Wireless Personal Communications 23: 217–242, 2002. © 2002 Kluwer Academic Publishers. Printed in the Netherlands. WCDMA Downlink Coverage Reduction Due to Adjacent Channel Interference KARI HEISKA 1 , HARRI POSTI 1 , PETER MUSZYNSKI 1 , TERHI RAUTIAINEN 2 and JUSSI NUMMINEN 3 1 Nokia Networks, P.O. Box 300, FIN-0045 Nokia Group, Finland E-mail: [email protected] 2 Nokia Research Center, FIN-00045 Nokia Group, Finland 3 Nokia Mobile Phones, FIN-00045 Nokia Group, Finland Abstract. This paper determines the coverage reduction of the Wideband CDMA (WCDMA) downlink in the case of interference, due to adjacent narrowband system. The coverage reduction has been evaluated in terms of block- ing area around the interfering base station. The analysis takes into account different interference mechanisms and their individual effects to the coverage. The interference mechanisms which have been considered here are the out-of-band emissions of the base station transmitter, the adjacent channel interference due to non-ideal sideband filtering, the intermodulation and the crossmodulation. The coverage effects in realistic network environment have been computed by using accurate ray-tracing propagation models designed for the path loss calculation in the urban environment. In the numerical examples, the effect of GSM interference has been demonstrated, but the method can be utilized with other narrowband systems as well. The results can be utilized in radio system design, radio network planning (RNP) and the frequency allocation of the WCDMA systems. Keywords: WCDMA, coverage, interference, cellular mobile comunications. 1. Introduction The quality of service (QoS)-requirements of the 3rd generation mobile networks are high. The 2nd generation networks like GSM already provide relatively good service quality with low drop call rate, low blocking and good voice quality. A similar kind of quality is also required from the next generation services. This is, however, a challenging target since the services and the end-user’s behavior are quite different from the present situation when the majority of the traffic is still speech and services are mainly voice, short messaging as well as low rate data applications. New future mobile multimedia services, like web-browsing or video streaming, require also higher bit-rates, which in turn increase the needed signal-to- interference ratio. The interference control in the 3rd generation systems is more demanding, and different interference sources have to be taken into account. Effective usage of the available WCDMA spectrum require a possibility to utilize the adjacent frequency bands without any guard bands. The interference coming from the adjacent channels might limit the performance of the sys- tem, for instance when different cell layers have been used in adjacent carriers. When the WCDMA is utilized in different frequency bands, like in PCS band or GSM bands, there might be large interference components coming from the adjacent narrowband system. This paper focuses on interference in downlink direction, from the NB base station to the WCDMA mobile station. The downlink interference in mobiles is compensated by the fast transmitted

Welcome message from author
This document is posted to help you gain knowledge. Please leave a comment to let me know what you think about it! Share it to your friends and learn new things together.
Transcript
Wireless Personal Communications 23: 217–242, 2002.© 2002 Kluwer Academic Publishers. Printed in the Netherlands.
WCDMA Downlink Coverage ReductionDue to Adjacent Channel Interference
KARI HEISKA 1, HARRI POSTI 1, PETER MUSZYNSKI 1, TERHI RAUTIAINEN 2
and JUSSI NUMMINEN 3
1Nokia Networks, P.O. Box 300, FIN-0045 Nokia Group, FinlandE-mail: [email protected] Research Center, FIN-00045 Nokia Group, Finland3Nokia Mobile Phones, FIN-00045 Nokia Group, Finland
Abstract. This paper determines the coverage reduction of the Wideband CDMA (WCDMA) downlink in the caseof interference, due to adjacent narrowband system. The coverage reduction has been evaluated in terms of block-ing area around the interfering base station. The analysis takes into account different interference mechanisms andtheir individual effects to the coverage. The interference mechanisms which have been considered here are theout-of-band emissions of the base station transmitter, the adjacent channel interference due to non-ideal sidebandfiltering, the intermodulation and the crossmodulation. The coverage effects in realistic network environment havebeen computed by using accurate ray-tracing propagation models designed for the path loss calculation in theurban environment. In the numerical examples, the effect of GSM interference has been demonstrated, but themethod can be utilized with other narrowband systems as well. The results can be utilized in radio system design,radio network planning (RNP) and the frequency allocation of the WCDMA systems.
Keywords: WCDMA, coverage, interference, cellular mobile comunications.
1. Introduction
The quality of service (QoS)-requirements of the 3rd generation mobile networks are high.The 2nd generation networks like GSM already provide relatively good service quality withlow drop call rate, low blocking and good voice quality. A similar kind of quality is alsorequired from the next generation services. This is, however, a challenging target since theservices and the end-user’s behavior are quite different from the present situation when themajority of the traffic is still speech and services are mainly voice, short messaging as wellas low rate data applications. New future mobile multimedia services, like web-browsing orvideo streaming, require also higher bit-rates, which in turn increase the needed signal-to-interference ratio.
The interference control in the 3rd generation systems is more demanding, and differentinterference sources have to be taken into account. Effective usage of the available WCDMAspectrum require a possibility to utilize the adjacent frequency bands without any guard bands.The interference coming from the adjacent channels might limit the performance of the sys-tem, for instance when different cell layers have been used in adjacent carriers. When theWCDMA is utilized in different frequency bands, like in PCS band or GSM bands, theremight be large interference components coming from the adjacent narrowband system. Thispaper focuses on interference in downlink direction, from the NB base station to the WCDMAmobile station. The downlink interference in mobiles is compensated by the fast transmitted
218 Kari Heiska et al.
power control (TPC). The fast downlink power control of the WCDMA is based on the mea-sured signal-to-interference ratio (SIR). If the measured signal-to-interference ratio is belowthe target value, the mobile asks the base station to increase the link power dedicated to themobile. This SIR-target is controlled by the outer loop power control, in order to achieve thetarget FER. The maximum allowed transmit power per link is a network-planning parameter.If the maximum link-specific power is high, the mobile is able to survive with large interfer-ence peaks, but, on the other hand, the large link-specific powers will decrease the maximumcapacity of the system. If the link-specific powers are low, the overall system capacity can berelatively high, but there might be considerable dead zones around the base stations which areworking at the adjacent carrier or inside the buildings. The network planner has to be able tofind an optimum performance of the system with appropriate parameter tuning.
The propagation environment is also essential when considering the interference effects.When the interfering base station is a microcell, in which case the antenna is well below therooftops, the coupling loss from the antenna to its surroundings can be relatively low, causinghigh interference powers. In macrocells, the antenna is above the rooftops and the verticalantenna pattern is more narrow, so that the minimum coupling loss is considerably higherthan in microcells. The effect of the interference is therefore very case-specific and has to bestudied by using accurate propagation models.
In this paper we attempt to analyze the effect of various downlink interference mecha-nisms on the coverage of a WCDMA macrocell. The minimum allowed distance between theinterfering base station and the WCDMA mobile station (MS) in terms of pathloss has beendetermined for various interference components. The respective blocked area in the WCDMAcell around the interfering NB base station has been determined in situations where the inter-fering base station is either micro- or macrocellular. For this purpose accurate, case-specificpropagation models have been utilized. The downlink interference to the CDMA reception hasbeen previously studied in [1] and in [2], but those papers concentrates only on the estimationof interference powers and no system level effects have been taken into account.
This paper has been organized as follows: Section 2 presents the downlink interferencecomponents analyzed in the study. The used WCDMA system model has been shown in Sec-tion 3. The effect of the interference mechanism on the blocking area around the interferingbase station has been determined in Section 4. Section 5 shows the numerical results fromthe case study, carried out with realistic propagation models. The conclusions are given inSection 6.
2. DL Interference Components
This section specifies the most dominant downlink interference components. The system-leveleffect of these components will be analyzed in Section 4. Figure 1 shows the receiver’s frontend model used in this study.
2.1. INTERMODULATION
Intermodulation distortion (IMD) is created in the receiver due to non-linearity of such com-ponents as the Low Noise Amplifier (LNA). Third-order IMD, which is caused by the thirdorder non-linearity term of the polynomial, is particularly problematic, because it is typicallythe strongest and falls close to the band of interest. Therefore only 3rd order products areconsidered in this analysis. In the case of two interfering signals on frequencies f1 and f2,
WCDMA Downlink Coverage Reduction 219
Figure 1. Front end structure of the receiver.
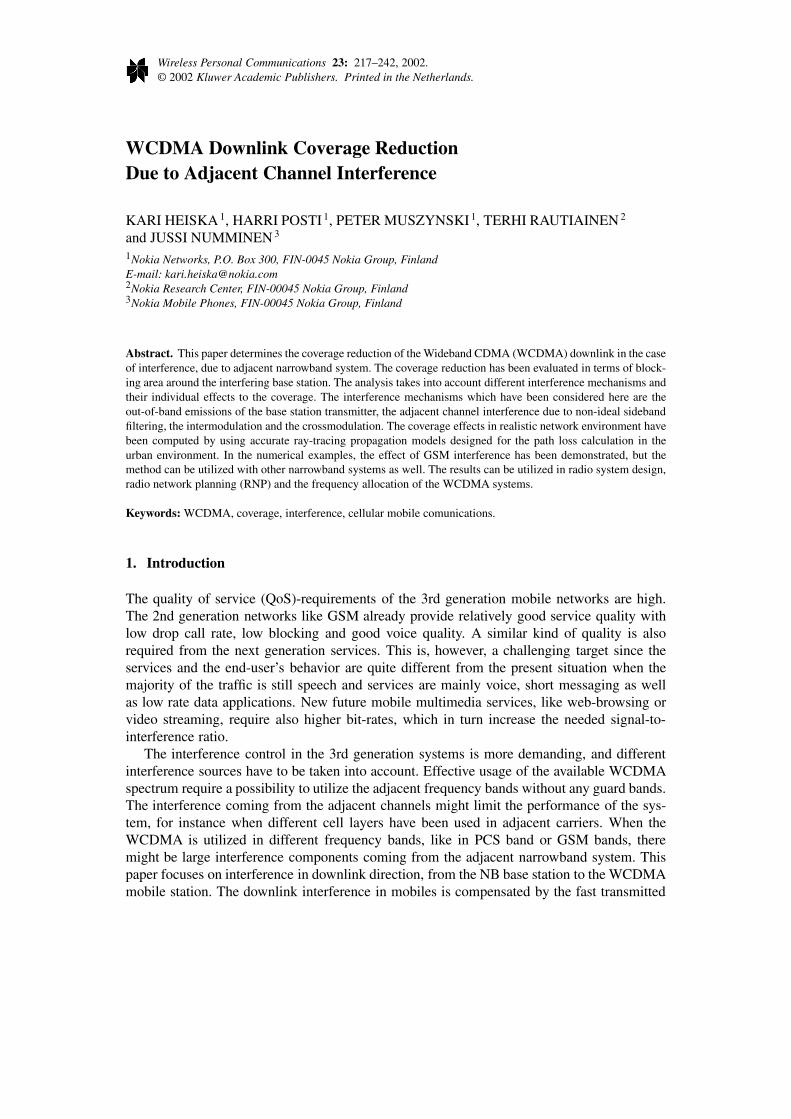
Figure 2. Intermodulation.
in the proximity of the desired signal, the most important IMD products are those falling onfrequencies 2f1 −f2 and 2f2 −f1. The modelling principle of intermodulation distortion can,for example, be found in [3]. Assuming that interferers on frequencies f1 and f2 have equalpowers Pf 1 = Pf 2 (e.g. originate in the same base station), the 3rd-order intermodulationpower reduced to the input of the nonlinear element is given in dB scale by:
P inIMD = 3 · Pi − 2 · IIP3 , (1)
where Pi is the power at the input of the element and IIP3 is the 3rd-order input intercept pointof the same.
Figure 2 shows the first relevant intermodulation mechanism (called simply IMD in thispaper), where the interference consists of two strong signals from narrowband base stations.The severity of this mechanism depends on the interferer parameters: amount, frequenciesand levels, as well as the receiver linearity. In this paper, two narrowband signals with equalpowers have been assumed.
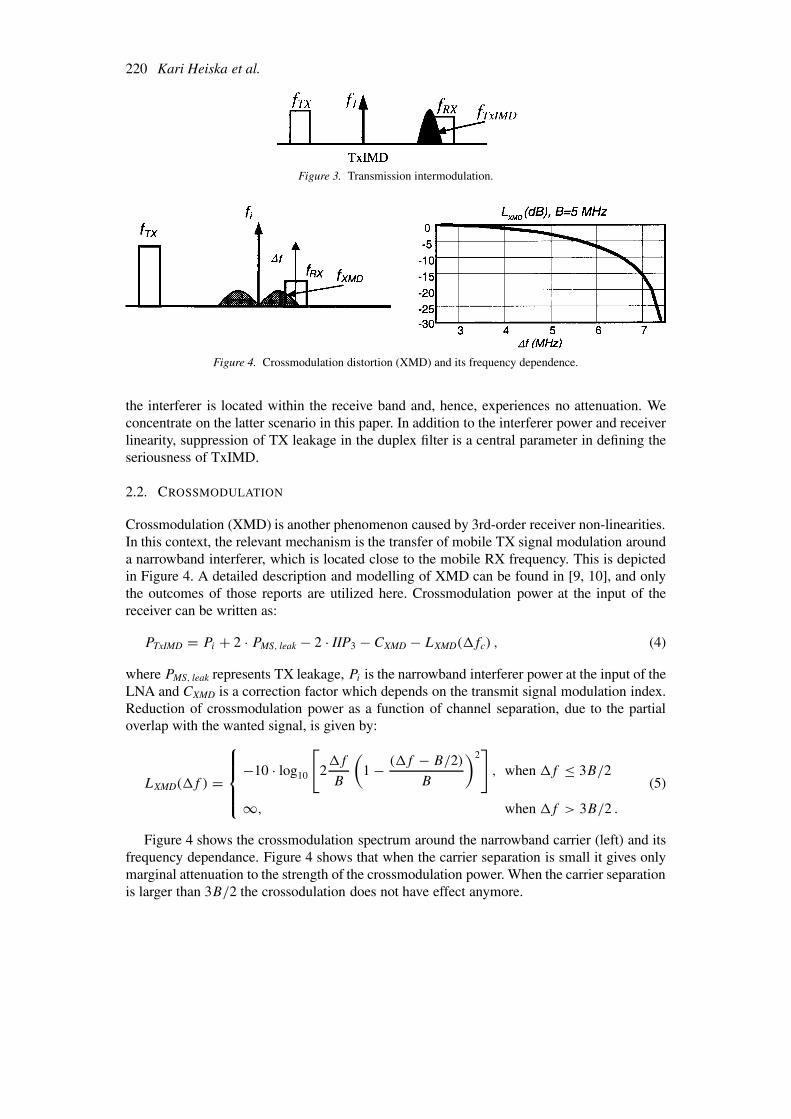
In a CDMA mobile transmission (TX) and reception (RX) occur simultaneously and aportion of the transmitted signal leaks to the receiver due to non-idealities of the duplexfilter (Figure 1). Therefore, another IMD mechanism results from the interaction of a singlestrong interferer and the leaking TX signal. Figure 3 illustrates this phenomenon, which willsubsequently be called TxIMD. As the sources of interference are different, their powers aretypically dissimilar. If the external interferer (f1) is located below the mobile TX frequency(f2), the relevant 3rd order intermodulation product falls on fimd = 2f2 − f1 and has thepower:
PTxIMD = Pi + 2 · PMS, leak − 2 · IIP3 , (2)
where Pi is the interferer power at the input of the LNA and PMS, leak is the leakage powerfrom the mobile transmission. When the frequency of the interferer is above the mobile TXfrequency (f1 > f2), fimd = 2f1 − f2 and the intermodulation power at the input of thereceiver is computed as:
PTxIMD = 2 · Pi + PMS, leak − 2 · IIP3 . (3)
The existence and importance of these alternatives depends on the frequency scenario. Incellular applications the latter one is more relevant, because it corresponds to the case where
220 Kari Heiska et al.
Figure 3. Transmission intermodulation.
Figure 4. Crossmodulation distortion (XMD) and its frequency dependence.
the interferer is located within the receive band and, hence, experiences no attenuation. Weconcentrate on the latter scenario in this paper. In addition to the interferer power and receiverlinearity, suppression of TX leakage in the duplex filter is a central parameter in defining theseriousness of TxIMD.
2.2. CROSSMODULATION
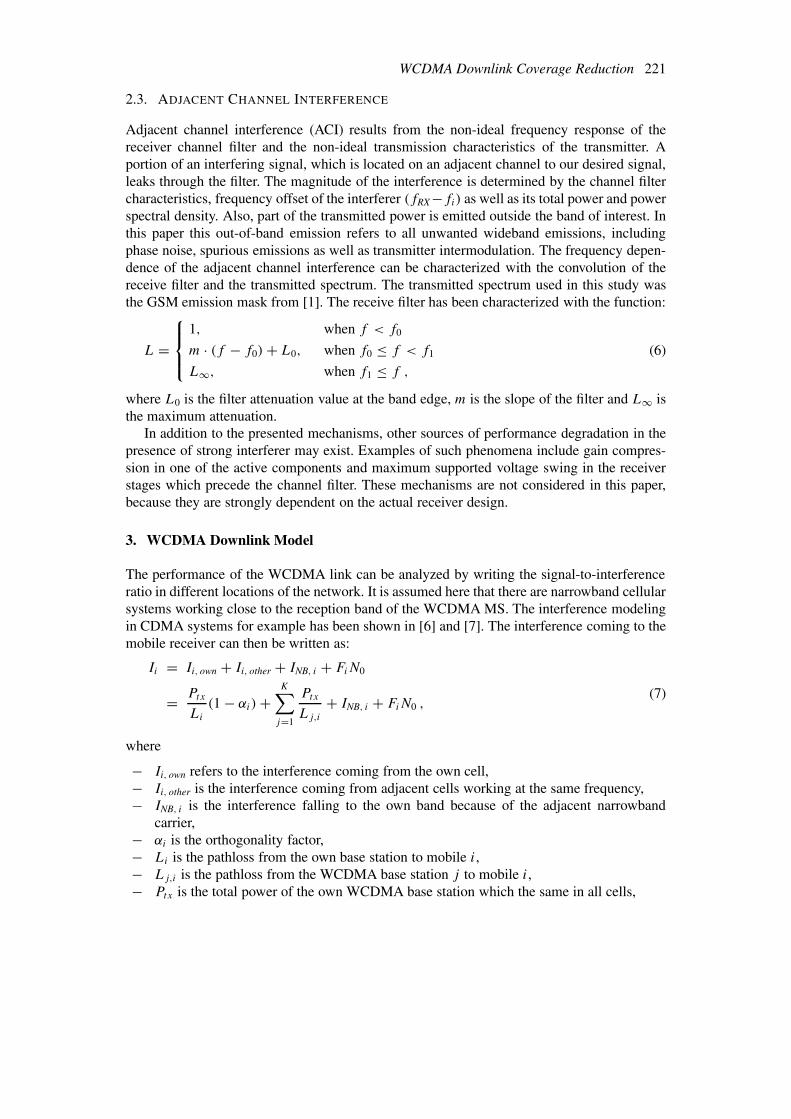
Crossmodulation (XMD) is another phenomenon caused by 3rd-order receiver non-linearities.In this context, the relevant mechanism is the transfer of mobile TX signal modulation arounda narrowband interferer, which is located close to the mobile RX frequency. This is depictedin Figure 4. A detailed description and modelling of XMD can be found in [9, 10], and onlythe outcomes of those reports are utilized here. Crossmodulation power at the input of thereceiver can be written as:
PTxIMD = Pi + 2 · PMS, leak − 2 · IIP3 − CXMD − LXMD(fc) , (4)
where PMS, leak represents TX leakage, Pi is the narrowband interferer power at the input of theLNA and CXMD is a correction factor which depends on the transmit signal modulation index.Reduction of crossmodulation power as a function of channel separation, due to the partialoverlap with the wanted signal, is given by:
LXMD(f ) =
−10 · log10
[2f
B
(1 − (f − B/2)
B
)2], when f ≤ 3B/2
∞, when f > 3B/2 .
(5)
Figure 4 shows the crossmodulation spectrum around the narrowband carrier (left) and itsfrequency dependance. Figure 4 shows that when the carrier separation is small it gives onlymarginal attenuation to the strength of the crossmodulation power. When the carrier separationis larger than 3B/2 the crossodulation does not have effect anymore.
WCDMA Downlink Coverage Reduction 221
2.3. ADJACENT CHANNEL INTERFERENCE
Adjacent channel interference (ACI) results from the non-ideal frequency response of thereceiver channel filter and the non-ideal transmission characteristics of the transmitter. Aportion of an interfering signal, which is located on an adjacent channel to our desired signal,leaks through the filter. The magnitude of the interference is determined by the channel filtercharacteristics, frequency offset of the interferer (fRX−fi) as well as its total power and powerspectral density. Also, part of the transmitted power is emitted outside the band of interest. Inthis paper this out-of-band emission refers to all unwanted wideband emissions, includingphase noise, spurious emissions as well as transmitter intermodulation. The frequency depen-dence of the adjacent channel interference can be characterized with the convolution of thereceive filter and the transmitted spectrum. The transmitted spectrum used in this study wasthe GSM emission mask from [1]. The receive filter has been characterized with the function:
L =
1, when f < f0
m · (f − f0) + L0, when f0 ≤ f < f1
L∞, when f1 ≤ f ,
(6)
where L0 is the filter attenuation value at the band edge, m is the slope of the filter and L∞ isthe maximum attenuation.
In addition to the presented mechanisms, other sources of performance degradation in thepresence of strong interferer may exist. Examples of such phenomena include gain compres-sion in one of the active components and maximum supported voltage swing in the receiverstages which precede the channel filter. These mechanisms are not considered in this paper,because they are strongly dependent on the actual receiver design.
3. WCDMA Downlink Model
The performance of the WCDMA link can be analyzed by writing the signal-to-interferenceratio in different locations of the network. It is assumed here that there are narrowband cellularsystems working close to the reception band of the WCDMA MS. The interference modelingin CDMA systems for example has been shown in [6] and [7]. The interference coming to themobile receiver can then be written as:
Ii = Ii, own + Ii, other + INB, i + FiN0
= Ptx
Li
(1 − αi) +K∑j=1
Ptx
Lj,i
+ INB, i + FiN0 ,(7)
where
− Ii, own refers to the interference coming from the own cell,− Ii, other is the interference coming from adjacent cells working at the same frequency,− INB, i is the interference falling to the own band because of the adjacent narrowband
carrier,− αi is the orthogonality factor,− Li is the pathloss from the own base station to mobile i,− Lj,i is the pathloss from the WCDMA base station j to mobile i,− Ptx is the total power of the own WCDMA base station which the same in all cells,
222 Kari Heiska et al.
− Fi is the noise figure of the mobile receiver,− K is the number of base stations in the WCDMA system and− N0 is the thermal noise power (–107.5 dBm@5 MHz).
Signal-to-interference (SIR)-ratio reduced at the input of the receiver is then:
(W/Ri) · (ptx,i/Li)
Ptx
Li
(1 − αi) +K−1∑j=1
Ptx
Lj,i
+ INB, i + Ni
= ρi (8)
⇒ (W/Ri) · ptx,i
Ptx[(1 − αi) + fDL, i] + (INB, i + Ni) · Li
= ρi , (9)
where ρi is the Eb/N0 target of the service using the bit-rate of Ri , and ptx,i is the neededtransmission power per link. Other-to-own cell interference ratio, fDL, i can then be definedas:
fDL, i =K−1∑j=1
Li
Lj,i
. (10)
If ptx,max is the maximum allowed power for a single link, then the maximum allowed strengthof the narrowband interference can be computed as:
INB, i = 1
Li
(W · ptx,max
ρiRi
− Ptx[(1 − αi) + fDL, i])
− Ni . (11)
If there is no interference from narrowband system, so that INB, i = 0 the minimum requiredpower per link at the cell edge can be written as:
ptx = ρR
W(LmaxN + Ptx[(1 − αmin) + fDL,max]) , (12)
where Lmax is the maximum pathloss of the WCDMA cell, αmin is the orthogonality at the celledge and fDL,max is the other-to-own cell interference ratio at the cell edge. Interference INB, i isdependent on the pathloss from the interfering cell, and in the following chapter the minimumallowed pathloss from the interfering narrowband cell is computed, so that the condition forpower per link from Equation (12) holds. The effect of soft handover is not taken into accountin this analysis. The soft handover would reduce the needed power slightly, even though it isnot as effective in downlink as in uplink.
The distributions of the other-to-own cell interference, fDL, and the orthogonality of theradio channel, α, are usually unknown and they are strongly dependent on the propagationenvironment as well as the network stucture. A channel with many multipath componentsgenerates own cell interference, because the parallel codes are no longer orthogonal. With aone-tap channel there is only one signifigant propagation path and the orthogonality is equalto one. The more multipath is present, the lower the orthogonality is, and the more significantthe interference from the own cell is. Isolation between adjacent cells decreases the other-to-own cell interference ratio, as it can be seen from Equation (10). At the cell border, themaximum value for the other-to-own cell interference ratio fDL,max, and the minimum valuefor the orthogonality αmin have been used.
WCDMA Downlink Coverage Reduction 223
4. Effect of Interference Mechanisms
The effect of the adjacent band interference on the DL coverage of the WCDMA macrocellwill be studied in this section. We have derived the minimum allowed pathloss from the inter-fering base station as a function of the maximum pathloss from the own base station, so thatthe WCDMA link SIR-target is still reached. By using the appropriate propagation model, thesize of the respective dead-zones around the interfering base stations can be estimated. In thisstudy the own cells are assumed to be macrocells, where the pathloss to the mobile locatingin the main lobe of the transmitting antenna can be written as:
Li = C · rniGa
⇒ Lmax = C · rnmax
Ga
, (13)
where Ga is the gain of the antenna, and ri is the distance between the base station and themobile i. Parameters C and n are propagation environment-specific constants. This equationgives only the average value for the pathloss, and the effects of shadow fading can be takeninto account by adding a margin over the maximum value, so that L = Lmax · Lsf , whereLsf is the used fading margin.
4.1. INTERMODULATION
The mobile station will suffer from intermodulation distortion if it is close to the interferingbase station, having two carriers f1 and f2, so that intermodulation components will fallinto the reception band of the mobile. In a wideband system the probability to have thosecomponents in the reception band is quite high, so the problem is more severe than in thenarrowband systems. Assuming that the powers of two carriers are equal, the SIR, in order toguarantee the service (reduced to the antenna connector of the mobile), can be computed bysubstituting intermodulation power from Equation (1) to Equation (9):
(W/Ri) · (ptx, i/Li)
Ptx[(1 − αi) + fDL, i]Li
+ Ni + L1
(IIP3)2
(Ptx, I
LI, iL1
)3 = ρi , (14)
where L1 is the attenuation before the LNA. Then, the minimum allowed pathloss from theinterfering BS can be computed with:
LI, i = Ptx, I
L13
√(IIP3)
2
LiL1
((Wptx, i
Riρi
)− (Ptx[(1 − αi) + fDL, i] + NiLi)
) . (15)
In order to compute the confidence limit for this value through the whole cell area, the pathlossLi should refer to the maximum pathloss value to own cell, which can be written as Li =LmaxLsf . Also, the orthogonality and the other-to-own cell ratio have to be given somerealistic values corresponding to the situation in the cell edge, and therefore the equation canbe rewritten as:
LI, i = Ptx, I
L13
√(IIP3)
2
LmaxLsfL1
((Wptx,max
Riρi
)− (Ptx[(1 − αi) + fDL, i] + NiLmaxLsf )
) . (16)
224 Kari Heiska et al.
From this equation we can see that LI is inverse proportional to the cube root of the pathlossfrom the own base station, indicating that IMD is not very sensitive to changes in own cellsizes, as we can also see from simulation results shown in Section 5. In here it has been as-sumed that two interfering components come from the same source, having the same pathloss.This is not always the case, but it is also possible that two interfering carriers are allocatedto different sectors. Also, in that case, the relationship would be similar, but added withadditional attenuation term inside the cube root.
4.2. TX INTERMODULATION
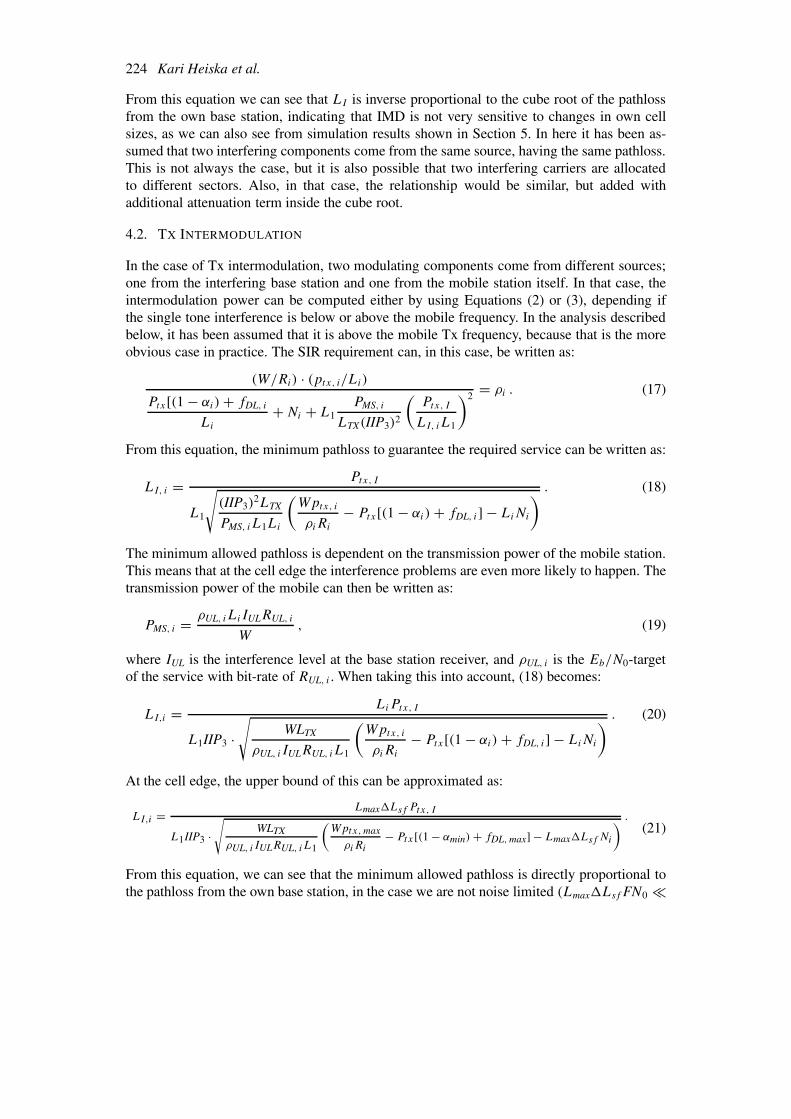
In the case of Tx intermodulation, two modulating components come from different sources;one from the interfering base station and one from the mobile station itself. In that case, theintermodulation power can be computed either by using Equations (2) or (3), depending ifthe single tone interference is below or above the mobile frequency. In the analysis describedbelow, it has been assumed that it is above the mobile Tx frequency, because that is the moreobvious case in practice. The SIR requirement can, in this case, be written as:
(W/Ri) · (ptx, i/Li)
Ptx[(1 − αi) + fDL, i
Li
+ Ni + L1PMS, i
LTX(IIP3)2
(Ptx, I
LI, iL1
)2 = ρi . (17)
From this equation, the minimum pathloss to guarantee the required service can be written as:
LI, i = Ptx, I
L1
√(IIP3)
2LTX
PMS, iL1Li
(Wptx, i
ρiRi
− Ptx[(1 − αi) + fDL, i] − LiNi
) . (18)
The minimum allowed pathloss is dependent on the transmission power of the mobile station.This means that at the cell edge the interference problems are even more likely to happen. Thetransmission power of the mobile can then be written as:
PMS, i = ρUL, iLiIULRUL, i
W, (19)
where IUL is the interference level at the base station receiver, and ρUL, i is the Eb/N0-targetof the service with bit-rate of RUL, i . When taking this into account, (18) becomes:
LI,i = LiPtx, I
L1IIP3 ·√
WLTX
ρUL, iIULRUL, iL1
(Wptx, i
ρiRi
− Ptx[(1 − αi) + fDL, i] − LiNi
) . (20)
At the cell edge, the upper bound of this can be approximated as:
LI,i = LmaxLsf Ptx, I
L1IIP3 ·√
WLTX
ρUL, iIULRUL, iL1
(Wptx,max
ρiRi− Ptx[(1 − αmin)+ fDL,max] − LmaxLsf Ni
) .(21)
From this equation, we can see that the minimum allowed pathloss is directly proportional tothe pathloss from the own base station, in the case we are not noise limited (LmaxLsfFN0
WCDMA Downlink Coverage Reduction 225
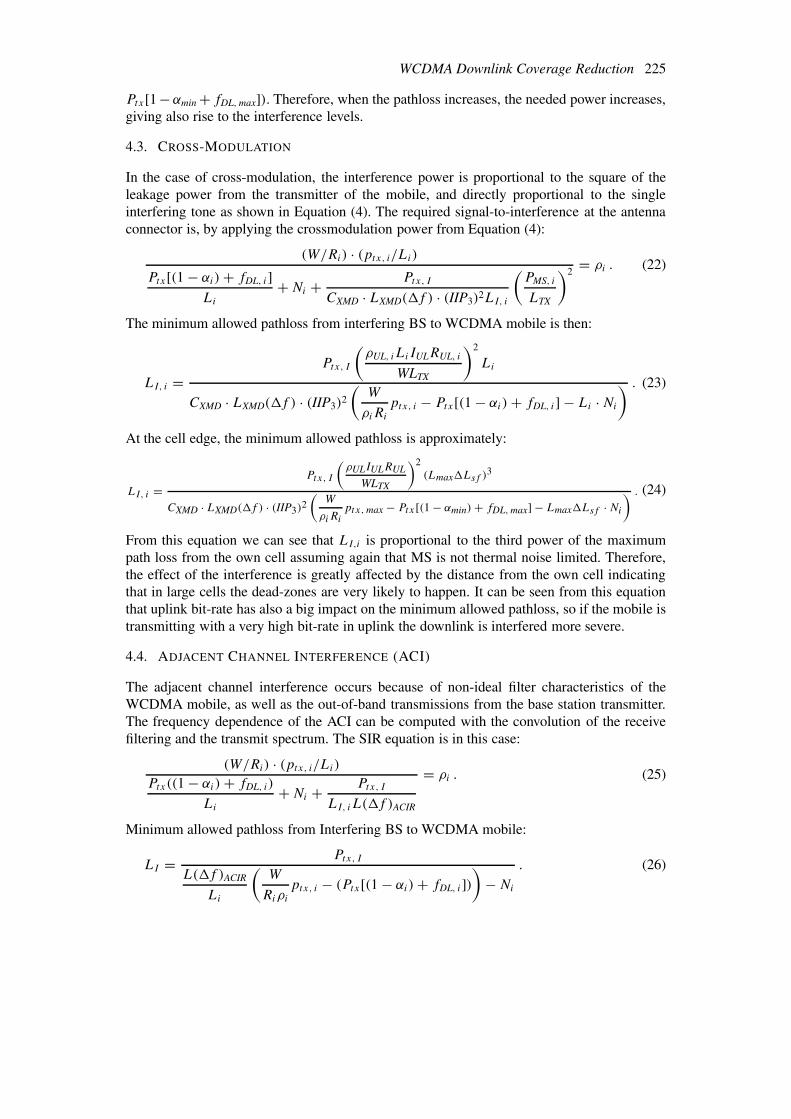
Ptx[1 −αmin + fDL,max]). Therefore, when the pathloss increases, the needed power increases,giving also rise to the interference levels.
4.3. CROSS-MODULATION
In the case of cross-modulation, the interference power is proportional to the square of theleakage power from the transmitter of the mobile, and directly proportional to the singleinterfering tone as shown in Equation (4). The required signal-to-interference at the antennaconnector is, by applying the crossmodulation power from Equation (4):
(W/Ri) · (ptx, i/Li)
Ptx[(1 − αi) + fDL, i]Li
+ Ni + Ptx, I
CXMD · LXMD(f ) · (IIP3)2LI, i
(PMS, i
LTX
)2 = ρi . (22)
The minimum allowed pathloss from interfering BS to WCDMA mobile is then:
LI, i =Ptx, I
(ρUL, iLiIULRUL, i
WLTX
)2
Li
CXMD · LXMD(f ) · (IIP3)2
(W
ρiRi
ptx, i − Ptx[(1 − αi) + fDL, i] − Li ·Ni
) . (23)
At the cell edge, the minimum allowed pathloss is approximately:
LI, i =Ptx, I
(ρULIULRUL
WLTX
)2(LmaxLsf )
3
CXMD · LXMD(f ) · (IIP3)2(
W
ρiRiptx,max − Ptx[(1 − αmin)+ fDL,max] − LmaxLsf ·Ni
) . (24)
From this equation we can see that LI,i is proportional to the third power of the maximumpath loss from the own cell assuming again that MS is not thermal noise limited. Therefore,the effect of the interference is greatly affected by the distance from the own cell indicatingthat in large cells the dead-zones are very likely to happen. It can be seen from this equationthat uplink bit-rate has also a big impact on the minimum allowed pathloss, so if the mobile istransmitting with a very high bit-rate in uplink the downlink is interfered more severe.
4.4. ADJACENT CHANNEL INTERFERENCE (ACI)
The adjacent channel interference occurs because of non-ideal filter characteristics of theWCDMA mobile, as well as the out-of-band transmissions from the base station transmitter.The frequency dependence of the ACI can be computed with the convolution of the receivefiltering and the transmit spectrum. The SIR equation is in this case:
(W/Ri) · (ptx, i/Li)
Ptx((1 − αi) + fDL, i)
Li
+ Ni + Ptx, I
LI, iL(f )ACIR
= ρi . (25)
Minimum allowed pathloss from Interfering BS to WCDMA mobile:
LI = Ptx, I
L(f )ACIR
Li
(W
Riρiptx, i − (Ptx[(1 − αi) + fDL, i])
)− Ni
. (26)
226 Kari Heiska et al.
At the cell edge, the maximum allowed pathloss is then:
LI = Ptx, I
L(f )ACIR
LmaxLsf
(W
Riρiptx,max − (Ptx[(1 − αmin) + fDL,max])
)− Ni
. (27)
From this equation we can see that the minimum allowed pathloss is directly proportionalto the pathloss from the own cell. Therefore, the effect of adjacent channel interference isdependent on the pathloss differences between the own cell and the interfering cell. It is alsosensitive to the channel separation between the interfering and the own signals.
5. Numerical Results
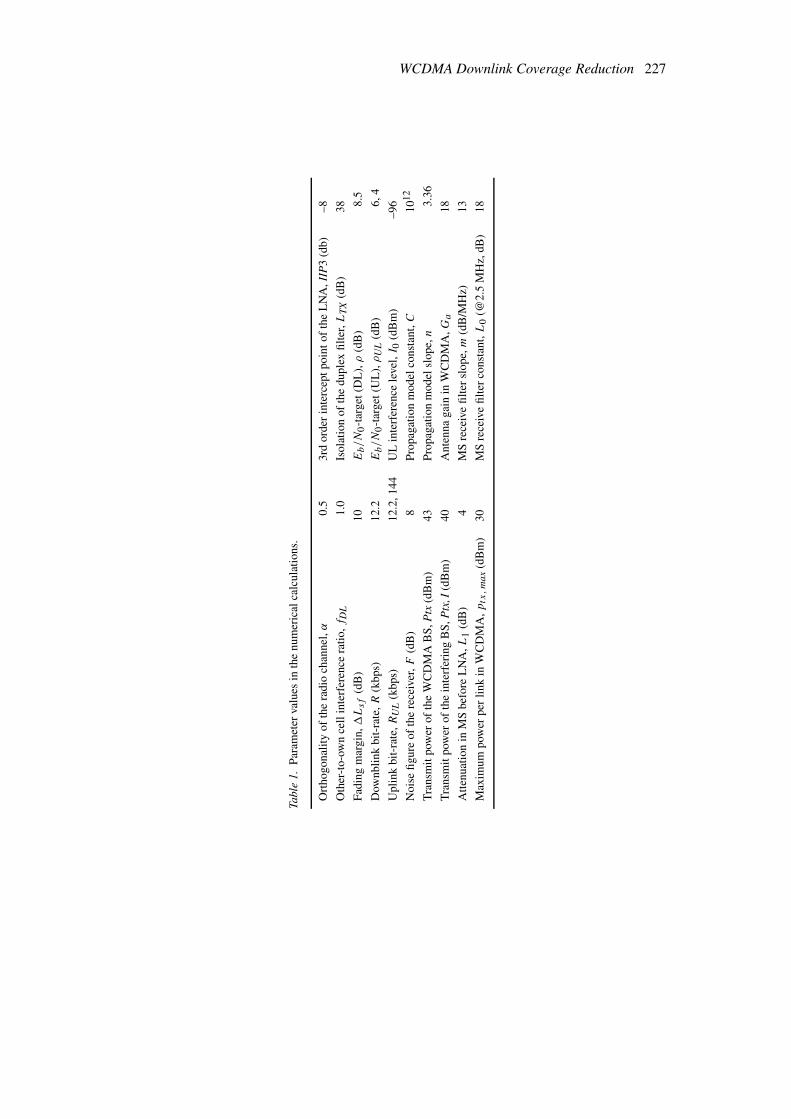
This section presents some numerical examples, demonstrating what the most critical inter-ference components in various situations are, and what their frequency dependence is. Theresults in Section 5.1 show the minimum allowed pathloss from the interfering base stationas a function of the range of the own cell. In order to find out the coverage effects of theinterference mechanisms in the real urban environment, the propagation prediction model hasto be utilized. The used propagation model has been introduced in Section 5.2 and the resultsare given in Section 5.3. Table 1 shows the parameters used in the calculations; the notationsare the same as used in Section 4.
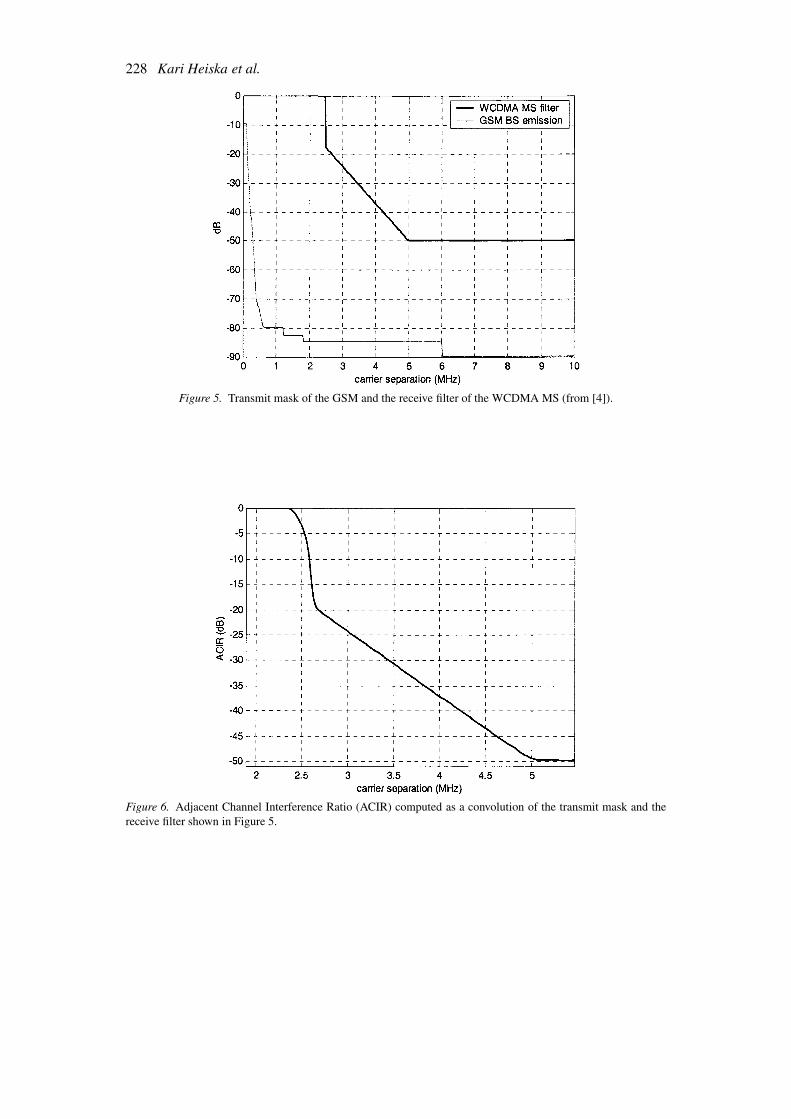
Figure 5 shows the transmission spectrum of the assumed narrowband base station trans-mitter and the receive filter of the WCDMA mobile station. The transmission mask has beennormalized, so that the output power is 0 dBm. The respective Adjacent Channel InterferenceRatio (ACIR), which has been computed as a convolution of the previous transmission andfilter functions, is shown in Figure 6. The used transmission mask is from GSM systemspecification [1], and the filter characteristic can be considered as a realistic implementationvalue.
5.1. MINIMUM ALLOWED COUPLING LOSS
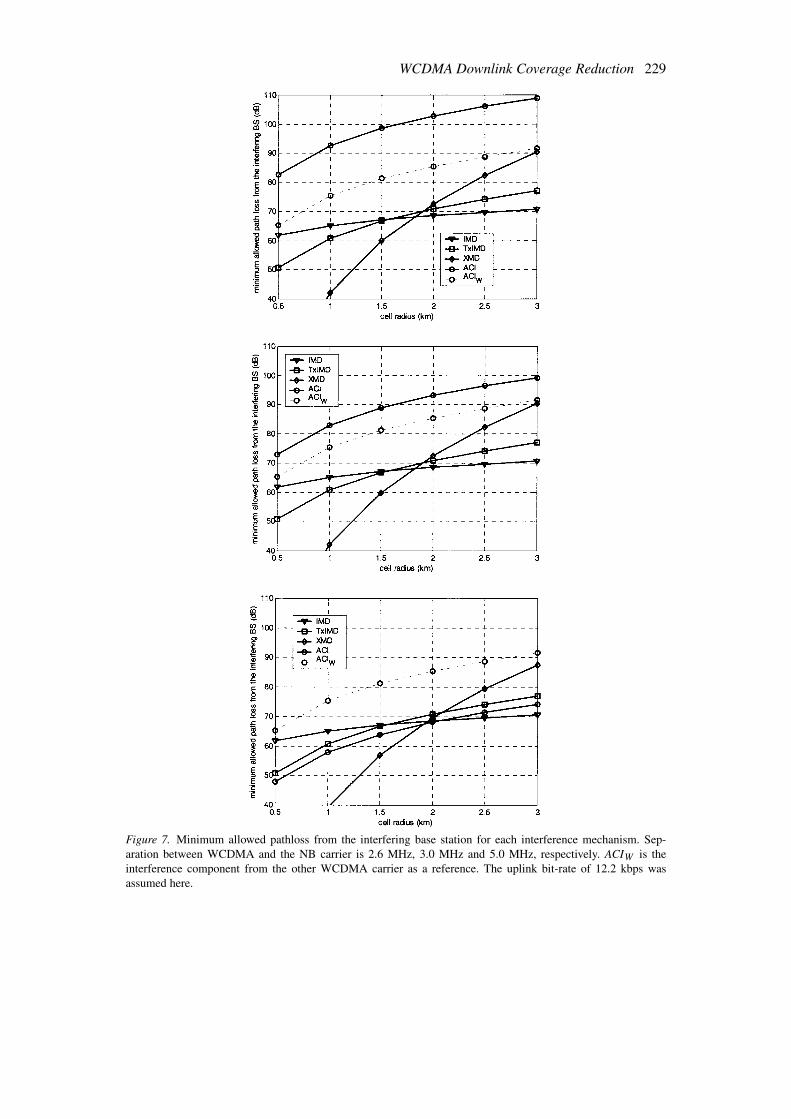
Figures 7 and 8 show the minimum allowed pathloss as a function of the own cell rangefor various interference components, computed by using methods presented in the previoussection. The own cell range determines the maximum range without any fading margins as inEquation (13). The fading margin has been added above that, in order to model the signal levelvariation due to the fast fading and the shadow fading. In Figures 7 and 8 the uplink bit-rateswere 12.2 kbps and 144 kbps, respectively. As a reference, the adjacent channel interferencefrom the other WCDMA system has also been shown. The used adjacent channel attenuationwas 32 dB, taking into account the adjacent channel leakage and adjacent channel selection,and is in accordance with 3GPP specifications [5].
It can be seen that the ACI limits the range when the channel separation is 2.6 MHz, whichmeans that there is no guard band between the WCDMA and the 200 kHz GSM carrier. Inthe case of 0.5 km ranges, the minimum allowed pathloss is about 82 dB, which correspondsquite typical minimum coupling loss (MCL) of a macro cell. As the maximum range increases,the minimum allowed pathloss increases as well, up to 108 dB in 3 km cells. With 3.0 MHzchannel separation the situation is quite similar, but now the minimum allowed coupling lossdue to ACI is about 10 dB lower. In the case of 5.0 MHz channel separation, the limiting factor
WCDMA Downlink Coverage Reduction 227
Tabl
e1.
Para
met
erva
lues
inth
enu
mer
ical
calc
ulat
ions
.
Ort
hogo
nalit
yof
the
radi
och
anne
l,α
0.5
3rd
orde
rin
terc
eptp
oint
ofth
eL
NA
,IIP
3(d
b)–8
Oth
er-t
o-ow
nce
llin
terf
eren
cera
tio,f
DL
1.0
Isol
atio
nof
the
dupl
exfi
lter
,LT
X(d
B)
38
Fadi
ngm
argi
n,Lsf
(dB
)10
Eb/N
0-t
arge
t(D
L),ρ
(dB
)8.
5
Dow
nbli
nkbi
t-ra
te,R
(kbp
s)12
.2Eb/N
0-t
arge
t(U
L),ρ
UL
(dB
)6,
4
Upl
ink
bit-
rate
,RU
L(k
bps)
12.2
,144
UL
inte
rfer
ence
leve
l,I 0
(dB
m)
–96
Noi
sefi
gure
ofth
ere
ceiv
er,F
(dB
)8
Pro
paga
tion
mod
elco
nsta
nt,C
1012
Tra
nsm
itpo
wer
ofth
eW
CD
MA
BS
,Ptx
(dB
m)
43P
ropa
gati
onm
odel
slop
e,n
3.36
Tra
nsm
itpo
wer
ofth
ein
terf
erin
gB
S,P
tx,I
(dB
m)
40A
nten
naga
inin
WC
DM
A,G
a18
Att
enua
tion
inM
Sbe
fore
LN
A,L
1(d
B)
4M
Sre
ceiv
efi
lter
slop
e,m
(dB
/MH
z)13
Max
imum
pow
erpe
rli
nkin
WC
DM
A,p
tx,
max
(dB
m)
30M
Sre
ceiv
efi
lter
cons
tant
,L0
(@2.
5M
Hz,
dB)
18
228 Kari Heiska et al.
Figure 5. Transmit mask of the GSM and the receive filter of the WCDMA MS (from [4]).
Figure 6. Adjacent Channel Interference Ratio (ACIR) computed as a convolution of the transmit mask and thereceive filter shown in Figure 5.
WCDMA Downlink Coverage Reduction 229
Figure 7. Minimum allowed pathloss from the interfering base station for each interference mechanism. Sep-aration between WCDMA and the NB carrier is 2.6 MHz, 3.0 MHz and 5.0 MHz, respectively. ACIW is theinterference component from the other WCDMA carrier as a reference. The uplink bit-rate of 12.2 kbps wasassumed here.
230 Kari Heiska et al.
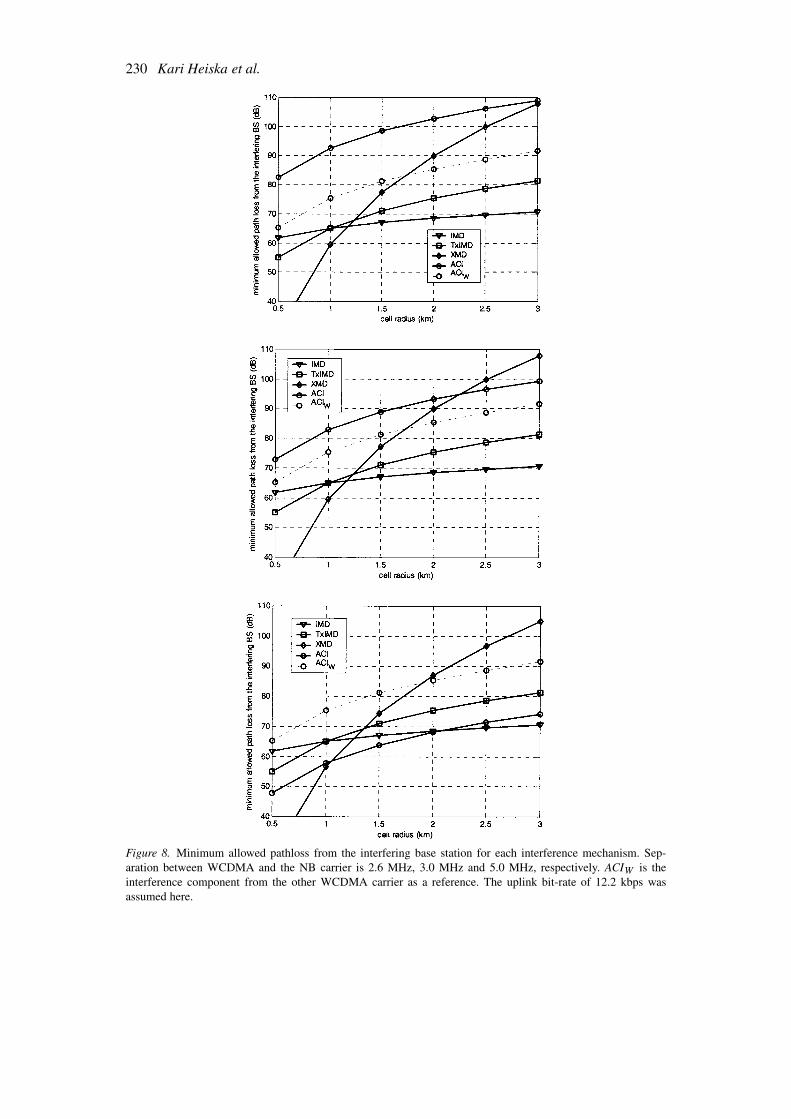
Figure 8. Minimum allowed pathloss from the interfering base station for each interference mechanism. Sep-aration between WCDMA and the NB carrier is 2.6 MHz, 3.0 MHz and 5.0 MHz, respectively. ACIW is theinterference component from the other WCDMA carrier as a reference. The uplink bit-rate of 12.2 kbps wasassumed here.
WCDMA Downlink Coverage Reduction 231
is IMD in small cells and XMD in large cells. However, these effects are small compared tothe blocking limit of ACIW in the case of adjacent WCDMA carriers.
When the uplink bit-rate increases to 144 kbps (Figure 8), the interference from TxIMDand XMD increases as the mobile station transmit power increases, which we can see alsofrom Equation (21) and (24). The effect of the uplink bit-rate is more severe in XMD thanin the case of TxIMD, which can also be seen from results below. Without any guard bands,the ACI is still the limiting factor. In the case of 3.0 MHz channel separation (400 kHz guardband), the ACI is the dominant component. In the case of smaller cells (up to 2.2 km cellranges and beyond), the XMD becomes the dominant component. As the XMD is proportionalto the square of the transmitting power, the required bit rate as well as the cell range effect tothe interference power significantly. This can be seen from the results by comparing the slopesof the curves. The slope of the XMD is much steeper as a function of the cell range. Whenthe channel separation is 5 MHz, the IMD becomes dominant at smaller ranges. Only averagemobile station powers have been used here, so the effect of the power rise due to fast powercontrol has not been taken into account, although its contribution can be high, especially atthe low mobile speeds.
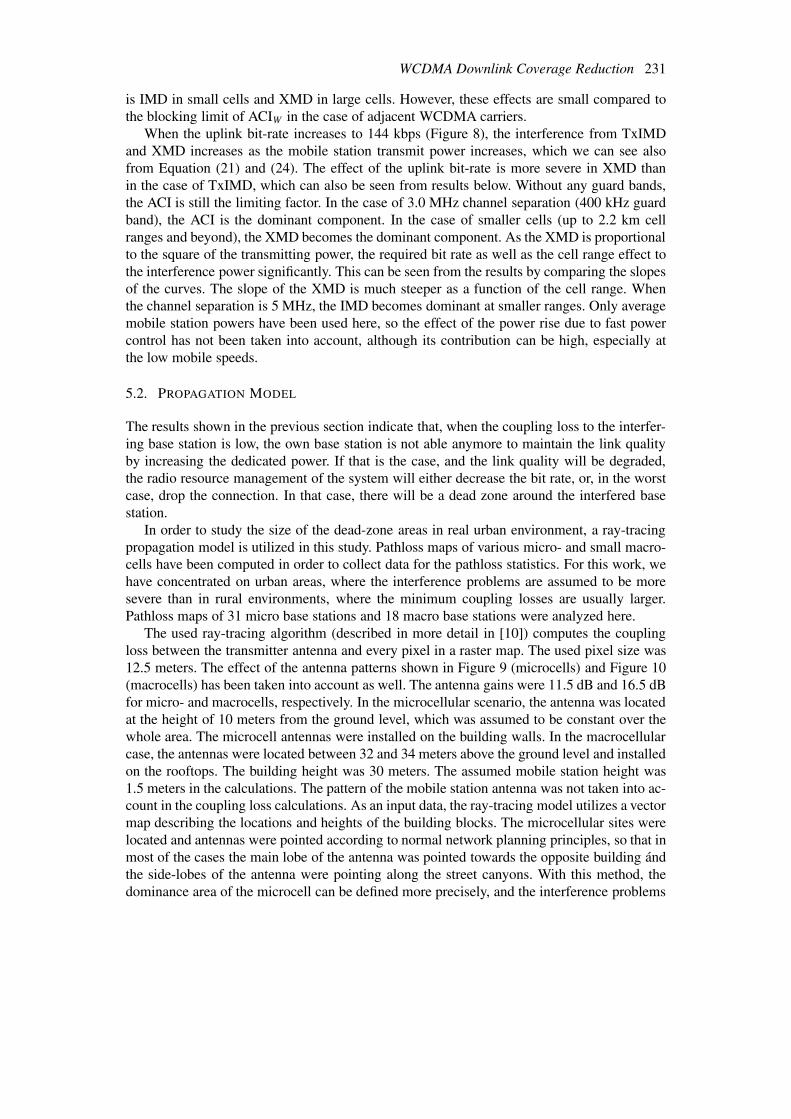
5.2. PROPAGATION MODEL
The results shown in the previous section indicate that, when the coupling loss to the interfer-ing base station is low, the own base station is not able anymore to maintain the link qualityby increasing the dedicated power. If that is the case, and the link quality will be degraded,the radio resource management of the system will either decrease the bit rate, or, in the worstcase, drop the connection. In that case, there will be a dead zone around the interfered basestation.
In order to study the size of the dead-zone areas in real urban environment, a ray-tracingpropagation model is utilized in this study. Pathloss maps of various micro- and small macro-cells have been computed in order to collect data for the pathloss statistics. For this work, wehave concentrated on urban areas, where the interference problems are assumed to be moresevere than in rural environments, where the minimum coupling losses are usually larger.Pathloss maps of 31 micro base stations and 18 macro base stations were analyzed here.
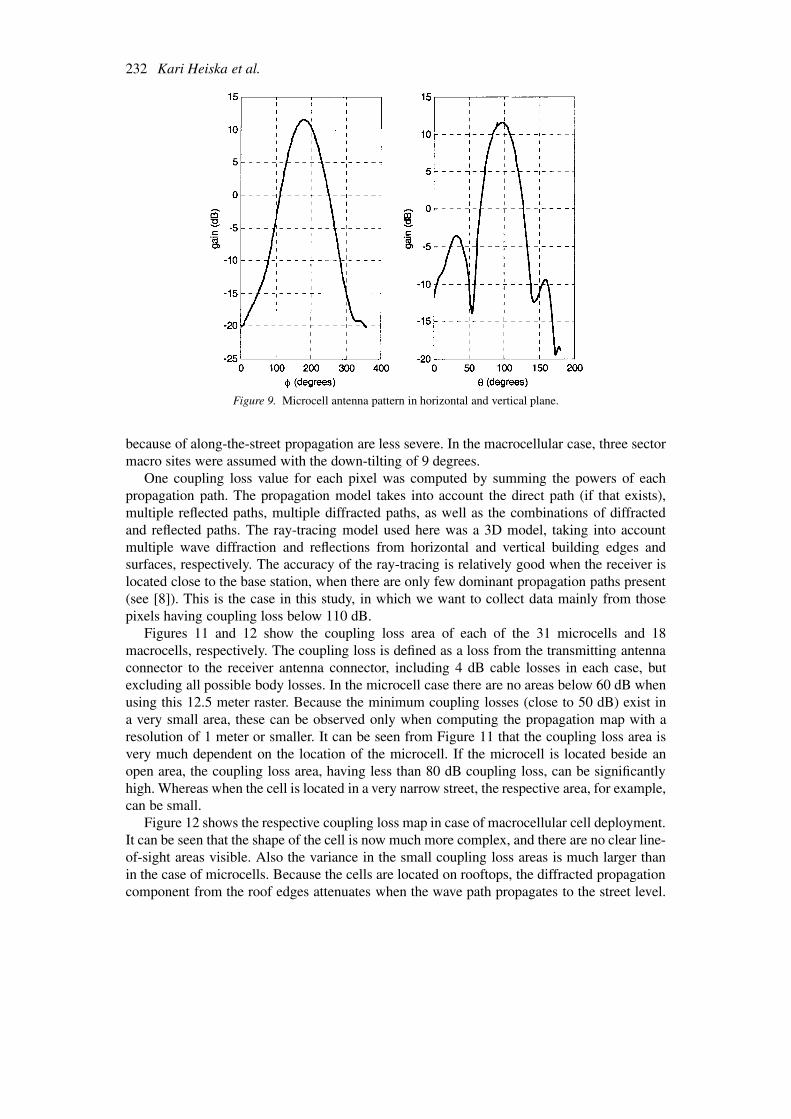
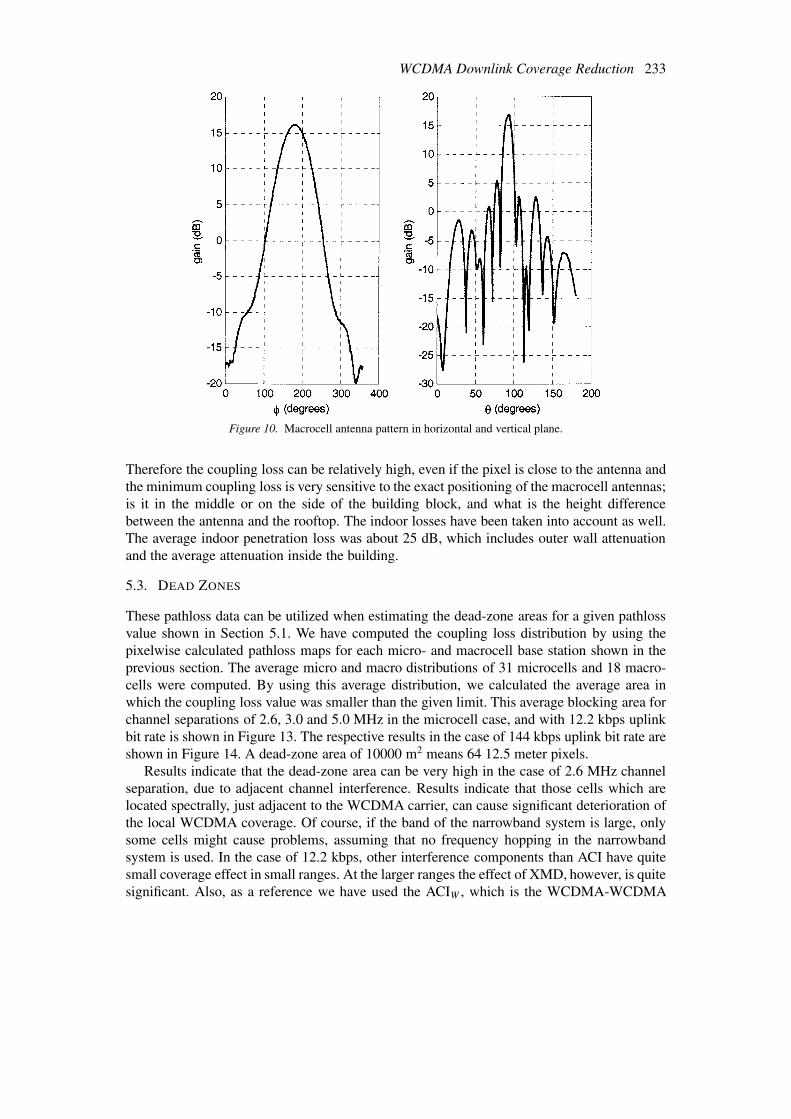
The used ray-tracing algorithm (described in more detail in [10]) computes the couplingloss between the transmitter antenna and every pixel in a raster map. The used pixel size was12.5 meters. The effect of the antenna patterns shown in Figure 9 (microcells) and Figure 10(macrocells) has been taken into account as well. The antenna gains were 11.5 dB and 16.5 dBfor micro- and macrocells, respectively. In the microcellular scenario, the antenna was locatedat the height of 10 meters from the ground level, which was assumed to be constant over thewhole area. The microcell antennas were installed on the building walls. In the macrocellularcase, the antennas were located between 32 and 34 meters above the ground level and installedon the rooftops. The building height was 30 meters. The assumed mobile station height was1.5 meters in the calculations. The pattern of the mobile station antenna was not taken into ac-count in the coupling loss calculations. As an input data, the ray-tracing model utilizes a vectormap describing the locations and heights of the building blocks. The microcellular sites werelocated and antennas were pointed according to normal network planning principles, so that inmost of the cases the main lobe of the antenna was pointed towards the opposite building ándthe side-lobes of the antenna were pointing along the street canyons. With this method, thedominance area of the microcell can be defined more precisely, and the interference problems
232 Kari Heiska et al.
Figure 9. Microcell antenna pattern in horizontal and vertical plane.
because of along-the-street propagation are less severe. In the macrocellular case, three sectormacro sites were assumed with the down-tilting of 9 degrees.
One coupling loss value for each pixel was computed by summing the powers of eachpropagation path. The propagation model takes into account the direct path (if that exists),multiple reflected paths, multiple diffracted paths, as well as the combinations of diffractedand reflected paths. The ray-tracing model used here was a 3D model, taking into accountmultiple wave diffraction and reflections from horizontal and vertical building edges andsurfaces, respectively. The accuracy of the ray-tracing is relatively good when the receiver islocated close to the base station, when there are only few dominant propagation paths present(see [8]). This is the case in this study, in which we want to collect data mainly from thosepixels having coupling loss below 110 dB.
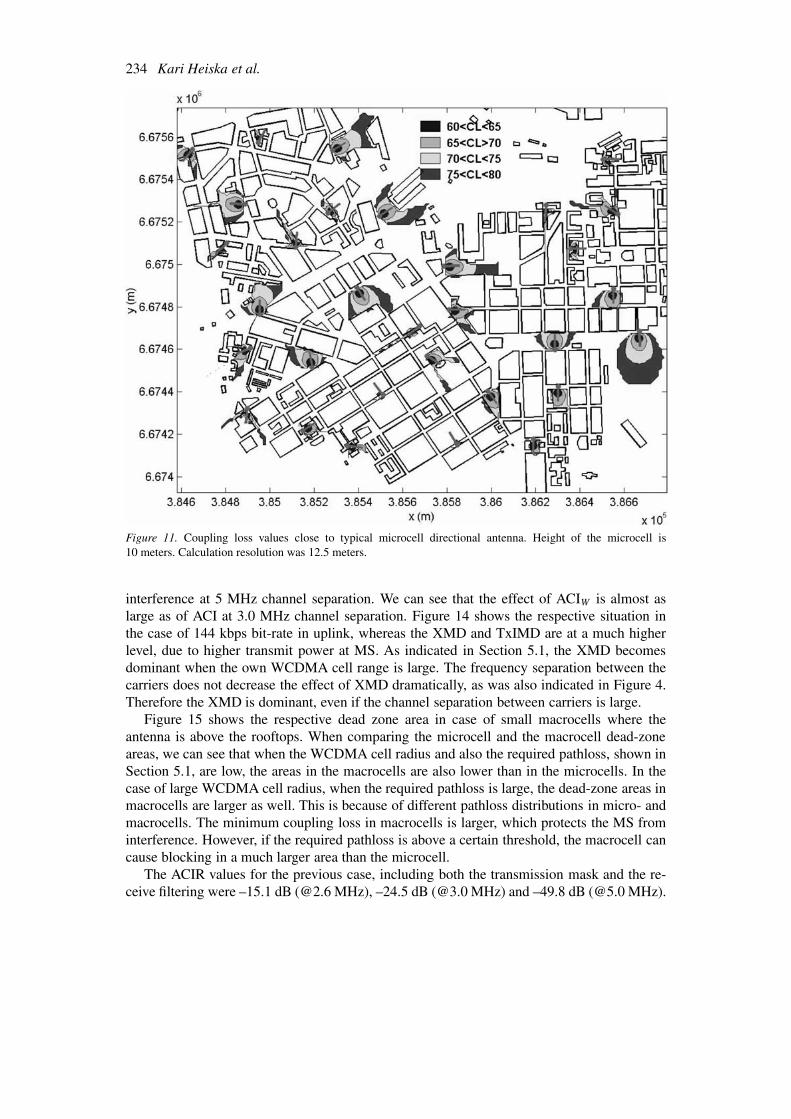
Figures 11 and 12 show the coupling loss area of each of the 31 microcells and 18macrocells, respectively. The coupling loss is defined as a loss from the transmitting antennaconnector to the receiver antenna connector, including 4 dB cable losses in each case, butexcluding all possible body losses. In the microcell case there are no areas below 60 dB whenusing this 12.5 meter raster. Because the minimum coupling losses (close to 50 dB) exist ina very small area, these can be observed only when computing the propagation map with aresolution of 1 meter or smaller. It can be seen from Figure 11 that the coupling loss area isvery much dependent on the location of the microcell. If the microcell is located beside anopen area, the coupling loss area, having less than 80 dB coupling loss, can be significantlyhigh. Whereas when the cell is located in a very narrow street, the respective area, for example,can be small.
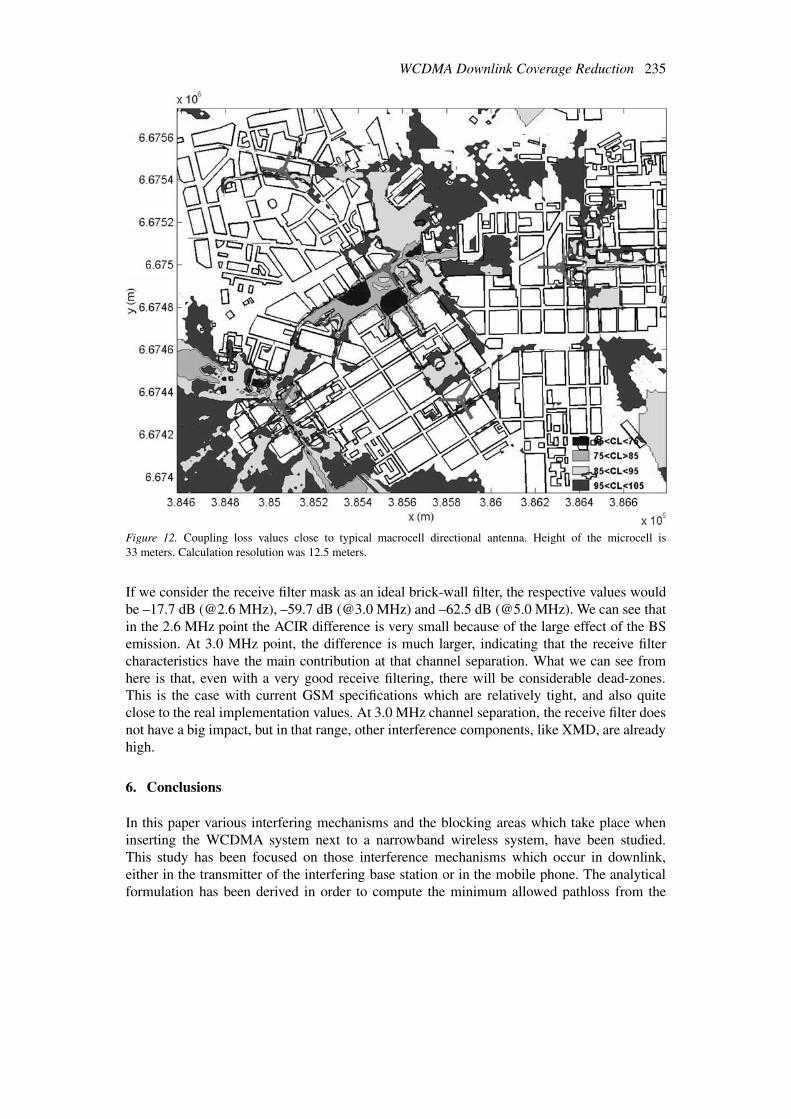
Figure 12 shows the respective coupling loss map in case of macrocellular cell deployment.It can be seen that the shape of the cell is now much more complex, and there are no clear line-of-sight areas visible. Also the variance in the small coupling loss areas is much larger thanin the case of microcells. Because the cells are located on rooftops, the diffracted propagationcomponent from the roof edges attenuates when the wave path propagates to the street level.
WCDMA Downlink Coverage Reduction 233
Figure 10. Macrocell antenna pattern in horizontal and vertical plane.
Therefore the coupling loss can be relatively high, even if the pixel is close to the antenna andthe minimum coupling loss is very sensitive to the exact positioning of the macrocell antennas;is it in the middle or on the side of the building block, and what is the height differencebetween the antenna and the rooftop. The indoor losses have been taken into account as well.The average indoor penetration loss was about 25 dB, which includes outer wall attenuationand the average attenuation inside the building.
5.3. DEAD ZONES
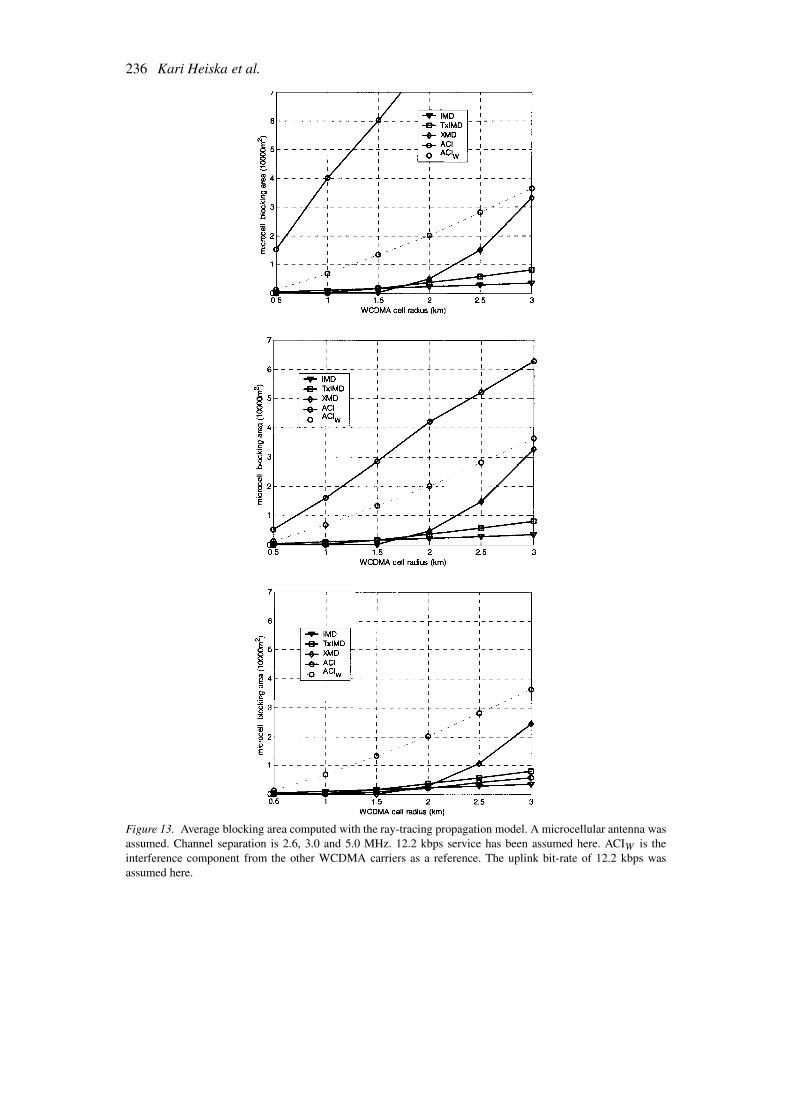
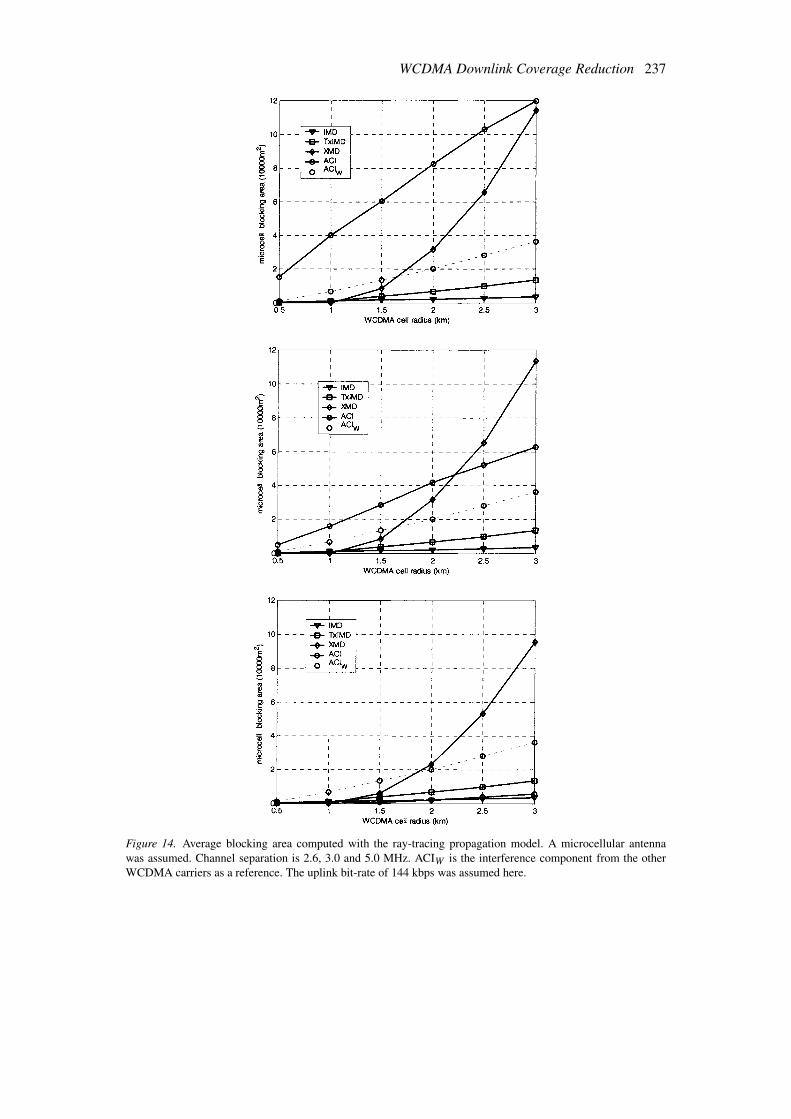
These pathloss data can be utilized when estimating the dead-zone areas for a given pathlossvalue shown in Section 5.1. We have computed the coupling loss distribution by using thepixelwise calculated pathloss maps for each micro- and macrocell base station shown in theprevious section. The average micro and macro distributions of 31 microcells and 18 macro-cells were computed. By using this average distribution, we calculated the average area inwhich the coupling loss value was smaller than the given limit. This average blocking area forchannel separations of 2.6, 3.0 and 5.0 MHz in the microcell case, and with 12.2 kbps uplinkbit rate is shown in Figure 13. The respective results in the case of 144 kbps uplink bit rate areshown in Figure 14. A dead-zone area of 10000 m2 means 64 12.5 meter pixels.
Results indicate that the dead-zone area can be very high in the case of 2.6 MHz channelseparation, due to adjacent channel interference. Results indicate that those cells which arelocated spectrally, just adjacent to the WCDMA carrier, can cause significant deterioration ofthe local WCDMA coverage. Of course, if the band of the narrowband system is large, onlysome cells might cause problems, assuming that no frequency hopping in the narrowbandsystem is used. In the case of 12.2 kbps, other interference components than ACI have quitesmall coverage effect in small ranges. At the larger ranges the effect of XMD, however, is quitesignificant. Also, as a reference we have used the ACIW , which is the WCDMA-WCDMA
234 Kari Heiska et al.
Figure 11. Coupling loss values close to typical microcell directional antenna. Height of the microcell is10 meters. Calculation resolution was 12.5 meters.
interference at 5 MHz channel separation. We can see that the effect of ACIW is almost aslarge as of ACI at 3.0 MHz channel separation. Figure 14 shows the respective situation inthe case of 144 kbps bit-rate in uplink, whereas the XMD and TxIMD are at a much higherlevel, due to higher transmit power at MS. As indicated in Section 5.1, the XMD becomesdominant when the own WCDMA cell range is large. The frequency separation between thecarriers does not decrease the effect of XMD dramatically, as was also indicated in Figure 4.Therefore the XMD is dominant, even if the channel separation between carriers is large.
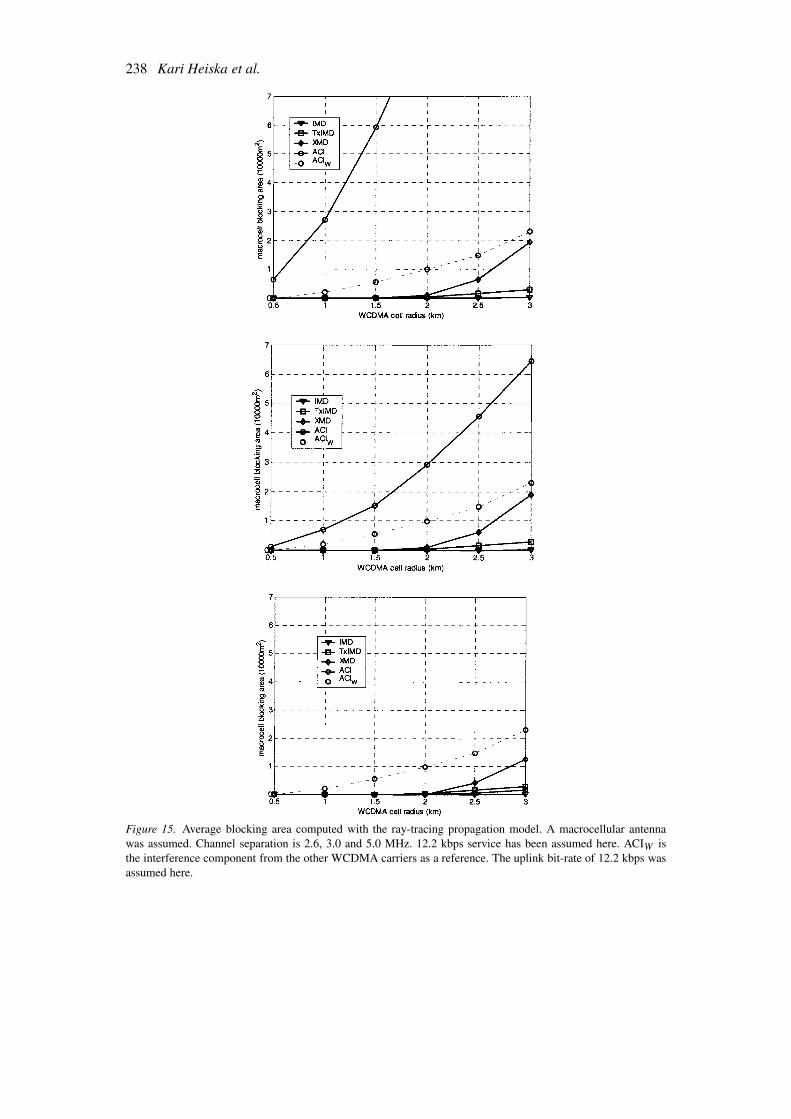
Figure 15 shows the respective dead zone area in case of small macrocells where theantenna is above the rooftops. When comparing the microcell and the macrocell dead-zoneareas, we can see that when the WCDMA cell radius and also the required pathloss, shown inSection 5.1, are low, the areas in the macrocells are also lower than in the microcells. In thecase of large WCDMA cell radius, when the required pathloss is large, the dead-zone areas inmacrocells are larger as well. This is because of different pathloss distributions in micro- andmacrocells. The minimum coupling loss in macrocells is larger, which protects the MS frominterference. However, if the required pathloss is above a certain threshold, the macrocell cancause blocking in a much larger area than the microcell.
The ACIR values for the previous case, including both the transmission mask and the re-ceive filtering were –15.1 dB (@2.6 MHz), –24.5 dB (@3.0 MHz) and –49.8 dB (@5.0 MHz).
WCDMA Downlink Coverage Reduction 235
Figure 12. Coupling loss values close to typical macrocell directional antenna. Height of the microcell is33 meters. Calculation resolution was 12.5 meters.
If we consider the receive filter mask as an ideal brick-wall filter, the respective values wouldbe –17.7 dB (@2.6 MHz), –59.7 dB (@3.0 MHz) and –62.5 dB (@5.0 MHz). We can see thatin the 2.6 MHz point the ACIR difference is very small because of the large effect of the BSemission. At 3.0 MHz point, the difference is much larger, indicating that the receive filtercharacteristics have the main contribution at that channel separation. What we can see fromhere is that, even with a very good receive filtering, there will be considerable dead-zones.This is the case with current GSM specifications which are relatively tight, and also quiteclose to the real implementation values. At 3.0 MHz channel separation, the receive filter doesnot have a big impact, but in that range, other interference components, like XMD, are alreadyhigh.
6. Conclusions
In this paper various interfering mechanisms and the blocking areas which take place wheninserting the WCDMA system next to a narrowband wireless system, have been studied.This study has been focused on those interference mechanisms which occur in downlink,either in the transmitter of the interfering base station or in the mobile phone. The analyticalformulation has been derived in order to compute the minimum allowed pathloss from the
236 Kari Heiska et al.
Figure 13. Average blocking area computed with the ray-tracing propagation model. A microcellular antenna wasassumed. Channel separation is 2.6, 3.0 and 5.0 MHz. 12.2 kbps service has been assumed here. ACIW is theinterference component from the other WCDMA carriers as a reference. The uplink bit-rate of 12.2 kbps wasassumed here.
WCDMA Downlink Coverage Reduction 237
Figure 14. Average blocking area computed with the ray-tracing propagation model. A microcellular antennawas assumed. Channel separation is 2.6, 3.0 and 5.0 MHz. ACIW is the interference component from the otherWCDMA carriers as a reference. The uplink bit-rate of 144 kbps was assumed here.
238 Kari Heiska et al.
Figure 15. Average blocking area computed with the ray-tracing propagation model. A macrocellular antennawas assumed. Channel separation is 2.6, 3.0 and 5.0 MHz. 12.2 kbps service has been assumed here. ACIW isthe interference component from the other WCDMA carriers as a reference. The uplink bit-rate of 12.2 kbps wasassumed here.
WCDMA Downlink Coverage Reduction 239
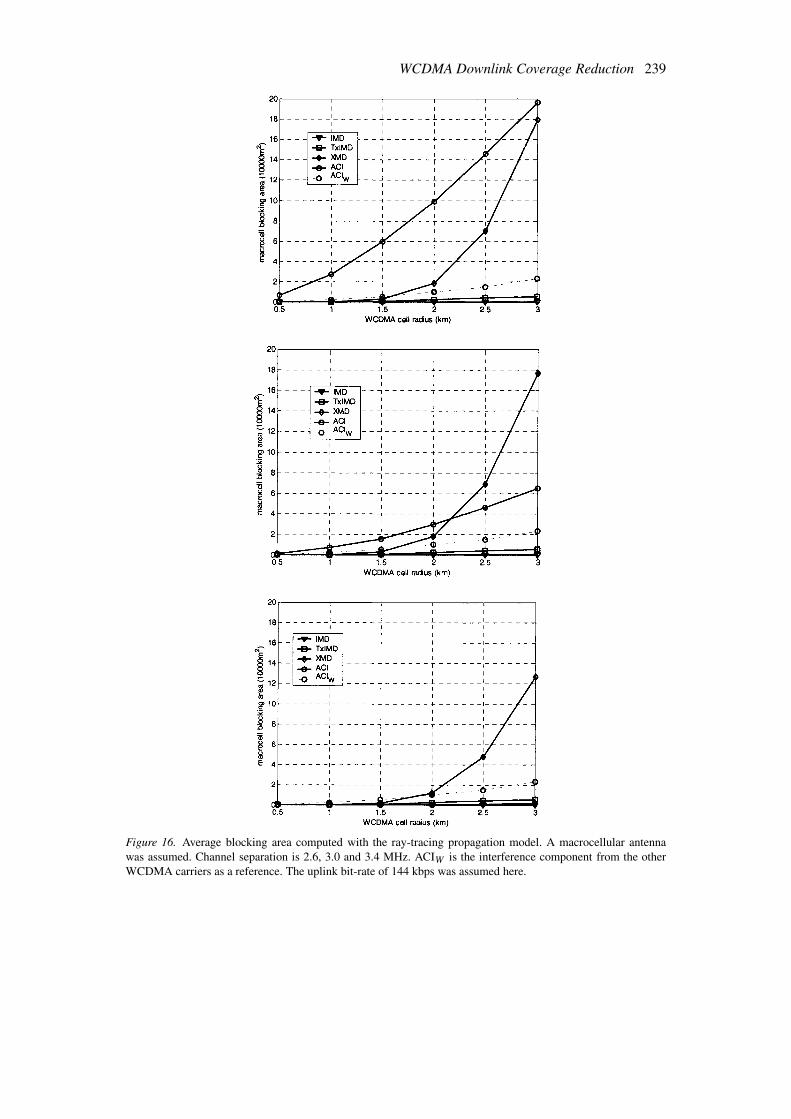
Figure 16. Average blocking area computed with the ray-tracing propagation model. A macrocellular antennawas assumed. Channel separation is 2.6, 3.0 and 3.4 MHz. ACIW is the interference component from the otherWCDMA carriers as a reference. The uplink bit-rate of 144 kbps was assumed here.
240 Kari Heiska et al.
interfering base station to keep the required downlink service level. Based on this analyticalformulation, the urban microcellular and macrocellular case study has also been carried out.Accurate ray-tracing propagation model has been used in order to detect the dead-zone areas inurban environment with narrowband microcellular and macrocellular network in the adjacentchannel.
Results indicate that the adjacent channel interference is the most dominant interferencemechanism if the carrier separation between the narrowband and WCDMA system is low(2.6 MHz). The Adjacent Channel Interference (ACI) includes the contributions from the BSemissions and MS receive filtering. It has been shown in this paper that, when the carrierseparation is small, the receive filtering does not have a big impact on the interference levels,due to out-of band transmission from the adjacent narrowband base station.
The site locations of current narrowband network has a big impact on the interferencelevels in the WCDMA. Also, the cell size of the WCDMA affects the dead-zone areas. Theeffect of the cell range is different in different interference components. Crossmodulation andTx intermodulation are sensitive to the transmitting power of the own WCDMA mobile, andtherefore, the used bit-rate affects also the interference levels. It must be noted that many ofthe results shown here are dependent on the implementation parameters, and only one possibleimplementation has been shown in this paper.
In order to improve the performance of the network, careful site and frequency planningin the network planning phase is needed. The co-operation between operators by co-siting thesites would help the performance of both networks. In the case of large cells, there might belarge interference effects from the adjacent network. Therefore, in urban areas, the rollout ofthe network is quite crucial. These same effects happen not only in the case of WCDMA-NB interference, but also when two WCDMA operators use adjacent frequencies. One wayto overcome the coverage degradation due to interference problems is to use intersystemhandover, if we have several carriers available. In the case of large interference from adjacentsystems, in some locations the mobile can change the carrier and thus avoid the interferenceproblems.
References
1. K. Hamied and G. Labedz, “AMPS Cell Transmitter Interference to CDMA Mobile Receiver”, Proceedingsof Vehicular Technology Conference, Vol. 3, pp. 1467–1471, 1996.
2. D. Kwon, H. Hong and, S. Kang, “CDMA Mobile Station Intermodulation Interference Induced byAMPS Competitor Base Station”, Proceedings of IEEE 4th International Symposium on Spread SpectrumTechniques and Applications, Vol. 1, pp. 380–384, 1996.
3. S.C. Yang, CDMA RF System Engineering, Artech House, 1998.4. European Telecommunications Standards Institute (ETSI), GSM 05.05, http://www.etsi.org.5. 3rd Generation Partnership Project (3GPP), Technical Specification Group (TSG), UTRA FDD, Radio
Requirements: TS 25.101 and TS 25.104.6. J.S. Lee and L.E. Miller, CDMA Systems Engneering Handbook, Artech House Publishers, 1998.7. J. Laiho, A. Wacker and T. Novosad (eds), Radio Network Planning and Optimization for UMTS, Wiley &
Sons, 2001.8. K. Heiska and A. Kangas, “Microcell Propagation Model for Network Planning”, IEEE. Proc. of PIMRC
’96, Taiwan, Oct. 1996, pp. 148–152.9. B. Ko, D. Cheon, S. Kim, J. Ko, J. Kim and B. Park, “A Nightmare for CDMA RF Receiver: The Cross
Modulation”, in AP-ASIC ’99, 1999, pp. 400–402.10. V. Aparin, B. Butler and P. Draxler, “Cross-Modulation Distortion in CDMA receivers”, in Proceedings of
IEEE MTTS, 2000, pp. 1953–1956.
WCDMA Downlink Coverage Reduction 241
11. G. Wölfle, R. Hoppe and F.M. Landstorfer, “A Fast and Enhanced Ray Optical Propagation Model for Indoorand Urban Scenarios, Based on an Intelligent Preprocessing of the Database”, in Proceedings of the 10thPIMRC 1999, Osaka, Japan, Sept. 1999, F5-3.
Kari Heiska was born in Toivakka, Finland in 1968. He received the M.Sc. and Lic.Tech.degrees in 1992 and 1996 respectively, at Helsinki University of Technology, Espoo, Finland,and is currently working towards the Ph.D. degree. Since 1994 he has been with NokiaNetworks as a research engineer. His research interests are radio wave propagation, thirdgeneration mobile system design and 3G radio network planning and optimization.
Harri Posti was born in Rovaniemi, Finland, on 2 November 1965. He received his M.Sc.E.E.in 1991 and his Ph.D. in 2000, both from the University of Oulu. Posti has held variousspecialist and managerial positions in Nokia Networks, and is currently working as a principalengineer. His areas of interest have included cellular WLL, high-speed GSM data transmis-sion, GSM radio network performance, wide-band GSM transceivers, as well as multi-radiotechnology. He is the sole or co-inventor of 20 patents and about 10 patent applications.
Peter Muszynski graduated in 1988 with an M.Sc. degree in mathematics and computerscience at Technical University Munich. Since 1990 he is with Nokia Networks, initially in theGSM switching product development, but since 1992 he is active in the research of 3G mobile
242 Kari Heiska et al.
systems. He is currently head of WCDMA Radio System Research, leading a team that isinvolved in developing and verifying performance enhancing features for 3G radio systems.
Terhi Rautianen received her M.Sc. in 1994 from Tampere University of Technology and herPh.D. in 1999 from Oxford University. Since 1999 she has been at Nokia Research Center,working on 3G network planning and optimisation, radio propagation and channel modelling.
Related Documents