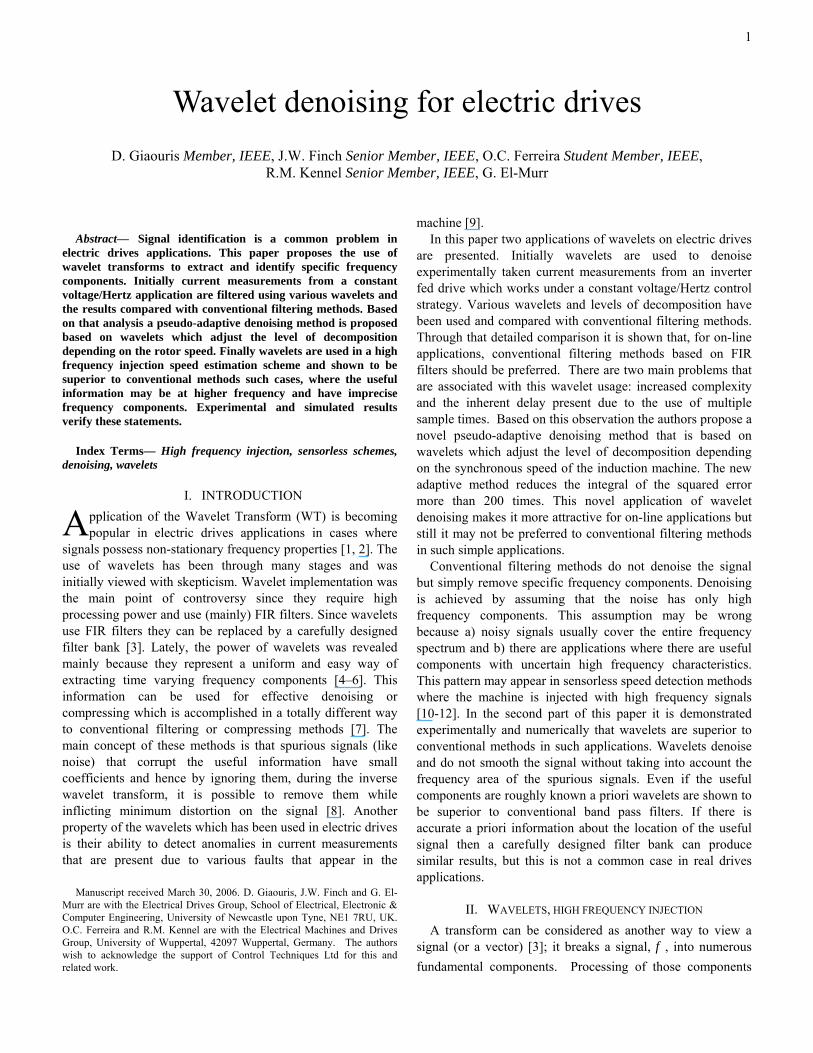
1 Wavelet denoising for electric drives D. Giaouris Member, IEEE, J.W. Finch Senior Member, IEEE, O.C. Ferreira Student Member, IEEE, R.M. Kennel Senior Member, IEEE, G. El-Murr Abstract— Signal identification is a common problem in electric drives applications. This paper proposes the use of wavelet transforms to extract and identify specific frequency components. Initially current measurements from a constant voltage/Hertz application are filtered using various wavelets and the results compared with conventional filtering methods. Based on that analysis a pseudo-adaptive denoising method is proposed based on wavelets which adjust the level of decomposition depending on the rotor speed. Finally wavelets are used in a high frequency injection speed estimation scheme and shown to be superior to conventional methods such cases, where the useful information may be at higher frequency and have imprecise frequency components. Experimental and simulated results verify these statements. Index Terms— High frequency injection, sensorless schemes, denoising, wavelets I. INTRODUCTION pplication of the Wavelet Transform (WT) is becoming popular in electric drives applications in cases where signals possess non-stationary frequency properties [1, 2]. The use of wavelets has been through many stages and was initially viewed with skepticism. Wavelet implementation was the main point of controversy since they require high processing power and use (mainly) FIR filters. Since wavelets use FIR filters they can be replaced by a carefully designed filter bank [3]. Lately, the power of wavelets was revealed mainly because they represent a uniform and easy way of extracting time varying frequency components [4–6]. This information can be used for effective denoising or compressing which is accomplished in a totally different way to conventional filtering or compressing methods [7]. The main concept of these methods is that spurious signals (like noise) that corrupt the useful information have small coefficients and hence by ignoring them, during the inverse wavelet transform, it is possible to remove them while inflicting minimum distortion on the signal [8]. Another property of the wavelets which has been used in electric drives is their ability to detect anomalies in current measurements that are present due to various faults that appear in the machine [9]. Manuscript received March 30, 2006. D. Giaouris, J.W. Finch and G. El- Murr are with the Electrical Drives Group, School of Electrical, Electronic & Computer Engineering, University of Newcastle upon Tyne, NE1 7RU, UK. O.C. Ferreira and R.M. Kennel are with the Electrical Machines and Drives Group, University of Wuppertal, 42097 Wuppertal, Germany. The authors wish to acknowledge the support of Control Techniques Ltd for this and related work. In this paper two applications of wavelets on electric drives are presented. Initially wavelets are used to denoise experimentally taken current measurements from an inverter fed drive which works under a constant voltage/Hertz control strategy. Various wavelets and levels of decomposition have been used and compared with conventional filtering methods. Through that detailed comparison it is shown that, for on-line applications, conventional filtering methods based on FIR filters should be preferred. There are two main problems that are associated with this wavelet usage: increased complexity and the inherent delay present due to the use of multiple sample times. Based on this observation the authors propose a novel pseudo-adaptive denoising method that is based on wavelets which adjust the level of decomposition depending on the synchronous speed of the induction machine. The new adaptive method reduces the integral of the squared error more than 200 times. This novel application of wavelet denoising makes it more attractive for on-line applications but still it may not be preferred to conventional filtering methods in such simple applications. Conventional filtering methods do not denoise the signal but simply remove specific frequency components. Denoising is achieved by assuming that the noise has only high frequency components. This assumption may be wrong because a) noisy signals usually cover the entire frequency spectrum and b) there are applications where there are useful components with uncertain high frequency characteristics. This pattern may appear in sensorless speed detection methods where the machine is injected with high frequency signals [10-12]. In the second part of this paper it is demonstrated experimentally and numerically that wavelets are superior to conventional methods in such applications. Wavelets denoise and do not smooth the signal without taking into account the frequency area of the spurious signals. Even if the useful components are roughly known a priori wavelets are shown to be superior to conventional band pass filters. If there is accurate a priori information about the location of the useful signal then a carefully designed filter bank can produce similar results, but this is not a common case in real drives applications. II. WAVELETS, HIGH FREQUENCY INJECTION A transform can be considered as another way to view a signal (or a vector) [3]; it breaks a signal, , into numerous fundamental components. Processing of those components f A

Welcome message from author
This document is posted to help you gain knowledge. Please leave a comment to let me know what you think about it! Share it to your friends and learn new things together.
Transcript
1
Wavelet denoising for electric drives D. Giaouris Member, IEEE, J.W. Finch Senior Member, IEEE, O.C. Ferreira Student Member, IEEE,
R.M. Kennel Senior Member, IEEE, G. El-Murr
Abstract— Signal identification is a common problem in
electric drives applications. This paper proposes the use of wavelet transforms to extract and identify specific frequency components. Initially current measurements from a constant voltage/Hertz application are filtered using various wavelets and the results compared with conventional filtering methods. Based on that analysis a pseudo-adaptive denoising method is proposed based on wavelets which adjust the level of decomposition depending on the rotor speed. Finally wavelets are used in a high frequency injection speed estimation scheme and shown to be superior to conventional methods such cases, where the useful information may be at higher frequency and have imprecise frequency components. Experimental and simulated results verify these statements.
Index Terms— High frequency injection, sensorless schemes, denoising, wavelets
I. INTRODUCTION pplication of the Wavelet Transform (WT) is becoming popular in electric drives applications in cases where
signals possess non-stationary frequency properties [1, 2]. The use of wavelets has been through many stages and was initially viewed with skepticism. Wavelet implementation was the main point of controversy since they require high processing power and use (mainly) FIR filters. Since wavelets use FIR filters they can be replaced by a carefully designed filter bank [3]. Lately, the power of wavelets was revealed mainly because they represent a uniform and easy way of extracting time varying frequency components [4–6]. This information can be used for effective denoising or compressing which is accomplished in a totally different way to conventional filtering or compressing methods [7]. The main concept of these methods is that spurious signals (like noise) that corrupt the useful information have small coefficients and hence by ignoring them, during the inverse wavelet transform, it is possible to remove them while inflicting minimum distortion on the signal [8]. Another property of the wavelets which has been used in electric drives is their ability to detect anomalies in current measurements that are present due to various faults that appear in the
machine [9].
Manuscript received March 30, 2006. D. Giaouris, J.W. Finch and G. El-
Murr are with the Electrical Drives Group, School of Electrical, Electronic & Computer Engineering, University of Newcastle upon Tyne, NE1 7RU, UK. O.C. Ferreira and R.M. Kennel are with the Electrical Machines and Drives Group, University of Wuppertal, 42097 Wuppertal, Germany. The authors wish to acknowledge the support of Control Techniques Ltd for this and related work.
In this paper two applications of wavelets on electric drives are presented. Initially wavelets are used to denoise experimentally taken current measurements from an inverter fed drive which works under a constant voltage/Hertz control strategy. Various wavelets and levels of decomposition have been used and compared with conventional filtering methods. Through that detailed comparison it is shown that, for on-line applications, conventional filtering methods based on FIR filters should be preferred. There are two main problems that are associated with this wavelet usage: increased complexity and the inherent delay present due to the use of multiple sample times. Based on this observation the authors propose a novel pseudo-adaptive denoising method that is based on wavelets which adjust the level of decomposition depending on the synchronous speed of the induction machine. The new adaptive method reduces the integral of the squared error more than 200 times. This novel application of wavelet denoising makes it more attractive for on-line applications but still it may not be preferred to conventional filtering methods in such simple applications.
Conventional filtering methods do not denoise the signal but simply remove specific frequency components. Denoising is achieved by assuming that the noise has only high frequency components. This assumption may be wrong because a) noisy signals usually cover the entire frequency spectrum and b) there are applications where there are useful components with uncertain high frequency characteristics. This pattern may appear in sensorless speed detection methods where the machine is injected with high frequency signals [10-12]. In the second part of this paper it is demonstrated experimentally and numerically that wavelets are superior to conventional methods in such applications. Wavelets denoise and do not smooth the signal without taking into account the frequency area of the spurious signals. Even if the useful components are roughly known a priori wavelets are shown to be superior to conventional band pass filters. If there is accurate a priori information about the location of the useful signal then a carefully designed filter bank can produce similar results, but this is not a common case in real drives applications.
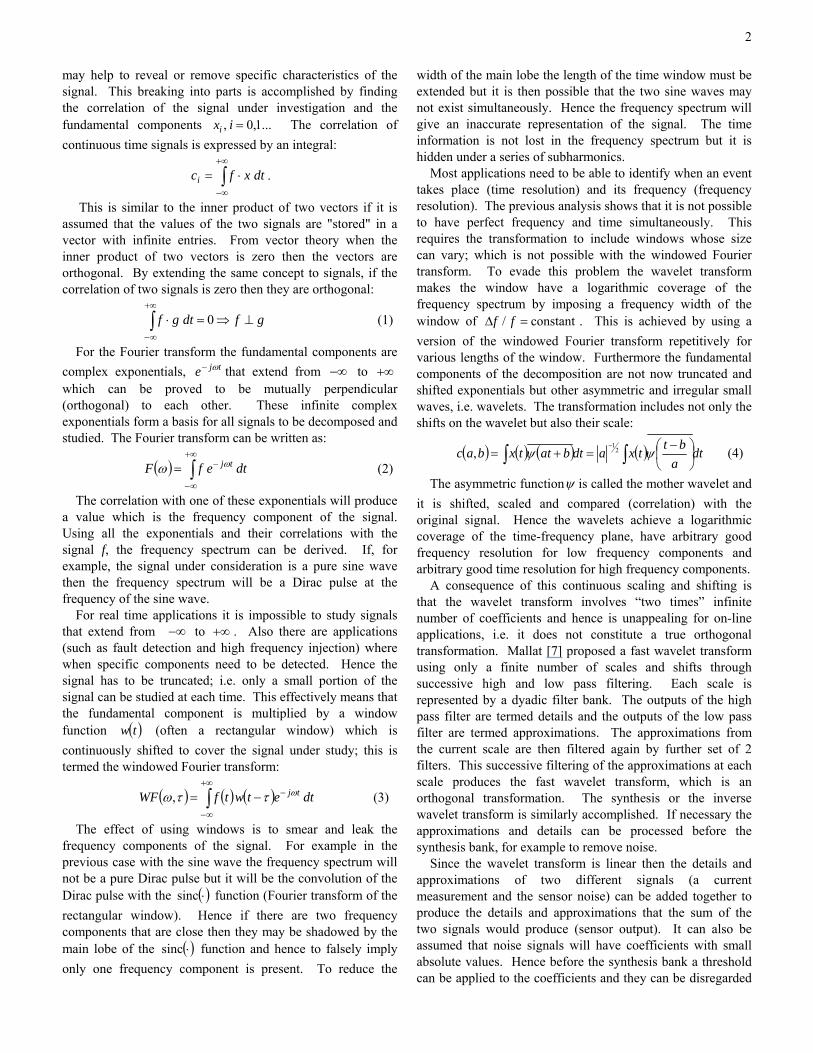
II. WAVELETS, HIGH FREQUENCY INJECTION A transform can be considered as another way to view a
signal (or a vector) [3]; it breaks a signal, , into numerous fundamental components. Processing of those components
f
A
2
may help to reveal or remove specific characteristics of the signal. This breaking into parts is accomplished by finding the correlation of the signal under investigation and the fundamental components The correlation of continuous time signals is expressed by an integral:
...1,0, =ixi
∫+∞
∞−
⋅= dtxfci .
This is similar to the inner product of two vectors if it is assumed that the values of the two signals are "stored" in a vector with infinite entries. From vector theory when the inner product of two vectors is zero then the vectors are orthogonal. By extending the same concept to signals, if the correlation of two signals is zero then they are orthogonal:
(1) gfdtgf ⊥⇒=⋅∫+∞
∞−
0
For the Fourier transform the fundamental components are complex exponentials, that extend from tje ω− −∞ to +∞ which can be proved to be mutually perpendicular (orthogonal) to each other. These infinite complex exponentials form a basis for all signals to be decomposed and studied. The Fourier transform can be written as:
(2) ( ) ∫+∞
∞−
−= dtefF tjωω
The correlation with one of these exponentials will produce a value which is the frequency component of the signal. Using all the exponentials and their correlations with the signal f, the frequency spectrum can be derived. If, for example, the signal under consideration is a pure sine wave then the frequency spectrum will be a Dirac pulse at the frequency of the sine wave.
For real time applications it is impossible to study signals that extend from −∞ to . Also there are applications (such as fault detection and high frequency injection) where when specific components need to be detected. Hence the signal has to be truncated; i.e. only a small portion of the signal can be studied at each time. This effectively means that the fundamental component is multiplied by a window function (often a rectangular window) which is continuously shifted to cover the signal under study; this is termed the windowed Fourier transform:
+∞
( )tw
(3) ( ) ( ) ( )∫+∞
∞−
−−= dtetwtfWF tjωττω,
The effect of using windows is to smear and leak the frequency components of the signal. For example in the previous case with the sine wave the frequency spectrum will not be a pure Dirac pulse but it will be the convolution of the Dirac pulse with the function (Fourier transform of the rectangular window). Hence if there are two frequency components that are close then they may be shadowed by the main lobe of the function and hence to falsely imply only one frequency component is present. To reduce the
width of the main lobe the length of the time window must be extended but it is then possible that the two sine waves may not exist simultaneously. Hence the frequency spectrum will give an inaccurate representation of the signal. The time information is not lost in the frequency spectrum but it is hidden under a series of subharmonics.
( )⋅sinc
( )⋅sinc
Most applications need to be able to identify when an event takes place (time resolution) and its frequency (frequency resolution). The previous analysis shows that it is not possible to have perfect frequency and time simultaneously. This requires the transformation to include windows whose size can vary; which is not possible with the windowed Fourier transform. To evade this problem the wavelet transform makes the window have a logarithmic coverage of the frequency spectrum by imposing a frequency width of the window of constant/ =∆ ff . This is achieved by using a version of the windowed Fourier transform repetitively for various lengths of the window. Furthermore the fundamental components of the decomposition are not now truncated and shifted exponentials but other asymmetric and irregular small waves, i.e. wavelets. The transformation includes not only the shifts on the wavelet but also their scale:
( ) ( ) ( ) ( )∫∫ ⎟⎠⎞
⎜⎝⎛ −
=+=−
dta
bttxadtbattxbac ψψ 21
, (4)
The asymmetric functionψ is called the mother wavelet and it is shifted, scaled and compared (correlation) with the original signal. Hence the wavelets achieve a logarithmic coverage of the time-frequency plane, have arbitrary good frequency resolution for low frequency components and arbitrary good time resolution for high frequency components.
A consequence of this continuous scaling and shifting is that the wavelet transform involves “two times” infinite number of coefficients and hence is unappealing for on-line applications, i.e. it does not constitute a true orthogonal transformation. Mallat [7] proposed a fast wavelet transform using only a finite number of scales and shifts through successive high and low pass filtering. Each scale is represented by a dyadic filter bank. The outputs of the high pass filter are termed details and the outputs of the low pass filter are termed approximations. The approximations from the current scale are then filtered again by further set of 2 filters. This successive filtering of the approximations at each scale produces the fast wavelet transform, which is an orthogonal transformation. The synthesis or the inverse wavelet transform is similarly accomplished. If necessary the approximations and details can be processed before the synthesis bank, for example to remove noise.
Since the wavelet transform is linear then the details and approximations of two different signals (a current measurement and the sensor noise) can be added together to produce the details and approximations that the sum of the two signals would produce (sensor output). It can also be assumed that noise signals will have coefficients with small absolute values. Hence before the synthesis bank a threshold can be applied to the coefficients and they can be disregarded
3
if they are below a specific value. This is an irreversible operation and will also influence the useful signal, but since that has more coefficients with high values the final result will be a slightly distorted, almost noised free, signal.
III. WAVELETS AND SIMPLE CURRENT DENOISING ON CONSTANT V/F SCHEME
A. Experiment arrangement The filtering was tested using an experimental current
waveform, Fig. 1, measured on a modern induction motor based electrical drive. This uses a 4-pole 7.5 kW 400 V, delta connected machine driven by a commercial inverter coupled to a DC load machine. This waveform came from the drive using a simple Volts/Hz control under acceleration from 0 to 10 Hz in 0.2 s at no load.
The best level of decomposition and wavelet was first established with performance comparisons with a normal FIR filter, using a sampling frequency of 10 kHz. Five different levels of analysis were tested and the wavelets that were used are from the Daubechies family, DB2-DB43.
This test signal is a practical signal already contaminated by noise, so the ideal or noise-less signal is not available directly. A more effective comparison can be made if a version of the ideal were available, so the practical signal of Fig. 1 was filtered by an analogue low pass 6th order Butterworth filter with a cut off frequency of 60 Hz. A cut-off frequency as low as this would be impractical in an actual drive expected to run over a range of frequency.
-40
-30
-20
-10
0
10
20
30
40
50
-0.2 0 0.2 0.4 0.6 0.8 1
tim e , s
curr
ent
A
Time (s)
Cur
rent
(A)
Fig. 1 Experimental current used to test wavelet denoising schemes
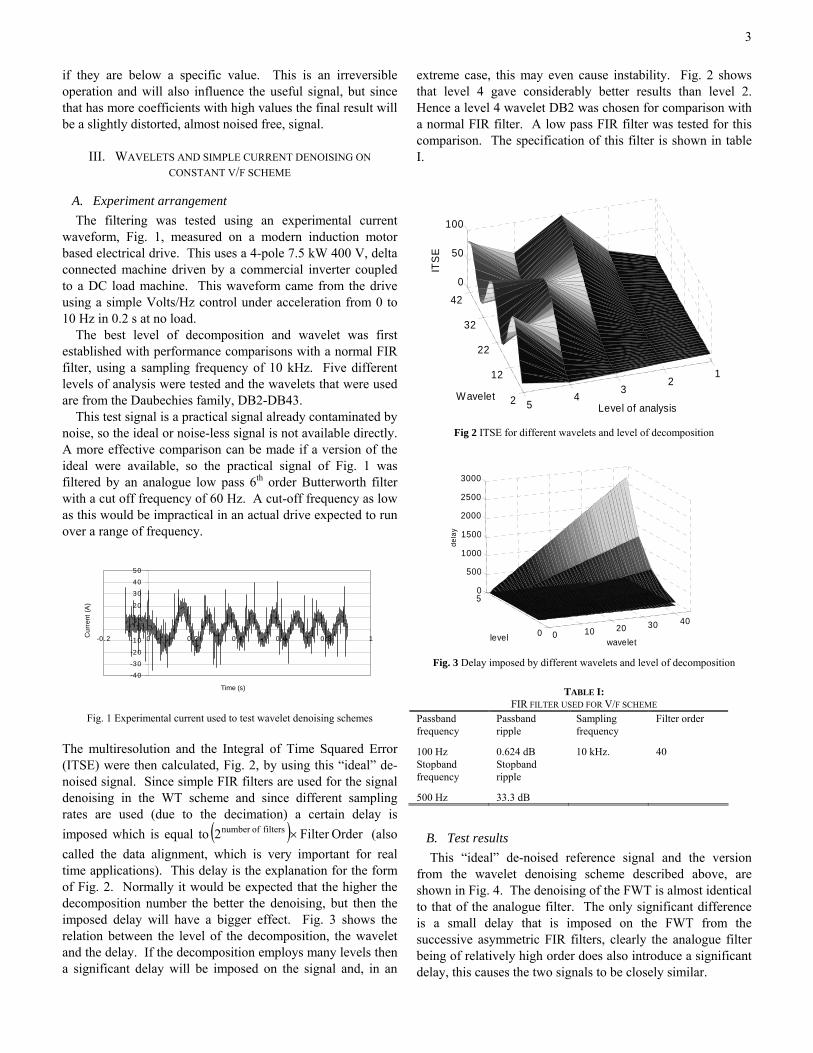
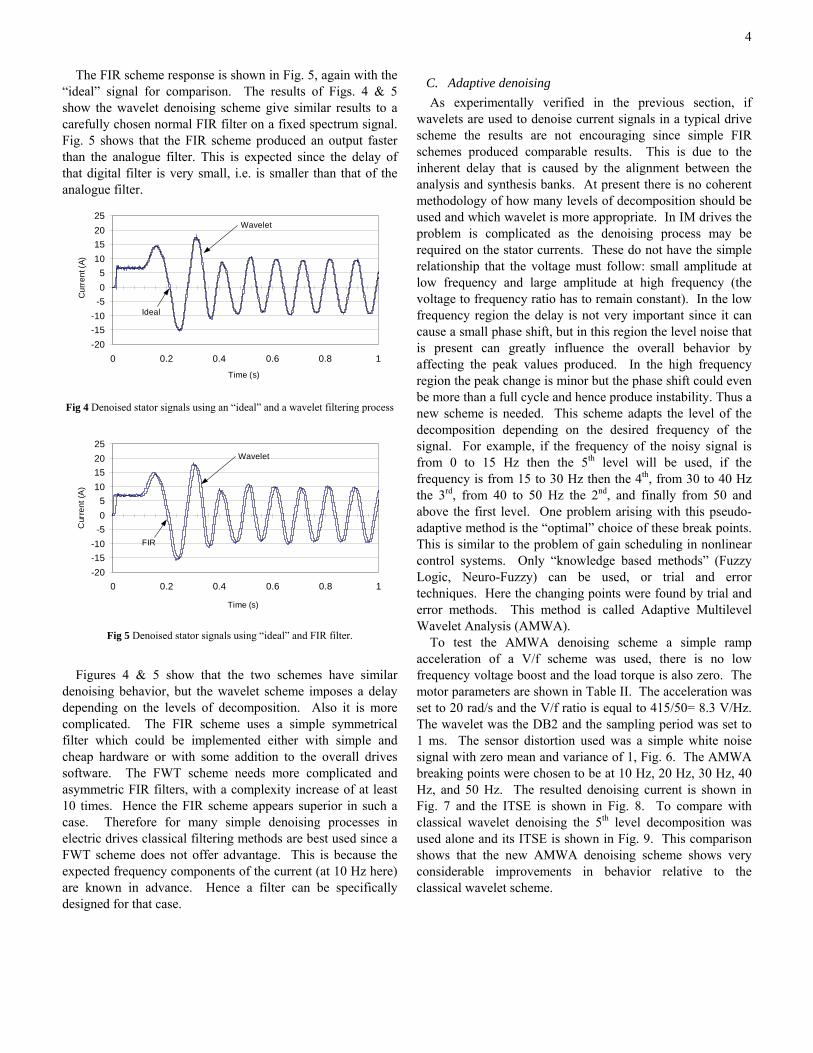
The multiresolution and the Integral of Time Squared Error (ITSE) were then calculated, Fig. 2, by using this “ideal” de-noised signal. Since simple FIR filters are used for the signal denoising in the WT scheme and since different sampling rates are used (due to the decimation) a certain delay is imposed which is equal to ( ) OrderFilter 2 filtersofnumber × (also called the data alignment, which is very important for real time applications). This delay is the explanation for the form of Fig. 2. Normally it would be expected that the higher the decomposition number the better the denoising, but then the imposed delay will have a bigger effect. Fig. 3 shows the relation between the level of the decomposition, the wavelet and the delay. If the decomposition employs many levels then a significant delay will be imposed on the signal and, in an
extreme case, this may even cause instability. Fig. 2 shows that level 4 gave considerably better results than level 2. Hence a level 4 wavelet DB2 was chosen for comparison with a normal FIR filter. A low pass FIR filter was tested for this comparison. The specification of this filter is shown in table I.
2
12
22
32
42
12
34
5
0
50
100
Level of analysisWavelet
ITS
E
Fig 2 ITSE for different wavelets and level of decomposition
0 10 20 30 400
50
500
1000
1500
2000
2500
3000
waveletlevel
dela
y
Fig. 3 Delay imposed by different wavelets and level of decomposition
TABLE I: FIR FILTER USED FOR V/F SCHEME
Passband frequency
Passband ripple
Sampling frequency
Filter order
100 Hz 0.624 dB 10 kHz. 40 Stopband frequency
Stopband ripple
500 Hz 33.3 dB
B. Test results This “ideal” de-noised reference signal and the version
from the wavelet denoising scheme described above, are shown in Fig. 4. The denoising of the FWT is almost identical to that of the analogue filter. The only significant difference is a small delay that is imposed on the FWT from the successive asymmetric FIR filters, clearly the analogue filter being of relatively high order does also introduce a significant delay, this causes the two signals to be closely similar.
4
The FIR scheme response is shown in Fig. 5, again with the “ideal” signal for comparison. The results of Figs. 4 & 5 show the wavelet denoising scheme give similar results to a carefully chosen normal FIR filter on a fixed spectrum signal. Fig. 5 shows that the FIR scheme produced an output faster than the analogue filter. This is expected since the delay of that digital filter is very small, i.e. is smaller than that of the analogue filter.
-20-15-10
-505
10152025
0 0.2 0.4 0.6 0.8 1
time, s
curr
ent,
A
Wavelet
Ideal
Time (s)
Cur
rent
(A)
Fig 4 Denoised stator signals using an “ideal” and a wavelet filtering process
-20-15-10
-505
10152025
0 0.2 0.4 0.6 0.8 1
time, s
curr
ent,
A
Wavelet
FIR
Time (s)
Cur
rent
(A)
Fig 5 Denoised stator signals using “ideal” and FIR filter.
Figures 4 & 5 show that the two schemes have similar denoising behavior, but the wavelet scheme imposes a delay depending on the levels of decomposition. Also it is more complicated. The FIR scheme uses a simple symmetrical filter which could be implemented either with simple and cheap hardware or with some addition to the overall drives software. The FWT scheme needs more complicated and asymmetric FIR filters, with a complexity increase of at least 10 times. Hence the FIR scheme appears superior in such a case. Therefore for many simple denoising processes in electric drives classical filtering methods are best used since a FWT scheme does not offer advantage. This is because the expected frequency components of the current (at 10 Hz here) are known in advance. Hence a filter can be specifically designed for that case.
C. Adaptive denoising As experimentally verified in the previous section, if
wavelets are used to denoise current signals in a typical drive scheme the results are not encouraging since simple FIR schemes produced comparable results. This is due to the inherent delay that is caused by the alignment between the analysis and synthesis banks. At present there is no coherent methodology of how many levels of decomposition should be used and which wavelet is more appropriate. In IM drives the problem is complicated as the denoising process may be required on the stator currents. These do not have the simple relationship that the voltage must follow: small amplitude at low frequency and large amplitude at high frequency (the voltage to frequency ratio has to remain constant). In the low frequency region the delay is not very important since it can cause a small phase shift, but in this region the level noise that is present can greatly influence the overall behavior by affecting the peak values produced. In the high frequency region the peak change is minor but the phase shift could even be more than a full cycle and hence produce instability. Thus a new scheme is needed. This scheme adapts the level of the decomposition depending on the desired frequency of the signal. For example, if the frequency of the noisy signal is from 0 to 15 Hz then the 5th level will be used, if the frequency is from 15 to 30 Hz then the 4th, from 30 to 40 Hz the 3rd, from 40 to 50 Hz the 2nd, and finally from 50 and above the first level. One problem arising with this pseudo-adaptive method is the “optimal” choice of these break points. This is similar to the problem of gain scheduling in nonlinear control systems. Only “knowledge based methods” (Fuzzy Logic, Neuro-Fuzzy) can be used, or trial and error techniques. Here the changing points were found by trial and error methods. This method is called Adaptive Multilevel Wavelet Analysis (AMWA).
To test the AMWA denoising scheme a simple ramp acceleration of a V/f scheme was used, there is no low frequency voltage boost and the load torque is also zero. The motor parameters are shown in Table II. The acceleration was set to 20 rad/s and the V/f ratio is equal to 415/50= 8.3 V/Hz. The wavelet was the DB2 and the sampling period was set to 1 ms. The sensor distortion used was a simple white noise signal with zero mean and variance of 1, Fig. 6. The AMWA breaking points were chosen to be at 10 Hz, 20 Hz, 30 Hz, 40 Hz, and 50 Hz. The resulted denoising current is shown in Fig. 7 and the ITSE is shown in Fig. 8. To compare with classical wavelet denoising the 5th level decomposition was used alone and its ITSE is shown in Fig. 9. This comparison shows that the new AMWA denoising scheme shows very considerable improvements in behavior relative to the classical wavelet scheme.
5
-15
-10
-5
0
5
10
15
0 0.5 1 1.5Time (s)
Cur
rent
(A)
Fig. 6 Noisy stator current signal
-15
-10
-5
0
5
10
15
0 0.5 1
time, s
curr
ent,
A
1.5
Time (s)
Cur
rent
(A)
Fig. 7 Denoised stator current with adaptive scheme
0
0.5
1
1.5
2
2.5
3
0 0.5 1 1
time, s
ITSE
.5
Time (s)
ITS
E
Fig. 8 ITSE of adaptive denoised scheme
0
10
20
30
40
50
60
70
80
90
0 0.5 1
time, s
ITSE
1.5
Time (s)
ITS
E
Fig. 9 ITSE for normal wavelet denoised scheme
TABLE II: RATED VALUES FOR DELTA-CONNECTED SQUIRREL CAGE INDUCTION MACHINE
Quantity Value
Power 7.5 kW Pole Pair Number, P 1 Rated Frequency 50 Hz Rated Voltage 415 Volts Rated Torque 25 Nm Rated Speed 2860 rpm Rated Current 13.5 A Stator Resistance, Rs 2.19 Ω Rotor Resistance, Rr 1.04 Ω Stator Leakage Inductance, ls 17.59 mH Rotor Leakage Inductance, lr 17.59 mH Mutual Inductance, Lm 0.55 H Estimated Inertia, J 0.221 kg m2
IV. WAVELETS AND HIGH FREQUENCY SIGNAL INJECTION
A. Simulation analysis The previous section showed that a FWT scheme may not
offer advantage in the simple fixed frequency filtering. The situation is different if the frequency information of the signal is time varying and its frequency is unknown. Simple FIR filters cannot be used when there is useful information in the current signal in different areas of the frequency spectrum. Hence the FWT is well suited to an application where the bandwidths are uncertain, or if useful components exist at widely spread frequencies. Such an application in an electrical drive would include where signal injection schemes are used for sensorless control for speed identification. This is an active research area [11, 12]. In such a scheme a typical frequency spectrum may be as depicted in Fig. 10.
Fig 10 Illustrative frequency spectrum with signal injection
If the high frequency component is time varying but is remote in frequency from the useful low frequency components then low pass FIR filters are feasible. If the location of both coefficients was known then a filter bank with two FIR filters could be used, one low pass and one band pass. But this is not applicable here so this is a suitable application for wavelets. As an example, assume one component at 50Hz resulting from the machine speed and another component ranging over [1.5kHz, 2.5kHz], which may result from the modulation of the carrier signal with the rotor speed (a test signal at 2kHz is used), sampling frequency 100kHz (this is required since the useful signal now is 200
6
times higher in frequency than before). To mimic a typical case a white noise signal is added giving a SNR of 10. This produced a random signal, with Gaussian distribution, zero mean value and a variance of 0.1. The two useful frequency components come from two sine waves of amplitude 10. To evaluate the denoising process the Mean Squared Error (MSE) of the original noise free and the two denoised signals is used:
( ) ( )( )∑=
−=N
nnxnx
NMSE
1
where ( )nx is the no
2~1
ised free signal and ( )nx~ is the signal un
s. The MSE of the noised and the noised fr
hows the histograms of the noise signal with the same scales.
der consideration. The duration of the simulation was chosen to be 0.5 s
giving 50000 sampleee signal is: ~0.1. Also for the FWT the principle of “superposition” holds,
i.e. the values of CD1, CD2 and CA2 from the decomposition of two signals are the values given if the two signals are decomposed separately and then added. Hence the two sine waves (the useful signals) and the noise signals can be studied separately. The decomposition of the two sine waves gave three new signals whose histograms are shown in Fig. 11. Fig. 12 s
-40 -30 -20 -10 0 10 20 30 400
100
200CA2
-0.5 0 0.50
500
1000CD2
-0.1 -0.05 0 0.05 0.10
2000
4000CD1
Fig 11 Histograms of two sine waves: approximations and details
-1.5 -1 -0.5 0 0.5 1 1.50
50CA2
-1.5 -1 -0.5 0 0.5 1 1.50
50
100CD2
-1.5 -1 -0.5 0 0.5 1 1.50
100
200CD1
Fig 12 Histograms of the noise signal: approximations and details
Hence if all the values of CD1, CD2 and CD3 that are less than +/-1 are removed (hard thresholding) it can be assumed that all the noise components will be removed as well. These values of +/-1 are empirically found, if Stein's Unbiased Risk method is used then the threshold is +/-4.0332. Other, less conservative, techniques, such as Heuristic Stein's Unbiased Risk, produced similar thresholds. This gives a signal whose MSE with the original is: 0.0277, i.e. 5 times better than the no
this illustrates the power of denoising based on the WT.
eeer freque y
isy signal. More levels or more advanced wavelet techniques (wavelet
packets) can achieve better results. The important point is that this denoising did not require knowledge of its frequency components. It is simply assumed that the useful information has large coefficients and
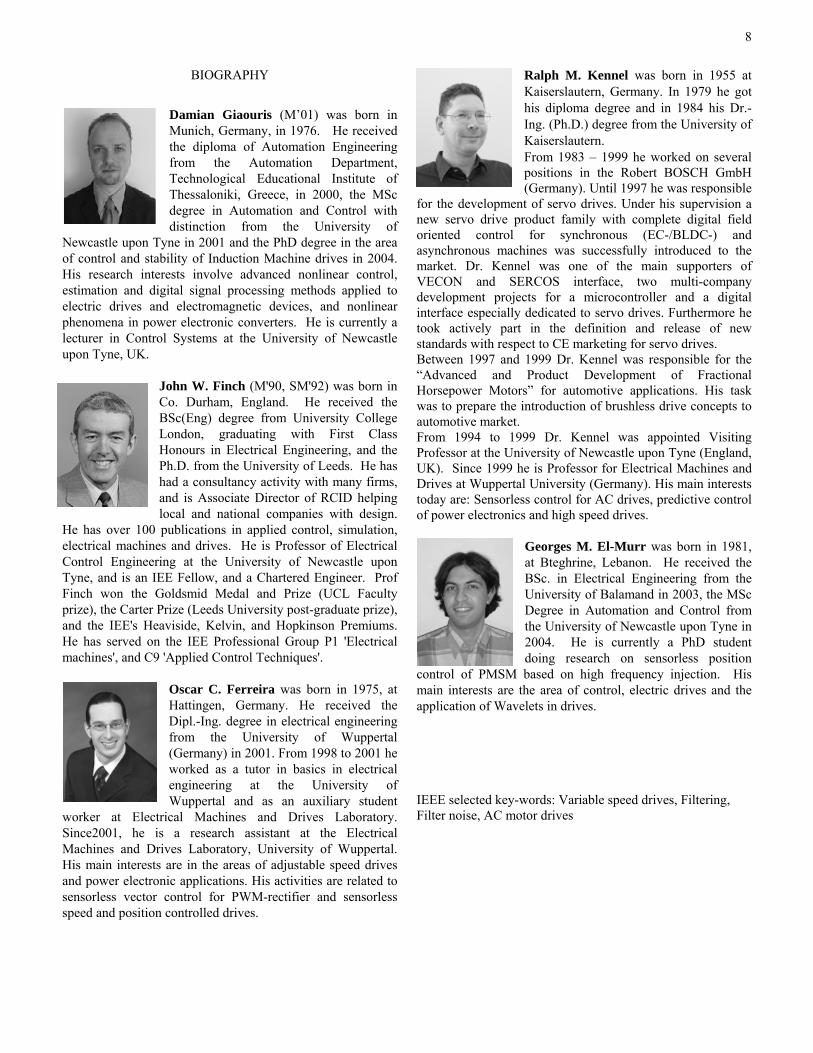
B. Experimental results To further illustrate the power of wavelets when useful signals have unknown high frequency components; a wavelet based denoising process have been used in a high frequency injection speed estimation application [11]. A Permanent Machine (PM) was injected with a high frequency signal of 1.5 kHz when the machine was rotating at a constant low speed of 4.5Hz. By disengaging the angle estimating scheme the stator current expressed at a stationary reference frame is expected to have thr high frequency components, one at the carri nc c ω and two side bands at ac ωω 2+ and ac ωω 2+− , aω is the rotor speed. The parameters of the PM are shown in Table III and the sampling time was set to 25 kHz. In this specific estimation the location of the useful information is roughly known but there are other cases where this is not possible. For example the estimated angle can be grossly wrong and this would move the useful information far way from the carrier. Nevertheless, a wavelet denoising scheme was compared with a normal band-pass filter which can currently be used in these applications. The specifications of that filter are shown in Table IV; the threshold of the wavelet denoising scheme was found by using trial and error methods. Fig. 13 shows the current measurement and Fig. 14 shows the frequency spectra of the original signal, of the filtered signal using a band-pass filter and of the signal that was derived by the wavelet denoising scheme by using a sym8 wavelet, 7 levels of decomposition and hard threshold denoising method at [15 15 12 0 6 6]. To calculate the FFT a Hann window was used. Figure 13 shows that the wavelet method produced a better signal and hence when the angle estimated scheme is engaged the speed sensorless scheme will have better results. It can be the case that even for this specific application if the useful information is a priori known exactly it is possible to use better designed FIR filters. This is not always the case and even then the wavelet produced signals that were less contaminated with noise.
7
-10
-8
-6
-4
-2
0
2
4
6
8
-0.05 0 0.05 0.1 0.15 0.2 0.25 0.3
time, s
phas
e A
cur
rent
, V
Time (s)
Cur
rent
(V)
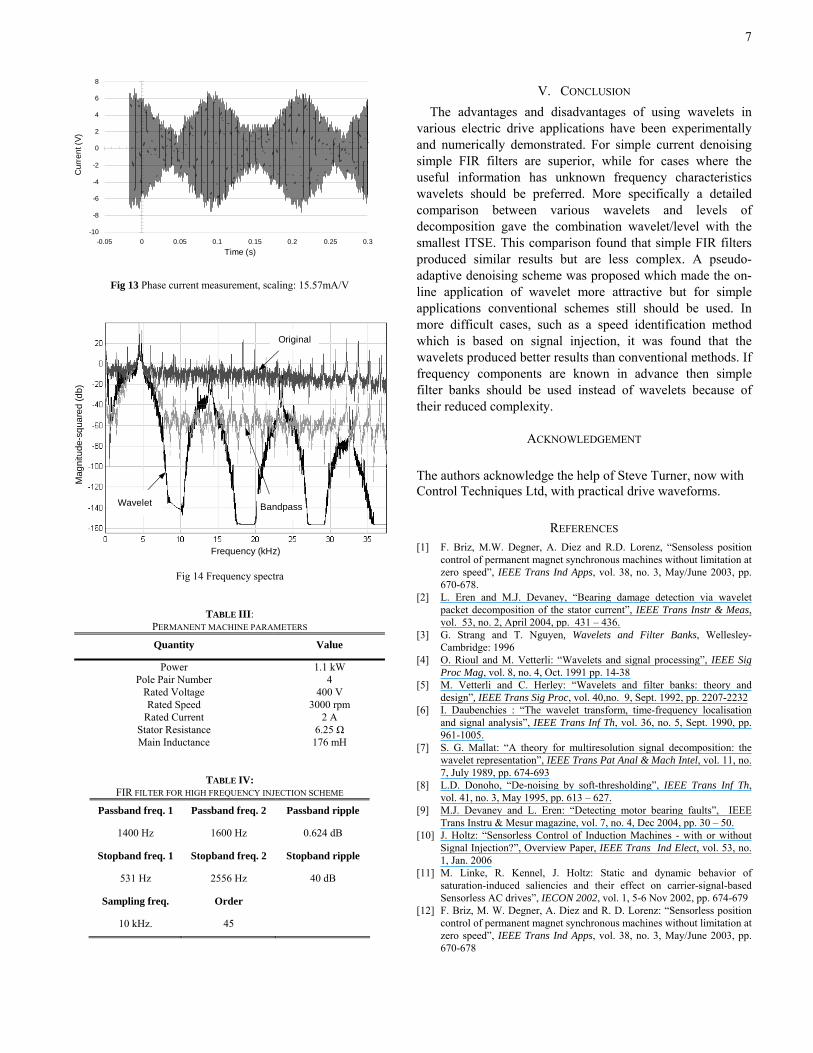
Fig 13 Phase current measurement, scaling: 15.57mA/V
Frequency (kHz)
Mag
nitu
de-s
quar
ed (d
b)
Original
Wavelet Bandpass
Fig 14 Frequency spectra
TABLE III: PERMANENT MACHINE PARAMETERS
Quantity Value
Power 1.1 kW Pole Pair Number 4
Rated Voltage 400 V Rated Speed 3000 rpm
Rated Current 2 A Stator Resistance 6.25 Ω Main Inductance 176 mH
TABLE IV: FIR FILTER FOR HIGH FREQUENCY INJECTION SCHEME
Passband freq. 1 Passband freq. 2 Passband ripple
1400 Hz 1600 Hz 0.624 dB
Stopband freq. 1 Stopband freq. 2 Stopband ripple
531 Hz 2556 Hz 40 dB
Sampling freq. Order
10 kHz. 45
V. CONCLUSION The advantages and disadvantages of using wavelets in
various electric drive applications have been experimentally and numerically demonstrated. For simple current denoising simple FIR filters are superior, while for cases where the useful information has unknown frequency characteristics wavelets should be preferred. More specifically a detailed comparison between various wavelets and levels of decomposition gave the combination wavelet/level with the smallest ITSE. This comparison found that simple FIR filters produced similar results but are less complex. A pseudo-adaptive denoising scheme was proposed which made the on-line application of wavelet more attractive but for simple applications conventional schemes still should be used. In more difficult cases, such as a speed identification method which is based on signal injection, it was found that the wavelets produced better results than conventional methods. If frequency components are known in advance then simple filter banks should be used instead of wavelets because of their reduced complexity.
ACKNOWLEDGEMENT
The authors acknowledge the help of Steve Turner, now with Control Techniques Ltd, with practical drive waveforms.
REFERENCES [1] F. Briz, M.W. Degner, A. Diez and R.D. Lorenz, “Sensoless position
control of permanent magnet synchronous machines without limitation at zero speed”, IEEE Trans Ind Apps, vol. 38, no. 3, May/June 2003, pp. 670-678.
[2] L. Eren and M.J. Devaney, “Bearing damage detection via wavelet packet decomposition of the stator current”, IEEE Trans Instr & Meas, vol. 53, no. 2, April 2004, pp. 431 – 436.
[3] G. Strang and T. Nguyen, Wavelets and Filter Banks, Wellesley-Cambridge: 1996
[4] O. Rioul and M. Vetterli: “Wavelets and signal processing”, IEEE Sig Proc Mag, vol. 8, no. 4, Oct. 1991 pp. 14-38
[5] M. Vetterli and C. Herley: “Wavelets and filter banks: theory and design”, IEEE Trans Sig Proc, vol. 40,no. 9, Sept. 1992, pp. 2207-2232
[6] I. Daubenchies : “The wavelet transform, time-frequency localisation and signal analysis”, IEEE Trans Inf Th, vol. 36, no. 5, Sept. 1990, pp. 961-1005.
[7] S. G. Mallat: “A theory for multiresolution signal decomposition: the wavelet representation”, IEEE Trans Pat Anal & Mach Intel, vol. 11, no. 7, July 1989, pp. 674-693
[8] L.D. Donoho, “De-noising by soft-thresholding”, IEEE Trans Inf Th, vol. 41, no. 3, May 1995, pp. 613 – 627.
[9] M.J. Devaney and L. Eren: “Detecting motor bearing faults”, IEEE Trans Instru & Mesur magazine, vol. 7, no. 4, Dec 2004, pp. 30 – 50.
[10] J. Holtz: “Sensorless Control of Induction Machines - with or without Signal Injection?”, Overview Paper, IEEE Trans Ind Elect, vol. 53, no. 1, Jan. 2006
[11] M. Linke, R. Kennel, J. Holtz: Static and dynamic behavior of saturation-induced saliencies and their effect on carrier-signal-based Sensorless AC drives”, IECON 2002, vol. 1, 5-6 Nov 2002, pp. 674-679
[12] F. Briz, M. W. Degner, A. Diez and R. D. Lorenz: “Sensorless position control of permanent magnet synchronous machines without limitation at zero speed”, IEEE Trans Ind Apps, vol. 38, no. 3, May/June 2003, pp. 670-678
8
BIOGRAPHY
Damian Giaouris (M’01) was born in Munich, Germany, in 1976. He received the diploma of Automation Engineering from the Automation Department, Technological Educational Institute of Thessaloniki, Greece, in 2000, the MSc degree in Automation and Control with distinction from the University of
Newcastle upon Tyne in 2001 and the PhD degree in the area of control and stability of Induction Machine drives in 2004. His research interests involve advanced nonlinear control, estimation and digital signal processing methods applied to electric drives and electromagnetic devices, and nonlinear phenomena in power electronic converters. He is currently a lecturer in Control Systems at the University of Newcastle upon Tyne, UK.
John W. Finch (M'90, SM'92) was born in Co. Durham, England. He received the BSc(Eng) degree from University College London, graduating with First Class Honours in Electrical Engineering, and the Ph.D. from the University of Leeds. He has had a consultancy activity with many firms, and is Associate Director of RCID helping local and national companies with design.
He has over 100 publications in applied control, simulation, electrical machines and drives. He is Professor of Electrical Control Engineering at the University of Newcastle upon Tyne, and is an IEE Fellow, and a Chartered Engineer. Prof Finch won the Goldsmid Medal and Prize (UCL Faculty prize), the Carter Prize (Leeds University post-graduate prize), and the IEE's Heaviside, Kelvin, and Hopkinson Premiums. He has served on the IEE Professional Group P1 'Electrical machines', and C9 'Applied Control Techniques'.
Oscar C. Ferreira was born in 1975, at Hattingen, Germany. He received the Dipl.-Ing. degree in electrical engineering from the University of Wuppertal (Germany) in 2001. From 1998 to 2001 he worked as a tutor in basics in electrical engineering at the University of Wuppertal and as an auxiliary student
worker at Electrical Machines and Drives Laboratory. Since2001, he is a research assistant at the Electrical Machines and Drives Laboratory, University of Wuppertal. His main interests are in the areas of adjustable speed drives and power electronic applications. His activities are related to sensorless vector control for PWM-rectifier and sensorless speed and position controlled drives.
Ralph M. Kennel was born in 1955 at Kaiserslautern, Germany. In 1979 he got his diploma degree and in 1984 his Dr.-Ing. (Ph.D.) degree from the University of Kaiserslautern. From 1983 – 1999 he worked on several positions in the Robert BOSCH GmbH (Germany). Until 1997 he was responsible
for the development of servo drives. Under his supervision a new servo drive product family with complete digital field oriented control for synchronous (EC-/BLDC-) and asynchronous machines was successfully introduced to the market. Dr. Kennel was one of the main supporters of VECON and SERCOS interface, two multi-company development projects for a microcontroller and a digital interface especially dedicated to servo drives. Furthermore he took actively part in the definition and release of new standards with respect to CE marketing for servo drives. Between 1997 and 1999 Dr. Kennel was responsible for the “Advanced and Product Development of Fractional Horsepower Motors” for automotive applications. His task was to prepare the introduction of brushless drive concepts to automotive market. From 1994 to 1999 Dr. Kennel was appointed Visiting Professor at the University of Newcastle upon Tyne (England, UK). Since 1999 he is Professor for Electrical Machines and Drives at Wuppertal University (Germany). His main interests today are: Sensorless control for AC drives, predictive control of power electronics and high speed drives.
Georges M. El-Murr was born in 1981, at Bteghrine, Lebanon. He received the BSc. in Electrical Engineering from the University of Balamand in 2003, the MSc Degree in Automation and Control from the University of Newcastle upon Tyne in 2004. He is currently a PhD student doing research on sensorless position
control of PMSM based on high frequency injection. His main interests are the area of control, electric drives and the application of Wavelets in drives.
IEEE selected key-words: Variable speed drives, Filtering, Filter noise, AC motor drives
Related Documents