UNCORRECTED PROOF Scale effects on water use and water productivity in a rice-based irrigation system (UPRIIS) in the Philippines M.M. Hafeez a,b , B.A.M. Bouman c, *, N. Van de Giesen a,d , P. Vlek a a Center for Development Research (ZEF), Bonn University, Bonn 53113, Germany b CSIRO Land and Water, Wagga Wagga, LMB 588, NSW 2678, Australia c International Rice Research Institute (IRRI), DAPO Box 7777, Manila, Philippines d Technical University of Delft, PO Box 5048, 2600 GA Delft, Netherlands 1. Introduction Rice is eaten by about three billion people and is the most common staple food in Asia (Maclean et al., 2002). Some 75% of the world’s annual rice production is harvested from 79 million ha of irrigated lowland rice, mainly in Asia, where it accounts for 40–46% of the net irrigated area of all crops (Dawe, 2005). Because of its large area, and because rice agricultural water management xxx (2007) xxx–xxx 1 2 3 4 5 6 7 8 9 10 11 12 13 14 15 16 17 18 19 20 21 article info Article history: Accepted 11 May 2007 Keywords: Rice Irrigation Water accounting Water reuse Water productivity Spatial scale abstract Between 25% and 85% of water inputs to rice fields are lost by seepage and percolation. These losses can be reused downstream and do not necessarily lead to true water depletion at the irrigation system level. Because of this potential for reuse, the general efficiency of water use can increase with increasing spatial scale. To test this hypothesis, a multi-scale water accounting study was undertaken in District I of the rice-based Upper Pampanga River Integrated Irrigation System (UPRIIS) in the Philippines. Daily measurements of all surface water inflows and outflows, rainfall, evapotranspiration, and amounts of water internally reused through check dams and shallow pumping were summed into seasonal totals for 10 spatial scale units ranging from 1500 ha to 18,000 ha. The amount of net surface water input (rainfall plus irrigation) per unit area decreased and the process fraction, depleted fraction, water productivity, and amount of water reuse increased with increasing spatial scale. In total, 57% of all available surface water was reused by check dams and 17% by pumping. The amount of water pumped from the groundwater was 30% of the amount of percolation from rice fields. Because of the reuse of water, the water performance indicators at the district level were quite high: the depleted fraction of available water was 71%, the process fraction of depleted water was 80% (close to the 75% area covered by rice), water productivity with respect to available water was 0.45 kg grain m 3 water, and water productivity with respect to evapotranspiration was 0.8 kg grain m 3 water. Water use in the district can be reduced by cutting down the 49 10 6 m 3 uncommitted outflows. The depleted fraction of available water can be increased to 80% or more by a combination of adopting alternate wetting and drying (AWD) and increased pumping to capture percolating water. Water productivity with respect to available water can be increased to 0.83 kg grain m 3 water by a combination of reduced land preparation time, adoption of AWD, and increased fertilizer N use to increase yields. # 2007 Published by Elsevier B.V. * Corresponding author. Tel.: +63 2 845 0563; fax: +63 2 845 0606. E-mail address: [email protected] (B.A.M. Bouman). Q1 AGWAT 2454 1–9 available at www.sciencedirect.com journal homepage: www.elsevier.com/locate/agwat 0378-3774/$ – see front matter # 2007 Published by Elsevier B.V. doi:10.1016/j.agwat.2007.05.006 Please cite this article in press as: Hafeez, M.M. et al., Scale effects on water use and water productivity in a rice-based irrigation system (UPRIIS) in the Philippines, Agric. Water Manage. (2007), doi:10.1016/j.agwat.2007.05.006

Welcome message from author
This document is posted to help you gain knowledge. Please leave a comment to let me know what you think about it! Share it to your friends and learn new things together.
Transcript

123
4
5
6
7
8
9
101112
13
14
15
16
17
Q1
AGWAT 2454 1–9
NC
OR
RE
CTE
D P
RO
OFScale effects on water use and water productivity in a
rice-based irrigation system (UPRIIS) in the Philippines
M.M. Hafeez a,b, B.A.M. Bouman c,*, N. Van de Giesen a,d, P. Vlek a
aCenter for Development Research (ZEF), Bonn University, Bonn 53113, GermanybCSIRO Land and Water, Wagga Wagga, LMB 588, NSW 2678, Australiac International Rice Research Institute (IRRI), DAPO Box 7777, Manila, PhilippinesdTechnical University of Delft, PO Box 5048, 2600 GA Delft, Netherlands
a g r i c u l t u r a l w a t e r m a n a g e m e n t x x x ( 2 0 0 7 ) x x x – x x x
a r t i c l e i n f o
Article history:
Accepted 11 May 2007
Keywords:
Rice
Irrigation
Water accounting
Water reuse
Water productivity
Spatial scale
a b s t r a c t
Between 25% and 85% of water inputs to rice fields are lost by seepage and percolation. These
losses can be reused downstream and do not necessarily lead to true water depletion at the
irrigation system level. Because of this potential for reuse, the general efficiency of water use
can increase with increasing spatial scale. To test this hypothesis, a multi-scale water
accounting study was undertaken in District I of the rice-based Upper Pampanga River
Integrated Irrigation System (UPRIIS) in the Philippines. Daily measurements of all surface
water inflows and outflows, rainfall, evapotranspiration, and amounts of water internally
reused through check dams and shallow pumping were summed into seasonal totals for 10
spatial scale units ranging from 1500 ha to 18,000 ha.
The amount of net surface water input (rainfall plus irrigation) per unit area decreased
and the process fraction, depleted fraction, water productivity, and amount of water reuse
increased with increasing spatial scale. In total, 57% of all available surface water was
reused by check dams and 17% by pumping. The amount of water pumped from the
groundwater was 30% of the amount of percolation from rice fields. Because of the reuse
of water, the water performance indicators at the district level were quite high: the depleted
fraction of available water was 71%, the process fraction of depleted water was 80% (close to
the 75% area covered by rice), water productivity with respect to available water was
0.45 kg grain m�3 water, and water productivity with respect to evapotranspiration was
0.8 kg grain m�3 water. Water use in the district can be reduced by cutting down the
49 � 106 m3 uncommitted outflows. The depleted fraction of available water can be
increased to 80% or more by a combination of adopting alternate wetting and drying
(AWD) and increased pumping to capture percolating water. Water productivity with
respect to available water can be increased to 0.83 kg grain m�3 water by a combination
of reduced land preparation time, adoption of AWD, and increased fertilizer N use to
increase yields.
# 2007 Published by Elsevier B.V.
avai lab le at www.sc iencedi rec t .com
journal homepage: www.e lsev ier .com/ locate /agwat
18
19
20
21
U1. Introduction
Rice is eaten by about three billion people and is the most
common staple food in Asia (Maclean et al., 2002). Some 75% of
* Corresponding author. Tel.: +63 2 845 0563; fax: +63 2 845 0606.E-mail address: [email protected] (B.A.M. Bouman).
0378-3774/$ – see front matter # 2007 Published by Elsevier B.V.doi:10.1016/j.agwat.2007.05.006
Please cite this article in press as: Hafeez, M.M. et al., Scale effects on
(UPRIIS) in the Philippines, Agric. Water Manage. (2007), doi:10.1
the world’s annual rice production is harvested from
79 million ha of irrigated lowland rice, mainly in Asia, where
it accounts for 40–46% of the net irrigated area of all crops
(Dawe, 2005). Because of its large area, and because rice
water use and water productivity in a rice-based irrigation system
016/j.agwat.2007.05.006
E
22
23
24
25
26
27
28
29
30
31
32
33
34
35
36
37
38
39
40
41
42
43
44
45
46
47
48
49
50
51
52
53
54
55
56
57
58
59
60
61
62
63
64
65
66
67
68
69
70
71
72
73
74
75
76
77
78
79
80
81
82
83
84
85
86
87
88
89
90
91
92
93
94
95
96
97
98
99
100
101
102
103
104
105
106
107
108
109
110
111
112
113
114
115
116
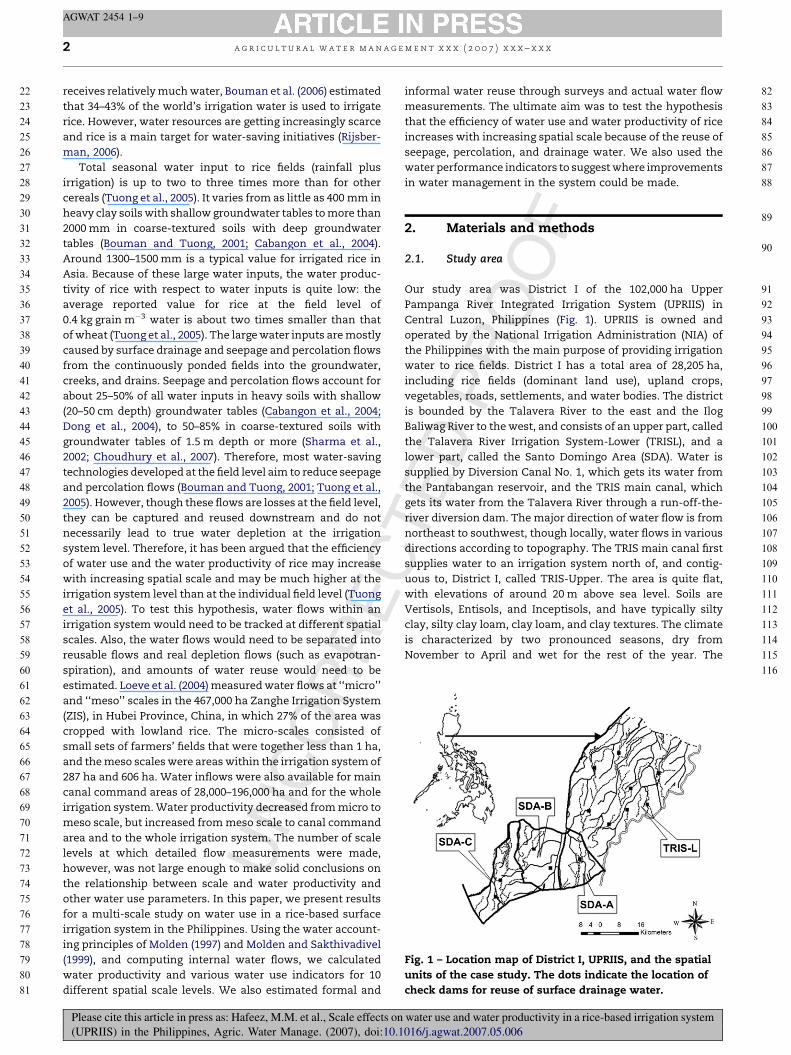
Fig. 1 – Location map of District I, UPRIIS, and the spatial
units of the case study. The dots indicate the location of
check dams for reuse of surface drainage water.
a g r i c u l t u r a l w a t e r m a n a g e m e n t x x x ( 2 0 0 7 ) x x x – x x x2
AGWAT 2454 1–9
UN
CO
RR
receives relatively much water, Bouman et al. (2006) estimated
that 34–43% of the world’s irrigation water is used to irrigate
rice. However, water resources are getting increasingly scarce
and rice is a main target for water-saving initiatives (Rijsber-
man, 2006).
Total seasonal water input to rice fields (rainfall plus
irrigation) is up to two to three times more than for other
cereals (Tuong et al., 2005). It varies from as little as 400 mm in
heavy clay soils with shallow groundwater tables to more than
2000 mm in coarse-textured soils with deep groundwater
tables (Bouman and Tuong, 2001; Cabangon et al., 2004).
Around 1300–1500 mm is a typical value for irrigated rice in
Asia. Because of these large water inputs, the water produc-
tivity of rice with respect to water inputs is quite low: the
average reported value for rice at the field level of
0.4 kg grain m�3 water is about two times smaller than that
of wheat (Tuong et al., 2005). The large water inputs are mostly
caused by surface drainage and seepage and percolation flows
from the continuously ponded fields into the groundwater,
creeks, and drains. Seepage and percolation flows account for
about 25–50% of all water inputs in heavy soils with shallow
(20–50 cm depth) groundwater tables (Cabangon et al., 2004;
Dong et al., 2004), to 50–85% in coarse-textured soils with
groundwater tables of 1.5 m depth or more (Sharma et al.,
2002; Choudhury et al., 2007). Therefore, most water-saving
technologies developed at the field level aim to reduce seepage
and percolation flows (Bouman and Tuong, 2001; Tuong et al.,
2005). However, though these flows are losses at the field level,
they can be captured and reused downstream and do not
necessarily lead to true water depletion at the irrigation
system level. Therefore, it has been argued that the efficiency
of water use and the water productivity of rice may increase
with increasing spatial scale and may be much higher at the
irrigation system level than at the individual field level (Tuong
et al., 2005). To test this hypothesis, water flows within an
irrigation system would need to be tracked at different spatial
scales. Also, the water flows would need to be separated into
reusable flows and real depletion flows (such as evapotran-
spiration), and amounts of water reuse would need to be
estimated. Loeve et al. (2004) measured water flows at ‘‘micro’’
and ‘‘meso’’ scales in the 467,000 ha Zanghe Irrigation System
(ZIS), in Hubei Province, China, in which 27% of the area was
cropped with lowland rice. The micro-scales consisted of
small sets of farmers’ fields that were together less than 1 ha,
and the meso scales were areas within the irrigation system of
287 ha and 606 ha. Water inflows were also available for main
canal command areas of 28,000–196,000 ha and for the whole
irrigation system. Water productivity decreased from micro to
meso scale, but increased from meso scale to canal command
area and to the whole irrigation system. The number of scale
levels at which detailed flow measurements were made,
however, was not large enough to make solid conclusions on
the relationship between scale and water productivity and
other water use parameters. In this paper, we present results
for a multi-scale study on water use in a rice-based surface
irrigation system in the Philippines. Using the water account-
ing principles of Molden (1997) and Molden and Sakthivadivel
(1999), and computing internal water flows, we calculated
water productivity and various water use indicators for 10
different spatial scale levels. We also estimated formal and
Please cite this article in press as: Hafeez, M.M. et al., Scale effects on
(UPRIIS) in the Philippines, Agric. Water Manage. (2007), doi:10.1
CTE
D P
RO
OF
informal water reuse through surveys and actual water flow
measurements. The ultimate aim was to test the hypothesis
that the efficiency of water use and water productivity of rice
increases with increasing spatial scale because of the reuse of
seepage, percolation, and drainage water. We also used the
water performance indicators to suggest where improvements
in water management in the system could be made.
2. Materials and methods
2.1. Study area
Our study area was District I of the 102,000 ha Upper
Pampanga River Integrated Irrigation System (UPRIIS) in
Central Luzon, Philippines (Fig. 1). UPRIIS is owned and
operated by the National Irrigation Administration (NIA) of
the Philippines with the main purpose of providing irrigation
water to rice fields. District I has a total area of 28,205 ha,
including rice fields (dominant land use), upland crops,
vegetables, roads, settlements, and water bodies. The district
is bounded by the Talavera River to the east and the Ilog
Baliwag River to the west, and consists of an upper part, called
the Talavera River Irrigation System-Lower (TRISL), and a
lower part, called the Santo Domingo Area (SDA). Water is
supplied by Diversion Canal No. 1, which gets its water from
the Pantabangan reservoir, and the TRIS main canal, which
gets its water from the Talavera River through a run-off-the-
river diversion dam. The major direction of water flow is from
northeast to southwest, though locally, water flows in various
directions according to topography. The TRIS main canal first
supplies water to an irrigation system north of, and contig-
uous to, District I, called TRIS-Upper. The area is quite flat,
with elevations of around 20 m above sea level. Soils are
Vertisols, Entisols, and Inceptisols, and have typically silty
clay, silty clay loam, clay loam, and clay textures. The climate
is characterized by two pronounced seasons, dry from
November to April and wet for the rest of the year. The
water use and water productivity in a rice-based irrigation system
016/j.agwat.2007.05.006
C
116
117
118
119
120
121
122
123
124
125
126
127
128
129
130
131
132
133
134
135
136
137
138
139
140
141
142
143
144
145
146
147
148
149
150
151
152
153
154
155
156
157
158
159
160
161
162
163
164
165
166
167
168
169
170
171
172
173
174
175
176
177178
179
180
181
182
183
184
185
a g r i c u l t u r a l w a t e r m a n a g e m e n t x x x ( 2 0 0 7 ) x x x – x x x 3
AGWAT 2454 1–9
E
average annual rainfall is about 1900 mm, of which 90% falls in
the wet season (Tabbal et al., 2002).
Our study was conducted in the 2000–2001 dry season. It
started with the first release of water in the main canals on 19
November 2000, and ended with the harvest of the last rice
crops on 18 May 2001. District I was subdivided into four
spatial units (Fig. 1): TRISL, SDA-A, SDA-B, and SDA-C. All
boundaries were roads, which were selected in such a way
that all surface water flowing in and out of the areas
underneath the roads could be measured. A downstream
part of District I in the southwest was excluded since this part
of the system was inaccessible by roads and no well-defined
boundaries were available across which water flows could be
measured. Six additional spatial units were obtained for the
water accounting analysis by combining contiguous units, so
that a total of 10 units were obtained: the four original ones,
plus SDA-AB, SDA-BC, SDA-ABC, TRISL + SDA-A, TRISL + SDA-
AB, and TRISL + SDA-ABC. Surface water (inflow and/or
outflow) flowed across the boundaries of all units.
2.2. Water accounting
The water accounting framework is basically an analysis of
the water balance, in which the outflows are classified
according to their use, or potential use, within or outside
that area (Table 1). The three-dimensional boundaries of our
study area were the horizontal outer boundaries of the 10
combined units, the top of the surface/vegetation, and the
bottom of the rootzone. Keeping in line with Loeve et al. (2004),
we focused our water accounting on surface water, and we
separately analyzed the net flow of water across the lower
boundary (rootzone) as the closing term of the water balance.
We computed all water flows as seasonal totals, from 19
November 2000 to 18 May 2001. The gross inflow was rainfall
plus all surface irrigation water. The net inflow was the gross
inflow minus the change in water stored at the surface (mainly
in the canals) and in water stored in the rootzone of the crops
UN
CO
RR
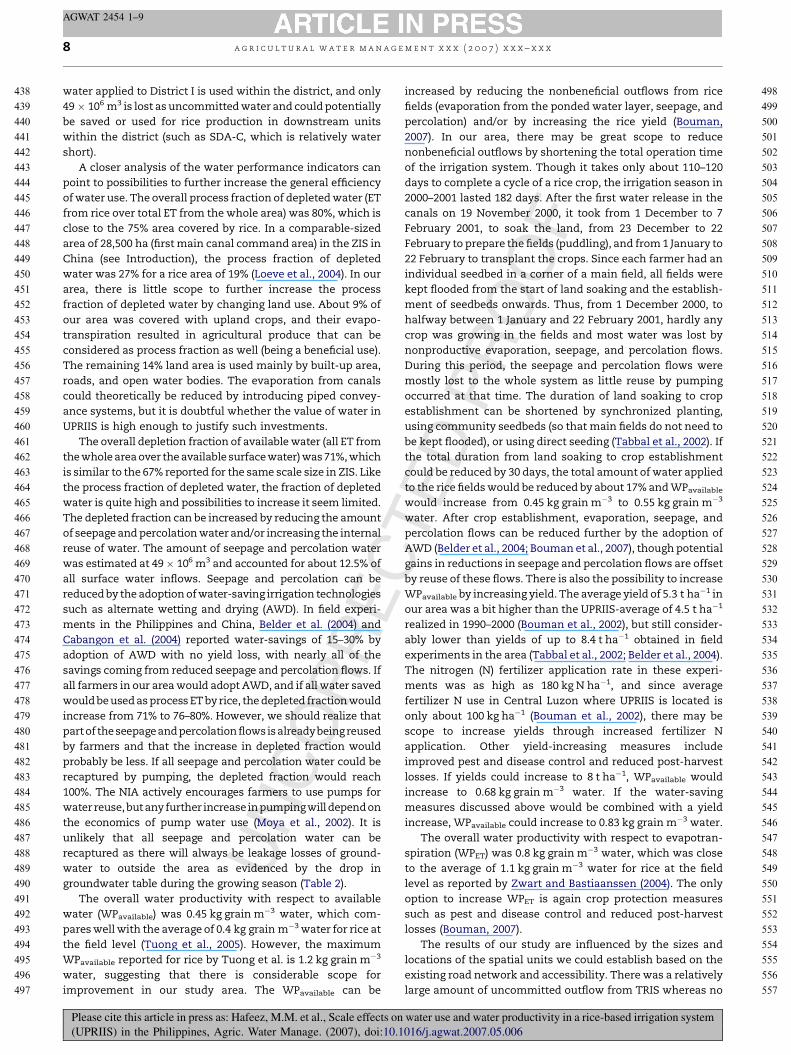
Table 1 – Water accounting and performance indicators in DisSakthivadivel (1999))
Indicator
Gross inflow Total amount of water flowing into the
surface irrigation
Net inflow Gross inflow less the change in storage
equals gross inflow in our study area
Committed water Part of outflow from the spatial units t
irrigation by the other spatial units
Uncommitted outflow Water which is neither depleted nor co
because of lack of storage or operation
Available water Net inflow less the committed water
Process flow That part of the water outflows that is
evapotranspiration is the only process
Depletion flow Water outflow of the spatial units that
percolation flows to unrecoverable sin
depletion flows are evapotranspiration
Process fraction (PF) Ratio of process depletion (rice evapot
(PFavailable), and to depleted water (PFde
Depleted fraction (DF) Ratio of total depletion (both rice and
Water productivity (WP) Ratio of rice grain production to gross
depletion (WPET)
Please cite this article in press as: Hafeez, M.M. et al., Scale effects on
(UPRIIS) in the Philippines, Agric. Water Manage. (2007), doi:10.1
TED
PR
OO
F
from the beginning to the end of the cropping season. Since
the canals were dry before the start of the season and after
harvest of the last crops, the change in surface water storage
was zero. We neglected the change in stored soil water in the
rootzone since our dry season crop followed straight after a
wet season crop and we assumed that the amount of soil water
was the same after a harvested wet season crop and after a
harvested dry season crop. Therefore, the net inflow was the
same as the gross inflow. All surface outflows were considered
‘‘committed’’ when they flowed into a neighboring spatial unit
or further downstream in the irrigated area of District I. All
water flowing out of District I was considered ‘‘uncommitted’’
since there was no immediate major water user downstream
of District I. The only outflow considered ‘‘depletion’’ was
evapotranspiration (ET) since no water percolated to irretrie-
vably deep or saline groundwater. Since the purpose of UPRIIS
is to irrigate rice, we considered only rice ET as ‘‘process
depletion,’’ and all nonrice ET as nonprocess depletion
(following Loeve et al., 2004). Nonprocess depletion is
evaporation from bare soil, build-up area, open water bodies,
and nonrice crops. The transpiration from nonrice crops is a
beneficial water use, of course, but no data on nonrice crops
were available for this study, so this particular use of water
could not be quantified.
2.3. Water balance
The water balance of each spatial unit was calculated as
dW ¼ I� O� ETðmmÞ (1)
where I is the net surface inflow by irrigation and rainfall,O the
surface outflows, and ET is the evapotranspiration of all rice
and nonrice surfaces. The term dW should be interpreted as
the net result of water percolating downward, capillary rise,
and groundwater pumping across the lower boundary (bottom
of the rootzone) of our study area. These components could
not be as accurately assessed as the surface water flows, and,
in the case of percolation, could not be readily classified as
trict I, UPRIIS (adapted from Molden (1997) and Molden and
Description
spatial units of the irrigation system, comprising rainfall and
over the time period within the growing season. Net inflow
hat is committed to downstream uses, in our study area for
mmitted and is available for use, but flows out of the spatial units
al measures
truly used by the intended user. In our study area, rice
flow
is no longer available for reuse, such as evapotranspiration or
ks such as deep or saline groundwater. In our study area, the only
ranspiration) to gross water inflow (PFgross), to available water
pleted)
nonrice ET) to gross inflow (DFgross) and to available water (DFavailable)
water inflow (WPgross), to available water (WPavailable), and to process
water use and water productivity in a rice-based irrigation system
016/j.agwat.2007.05.006

E
186
187
188
189
190
191
192
193
194
195
196
197
198
199
200
201
202
203
204
205
206
207
208
209
210
211
212
213
214
215
216
217
218
219
220
221
222
223
224
225
226
227
228
229
230
231
232
233
234
235
236
237
238
239
240
241
242
243
244
245
246
247
248
249
250
251
252
253
254
255
256
257
258
259
260
261
262
263
264
265
266
267
268
269
270
271
272
273
274
275
276
277
278
279
280
281
282
283
284
285
286
287
288
289
290
291
292
293
294
295
296
297
298
299
300
a g r i c u l t u r a l w a t e r m a n a g e m e n t x x x ( 2 0 0 7 ) x x x – x x x4
AGWAT 2454 1–9
UN
CO
RR
‘‘committed’’ or ‘‘uncommitted.’’ Moreover, part (if not all) of
the water pumped from the groundwater is in fact reuse of
percolation water and is analyzed separately as internal water
reuse. When dW is positive, it means that water is added to the
groundwater or to the soil layers below the rootzone; when it is
negative, it means that water is extracted from the ground-
water or from the soil layers below the rootzone (Bouman
et al., 2007). It should be noted, however, that since dW is
calculated as the closing term of the water balance, it also
includes all errors in the measurement or computation of the
individual water balance components.
Linear regression was performed on water balance com-
ponents against surface area of the spatial scale units.
2.4. Internal water reuse
UPRIIS was designed to reuse surface water through check
dams in creeks and drainage ways. Farmers added to this
water reuse by constructing their own dams that have
subsequently been formalized by the irrigation system
management. There are now a total of 15 check dams in
District I, which are operated and maintained by either NIA or
by groups of farmers. We estimated water flows in inlets at 9
of the 15 check dams (see below). Farmers also informally
reuse water by pumping from shallow groundwater, creeks,
and drains. We surveyed all farmers in the area on pump
ownership and pump use, and counted the number of pumps
in each of our spatial units. We then selected 50 farmers
representative for the different types of pumps and pump
use, and monitored their pump operations during the
growing season. Each pump was calibrated, and pumped
water volumes from surface water and groundwater were
obtained by multiplying calibrated flow rates by recorded
durations of pumping. The pumped water volumes were
extrapolated to our spatial units using the total number of
pumps in each unit.
Groundwater pumping can mean the reuse of water
percolated down from rice fields and/or the use of ground-
water that originated from outside the area. We estimated the
total volume of water percolating down from rice fields by
multiplying the rice area by a mean percolation rate of
2 mm d�1 as reported for the TRIS and SDA areas by Lucero
(1984) and Sattar (1992). This calculation is a conservative
estimate of total percolation flows through the lower
boundaries of our areas since it does not include water
percolating from waterways and nonrice fields.
We also estimated the change in groundwater storage from
the start to the end of the growing season by measuring
groundwater depths in 50 observation wells throughout
District I. The differences in depth were multiplied by a
soil-type specific storage coefficient that was estimated as the
difference in water content between saturation and field
capacity derived from data reported by Ramos (1986). Changes
in groundwater storage for each spatial unit were obtained by
overlaying our spatial units with the soil map (containing the
calculated storage coefficients) and with Thiessen polygons
around the observation wells (containing the measured
changes in groundwater depth). The calculated change in
groundwater storage indicates whether net groundwater
recharge or depletion takes place.
Please cite this article in press as: Hafeez, M.M. et al., Scale effects on
(UPRIIS) in the Philippines, Agric. Water Manage. (2007), doi:10.1
CTE
D P
RO
OF
2.5. Water flow measurements
Surface water flows were tracked twice a day by measuring
water depths and establishing rating curves to estimate flow
volumes. At the inlets of six of the internal check dams, we
installed staff gauges and at three others we installed
automatic water level recorders. We could not measure water
flows at the remaining six dams because of inaccessibility
and/or semi-stagnant water conditions. Surface inflows and
outflows across the boundaries of our spatial units were
measured in all drains, creeks, channels, and culverts (a total
of 158 points) underneath the roads that formed the
boundaries. For most open waterways, we measured water
depth with installed staff gauges, while, for some smaller
waterways, we used V-notch weirs or Parshall flumes. For
culverts, we used standard flow equations and measured
water depths up- and downstream where possible, or we
established our own rating curves again. Rating curves were
established by plotting measured water depths against flow
volumes obtained with current meters. Calibrations were
made until each rating curve (for each staff gauge location)
had an R2 of 0.95 or more. Further details on the measurements
are given by Hafeez (2003). An accuracy analysis using the
electronic water level recorders showed that daily flow rates
obtained from the twice a day readings of the staff gauge were
on average 13% higher than the daily flow rates obtained from
5 min interval readings of water depth with the electronic
recorders.
Rainfall was measured twice a day with eight rain gauges
installed throughout District I, and spatially extrapolated
using Thiessen polygons. Total rainfall for each of our spatial
units was obtained by overlaying with the Thiessen polygons.
We used six MODIS and three Landsat optical satellite
images and the surface energy balance algorithm for land
(SEBAL; Bastiaanssen, 1995) to estimate actual ET. SEBAL is a
thermodynamically based model, which partitions between
sensible heat flux and latent heat of vaporization flux. All
meteorological data for calibration of SEBAL, such as air
temperature, skin water temperature, soil temperature, air
humidity, wind speed, and solar radiation, were collected
hourly on the day of satellite overpass from two weather
stations in District I. The SEBAL-derived ET values were
extrapolated in time using measured (Class A) pan evapora-
tion and calculated Penman–Monteith reference ET using the
daily weather station data. The ET was divided over rice
(process outflow) and other land covers (nonprocess outflow)
based on a supervised classification checked by groundtruth-
ing using a Landsat image from 31 March (the classification
accuracy was estimated as 90%; Hafeez, 2003). The ‘‘other land
covers’’ included mainly built-up areas, open water bodies,
nonrice crops, and bare soil. The final output was a pixel-based
map of seasonal ET in District I, which was then used to obtain
spatially aggregated ET values for all our spatial units. More
details of the approach are given by Hafeez et al. (2002).
2.6. Water performance indicators
For each spatial unit, we calculated a number of water
accounting indicators and water productivity (WP) following
the procedures presented by Molden (1997), as summarized in
water use and water productivity in a rice-based irrigation system
016/j.agwat.2007.05.006

CTE
D P
RO
OF
301
302
303
304
305
306
307
308
309
310
311
312
313
314
315
316
317
318
319
320
321
322
323
324
325
326
327
328
329
330
331
332
333
334
335
336
337
338
339
340
341
342
343
344
345
346
347
348
349
350
351
352
353
354
355
Ta
ble
2–
Ma
inch
ara
cteri
stic
sa
nd
wa
ter
acc
ou
nti
ng
com
po
nen
tsfo
r1
0sp
ati
al
sca
les
inD
istr
ict
I,U
PR
IIS
SD
A-A
SD
A-B
SD
A-C
SD
A-A
BS
DA
-BC
SD
A-A
BC
TR
ISL
TR
ISL
+S
DA
-AT
RIS
L+
SD
A-A
BT
RIS
L+
SD
A-A
BC
To
tal
are
a(h
a)
1513
2240
3011
3753
5251
6764
11,2
39
12,7
52
14,9
92
18,0
03
Ric
ea
rea
(ha
)1177
1709
1972
2886
3681
4858
8,7
13
9,8
90
11,5
99
13,5
71
Up
lan
dcr
op
(ha
)86
242
415
328
657
743
886
972
1,2
14
1,6
29
Rest
(ha
)250
289
624
539
913
1163
1,6
40
1,8
90
2,1
79
2,8
03
Ric
ey
ield
(th
a�
1)
4.7
35.5
84.8
35.1
65.2
05.0
56.0
95.4
15.4
75.3
1
Fa
rmers
(nu
mb
er)
751
901
1051
1652
1952
2703
7,2
07
7,9
58
8,8
59
9,9
10
Pu
mp
s(n
um
ber)
109
107
419
216
526
635
519
628
735
1,1
54
Wa
ter
flo
ws
(all
in10
6m
3)
Irri
ga
tio
nin
flo
w110
129
112
226
127
228
355
355
358
358
Ra
inin
flo
w3
59
814
17
33
37
41
50
Co
mm
itte
do
utfl
ow
95
109
98
195
102
198
231
245
239
250
Un
com
mit
ted
ou
tflo
w0
00
00
049
49
49
49
Av
ail
ab
lew
ate
r18
25
22
39
39
47
157
147
160
159
Ric
eE
Td
ep
leti
on
812
13
20
25
33
57
65
77
90
Oth
er
ET
dep
leti
on
23
65
10
11
11
13
16
22
Ba
lan
ce8
10
214
43
40
20
18
�3
Inte
rna
lw
ate
rfl
ow
s(a
llin
10
6m
3)
Ric
efi
eld
per
cola
tio
n4
67
11
13
18
32
36
42
49
Reu
seb
ych
eck
da
ms
07
29
736
36
54
54
61
90
Pu
mp
ing
surf
ace
wa
ter
00
00
00
11
11
Pu
mp
ing
gro
un
dw
ate
r2
29
310
12
14
16
17
26
Gro
un
dw
ate
rch
an
ge
�1
�2
�1
�3
�4
�4
�3
�3
�5
�7
a g r i c u l t u r a l w a t e r m a n a g e m e n t x x x ( 2 0 0 7 ) x x x – x x x 5
AGWAT 2454 1–9
UN
CO
RR
E
Table 1. Rice yield to calculate WP was obtained from the NIA,
which kept track of the yield of each farmer in the area. For
each spatial unit, total rice production was obtained by
summing the yields of the individual farmers. Linear regres-
sion was performed on the performance indicators against
surface area of the spatial scale units.
3. Results
General characteristics and results of the water balancing and
water accounting are given for each spatial unit in Table 2. The
sizes of the spatial units varied from 1500 ha to about
18,000 ha. Some 10,000 ha of District I, mainly at the down-
stream end in the southwest, were excluded from the analysis.
Rice covered about 75% of the surface area in most of our
spatial units. In SDA-C, the rice area covered only 65% of the
total area, probably because less water was available here,
which prompted farmers to grow less water-demanding crops.
Rice yields were highest in the upstream area TRIS and lowest
in SDA-A, with an absolute difference of 1.36 t ha�1.
3.1. Water accounting and balance
Because of little rainfall, irrigation comprised 88–97% of all
surface water inflows. The irrigation water inflow generally
increased with increasing spatial scale within the whole SDA
(Fig. 2). However, when TRISL was merged with any of the
units of SDA, no more irrigation water was supplied between
scales of 11,000 ha (TRISL) and 18,000 ha. Total water outflows
and net water inflows followed the same trend (Fig. 2). These
trends indicate that large amounts of surface water flowed
overland through the system without being depleted. Out of all
surface water outflows, only 49 � 106 m3 was uncommitted as
it flowed directly into the Talavera River from TRISL. All other
outflows were committed and flowed either into another
spatial unit or into the downstream irrigated area of District I.
Units that had a relatively large irrigation water inflow also
had a relatively large surface water outflow. The result is that
the net surface inflow increased quite linearly with spatial
scale up to the 11,000 ha of TRISL.
Per unit rice area, total net applied surface water (all
surface inflows minus surface outflows) decreased linearly
with increasing scale within the SDA from 1500 mm at 1500 ha
to 1000 mm at 6800 ha (Fig. 3). There was a break in the linear
relation when TRISL was added, but, over all units combined,
applied surface water decreased linearly again from 1200 mm
at 11,000 ha to 800 mm at 18,000 ha. Overall, applied surface
water decreased by 30 mm for every 1000 ha. Out of the
applied amounts of surface water, only 213–295 mm was
rainfall in the different spatial units.
The volume of rice and nonrice ET increased linearly with
spatial scale, indicating uniform evaporation conditions
within District I. Per unit area, the average rice ET was
665 mm for the whole season and 3.7 mm d�1. The nonrice ET
was 503 mm for the whole season and 2.8 mm d�1.
The water balance term (net surface inflows minus surface
outflows and all ET) was relatively small, being 1–10% of total
surface inflows at different scales. The term was positive for
all spatial units except for the combination of all units, for
Please cite this article in press as: Hafeez, M.M. et al., Scale effects on water use and water productivity in a rice-based irrigation system
(UPRIIS) in the Philippines, Agric. Water Manage. (2007), doi:10.1016/j.agwat.2007.05.006

E
OO
F
356
357
358
359
360
361
362
363
364
365
366
367
368
369
370
371
372
373
374
375
376
377
378
379
380
Fig. 2 – Volume of irrigation water inflow (^), surface water
outflow (^), and net inflow (irrigation plus rainfall minus
surface outflow; T) vs. spatial scale. The lines are linear
regressions.
Fig. 3 – Depth (volume divided by rice surface area) of
available surface water (^) and rain water (^) vs. spatial
scale. The lines are linear regressions.
Fig. 4 – Process fraction of net surface inflow (^), available
water (^), and depleted water (T) vs. spatial scale. The
lines are linear regressions.
a g r i c u l t u r a l w a t e r m a n a g e m e n t x x x ( 2 0 0 7 ) x x x – x x x6
AGWAT 2454 1–9
RRwhich it was close to zero. These positive values suggest that
water percolated down and recharged groundwater or flowed
as subsurface water into neighboring units. There was no
relation between the water balance term and scale within SDA
UN
CO
Table 3 – Process fraction (PF), depleted fraction (DF), and wate
SDA-A SDA-B SDA-C SDA-AB SDA-B
PF (%)
PFgross 7 9 11 8 18
PFavailable 45 47 61 50 65
PFdepleted 81 78 68 79 72
DF (%)
DFgross 9 11 16 11 24
DFavailable 56 60 89 63 89
WP (kg grain m�3 water)
WPgross 0.05 0.07 0.08 0.06 0.14
WPavailable 0.32 0.39 0.43 0.38 0.50
WPriceET 0.70 0.82 0.72 0.76 0.77
See Table 1 for explanation of abbreviations.
Please cite this article in press as: Hafeez, M.M. et al., Scale effects on
(UPRIIS) in the Philippines, Agric. Water Manage. (2007), doi:10.1
CTE
D P
R
alone. However, the water balance term decreased consis-
tently with scale starting with TRISL and sequentially adding
units.
3.2. Water performance indicators
The performance indicators are given in Table 3. The process
fraction of all surface water input (irrigation and rainfall) was
relatively low but gradually increased with spatial scale up to
22% for all scale units combined (Fig. 4). The process fraction of
available water was much higher. For SDA, it linearly
increased with spatial scale up to 70% for all SDA units
combined. In TRISL, though the spatial scale was larger, it
dropped down to 36%, partly because of the relatively large
uncommitted surface water outflows from TRISL (Table 2).
However, when SDA units were subsequently added, the
process fraction increased again to a maximum of 57%. The
process fraction of depleted water was relatively independent
of scale because the fraction of the surface area covered by rice
was similar for all spatial units (Table 2).
The depleted fractions of all surface water input and of
available water increased with spatial scale and followed the
same trends as the process fractions (Fig. 5). Again, with the
r productivity (WP) for 10 spatial scales in District I, UPRIIS
C SDA-ABC TRISL TRISL +SDA-A
TRISL +SDA-AB
TRISL +SDA-ABC
13 15 17 19 22
70 36 45 48 57
74 84 84 83 80
18 18 20 23 28
95 43 53 58 71
0.10 0.14 0.14 0.16 0.18
0.52 0.34 0.36 0.40 0.45
0.75 0.92 0.82 0.82 0.80
water use and water productivity in a rice-based irrigation system
016/j.agwat.2007.05.006

C
OO
F
381
382
383
384
385
386
387
388
389
390
391
392
393
394
395
396
397
398
399
400
401
402
403
404
405
406
407
408
409
410
411
412
413
414
415
416
417
418
419
420
421
422
Fig. 5 – Depletion fraction of net surface inflow (^) and
available water (^) vs. spatial scale. The lines are linear
regressions.
Fig. 7 – Volume of reuse of surface water by check dams (^)
and volume of pumped water (^) vs. spatial scale. The
lines are linear regressions.
a g r i c u l t u r a l w a t e r m a n a g e m e n t x x x ( 2 0 0 7 ) x x x – x x x 7
AGWAT 2454 1–9
RR
Elarge uncommitted outflow of water, the depleted fraction of
available water in TRISL was lower than in SDA despite its
larger surface area.
Water productivity with respect to gross inflow and
available water increased with spatial scale and followed
the same trend as the process fractions (Fig. 6). Water
productivity with respect to ET of rice was less scale
dependent and varied between 0.7 kg grain m�3 and
0.9 kg grain m�3 water.
3.3. Water reuse
Data on water reuse are given in Table 2. The reuse of surface
water through check dams was well distributed throughout
the area and increased linearly with 4.6 � 106 m3 per 1000 ha
(Fig. 7). At the highest aggregation level, the reuse of surface
water was 22% of all applied surface water and 57% of all
available surface water. A large number of farmers used
pumps for complete or supplemental irrigation. On average,
12% of the farmers owned a pump, though more farmers used
a pump because of shared use and rental arrangements (Moya
et al., 2002). The highest pump density occurred in SDA-C with
212 pumps 1000�1 ha and 40% of the farmers owning a pump,
UN
CO 423
424
425
426
427
428
429
430
431
432
433
434
435
436
437
Fig. 6 – Water productivity per unit net surface inflow (^),
per unit available water (^), and per unit depleted water
(T) vs. spatial scale. The lines are linear regressions.
Please cite this article in press as: Hafeez, M.M. et al., Scale effects on
(UPRIIS) in the Philippines, Agric. Water Manage. (2007), doi:10.1
TED
PR
confirming the relative lack of surface water suggested by the
relatively low percentage rice area compared with the other
units. The pump density in the other units was 60–90
1000 ha�1 and pump ownership ranged from 7% to 40%.
Pumping from surface water was negligible and nearly all
water was pumped from the shallow groundwater. The total
(re)use of water through pumping increased by 1.3 � 106 m3
per 1000 ha (Fig. 7). At the highest aggregation level, the water
(re)use by pumping was 7% of the applied surface water and
17% of the available water.
3.4. Percolation and groundwater recharge
The estimated amount of percolating water from rice fields
was about one to three times the amount of water pumped
from the groundwater across the spatial units (Table 2).
Despite this percolation flow, which can be interpreted as
recharging the groundwater, groundwater tables in our
observation wells decreased from an average depth of 2.3 m
at the start to 3.4 m (standard error 0.2 m) at the end of the
growing season. Though the estimated changes in stored
groundwater were small (Table 2), the negative values suggest
that groundwater leaked out of the irrigated area.
4. Conclusions and discussion
Our results support the hypothesis that water use becomes
more efficient with increasing scale because of water reuse:
the amount of net surface water input decreased and the
process fraction, depleted fraction, water productivity, and
amount of water reuse increased with increasing spatial scale.
We calculated that in the whole of our study area, 22% of the
applied surface water was reused by internal check dams and
7% through pumping from shallow groundwater. The 22%
reuse through check dams is probably even an underestima-
tion as 6 of the 15 check dams could not be monitored. Because
of the large amount of water reuse, the overall water use in the
area is quite efficient as evidenced by fairly good performance
indicators (Table 3) and low values of uncommitted outflow
(drainage water that is not used downstream). Most of the
water use and water productivity in a rice-based irrigation system
016/j.agwat.2007.05.006
E
438
439
440
441
442
443
444
445
446
447
448
449
450
451
452
453
454
455
456
457
458
459
460
461
462
463
464
465
466
467
468
469
470
471
472
473
474
475
476
477
478
479
480
481
482
483
484
485
486
487
488
489
490
491
492
493
494
495
496
497
498
499
500
501
502
503
504
505
506
507
508
509
510
511
512
513
514
515
516
517
518
519
520
521
522
523
524
525
526
527
528
529
530
531
532
533
534
535
536
537
538
539
540
541
542
543
544
545
546
547
548
549
550
551
552
553
554
555
556
557
a g r i c u l t u r a l w a t e r m a n a g e m e n t x x x ( 2 0 0 7 ) x x x – x x x8
AGWAT 2454 1–9
UN
CO
RR
water applied to District I is used within the district, and only
49 � 106 m3 is lost as uncommitted water and could potentially
be saved or used for rice production in downstream units
within the district (such as SDA-C, which is relatively water
short).
A closer analysis of the water performance indicators can
point to possibilities to further increase the general efficiency
of water use. The overall process fraction of depleted water (ET
from rice over total ET from the whole area) was 80%, which is
close to the 75% area covered by rice. In a comparable-sized
area of 28,500 ha (first main canal command area) in the ZIS in
China (see Introduction), the process fraction of depleted
water was 27% for a rice area of 19% (Loeve et al., 2004). In our
area, there is little scope to further increase the process
fraction of depleted water by changing land use. About 9% of
our area was covered with upland crops, and their evapo-
transpiration resulted in agricultural produce that can be
considered as process fraction as well (being a beneficial use).
The remaining 14% land area is used mainly by built-up area,
roads, and open water bodies. The evaporation from canals
could theoretically be reduced by introducing piped convey-
ance systems, but it is doubtful whether the value of water in
UPRIIS is high enough to justify such investments.
The overall depletion fraction of available water (all ET from
the whole area over the available surface water) was 71%, which
is similar to the 67% reported for the same scale size in ZIS. Like
the process fraction of depleted water, the fraction of depleted
water is quite high and possibilities to increase it seem limited.
The depleted fraction can be increased by reducing the amount
of seepage and percolation water and/or increasing the internal
reuse of water. The amount of seepage and percolation water
was estimated at 49� 106 m3 and accounted for about 12.5% of
all surface water inflows. Seepage and percolation can be
reduced by the adoption of water-saving irrigation technologies
such as alternate wetting and drying (AWD). In field experi-
ments in the Philippines and China, Belder et al. (2004) and
Cabangon et al. (2004) reported water-savings of 15–30% by
adoption of AWD with no yield loss, with nearly all of the
savings coming from reduced seepage and percolation flows. If
all farmers in our area would adopt AWD, and if all water saved
would be used as process ET by rice, the depleted fraction would
increase from 71% to 76–80%. However, we should realize that
part of the seepageand percolation flowsis alreadybeing reused
by farmers and that the increase in depleted fraction would
probably be less. If all seepage and percolation water could be
recaptured by pumping, the depleted fraction would reach
100%. The NIA actively encourages farmers to use pumps for
water reuse,but any further increase inpumping will dependon
the economics of pump water use (Moya et al., 2002). It is
unlikely that all seepage and percolation water can be
recaptured as there will always be leakage losses of ground-
water to outside the area as evidenced by the drop in
groundwater table during the growing season (Table 2).
The overall water productivity with respect to available
water (WPavailable) was 0.45 kg grain m�3 water, which com-
pares well with the average of 0.4 kg grain m�3 water for rice at
the field level (Tuong et al., 2005). However, the maximum
WPavailable reported for rice by Tuong et al. is 1.2 kg grain m�3
water, suggesting that there is considerable scope for
improvement in our study area. The WPavailable can be
Please cite this article in press as: Hafeez, M.M. et al., Scale effects on
(UPRIIS) in the Philippines, Agric. Water Manage. (2007), doi:10.1
CTE
D P
RO
OF
increased by reducing the nonbeneficial outflows from rice
fields (evaporation from the ponded water layer, seepage, and
percolation) and/or by increasing the rice yield (Bouman,
2007). In our area, there may be great scope to reduce
nonbeneficial outflows by shortening the total operation time
of the irrigation system. Though it takes only about 110–120
days to complete a cycle of a rice crop, the irrigation season in
2000–2001 lasted 182 days. After the first water release in the
canals on 19 November 2000, it took from 1 December to 7
February 2001, to soak the land, from 23 December to 22
February to prepare the fields (puddling), and from 1 January to
22 February to transplant the crops. Since each farmer had an
individual seedbed in a corner of a main field, all fields were
kept flooded from the start of land soaking and the establish-
ment of seedbeds onwards. Thus, from 1 December 2000, to
halfway between 1 January and 22 February 2001, hardly any
crop was growing in the fields and most water was lost by
nonproductive evaporation, seepage, and percolation flows.
During this period, the seepage and percolation flows were
mostly lost to the whole system as little reuse by pumping
occurred at that time. The duration of land soaking to crop
establishment can be shortened by synchronized planting,
using community seedbeds (so that main fields do not need to
be kept flooded), or using direct seeding (Tabbal et al., 2002). If
the total duration from land soaking to crop establishment
could be reduced by 30 days, the total amount of water applied
to the rice fields would be reduced by about 17% and WPavailable
would increase from 0.45 kg grain m�3 to 0.55 kg grain m�3
water. After crop establishment, evaporation, seepage, and
percolation flows can be reduced further by the adoption of
AWD (Belder et al., 2004; Bouman et al., 2007), though potential
gains in reductions in seepage and percolation flows are offset
by reuse of these flows. There is also the possibility to increase
WPavailable by increasing yield. The average yield of 5.3 t ha�1 in
our area was a bit higher than the UPRIIS-average of 4.5 t ha�1
realized in 1990–2000 (Bouman et al., 2002), but still consider-
ably lower than yields of up to 8.4 t ha�1 obtained in field
experiments in the area (Tabbal et al., 2002; Belder et al., 2004).
The nitrogen (N) fertilizer application rate in these experi-
ments was as high as 180 kg N ha�1, and since average
fertilizer N use in Central Luzon where UPRIIS is located is
only about 100 kg ha�1 (Bouman et al., 2002), there may be
scope to increase yields through increased fertilizer N
application. Other yield-increasing measures include
improved pest and disease control and reduced post-harvest
losses. If yields could increase to 8 t ha�1, WPavailable would
increase to 0.68 kg grain m�3 water. If the water-saving
measures discussed above would be combined with a yield
increase, WPavailable could increase to 0.83 kg grain m�3 water.
The overall water productivity with respect to evapotran-
spiration (WPET) was 0.8 kg grain m�3 water, which was close
to the average of 1.1 kg grain m�3 water for rice at the field
level as reported by Zwart and Bastiaanssen (2004). The only
option to increase WPET is again crop protection measures
such as pest and disease control and reduced post-harvest
losses (Bouman, 2007).
The results of our study are influenced by the sizes and
locations of the spatial units we could establish based on the
existing road network and accessibility. There was a relatively
large amount of uncommitted outflow from TRIS whereas no
water use and water productivity in a rice-based irrigation system
016/j.agwat.2007.05.006
C
558
559
560
561
562
563
564
565
566
567
568
569
570
571
572
573
574
575
576
577
578
579
580
581
582
583
584
585
586
587
588
589
590
591
592
593
594
595
596
597
598
599
600
601
602
603
604
605
606
607
608
609
610
611
612
613
614
615
616
617
618
619
620
621
622
623
624
625
626
627
628
629
630
631
632
633
634
635
636
637
638
639
640
641
642
643
644
645
646
647
648
649
650
651
652
653
654
655
656
657
658
659
660
661
662
663
664
665
666
667
668
669
670
671
672
673
674
675
676
677
678
679
680
681
682
683
684
a g r i c u l t u r a l w a t e r m a n a g e m e n t x x x ( 2 0 0 7 ) x x x – x x x 9
AGWAT 2454 1–9
UN
CO
RR
E
uncommitted water flowed out of any of the other spatial
units. This caused a ‘‘break’’ in some of the linear relation-
ships between water accounting and performance indicators
with spatial scale when we lumped spatial units in our
analysis. Although the slope of the relationships between
water accounting and performance indicators with spatial
scale will be different with another layout of spatial units, the
trends we have found will be the same. A hydrological model
study is needed next to quantify the options to improve the
efficiency and productivity of water use as discussed above,
and to disentangle spatial tradeoffs in water accounting and
water performance indicators.
Acknowledgments
The following IRRI staff assisted in data collection, data
processing, and overall logistical arrangements: Domeng
Tabbal, Ruben Lampayan, Lizzel Llorca, and Lucio Caramihan.
We thank the NIA and their staff who contributed to this study
and generously shared their data with us.
r e f e r e n c e s
Bastiaanssen, W.G.M., 1995. Regionalization of surface fluxdensities and moisture indicators in composite terrain: aremote sensing approach under clear skies inMediterranean climates. Report 109. Agricultural ResearchDepartment, Wageningen, The Netherlands.
Belder, P., Bouman, B.A.M., Spiertz, J.H.J., Cabangon, R., LuGuoan, Quilang, E.J.P., Li Yuanhua, Tuong, T.P., 2004. Effectof water-saving irrigation on rice yield and water use intypical lowland conditions in Asia. Agric. Water Manage. 65,193–210.
Bouman, B.A.M., 2007. A conceptual framework for theimprovement of crop water productivity at different spatialscales. Agric. Syst. 93, 43–60.
Bouman, B.A.M., Tuong, T.P., 2001. Field water management tosave water and increase its productivity in irrigated rice.Agric. Water Manage. 49, 11–30.
Bouman, B.A.M., Castaneda, A., Bhuiyan, S.I., 2002. Nitrate andpesticide contamination of groundwater under rice-basedcropping systems: evidence from the Philippines. Agric.Ecosyst. Environ. 92, 185–199.
Bouman, B.A.M., Humphreys, E., Barker, R., Tuong, T.P., 2006.Rice water. Adv. Agron. 92, 187–237.
Bouman, B.A.M., Feng, L., Tuong, T.P., Lu, G., Wang, H., Feng, Y.,2007. Exploring options to grow rice under water-shortconditions in northern China using a modelling approach.II. Quantifying yield, water balance components, and waterproductivity. Agric. Water Manage. 88, 23–33.
Cabangon, R.J., Tuong, T.P., Castillo, E.G., Bao, L.X., Lu, G., Wang,G., Cui, Y., Bouman, B.A.M., Li, Y., Chen, C., Wang, J., 2004.Effect of irrigation method and N-fertilizer management onrice yield, water productivity and nutrient-use efficienciesin typical lowland rice conditions in China. Paddy WaterEnviron. 2, 195–206.
Choudhury, B.U., Bouman, B.A.M., Singh, A.K., 2007. Yield andwater productivity of rice-wheat on raised beds at NewDelhi, India. Field Crop. Res. 100, 229–239.
Dawe, D., 2005. Increasing water productivity in rice-basedsystems in Asia—past trends, current problems, and futureprospects. Plant Prod. Sci. 8, 221–230.
Please cite this article in press as: Hafeez, M.M. et al., Scale effects on
(UPRIIS) in the Philippines, Agric. Water Manage. (2007), doi:10.1
TED
PR
OO
F
Dong, B., Molden, D., Loeve, R., Li, Y., Chen, C., Wang, J., 2004.Farm level practices and water productivity in Zangheirrigation system. Paddy Water Environ. 2, 217–226.
Hafeez, M.M., 2003. Water Accounting and Productivity atDifferent Scales in a Rice Irrigation System: A RemoteSensing Approach. Ecology and Development Series No. 8.University of Bonn, Germany.
Hafeez, M.M., Chemin, Y., Van De Giesen, N., Bouman, B.A.M.,2002. Field evapotranspiration estimation in central Luzon,Philippines, using different sensors: Landsat 7 ETM+, TerraMODIS and ASTER. In: Proceedings of the Joint Conferenceon ‘‘Geospatial Theory, Processing, and Applications’’organized by the International Society of Photogrammetryand Remote Sensing (ISPRS)/Canadian Institute ofGeomatics (CIG) Conference, Ottawa, Canada, July 8–12, pp.142–149.
Loeve, R., Dong, B., Molden, D., Li, Y., Chen, C., Wang, J., 2004.Issues of scale in water productivity in the Zhangheirrigation system: implications for irrigation in the basincontext. Paddy Water Environ. 2, 227–236.
Lucero, L.C., 1984. Improved project water management inirrigated rice. Ph.D. Thesis. Utah State University, Logan,UT, USA.
Maclean, J.L., Dawe, D., Hardy, B., Hettel, G.P. (Eds.), 2002. RiceAlmanac. International Rice Research Institute, Los Banos,Philippines.
Molden, D., 1997. Accounting for water use and productivity.SWIM Paper. International Water Management Institute,Colombo, Sri Lanka.
Molden, D., Sakthivadivel, R., 1999. Water accounting to assessuse and productivity of water. Water Res. Dev. 15, 55–71.
Moya, P.F., Dawe, D., Valencia, S., 2002. The effects ofpumping on water use and profitability in dry-seasonrice: a case study in UPRIIS, Philippines. In: Bouman,B.A.M., Hengsdijk, H., Hardy, B., Bindraban, P.S., Tuong,T.P., Ladha, J.K. (Eds.), Proceedings of the InternationalWorkshop on Water-wise Rice Production, InternationalRice Research Institute, Los Banos, Philippines, April 8–11,pp. 333–345.
Ramos, E.P., 1986. Evaluation of soil parameters for irrigationplanning and design for upland crops. M.Sc. Thesis. CentralLuzon State University, Munoz, Nueva Ecija, Philippines.
Rijsberman, F.R., 2006. Water scarcity: fact or fiction? Agric.Water Manage. 80, 5–22.
Sattar, M.A., 1992. Water management and technology adoptionfor direct seeded rice in an irrigation system. Ph.D. Thesis.Central Luzon State University, Munoz, Nueva Ecija,Philippines.
Sharma, P.K., Bhushan Lav, Ladha, J.K., Naresh, R.K., Gupta,R.K., Balasubramanian, B.V., Bouman, B.A.M., 2002. Crop-water relations in rice-wheat cropping under differenttillage systems and water-management practices in amarginally sodic, medium-textured soil. In: Bouman,B.A.M., Hengsdijk, H., Hardy, B., Bindraban, P.S., Tuong,T.P., Ladha, J.K. (Eds.), Proceedings of the InternationalWorkshop on Water-wise Rice Production, InternationalRice Research Institute, Los Banos, Philippines, April 8–11,pp. 223–235.
Tabbal, D.F., Bouman, B.A.M., Bhuiyan, S.I., Sibayan, E.B., Sattar,M.A., 2002. On-farm strategies for reducing water input inirrigated rice: case studies in the Philippines. Agric. WaterManage. 56, 93–112.
Tuong, T.P., Bouman, B.A.M., Mortimer, M., 2005. More rice, lesswater—integrated approaches for increasing waterproductivity in irrigated rice-based systems in Asia. PlantProd. Sci. 8, 231–241.
Zwart, S.J., Bastiaanssen, W.G.M., 2004. Review of measuredcrop water productivity values for irrigated wheat, rice,cotton and maize. Agric. Water Manage. 69, 115–133.
water use and water productivity in a rice-based irrigation system
016/j.agwat.2007.05.006
Related Documents