Jurnal Kejuruteraan 28(2016): 65-72 Water Quality of Surface Runoff in Loop Two Catchment Area in UKM (Kualiti Air Larian Permukaan Kawasan Tadahan Lingkungan Kedua di UKM) Norshahkilla Izzatul Zaiedy, Othman A. Karim* & Nurul Afina Abd Mutalib ABSTRACT For a country that is developing, there is a need to control and maintain the quality of raw water, with adequate quantities to ensure continuous supply of clean water. In Malaysia, urban development activities especially constructions, is believed to be one of the activities that contributes to the deterioration of the quality of surface runoff. The main objectives of this project are to investigate water quality of surface water runoff at UKM’s loop two catchment areas and to observe the effect of slope failure, erosion, and construction activities on surface water quality in UKM Bangi campus. Besides that, the development of hydraulic models using HEC-RAS software is also the objective of this research. This research is conducted through field study and laboratory works. The main findings confirmed that water quality and total surface runoff in the catchment is directly affected by slope failure, erosion, and construction activities. Results from HEC-RAS modeling revealed that the drains surrounding the lake are not overflowing or flooding. Keywords: Surface runoff; water quality; HEC-RAS modelling; UKM catchment area ABSTRAK Bagi sesebuah negara yang membangun, terdapat keperluan untuk mengawal dan mengekalkan kualiti air mentah, dengan kuantiti yang mencukupi. Di Malaysia, pembangunan bandar terutamanya dalam sektor pembinaan merupakan salah satu aktiviti yang menyumbang kepada kemerosotan kualiti air larian permukaan. Kegagalan cerun dan aktiviti pembinaan yang tidak dikawal juga memberi kesan ke atas kualiti air permukaan. Objektif kajian ini adalah untuk mengkaji ciri-ciri air larian hujan dan kualiti air di kawasan Tasik UKM, dan untuk mengkaji kesan kegagalan cerun, hakisan dan aktiviti pembinaan kepada kualiti air di kampus UKM Bangi. Kajian ini juga melibatkan pembangunan model hidraulik di kawasan tadahan menggunakan perisian HEC-RAS. Kajian ini dijalankan secara lapangan dan kerja-kerja makmal. Hasil kajian terbukti bahawa kualiti air dan jumlah air larian permukaan di kawasan tadahan dipengaruhi oleh kegagalan cerun, hakisan dan aktiviti pembinaan. Hasil permodelan menunjukkan saliran di kawasan tasik tidak melimpah dan banjir. Kata Kunci: Air larian; kualiti air; HEC-RAS; kawasan tadahan UKM. INTRODUCTION The demand of water increases as the population growth and economic development increase. Therefore, there is a need to control and maintain the quantity and quality of raw water. The increasing urban development especially in property construction is assumed to be one of the major contributions to the poor water quality. Planning, developing and managing water resource systems to ensure adequate, inexpensive and sustainable supplies and quality of water for both humans and natural ecosystems can only be successful if such activities address the causal socio- economic factors (Loucks & Beek 2005). There are many developments around the catchment area in loop two since 2009 (Mukhlisin et al. 2010 and 2012) (refer to Figure 1). Slope failure and constructions definitely will have an effect on surface flow water quality. Construction without proper sediment erosion control structures can cause high sediment load movement and affect the water quality due to the runoff from construction site to the pond, lake, and rivers (Kamal Alsharif, 2010). In this study, the effect of water quality before and during the construction has been conducted at Universiti Kebangsaan Malaysia. Water quality is a complex subject and is reflected by different types of parameters that need to be measured. The most accurate measurements of water quality are the in- situ measurement. This is because water sample exists in equilibrium within its surroundings. The measurements that are commonly made in-situ and in-direct contact with the water source include pH, dissolved oxygen, and turbidity. The components that influence life forms are BOD, COD, TSS, and pH.

Welcome message from author
This document is posted to help you gain knowledge. Please leave a comment to let me know what you think about it! Share it to your friends and learn new things together.
Transcript
Jurnal Kejuruteraan 28(2016): 65-72
Water Quality of Surface Runoff in Loop Two Catchment Area in UKM
(Kualiti Air Larian Permukaan Kawasan Tadahan Lingkungan Kedua di UKM)
Norshahkilla Izzatul Zaiedy, Othman A. Karim* & Nurul Afina Abd Mutalib
ABSTRACT
For a country that is developing, there is a need to control and maintain the quality of raw water, with adequate quantities to ensure continuous supply of clean water. In Malaysia, urban development activities especially constructions, is believed to be one of the activities that contributes to the deterioration of the quality of surface runoff. The main objectives of this project are to investigate water quality of surface water runoff at UKM’s loop two catchment areas and to observe the effect of slope failure, erosion, and construction activities on surface water quality in UKM Bangi campus. Besides that, the development of hydraulic models using HEC-RAS software is also the objective of this research. This research is conducted through field study and laboratory works. The main findings confirmed that water quality and total surface runoff in the catchment is directly affected by slope failure, erosion, and construction activities. Results from HEC-RAS modeling revealed that the drains surrounding the lake are not overflowing or flooding.
Keywords: Surface runoff; water quality; HEC-RAS modelling; UKM catchment area
ABSTRAK
Bagi sesebuah negara yang membangun, terdapat keperluan untuk mengawal dan mengekalkan kualiti air mentah, dengan kuantiti yang mencukupi. Di Malaysia, pembangunan bandar terutamanya dalam sektor pembinaan merupakan salah satu aktiviti yang menyumbang kepada kemerosotan kualiti air larian permukaan. Kegagalan cerun dan aktiviti pembinaan yang tidak dikawal juga memberi kesan ke atas kualiti air permukaan. Objektif kajian ini adalah untuk mengkaji ciri-ciri air larian hujan dan kualiti air di kawasan Tasik UKM, dan untuk mengkaji kesan kegagalan cerun, hakisan dan aktiviti pembinaan kepada kualiti air di kampus UKM Bangi. Kajian ini juga melibatkan pembangunan model hidraulik di kawasan tadahan menggunakan perisian HEC-RAS. Kajian ini dijalankan secara lapangan dan kerja-kerja makmal. Hasil kajian terbukti bahawa kualiti air dan jumlah air larian permukaan di kawasan tadahan dipengaruhi oleh kegagalan cerun, hakisan dan aktiviti pembinaan. Hasil permodelan menunjukkan saliran di kawasan tasik tidak melimpah dan banjir.
Kata Kunci: Air larian; kualiti air; HEC-RAS; kawasan tadahan UKM.
INTRODUCTION
The demand of water increases as the population growth and economic development increase. Therefore, there is a need to control and maintain the quantity and quality of raw water. The increasing urban development especially in property construction is assumed to be one of the major contributions to the poor water quality. Planning, developing and managing water resource systems to ensure adequate, inexpensive and sustainable supplies and quality of water for both humans and natural ecosystems can only be successful if such activities address the causal socio-economic factors (Loucks & Beek 2005).
There are many developments around the catchment area in loop two since 2009 (Mukhlisin et al. 2010 and 2012) (refer to Figure 1). Slope failure and constructions definitely will have an effect on surface flow water quality.
Construction without proper sediment erosion control structures can cause high sediment load movement and affect the water quality due to the runoff from construction site to the pond, lake, and rivers (Kamal Alsharif, 2010). In this study, the effect of water quality before and during the construction has been conducted at Universiti Kebangsaan Malaysia.
Water quality is a complex subject and is reflected by different types of parameters that need to be measured. The most accurate measurements of water quality are the in-situ measurement. This is because water sample exists in equilibrium within its surroundings. The measurements that are commonly made in-situ and in-direct contact with the water source include pH, dissolved oxygen, and turbidity. The components that influence life forms are BOD, COD, TSS, and pH.

66
The weather can also affect the water quality in the river. Typically, pollution in water body will be high during rainfall. This is because when heavy downpours occurs it can increase the amount of runoff into rivers by washing out the sediment, nutrients, pollutants, trash, animal waste, and other materials into water supplies. Thus, making them unusable, unsafe, or needed of water treatment. These effects can reduce the quality of water. The direct correlation with the frequency and intensity of rainfall runoff with river discharge volume affects the load of pollutants affecting the water quality of the river (Approach, 2012).
FIGURE 1. Location of Loop two of UKM Bangi campus, Selangor Source: Google Maps
This present study will identify the condition of UKM Lake drainage (Figure 2) at 2 years Average Recurrence Interval (ARI). By obtaining the main data to be analyzed as well as the length and depth of the river basin area so that the flowrate, Q maximum will be obtained for analysis of hydraulic UKM Lake drainage system using computer software HEC-RAS version 4.1. This is aims to obtain a profile of the surface runoff water along the drainage.
water resource systems to ensure adequate, inexpensive and sustainable supplies and quality of water for both humans and natural ecosystems can only be successful if such activities address the causal socio-economic factors (Loucks & Beek 2005).
There are many developments around the catchment area in loop two since 2009 (Mukhlisin et al. 2010 and 2012) (refer to Figure 1). Slope failure and constructions definitely will have an effect on surface flow water quality. Construction without proper sediment erosion control structures can cause high sediment load movement and affect the water quality due to the runoff from construction site to the pond, lake, and rivers (Kamal Alsharif, 2010). In this study, the effect of water quality before and during the construction has been conducted at Universiti Kebangsaan Malaysia.
Water quality is a complex subject and is reflected by different types of parameters that need to be measured. The most accurate measurements of water quality are the in-situ measurement. This is because water sample exists in equilibrium within its surroundings. The measurements that are commonly made in-situ and in-direct contact with the water source include pH, dissolved oxygen, and turbidity. The components that influence life forms are BOD, COD, TSS, and pH.
The weather can also affect the water quality in the river. Typically, pollution in water body will be high during rainfall. This is because when heavy downpours occurs it can increase the amount of runoff into rivers by washing out the sediment, nutrients, pollutants, trash, animal waste, and other materials into water supplies. Thus, making them unusable, unsafe, or needed of water treatment. These effects can reduce the quality of water. The direct correlation with the frequency and intensity of rainfall runoff with river discharge volume affects the load of pollutants affecting the water quality of the river (Approach, 2012).
This present study will identify the condition of UKM Lake drainage (Figure 2) at 2 years Average Recurrence Interval (ARI). By obtaining the main data to be analyzed as well as the length and depth of the river basin area so that the flowrate, Q maximum will be obtained for analysis of hydraulic UKM Lake drainage system using computer software HEC-RAS version 4.1. This is aims to obtain a profile of the surface runoff water along the drainage.
FIGURE 1. Location of Loop two of UKM Bangi campus, Selangor
Source: Google Maps
Area of Loop two in UKM, Bangi
Fakulti Undang-Undang
Bangunan Akedemik Fakulti Kejuruteraan &
Alam Bina Bangunan Pentadbiran Fakulti Kejuruteraan & Alam Bina
METHODOLOGY
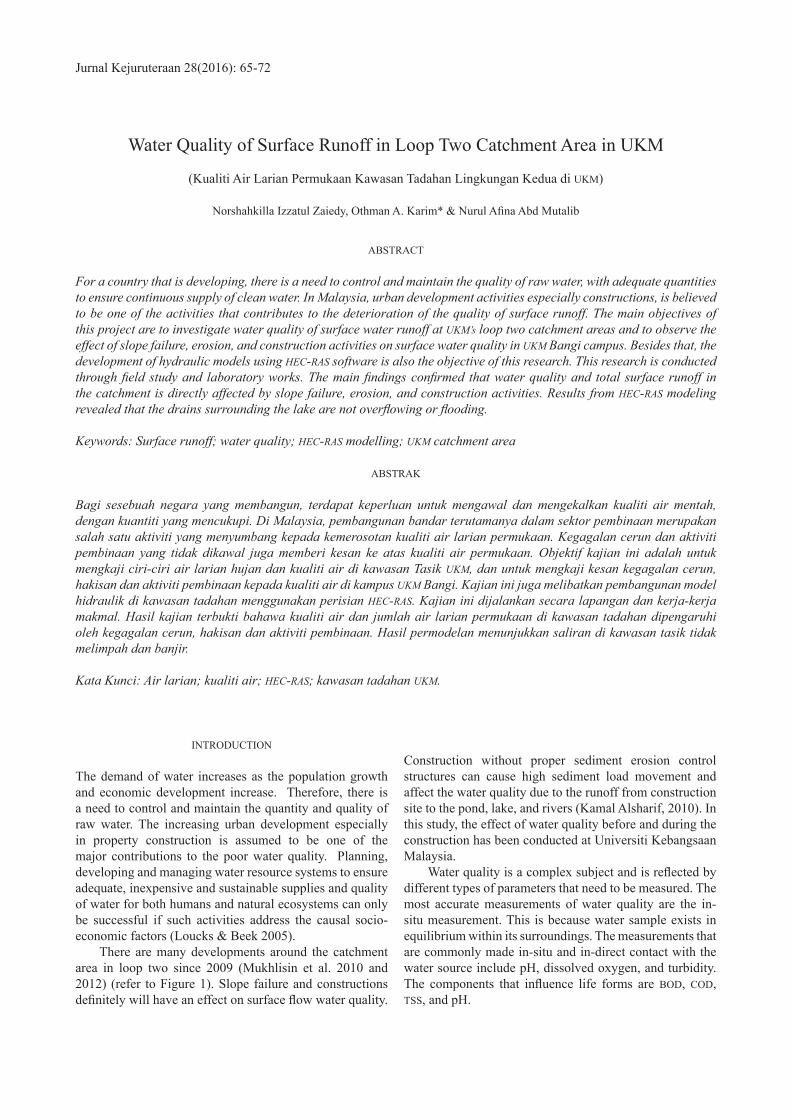
The process of collecting data to determine the level of water quality in the catchment area is done by taking water samples in six different locations which are in STP Za’aba, Cells Fuel, Engineering Lab, Geotechnical Lab, Cafeteria and downstream of the UKM Lake (refer to Figure 2).
To obtain accurate test results, any planning must be done carefully starting from the sampling process until the process of experimenting in laboratory. Water samples taken in the vicinity of UKM Lake where there are six areas that have been set. The areas are at STP Za’aba, drains behind Cells Fuel Centre, drains near the cafeteria of the Faculty of Engineering, at the back of the Geotechnical Laboratory and Coastal Engineering Laboratory and at the downstream of UKM Lake.
Water sampling was conducted in April, May and June 2015 after the rainfall events and July 2015 for the normal day (no rain). The samples used in the experiment were taken immediately after the rain had stopped. All water samples taken will be analyzed by focusing on five key parameters which are BOD (Biological Oxygen Demand),
COD (Chemical Oxygen Demand), TSS (Total Suspended Solid) and pH. The process for determining the value of these parameters is done in the laboratory.
Surface runoffs are calculated using Manning equation which involves rainfall data, depth of water data, and geometry of the drain. The rainfall data are obtained via rainfall data logger while depth of water in the catchment are calculated using water level data, which can be collected through water level logger installed at the selected point.
Sieve analysis was performed to determine the size and type of soils in the lake. One point of sample collected was oven dried and weighed (refer to Figure 2). The samples were dried at 105ºC for 24 hours. Next, the samples then were sieved using 4.75, 2.36, 1.18, 0.6, 0.3, 0.15 and 0.075 mm size to measure the particle distribution. The sieve analysis was done for 10 minutes for each sample. The retained sediment in each sieve was measured accordingly.
The hydraulic model is based on HEC’s River Analysis System (HEC-RAS), version 4.1. HEC-RAS is computer software that is one-dimensional. This software runs a hydraulic modeling of water flow through natural rivers
67
FIGURE 2. Location of water and soil sampling
FIGURE 2. Location of water and soil sampling
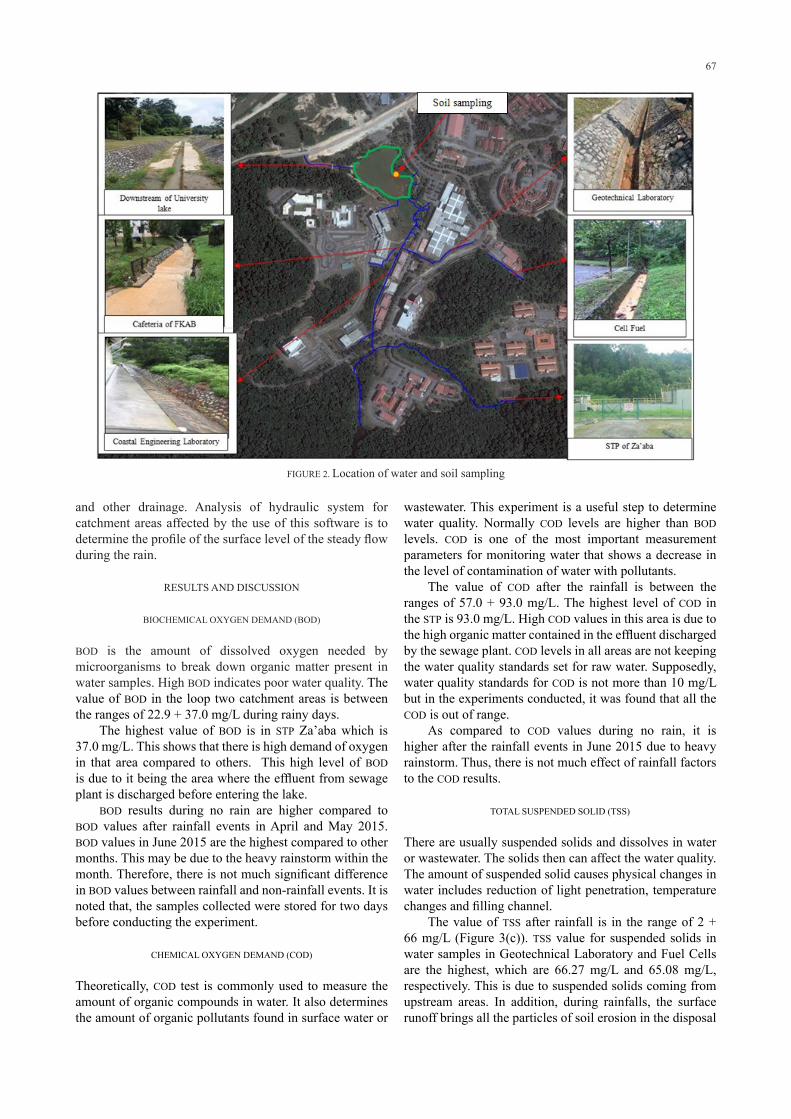
RESULTS AND DISCUSSION
BIOCHEMICAL OXYGEN DEMAND (BOD)
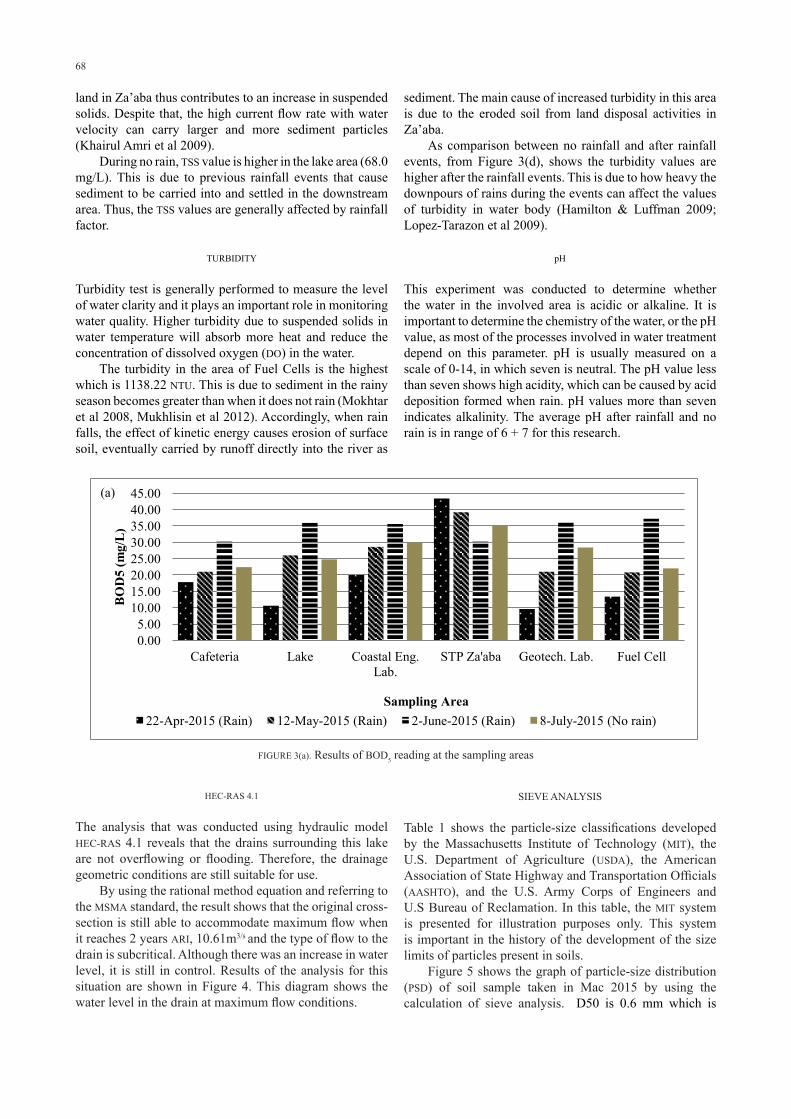
BOD is the amount of dissolved oxygen needed by microorganisms to break down organic matter present in water samples. High BOD indicates poor water quality. The value of BOD in the loop two catchment areas is between the ranges of 22.9 + 37.0 mg/L during rainy days.
The highest value of BOD is in STP Za’aba which is 37.0 mg/L. This shows that there is high demand of oxygen in that area compared to others. This high level of BOD is due to it being the area where the effluent from sewage plant is discharged before entering the lake.
BOD results during no rain are higher compared to BOD values after rainfall events in April and May 2015. BOD values in June 2015 are the highest compared to other months. This may be due to the heavy rainstorm within the month. Therefore, there is not much significant difference in BOD values between rainfall and non-rainfall events. It is noted that, the samples collected were stored for two days before conducting the experiment.
CHEMICAL OXYGEN DEMAND (COD)
Theoretically, COD test is commonly used to measure the amount of organic compounds in water. It also determines the amount of organic pollutants found in surface water or wastewater. This experiment is a useful step to determine water quality. Normally COD levels are higher than BOD levels. COD is one of the most important measurement parameters for monitoring water that shows a decrease in the level of contamination of water with pollutants.
The value of COD after the rainfall is between the ranges of 57.0 + 93.0 mg/L. The highest level of COD in the STP is 93.0 mg/L. High COD values in this area is due to the high organic matter contained in the effluent discharged by the sewage plant. COD levels in
and other drainage. Analysis of hydraulic system for catchment areas affected by the use of this software is to determine the profile of the surface level of the steady flow during the rain.
RESULTS AND DISCUSSION
BIOCHEMICAL OXYGEN DEMAND (BOD)
BOD is the amount of dissolved oxygen needed by microorganisms to break down organic matter present in water samples. High BOD indicates poor water quality. The value of BOD in the loop two catchment areas is between the ranges of 22.9 + 37.0 mg/L during rainy days.
The highest value of BOD is in STP Za’aba which is 37.0 mg/L. This shows that there is high demand of oxygen in that area compared to others. This high level of BOD is due to it being the area where the effluent from sewage plant is discharged before entering the lake.
BOD results during no rain are higher compared to BOD values after rainfall events in April and May 2015. BOD values in June 2015 are the highest compared to other months. This may be due to the heavy rainstorm within the month. Therefore, there is not much significant difference in BOD values between rainfall and non-rainfall events. It is noted that, the samples collected were stored for two days before conducting the experiment.
CHEMICAL OXYGEN DEMAND (COD)
Theoretically, COD test is commonly used to measure the amount of organic compounds in water. It also determines the amount of organic pollutants found in surface water or
wastewater. This experiment is a useful step to determine water quality. Normally COD levels are higher than BOD levels. COD is one of the most important measurement parameters for monitoring water that shows a decrease in the level of contamination of water with pollutants.
The value of COD after the rainfall is between the ranges of 57.0 + 93.0 mg/L. The highest level of COD in the STP is 93.0 mg/L. High COD values in this area is due to the high organic matter contained in the effluent discharged by the sewage plant. COD levels in all areas are not keeping the water quality standards set for raw water. Supposedly, water quality standards for COD is not more than 10 mg/L but in the experiments conducted, it was found that all the COD is out of range.
As compared to COD values during no rain, it is higher after the rainfall events in June 2015 due to heavy rainstorm. Thus, there is not much effect of rainfall factors to the COD results.
TOTAL SUSPENDED SOLID (TSS)
There are usually suspended solids and dissolves in water or wastewater. The solids then can affect the water quality. The amount of suspended solid causes physical changes in water includes reduction of light penetration, temperature changes and filling channel.
The value of TSS after rainfall is in the range of 2 + 66 mg/L (Figure 3(c)). TSS value for suspended solids in water samples in Geotechnical Laboratory and Fuel Cells are the highest, which are 66.27 mg/L and 65.08 mg/L, respectively. This is due to suspended solids coming from upstream areas. In addition, during rainfalls, the surface runoff brings all the particles of soil erosion in the disposal
68
land in Za’aba thus contributes to an increase in suspended solids. Despite that, the high current flow rate with water velocity can carry larger and more sediment particles (Khairul Amri et al 2009).
During no rain, TSS value is higher in the lake area (68.0 mg/L). This is due to previous rainfall events that cause sediment to be carried into and settled in the downstream area. Thus, the TSS values are generally affected by rainfall factor.
TURBIDITY
Turbidity test is generally performed to measure the level of water clarity and it plays an important role in monitoring water quality. Higher turbidity due to suspended solids in water temperature will absorb more heat and reduce the concentration of dissolved oxygen (DO) in the water.
The turbidity in the area of Fuel Cells is the highest which is 1138.22 NTU. This is due to sediment in the rainy season becomes greater than when it does not rain (Mokhtar et al 2008, Mukhlisin et al 2012). Accordingly, when rain falls, the effect of kinetic energy causes erosion of surface soil, eventually carried by runoff directly into the river as
sediment. The main cause of increased turbidity in this area is due to the eroded soil from land disposal activities in Za’aba.
As comparison between no rainfall and after rainfall events, from Figure 3(d), shows the turbidity values are higher after the rainfall events. This is due to how heavy the downpours of rains during the events can affect the values of turbidity in water body (Hamilton & Luffman 2009; Lopez-Tarazon et al 2009).
pH
This experiment was conducted to determine whether the water in the involved area is acidic or alkaline. It is important to determine the chemistry of the water, or the pH value, as most of the processes involved in water treatment depend on this parameter. pH is usually measured on a scale of 0-14, in which seven is neutral. The pH value less than seven shows high acidity, which can be caused by acid deposition formed when rain. pH values more than seven indicates alkalinity. The average pH after rainfall and no rain is in range of 6 + 7 for this research.
FIGURE 3(a). Results of BOD5 reading at the sampling areas
FIGURE 3(b). Results of COD reading at the sampling areas
FIGURE 3(c). Results of TSS reading at the sampling areas
0.00 5.00
10.00 15.00 20.00 25.00 30.00 35.00 40.00 45.00
Cafeteria Lake Coastal Eng. Lab.
STP Za'aba Geotech. Lab. Fuel Cell
BO
D5
(mg/
L)
Sampling Area 22-Apr-2015 (Rain) 12-May-2015 (Rain) 2-June-2015 (Rain) 8-July-2015 (No rain)
0.0 20.0 40.0 60.0 80.0
100.0 120.0
Cafeteria Lake Coastal Eng. Lab.
STP Za'aba Geotech. Lab. Fuel Cell
CO
D (m
g/L)
Sampling Area
22-Apr-2015 (Rain) 12-May-2015 (Rain) 2-June-2015 (Rain) 8-July-2015 (No rain)
0.00 20.00 40.00 60.00 80.00
100.00 120.00 140.00 160.00 180.00 200.00
Cafeteria Lake Coastal Eng. Lab.
STP Za'aba Geotech. Lab. Fuel Cell
TSS
(mg/
L)
Sampling Area
22-Apr-2015 (Rain) 12-May-2015 (Rain) 2-June-2015 (Rain) 8-July-2015 (No rain)
(a)
(c)
(b)
FIGURE 3(a). Results of BOD5 reading at the sampling areas
HEC-RAS 4.1
The analysis that was conducted using hydraulic model HEC-RAS 4.1 reveals that the drains surrounding this lake are not overflowing or flooding. Therefore, the drainage geometric conditions are still suitable for use.
By using the rational method equation and referring to the MSMA standard, the result shows that the original cross-section is still able to accommodate maximum flow when it reaches 2 years ARI, 10.61m3/s and the type of flow to the drain is subcritical. Although there was an increase in water level, it is still in control. Results of the analysis for this situation are shown in Figure 4. This diagram shows the water level in the drain at maximum flow conditions.
SIEVE ANALYSIS
Table 1 shows the particle-size classifications developed by the Massachusetts Institute of Technology (MIT), the U.S. Department of Agriculture (USDA), the American Association of State Highway and Transportation Officials (AASHTO), and the U.S. Army Corps of Engineers and U.S Bureau of Reclamation. In this table, the MIT system is presented for illustration purposes only. This system is important in the history of the development of the size limits of particles present in soils.
Figure 5 shows the graph of particle-size distribution (PSD) of soil sample taken in Mac 2015 by using the calculation of sieve analysis. D50 is 0.6 mm which is

69
FIGURE 3(a). Results of BOD5 reading at the sampling areas
FIGURE 3(b). Results of COD reading at the sampling areas
FIGURE 3(c). Results of TSS reading at the sampling areas
0.00 5.00
10.00 15.00 20.00 25.00 30.00 35.00 40.00 45.00
Cafeteria Lake Coastal Eng. Lab.
STP Za'aba Geotech. Lab. Fuel Cell
BO
D5
(mg/
L)
Sampling Area 22-Apr-2015 (Rain) 12-May-2015 (Rain) 2-June-2015 (Rain) 8-July-2015 (No rain)
0.0 20.0 40.0 60.0 80.0
100.0 120.0
Cafeteria Lake Coastal Eng. Lab.
STP Za'aba Geotech. Lab. Fuel Cell
CO
D (m
g/L)
Sampling Area
22-Apr-2015 (Rain) 12-May-2015 (Rain) 2-June-2015 (Rain) 8-July-2015 (No rain)
0.00 20.00 40.00 60.00 80.00
100.00 120.00 140.00 160.00 180.00 200.00
Cafeteria Lake Coastal Eng. Lab.
STP Za'aba Geotech. Lab. Fuel Cell
TSS
(mg/
L)
Sampling Area
22-Apr-2015 (Rain) 12-May-2015 (Rain) 2-June-2015 (Rain) 8-July-2015 (No rain)
(a)
(c)
(b)
FIGURE 3(b). Results of COD reading at the sampling areas
FIGURE 3(a). Results of BOD5 reading at the sampling areas
FIGURE 3(b). Results of COD reading at the sampling areas
FIGURE 3(c). Results of TSS reading at the sampling areas
0.00 5.00
10.00 15.00 20.00 25.00 30.00 35.00 40.00 45.00
Cafeteria Lake Coastal Eng. Lab.
STP Za'aba Geotech. Lab. Fuel Cell
BO
D5
(mg/
L)
Sampling Area 22-Apr-2015 (Rain) 12-May-2015 (Rain) 2-June-2015 (Rain) 8-July-2015 (No rain)
0.0 20.0 40.0 60.0 80.0
100.0 120.0
Cafeteria Lake Coastal Eng. Lab.
STP Za'aba Geotech. Lab. Fuel Cell
CO
D (m
g/L)
Sampling Area
22-Apr-2015 (Rain) 12-May-2015 (Rain) 2-June-2015 (Rain) 8-July-2015 (No rain)
0.00 20.00 40.00 60.00 80.00
100.00 120.00 140.00 160.00 180.00 200.00
Cafeteria Lake Coastal Eng. Lab.
STP Za'aba Geotech. Lab. Fuel Cell
TSS
(mg/
L)
Sampling Area
22-Apr-2015 (Rain) 12-May-2015 (Rain) 2-June-2015 (Rain) 8-July-2015 (No rain)
(a)
(c)
(b)
FIGURE 3(c). Results of TSS reading at the sampling areas
FIGURE 3(d). Results of turbidity reading at the sampling areas
FIGURE 3(d). Results of turbidity reading at the sampling areas
FIGURE 3(e). Results of pH reading at the sampling areas
HEC-RAS 4.1
The analysis that was conducted using hydraulic model HEC-RAS 4.1 reveals that the drains surrounding this lake are not overflowing or flooding. Therefore, the drainage geometric conditions are still suitable for use.
By using the rational method equation and referring to the MSMA standard, the result shows that the original cross-section is still able to accommodate maximum flow when it reaches 2 years ARI, 10.61m3/s and the type of flow to the drain is subcritical. Although there was an increase in water level, it is still in control. Results of the analysis for this situation are shown in Figure 4. This diagram shows the water level in the drain at maximum flow conditions.
0.00 500.00
1000.00 1500.00 2000.00 2500.00 3000.00 3500.00
Cafeteria Lake Coastal Eng. Lab.
STP Za'aba Geotech. Lab. Fuel Cell
Turb
idity
(NTU
)
Sampling Area 22-Apr-2015 (Rain) 12-May-2015 (Rain) 2-June-2015 (Rain) 8-July-2015 (No rain)
0.00 1.00 2.00 3.00 4.00 5.00 6.00 7.00 8.00
Cafeteria Lake Coastal Eng. Lab.
STP Za'aba Geotech. Lab. Fuel Cell
pH
Sampling Area 22-Apr-2015 (Rain) 12-May-2015 (Rain) 2-June-2015 (Rain) 8-July-2015 (No rain)
(d)
(e)

70
FIGURE 3(e). Results of pH reading at the sampling areas
FIGURE 3(d). Results of turbidity reading at the sampling areas
FIGURE 3(e). Results of pH reading at the sampling areas
HEC-RAS 4.1
The analysis that was conducted using hydraulic model HEC-RAS 4.1 reveals that the drains surrounding this lake are not overflowing or flooding. Therefore, the drainage geometric conditions are still suitable for use.
By using the rational method equation and referring to the MSMA standard, the result shows that the original cross-section is still able to accommodate maximum flow when it reaches 2 years ARI, 10.61m3/s and the type of flow to the drain is subcritical. Although there was an increase in water level, it is still in control. Results of the analysis for this situation are shown in Figure 4. This diagram shows the water level in the drain at maximum flow conditions.
0.00 500.00
1000.00 1500.00 2000.00 2500.00 3000.00 3500.00
Cafeteria Lake Coastal Eng. Lab.
STP Za'aba Geotech. Lab. Fuel Cell
Turb
idity
(NTU
)
Sampling Area 22-Apr-2015 (Rain) 12-May-2015 (Rain) 2-June-2015 (Rain) 8-July-2015 (No rain)
0.00 1.00 2.00 3.00 4.00 5.00 6.00 7.00 8.00
Cafeteria Lake Coastal Eng. Lab.
STP Za'aba Geotech. Lab. Fuel Cell
pH
Sampling Area 22-Apr-2015 (Rain) 12-May-2015 (Rain) 2-June-2015 (Rain) 8-July-2015 (No rain)
(d)
(e)
FIGURE 4. Water level in the drain at maximum flow conditions
Grain size (mm)Name of organization Gravel Sand Silt ClayMassachusetts Institute of Technology (MIT) >2 2 to 0.06 0.06 to 0.002 <0.002
U.S. Department of Agriculture (USDA) >2 2 to 0.05 0.05 to 0.002 <0.002
American Association of State Highway and Transportation Officials (AASHTO) 76.2 to 2 2 to 0.075 0.075 to 0.002 <0.002
Unified Soil Classification System (U.S. Army Corps of Engineers, U.S.
Bureau of Reclamation, and American Soci-ety for Testing and Materials)
76.2 to 4.75 4.75 to 0.075Fines(i.e., silts and clays)<0.075
TABLE 1. Particle-Size Classifications
Source: Principles of Geotechnical Engineering (2010)

71
the value of the particle diameter at 50% passing in the cumulative distribution. Based on Table 1, the type of soil in lake is sand. The presence of soil in the lake reflects that the erosion and removal of soil has been going on for quite awhile.
CONCLUSION
Water quality condition in the catchment area is considered slightly polluted. The situation becomes worsen during rainy season. The source of contamination originates from various directions near the entrance of the lake. Therefore, measures to control pollution and rehabilitation should be implemented at this location, which include soil stabilization and erosion control practice as well as telemetry system. These measures help to reduce soil erosion, sedimentation and potential attached pollutants which consequently will improve the water quality. Therefore, the findings indicate that the effects of the removal of soil, slope failure and development projects upstream of the drainage contribute to the quality of water in UKM Lake.
ACKNOWLEDGMENTS
The researchers and authors would like to thank all the individuals, Departments of Civil and Structural Engineering UKM and UKM via Grant Arus Perdana AP-2014-008 for their cooperation and information in the success of these studies.
REFERENCE
Approach, C. E. M. C. 2012. Kepekatan Beban Bahan Pencemar Di Alur Ilmu Kampus UKM Bangi: Kaedah Min Kepekatan Peristiwa (Emc) (Loading Concentrations Of Pollutant In Alur Ilmu At UKM Bangi Campus: Event Mean. Analytical Sciences 16(3): 353–365.
Braja M.Das. 2010. Principles of Geotechnical Engineering. 7th edition. SI Edition.
Hamilton, J. L. & Luffman, I. 2009. Precipitation, pathogens, and turbidity trends in the Little River, Tennessee. Physical Geography 30(3): 236–248.
Kamal Alsharif. 2010. Construction and stormwater pollution: Policy, violations, and penalties. Journal of Land Use Policy 27: 612-616.
Loucks D.P., & van Beek E. 2005. Water resources Systems Planning and Management: An Introduaction to Methods, Models and Applications. UNESCO and WL Delft Hydraulics. 1- 676.
Lopez-Tarazon, J. A., Batalla, R. J., Vericat, D., & Francke, T. 2009. Suspended sediment transport in a highly erodible catchment: The River Isabena (Southern Pyrenees). Geomorphology 109 (3-4): 210–221.
Mokhtar, M. Bin & Karim, O. A. 2008. Penentuan kualiti air Tasik Kejuruteraan UKM Kampus Bangi : Ke arah sistem pengurusan sumber air bersepadu 12(1): 123–131.
Mohd Khairul Amri Kamarudin, Mohd Ekhwan Toriman, Sharifah Mastura, S.A., Mushrifah Hj. Idris, Nor Rohaizah Jamil & Muhammad Barzani Gasim. 2009. Temporal variability on lowland river sediment properties and yield. American Journal of Environmental Sciences 5 (5): 657-663.
particle diameter at 50% passing in the cumulative distribution. Based on Table 1, the type of soil in lake is sand. The presence of soil in the lake reflects that the erosion and removal of soil has been going on for quite awhile.
FIGURE 6. Grain size analysis of soil sample
CONCLUSION
Water quality condition in the catchment area is considered slightly polluted. The situation becomes worsen during rainy season. The source of contamination originates from various directions near the entrance of the lake. Therefore, measures to control pollution and rehabilitation should be implemented at this location, which include soil stabilization and erosion control practice as well as telemetry system. These measures help to reduce soil erosion, sedimentation and potential attached pollutants which consequently will improve the water quality. Therefore, the findings indicate that the effects of the removal of soil, slope failure and development projects upstream of the drainage contribute to the quality of water in UKM Lake.
ACKNOWLEDGMENTS
The researchers and authors would like to thank all the individuals, Departments of Civil and Structural Engineering UKM and UKM via Grant Arus Perdana AP-2014-008 for their cooperation and information in the success of these studies.
REFERENCE
Approach, C. E. M. C. 2012. Kepekatan Beban bahan pencemar di alur ilmu kampus ukm bangi: kaedah min kepekatan peristiwa (EMC) (Loading Concentrations of Pollutant in Alur Ilmu at Ukm Bangi Campus: Event Mean. Analytical Sciences 16(3): 353–365.
Hamilton, J. L. & Luffman, I. 2009. Precipitation, pathogens, and turbidity trends in the Little River, Tennessee. Physical Geography 30(3): 236–248.
Kamal Alsharif. 2010. Construction and stormwater pollution: Policy, violations, and penalties. Journal of Land Use Policy 27: 612-616.
0 10 20 30 40 50 60 70 80 90
100
0.01 0.1 1 10
Prec
ent P
assin
g
Grain Sieve (mm)
Soil Analysis
Soil Analysis
FIGURE 5. Grain size analysis of soil sample

72
Muhammad Mukhlisin, Aniza Ibrahim, Othman Jaafar & Siti Fatin Mohd Razali. 2012. Electrochemical assessment of water quality as an effect of construction. International Journal of Electrochemical Science 7(6): 5467-5483.
Muhammad Mukhlisin, Farah Wahida, Othman Jaafar & Mohd. Raihan Taha. 2010. Effect of construction activities on surfaceflow water quality of Bangi Forest Reserve. Wahana teknik sipi: Jurnal Pengembangan Teknik Sipi 15(1): 1-12.
Norshahkilla Izzatul ZaiedyOthman A. Karim* Nurul Afina Abd MutalibDepartment of Civil & Structural EngineeringUniversiti Kebangsaan Malaysia43600 UKM Bangi, Malaysia
*Corresponding author; email: [email protected]
Received Date: 7th March 2016Accepted Date: 27th May 2016
Related Documents