Author's personal copy Runoff and water erosion modelling using WEPP on a Mediterranean cultivated catchment Damien Raclot * , Jean Albergel IRD, Laboratoire d’e ´tude des Interactions Sol-Agrosyste `me-Hydrosyste `me, UMR LISAH, Agro.M-INRA-IRD, 2 place Viala, 34060 Montpellier Cedex 1, France Received 30 July 2005; accepted 6 July 2006 Available online 28 September 2006 Abstract Soil erosion due to water is a major environmental problem in many parts of the world. Most of Mediterranean countries are con- cerned because of their specific climate and soils sensitivity, but also because of the recent intensification of human activities and agri- cultural practices. Accurate estimation of soil water erosion for various land-use and climate scenarios is so an important key to define sustainable management policies. In the last decades, several studies have been carried out to build models suitable for quantifying soil erosion. Among these models, the Water Erosion Prediction Project (WEPP, Flanagan, D.C., Nearing, M.A., 1995. USDA-Water Ero- sion Prediction Project: Hillslope profile and watershed model documentation. NSERL Report 10, USDA-ARS National Soil Erosion Research Laboratory, West Lafayette, IN, USA.) is a physically based, distributed-parameter model that has been developed and mainly validated in USA. Only few studies have investigated its applicability to environmental conditions that differs from those where the model was developed. The aim of this work is to test the efficiency of WEPP model to predict soil erosion at catchment scale in a Med- iterranean semi-arid area. Continuous simulations have been conducted between 1995 and 2002 on an cultivated experimental catchment located upstream from a hill reservoir (Kamech catchment, 2.45 km 2 , Cap Bon, Tunisia) where runoff and soil erosion measurements are available at the outlet. Comparison between predictions and measurements shows significant differences. Processes related to seasonal effects (as cracking soils) are pointed out as a weakness of WEPP model for Mediterranean conditions. Ó 2006 Elsevier Ltd. All rights reserved. Keywords: Water erosion prediction project; Soil erosion; Runoff; Hill reservoir; Mediterranean catchment; Tunisia 1. Introduction Accurate estimation of soil erosion due to water is very important for the assessment of potential soil loss from cul- tivated lands and the evaluation of the loss of water storage capacity in reservoirs due to sediment deposition (Amore et al., 2004). Due to its modest data demands and transparent model structure, the Universal Soil Loss Equation (USLE) remains nowadays the most popular and widely used model for prediction of water erosion hazard and planning of soil conservation measures (Sonneveld and Nearing, 2003). This lumped empirical erosion model was adopted in 1958 by the Soil Conservation Service in USA. After, it was first updated in 1978 using numerous experiment data sets collected in the USA (Wischmeier and Smith, 1978) and then derived in multiples models such as the Revised Universal Soil Loss Equation-RUSLE (Renard et al., 1998) or the Modified Universal Soil Loss Equa- tion-MUSLE (Williams, 1975) in order to improve the pre- dictive capability of the USLE. Nevertheless all these models are based on empirical coefficients which must to be accurately evaluated from field observations for each specific situation (crop type, protection, climate, ...). In recent decades, several studies have been carried out to build physically based models. One of them is the Water Erosion Prediction Project (WEPP, Nearing et al., 1989; 1474-7065/$ - see front matter Ó 2006 Elsevier Ltd. All rights reserved. doi:10.1016/j.pce.2006.07.002 * Corresponding author. Tel.: +33 4 99 61 22 51; fax: +33 4 67 63 26 14. E-mail address: [email protected] (D. Raclot). www.elsevier.com/locate/pce Physics and Chemistry of the Earth 31 (2006) 1038–1047

Welcome message from author
This document is posted to help you gain knowledge. Please leave a comment to let me know what you think about it! Share it to your friends and learn new things together.
Transcript

Autho
r's
pers
onal
co
py
Runoff and water erosion modelling using WEPPon a Mediterranean cultivated catchment
Damien Raclot *, Jean Albergel
IRD, Laboratoire d’etude des Interactions Sol-Agrosysteme-Hydrosysteme, UMR LISAH, Agro.M-INRA-IRD, 2 place Viala,
34060 Montpellier Cedex 1, France
Received 30 July 2005; accepted 6 July 2006Available online 28 September 2006
Abstract
Soil erosion due to water is a major environmental problem in many parts of the world. Most of Mediterranean countries are con-cerned because of their specific climate and soils sensitivity, but also because of the recent intensification of human activities and agri-cultural practices. Accurate estimation of soil water erosion for various land-use and climate scenarios is so an important key to definesustainable management policies. In the last decades, several studies have been carried out to build models suitable for quantifying soilerosion. Among these models, the Water Erosion Prediction Project (WEPP, Flanagan, D.C., Nearing, M.A., 1995. USDA-Water Ero-sion Prediction Project: Hillslope profile and watershed model documentation. NSERL Report 10, USDA-ARS National Soil ErosionResearch Laboratory, West Lafayette, IN, USA.) is a physically based, distributed-parameter model that has been developed and mainlyvalidated in USA. Only few studies have investigated its applicability to environmental conditions that differs from those where themodel was developed. The aim of this work is to test the efficiency of WEPP model to predict soil erosion at catchment scale in a Med-iterranean semi-arid area. Continuous simulations have been conducted between 1995 and 2002 on an cultivated experimental catchmentlocated upstream from a hill reservoir (Kamech catchment, 2.45 km2, Cap Bon, Tunisia) where runoff and soil erosion measurements areavailable at the outlet. Comparison between predictions and measurements shows significant differences. Processes related to seasonaleffects (as cracking soils) are pointed out as a weakness of WEPP model for Mediterranean conditions.� 2006 Elsevier Ltd. All rights reserved.
Keywords: Water erosion prediction project; Soil erosion; Runoff; Hill reservoir; Mediterranean catchment; Tunisia
1. Introduction
Accurate estimation of soil erosion due to water is veryimportant for the assessment of potential soil loss from cul-tivated lands and the evaluation of the loss of water storagecapacity in reservoirs due to sediment deposition (Amoreet al., 2004).
Due to its modest data demands and transparent modelstructure, the Universal Soil Loss Equation (USLE)remains nowadays the most popular and widely usedmodel for prediction of water erosion hazard and planningof soil conservation measures (Sonneveld and Nearing,
2003). This lumped empirical erosion model was adoptedin 1958 by the Soil Conservation Service in USA. After,it was first updated in 1978 using numerous experimentdata sets collected in the USA (Wischmeier and Smith,1978) and then derived in multiples models such as theRevised Universal Soil Loss Equation-RUSLE (Renardet al., 1998) or the Modified Universal Soil Loss Equa-tion-MUSLE (Williams, 1975) in order to improve the pre-dictive capability of the USLE. Nevertheless all thesemodels are based on empirical coefficients which must tobe accurately evaluated from field observations for eachspecific situation (crop type, protection, climate, . . .).
In recent decades, several studies have been carried outto build physically based models. One of them is the WaterErosion Prediction Project (WEPP, Nearing et al., 1989;
1474-7065/$ - see front matter � 2006 Elsevier Ltd. All rights reserved.
doi:10.1016/j.pce.2006.07.002
* Corresponding author. Tel.: +33 4 99 61 22 51; fax: +33 4 67 63 26 14.E-mail address: [email protected] (D. Raclot).
www.elsevier.com/locate/pce
Physics and Chemistry of the Earth 31 (2006) 1038–1047
Autho
r's
pers
onal
co
py
Nicks et al., 1995), a physically based distributed-parame-ter model developed by the USDA. Intended to representthe essential mechanisms controlling water erosion and toestimate spatial an temporal distribution of soil loss, it issupposed to have a wide range of applicability (Nickset al., 1995) and so to be able to reduce the need for exten-sive field experiments and calibrations (Bacchi et al., 2003).It is presented as being conceptually a significant enhance-ment over the USLE (Ascough et al., 1997). If the WEPPmodel was well validated in USA in environmental condi-tions for which it was developed, both at plot scale (e.g.Zhang et al., 1996) and catchment scale (e.g. Liu et al.,1997), further investigations in various conditions are stillrequired.
This study focuses on a semi-arid Mediterranean culti-vated catchment located upstream from a hill reservoir.Indeed, Middle East and North African countries havebuilt numerous hill reservoirs since 1980 for the followingobjectives (Albergel et al., 2004): (i) protection of down-stream infrastructures against floods and erosion; (ii) assur-ing availability of water for domestic needs, wateringcattle, micro-irrigation and water harvesting; (iii) develop-ment of new economic activities as breeding, fishing ortourism. The sustainability of such hill reservoirs aregreatly threatened by sediment deposition which canreduce seriously their storage capacity. To maintain popu-lations in place and ensure for them real possibilities ofdevelopment, it is so very important to reduce the problemin optimising water and erosion management policies bydistributed actions at local scale. That’s why a distributedmodel is needed.
Moreover, one of the main specificity of semi-arid Med-iterranean area is the highly episodic nature of sedimentsupply and transport. Indeed, only a few number of eventscan be responsible for the majority of the soil erosion. Forexample, Albergel et al. (2004) showed that three floodswere responsible for 50% of the sedimentation thatoccurred in the Kamech dam (Tunisia) between the years1994 and 2002.
Process-based models are of important interest in such acontext because of their capacity of simulating each indi-vidual erosive event. A major difficulty to test and validatethese models is the availability of observed data. If severaldata sets exist at plot scale (Edeso et al., 1999; Gomezet al., 2004; Kosmas et al., 1997; Romero-Diaz et al.,1999; Soto and Diaz-Fierros, 1998), measurements atcatchment scale are not numerous. As a result, tests ofWepp model at catchment scale in semi-arid Mediterra-nean have only been conducted on cumulative soil deposi-tion over a long time period. For example, Amore et al.(2004) obtained reasonable sediment yield estimations withWEPP on three large areas Sicilian basins (more than100 km2) over an integrated period of 9, 22 or 25 years.
The objective of this study is to evaluate the WEPPmodel predictions capabilities on small agriculturalwatershed in such a semi-arid Mediterranean context. Wecompare measured and predicted runoff and sediment yield
both on a integrated period (total amounts of runoff andsediment yield over a 7 years period); a medium period(amounts of runoff and sediment yield at around annualtime period) and a daily period (daily runoff volume andpeak discharge). For that, a large data set acquired between1995 and 2002 on a 245 ha Tunisian catchment calledKamech is used.
2. Materials and methods
2.1. The study area
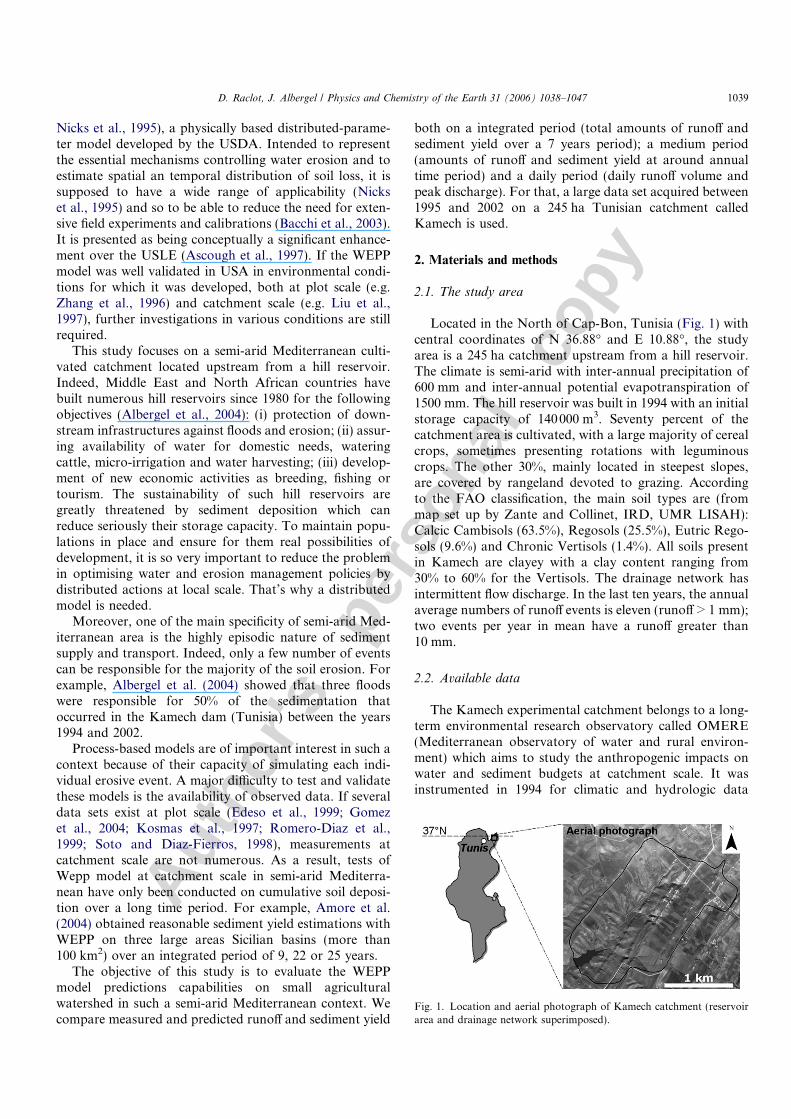
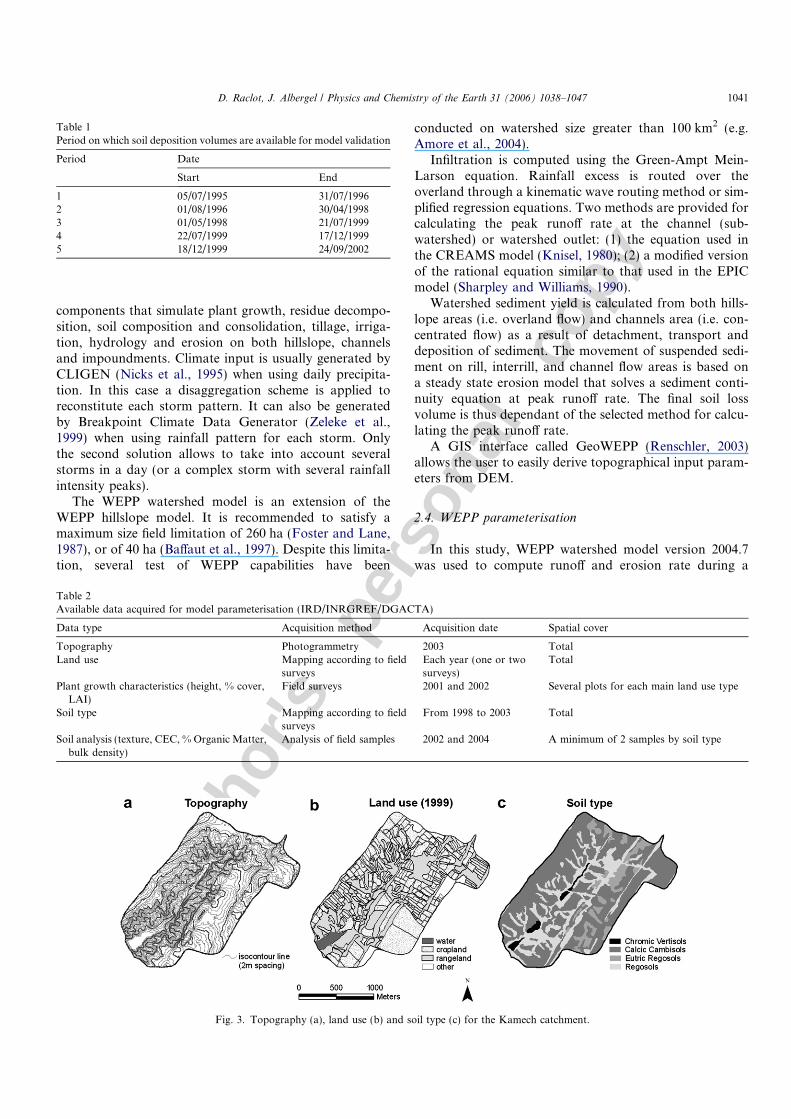
Located in the North of Cap-Bon, Tunisia (Fig. 1) withcentral coordinates of N 36.88� and E 10.88�, the studyarea is a 245 ha catchment upstream from a hill reservoir.The climate is semi-arid with inter-annual precipitation of600 mm and inter-annual potential evapotranspiration of1500 mm. The hill reservoir was built in 1994 with an initialstorage capacity of 140000 m3. Seventy percent of thecatchment area is cultivated, with a large majority of cerealcrops, sometimes presenting rotations with leguminouscrops. The other 30%, mainly located in steepest slopes,are covered by rangeland devoted to grazing. Accordingto the FAO classification, the main soil types are (frommap set up by Zante and Collinet, IRD, UMR LISAH):Calcic Cambisols (63.5%), Regosols (25.5%), Eutric Rego-sols (9.6%) and Chronic Vertisols (1.4%). All soils presentin Kamech are clayey with a clay content ranging from30% to 60% for the Vertisols. The drainage network hasintermittent flow discharge. In the last ten years, the annualaverage numbers of runoff events is eleven (runoff > 1 mm);two events per year in mean have a runoff greater than10 mm.
2.2. Available data
The Kamech experimental catchment belongs to a long-term environmental research observatory called OMERE(Mediterranean observatory of water and rural environ-ment) which aims to study the anthropogenic impacts onwater and sediment budgets at catchment scale. It wasinstrumented in 1994 for climatic and hydrologic data
Fig. 1. Location and aerial photograph of Kamech catchment (reservoirarea and drainage network superimposed).
D. Raclot, J. Albergel / Physics and Chemistry of the Earth 31 (2006) 1038–1047 1039
Autho
r's
pers
onal
co
py
acquisition in an automatic mode. The climatic instrumentsset is composed of a tipping bucket rain gauge (0.5 mm), anevaporation pan and an air thermometer. As hydrologicdata acquisition, a water level gauge was installed in thereservoir at the catchment outlet to provide water levelswith 1 cm accuracy. The spillway was shaped in such away that discharge could be well estimated. The bathyme-try of the hill reservoir is measured each years or each twoyears by localized sampling of the bottom of the reservoiralong transverse lines between its shores. The ends of eachline are levelled and positioned on the as-built drawing ofthe reservoir. A digital elevation model is constructed,making it possible to establish depth/volume and depth/surface curves. Finally, continuous runoff and soil deposi-tion during five periods (six bathymetric measurements)could be evaluate at the catchment scale using an hydro-logic and erosion budget (Albergel et al., 1998, 2005).For that, comparison of the reservoir volumes at dischargelevel between one measurement and another is used to esti-mate the amount of material retained. A mean concentra-tion of suspended matter during the rare overflowing bythe spillway were estimated through manual samples. Solidtransport between two bathymetry measurements isobtained by adding the mass of soil exported by the dis-charged liquid flows to the volume of silt retained in thedam multiplied by its density:
T ¼ V s � d þXn
i¼1
SiCi
Here T is the total solid transport between two bathymetrymeasurements (in t), Vs the measured volume of silt (in m3),d the density of the silt (in t/m3), n the number of floodsthat have caused overflowing discharges by the spillway be-tween two measurements, Si the volume discharged by thespillway during overflowing i (in m3), and Ci the mean mea-
sured concentration of suspended matter during overflow-ing i (in t/m3).
This easily implemented method provides a good esti-mation of the solid transport at the outlet of a reservoircatchment. One difficulty is the conversion of volume ofsediment deposited in the reservoir into mass of trans-ported soil. The apparent density of the material depositedon the bottom of the reservoir varies over time according tothe compaction of the deposits and their water content.With the small Kamech dam, a mean value of 1.2 t/m3 isused corresponding to site samples and literature informa-tion (Amore et al., 2004).
The precision of the method is difficult to estimate. It ismainly depending on: (i) the precision of the DEM (it isabout 10% for a bathymetry done with 500 points on theKamech site); (ii) the precision on volumes discharged overthe spillway (5%) and on measured concentration (30%);(iii) the precision on average silt density (10%). As a result,global error on these data can be roughly estimated to lessthan 20%.
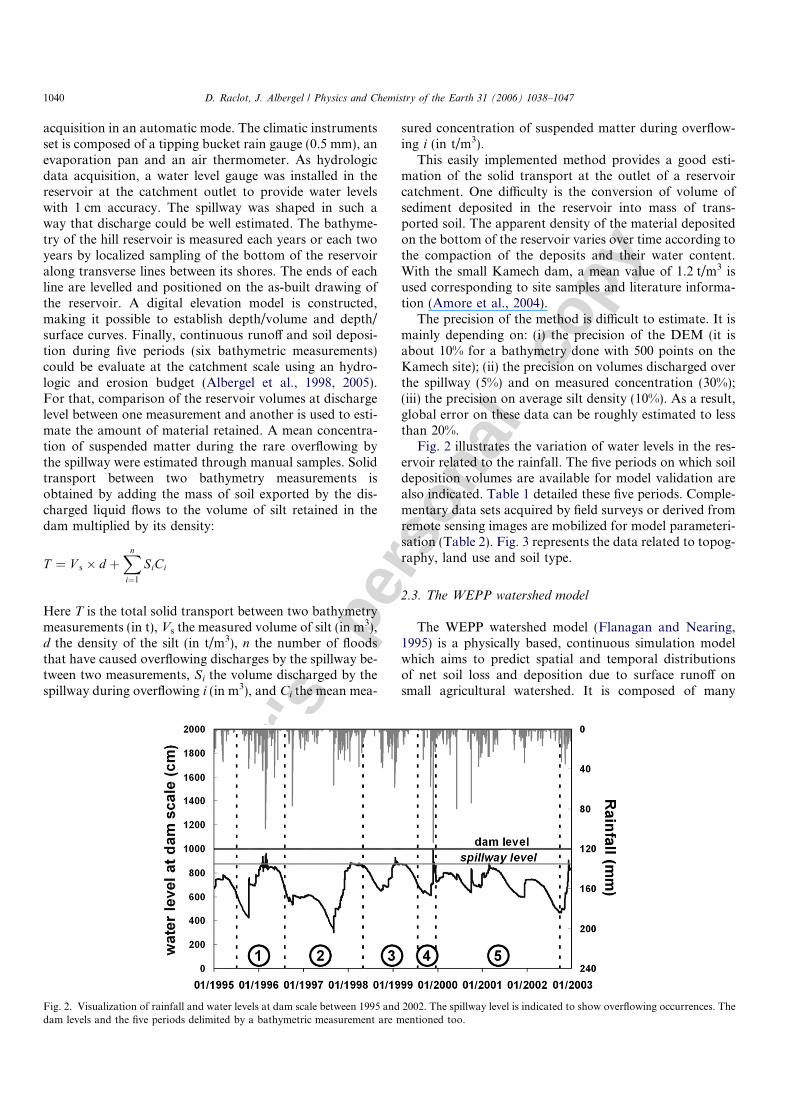
Fig. 2 illustrates the variation of water levels in the res-ervoir related to the rainfall. The five periods on which soildeposition volumes are available for model validation arealso indicated. Table 1 detailed these five periods. Comple-mentary data sets acquired by field surveys or derived fromremote sensing images are mobilized for model parameteri-sation (Table 2). Fig. 3 represents the data related to topog-raphy, land use and soil type.
2.3. The WEPP watershed model
The WEPP watershed model (Flanagan and Nearing,1995) is a physically based, continuous simulation modelwhich aims to predict spatial and temporal distributionsof net soil loss and deposition due to surface runoff onsmall agricultural watershed. It is composed of many
Fig. 2. Visualization of rainfall and water levels at dam scale between 1995 and 2002. The spillway level is indicated to show overflowing occurrences. Thedam levels and the five periods delimited by a bathymetric measurement are mentioned too.
1040 D. Raclot, J. Albergel / Physics and Chemistry of the Earth 31 (2006) 1038–1047
Autho
r's
pers
onal
co
pycomponents that simulate plant growth, residue decompo-sition, soil composition and consolidation, tillage, irriga-tion, hydrology and erosion on both hillslope, channelsand impoundments. Climate input is usually generated byCLIGEN (Nicks et al., 1995) when using daily precipita-tion. In this case a disaggregation scheme is applied toreconstitute each storm pattern. It can also be generatedby Breakpoint Climate Data Generator (Zeleke et al.,1999) when using rainfall pattern for each storm. Onlythe second solution allows to take into account severalstorms in a day (or a complex storm with several rainfallintensity peaks).
The WEPP watershed model is an extension of theWEPP hillslope model. It is recommended to satisfy amaximum size field limitation of 260 ha (Foster and Lane,1987), or of 40 ha (Baffaut et al., 1997). Despite this limita-tion, several test of WEPP capabilities have been
conducted on watershed size greater than 100 km2 (e.g.Amore et al., 2004).
Infiltration is computed using the Green-Ampt Mein-Larson equation. Rainfall excess is routed over theoverland through a kinematic wave routing method or sim-plified regression equations. Two methods are provided forcalculating the peak runoff rate at the channel (sub-watershed) or watershed outlet: (1) the equation used inthe CREAMS model (Knisel, 1980); (2) a modified versionof the rational equation similar to that used in the EPICmodel (Sharpley and Williams, 1990).
Watershed sediment yield is calculated from both hills-lope areas (i.e. overland flow) and channels area (i.e. con-centrated flow) as a result of detachment, transport anddeposition of sediment. The movement of suspended sedi-ment on rill, interrill, and channel flow areas is based ona steady state erosion model that solves a sediment conti-nuity equation at peak runoff rate. The final soil lossvolume is thus dependant of the selected method for calcu-lating the peak runoff rate.
A GIS interface called GeoWEPP (Renschler, 2003)allows the user to easily derive topographical input param-eters from DEM.
2.4. WEPP parameterisation
In this study, WEPP watershed model version 2004.7was used to compute runoff and erosion rate during a
Table 1Period on which soil deposition volumes are available for model validation
Period Date
Start End
1 05/07/1995 31/07/19962 01/08/1996 30/04/19983 01/05/1998 21/07/19994 22/07/1999 17/12/19995 18/12/1999 24/09/2002
Table 2Available data acquired for model parameterisation (IRD/INRGREF/DGACTA)
Data type Acquisition method Acquisition date Spatial cover
Topography Photogrammetry 2003 TotalLand use Mapping according to field
surveysEach year (one or twosurveys)
Total
Plant growth characteristics (height, % cover,LAI)
Field surveys 2001 and 2002 Several plots for each main land use type
Soil type Mapping according to fieldsurveys
From 1998 to 2003 Total
Soil analysis (texture, CEC, % Organic Matter,bulk density)
Analysis of field samples 2002 and 2004 A minimum of 2 samples by soil type
Fig. 3. Topography (a), land use (b) and soil type (c) for the Kamech catchment.
D. Raclot, J. Albergel / Physics and Chemistry of the Earth 31 (2006) 1038–1047 1041
Autho
r's
pers
onal
co
py
continuous period from January 1995 to September 2002.The period from January to July 1995 was used to initialisesome conditions as soil moisture. In order to evaluate thepredictive ability of WEPP, parameterisation was madeas recommended in the WEPP user summary (Flanaganand Livingston, 1995) and no calibration on hydrologicalor erosion data was conducted.
Morphological subdivisions were derived using Geo-WEPP and a 4 m-DEM obtained by photogrammetry froma stereo pair of panchromatic Ikonos images. The criticalsource area and the minimum source channel lengththresholds were adapted to optimise the reproduction ofthe main intermittent drainage network and the crop andsoil type homogeneity of each subdivision. Sixty nine sub-divisions (from 0.1 ha to 15.2 ha with a mean area of3.7 ha) and 28 channels were thus obtained (cf. Fig. 4).Geometric characteristics of each subdivision (i.e. length,
width and slope) were automatically derived from DEMby a procedure developed by Cochrane and Flanagan(1999) and implemented in GeoWEPP.
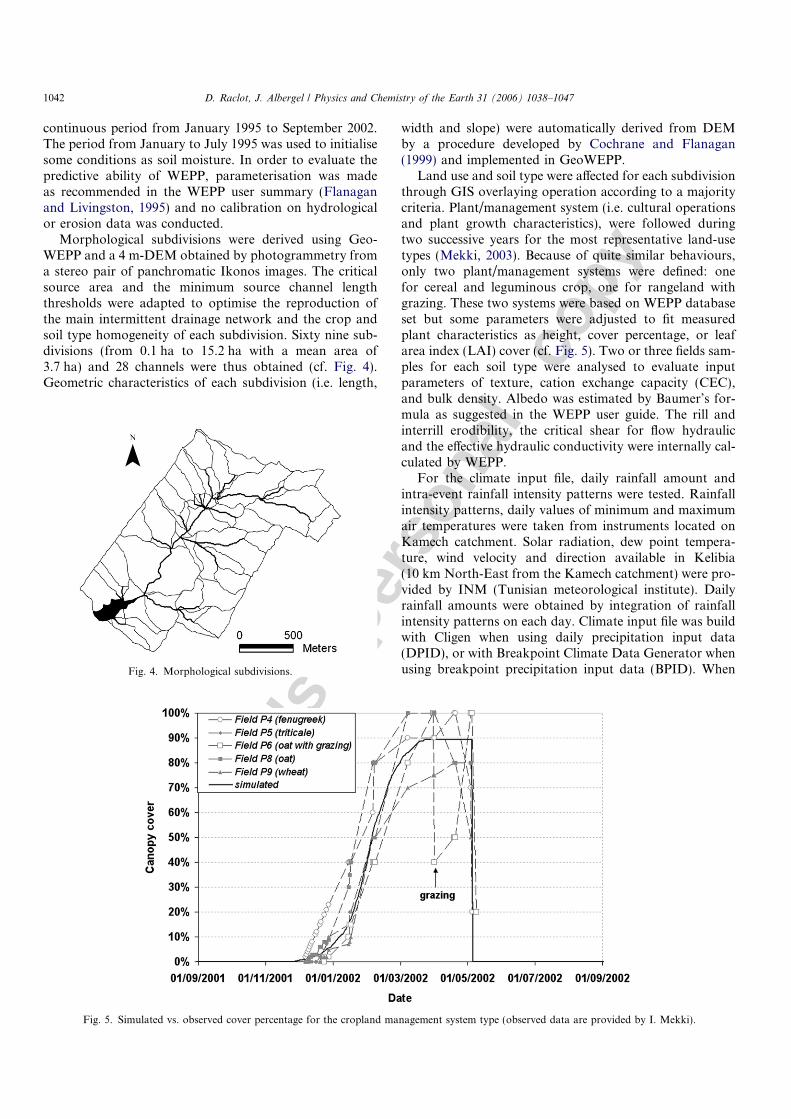
Land use and soil type were affected for each subdivisionthrough GIS overlaying operation according to a majoritycriteria. Plant/management system (i.e. cultural operationsand plant growth characteristics), were followed duringtwo successive years for the most representative land-usetypes (Mekki, 2003). Because of quite similar behaviours,only two plant/management systems were defined: onefor cereal and leguminous crop, one for rangeland withgrazing. These two systems were based on WEPP databaseset but some parameters were adjusted to fit measuredplant characteristics as height, cover percentage, or leafarea index (LAI) cover (cf. Fig. 5). Two or three fields sam-ples for each soil type were analysed to evaluate inputparameters of texture, cation exchange capacity (CEC),and bulk density. Albedo was estimated by Baumer’s for-mula as suggested in the WEPP user guide. The rill andinterrill erodibility, the critical shear for flow hydraulicand the effective hydraulic conductivity were internally cal-culated by WEPP.
For the climate input file, daily rainfall amount andintra-event rainfall intensity patterns were tested. Rainfallintensity patterns, daily values of minimum and maximumair temperatures were taken from instruments located onKamech catchment. Solar radiation, dew point tempera-ture, wind velocity and direction available in Kelibia(10 km North-East from the Kamech catchment) were pro-vided by INM (Tunisian meteorological institute). Dailyrainfall amounts were obtained by integration of rainfallintensity patterns on each day. Climate input file was buildwith Cligen when using daily precipitation input data(DPID), or with Breakpoint Climate Data Generator whenusing breakpoint precipitation input data (BPID). WhenFig. 4. Morphological subdivisions.
Fig. 5. Simulated vs. observed cover percentage for the cropland management system type (observed data are provided by I. Mekki).
1042 D. Raclot, J. Albergel / Physics and Chemistry of the Earth 31 (2006) 1038–1047
Autho
r's
pers
onal
co
pyusing daily precipitation as input data, the Cligen disaggre-gation method generates storm intensity input assuming astorm with a single intensity peak and described by a dou-ble exponential function.
For maximum discharge calculation, we tested both theCREAMS and the EPIC methods. As a result, four simu-lations (Table 3) were computed and analysed.
3. Results
The results are presented below at three different timesteps: (1) over the total period of measurement; (2) betweenconsecutive bathymetric measurements; (3) at a daily timestep, only for runoff volumes.
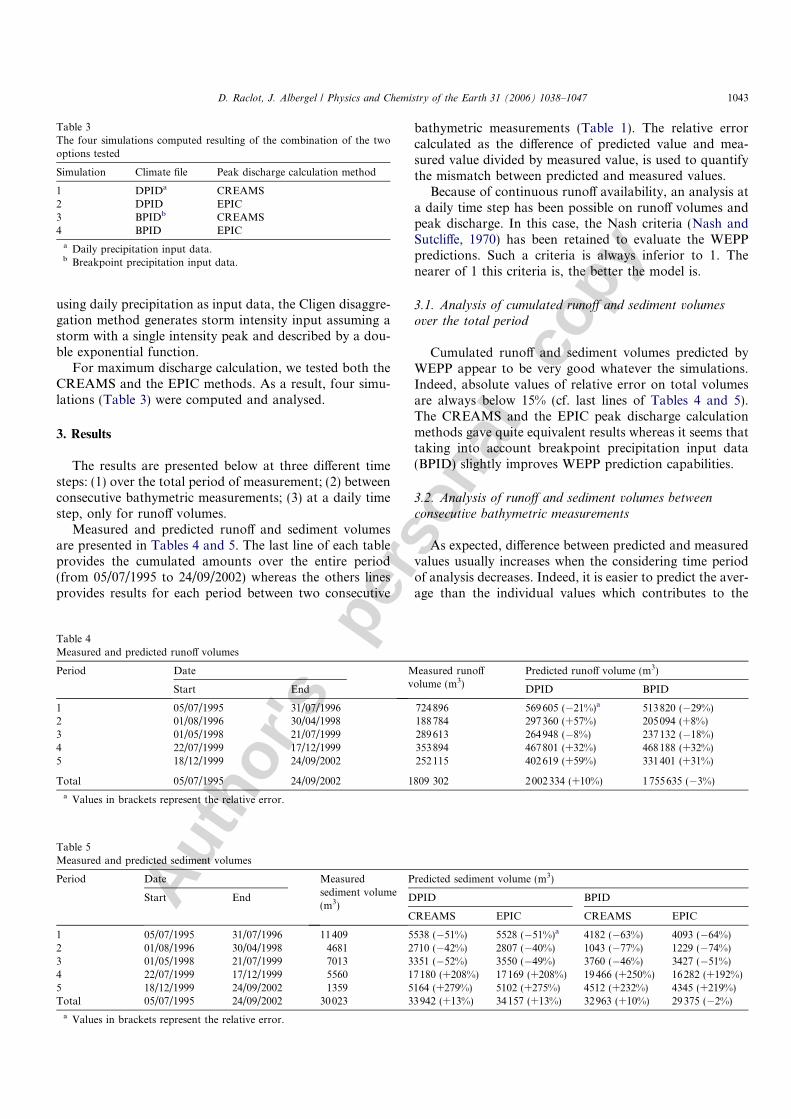
Measured and predicted runoff and sediment volumesare presented in Tables 4 and 5. The last line of each tableprovides the cumulated amounts over the entire period(from 05/07/1995 to 24/09/2002) whereas the others linesprovides results for each period between two consecutive
bathymetric measurements (Table 1). The relative errorcalculated as the difference of predicted value and mea-sured value divided by measured value, is used to quantifythe mismatch between predicted and measured values.
Because of continuous runoff availability, an analysis ata daily time step has been possible on runoff volumes andpeak discharge. In this case, the Nash criteria (Nash andSutcliffe, 1970) has been retained to evaluate the WEPPpredictions. Such a criteria is always inferior to 1. Thenearer of 1 this criteria is, the better the model is.
3.1. Analysis of cumulated runoff and sediment volumesover the total period
Cumulated runoff and sediment volumes predicted byWEPP appear to be very good whatever the simulations.Indeed, absolute values of relative error on total volumesare always below 15% (cf. last lines of Tables 4 and 5).The CREAMS and the EPIC peak discharge calculationmethods gave quite equivalent results whereas it seems thattaking into account breakpoint precipitation input data(BPID) slightly improves WEPP prediction capabilities.
3.2. Analysis of runoff and sediment volumes between
consecutive bathymetric measurements
As expected, difference between predicted and measuredvalues usually increases when the considering time periodof analysis decreases. Indeed, it is easier to predict the aver-age than the individual values which contributes to the
Table 3The four simulations computed resulting of the combination of the twooptions tested
Simulation Climate file Peak discharge calculation method
1 DPIDa CREAMS2 DPID EPIC3 BPIDb CREAMS4 BPID EPIC
a Daily precipitation input data.b Breakpoint precipitation input data.
Table 4Measured and predicted runoff volumes
Period Date Measured runoffvolume (m3)
Predicted runoff volume (m3)
Start End DPID BPID
1 05/07/1995 31/07/1996 724896 569605 (�21%)a 513820 (�29%)2 01/08/1996 30/04/1998 188784 297360 (+57%) 205094 (+8%)3 01/05/1998 21/07/1999 289613 264948 (�8%) 237132 (�18%)4 22/07/1999 17/12/1999 353894 467801 (+32%) 468188 (+32%)5 18/12/1999 24/09/2002 252115 402619 (+59%) 331401 (+31%)
Total 05/07/1995 24/09/2002 1809 302 2002334 (+10%) 1755635 (�3%)
a Values in brackets represent the relative error.
Table 5Measured and predicted sediment volumes
Period Date Measuredsediment volume(m3)
Predicted sediment volume (m3)
Start End DPID BPID
CREAMS EPIC CREAMS EPIC
1 05/07/1995 31/07/1996 11409 5538 (�51%) 5528 (�51%)a 4182 (�63%) 4093 (�64%)2 01/08/1996 30/04/1998 4681 2710 (�42%) 2807 (�40%) 1043 (�77%) 1229 (�74%)3 01/05/1998 21/07/1999 7013 3351 (�52%) 3550 (�49%) 3760 (�46%) 3427 (�51%)4 22/07/1999 17/12/1999 5560 17180 (+208%) 17169 (+208%) 19466 (+250%) 16282 (+192%)5 18/12/1999 24/09/2002 1359 5164 (+279%) 5102 (+275%) 4512 (+232%) 4345 (+219%)Total 05/07/1995 24/09/2002 30023 33942 (+13%) 34157 (+13%) 32963 (+10%) 29375 (�2%)
a Values in brackets represent the relative error.
D. Raclot, J. Albergel / Physics and Chemistry of the Earth 31 (2006) 1038–1047 1043
Autho
r's
pers
onal
co
py
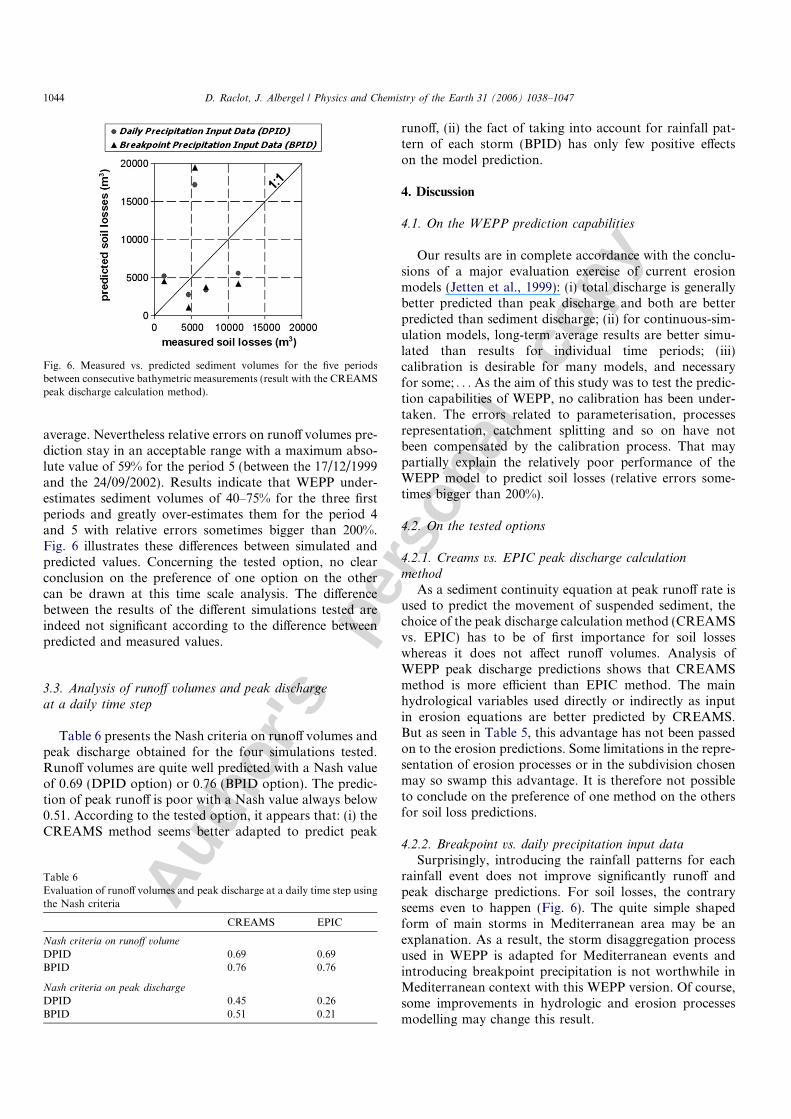
average. Nevertheless relative errors on runoff volumes pre-diction stay in an acceptable range with a maximum abso-lute value of 59% for the period 5 (between the 17/12/1999and the 24/09/2002). Results indicate that WEPP under-estimates sediment volumes of 40–75% for the three firstperiods and greatly over-estimates them for the period 4and 5 with relative errors sometimes bigger than 200%.Fig. 6 illustrates these differences between simulated andpredicted values. Concerning the tested option, no clearconclusion on the preference of one option on the othercan be drawn at this time scale analysis. The differencebetween the results of the different simulations tested areindeed not significant according to the difference betweenpredicted and measured values.
3.3. Analysis of runoff volumes and peak discharge
at a daily time step
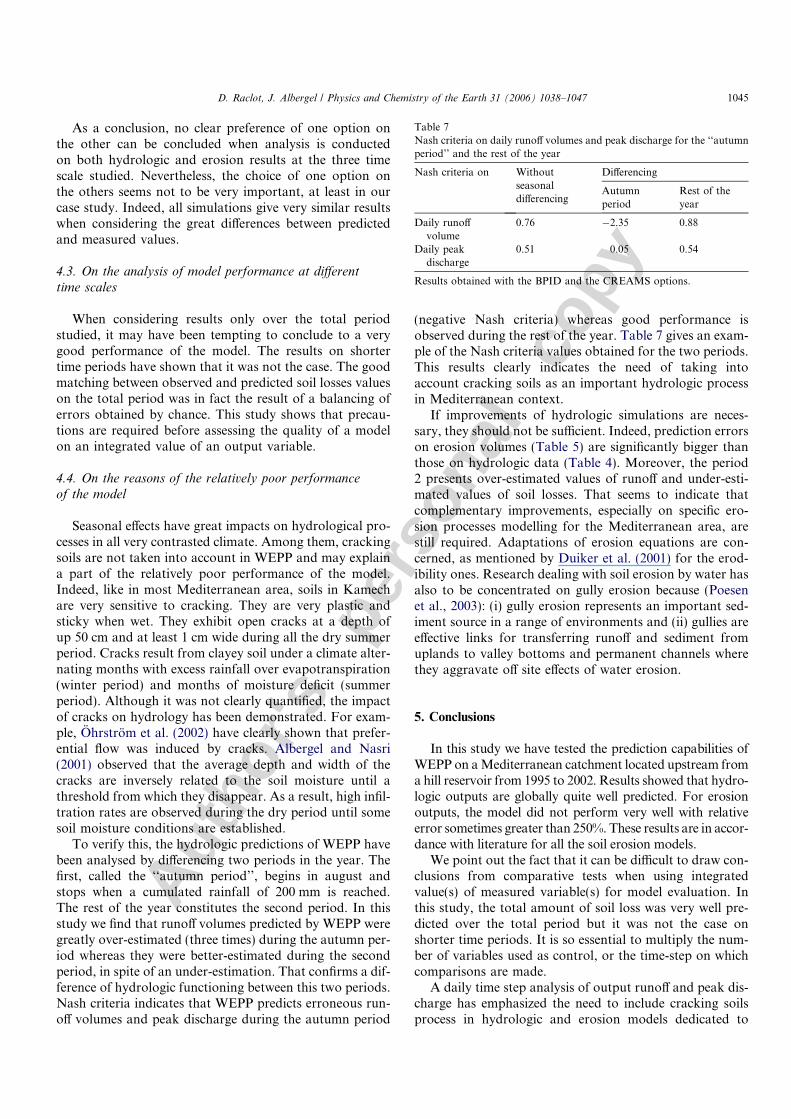
Table 6 presents the Nash criteria on runoff volumes andpeak discharge obtained for the four simulations tested.Runoff volumes are quite well predicted with a Nash valueof 0.69 (DPID option) or 0.76 (BPID option). The predic-tion of peak runoff is poor with a Nash value always below0.51. According to the tested option, it appears that: (i) theCREAMS method seems better adapted to predict peak
runoff, (ii) the fact of taking into account for rainfall pat-tern of each storm (BPID) has only few positive effectson the model prediction.
4. Discussion
4.1. On the WEPP prediction capabilities
Our results are in complete accordance with the conclu-sions of a major evaluation exercise of current erosionmodels (Jetten et al., 1999): (i) total discharge is generallybetter predicted than peak discharge and both are betterpredicted than sediment discharge; (ii) for continuous-sim-ulation models, long-term average results are better simu-lated than results for individual time periods; (iii)calibration is desirable for many models, and necessaryfor some; . . . As the aim of this study was to test the predic-tion capabilities of WEPP, no calibration has been under-taken. The errors related to parameterisation, processesrepresentation, catchment splitting and so on have notbeen compensated by the calibration process. That maypartially explain the relatively poor performance of theWEPP model to predict soil losses (relative errors some-times bigger than 200%).
4.2. On the tested options
4.2.1. Creams vs. EPIC peak discharge calculation
method
As a sediment continuity equation at peak runoff rate isused to predict the movement of suspended sediment, thechoice of the peak discharge calculation method (CREAMSvs. EPIC) has to be of first importance for soil losseswhereas it does not affect runoff volumes. Analysis ofWEPP peak discharge predictions shows that CREAMSmethod is more efficient than EPIC method. The mainhydrological variables used directly or indirectly as inputin erosion equations are better predicted by CREAMS.But as seen in Table 5, this advantage has not been passedon to the erosion predictions. Some limitations in the repre-sentation of erosion processes or in the subdivision chosenmay so swamp this advantage. It is therefore not possibleto conclude on the preference of one method on the othersfor soil loss predictions.
4.2.2. Breakpoint vs. daily precipitation input dataSurprisingly, introducing the rainfall patterns for each
rainfall event does not improve significantly runoff andpeak discharge predictions. For soil losses, the contraryseems even to happen (Fig. 6). The quite simple shapedform of main storms in Mediterranean area may be anexplanation. As a result, the storm disaggregation processused in WEPP is adapted for Mediterranean events andintroducing breakpoint precipitation is not worthwhile inMediterranean context with this WEPP version. Of course,some improvements in hydrologic and erosion processesmodelling may change this result.
Fig. 6. Measured vs. predicted sediment volumes for the five periodsbetween consecutive bathymetric measurements (result with the CREAMSpeak discharge calculation method).
Table 6Evaluation of runoff volumes and peak discharge at a daily time step usingthe Nash criteria
CREAMS EPIC
Nash criteria on runoff volume
DPID 0.69 0.69BPID 0.76 0.76
Nash criteria on peak discharge
DPID 0.45 0.26BPID 0.51 0.21
1044 D. Raclot, J. Albergel / Physics and Chemistry of the Earth 31 (2006) 1038–1047
Autho
r's
pers
onal
co
py
As a conclusion, no clear preference of one option onthe other can be concluded when analysis is conductedon both hydrologic and erosion results at the three timescale studied. Nevertheless, the choice of one option onthe others seems not to be very important, at least in ourcase study. Indeed, all simulations give very similar resultswhen considering the great differences between predictedand measured values.
4.3. On the analysis of model performance at different
time scales
When considering results only over the total periodstudied, it may have been tempting to conclude to a verygood performance of the model. The results on shortertime periods have shown that it was not the case. The goodmatching between observed and predicted soil losses valueson the total period was in fact the result of a balancing oferrors obtained by chance. This study shows that precau-tions are required before assessing the quality of a modelon an integrated value of an output variable.
4.4. On the reasons of the relatively poor performanceof the model
Seasonal effects have great impacts on hydrological pro-cesses in all very contrasted climate. Among them, crackingsoils are not taken into account in WEPP and may explaina part of the relatively poor performance of the model.Indeed, like in most Mediterranean area, soils in Kamechare very sensitive to cracking. They are very plastic andsticky when wet. They exhibit open cracks at a depth ofup 50 cm and at least 1 cm wide during all the dry summerperiod. Cracks result from clayey soil under a climate alter-nating months with excess rainfall over evapotranspiration(winter period) and months of moisture deficit (summerperiod). Although it was not clearly quantified, the impactof cracks on hydrology has been demonstrated. For exam-ple, Ohrstrom et al. (2002) have clearly shown that prefer-ential flow was induced by cracks. Albergel and Nasri(2001) observed that the average depth and width of thecracks are inversely related to the soil moisture until athreshold from which they disappear. As a result, high infil-tration rates are observed during the dry period until somesoil moisture conditions are established.
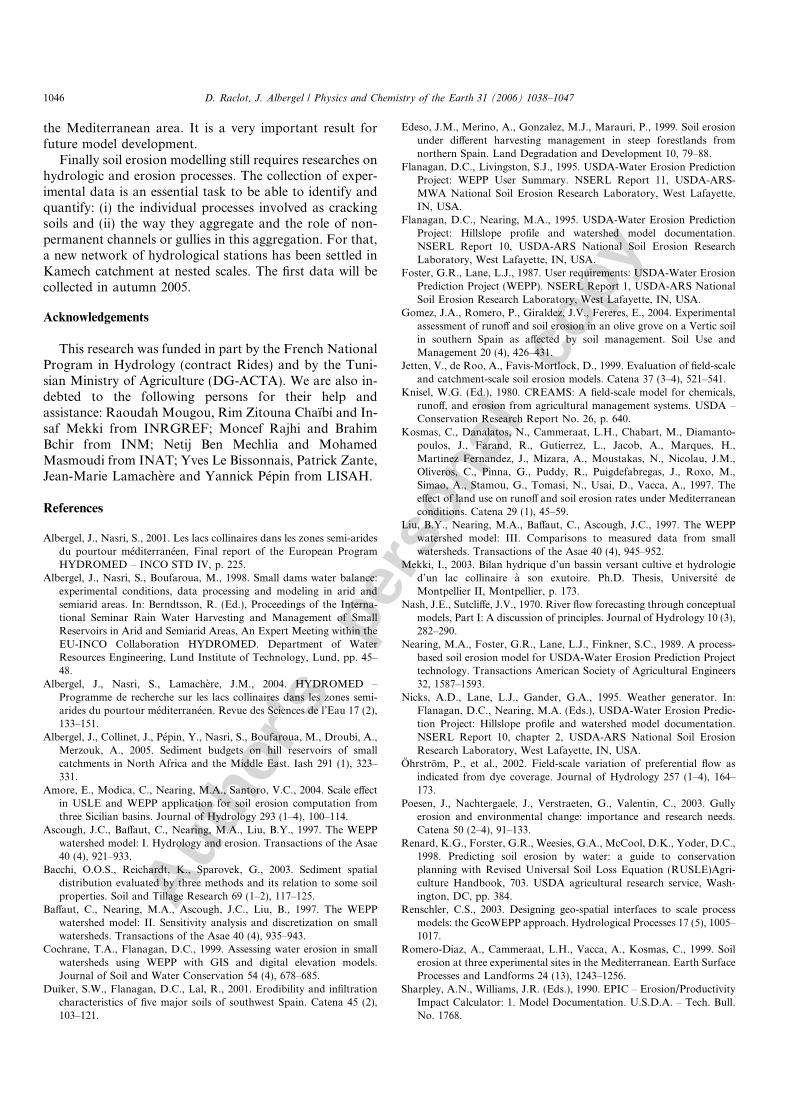
To verify this, the hydrologic predictions of WEPP havebeen analysed by differencing two periods in the year. Thefirst, called the ‘‘autumn period’’, begins in august andstops when a cumulated rainfall of 200 mm is reached.The rest of the year constitutes the second period. In thisstudy we find that runoff volumes predicted by WEPP weregreatly over-estimated (three times) during the autumn per-iod whereas they were better-estimated during the secondperiod, in spite of an under-estimation. That confirms a dif-ference of hydrologic functioning between this two periods.Nash criteria indicates that WEPP predicts erroneous run-off volumes and peak discharge during the autumn period
(negative Nash criteria) whereas good performance isobserved during the rest of the year. Table 7 gives an exam-ple of the Nash criteria values obtained for the two periods.This results clearly indicates the need of taking intoaccount cracking soils as an important hydrologic processin Mediterranean context.
If improvements of hydrologic simulations are neces-sary, they should not be sufficient. Indeed, prediction errorson erosion volumes (Table 5) are significantly bigger thanthose on hydrologic data (Table 4). Moreover, the period2 presents over-estimated values of runoff and under-esti-mated values of soil losses. That seems to indicate thatcomplementary improvements, especially on specific ero-sion processes modelling for the Mediterranean area, arestill required. Adaptations of erosion equations are con-cerned, as mentioned by Duiker et al. (2001) for the erod-ibility ones. Research dealing with soil erosion by water hasalso to be concentrated on gully erosion because (Poesenet al., 2003): (i) gully erosion represents an important sed-iment source in a range of environments and (ii) gullies areeffective links for transferring runoff and sediment fromuplands to valley bottoms and permanent channels wherethey aggravate off site effects of water erosion.
5. Conclusions
In this study we have tested the prediction capabilities ofWEPP on a Mediterranean catchment located upstream froma hill reservoir from 1995 to 2002. Results showed that hydro-logic outputs are globally quite well predicted. For erosionoutputs, the model did not perform very well with relativeerror sometimes greater than 250%. These results are in accor-dance with literature for all the soil erosion models.
We point out the fact that it can be difficult to draw con-clusions from comparative tests when using integratedvalue(s) of measured variable(s) for model evaluation. Inthis study, the total amount of soil loss was very well pre-dicted over the total period but it was not the case onshorter time periods. It is so essential to multiply the num-ber of variables used as control, or the time-step on whichcomparisons are made.
A daily time step analysis of output runoff and peak dis-charge has emphasized the need to include cracking soilsprocess in hydrologic and erosion models dedicated to
Table 7Nash criteria on daily runoff volumes and peak discharge for the ‘‘autumnperiod’’ and the rest of the year
Nash criteria on Withoutseasonaldifferencing
Differencing
Autumnperiod
Rest of theyear
Daily runoffvolume
0.76 �2.35 0.88
Daily peakdischarge
0.51 0.05 0.54
Results obtained with the BPID and the CREAMS options.
D. Raclot, J. Albergel / Physics and Chemistry of the Earth 31 (2006) 1038–1047 1045
Autho
r's
pers
onal
co
py
the Mediterranean area. It is a very important result forfuture model development.
Finally soil erosion modelling still requires researches onhydrologic and erosion processes. The collection of exper-imental data is an essential task to be able to identify andquantify: (i) the individual processes involved as crackingsoils and (ii) the way they aggregate and the role of non-permanent channels or gullies in this aggregation. For that,a new network of hydrological stations has been settled inKamech catchment at nested scales. The first data will becollected in autumn 2005.
Acknowledgements
This research was funded in part by the French NationalProgram in Hydrology (contract Rides) and by the Tuni-sian Ministry of Agriculture (DG-ACTA). We are also in-debted to the following persons for their help andassistance: Raoudah Mougou, Rim Zitouna Chaıbi and In-saf Mekki from INRGREF; Moncef Rajhi and BrahimBchir from INM; Netij Ben Mechlia and MohamedMasmoudi from INAT; Yves Le Bissonnais, Patrick Zante,Jean-Marie Lamachere and Yannick Pepin from LISAH.
References
Albergel, J., Nasri, S., 2001. Les lacs collinaires dans les zones semi-aridesdu pourtour mediterraneen, Final report of the European ProgramHYDROMED – INCO STD IV, p. 225.
Albergel, J., Nasri, S., Boufaroua, M., 1998. Small dams water balance:experimental conditions, data processing and modeling in arid andsemiarid areas. In: Berndtsson, R. (Ed.), Proceedings of the Interna-tional Seminar Rain Water Harvesting and Management of SmallReservoirs in Arid and Semiarid Areas, An Expert Meeting within theEU-INCO Collaboration HYDROMED. Department of WaterResources Engineering, Lund Institute of Technology, Lund, pp. 45–48.
Albergel, J., Nasri, S., Lamachere, J.M., 2004. HYDROMED –Programme de recherche sur les lacs collinaires dans les zones semi-arides du pourtour mediterraneen. Revue des Sciences de l’Eau 17 (2),133–151.
Albergel, J., Collinet, J., Pepin, Y., Nasri, S., Boufaroua, M., Droubi, A.,Merzouk, A., 2005. Sediment budgets on hill reservoirs of smallcatchments in North Africa and the Middle East. Iash 291 (1), 323–331.
Amore, E., Modica, C., Nearing, M.A., Santoro, V.C., 2004. Scale effectin USLE and WEPP application for soil erosion computation fromthree Sicilian basins. Journal of Hydrology 293 (1–4), 100–114.
Ascough, J.C., Baffaut, C., Nearing, M.A., Liu, B.Y., 1997. The WEPPwatershed model: I. Hydrology and erosion. Transactions of the Asae40 (4), 921–933.
Bacchi, O.O.S., Reichardt, K., Sparovek, G., 2003. Sediment spatialdistribution evaluated by three methods and its relation to some soilproperties. Soil and Tillage Research 69 (1–2), 117–125.
Baffaut, C., Nearing, M.A., Ascough, J.C., Liu, B., 1997. The WEPPwatershed model: II. Sensitivity analysis and discretization on smallwatersheds. Transactions of the Asae 40 (4), 935–943.
Cochrane, T.A., Flanagan, D.C., 1999. Assessing water erosion in smallwatersheds using WEPP with GIS and digital elevation models.Journal of Soil and Water Conservation 54 (4), 678–685.
Duiker, S.W., Flanagan, D.C., Lal, R., 2001. Erodibility and infiltrationcharacteristics of five major soils of southwest Spain. Catena 45 (2),103–121.
Edeso, J.M., Merino, A., Gonzalez, M.J., Marauri, P., 1999. Soil erosionunder different harvesting management in steep forestlands fromnorthern Spain. Land Degradation and Development 10, 79–88.
Flanagan, D.C., Livingston, S.J., 1995. USDA-Water Erosion PredictionProject: WEPP User Summary. NSERL Report 11, USDA-ARS-MWA National Soil Erosion Research Laboratory, West Lafayette,IN, USA.
Flanagan, D.C., Nearing, M.A., 1995. USDA-Water Erosion PredictionProject: Hillslope profile and watershed model documentation.NSERL Report 10, USDA-ARS National Soil Erosion ResearchLaboratory, West Lafayette, IN, USA.
Foster, G.R., Lane, L.J., 1987. User requirements: USDA-Water ErosionPrediction Project (WEPP). NSERL Report 1, USDA-ARS NationalSoil Erosion Research Laboratory, West Lafayette, IN, USA.
Gomez, J.A., Romero, P., Giraldez, J.V., Fereres, E., 2004. Experimentalassessment of runoff and soil erosion in an olive grove on a Vertic soilin southern Spain as affected by soil management. Soil Use andManagement 20 (4), 426–431.
Jetten, V., de Roo, A., Favis-Mortlock, D., 1999. Evaluation of field-scaleand catchment-scale soil erosion models. Catena 37 (3–4), 521–541.
Knisel, W.G. (Ed.), 1980. CREAMS: A field-scale model for chemicals,runoff, and erosion from agricultural management systems. USDA –Conservation Research Report No. 26, p. 640.
Kosmas, C., Danalatos, N., Cammeraat, L.H., Chabart, M., Diamanto-poulos, J., Farand, R., Gutierrez, L., Jacob, A., Marques, H.,Martinez Fernandez, J., Mizara, A., Moustakas, N., Nicolau, J.M.,Oliveros, C., Pinna, G., Puddy, R., Puigdefabregas, J., Roxo, M.,Simao, A., Stamou, G., Tomasi, N., Usai, D., Vacca, A., 1997. Theeffect of land use on runoff and soil erosion rates under Mediterraneanconditions. Catena 29 (1), 45–59.
Liu, B.Y., Nearing, M.A., Baffaut, C., Ascough, J.C., 1997. The WEPPwatershed model: III. Comparisons to measured data from smallwatersheds. Transactions of the Asae 40 (4), 945–952.
Mekki, I., 2003. Bilan hydrique d’un bassin versant cultive et hydrologied’un lac collinaire a son exutoire. Ph.D. Thesis, Universite deMontpellier II, Montpellier, p. 173.
Nash, J.E., Sutcliffe, J.V., 1970. River flow forecasting through conceptualmodels, Part I: A discussion of principles. Journal of Hydrology 10 (3),282–290.
Nearing, M.A., Foster, G.R., Lane, L.J., Finkner, S.C., 1989. A process-based soil erosion model for USDA-Water Erosion Prediction Projecttechnology. Transactions American Society of Agricultural Engineers32, 1587–1593.
Nicks, A.D., Lane, L.J., Gander, G.A., 1995. Weather generator. In:Flanagan, D.C., Nearing, M.A. (Eds.), USDA-Water Erosion Predic-tion Project: Hillslope profile and watershed model documentation.NSERL Report 10, chapter 2, USDA-ARS National Soil ErosionResearch Laboratory, West Lafayette, IN, USA.
Ohrstrom, P., et al., 2002. Field-scale variation of preferential flow asindicated from dye coverage. Journal of Hydrology 257 (1–4), 164–173.
Poesen, J., Nachtergaele, J., Verstraeten, G., Valentin, C., 2003. Gullyerosion and environmental change: importance and research needs.Catena 50 (2–4), 91–133.
Renard, K.G., Forster, G.R., Weesies, G.A., McCool, D.K., Yoder, D.C.,1998. Predicting soil erosion by water: a guide to conservationplanning with Revised Universal Soil Loss Equation (RUSLE)Agri-culture Handbook, 703. USDA agricultural research service, Wash-ington, DC, pp. 384.
Renschler, C.S., 2003. Designing geo-spatial interfaces to scale processmodels: the GeoWEPP approach. Hydrological Processes 17 (5), 1005–1017.
Romero-Diaz, A., Cammeraat, L.H., Vacca, A., Kosmas, C., 1999. Soilerosion at three experimental sites in the Mediterranean. Earth SurfaceProcesses and Landforms 24 (13), 1243–1256.
Sharpley, A.N., Williams, J.R. (Eds.), 1990. EPIC – Erosion/ProductivityImpact Calculator: 1. Model Documentation. U.S.D.A. – Tech. Bull.No. 1768.
1046 D. Raclot, J. Albergel / Physics and Chemistry of the Earth 31 (2006) 1038–1047

Autho
r's
pers
onal
co
py
Sonneveld, B., Nearing, M.A., 2003. A nonparametric/parametric analysisof the Universal Soil Loss Equation. Catena 52 (1), 9–21.
Soto, B., Diaz-Fierros, F., 1998. Runoff and soil erosion from areas ofburnt scrub: comparison of experimental results with those predictedby the WEPP model. Catena 31 (4), 257–270.
Williams, J.R., 1975. Sediment yield prediction with universal equationusing runoff energy factor, Present and Prospective Technology forPredicting Sediment Yields and Sources. Report ARS-S-40,USDA agricultural research service, Washington, DC, pp. 244–252.
Wischmeier, W.H., Smith, D.D., 1978. Predicting Rainfall Erosion Loss:A Guide to Conservation Planning, 537. USDA Handbook, Wash-ington, DC, pp. 58.
Zeleke, G., Winter, T., Flanagan, D.C., 1999. BPCDG: BreakpointClimate Data Generator for WEPP using observed standard weatherdata sets. Available from: <http://topsoil.nserl.purdue.edu/nserlweb/weppmain/BPCDG.html>.
Zhang, X.C., Nearing, M.A., Risse, L.M., McGregor, K.C., 1996.Evaluation of WEPP runoff and soil loss predictions using naturalrunoff plot data. Transactions of the Asae 39 (3), 855–863.
D. Raclot, J. Albergel / Physics and Chemistry of the Earth 31 (2006) 1038–1047 1047
Related Documents