WATER-POWER RESOURCES OF THE UMPQUA RIVER AND ITS TRIBUTARIES, OREGON By BENJAMIN E. JoNES and HAROW T. STEARNS PREFACE The following observations .were made by the Secretary of the Interior in his report to the President for the fiscal year ended June 30, 1928 : The new business policy for administering the national domain began to take shape about 20 years ago, but its evolution continues. Its keynote has been to put to the best possible use whatever remains in public ownership- wise utilization of land, whether· agricultural or mineral, grazing or irrigable, forest or power site. Such a policy predicates scientific land classification. * * * The laws providing for leasing lands that are chiefly valuable for the 1Jlining of coal, oil, gas, phosphate, or potash or the generating of water power likewise recognize scientific classification of the Nation's lands as an integral part of public-land administration. At its start, half a century ago, the land classification was necessarily of the nature of a general and quali- tative survey of the national domain, but the Interior Department engineers have been putting their investigations on a more and more detailed and exact basis, until now they seek to afford a quantitative determination of every natural resource that gives value to the publicly owned lands. Only with the facts at hand as to the relative worth and possible use of these lands is it possible to administer properly. the land laws of to-day and to propose more advanced laws for to-morrow. * * * Foremost among the present-day activities of the Government in planning for the future is its handling of the resources that represent the energy supply. A national inventory of tons of coal, barrels of oil, and second-feet of water is a measure of the potential aid that will be ready for American workers of the future. With the present realization that the limit to be placed on indus- trial progress is likely to be fixed by the amount of power available for doing man's work, it is a plain duty to safeguard the future with a business-like policy in developing these stores of oil and coal and in utilizing these power sites. An indication of the extent to which use is now being made of the water power and mineral resources under permit or lease from the Government is furnished by the following statements : Out of a total of more than 13,000,000 horsepower of water power now developed in the.United States, more than 4,500,000 horsepower is developed on public lands or navigable streams and is being oper- 221

Welcome message from author
This document is posted to help you gain knowledge. Please leave a comment to let me know what you think about it! Share it to your friends and learn new things together.
Transcript
WATER-POWER RESOURCES OF THE UMPQUA RIVER AND ITS TRIBUTARIES, OREGON
By BENJAMIN E. JoNES and HAROW T. STEARNS
PREFACE
The following observations . were made by the Secretary of the Interior in his report to the President for the fiscal year ended June 30, 1928 :
The new business policy for administering the national domain began to take shape about 20 years ago, but its evolution continues. Its keynote has been to put to the best possible use whatever remains in public ownershipwise utilization of land, whether· agricultural or mineral, grazing or irrigable, forest or power site. Such a policy predicates scientific land classification. * * * The laws providing for leasing lands that are chiefly valuable for the 1Jlining of coal, oil, gas, phosphate, or potash or the generating of water power likewise recognize scientific classification of the Nation's lands as an integral part of public-land administration. At its start, half a century ago, the land classification was necessarily of the nature of a general and qualitative survey of the national domain, but the Interior Department engineers have been putting their investigations on a more and more detailed and exact basis, until now they seek to afford a quantitative determination of every natural resource that gives value to the publicly owned lands. Only with the facts at hand as to the relative worth and possible use of these lands is it possible to administer properly. the land laws of to-day and to propose more advanced laws for to-morrow. * * *
Foremost among the present-day activities of the Government in planning for the future is its handling of the resources that represent the energy supply. A national inventory of tons of coal, barrels of oil, and second-feet of water is a measure of the potential aid that will be ready for American workers of the future. With the present realization that the limit to be placed on industrial progress is likely to be fixed by the amount of power available for doing man's work, it is a plain duty to safeguard the future with a business-like policy in developing these stores of oil and coal and in utilizing these power sites.
An indication of the extent to which use is now being made of the water power and mineral resources under permit or lease from the Government is furnished by the following statements :
Out of a total of more than 13,000,000 horsepower of water power now developed in the.United States, more than 4,500,000 horsepower is developed on public lands or navigable streams and is being oper-
221
222 CONTRIBUTIONS TO HYDROLOGY OF UNITED STATES, 19 2 9
a ted under authorization of the· Federal Government. From the passage rlf the mineral leasing law in 1920 until Jun~ 30, 1928, 197,000,000 barrels of oil have been produced from public lands under Government lease or permit, of which more than 23,000,000 barrels were produced during the fiscal year ending June 30, 1928. During the same period nearly 13,000,000 tons of coal were mined from leased public lands, of which about 3,000,000 tons were produced in the fiscal year ended June 30, 1928.
One of the chief uses of water is for the generation of power, and this use involves the lands adjacent to the stream. Public lands that would be used in the development of the water-power resources are therefore classified as power-site lands. Lands classified in this way are either retained wholly in Federal ownership, if early development seems probable, or they may be opened to entry under the homestead and other settlement laws and the surface title disposed of, the right being reserved to the Federal Government or its permittees or licensees to use the land for development of power upon payment for damages to improvements.
The power-site value of each individual tract of pubUc land depends upon the use that would be made of that tract if the river system were developed as a whole in an efficient and economical manner. Scientific classification of any tract of land with respect to power therefore requires a study of the river as a whole, includ.ing the tributaries, and the formulation of a comprehensive plan of development.
Such studies are regularly made by the United States Geological Survey in its task of making an inventory of the water resources of the public lands, but much basic work must be done before such studies can be made intelligently and adequate plans of development can be formulated. Gaging stations to measure the stream flow must be established and maintained for a period of years and river surveys and maps must be made.
In the light of information so obtained an outline of a comprehensive plan of development for the whole stream is prepared, and later the suggested plan can be perfected by detailed field work, such as the selection, engineering, and geologi(f examination and survey of dam sites, reservoirs, and other critical features.
A plan for development, which may include one or more alternative schemes is then formally outlined in a report that is essentially a compilation and study of all the data previously collected. On the basis of such reports the public lands are classified as to their probable use for power, whether for conduits, reservoirs, dams, power houses, or other possible uses, all practicable alternative schemesrof development being taken into consideration.. Though. any
-WATER-POWER RESOURCES OF UMPQUA RIVER, OREGON 223
plan of development proposed must be regarded as tentative in detail and subject to modification in the light of further and more intensive studies made as a prelim.inary to construction, such a tentative plan can be used with assurance as a basis for estimating the potential power of the river, for locating the principal concentrations of potential power, and for guiding further studies undertaken for the purposes of actual development. .
In connection with the classification of the public lands a number of reports have been prepared by the Geological Survey, outlining schemes of development for certain rivers, and though intended primarily for official use, it has seemed advisable to make many of them available for general public use.
In general, these reports contain information on geography, geology, phy-siography, water supply, river control, water-power sites, and market for power.
In these reports the conditions in the whole river basin are considered under geography, geology, and physiography. The same subjects are treated more in detail in the description of the individual power sites. Under water supply the records of run-off for the river and tributaries are summarized and analyzed. Under river control reservoir sites are described, capacity curves are drawn, and the effect of storage on stream flow is estimated. A summary is prepared, showing the additional horsepower that can be developed through storage and the benefits to irrigation, navigation, and flood protection. Developed water-power sites are described only briefly. In manuscript reports undeveloped sites are described in detail if they are of sufficient importance to justify it, and in published reports this information is summarized. The water supply with and without storage for 50 and 90 per cent of the time is stated, and pondage is discussed.
A feasible method of development is outlined, the head available is estimated, and the horsepower available 50 and 90 per cent of the time is computed by using the formula HP=O.OS QH,' in which Q is the discharge ih second-feet and H is the static head in feet. This formula is based on an average over-all efficiency of 70 per cent. The market for electric power is discussed very briefly. The distances to the nearest large cities are usually given, and some reference is made to the companies supplying the market at the time of the preparation of the report. A detailed study of rates, competition, and probable earning capacity is not attempted. The reports may also contain recommendations, which usually refer to the best .use of the government lands involved and to questions of interference between power and other uses of the water. Tables and curves used in analyzing the water supply and computations are given in the appendix to
224 CO:NTRilfUT:i:ONS TO ftYntwt.OGY OF UNI1'ED STA'tES, 19 2 9
manuscript reports but usually are not published. Funds are available for the publication of only a small number of reports yearly. For this reason the policy of the Geological Survey is to publish only a few general reports and brief summaries of smaller reports. The results of reconnaissance river surveys are not published, but white prints of the maps are included in the power reports on the area surveyed and can be supplied at cost to anyone interested.
At present about 17,000 miles of river courses have been surveyed by the Geological Survey, and rna ps of many dam sites and reservoir sites are on file in the office at Washington. Most of these surveys are listed in Water-Supply Paper 558, "Preliminary index to river surveys." In addition to the river surveys the standard topographic maps are of great value in studying reservoir possibilities, drainage areas, possible diversions from one drainage basin to another, and other features relating to power. From 1895 to 1928, roughly, 32,000 station-years of stream-flow records were obtained. The Geological Survey has published 44 reports on water power and river surveys and its files contain several hundred manuscript reports, of which about 40 are open to public inspection.
This report on the water-power resources of the Umpqua River, Oreg., is representative of the reports prepared in connection with the classification of the public lands. The plan of development outlined is believed to be :feasible, and it shows the potential power of the stream. Probably in the actual development of the power resources there will be considerable departures from the plan here presented, but this plan and the estimates based on it may be used as a basis to determine how much power, if any, is sacrificed by any alternative plan which may be proposed as financially preferable.
Topographic maps of the main river, with detailed maps of proposed dam sites, have been made by C. W. H. Nessler, C. P. McKinley, and R. B. Kilgore, of the topographic branch, and R. 0. Helland, of the conservation branch. Geologic examinations were made at many sites by H. T. Stearns, who spent about one month in the field during the summer of 1926. Gaging stations to determine the discharge of the rivers have been maintained by the waterresources branch under F. F. Henshaw and G. H. Canfield, district engineers, at a number of stations listed elsewhere in this report. Many miscellaneous stream-flow measurements have been obtained, and several temporary gaging stations were maintained during the low-water period of 1924. A field examination of the river basin, with more detailed examinations of the different sites, was made by B. E. Jones and R: 0. Helland during a period of about five months in 1924 and 1926. .All the data gathered in these ways have been combined and studied to determine a :feasible method of developing
WATER-POWER RESOURCES OF UMPQUA RIVER, OREGON 225
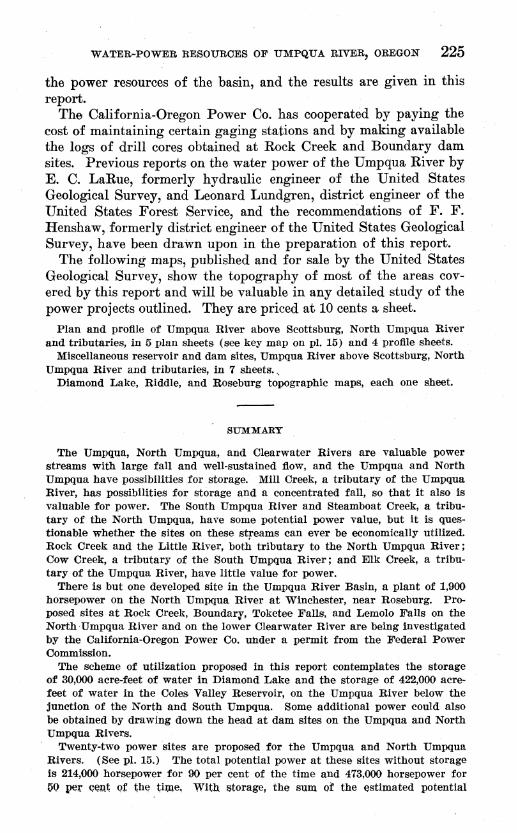
the power resources of the basin, and the results are given in this report.
The California-Oregon Power Co. has cooperated by paying the cost of maintaining certain gaging stations and by making available the logs of drill cores obtained at Rock Creek and Boundary dam sites. Previous reports on the water power of the Umpqua River by E. C. LaRue, formerly hydraulic engineer of the United States Geological Survey, and Leonard Lundgren, district engineer of the United States Forest Service, and the recommendations of F. F. Henshaw, formerly district engineer of the United States Geological Survey, have been drawn upon in the preparation of this report.
The following maps, published and for sale by the United States Geological Survey, show the topography of most of the areas covered by this report and will be valuable in any detailed study of the power projects outlined. They are priced at 10 cents a sheet.
Plan and profile of Umpqua River above Scottsburg, North Umpqua River and tributaries, in 5 plan sheets (see key map on pl. 15) and 4 profile sheets.
Miscellaneous reservoir and dam sites, Umpqua River above Scottsburg, North Umpqua River and tributaries, in 7 sheets.,
Diamond Lake, Riddle, and Roseburg topographic maps, each one sheet.
SUMMARY
The Umpqua, North Umpqua, and Clearwater Rivers are valuable power streams with large fall and well-sustained flow, and the Umpqua and North Umpqua have possibilities for storage. Mill Creek, a tributary of the Umpqua River, has possibilities for storage and a concentrated fall, so that it also is valuable for power. The South Umpqua River and Steamboat Creek, a tributary of the North Umpqua, have some potential power value, but it is questionable whether the sites on these streams can ever be economically utilized. Rock Creek and the Little River, both tributary to the North Umpqua River; Cow Creek, a tributary of the South Umpqua River; and Elk Creek, a tributary of the Umpqua River, have little value for power.
There is but one developed site in the Umpqua River Basin, a plant of 1,900 horsepower on the North Umpqua River at Winchester, near Roseburg. Proposed sites at Rock Creek, Boundary, Toketee Falls, and Lemolo Falls on the North Umpqua River and on the lower Clearwater River are being investigated by the California-Oregon Power Co. under a permit from the Federal Power Commission.
The scheme of utilization proposed in this report contemplates the storage of 30,000 acre-feet of water in Diamond Lake and the storage of 422,000 acrefeet of water in the Coles Valley Reservoir, on the Umpqua River below the junction of the North and South Umpqua. Some additional power could also be obtained by drawing down the head at dam sites on the Umpqua and North Umpqua Rivers.
Twenty-two power sites are proposed for the Umpqua and North Umpqua Rivers. (See pl. 15.) The total potential power at these sites without storage is 214,000 horsepower for 90 per cent of the time and 473,000 horsepower for 50 pel;" cent ():f the time, With storage, the sum of the estimated potential
226 CONTRIBUTIONS TO HYDROLOGY OF UNITED STATES, 1929
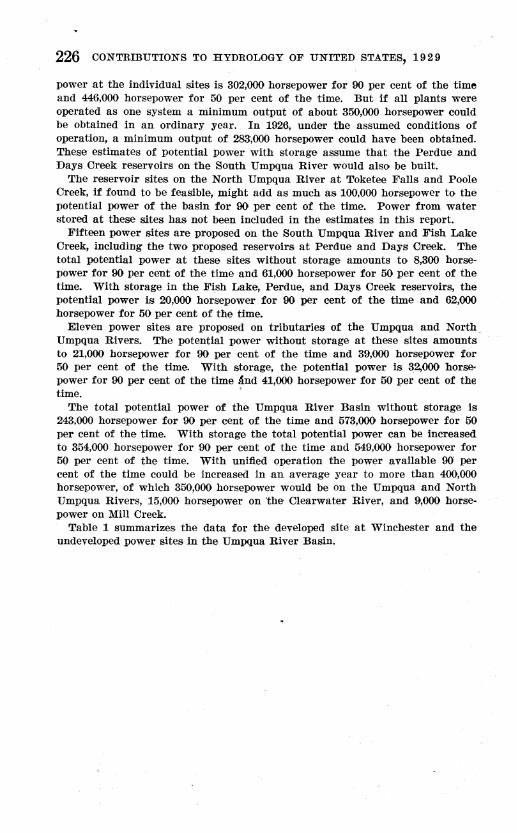
power at the individual sites is 302,000 horsepower for 90 per cent of the time and 446,000 horsepower for 50 per cent of the time. But if all plants were operated as one system a minimum output of about 350,000 horsepower could be obtained in an ordinary year. In 1926, under the assumed conditions of operation, a minimum output of 283;000 horsepower could have been obtained. These estimates of potential power with storage assume that- the Perdue and Days Creek reservoirs on the South Umpqua River would also be built.
The reservoir sites on the North Umpqua River at Toketee Falls and Poole Creek, if found to be feasible, might add as much as 100,000 horsepower to the potential power of the basin for 90 per cent of the time. Power from water stored at these sites has not been included in the estimates in this report.
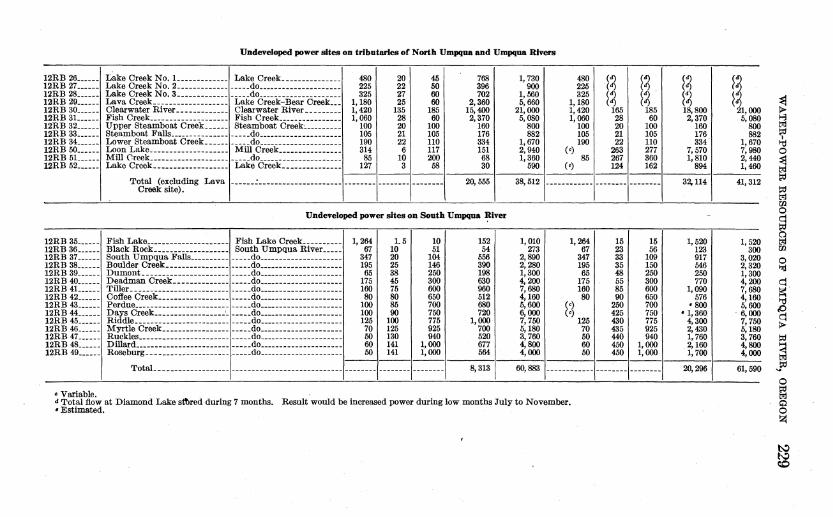
Fifteen power sites are proposed on the South Umpqua River and Fish Lake Creek, including the two proposed reservoirs at Perdue and Days Creek. The total potential power at these sites without storage amounts to 8,300 horsepower for 90 per cent of the time and 61,000 horsepower for 50 per cent of the time. With storage in the Fish Lake, Perdue, and Days Creek reservoirs, the potential power is 20,000 horsepower for 90 per cent of the time and 62,000 horsepower for 50 per cent of the time.
Eleven power sites are proposed on tributaries of the Umpqua and North Umpqua Rivers. The potential power without storage at these sites amounts to 21,000 horsepower for 90 per cent of the time and 39,000 horsepower for 50 per cent of the time. With storage, the potential power is 32,000 horse· power for 90 per cent of the time lind 41,000 horsepower for 50 per cent of the time. '·
The total potential power of the Umpqua River Basin without storage is 243,000 horsepower for 90 per cent of the time and 573,000 horsepower for 50 per cent of the time. With storage the total potential power can be increased to 354,000 horsepower for 90 per cent of the time and 549,000 horsepower for 50 per cent of the time. With unified operation the power available 90' per cent of the time could be increased in an average year to more than 400,000 horsepower, of which 350,000 horsepower would be on the Umpqua and North Umpqua Rivers, 15,000 horsepower on "the Clearwater River, and 9,000 horsepower on Mill Creek.
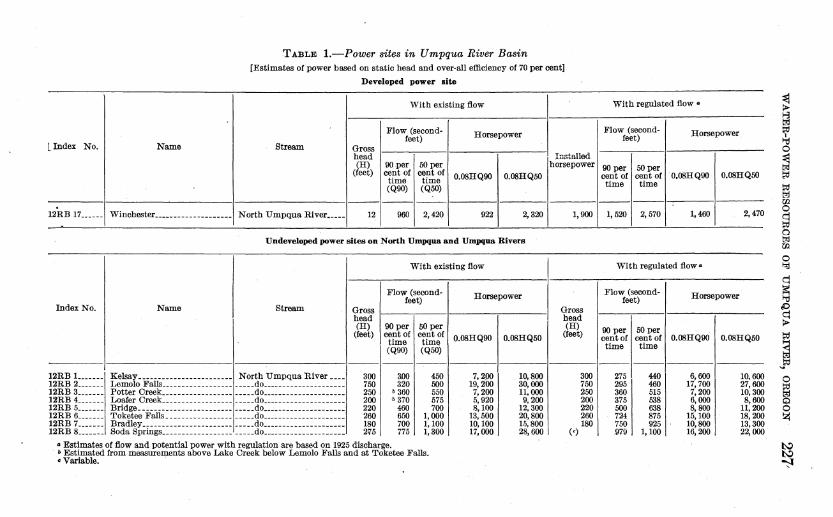
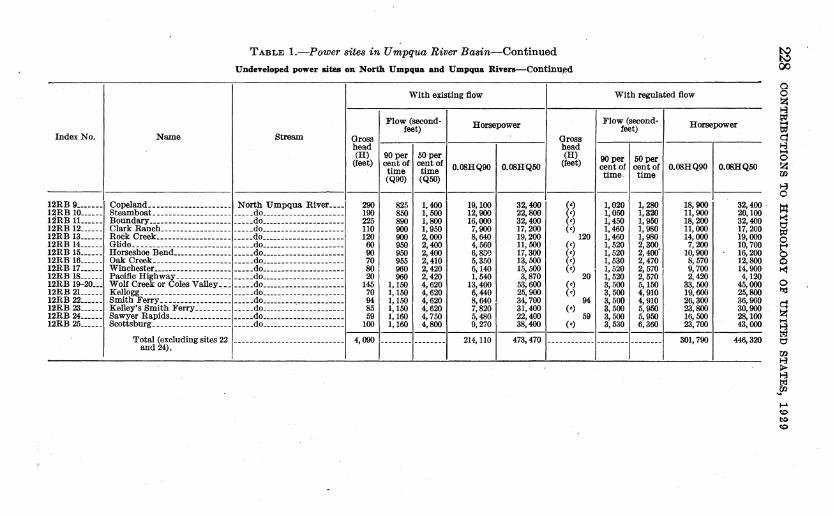
Table 1 summarizes the data for the developed site at Winchester and the undeveloped power sites in the Umpqua River Basin.
Llndex No.
12RB 17 .....• -
Index No.
12RB !__ _____ 12RB 2 •...... 12RB 3 _______ lZRB 4 _______ 12RB 5 _______ 12RB 6 ..•.... 12RB 7 ..•.... 12RB 8 _______
Name
Winchester ..••.........••• ----
Name
:E:~~IoF'aiiS~~================ Potter Creek __________________ Loafer Creek __________________ Bridge _________ ----- _____ -----Toketee Falls _________________
TABLE 1.-Power sites in Umpqua River Basin [Estimates of power based on static head and over-all efficiency of 70 per cent]
Developed power aite
With existing flow
Flow (second- Horsepower feet) Stream Gross
head (H) 90 per 50 per
(feet) cent of cent of 0.08HQ90 0.08HQ50 time time (QOO) (Q50)
---North Umpqua River _____ 12 960 2,420 922 2,320
Undevel-d power sites on North Umpqna and Umpqna Rivers
Stream
North Umpqua River ____ ____ .do .... _________ . _______ _ ___ .do _________________ • ___ _ ___ .do, ______________ . _____ ____ .do ____ ._. _____________ • _____ do ____________ ---------
With existing flow
Flow (secondfeet) Horsepower
~~ 1---~,----11------.--------1 (H) OOper
(feet) cent of time (Q90)
300 300 750 320 250 • 360 200 .• 370 220 460 260 650
50 per cent of time (Q50)
450 500 550 575 700
1,000
0.08HQ90 0.08HQ50
7, 2jlO 10,800 19,200 30,000 7,200 11,000 5,920 9,200 8,100 12,300
13,500 20,800
Installed horsepower
1,900
Gross head (H)
(feet)
300 750 250 200 220 260
Bradley ___ . ___ ---------------- _____ do ________ ------------- 180 700 1,100 10,100 15,800 180 Soda Springs _______________________ do _____________ ----- ___ 21'5 775 1,300 17,000 28,600 (')
• Estimates of flow and potential power with regulation are based on 1925 discharge. • Estimated from measurements above Lake Creek below Lemolo Falls and at Toketee Falls. • Variable. ·
With regulated flow •
Flow (second-feet) Horsepower.
90 per 50 per cent of cent of ·o.osHQOO 0.08HQ50 time time
1,520 2,570 1,460 2,470
With regulated flow•
Flow (secondfeet) Horsepower
90 per 50 per cent of cent of 0.08HQ90 0.08HQ50 time time
275 440 6,600 10,600 295 460 17,700 27,600 360 515 7,200 10,300 375 538 6,000 8,600 500 638 8,800 11,200 724 875 15,100 18,200 750 925 10,800
I 13,300
979 1,100 16,200 22,000
Index No. Name
12RB 9 _______ Copeland _____________________ 1~B 10 ______ Steamboat_ ___________________ 12 B 11 ______ Boundary _____________________ 12RB 12 ______ Clark Ranch __________________ 12RB 13 ______ Rock Creek •• -----------------12RB 14 ______ Glide __________ ----- _____ -----12RB 15 ______ Horseshoe Bend _______________ 12RB 16 ______ Oak Creek ____________________
12RB 17------ Winchester----- _______________ 12RB 18__ ____ Pacific ~hway _ -------------12RB 19-20 ... Wolf Cr or Coles Valley ___ 12RB2L ____
~:9t~\;;.;.y ~ ~~ == = == ==~ ===== =~ 12RB 22 ______ 1l!RB 23------ Kelley's Smith Ferry _________ 12RB 24 ______ Sawyer Rapids ________________ 12RB 25 ______ Scottsburg_-------------------
Totsl (excluding sit!)S 22 and 24).
TABLE I.-Power sites in Umpqua River Basin-Continued
Undeveloped power sites on North Umpqua and Umpqua Rivers--Continulld
Stream
North Umpqua River ____ _ ___ .do ________ -------------_ ___ .do _____________________
----.do ______ ---------------_ ___ .do _____________________ ____ .do _____________________ _ ___ .do _____________________ _ ___ .do __________ --- ______ --_ ---.do __________ ---- __ -----_ ___ .do _____________________ ____ .do _____________________ _ ___ .do _____________________ _ ___ .do ________ -.- ___________ ____ .do _____________________ _ ___ .do _____________________ _____ do _____________________
----------------------------
With existing llow
Flow (secondfeet) Horsepower
~~ 1----.----11-----.-----1 (H) 00 per 50 per
(feet) ~~:f ~~:f 0.08HQ90 0.08HQ50 (Q90) (Q50)
290 825 1,400 19,100 32,400 190 850 1,500 12,900 22,800 225 890 1,800 16,000 32,400 110 900 1,950 7,900 17,200 120 900 2,000 8,640 19,200 60 950 2,400 4,560 11,500 90 950 2,400 6,800 17,300 70 955 2,410 5,350. 13,500 80 960 2,420 6,140 15,500 20 960 2,420 1,540 .3,870
145 1,150 4,620 13,400 53,600 70 1,150 4,620 6,440 25,900 94 1,150 4,620 8,640 34,700 85 1,150 4,620 7,820 31,400 59 1,160 4, 750 5,480 22,400
100 1,160 4,800 9,270' 38,400 ------
4,090 ------·- -------- 214,110 473,470
Gross head (H)
(feet)
~:~ (•
120 (•)
m 20
~:~ 94
(•) 59
(•)
------------
With regulated llow
Flow (secondfeet) Horsepower
90 per 50 per cent of cent of 0.08HQOO O.~Q50 time. time
1,020 1,280 18,900 32,400 . 1,050 1,320 11,900 20,100 1,450 1,950 18,200 32,400 1,450 1,980 11,000 17,200 1,450 1,980 14;000 19,000 1,520 ~:::· 7,200 10,700 1,520 10,900 16,200 1,530 2,470 8,570 12,800 1,520 2,570 9, 700 14,900 1,520 2,570 2,420 4,120 3,500 5,150 33,500 45,000 3,500 4,910 19,600 25,800 3,500 4,910 26,300 36,900 3,500 5,950 23,800 30,900 3,500 5,950 16,500 28,100 3,530 6,360 23,700 43,000
-------- -------- 301,790 446,320
12RB 26 _____ _ 12RB 27------12RB 28 _____ _ 12RB 29 _____ _ 12RB 30 _____ _ 12RB 31__ ___ _ 12RB 32 _____ _ 12RB 33 _____ _ 12RB 34 _____ _ 12RB 50 _____ _ 12RB 51__ ___ _ 12RB 52 _____ _
12RB 35 _____ -12RB 36 ______ 12RB 37------12RB 38 ______ 12RB 39 ______ 12RB 40 ______ 12RB 41__ ____ 12RB 42 ______ 12RB 43 ______ 12RB 44 ______ 12RB 45 ______ 12RB 46 ______ 12RB 47------12RB 48 ______ 12RB 49 ______
• Variable.
Undeveloped power sites on tributaries of North Umpqua and Umpqua Rivers
Lake Creek No. L ____________ Lake Creek ______________ _ Lake Creek No.2------------· _____ do ____________________ , Lake Creek No.3------------- _____ do ____________________ _ Lava Creek ___________________ Lake Creek-Bear Creek __ _ Clearwater River _____________ Clearwater River---------Fish Creek ____________________ Fish Creek _______________ _ Upper Steamboat Creek______ Steamboat Creek~---------Steamboat Falls _______ -------- _____ do ___________ ----------Lower Steamboat Creek ___________ do ____________________ _ Loon Lake____________________ Mill Creek _______________ _ Mill Creek _________________________ do ____________________ _ Lake Creek ___________________ Lake Creek ______________ _
480 225 325
1,180 1,420 1,060
100 105 190 314
85 127
20 22 27 25
135 28 20 21 22 6
10 3
45 50 60 60
185 60
100 105 110 117 200 58
Total (excluding Lava ______ : _____________________ -------- -------- --------Creek site).
768 396 702
2,360 15,400 2,370
160 176 334 151 68 30
20,555
Undeveloped power sites on South Umpqua ~lver
Fish Lake _____________________ Fish Lake Creek __________ 1,264 1. 5 10 152 Black Rock------------------- South Umpqua River _____ 67 10 51 54 South Umpqua Falls __________ _____ do _____________________
347 20 104 556 Boulder Creek ________________ _____ do _____________________ 195 25 146 390
Dumont ______ ----------------_____ do _____________________
65 38 250 198 Deadman Creek--"-----------
____ .do ________ --- __________ 175 45 300 630 Tiller __ -----------------------
_____ do _________ ----- _______ 160 75 600 960 Coffee Qreek __________________ _____ do _____________________ 80 80 650 512
Perdue ___ ---------------------_____ do _____________________ 100 85 700 680 Days Creek __________________ , _ _____ do _______________ • _____ 100 90 750 720
Riddle __________ -------------- _____ do ______________ -· _____ 125 100 775 1,000 Myrtle Creek _________________ _____ do _______________ -- ____ 70 125 925 700 Buckles ___________ --- __ ------- _____ do _____________________
50 130 940 520 Dillard ______ ------------------ _____ do __________ " __________ 60 141 1,000 677 Roseburg ____ ---------_-- __ --- _____ do _____________________
50 141 1,000 564 ---------
Total ___ ---------------- ---------------------------- -------- -------- -------- 8, 313
1, 730 480 900 225
1, tl60 325 5,660 1,180
21,000 1,420 5,080 1,060
800 100 882 105
1,670 190 2,940 (•) 1,360 85
590 (•)
38,512 ------------
1,010 1,264 273 67
2,890 347 2,280 195 1,300 65 4,200 175 7,680 160 4,160 80 5,600 ~:~ 6,000 7, 750 125 5,180 70 3, 760 50 4,800 60 4,000 50
60,883 ------------
• Total flow at Diamond Lake s~red during 7 months. Result would be increased power during low months July to November. • Estimated.
m 1~ 165 185 28 60 20 100 21 105 22 110
263 277 267 360 124 162
-------- --------
15 15 23 56 33 109 35 150 48 250 55 300 85 600 90 650
250 700 425 750 430 775 435 925 440 940 450 1,000 450 1,000
-------- --------
m 18,800 2,370
160 176 334"
7,570 1,810
894
32,114
1,520 123 917 546 250 770
1,090 576
• 800 • 1,360
4,300 2,430 1,760 2,160 1,700
20,296
f~ ~~ 21,000 5,080
800 882
1,670 7,980 2,440 1,460
41,312
1, 520 300
3,020 2,320 1,300 4,200 7,680 4,160 5,600
. 6,000 7,750 5,180 3,760 4,800 4,000
61,590
230 CONTRffiUTIONS TO HYDROLOGY OF UNITElD STATES, 19 2 9
INTRODUCTION
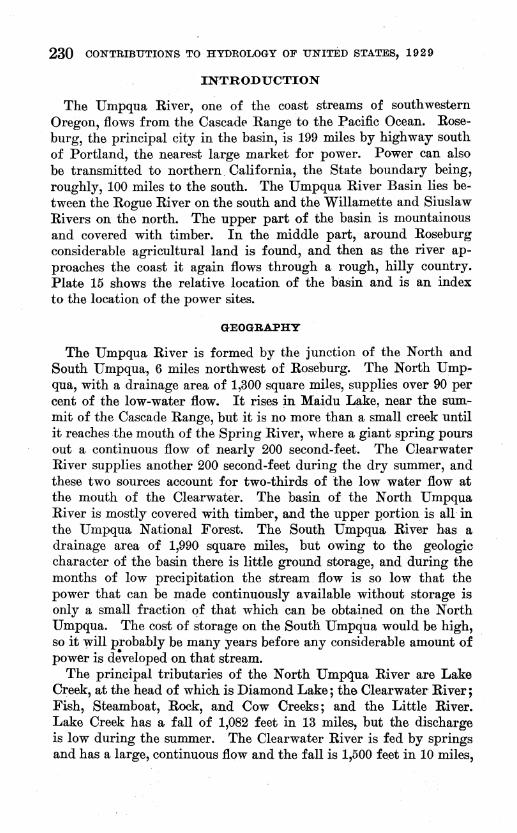
The Umpqua River, one of the coast streams of southwestern Oregon, flows from the CascadP Range to the Pacific Ocean. Roseburg, the principal city in the basin, is 199 miles by highway south of Portland, the nearest large market for power. Power can also be transmitted to northern. California, the State boundary being, roughly, 100 miles to the south. The Umpqua River Basin lies between the Rogue River on the south and the Willamette and Siuslaw Rivers on the north. The upper part of the basin is mountainous and covered with timber. In the middle part, around Roseburg considerable agricultural land is found, and then as the river approaches the coast it again flows through a rough, hilly country. Plate 15 shows the relative location of the basin and is an index to the location of the power sites.
GEOGRAPHY
The Umpqua River is formed by the junction of the North and South Umpqua, 6 miles northwest of Roseburg. The North Umpqua, with a drainage area of 1,300 square miles, supplies over 90 per cent of the low-water flow. It rises in Maidu Lake, near the summit of the Cascade Range, but it is no more than a small creek until it reaches the mouth of the Spring River, where a giant spring pours out a continuous flow of nearly 200 second-feet. The Clearwater River supplies another 200 second-feet during the dry summer, and these two sources account for two-thirds of the low water flow at the mouth of the Clearwater. The basin of the North Umpqua River is mostly covered with timber, and the upper portion is all in the Umpqua National Forest. The South Umpqua River has a drainage area of 1,990 square miles, but owing to the geologic character of the basin there is little ground storage, and during the months of low precipitation the stream flow is so low that the power that can be made continuously available without storage is only a small fraction of that which can be obtained on the North Umpqua. The cost of storage on the South Umpqua would be high, so it will probably be many years before any considerable amount of power is d~veloped on that stream.
The principal tributaries of the North Umpqua River are Lake Creek, at the head of which is Diamond Lake; the Clearwater River; Fish, Steamboat, Rock, and Cow Creeks; and the Little River. Lake Creek has a fall of 1,082 feet in 13 miles, but the discharge is low during the summer. The Clearwater River is fed by springs and has a large, continuous flow and the fall is 1,500 feet in 10 miles,
WATER-POWER RESOURCES OF UMPQUA RIVER, OREGON 231
making it the most valuable power stream among the tributaries. Fish Creek, Steamboat Creek, Rock Creek, and th, Little River have periods o:f low flow that prevent any large possibilities o:f developing power without very expensive storage.
The tributaries o:f the South Umpqua River have characteristics similar to the main stream, the long period o:f low flow precluding any considerable use :for power.
There are some small lakes at the head o:f the South Umpqua River, but they are not large enough to be o:f any great value as reservoir sites.
The principal tributaries o:f the main Umpqua River are Mill Creek and Elk Creek. For several months in summer the discharge o:f Elk Creek is low and its power value is small.
Mill Creek, the outlet o:f Loon Lake, is a stream about 8¥2 miles in length, tributary to the Umpqua River at a point about 20 miles above its mouth. Loon Lake, which covers an area o:f 269 acres at low-water line, is :fed by Lake Creek, a stream roughly 25 miles in length, which has its source in the Coast Range. Loon Lake lies at the lower end o:f a natural reservoir, the flooding o:f which would inundate a considerable area o:f valuable agricultural lands. Lake Creek, which is really the head o:f Mill Creek, :follows a narrow mountain valley that widens into a natural basin around Loon Lake. The course o:f the combined streams throughout is on bedrock, except :for a short distance above Loon Lake. Loon Lake is said by geologists to be the result o:f a great mountain slide that dammed the stream course. Above this lake the stream has little :fall, but below the lake, where it continues as Mill Creek, it drops 300 :feet in a distance o:f about 3 miles. Below this swi:ft stretch the stream is rather sluggish, dropping only 100 :feet in the remaining 5¥2 miles o:f its course. The entire basin is heavily timbered except :for a :few acres o:f marsh in the upper reservoir and except :for the small area adjacent to Loon Lake, which is open and under intensive agricultural development. The ordinary mean annual run-off above Loon Lake could be stored in a reservoir that could be created at the lake, rendering this a valuable power stream. Diamond Lake, at the head o:f Lake Creek is an ideal reservoir site, but the water supply is deficient. ·At Coles Valley, below Roseburg, the topography is :favorable :for
a large reservoir, and the water supply is sufficient, but much valuable land would be overflowed. Probably when a market for power is available the Coles Valley Reservoir will be financially :feasible.
232 CONTRIBUTIONS TO HYDROLOGY OF UNITED STATES, 1929
GEOLOGY'
A description of the geology of numerous reservoir and dam sites examined during the i~vestigation of sites in the Umpqua River Basin involves mention of so many structural features, formations, and types of rocks that a brief summary of the important events in the geologic history of western Oregon and a description of the areal distribution of the chief formations are given.
The known facts of the geologic history of western Oregon before Cretaceous time are meager, for the sediments then laid down have since been completely metamorphosed and now occur as schist, slate, and serpentine. These rocks are exposed along the lower part of the Rogue River in Jackson, Josephine, and Curry Counties. Dam sites in these rocks involve no problem of leakage, and all of them are satisfactory for foundations.
The Cretaceous period was ushered in with great intrusions of granodiorite and other igneous rocks and extensive movements of the crust. During Cretaceous time the northern and central parts of western. Oregon lay below sea level, and on this area were deposited sediments that upon consolidation became conglomerate, .shale, and sandstone. These sediments were then subjected to considerable folding, which has altered their original character and tilted the beds at steep angles. Outcrops of these sediments are seen along the Illinois and Rogue Rivers in Josephine and Curry Counties. Many of the rugged canyons and consequently the sites of large dams and reservoirs are located in the intrusive rocks of this period. In general these intrusive rocks form excellent sites from the point of view of both the geologist and the engineer, and they are as a whole better than the sites in any of the later formations. The gran-. odiorite, diabase, and other intrusive rocks of this period cooled under the weight of overlying sediments and consequently do not have the porous texture and leaky contacts and joints that characterize so many of the later extrusive rocks. Moreover, in crushing strength the intrusive rocks are usually equal to granite and are all sufficiently strong to support large structures.
The chief event during the Tertiary period was the building of the Cascade Range by uplift and volcanic action. The Eocene, or early part of the Tertiary, was a time of deposition and marine invasion, during which extensive beds of sandstone and conglomerate were deposited. Many of the dam sites on the lower Umpqua River are in the sandstone beds of this epoch. Thick dikes and sills of ba-
1 This summary of the geology is based largely upon the numerous publlcatlons of J. S. Diller, which appear as bulletins and geologic folios of the United States Geological Survey.
WATER-POWER RESOURCES OF UMPQUA RIVER, OREGON 233
saltic lava were intruded into the sediments, and in the outcrops of these intrusive rocks are found many of the finest sites on the Rogue River. The sites in the sedimentary rocks of this epoch are generally good, although there may be slight leakage along bedding planes.
During the later half of the Tertiary period, marine deposition continued over the northwestern part of .the State, interrupted by occasional periods of uplift. None of the sites described in this report are located in the sedimentary rocks of this time. However, this epoch together with the Pleistocene was one of the most noteworthy periods of volcanic activity. Numerous volcanoes along the Cascade Mountains poured forth thick flows of lava and emitted showers of pumice. Many of these lava flows coursed down river valleys and partly filled them. Since that time the rivers have excavated portions of these lava fills and formed narrow canyons with vertical walls of lava. Most of this rock is fractured and fissured and commonly covers ancient gravel beds through which impounded water might escape rapidly. In places this combination gives excellent dam sites, so far as purely physical form is considered, but such places are treacherous for storing water because of leakage.
· The pumice deposits of this epoch cover wide areas, especially in the vicinity of Crater Lake, and they form a thick pumice flow in the Rogue River Valley. The misplaced drainage and concealed river channels caused by this epoch of volcanism make reservoir sites in these volcanic deposits hazardous.
In the Pleistocene epoch the high peaks of the Cascades were covered with glaciers, which moved down the valleys of most of the larger streams. During the existence of these glaciers the master streams were overloaded with debris and aggraded their valleys. Later erosion excavated valleys in the glacial gravel, leaving the ren;mants of the fill as terraces. Some of the dam sites are in this material and are consequently poor, because of the amount of excavation necessary to reach bedrock. Diamond Lake, at the head of Lake Creek, is an ideal reservoir site, but the water supply is deficient.
CLIMATE
The climate of the lower and central Umpqua River Basin is mild, the temperature seldom dropping below freezing. Even at Diamond Lake, the highest point at which there would be any works, the winters are not severe, although there is considerable snow.
The amount of annual ra~nfall differs greatly in different parts of the basin. Along the coast it is about 80 inches, but in the Coast Range, a few miles inland, it lis believed to reach 100 inches. Farther upstream, at Roseburg, it drops to 33 inches, and in the Cow Creek Basin, south of Roseburg, it lis 27 inches or less. At the higher alti-
234 CONTRffiUTIONS TO HYDROLOGY OF UNITED STATES, 19 2 9
tudes, on the North and South Umpqua, the rainfall gradually increases to 50 to '75 inches.
In this area, as in all of western Oregon, there is heavy precipitation during the winter and spring, but very little in the summer and early fall. The result is a period of low run-off on streams such as the South Umpqua, which has little ground storage. On the North Umpqua the flow is sustained through the dry summer months by the discharge of large springs, which show little decrease in flow even in very dry years.
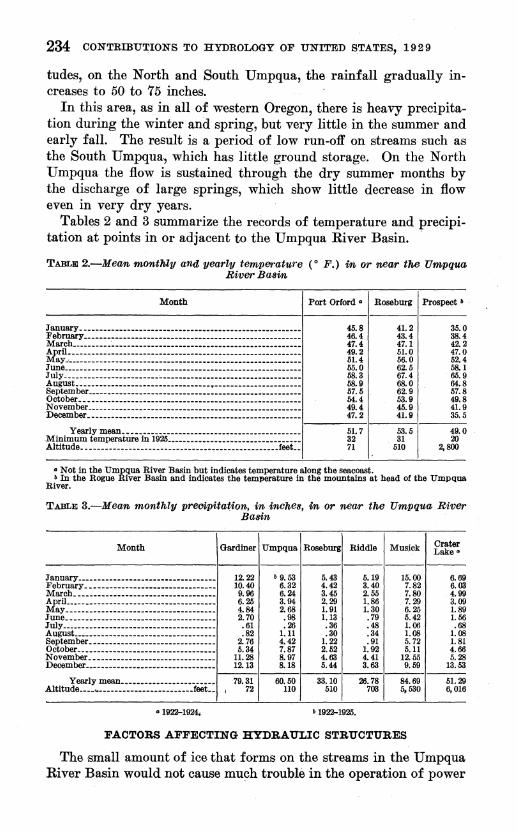
Tables 2 and 3 summarize the records of temperature and precipitation at points in or adjacent to the Umpqua River Basin. ·
TABLE 2.-Mean mont1Uy ana yearly temperature (• F.) m or near the Umpqua River Basm
Month
;r anuary- ------------------------------------------------------February------------------------------------------------------March----------~----------------------------------------------Aprll-----------------------------------------------------------May "-----______ --------------------------- __ ------------------_ June------------------------------------------------------------1 uly-- ----------------------~---------- ------------------------AugusL---------------------------------·----------------------September _____________________________________________________ _ October __________ ----- ______ ---------------------- ___ ------- __ _ November ______ ----- ________ -------------------------------- __ _ December _______ ----- __ ----------------------------------------
Minl~~m::!ture-liii926~::::::::::::::::::::::::::::::::: Altitude _____________________________ -------- __ ----- ______ feet __
Port Orford •
45.8 46.4 47.4 49.2 51.4 55.0 58.3 58.9 57.5 54.4 49.4 47.2
51.7 32 71
Roseburg Prospect •
41.2 35.0 43.4 38.4 47.1 42.2 51.0 47.0 56.0 52.4 62.5 58.1 67.4 65.9 68.0 64.8 62.9 57.8 53.9 49.8 45.9 41.9 41.9 35.5
53.5 49.0 31 20
510 2,800
• Not in the Umpqua River Basin but indicates temperature along the seeccast. • In the Rogue River Basin and indicates the temr;erature in the mounteins at head of the Umpqua
River.
TABLE 3.-Mean. monthly preoi.pitation, in inches, m or near the Umpqua River Basin
Month Gardiner Umpqua Roseburg Riddle Musick Crater Lake•
------------1------------------~~~~--:::::::::::::::::::::::::::::::: i~: . ~: ~ March_----------------------------------- 9. 96 6. 24
5.43 5.19 15.00 6, 69 4.42 3.40 7.82 6.03 3.45 2. 55 7.80 4.99
April-------------------------------------- 6. 25 3. 94 May-------------------------------------- 4. 84 2. 68 June-------------------------------------- 2. 70 • 98
2.29 1.86 7.29 3.09 1. 91 1.30 6.25 1.89 1.13 .79 5.42 1.56
July--------------------------------------- . 61 • 26 August------------------------------------ .82 1.11
.36 .48 1.06 .68
.30 .34 1.08 1.08 September-------------------------------- 2. 76 4.42 October----------------------------------- 5. 34 7. 87
1.22 .91 5. 72 1.81 2.52 1.92 5.11 4.66
November-------------------------------- 11.28 8. 97 4.63 4.41 12.55 5.28 December-----------·---------------------- 12.13 8.18 5.44 3.63 9.59 13.53
1---1---------------AltituX~!:.~~--~---_-_-_-_-_-_-_-_-_-_-_-_-:_--_-_fOOi:: 79' ~ 60i~g 33.10 26.78 84.69 51.29
510 703 5, 530 6,016
• 1922-1924; • 1922-1925 •
FACTORS AFFECTING HYDRAULIC STRUCTURES
The small amount of ice that forms on the streams in the Umpqua River Basin would not cause mu~h trouble in the operation of power
WATER-POWER RESOUR ES OF UMPQUA RIVER, OREGON 235
plants. The upper sections o both the South Umpqua and North Umpqua Rivers are too steep t ·be used for logging, and any floating debris could easily be removed at the d~ms. The rivers carry practically no silt except during floods.
Irrigation does not affect the North Umpqua River, except for some small diversions on tributaries. The tributaries of the South Umpqua bdow Tiller are used for irrigation, .but their flow is small. The summer discharge of Calapooya Creek is also used for irrigation. The total diversions for irrigation, however, are but a small percentage of the summer flow of the Umpqua and North Umpqua Rivers. On the South Umpqua River no exact figures are available, but the extreme low flow at Brockway might be doubled if there were no irrigation, although this is only a guess. Future requirements for diversion will not be great, because there is little land that can be irrigated economically from the North Umpqua and Umpqua Rivers, and the water supply is not very great on the South Umpqua.
Tidewater extends up the Umpqua River as far as Scottsburg, at the head of navigation. The first power site is just above Scottsburg, where the depth of the water at low stages is only about 1 foot. The operation of the power plants would have little effect on navigation below Scottsburg, and this effect would undoubtedly be favorable.
There is not much valuable agricultural land on the Umpqua River below Coles Valley, and the cost of relocating roads and paying for land flooded by proposed reservoirs would be only a small percentage of the total cost of the projects. Coles Valley and the valley of Calapooya Creek constitute a rich agricultural. area, and the cost of storage at the Wolf Creek and Coles Valley sites will be high and may prevent the use of the sites. On both the North Umpqua and the South Umpqua the dams proposed would not cause excessive damage by flooding lands or buildings.
A number of summer homes and a hotel and resort on Diamond Lake have acquired certain rights to the use o:f the lake 'fo~ recreation, but this use would not be precluded by the use of the lake as a reservoir site. Possibly it would be ne~ssary to move some of the cottages back a short distance if the lake were raised 5 feet, but that would be the only expense, and it would be slight.
VARIATION IN STREAM FLOW
Records of stream flow have been obtained on the Umpqua River at Elkton since October, 1905. Records at other points cover much shorter periods, but the comparative run-off at Elkton for these periods gives some idea whether the flow recorded at each station was higher or lower than normal. Likewise the record at Elkton
47154°--30----16
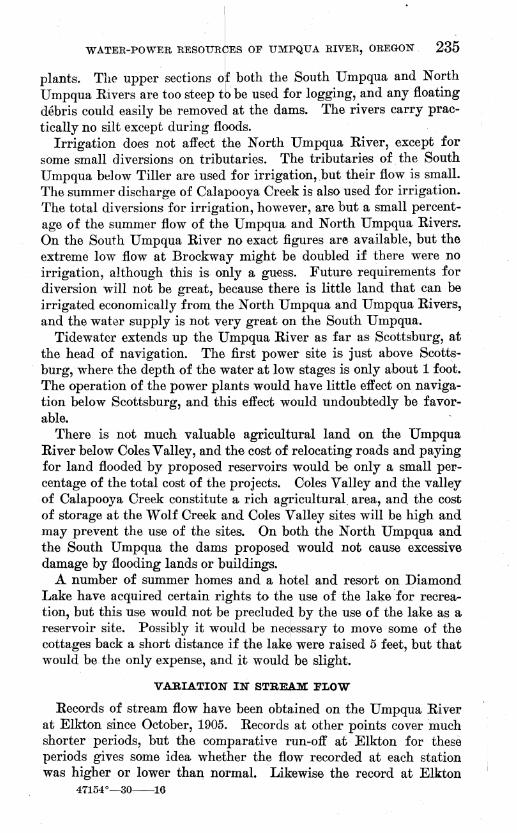
236 CONTltmtrTIONS TO HYDROLOGY O:F UNITED STATES, 19 2 9
has been compared with the longer records on the .Columbia River at The Dalles and the Willamette River at Albany and with the rainfall records. (See fig. 12.) The longest record is that for the
RUN-OFF IN INCHE$ ~NOOOW~NOOOW~NOOOW~NOOOW~ ~~~~~~~~MMMMMNNNNN ---. -~ ·1- •
r- r- t- 1-·1- . --1- .I-
~~- I 1-· -- -r- --. L ~
" - -- -- t- ·t- . """ . > 1"-t-.. ~-~-- . 0::§ "' ....
·~ 6-~ v w \ .... E"li!
-I-" .V" ::;l
r ~- r:::. .:.~- . t--
-~ .... - ~-~
_ .. /
< ...... .... !/ "' -!"--- , ....
L
" - ~-- ,/ > 0::
"' " 2 .., E -1-- "' 1/ "' '\ ..!! t-r--r-
';;:: I'· Ill ~-~ 0
1--~- -~- ., 1- 1---- t:, ..... f' .... iii
L Q)
> 1/ ' 0: __ .... "' ·-r-1-- .]i \ __ ,_
~- E v -- j -.... 8" " L--~ 1--
r-r- t--
I'-. v
!--""'" 1'--
v
I'.
t..-~-""
/
I"
1'..
1-1--
PER CENT OF MEAN
l'3285l:ilRfil ID N 2!
---v~""
1'--
""' I I" I"
""" :""-
...... f-"" -r-~ 1-"""
' I 1: 1-
' L~ ~ r-I a,_
I 1:
\ ~~--~~--1...- S:r-, ...... 1: 1-
'-~ 0 r-...... ~ ~ r:--]t-·:;r-I a': I-
' v 1"-
~ t-
I'
"" ..
-
f-r- 1-
1- f-r- f-1- 1-
t- 1-
1- 1-1- 1-
1- 1-1- 1-1- -1- -
l .s
2 -a 2! = e ~
0
~
2 !:::~~::!:!:1!:l=~Olro S:3H::JNI Nl .:1.:10-Nn~
Columbia River at The Dalles, which began in 1879. This record shows thre_e dry periods prior to 1924. The first was in 1889. For that year few data except the record of the flow of the Columbia
WATER-POWER RESOURCES OF UMPQUA RIVER, OREGON . 237
River at The Dalles are available on which to base an estimate of the dryness. But Weather Bureau reports for 1889 state that the year was very dry r.· eastern Oregon and in the lower Willamette Valley, so it is infe red that this was not an extremely dry year in southwestern Orego , where the Umpqua River is situated, and the records of rainfall bear out this inference. In 1891 the precipitation in western Oregon was 71 per cent of the mean, and in 1924 it was 61 per cent of the mean. These rather meager facts seem to indicate that the flow of the Umpqua River was lower in 1924 than in either 1889 or 1891. The third dry period came in 1905, and for this more information is available. The precipitation was 91 per cent of the mean. The run-off of the Willamette River at Albany was nearly 2 inches greater than in 1924. The Link River at Klamath Falls had a mean annual discharge of 2,140 second-feet in 1905, as compared with 2,230 second-feet in 1906, which was probably about the normal, as in 1906 the mean annual discharge at Elkton was nearly normal. In 1924 so much water was diverted from the Link River above this point that no comparison is possible for that year. It seems probable however, that the run-off of the Umpqua River at Elkton was greater in 1905 than in 1924. Beginning with 1906, records are available for the Umpqua River at Elkton.
Records on the Columbia River since 1879 and the records of precipitation for western Oregon beginning with 1891 show that a very dry year comes on the average once in eight years. In the period of years beginning with 1879 the dry years were 1889, 1891, 1905, 1915, 1924, and 1926. The dryest year was probably 1924. The record of precipitation for western Oregon also shows a continued dry period from 1915 to 1926 and an extremely dry period from 1922 to 1926. (See fig. 12.)
The records available for the Umpqua River cover the dry period from 1915 to 1926, and the estimates of power available are based on the record for this period. The estimates are therefore conservative and probably are somewhat low. From. the records available it can be assumed that a year approaching 1924 in dryness will occur once in 8 or 10 years, and that a drier year may occur only once in a long period, possibly as long· as ·100 years, but that it probably will not greatly exceed 1924 in dr;Yness. ·
The records obtained on the Umpqua River near Elkton are swnmarized in Tables 4 and 5. The Q90 flow is shown to be remarkably consistent, ranging from 1,020 to 1,240 second-feet, except in 1924, when it fell to 790 second-feet, and in 1926, when it was 735 second-feet. The Q50 flow ranged from 3,120 to 10,700 second-f~et, except in 1924, when it fell to 2,040 second-feet, and in 1926, when it
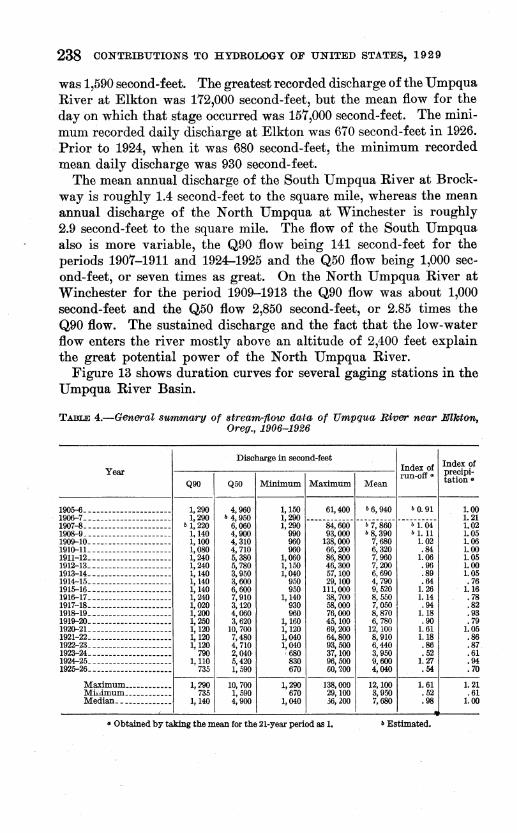
238 CONTRffiUTIONS TO HYDROLOGY OF UNITED STATES, 19 2 9
was 1,590 second-feet. The greatest recorded discharge of the Umpqua River at Elkton was 1'72,000 second-feet, but the mean flow for the day on which that stage occurred was 15'7,000 second-feet. The minimum recorded daily discharge at Elkton was 6'70 second-feet in 1926. Prior to 1924, when it was 680 second-feet, the minimum recorded mean daily discharge was 930 second-feet.
The mean annual discharge of the South Umpqua River at Brockway is roughly 1.4 second-feet to the square mile, whereas the menn annual discharge of the North Umpqua at Winchester is roughly 2.9 second-feet to the square mile. The flow of the South Umpqua also is more variable, the Q90 flow being 141 second-feet for the periods 190'7-1911 and 1924-1925 and the Q50 flow being 1,000 second-feet, or seven times as great. On the North Umpqua River at Winchester for the period 1909-1913 the Q90 flow was about 1,000 second-feet and the Q50 flow 2,850 second-feet, or 2.85 times the Q90 flow. The sustained discharge and the fact that the low-water flow enters the river mostly above an altitude of 2,400 feet explain the great potential power of the North Umpqua River.
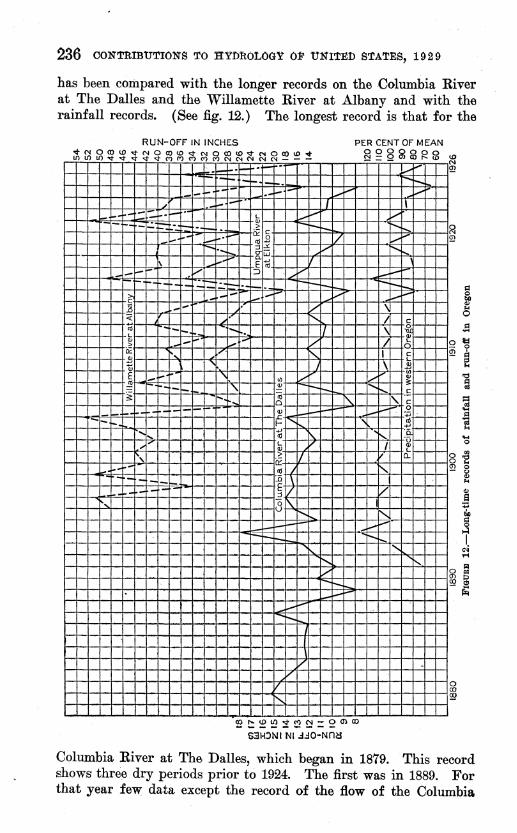
Figure 13 shows duration curves for several gaging stations in the Umpqua River Basin.
TABLE 4.-GeneraZ summary of streamrttow data of Umpqua RWel" near Jfflkton, Oreg., 1906-1926
Year Index of Inde~ !If
1----:-------.-----,---....,---1 run-off. r::;;:El; QOO Q50 Minimum Maximum Mean
Discharge in second-feet
--------1--- ---1----·1----1---------100/HL- -------------------- 1,290 4,960 1,150 61,400 &6,940 b 0. 91 1.00 1906-7---------------------- 1,290 b 4, 950 1,290 _ .. __________
---.-7;860" ----.,-i.-04" 1. 21 1907-8.--------------------- b 1, 220 6,060 1,290 84,600 1.02 1908-9.--------------------- 1,140 4,900 900 93,000 b 8,390 b 1. 11 1.05 1909-10.-------------------- 1,100 4,310 960 138,000 7,680 1.02 1.06 19HHL _ ------------------- 1,080 4, 710 960 66,200 6,320 .84 1.00 1911-12.-------------------- 1,240 5,380 1,060 86,800 7,960 1.06 1.05 1912-13.-------------------- 1,240 5, 780 1,150 46,300 7,200 .96 1.00 1913-14.-------------------- 1,140 3,950 I,040 57,100 6,690 .89 I.05 1914-15.-------------------- I,I40 3,600 950 29,IOO 4, 700 .64 0 76 I9I5-I6. -------------------- I,I40 6,600 950 11I, 000 9,520 1.26 1.16 IOI6-I7- -------------------- I,240 7,910 1,140 38,700 8, 550 1.14 .78 1917-18. -------------------- 1,020 3,120 930 58,000 7,050 .94 .82 19IS..I9.-------------------- 1,200 4,060 960 76,000 8,870 1.18 .93 I9I9-20. -------------------- 1,250 3,620 I,I60 45,IOO 6, 780 .00 .79 1920-21. -------------------- I, 120 10,700 I,I20 69,200 12, IOO 1.6I 1.05 1921-22.-------------------- 1, I20 7,480 I,040 64,800 8, 910 1.18 .86 1922-23.-------------------- 1,I20 4, 710 1,040 93,500 6,440 .86 .87. I922-24.- ------------------- 700 2,040· ,680 37,100 3,950 .52 .61 1924-25.-------------------- 1,110 5,420 830 96,500 9,600 1.27 .94 1925--26.-------------------- 735 1, 500 670 60,200 4,040 .54 .70
------ ------Maximum ____________ 1, 290 IO, 700 1,290 138,000 12,100 1.6I 1. 21 Miuimum ____________ 735 I, 500 670 29,100 3,950 .52 .61
Median._------------ 1,140 4,900 1,040 :i6,200 7,680 .98 1.00
• Obtained by taking the mean for the 21-year period as 1. ' Estlniated.
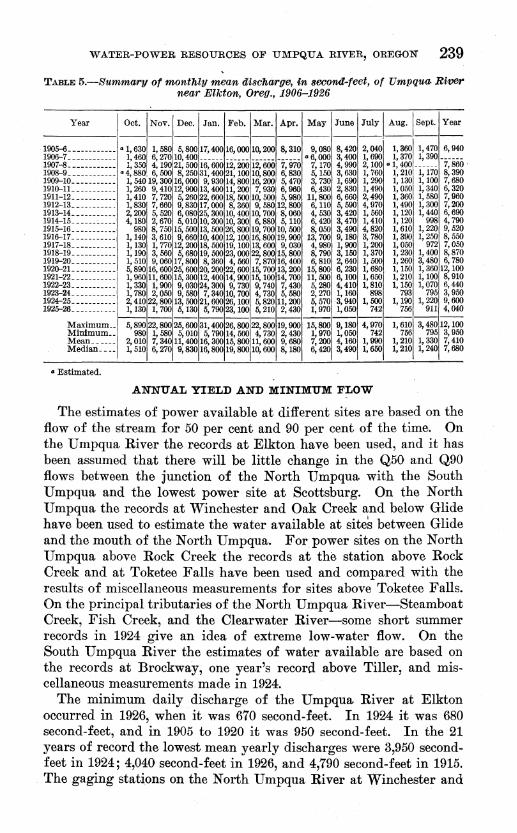
WATER-POWER RESOURCES OF U?.IPQUA RIVER, OREGON 239 '
TABLE 5.-Summa.ry of monthly mean discharge, in second-feet, of Umpqua. Rwer near Elkton, Oreg., 1906-19~6
Year Oct. Nov. Dec. Jan. Feb. Mar. Apr. May June July I Aug., Sept. Year
---- -.-i---'-100/HL ___________ • 1, 630 1, 580 5,800 17,400 16,000 10,200 8, 310 9,080 8,420 2,040 1,360 1,470 6,940 1906-7------------ 1,460 6,270 10,400
i2;200 i2;00ii -,.;ii7o • 6,.000 3,400 1,690 1,370 1,390 ·;;;siio 1907-8.----------- 1, 350 4,190 21,500 16,600 7,170 4,900 2,100 ·gro 1908-9.----------- • 4, 880, 6, 500 8,250 31,400 21,100 10,800 6,830 5,150 3,630 1, 760 1, 170 8,390 1909-10.---------- 1, 540 19, 300 16,000 9,930 14,800 I6, 200 5,470 3, 730 I,690 1,290 1,130 I,IOO 7,680 I910-1L __________ 1,260 9,410 I2, 900 13,400 11,200 7,930 6,960 6,.430 2,830 1,490 1,050 I,340 6,320 1911-12.---------- 1,410 7, 720 5,260 22,600 IS, 500 IO, 500 5,980 11,800 6,660 2,490 1,360 I, 580 7,960 I9I2-13. ---------- 1,830 7, 660 9,830 17,000 8,360 9,580 12,800 6,110 5,590 4,970 1,490 I,300 7,200 I913-14. ---------- 2, 200 5, 520 6,080 25,300 10,400 IO, 700 . 8,060 4,530 3,420 I, 560 I,120 I,440 6,690 I9I4-15. _____ , ____ 4, I80 2,670 5,010 10,300 I0,300 6,880 5, 110 6,420 3, 470 1,410 I,120 998 4, 790 19I5-16. ---------- 980 8, 750 15, 500 13,500 26,800 I9, 700 10,500 8,050 3,490 4,820 I,610 I,220 9,520 I91&-17- ---------- 1, 140 3, 610 9,660 10,400 12,100 16,800 I9, 900 I3, 700 9,I80 3, 780 I, 390 I,250 8,550 1917-18.---------- I,130 1, 770 12,200 18, 500 19,IOO 13,600 9,030 4,980 I, 900 I,200 1,050 972 7,050 I918-19. ---------- 1,IOO 3, 560 5,680 19,500 23,000 22,800 15,800 8,790 3, I50 I,370 1,230 1,400 8,870 1919-20.---------- 1, 510 9, 060 17,800 8,360 4,560 7,870 16,400 6, 810 2,640 I, 500 1,260 3,480 6,780 1920-21_ __________ 5, 800 16, 600 25,600 20,200 22,600 I5, 700 I3, 200 15,800 6,230 1,680 1,150 I,360 12, 100 1921-22.---------- 1, 960 11, 600 15,300 12,400 I4,900 15, IOO 14,700 11,500 6,100 1,650 1,210 1,100 8,910 192Z.23_ ---------- 1, 330 1, 900 9,030 24,300 9, 730 9, 740 7,430 5,280 4,410 I,.810 1,150 1,070 6,440 I923-24. ---------- 1, 780 2,050 9,580 7,340 IO, 700 4, 730 5,580 2,270 I, 160 898 793 795 3,950 1924-25.---------- 2, 410 22, 800 13,500 21,600 26,100 5,820 11,200 5, 570 3,940 1, 500 1, I90 I,220 9,600 1925-26. -------·--- 1,130 1, 700 5, I30 5, 790 23, IOO 5, 210 2,430 1,970 I,050 742 756 911 4,040
------------ - ------------Maximum __ 5,800 22,800 25,600 3I,400 26,800 22,800 I9, 900 15,800 9,180 4,970 I,610 3,480 I2, 100 Minimum __ 980 1, 580 5,010 5,790 14, 560 4, 730 2,430 1,970 1,050 742 756 795 3,950 Mean ______ 2,0IO 7,340 11,400 16,300 15,800 11,600 9,680 7,200 4, I60 1,900 1,2IO I,330 7,410 Median ____ 1,5IO 6,270 9,830 16,800 I9,800 10,600 8, I80 6,420 3,490 1,650 1, 210 1,240 7,680
• Estimated.
ANNUAL YIELD AND MINIMUM FLOW
The estimates of power available at different sites are based on the flow of the stream for 50 per cent and 90 per cent of the time. On the Umpqua River the records at Elkton have been used, and it has been assumed that there will be little change in the Q50 and Q90 flows between the junction of the North Umpqua with the South Umpqua and the lowest power site at Scottsburg. On the North Umpqua the records at Winchester and Oak Creek and below Glide have been used to estimate the water available at sites between Glide and the mouth of the North Umpqua. For power sites on the North Umpqua above Rock Creek· the records at the station above Rock Creek and at Toketee Falls have been used and compared with the results of miscellaneous measurements for sites above Toketee Falls. On the principal tributaries of the North Umpqua River-Steamboat Creek, Fish Creek, and the Clearwater River-some short summer records in 1924 give an idea of extreme low-water flow. On the South Umpqua River the estimates of water available are based on the records at Brockway, one yea.r's record above Tiller, and miscellaneous measurements made in 1924.
The minimum daily discharge of the Umpqua River at Elkton occurred in 1926, when it was 670 second-feet. In 1924 it was 680 second-feet, and in 1905 to 1920 it was 950 second-feet. In the 21 years of record the lowest mean yearly discharges were 3,950 secondfeet in 1924; 4,040 second-feet in 1926, and 4,790 second-feet in 1915. The gaging stations on the North Umpqua River at Winchester and
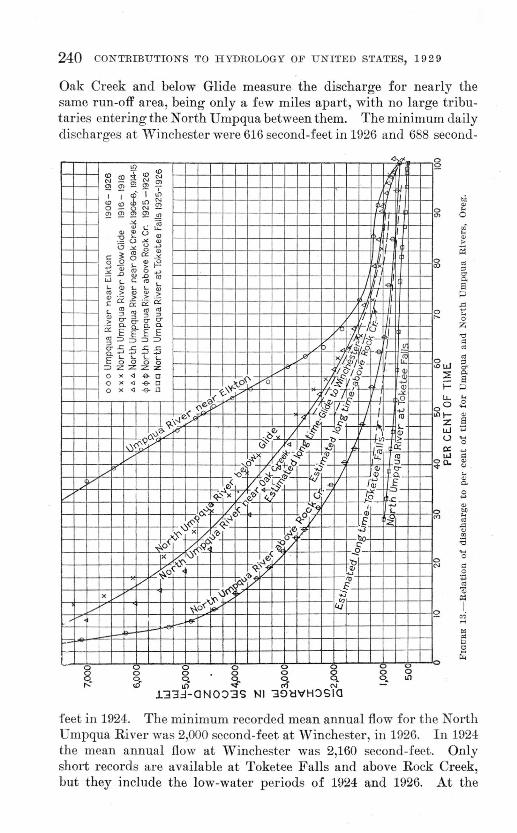
240 CONTRIBUTIONS TO HYDROLOGY OF UNITED STATES, 19 2 9
Oak Creek and below Glide measure the discharge for nearly the same run-off area, being only a few miles apart, with no large tributaries entering theN orth Umpqua between them. The minimum daily discharges at Winchester were 616 second-feet in 1926 and 688 second-
- r-1-
- I-1-- I-1-- I-1-- I-1-- 1-'-1-- I-1-- r-1-
- r-1-
- I-I-- I-I-- I-I-- - I-- - I-- - I-,_ - r-- - r-- - r-
v c'_
/
~-
a
.:;
!!2 <D (!J co::!<DN
!¥ N ~~~~ Ql <{ I I ctJ' I Ul
<D <D<htn~ ~ 0 - oN-<:!! 222?~tll
~..: ~ I ~ e u CJ I ·- u ~ Q) r-\3,:.::.0-+o>
c~c3&~ b _s.2~~t2 ~X ~~~_g~ W~Cro I r ~ ~ ~ ~ ~ ) Q) ·- > > .~ cacxcx:o:: 1111 ,( @ ~ ~ ~ ~ .?: g Kg g: V' ~-ex: E E E E /, (.)
~=>;:::~:=>:::> p l{;c:.l~ g cr£..c..c:..c a.....>-'t+' i<f E ~ 5 o ~ V'
></'II J! Ff r-- &I-=>ZZZZ
/ /v;o '_$1-0 )( <3 .e. c
... ._o" / 0 11.·'1;§'- -0 )( <3 -& a ox<J-e-0 ~\'f-/ r.t~ ~ ~ ~---
/
X/
__.
< ~I-I <'!:'i>P"' 'J.$ ;.J 1 1
I I ~,-.~e.~ IJ' .;0 ~ J o;l-6,v~>/ro oru / .§' -S? ~~ ~I-
,)<0.~ / c}' .. ;::"" ..":t>-7, - ~ ~I-a::
/
~~~~~r~ ·~ ~ Ill
'J,"'+ll, - :.:§' Q; 5.-1->.j "' I <V 0.1-ru -:_~-1--IJ .., . ,....,
!-1-
~Q ~ "~/ J -7- :;S -1-
< o" <l! L
~ £ ::z: "' .J.ru'./
.;:; ,._; 0 ~ o<( .~/
"~v«' ru</ -S? "'(\ . .J. 1:>
A< ~'/ q, ~0 '1> -;o V ['-» / .§ ~~~ .....
>v'<' p ~o<: ;....-~
or-r-
0 a a a
~ ~ ~ ~ ~ a a o. Ill
J.'3'3.:!-GN0:>3S Nl '3~HiVH:::>SIQ
0 0
tiJ "' 0 ...
a> 0
Ji ... - "' ,..
iil 0 d <X)
"' s: 8 p
0 il " ,... 0 z "" " "'
- Sw "' " "' --
::::!: 0. 8 i= p
- u.. ... 00
0 .... --
tnt- "' z 8 LLJ :p
- (.) .... 0
ex: '::l LU - ~ 0. <1>
<>
" - <1> 0.
- 0 ... -"' 0 00
c<l " "' "" ~ ;o ....
0 0
('J " ~ "' Oi ~
0 I
o-; .-<
" "' p
s P< a
feet in 1924. The minimum recorded mean annual flow for the North Umpqua River was 2,000 second-feet at Winchester, in 1926. In 1924 the mean annual flow at Winchester was 2,160 second-feet. Only short records are available at Toketee Falls and above Rock Creek, but they include the low-water periods of 1924 and 1926. At the
WATER-POWER RESOURCES OF UMPQUA RIVER, OREGON 241
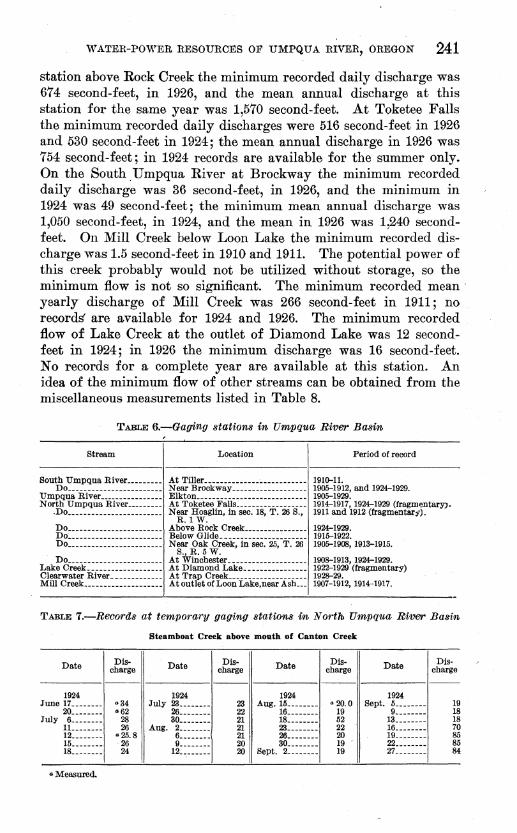
station above Rock Creek the minimum recorded daily discharge was 674 second-feet, in 1926, and the mean annual discharge at this station for the same year was 1,570 second-feet. At Toketee Falls the minimum recorded daily discharges were 516 second-feet in 1926 and 530 second-feet in 1924; the mean annual discharge in 1926 was 754 second-feet; in 1924 records are available for the summer only. On the South Umpqua River at Brockway the minimum recorded daily discharge was 36 second-feet, in 1926, and the minimum in 1924 was 49 second-feet; the minimum mean annual discharge was 1,050 second-feet, in 1924, and the mean in 1926 was 1,240 secondfeet. On Mill Creek below Loon Lake the minimum recorded discharge was 1.5 second-feet in 1910 and 1911. The potential power of this creek probably would not be utilized without storage, so the minimum flow is not so significant. The minimum recorded mean · yearly discharge of Mill Creek was 266 second-feet in 1911; no records' are available for 1924 and 1926. The minimum recorded flow of Lake Creek at the outlet of Diamond Lake was 12 second,.. feet in 1924; in 1926 the minimum discharge was 16 second-feet. No records for a complete year are available at this station. An idea of the minimum flow of other streams can be obtained from the miscellaneous measurements listed in Table 8.
TABLE 6.-Gaging station& in. Urrvpqua River Basin.
Stream Location Period of record
South Umpqua River _________ At Tiller-------------------------- 1910-11. Do ________________________ Near Brockway ___________________ 1905-1912, and 1924-1929. Umpqua River ________________ Elkton ____________________________ 1905-1929. North Umpqua River _________ At Toketee Falls __________________ 1914-1917, 1924-1929 (fragmentary) •
. Do ________________________ Near Hoaglin, in sec. 18, T. 26 S., 1911 and 1912 (fragmloZltar;l"). R.1 w.
Do________________________ Above Rock Creek---------------- 1924-1929. Do~----------------------- Below Glide _______________ :______ 1916-1922. Do________________________ Near Oak Creek, in sec. 25, T. 26 1901>-1908, 1913-1915.
Do________________________ Atw~ct.:e. __ ------------------ 1908-1913, 1924-1929. Lake Creek------------------- At Diamond Lake ________________ 1922-1929 (fragmentary) Clearwater River _____________ At Trap Creek ____________________ 1928-29. Mill Creek____________________ At outlet of Loon Lake,near Ash___ 1907-1912, 1914-1917.
TABLE 1.-Reoords at temporary gaging statiOn& in Nortlb Urrvpqua River Basin
Steamboat Creek above mouth of Canton Creek
Date Dis- Date Dis- Date Dis- Date Dis-charge charge charge charge
1924
u~------1924 1924
June 17 ________ 4 34 July 23 Aug. 15 ________ • 20.0 Sept. 5 ________
19 20 ________ G62
26 ________ 22
16 ________ 19
9 ________ 18
July 6-------- 28 ao ________ 21
18 ________ 52
13 ________ 18 u ________ 26 Aug. 2 ________
21 23-------- 22 16 ________ 70 12 ________ 4 25.8 6-------- 21 26-------- 20 19 ________ 85 15 ________
26 9 ________ 20 ao ________ 19 22 ________
85 18 ________ 24 12 ________ 20 Sept.
2 ________ 19 27 ________ 84
•Measured.
242 CONTRIBUTIONS TO HYDROLOGY OF UNITED STATES, 19 2 9
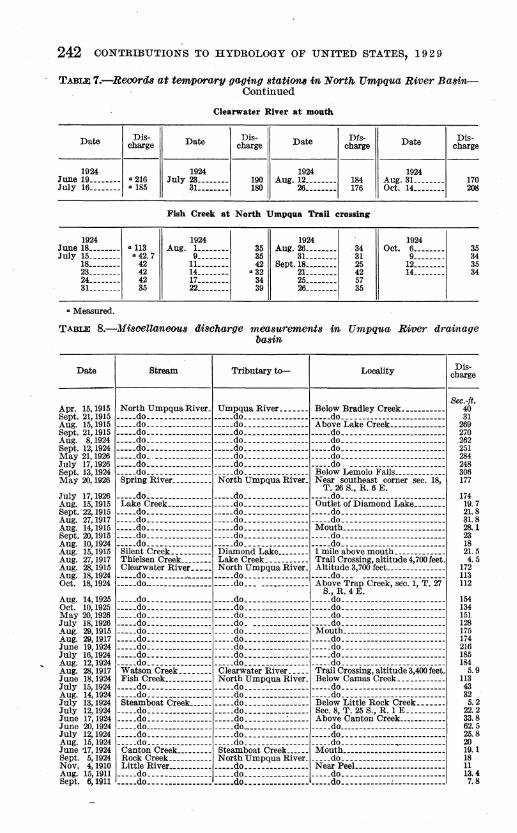
TABLlll 7.-Beoord8 at tempor-arv gaging stauom ln North Umpqua River BasflnContinued
Date
1924
Discharge
June 19........ • 216 July 16........ • 185
1924 June 18 .•••••.. July 15 .•••..••
18 ....... . 23 ....... . 24 •..•.... 3L ..... .
• Measured.
•113 • 42.7
42 42 42 35
Clearwater River at mouth
Date
1924 July 23 ••••••••
31. •••••••
Discharge Date
1924
Drscharge
190 Aug. 12........ 184 180 26........ 176
Fish Creek at North Umpqua TraU crossing
1924 Aug. 1. •••••••
9 •••••••• 11 •••••••• 14 •••••••• 17 •••••••• 22 ••••••••
35 35 42
• 32 34 39
1924 Aug. 26 .....••.
31. ...•••• Sept.18 .••.••••
21. ...•••• 25 ..•.•.•. 26 .••••.••
34 31 25 42 57 35
Date
1924 Aug. 31. ••••••• Oct. 14 ••••••••
1924 Oct. 6 ••••••••
9 ••• "~·-·· 12 •••••••• 14 •••.....
Dis· charge
170 201!
35 34 35 34
TABLE 8.-MisceZZaneous tUscharge measurements in Umpqua. Riloor drOiiinage basin
Date
Apr. 15, 1915 Sept. 21, 1915 Aug. 15, 1915 Sept. 21, 1915 Aug. 8,1924 Sept. 12, 1924 May 21,1926 July 17,1926 Sept. 13, 1924 May 20,1926
July 17,1926 Aug. 15, 1915 Sept. 22, 1915 Aug. 27, 1917 Aug. 14, 1915 Sept. 20, 1915 Aug. 10, 1924 Aug. 15, 1915 Aug. 27, 1917 Aug. 28, 1915 Aug. 18,1924 Oct. 18, 1924
Aug. 14,1925 Oct. 10, 1925 May 20,1926 July 18, 1926 Aug. 29, 1915 Aug. 29, 1917 June 19, 1924 July 16, 1924 Aug. 12, 1924 Aug. 28, 1917 June 18, 1924 July 15, 1924 Aug. 14, 1924 July 13, 1924 July 12, 1924 June 17, 1924 June 20, 1924 July 12, 1924 Aug. 15, 1924 June 17, 1924 Sept. 5, 1924 Nov. 4,1910 Aug. 15, 1911 Sept. 6, 1911
Stream Tributary to- Locality
North Umpqua River. Umpqua River....... Below Bradley Creek.···-------••••. do •. __ •••.••• __ .•.. _ .•• do .. __ ••••••••••••..•.• do ......... _. _. __ .•••.•.•.•. ••••• do ••••.•............... do................ Above Lake Creek •••••.•••••••• -·--.do .•.•.••• __ •.• __ .••••. do._ •••••. ·--...•.••••. do •••••.••.••••••••.•• __ •.•. ••••. do. __ .• ····--·---· ..••• do ..••..••••••••••••••. do._ •••............••.••.... ••••. do •••••••••••••••...... do ..•..••••••••••...... do .•• _ •.•..••.....•••....... ••••. do •.••• --------··· ..... do •••• ------------ ..•.• do ......•.•.•.•...•••....... ••••• do •••••.....•.•........ do .•. ------------- ....• do . . •..............•....... ...•. do •••••...•.••......... do .....••••••••••. Below Lemolo Falls ............ . Spring River........... North Umpqua River. Near southeast corner sec. 18,
T. 26 S., R. 6 E • .•••. do •••••.••...•......... do .•• _-----------· ••••. do ..•.•••.••••••• ------·----Lake Creek .•.............. do •.•••••••••••••. Outlet of Diamond Lake ......••
..••. do ....• ----------· ..••. do •.•• ------------ ..... do ..•.••....•.•.•..••••••••.
...•• do •...• ---------·- .•••. do .••••........... ~--·.do .•.••....•..•....••••.•••. • ---.do •••••..••.••••.....•. do ...••...... _. _. _ Mouth ..• _._. __ ._._._ .. _. ____ ... ••••• do ••••.•..•.•.•........ do ....•.........•.....• do .••.. ··--·-······-·------· ----.do ...•....•..••••...... do ..•.................. do ......................... . Silent Creek •.•••••••. Diamond Lake ••••.... 1 mile above mouth ............ . Thielsen Creek .•.••••• Lake Creek •.......... Trail Crossing, altitude4,700feet. Clearwater River ••••• North Umpqua River. Altitude 3,700 feet .•.••.......•••
••••. do •• -------~----- •••.. do ....•.•.....••.••.•.. do... • ............•••.••.. ••••• do ________________ ••••. do .•. ------------ Above Trap Creek, sec. 1, T. 27
· S., R. 4 E . .••.. do .•••. ----------- ••••. do ..•• ------------ ••••. do .••••••••.••....•••••.•••. ..••. do ...•. ----------- ••••. do .•.• --------···- ..... do ..•. ····"················· ..••. do .... -----------· •••.. do ••••••....•..... ----.do ..... ·-·-·····---------------"do •••••.....•...•...... do ••.......•.••••..•.. do ..•••.•.•.•••....••••••.•. ----.do •••• ------------ ..... do .• _._--------··· Mouth ........•........••.....•. ----.do •.•• ------------ ..•.. do ••••• ----------· ..•.. do ................•......... ••••• do •..••••••••.••••..•.. do •••••••••............ do ......•.......•••.......•. ••••• do .••• ------------ .••.. do ••••••••••........... do .•..........•.•.•......... .•••• do .•..• ----------· •••.. do •••.•................ do ........•...•••.•.......•. Watson Creek........ Clearwater River..... Trail Crossing, altitude 3,400 feet. Fish Creek •••••••••••• North Umpqua River. Below Camas Creek •••.••••••••
••••. do ...•• __ ••• _._ .•...•.. do .. _ .... __ .•••••...... do ..••......•••••••••••• ---. .•••• do ...• _ .••....••••..... do. __ .• ----------- ..•.. do .•..........••• -----------Steamboat Creek ....••..•.. do •••••••••••.•... Below Little Rock Creek ••••••.
:::::~~:::::::::::::::: :::::~~: ::::::::::::::: ~~o:e ~a;~:xi· ~~k~-~::::::::: ....• do .••...... ___ .......•.. do ___ .. __ .....•••.....• do ....•.••••.•..•............ . __ .. do ...••••••• __ •.•...... do .......• __ •••••..•••. do •••••••••.•..•••• __ ..• __ .. ••.•. do ....• -------···· ..... do .•..•.•.•.••....•.•.. do ..••• --------~-----------Canton Creek......... Steamboat Creek...... Mouth .. ---------------------·-· Rock Creek .••••...... North Umpqua River ...... do •••••••••••.•••••••.....•. Little River ••••••••••..•••• do .•••• ---------'· Near PeeL •• ___________________ _
..... do ••••• __ ...•.•...••••. do •••••..• ----••••....• do •••••••••••••...•••.•.••• -_____ do ••• _------------ ••••• do. ___ ------------ _____ do. ___ --------~-------------
Dis· charge
Sec.,(t. 40 31
269 270 262 251 284 248 306 177
174 19.7 21.8 31.8 28.1 23 18 21.5 4.5
172 113 112
154 134 151 128 175 174 216 185 184
5.9 113 43 32 5.2
22.2 33.8 62.5 25.8 20 19.1 18 11 13.4 7.8
WATER-POWER RESOURCES OF UMPQUA RIVER, OREGON 243
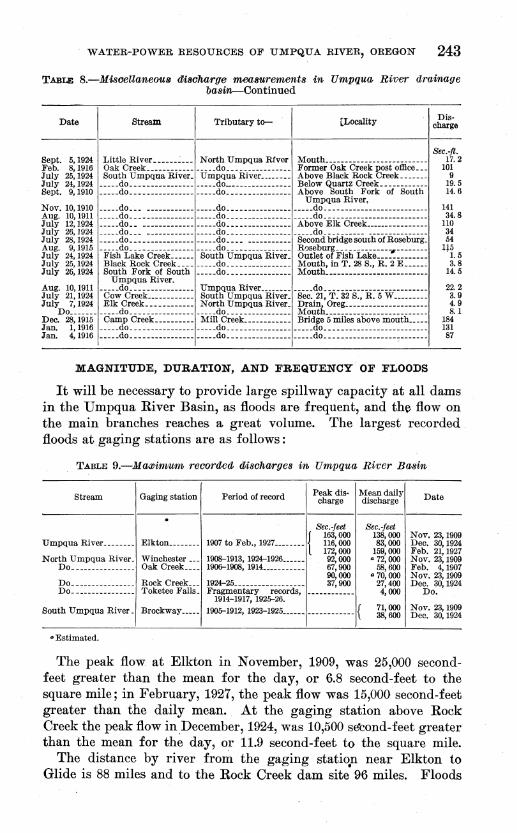
TABLE 8.-MisoeUaneous discharge mealtUrements in Umpqua Ri1>er drainage basin-Continued
Date
Sept. 5, 1924 Feb. 8,1916 July 25, 1924 July 24, 1924 Sept. 9, 1910
Nov. 10, 1910 Aug. 10, 1911 July 12, 1924 July 26, 1924 July 28, 1924 Aug. 9,1915 July 24, 1924 July 25, 1924 July 26, 1924
Stream Tributary to-
Little River·-----~--- North Umpqua Rfver Oak Creek ____________ ....• do _______________ _ South Umpqua River. Umpqua River _______ _
..... do .• _._---------- _____ .do ______ ----------_____ do._ ••• ----------- ____ .do •• _ •• -----------
(Locality Dis· charge
Sec.-ft. Mouth.......................... 17. 2 Former Oak Creek post office... 101 Above Black Rock Creek....... 9 Below Quartz Creek____________ 19.5 Above South Fork of South 14. 6
Umpqua River. ____ .do._. ------------ .•••. do. ___ ------------ .•••• do .• _.---------------------- 141 ____ .do._ •• ------------ ____ .do. ____ ----------- ____ .do. ____ --------------------- 34. 8 .••.. do .. ------------- ..••• do ________________ Above Elk Creek________________ 110 .•••• do ..• ------------ ..••• do _____________________ do __________ --------------- 34 ..••. do ________________ ..... do .... ----------- Second bridgesouthofRoseburg. 54 ...•. do.--------------- ..... do .. -------------- Roseburg.-------------...-------- 1~5 Fish Lake Creek...... South Umpqua River. Outlet of Fish Lake............. 1. 5 Black Rock Creek .... _____ do ________________ Mouth, in T. 28 S., R. 2 E...... 3.8 South Fork of South _____ do .••••• -----~---- Mouth ••• ----------------------- 14.5
Umpqua River. Aug. 10,1911 ..... do ________________ Umpqua River ________ ...•. do .. ------------------------ 22.2 July 21,1924 Cow Creek ____________ South Umpqua River. Sec. 21, T. 32 S., R. 5 W_________ 3. 9
JulyDo~~~~~- -~~~~~-~-_:::::::::: .:-:~~~~~~~~~~~~~: ~~~h-~~~::::::::::::::::::::: §: ~ Dec. 28,1915 Camp Creek •••••••••• Mill Creek ____________ Bridge 5 miles above mouth_____ 184 Jan. 1,1916 ..... do ________________ ....• do _____________________ do__________________________ 131 Jan. 4,1916 ..... do ________________ ..... do ________________ ..••. do·-----------------~------- 87
MAGNITUDE, DURATION, AND FREQUENCY OF FLOODS
It will be necessary to provide large spillway capacity at all dams in the Umpqua River Basin, as floods are freqU:ent, and the flow on the main branches reaches a great volume. The largest recorded floods at gaging stations are as follows :
TABLE 9.-MaJJimum recorded, rliisoharges in Umpqua River Basin
Stream Gaging station Period of record Peak dis- Mean daily Date charge discharge
. Sec.-feet Sec.-feet
{ 163,000 138,000 Nov. 23,1909 Umpqua River ________ Elkton ________ 1907 to Feb., 1927 ________ 116,000 83,000 Dec. 30, 1924
North Umpqua River. Winchester ___ 172,000 159,000 Feb. 21, 1927
1908-1913, 1924-1926 ______ 92,000 • 72,000 Nov. 23,1909 Do.--------------- Oak Creek .... 1906-1908, 1914 ___________ 67,900 58,600 Feb. 4,1907
Do.--------------- Rock Creek. __ 90,000 • 70,000 Nov. 23, 1909
1924-25.----------------- 37,900 27,400 Dec. 30, 1924 Do.--------------- Toke tee Falls_ Fragmentary records, ------------ 4,000 Do.
1914-1917, 1925-26. South Umpqua River_ Brockway _____ 1905-1912, 1923-1925 ______ ------------ { 71,000 Nov. 23, 1909
38,600 Dec. 30, 1924
• Estimated.
The peak flow at Elkton in November, 1909, was 25,000 secondfeet greater than the mean for the day, or 6.8 second-feet to the square mile; in February, 1927, the peak flow was 15,000 second-feet greater than the daily mean. At the gaging station above Rock Creek the peak flow in _December, 1924, was 10,500 socond-feet greater than the mean for the day, or 11.9 second-feet to the square mile.
The distance by river fro~ the gaging statio_n near Elkton t~ Glide is 88 miles and to the Rock Creek dam site 96 miles. Floods
244 CONTRIBUTIONS TO HYDROLOGY OF UNITED STATES, 1929
on the Colorado River travel downstream at a rate of 12 to 15 miles an hour and possibly at times exceed 20 miles an hour. At 12 miles an hour the floods would travel from Rock Creek to the gaging station near Elkton in eight hours. As the fall per mile averages higher on· the North Umpqua River than on the Colorado River below Lees Ferry, Ariz., it seems safe to assume that floods would travel downstream at a rate as great as ordinary floods on the Colorado River. The records at the gaging stations confirm these conclusions, as high water seems to occur on the same day near Glide on the North Umpqua River, on the South Umpqua River near Brockway, and on the Umpqua Riv:er near Elkton. A flood at Elkton would probably mean a flood at Glide on the same day, and owing to the small size of the basin a high flood probably would not occur at Elkton, except through general flood conditions over the basin. In November, 1909, when the meim daily discharge near Elkton amounted to 138,000 second-feet, 71,000 second-feet came from the South Umpqua River and about 72,000 second-feet from the North Umpqua River: above Winchester. The total estimated discharge of the North Umpqua and South Umpqua Rivers therefore exceeded the estimated mean daily flow at Elkton by 5,000 secondfeet, but this is a negligible error, which may be due to a lack of continuo~s gage-height records at the three stations. The peak flow at Winchester during the flood of November 23, 1909, amounted to 71 second-feet to the square mile.
On the South Umpqua River at Brockway records are available for eight years, but they include what was probably the greatest flow in a 20-year period.
Between Rock Creek and Toketee Falls saf101 estimates of flood discharge can be obtained on the basis of comparative drainage areas, but this method will probably give results that are too high, especially above the mouth of Steamboat Creek. At and above Toketee Falls comparatively low diversion dams are proposed in this report and no trouble should be experienced from floods. On the South Umpqua River comparisons based on drainage areas will probably give figures for flood flows that will be slightly low.
PRIOR WATER RIGHTS
The State uses Diamond Lake in connection with a fish hatchery near the outlet-the only prior right to the water of the North Umpqua River above Glide. There are no known diversions for irrigation from the North Umpqua River or the Umpqua River, but there are small diversions from the tributaries. Calapooya Creek, tributary t~ the Umpqua River, is practically all diverted for irrigation during the sUllilller. A power plant of the California-
WATER-t>OWElt UsotrRCES OF tr:M::PQ11A 'RIVER, OREGON" 245
Oregon Power Co. at Winchester uses the entire low-water flow of the North Umpqua River and therefore has established rights in this water.
On the South Umpqua River some water is .diverted from the main river by pumping. Cow Creek is almost entirely used for irrigation, and there are undoubtedly diversions from the other tributaries below Tiller. ·Above Tiller there are no known diversions or established rights.
RIVER CONTROL
The Umpqua and North Umpqua Rivers have a well-sustained low-water discharge, but there is a long period of comparatively low flow, when auxiliary power or storage will be required to carry the load that can ordinarily be carried by natural flow during eight or nine months of the year. During periods when the natural flow would not supply the power plants any water obtained from storage could be used to generate power at no additional cost except that for storing it, and of course the more plants this stored Wl\ter can pass through the greater its value. For this reason water stored in Diamond Lake would have greater power value than water stored at sites lower down, as it could be used at all plants on the North Umpqua and Umpqua Rivers. The water supply for Diamond Lake is not great, but storage will be inexpensive.
There are no other large reservoir sites except Coles Valley. This site is discussed in detail on page 250, but it lies at a low altitude, and the lands that would be flooded are valuable for agriculture, so that the cost per horsepower-year would be high. Some regulation can be provided at the proposed dams above Coles Valley, but not nearly enough storage is available to equalize the annual flow, even in a low year. At all proposed reservoirs on the North Umpqua and Umpqua Rivers there would be a loss of head due to drawdown. As the 'flow for 90 per cent of the time amounts to 775 second-feet at Soda Springs and is even greater at all other sites lower down, it is apparent that if the period of drawdown exceeds four months this loss of power will be very considerable. In fact, in most places the loss of power due to loss of head will exceed the power obtained from the stored water if the sites are considered individually, and it is only by assuming that the stored water will be used at a number of sites that drawdown for over two months san be justified. At some sites, notably at Soda Springs, it is proposed to develop the power by high dams rather than by conduits because of the storage that can be obtained by drawing down the head. Detailed studies at the time of development will be 'necessary to determine whether the additional
246 CON~RIBU~IONS TO HYDROLOGY OF UNITED STATES, 19 2 9
power obtained from the stored water will justify the added cost of a high dam over development by conduit.
At Coles Valley if it were not for the storage feature the head would be developed by a series of low dams rather than by the one high dam; so this is primarily a reservoir site. At this site the storage capacity is so great thaf the loss of power due to loss of head is small compared with the power obtained from the stored water, and the period of drawdown can be extended over a period of six months without serious loss of power due to loss of head.
On the South Umpqua very little power is available without storage. Two fair reservoir sites are available below Tiller, but the land is valuable, a rather long dam would be required in each place, and the flow of the South Umpqua is not so great or so well sustained as the flow of the North Umpqua. The valley of the South Umpqua River is agricultural, but it usually receives enough rainfall to supply the prune orchards, and there is not much demand for water for irrigation, so that reservoirs for irrigation are not justified under present conditions.
STORAGE SITES
DEVELOPED SITES
There are no developed storage sites in the Umpqua River Basin, except possibly very small reservoirs for irrigatwn.
UNDEVELOPED SITES
Some of the proposed storage in the Umpqua River Basin will be obtained at power dams by drawing down the head. In general it has been assumed that the head at sites on the upper tributaries will be drawn down first. Also the storage was assumed to be manipulated in 1925 and in 1926 so as to give a fairly uniform output of power for the whole system of plants on the Umpqua and North Umpqua Rivers. In Table 10 the value of the reservoirs is given in millions of kilowatt-hours on the basis of no loss of head except at the sites considered. This amount represents the maximum powm obtainable from the stored water. The net gain in power on the bash of a uniform power output for the system in 1926 is also given an-i. represents the minimum value· of the site. The latter amount represents a fair value for the storage in a power system largely supplied with water power. In a large system, with considerable power obtained from auxiliary steam, it would be possible to operate the plants so as to come somewhere between the two estimates, probably approaching the larger one.
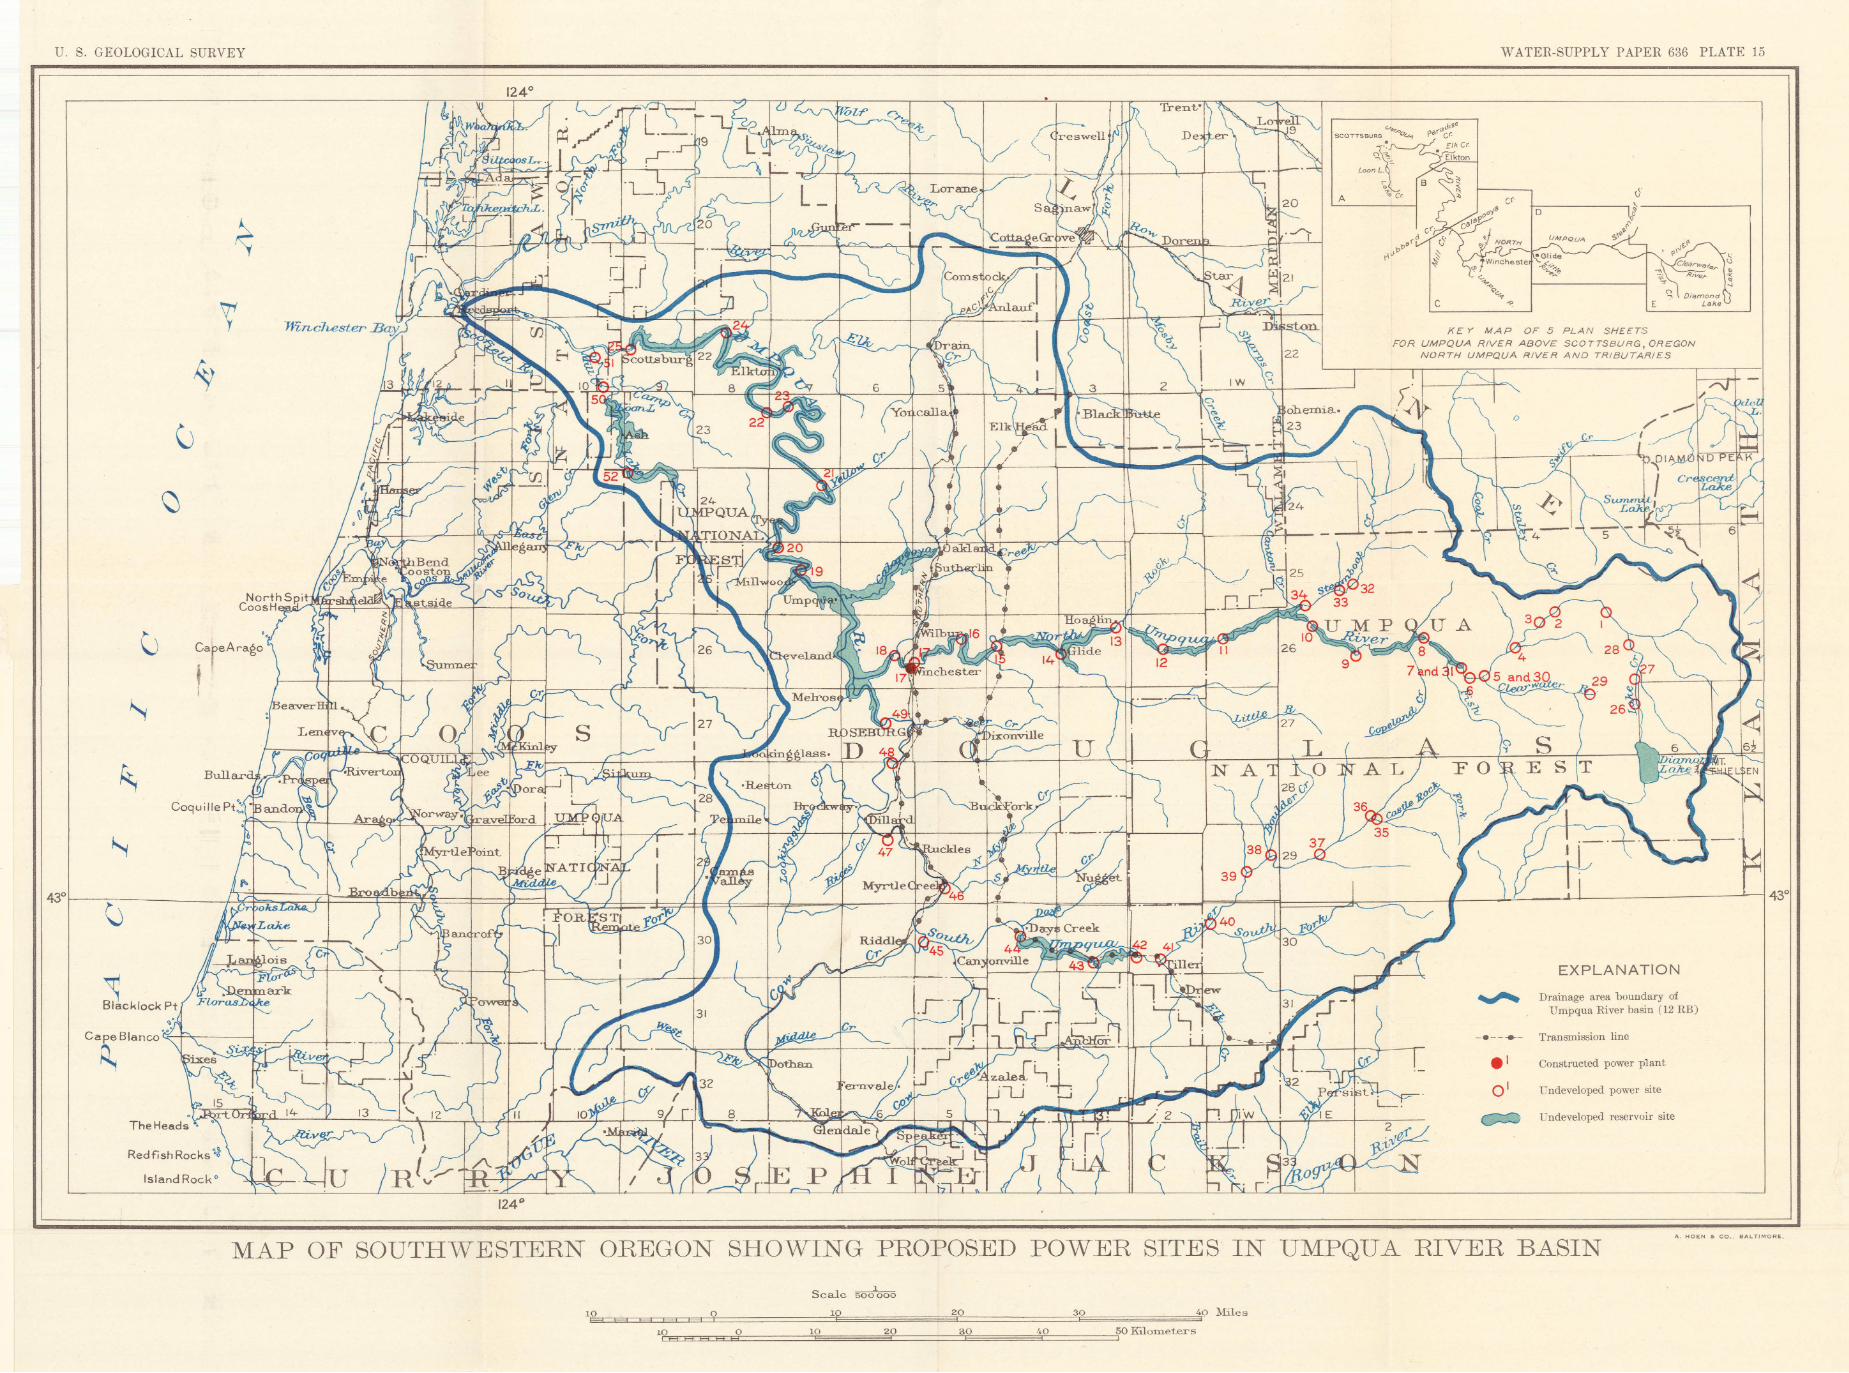
U. S. GEOLOGICAL SURVEY
~ Blacklock Pt ...
Ca ~Blanco .<::<: •• ct""\::~-:::-:-1---,--,L---+- .....-~r+--=-ol--1--
Red fish Rocks -:.&
Island Rock 0
WATER-SUPPLY PAPER 636 PLATE 15
"'"""~ SCOTTSBURG p~
A
~~ LoonLi
(.'>Cr.
K£ Y MAP OF 5 PLAN SHEETS
FOR UMPQUA RIVER ABOVE SCOTTSBURG, OREGON NORTH UMPQUA RIVER AND TRIBUTARIES
EXPLANATION
~ Drainage area boundary of Umpqua River basin (12 RB)
-•--_..- Transmjssion line
ei Coru.tructed power p1ant
O 1 Undeveloped power site
~ Undeveloped reservoir site
A. HOEN & CO . . BALTIMORE.
MAP OF SOUTHWESTERN OREGON SHOWING PROPOSED POWER SITES IN UMPQUA RivER BASIN
Scale soo1ooo
lEO~E3~~~~=c~o===============lOE=============~2~0==============3~0~~~~~~==34'9 Miles
~coEDEDED33~o=========lE0========2§0=========3EO========~~O========::J50Eilonneters
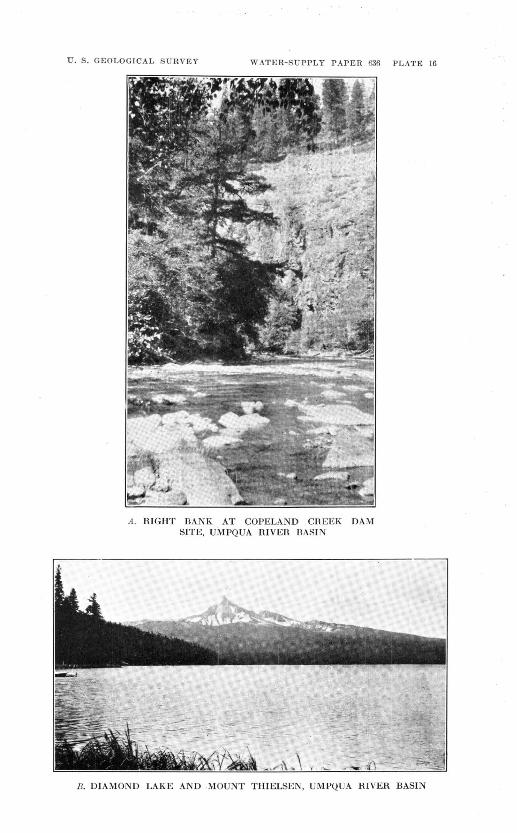
U. S. GEOLOG IC AL SURVEY WATER-SUPPLY PAPER 636 PLATE 16
A. RIGHT BANK AT COPELAND CREEK DAM SITE, UMPQUA RIVER BASIN
13. DIAMOND LAKE AND MOUNT THIELSEN, UMPQUA RIV ER BASIN
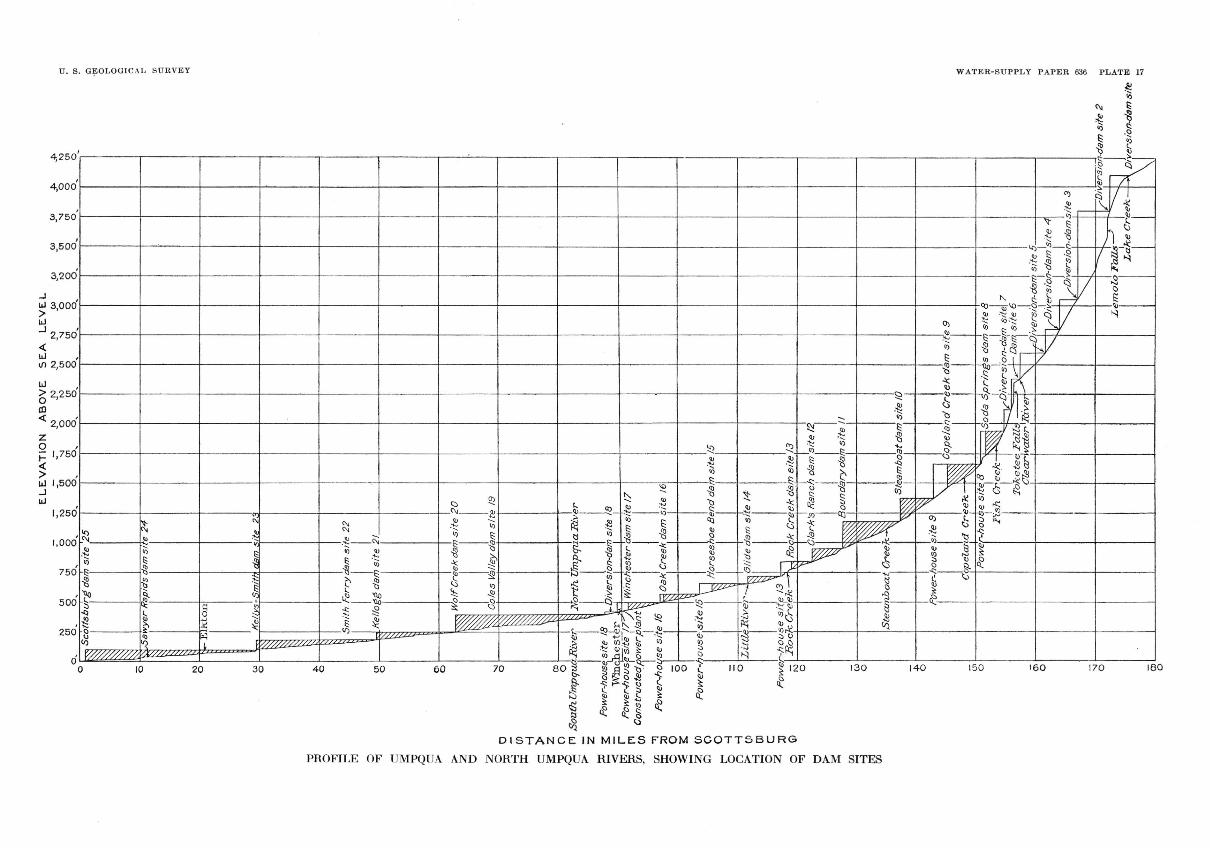
"t:l
::1:1
0 ""l
...... r t:rJ
0 ""l
......
'-<
~
"t:l
,0
......
'---<
~
~ z t:1 z 0
0 ::1:
1 -
~ = (J) -1
c
)>
~
z "t:
l ()
tO
l"'l
c ~
z ~
3::
<
-t:rJ
r
::1:1
l"'l
Jfl
(f)
w
.,
= ::0
0 0
~
i':
...... z
(f)
CJ
()
r o
0 -1
(1
-1
~
(J)
~
OJ
......
0 c
z :u
0 Gl
""
l t:1 ~ ~
w
...... ~
t:rJ
w
EL
EV
AT
ION
A
BO
VE
S
EA
L
EV
EL
-
--
-~
~
~
N
W
W
W
~
~
~
N
~
~
0 ~
~
~
0 N
~
~
0 N
~
~
0 ~
~
0 ~
0 ~
0 ~
0 ~
0 ~
0 0
0 ~
0 ~
o~
o~
o,
o,
o,
o,
o,
o,
o,
o,
o,
o~
o,
o,
o,
o,
o,
o_
0 h
Scot
t.sb
u'rg
dam
s/t
e '2
5 I
I I
I I
I I
I I
I I
I I
. I
I I
a l~sa~
yer~ap,ds~ams,~e 2
4 I
I I
I I
I I
I I
I I
I I
::5 I t
l;: E~
tonl
I
I I
I I
I I
I I
I I
I I
I
~ 1 ~ ;
xet/ys~smit1dam 41t
e 2~
1 1
I I
I I
I I
I I
I I
~~+-~-+--~+--r-+--r-~-r~--r-~-r~--~
Sm
ith
Fer
ry C
lam
s/t
e 2
2
. I
I .
~ I
1 I
Ke
llo
gg
dam
sit
e L
t __
+--
-+--
+--
--+
--+
---+
--t-
-+--
t--+
---+
--+
----
i Q~
1 I
I
gr--+----+-~t---+----+---t---+----+--~t---+----+---t---+-----+---t----t---~
~olf
'Cr~
ekda
~sit
e 'fo
~
Cbl
es v
JJI/e
yd'sm
sit
~ 19
0
Southl
lmpo~R
ivJ ~
)ort
h bm
pJaRiv
lr I
I I
I I
I I
I I
1 I
I P
ower
-hou
s{si
te ~
8 IJ
..bi
vers
~on-
da~ s
ite
~8
Win~ e st~r __
_k'
0 .
' U
I'Y
f1T
<f/
VV
<>
f si
te (
7-
WlnC~
este
r ifa
m s
ite
17
Con
s tr
ue t
ed P
,ow
er p
lan
t .
1 I
Po
wer
..h
nl(
se s
ite
/6
I J_~-J--1---+-
0 o!l
. I
Po
wer
-ho
use
· stt
e 15
' it,orses
~oe B~nd d
a}p
site
(5
wL---~--~--~--~~~---+---+--~~--~--}---f---4---~--~---+---+--~
0 ~L--J--~--~---+--~~~--~--~--4---+---+---+---~~--~--~--~
0 ~L---~
--~---+~~~-~~~~~---+----~--+-~4---~---+---4
----+---4---~
0 0>
0
Da
l si
te
J----+--+--
+--~k-1-t=Diversibn-dam
site
.:J'-
--+
--+
---1
oJ
ersi
oh-d
am ~d
e 4
nj
.I __
, I.
3 /u
Jver
.sto
n-u
am
slf
e
d ?'
0 ·1;1
0 t<
0 0 ;:; >
t<
rn
d :<1 <
1;1 ><!
~ > ., to
j ~ "' d "" "" t<
>< "" > "" 1;1
:<1 ~
~
v·~·_J
~ 2
0 w
ers
1on-
dam
Sit
e
.,
j .
.J
---~
Dtv
ers1
on-u
am
Stt
oc::
~·
I ~::;
iii
0
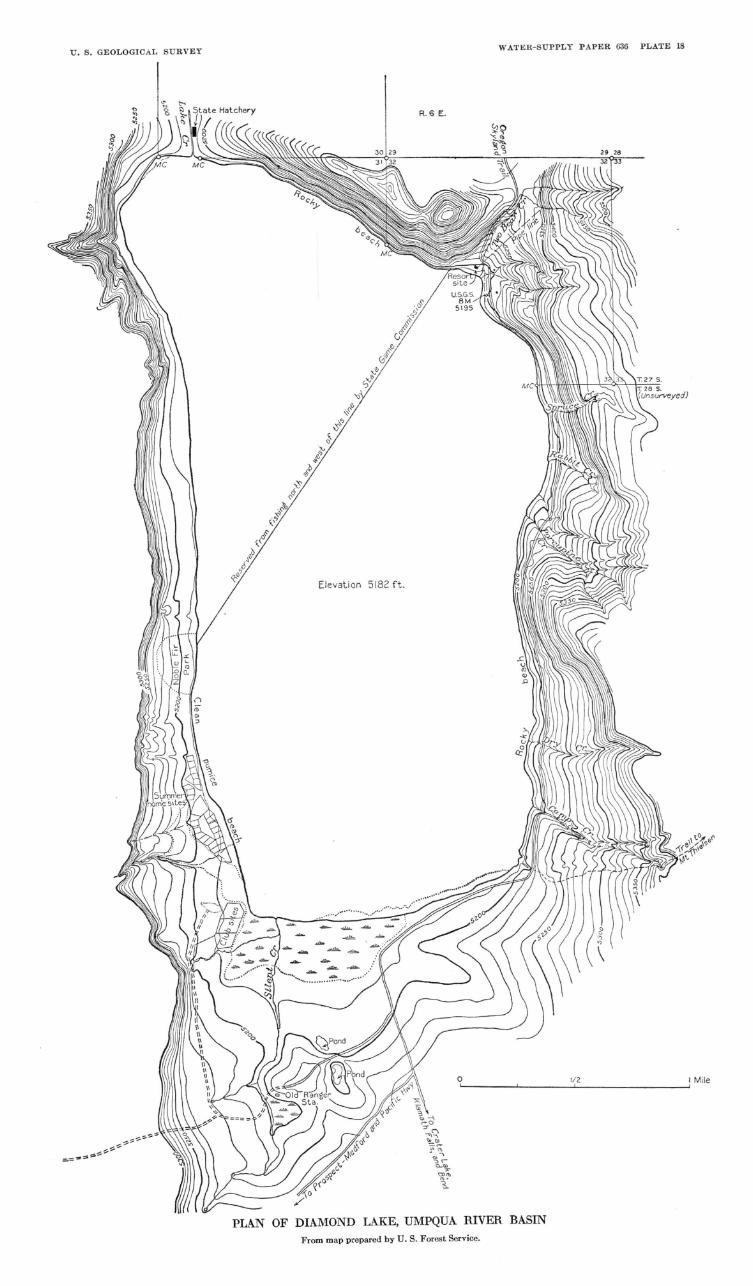
U . S. GEOLO GICAL SURVEY WATER-SUPPLY PAPER 636 PLATE 18
R. G E.
Elevation 5182 ft.
o'------'------'..L./2=----------' Mile
PLAN OF DIAMOND LAKE, UMPQUA RIVER BASIN From map prepared by U.S. Forest Service.

WATER-POWER RESOURCES OF UMPQUA RIVER, OREGON 247
Table 10 presents a summary o£ the principal features o£ proposed reservoir sites in the Umpqua River Basin and of the storage which can be obtained by drawing down the head above dams built primarily £or power. The first six sites will be operated primarily as storage sites; the others will be used for power with storage as a secondary feature. The first six sites are therefore discussed under undeveloped reservoir sites, and the power that can be obtained by drawing down the head at other sites has been discussed in connection with the power.
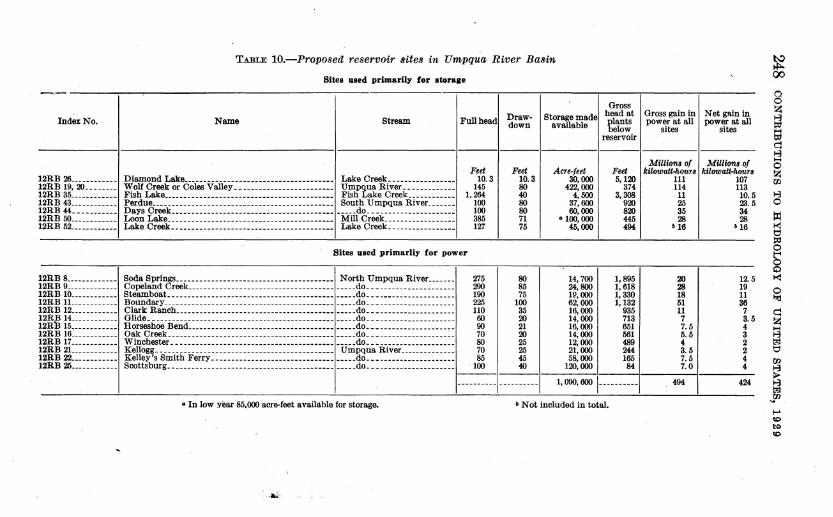
Index No.
12RB 26 ___________ _ 12RB 19, 20., •..... 12RB 35 ___________ _ 12RB 43 ___________ _ 12RB 44 __________ _ 12RB 50 ___________ _ 12RB 52 ..•.•.••••••
12RB 8 ____________ _ 12RB 9 ............ . 12RB 10 ........... . 12RB 11 ___________ _ 12RB 12 ___________ _ 12RB 14 ___________ _ 12R:B 15 ___________ _ 12RB 16 ........•••• 12RB 17.. ....•..... 12RB 21.. ..•....... 12RB 22 .......•..•. 12RB 25 ••••••.•••.•
TABLE 10.-Proposed reservoir sites in Umpqua River Basin
Sites used primarily for atorace
Gross
Stream Draw· S~emade head at
Full head f:nts down available low Name
reservoir
Feet Feet Acre-feet Feet 10.3 10.3 30,000 5,120
145 80 422,000 374 1.264 40 4,500 3,308
100 80 37,600 920 100 80 60,000 820 385 71 •100,000 445 127 75 45,000 494
Diamond Lake .......... ---------------------------- Lake Creek •• ____ -----------
-;'~: £':::~-~~-~~~-~ ~~?'. ~: == == = ===== === ==== ====== ¥::J'~~~b':!ir~:::: =: == === Perdue·----------------------~---------------------- South Umpqua River ..••••• Days Creek ...... ----------------------------------- ____ .do ... __________ ---------Loon Lake ________________ . __________ ---------------- Mill Creek.-----------------Lake Creek .• --------------------------------------- Lake Creek •. ---------------
Sites aaed primarily for power
~=~~eeE~::::::::::::::::::::::::::::::::::: -~~~~::~~~-~-~!~.8~::::::: Steamboat ..• ---------- .• __________ ----------------- ----.do._. ______ -------------Boundary _________________ -------------------------- .•••. do ... ___ ------------ ___ _ Clark Ranch _______ --------------------------------- ____ .do. __ -------- _____ ------Glide •• ---- _____ ------------------------------------ ____ .do •.•.•• -------------- __ Horseshoe Bend ...... ------- •• ---------------------- ____ .do. __________________ ••• Oak Creek.----------------------------------------- ••••• do .•• ______ ------- __ --~-Winchester .• _--------------- __ --------------------- ••••• do .•• ______ ------------_ Kellogg .. ____ .• ________ ----------------------------- Umpqua River--------------Kelley's Smith Ferry •• ----------------------------- •••.. do .. --------------------Scottsburg ••.•••.•. __ •.•••••••..• __ ......•.•.•• ----. __ ••. do •. _ .••.••. ____ • __ •••••
275 80 14,700 1,895 290 85 24,800 1,618 190 75 19,000 1,330 225 100 62,000 1,132 110 35 16,000 935 60 20 14,000 713 90 21 16,000 651 70 20 14,000 561 80 25 12,000 489 70 25 21,000 244 85 45 58,000 165
'100 40 120,000 84
---------- ---------- 1, 090,600 1----------• In low year 85,000 acre-feet available for storage. • Not included in total.
Gross gain in Net gain in power at all power at all
sites sites
MlUiOfUI of kilowatt-hour a
MlUIOfUI of ldiWJatt-limtra
111 107 114 113 11 10.5 25 23.5 35 34 28 28
•16 •16
20 i2. 5 28 19 18 11 51 36 11 7 7 3.5 7.5 4 5.5 3 4 2 3.5 2 7.5 4 7.0 4
494 424
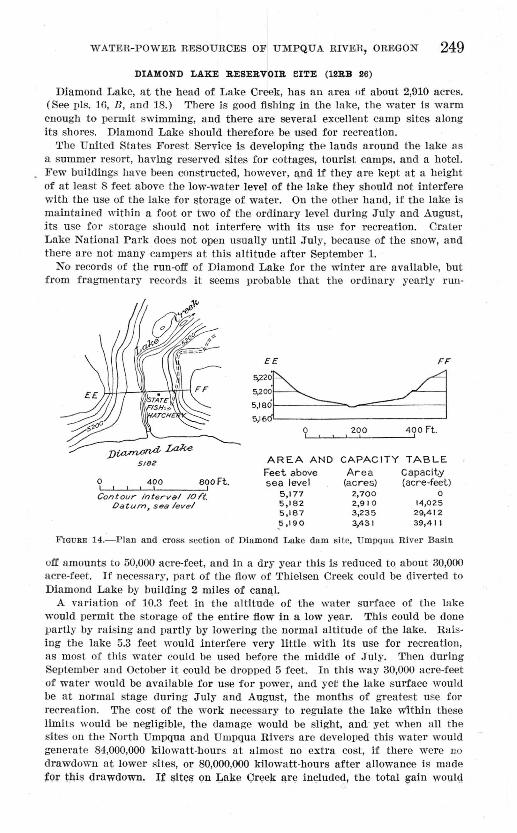
WATER-POWER RESOURCES OF UMPQUA RIVER, OREGON 249
DIAMOND LAKE RESERVOIR BITE (12RB 26)
Diamond Lake, at the head of Lake Creek, has an area of about 2,910 acres. (See pls. 16, B, and 18.) There is good fishing in the lake, the water is warm enough to permit swimming, and there are several excellent camp sites along its shores. Diamond Lake should therefore be used for recreation.
The United States Forest Service is developing the lands around the lake as a summer resort, having reserved sites for cottages, tourist camps, and a hotel. Few buildings have been constructed, however, a,nd if they are kept at a height of at least 8 feet above the low-water level of the lake they should not interfere with the use of the lake for storage of water. On the other hand, if the lake is maintained within a foot or two of the ordinary level during July and August, its use for storage should not interfere with its use for recreation. Crater Lake National Park does not open usually until July, because of the snow, and there are not many campers at this altitude after September 1.
No records of the run-{)ff of Diamond Lake for the winter are available, but from fragmentary records it seems probable that the ordinary yearly run-
££ FF
EE~-A 5,16dl---------
9 , zqo 490Ft.
5182 AREA AND CAPACITY TABLE
0 800Ft. 400 Feet above Ar ea Capacity sea level (acres) (acre-feet)
Contour interval !OI"t. Oaturn, sea level
5,177 2,700 0 5,182 2,910 14,025 5,187 3,235 29,4 12 _5,190 3,431 39,41 '1
FiGURE 14.-Plan and cross section of Diamond Lake dam site, Umpqua River Basin
off amounts to 50,000 acre-feet, and in a dry year this is reduced t() abou t 30,000 acre-feet. If necessary, part of the flow of Thielsen Creek could be diverted to Diamond Lake by building 2 miles of cana).
A variation of 10.3 feet in the altitude of the water surface of the lake would permit the storage of the entire flow in a low year. This could be done partly by raising and partly by lowering the normal altitude of the lake. Raising the lake 5.3 feet would interfere very little with its use for recreation , as most of this water could be used before the middle of July. Then during September and October it could be dropped 5 feet. In this way 30,000 acre-feet of water would be available for use for power, and yet the lake surface would be at normal stage during July and August, the months of greatest use for recreation. The cost of the work necessary to regulate the lake w1thin these limits would be negligible, the damage would be slight, and· yet when all the sites on the North Umpqua and Umpqua Rivers are developed this water would generate 84,000,000 kilowatt-hours at almost no extra cost, if there were no drawdown at lower sites, or 80,000,000 kilowatt-hours after allowance is made tor thi~ drawdown. It ~ite~? Qn J;,.ake Qree}!: a,re inQluded, the total ~ain woulq
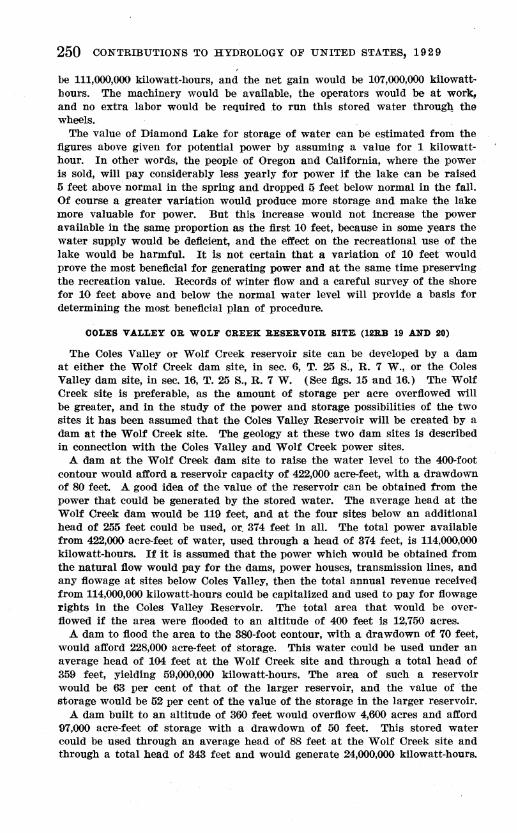
250 CONTRIBUTIONS TO HYDROLOGY OF UNITED STATES, 19 2 9
be 111,000,000 kilowatt-hours, and the net gain would be 107,000,000 kilowatthours. The machinery would be available, the operators would be at work, and no extra labor would be required to run this stored water througb, the wheels.
The value of Diamond Lake for storage of water can be estimated from the figures above given for potential power by assuming a value for 1 kilowatthour. In other words, the people of Oregon and California, where the power is sold, will pay considerably less yearly for power if the lake can be raised 5 feet above normal in the spring and dropped 5 feet below normal in the fall. Of course a greater variation would produce more storage and make the lake more valuable for power. But this increase would not increase the power available in the same proportion as the first 10 feet, because in some years the water supply would be deficient, and the effect on the recreational use of the lake would be harmful. It is not certain that a variation of 10 feet would prove the most beneficial for generating power and at the same time preserving the recreation value. Records of winter flow and a careful survey of the shore for 10 feet above and below the normal water level will provide a basis for determining the most beneficial plan of procedure.
COLES VALLEY OR WOLF CREEK RESERVOIR SITE (12R:B 19 AND 20)
Tile Coles Valley or Wolf Creek reservoir site can be developed by a dam at either the Wolf Creek dam site, in sec. 6, T. 25 s:, R. 7 W., or the Coles Valley dam site, in sec. 16, T. 25 S., R. 7 W. (See figs. 15 and 16.) The Wolf Creek site is preferable, as the amount of storage per acre overflowed will be greater, and in the study of the power and storage possibilities of the two sites it has been assumed that the Coles Valley Reservoir will be created by a dam at the Wolf Creek site. The geology at these two dam sites is described in connection with the Coles Valley and Wolf Creek power sites.
A dam at the Wolf Creek dam site to raise the water level to the 400-foot contour would afford a reservoir capacity of 422,000 acre-feet, with a drawdown of 80 feet. A good idea of the value of the reservoir can be obtained from the power that could be generated by the stored water. The average head at the Wolf Creek dam would be 119 feet, and at the four sites below an additional head of 255 feet could be used, or_ 374 feet in all. The total power available from 422,000 acre-feet of water, used through a head of 374 feet, is 114,000,000 kilowatt-hours. If it is assumed that the power which would be obtained from the natural flow would pay for the dams, power houses, transmission lines, and any flowage at sites below Coles Valley, then the total annual revenue received from 114,000,000 kilowatt-hours could be capitalized and used to pay for flowage rights in the Coles Valley Reservoir. The total area that would be overflowed if the area were flooded to an altitude of 400 feet is 12,750 acres.
A dam to flood the area to the 380-foot contour, with a drawdown of 70 feet, would afford 228,000 acre-feet of storage. This water could be used under an average head of 104 feet at the Wolf Creek site and through a total head of 359 feet, yielding 59,000,000 kilowatt-hours. The area of such a reservoir would be 63 per cent of that of the larger reservoir, and the value of the storage would be 52 per cent of the value of the storage in the larger reservoir.
A dam built to an altitude of 360 feet would overflow 4,600 acres and afford 97,000 acre-feet of storage with a drawdown of 50 feet. This stored water could be used through an average head of 88 feet at the Wolf Creek site and through a total head of 343 feet and would generate 24,000,000 kilowatt-hours.
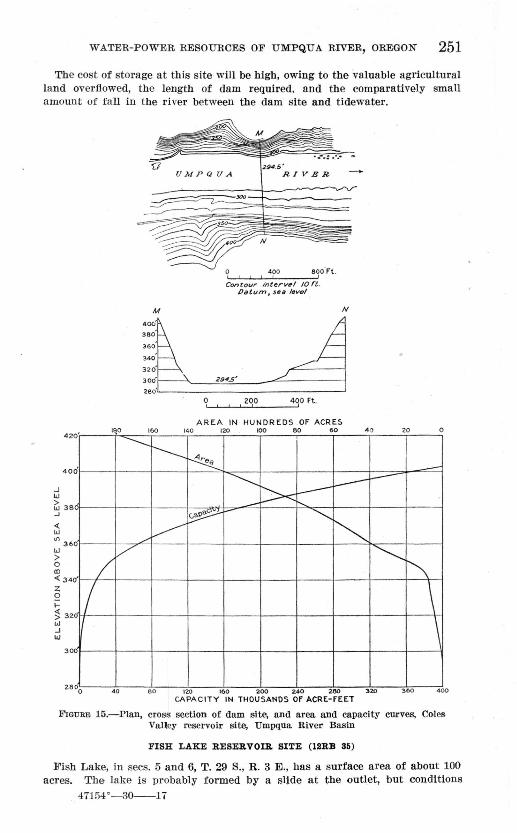
WATER-POWER RESOURCES OF UMPQUA RIVER, OREGON 251
The cost of storage at this site will be high, owing to the valuable agricultural land overflowed, the length of dam required, and the comparatively small amount of fall in the river between the dam site and tidewater.
Contour interv~l /Oft . Datum, s~a l~vsl
M N
400:~ A ~~P~-.!.29~4!::;:S~·---./..:::::..._~----j 280~--------------------------------~
0 200 400ft. '--'----'---'-'-----'
AREA IN HUNDREDS OF ACRES 160 140 120 100 80 60 4 0 20 0
o' --..J w
40 d
i:i 38 ...J
o( w If) 36 w
0
> 0 m < 34 :z:
if / v
01 0 1-
~ 32 w ..J w
3 0 0
0 28 0 40
----~ ..--~ ~ ->< ~ -- ~
/~ ~e-
.........._
~ ~
1'\
\ \
80 120 160 200 2.40 260 320 400
CAPACITY IN THOU SANDS Of ACRE-FEET
FIGuRE 15.-Plan, cross section of dam site, and area and capacity curves, Coles Valley reservoir site, Umpqua River Basin
FISH LAKE RESERVOIR SITE (12RB 35)
Fish Lake, in sees. 5 and 6, T. 29 S., R. 3 E., has a surface area of about 100 acres. The lake is probably formed by a slide at the outlet, but conditions
47154°-30----17
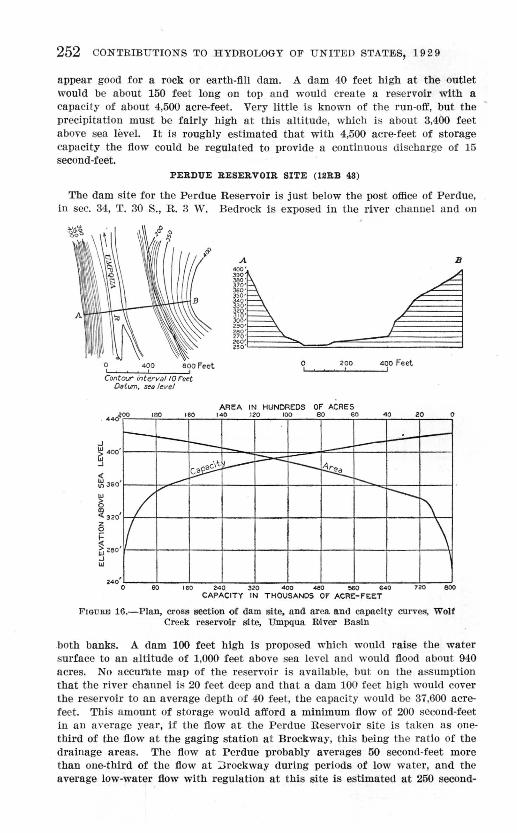
252 CONTRIBUTIONS TO HYDROLOGY OF UNITED STATES, 19 2 9
appear good for a rock or earth-fill dam. A dam 40 feet high at the outlet would be about 150 feet long on top and would create a reservoir with a capacity of about 4,500 acre-feet. Very little is known of the run-off, but the precipitation must be fairly high at this altitude, which is about 3,400 feet above sea level. It is roughly estimated that with 4,500 acre·feet of storage capacity the flow could be regulated to provide a continuous discharge of 15 second-feet.
PERDUE RESERVOIR SITE (12RB 48)
The dam site for the Perdue Reservoir is just below the post office of Perdue, in sec. 34, T. 30 S., R. 3 W. Bedrock is exposed in the river channel and on
A B
;gg~·· II 380' 370 ' 360'
J!ll~~"=~===~/~,/~;1'11 ~g; ........ ~ Z50 ' .__...-
Contout' interval tO rm Datum, sea level
. 446~00 160
r--
0 400 Feet '--'-~.....J.----l
200
AREA IN HUNDREDS OF ACRES 140 120 100 80 60 40
J
~400 I----- -'-----
< l:g JEiO
~ t.--- r--~ a _. r-
20
w '/~ --\ ~ ~ 320 z 0
~ ~ 280 J w
240 0
I
eo I 60 240 320 400 480 !160 640 720
CAPACITY IN THOUSANDS DF ACRE:-FEE:T
0
-
\ 600
FIGURE 16.-Plan, cross section of dam site, and area and capacity curves, Wolt Creek reservoir site, Umpqua Ibiver Basin
.both banks. A dam 100 feet high is proposed which would raise the water surface to an altitude of 1,000 feet above sea level and would flood about 940 acres. No accurate map of the reservoir is available, but on the assumption that the river channel is 20 feet deep and that a dam 100 feet high would cover the reservoir to an average depth of 40 feet, the capacity would be 37,600 acrefeet. This amount of storage would afford a minimum flow of 200 second-feet in an average year, if the flow at the P erdue Reservoir site is taken as onethird of the flow at the gaging station at Brockway, this being the ratio of the drainage areas. The flow at P erdue probably averages 50 second-feet more than one-third of the flow at :lrockway during periods of low water , and the average low-water flow with regulation at this site is estimated at 250 second-
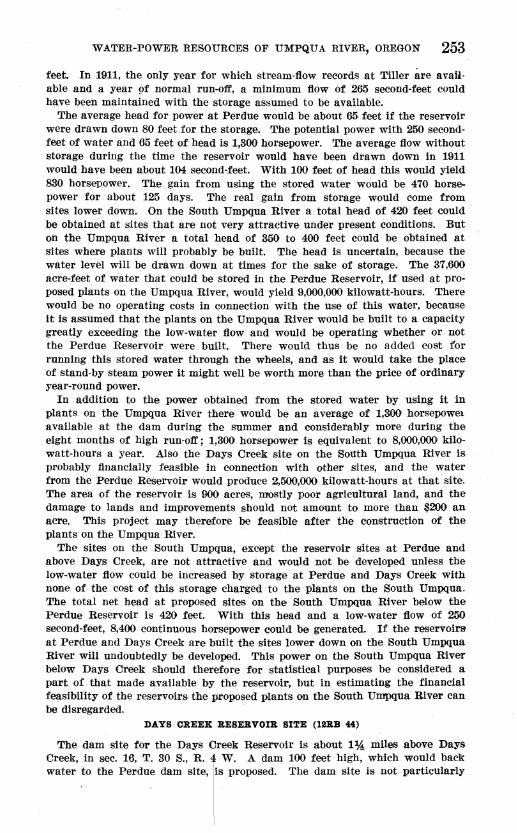
WATER-POWER RESOURCES OF UMPQUA RIVER, OREGON 253
feet. In 1911, the only year for which stream-flow records at Tiller are available and a year 9f normal run-off, a minimum flow of 265 second-feet could have been maintained with the storage assumed to be available.
The average head for power at Perdue would be about 65 feet if the reservoir were drawn down SO feet for the storage. The potential power with 250 secondfeet of water and 65 feet of head is 1,300 horsepower. The average flow without storage during the time the reservoir would have been drawn down in 1911 would have been about 104 second-feet. With 100 feet of head this would yield 830 horsepower. The gain from using the stored water would be 470 horsepower for about 125 days. The real gain from storage would come from sites lower down. On the South Umpqua River a total head of 420 feet could be obtained at sites that are not very attractive under present conditions. But on the Umpqua River a total head of 350 to 400 feet could be obtained at sites where plants will probably be built. The head is uncertain, because the water level will be drawn down at times for the sake of storage. The 37,600 acre-feet of water that could be stored in the Perdue Reservoir, if used at proposed plants on the Umpqua River, would yield 9,000,000 kilowatt-hours. There would be no operating costs in connection with the use of this water, because it is assumed that the plants on the Umpqua River would be built to a capacity greatly exceeding the low-water flow and would be operating whether or not the Perdue Reservoir were built. There would thus be no added cost for running this stored water through the wheels, and as it would take the place of stand-by steam power it might well be worth more than the price of ordinary year-round power.
In addition to the power obtained from the stored water by using it in plants on the Umpqua River there would be an average of 1,300 horsepowel. available at the dam during the summer and considerably more during the eight months of high run-off; 1,300 horsepower is equivalent to 8,000,000 kilowatt-hours a year. Also the Days Creek site on the SoUth Umpqua River is probably financially feasible in connection with other sites, and the water from the Perdue Reservoir would produce 2,500,000 kilowatt-hours at that site. The area of the reservoir is 900 acres, mostly poor agricultural land, and the damage to lands and improvements should not amount to more than $200 an acre. This project may therefore be feasible after the construction of the plants on the Umpqua River.
The sites on the South Umpqua, except the reservoir sites at Perdue and above Days Creek, are not attractive and would not be developed unless the low-water flow could be increased by storage at Perdue and Days Creek with none of the cost of this storage charged to the plants on the South Umpqua. The total net head at proposed sites on the South Umpqua River below the Perdue Reservoir is 420 feet. With this head and a low-water flow of 250 second-feet, 8,400 continuous horsepower could be generated. If the reservoirs at Perdue and Days Creek are built the sites lower down on the South Umpqua River will undoubtedly be developed. This power on the South Umpqua River below Days Creek should therefore for statistical purposes be considered a part of that made available by the reservoir, but in estimating the financial feasibility of the reservoirs the proposed plants on the South Umpqua River can be disregarded.
DAYS CREEK RE$ERVOIR SITE (12RB 44)
The dam site for the Days Creek Reservoir is about 1 ~ miles above Days Creek, in sec. 16, T. 30 S., R. 4 W. A dam 100 feet high, which would back water to the Perdue dam site, lis proposed. The dam site is not particularly
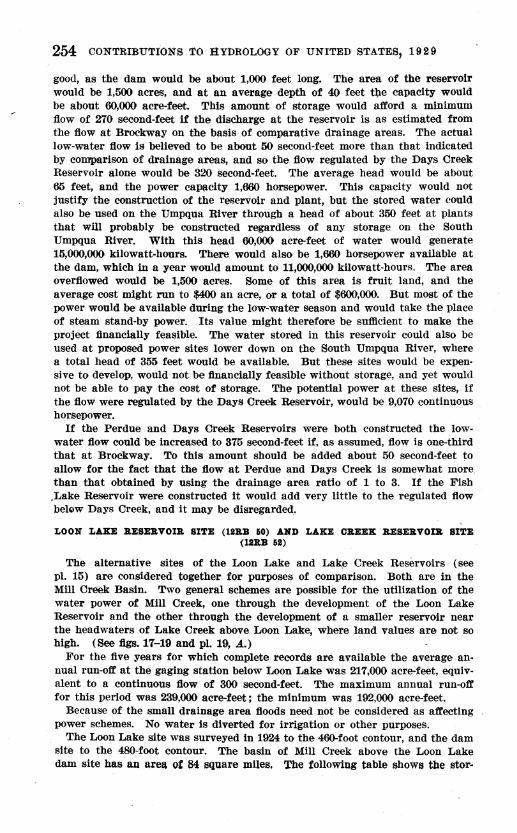
254 CONTRIBUTIONS TO HYDROLOGY OF UNITED STATES, 1929
good, as the dam would be about 1,000 feet long. The area of the reservoir would be 1,500 acres, and at an average depth of 40 feet t'b.e capacity would be about 60,000 acre-feet. This amount of storage would afford a minimum flow of 270 second-feet if the discharge at the reservoir is as estimated from the flow at Brockway on the basis of comparative drainage areas. The actual low-water flow is believed to be about 50 second-feet more than that indicated by comparison of drainage areas, and so the flow regulated by the Days Creek Reservoir alone would be 320 second-feet. The average head would be about 65 feet, and the power capacity 1,660 horsepower. This capacity would not justify the construction of the reservoir and plant, but the stored water could also be used on the Umpqua River through a head of about 350 feet at plants that will probably be constructed regardless of any storage on the South Umpqua River. With this head 60,000 acre-feet of water would generate 15,000,000 kilowatt-hours. There would also be 1,660 horsepower available at the dam, which in a year would amount to 11,000,000 kilowatt-hours. The area overflowed would be 1,500 acres. Some of this area is fruit land, and the average cost might run to $400 an acre, or a total of $600,000. But most of the power would be available during the low-water season and would take the place of steam stand-by power. Its value might therefore be sufficient to make the project financially feasible. The water stored in this reservoir could also be used at proposed power sites lower down on the South Umpqua River, where a total head of 355 feet would be available. But these sites would be expensive to develop, would not be financially feasible without storage, and yet would not be able to pay the cost of storage. The potential power at these sites, if the flow were regulated by the Days Creek Reservoir, would be 9,070 continuous horsepower.
If the Perdue and Days Creek Reservoirs were both constructed the lowwater flow could be increased to 375 second-feet if, as assumed, flow is one-third that at Brockway. To this amount should be added about 50 second-feet to allow for the fact that the flow at Perdue and Days Creek is somewhat more than that obtained by using the drainage area ratio of 1 to 3. If the Fish .Lake Reservoir were constructed it would add very little to the regulated flow belQw Days Creek, and it may be disregarded_.
LOON LAKE RESE1t.VOIR SITE (liD 50) AND LAKE CREEK :aESEllVOIR SITE (lBBB 58)
The alternative sites of the Loon Lake and Lak!;l Creek Reservoirs (see pl. 15) are considered together for purposes of comparison. Both are in the Mill Creek Basin. Two general schemes are possible for the utilization of the water power of Mill Creek, one through the development of the Loon Lake Reservoir and the other through tli.e development of a smaller reservoir near the headwaters of Lake Creek above Loon Lake, where land values are not so high. (See figs. 17-19 and pl. 19, A.)
For the five years for which complete records are available the average an· nual run-off at the gaging station below Loon Lake was 217,000 acre-feet, equivalent to a continuous flow of 300 second-feet. The maximum annual run-off for this period was 239,000 acre-feet; the minimum was 192,000 acre-feet.
Because of the small drainage area floods need not be considered as affecting power schemes. No water is diverted for irrigation or other purposes.
The Loon Lake site was surveyed in 1924 to the 460-foot contour, and the dam site to the 480-foot contour. The basin of Mill Creek above the Loon Lake dam site has an area of 84 square miles, The following table shows the stor-
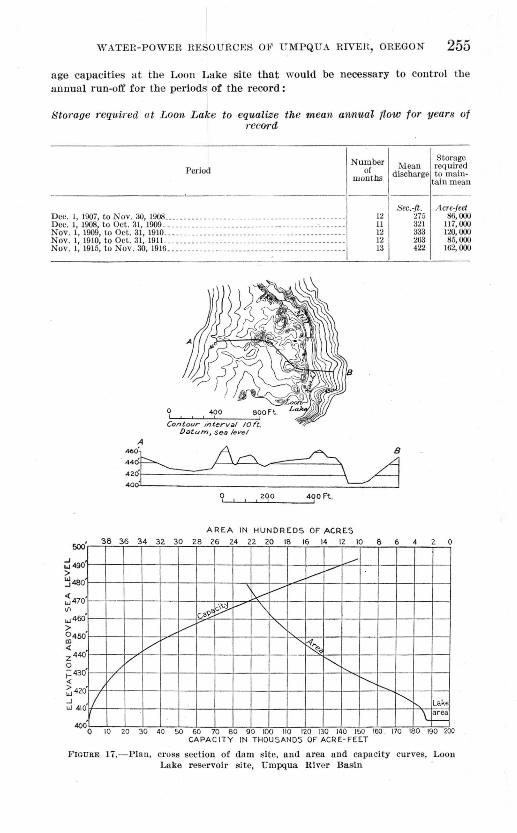
''\'ATEP.-POWER, RESOURCES OF U MPQU A RIVEH, OREGON 255
age capacities at the Loon Lake site that would be necessary to control the annual run-off for the periods of the recQrd:
Stomge 1-equir ed at Loon Lake to equalize the mean annua-l {low for year8 of ·r ecm-d
Period N umber
of months
Storage Mean req uired
discharge to maintain mean
--------~----------1---------
D ec. 1, 1907, to Nov. 30, 1908 ___ _________ __________________________ ___ ____ _
D ec. 1, 1908, to Oct. 31, 1909-- -------------------------------------- - - - - ov. 1, 1909, to Oct. 31, 1910--- ---- - - --- - - --- - ----------------- ----- ------Nov. 1, 1910, to Oct. 31, 1911. ____ ___ ______ ___________ _________ __ _________ _
Nov. 1,1915, to Nov. 30, 1916-· ------ --- -- ----- -- - --- --- --- -- -------- - --- -
0 400
Contour interval lOft. Datum, sea level
0'-J'-J'-Jc..2...J0c...0 ___ 4...JOO Ft.
AREA IN HUNDREDS OF ACRES
12 11 12 12 13
&c.-ft. 275 321 333 263 422
'YJO' 38 36 34 32 30 28 26 24 22 20 18 16 14 12 10 8 6
i:!490 > ~480
~470 "' w460 > 0450 CD < z440 0 ;:430 < i::,420 _J
"' 410 .1/
-oQ• ~v
/
v v
v
-v v
tx--- ..--'\
""" "~ f".,.
t'---~--. 1'---
\.
Acre-feet 86,000
117,000 120, 000 85, 000
162,000
2 0
Lake area I--
400 0 10 20 30 40 !>0 60 70 80 90 100 110 120 130 140 1!'>0 160 170 180 190 200
CAPACITY IN THOUSANDS OF ACRE-FEET
FIGURE 17.- Pla n, cross section of dam site, and area and capacity curves, Loon Lake reservoir site, Umpqua Hivcr Basin
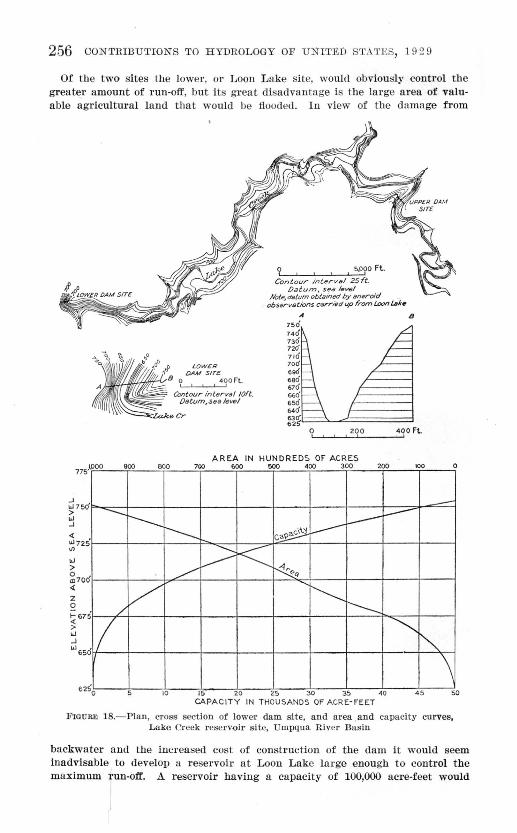
256 CONTRIBUTIONS TO H YDROLOGY OF UNITE D S~l.' .\ TES, 1 9:! 9
Of the two sites the lower, or Loon L ake site, would obviously control the greater amount of run-off, but its great disadvantage is the large area of valuable agricultural land that would be flooded. In view of the damage from
LOWER DAM SITE
o 4 00 FL
Contour in terval /Oft. Oatum;sea level
? ' ' I I 5.0?0 Ft. Cont our interval 25ft.
Datum, sea /~vel Note, datutn obtained by aneroid _
; ohservatiot?s carried up from Loon Lske
A B
750
AREA IN HUNDREDS OF ACRES 900 BOO 7Ql) 600 500 400 300 200 100 0
.J W750 > w .J
< wns tJ)
"' > 0 m700 <(
---
z 0
t- &7 <
5 /
61 >
"' .J
"'&s
5 &2 0
-------- ~ ---r--- c~ ----~
/ K ~q v ~ 1---..
~
""' \ 5 10 IS 20 25 30 35 4 0 4 5 so
CAPACITY IN THOUSANDS OF ACRE-FEET
FIGUREl 18.- Plan, cross section of lower dam site, and area and capacity curves, Lake Creek r eservoit· s ite, Umpqua River Basin
backwater and the increased cost of construction of the dam it would seem inadvisable to develop a reservoir at Loon Lake large enough to control the maximum run-off. .A. reservoir having a capacity of 100,000 acre-feet would
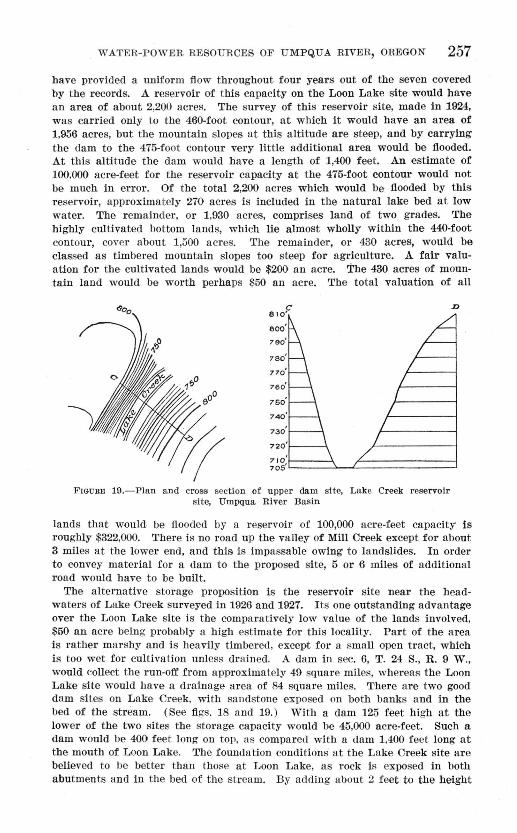
WATER-POWER RESOURCES OF UMPQUA RIVER, OREGON 257
have provided a uniform flow throughout four years out of the seven covered by the records. A reservoir of this capacity on the Loon Lake site would have an area of about 2,200 acres. The survey of this reservoir site, made in 1924, was carried only to the 460-foot contour, at which it would have an area of 1,956 acres, but the mountain slopes at this altitude are steep, and by carrying the dam to the 475-foot contour very little additional area would be flooded. At this altitude the dam would have a length of 1,400 feet. An estimate of 100,000 acre-feet for the reservoir capacity at t he 475-foot contour would not be much in error. Of the total 2,200 acres which would be flooded by this reservoir, approximately 270 acres is included in the natural lake bed at low water. The remainder, or 1,930 acres, comprises land of two grades. The highly cultivated bottom lands, which lie almost wholly within the 440-foot contour, cover about 1,500 acres. The remainder, or 430 acres, would be classed as timbered mountain slopes too steep for agriculture. A fair valuation for the cultivated lands would be $200 an acre. The 430 acres of mountain land would be worth perhaps $50 an acre. The total valuation of all
810r:
FIGURE 19.-Plan and cross section of upper dam site, La ke Creek r eservoir site, Umpqua River Basin
D
lands that would be flooded by a reservoir of 100,000 acre-feet capacity is roughly $322,000. There is no road up the valley of Mill Creek except for about 3 miles at the lower end, and this is impassable owing to landslides. In order to convey material for a dam to the proposed site, 5 or 6 miles of additional road would have to be built.
The alternative storage proposition is the reservoir site near the headwaters of Lake Creek surveyed in 1926 and 1927. Its one outstanding advantage over the Loon Lake site is the comparatively low value of t he lands involved, $50 an acre being probably a high estimate for this locality. Part of the area is rather mar shy and is heavily timbered, except for a small open tract, which is too wet for cultivation unless drained. A dam in sec. 6, T. 24 S. , R. 9 W., would collect the run-off from approximately 49 square miles, whereas the Loon Lake site would have a drainage area of 84 square miles. There are two good dam sites on Lake Creek, with sandstone exposed on both banks and in the bed of the stream. (See figs. 18 and 19.) With a dam 125 feet high at the lower of the two sites the storage capacity would be 45,000 acre-feet. Such a dam would be 400 fee t long on top, as compared with a dam 1,400 feet long at the mouth of Loon Lake. The foundation conditions a t the Lake Creek site are believed to be better than those at Loon Lake, as rock is exposed in both abutments and in the bed of the stream. By adding about 2 feet to the height
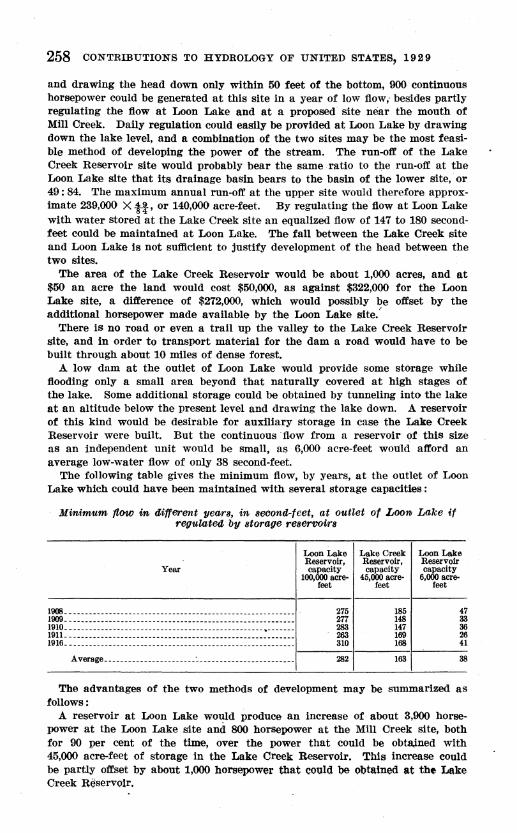
258 CONTRIBUTIONS TO HYDROLOGY OF UNITED STATES, 1929
and draWing the head down only within 50 feet of the bottom, 900 continuous horsepower could be generated at this site in a year of low flow,- besides partly regulating the flow at Loon Lake and at a proposed site near the mouth of Mill Creek. Daily regulation could easily be provided at Loon Lake by drawing down the lake level, and a combination of the two sites may be the most feasi· ble method of developing the power of the stream. The run-off of the Lake Creek Reservoir site would probably bear the same ratio to the run-off at the Loon Lake site that its drainage basin bears to the basin of the lower site, or 49: 84. The maximum annual run-off at the upper site would therefore approximate 239,000 X tt, or 140,000 acre-feet. By regulating the :O.ow at Loon Lake with water stored at the Lake Creek site an equalized flow of 147 to 180 secondfeet could be maintained at Loon Lake. The fall between the Lake Creek site and Loon Lake is not sufficient to justify development of the head between the two sites.
The area of the Lake Creek Reservoir would be about 1,000 acres, and at $50 an acre the land would cost $50,000, as against $322,000 for the Loon Lake site, a di:tference of $272,000, which would possibly be offset by the additional horsepower made available by the Loon Lake site./
There is no road or even a trail up the valley to the Lake Creek Reservoir site, and in order to transport material for the dam a road would have to be built through about 10 miles of dense forest.
A low dam at the outlet of Loon Lake would provide some storage while flooding only a small area beyond that naturally covered at high stages of the lake. Some additional storage could be obtained by tunneling into the lake at an altitude below the present level and drawing the lake down. A reservoir of this kind would be desirable for auxiliary storage in case the Lake Creek Reservoir were built. But the continuous ·flow from a reservoir of this size as an independent unit would be small, as 6,000 acre-feet woUld afford an average low-water flow of only 38 second-feet.
The following table gives the minimum flow, by years, at the outlet of Loon Lake which could have been maintained with several storage capacities:
Minimum ttow in d,if(erent yeara, in aeoond,-feet, at outlet of Loon Lake if regulated by atorage reaerootra
Year
lOOIL- -- __ -- •• -----.------------------------------------------ · 1009.---------------------------------------------------------1910.------------------------------------------------- ·- ------1911.---------------------------------------------------------1916.- --------------------------------------------------------
Average.--- ____ . ____ . ________ -~ ____ --------------------
Loon Lake Reservoir, capacity
100,000 acre-feet
275 277 283 263 310
282
Lake Creek Loon Lake Reservoir, Reservoir capacity capacity
45,000 acre- 6,000 acre-feet feet
185 47 148 33 147 36 169 26 168 41
163 38
The advantages of the two methods of development may be summarized as follows:
A reservoir at Loon Lake would produce an increase of about 3,900 horsepower at the Loon Lake site and 800 horsepower at the Mill Creek site, both for 90 per cent of the time, over the power that could be obta,ined with 45,000 acre-feet of storage in the Lake Creek Reservoir. This increase could be partly offset by about 1,000 horsepower that could be obtained at the Lake Creek Reservoir,
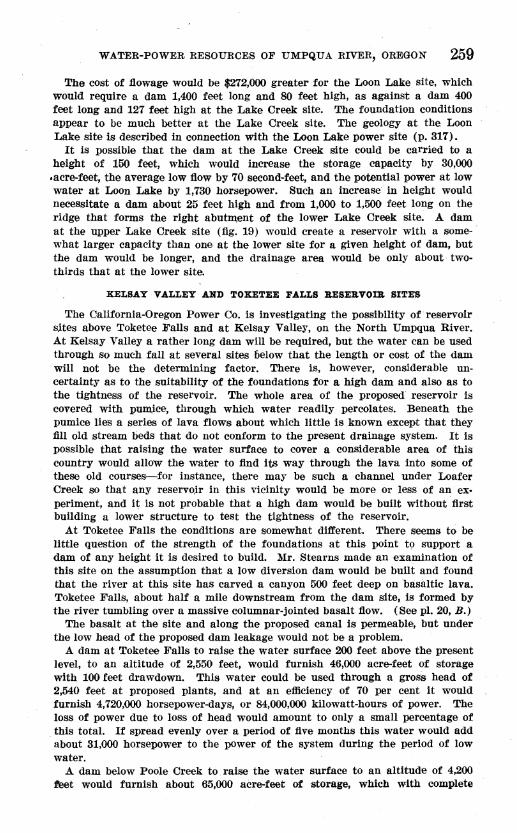
WATER-POWER RESOURCES OF UMPQUA RIVER, OREGON 259
The cost of :flowage would be $272,000 greater for the Loon Lake site, which would require a dam 1,400 feet long and 80 feet high, as against a dam 400 feet long and 127 feet high at the Lake Creek site. The foundation conditions appear to be much better at the Lake Creek site. The geology at the Loon Lake site is described in connection with the Loon Lake power site (p. 317).
It is possible that the dam at the Lake Creek site could be carried to a height of 150 feet, which would increase the storage capacity by 30,000
.acre-feet, the average low :flow by 70 second-feet, and the potential power at low water at Loon Lake by 1,730 horsepower. Such an increase in height would necessitate a dam about 25 feet high and from 1,000 to 1,500 feet long on the ridge that forms the right abutm,ent of the lower Lake Creek site. A dam at the upper Lake Creek site (fig. 19) would create a reservoir with a somewhat larger capacity than one at the lower site for a given height of dam, but the dam would be longer, and the drainage area would be only about twothirds that at the lower site.
KELSAY VALLEY AND TOKETEE FALLS RESERVODi SITES
The California-Oregon Power Co. is investigating the possibility of· reservoir s,i.tes above Toketee Falls and at Kelsay Valley, on the North Umpqua River. At Kelsay Valley a rather long dam will be required, but the water can be used through so much fall at several sites below that the length or cost of the dam will not be the determining factor. There is, however, considerable uncertainty as to the suitability of the foundations for a high dam and also as to the tightness of the reservoir. The whole area of the proposed reservoir is covered with pum,ice, through which water readily percolates. Beneath the pumice lies a series of lava flows about which little is known except that they fill old stream beds that do not conform to the present drainage system. It is possible that raising the water surface to cover a considerable area of this country would allow the water to find its way through the lava into some of these old courses-for instance, there may be such a channel under Loafer Creek so that any reservo.ir in this vicinity would be more or less of an ex· periment, and it is not probable that a high dam would be built without first building a lower structure to test the tightness of the reservoir.
At Toketee Falls the conditions are somewhat different. There seems to be little question of the strength of the foundations at this point tQ support a dam of any height it is desired to build. Mr. Stearns made an examination of this site on the assumption that a low diversion dam would be built and found that the river at this site has carved a canyon 500 feet deep on basaltic lava. Toketee Falls, about half a mile downstream from the dam site, is formed by the river tumbling over a massive columnar-jointed basalt :flow. (See pl. 20, B.)
The basalt at the site and along the proposed canal is permeable, but under the low head of the proposed dam leakage would not be a problem.
A dam at Toketee }'alls to raise the water surface 200 feet above the present level, to an altitude of 2,550 feet, would furnish 46,000 acre-feet of storage with 100 feet drawdown. This water could be used through a gross head of 2,540 feet at proposed plants, and at an efficiency of 70 per cent it would furnish 4,720,000 horsepower-days, or 84,000,000 kilowatt-hours of power. The loss of power due to loss of head would amount to only a small percentage of this total. If spread evenly over a period of five months this water would add about 31,000 horsepower to the power of the system during the period of low water.
A dam below Poole Creek to raise the water surface to an altitude of 4,200 feet would furnish about 65,000 acre-feet of storage, which with complete
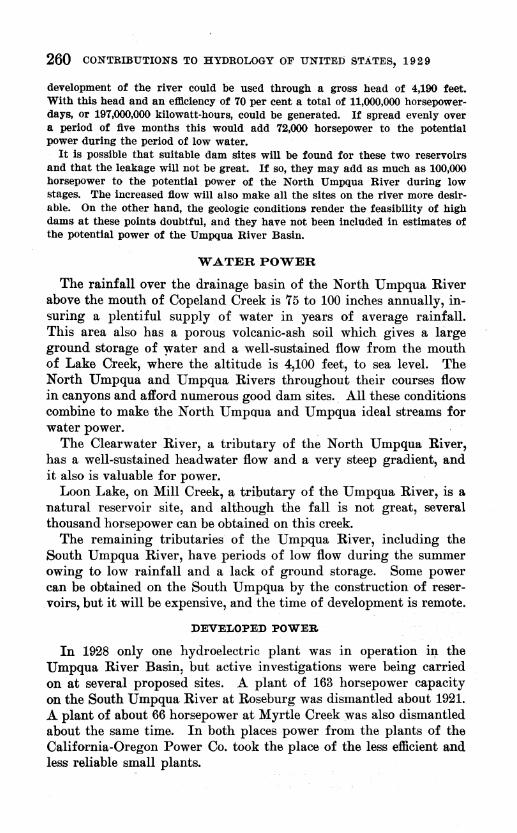
260 CONTRIBUTIONS TO HYDROLOGY OF UNITED STATES, 19 2 9
development of the river could be used through a gross head of 4,190 feet. With this head and an efficiency of 70 per cent a total of 11,000,000 horsepowerdays, or 197,000,000 kilowatt-hours, could be generated. If spread evenly over a period of five months this would add 72,000 horsepower to the potential power during the period of low water.
It is possible that suitable dam sites will be found for these two reservoirs and that the leakage will not be great. If so, they may add as much as 100,000 horsepower to the potential power of the North Umpqua River during low stages. The increased flow will also make all the sites on the river more desirable. On the other hand, the geologic conditions render the feasibility of high dams at these points doubtful, and they have not been included in estimates of the potential power of the Umpqua River Basin.
WATER POWER
The rainfall over the drainage basin of the North Umpqua River above the mouth of Copeland Creek is 75 to 100 inches annually, insuring a plentiful supply of water in years of average rainfall. This area also has a porous volcanic-ash soil which gives a large ground storage of ~ater and a well-sustained flow from the mouth of Lake Creek, where the altitude is 4,100 feet, to sea level. The North Umpqua and Umpqua Rivers throughout their courses flow in canyons and afford numerous good dam sites .. All these conditions combine to make the North UmpQua and Umpqua ideal streams for water power.
The Clearwater River, a tributary of the North Umpqua River, has a well-sustained headwater flow and a very steep gradient, and it also is valuable for power.
Loon Lake, on Mill Creek, a tributary of the Umpqua River, is a natural reservoir site, and although the fall is not great, several thousand horsepower can be obtained on this creek.
The remaining tributaries of the Umpqua River, including the South Umpqua River, have periods of low flow during the summer owing to low rainfall and a lack of ground storage. Some power can be obtained on the South Umpqua by the construction of reservoirs, but it will be expensive, and the time of development is remote.
DEVELOPED POWER
In 1928 only one hydroelectric plant was in operation il). the Umpqua River Basin, but active investigations were being carried on at several proposed sites. A plant of 163 horsepower capacity on the South Umpqua River at Roseburg was dismantled about 1921. A plant of about 66 horsepower at Myrtle Creek was also dismantled about the same time. In both places power from the plants of the California-Oregon Power Co. took the place of the less efficient and less reliable small plants.
WATER-POWER RESOURCES OF UMPQUA RIVER, OREGON 261
WINCHESTER POWER SITE (liiRB 1'7)
At the town of Winchester, north of Roseburg, in the NE. 14 sec. 25, T. 26 s., R. 6 W., on the North Umpqua River, a long wood dam creates a head of about 12 feet. The installation consists of three water wheels, with a rated capacity of 1,900 horsepower, and three generators, rated at 1,250 kilovoltamperes. There is an auxiliary steam engine with a capacity of 350 horsepower. As the potential power of the site with 12 feet head and the :fiow available for 50 per cent of the time is only 2,320 horsepower, the capacity of the plant can not be economically increased without raising the height of the dam, which does not appear to be feasible, as the left bank of the river is low at this point. However, this is a cheap development, near the market of Roseburg, and can probably be operated to advantage indefinitely. In con'sidering the potential power of the river this site has been combined with the site about 1~ miles upstream, for if the upper site is utilized this lower plant will be operated automatically from the upper plant, or the head will have to be developed by a canal, and the dam at this point will then be disc.arded.
Summary of potootiaZ power at developet!J site 12RB 17
[Head, 12 feet]
Flow in second·feet
90 per cent of time
50 per cent of time
Horsepower
OOper cent of time
50 per cent of time
---------------~--1------------Natural llow _ _ _ _ _ _ _ __ _ _ __ _ _ __ _ __ _ _ _ __ _ _ _ _ _ __ __ __ _ __ _ __ _ __ __ _ __ _ 960 Regulated llow ___ _ __ __ _ ___ _ _ _ __ _ __ _ _ _ _ _ _ _ _ __ __ _ _ _ _ _ _ _ _ _ _ _ _ _ __ _ _ I, 520 Regulated I! ow, I926 ______ ----------------------------- ________ I, 250
UNDEVELOPED POWER
2,420 2, 570 I,950
922 I,460 I,200
2, 320 2, 470 I,870
In outlining power projects and methods of operation in this report the object has been to set forth the maximum amount of power obtainable. In some 'places the head could be developed more cheaply by a conduit than by a high dam, but the dam would create a certain amount of storage, and although the use of the stored water at the single site Inight not justify the added cost, yet, if all the sites below were utilized~ the stored water would be worth considerably more than the difference in cost. The net gain in power due to drawing down the head at dams built primarily for power would amount to 108,000,000 kilowatt-hours. (See Table 10.)
As no estimates of stream flow for the upper basin are available for years before 1925, the power that could be obtained with storage was studied on the basis of the flow for the two years 1925 and 1926. The mean flow in 1925 was high, but the discharge for the summer was about normal, and that for the fall and early winter was low. The stream flow in 1926 was as low as any other of record. These two years therefore give a fair idea of what could be accomplished with storage. The estimates of power available with regulated flow
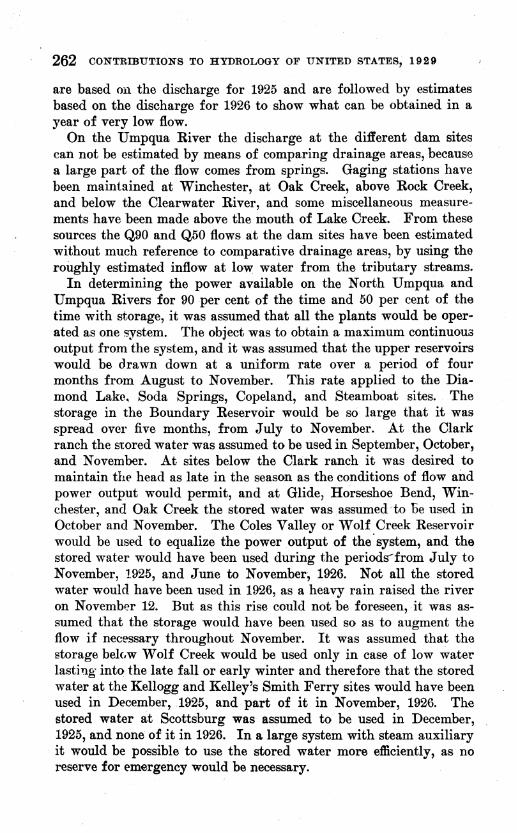
262 CONTRffiUTIONS TO HYDROLOGY OF UNITED STATES, 1929
are based on the discharge for 1925 and are followed by estimates based on the discharge for 1926 to show what can be obtained in a year of very low flow.
On the Umpqua River the discharge at the different dam sites can not be estimated by means of comparing drainage areas, because a large part of the .flow comes from springs. Gaging stations have been maintained at Winchester, at Oak Creek, above Rock Creek, and below the Clearwater River, and some miscellaneous measurements have been made above the mouth of Lake Creek. From these sources the Q90 and Q50 flows at the dam sites have been estimated without much reference to comparative drainage areas, by using the roughly estimated inflow at low water from the tributary streams.
In determining the power available on the North Umpqua and Umpqua Rivers for 90 per cent of the time and 50 per cent of the time with storage, it was assumed that all the plants would be operated as one system. The object was to obtain a maximum continuoua output from the system, and it was assumed that the upper reservoirs would be drawn down at a uniform rate over a period of four months from August to November. This rate applied to the Diamond Lake, Soda Springs, Copeland, and Steamboat sites. The storage in the Boundary Reservoir would be so large that it was spread over five months, from July to November. At the Clark ranch the stored water was assumed to be used in September, October, and November. At sites below the Clark ranch it was desired to maintain th~ head as late in the season as the conditions of flow and power output would permit, and at Glide, Horseshoe Bend, Winchester, and Oak Creek the stored water was assumed· to oe used in October and November. The Coles Valley or Wolf Creek Reservoir would be used to equalize the power output of the· system, and the stored water would have been used during the periods--from July to November, 1.925, and June to November; 1926. Not all the stored water would have been used in 1926, as a heavy rain raised the river on November 12. But as this rise could not be foreseen, ·it was assumed that the storage would have been used so as to augment the flow if necessary throughout November. It was assumed that the storage belc,w Wolf Creek would be used only in case of low water lasting into the late fall or early winter and therefore that the stored water at the Kellogg and Kelley's Smith Ferry sites would have been used in December, 1925, and part of it in November, 1926. The stored water at Scottsburg was assumed to be used in December, 1925, and none of it in 1926. In a large system with steam auxiliary it would be possible to use the stored water more efficiently, as no reserve for emergency would be necessary.
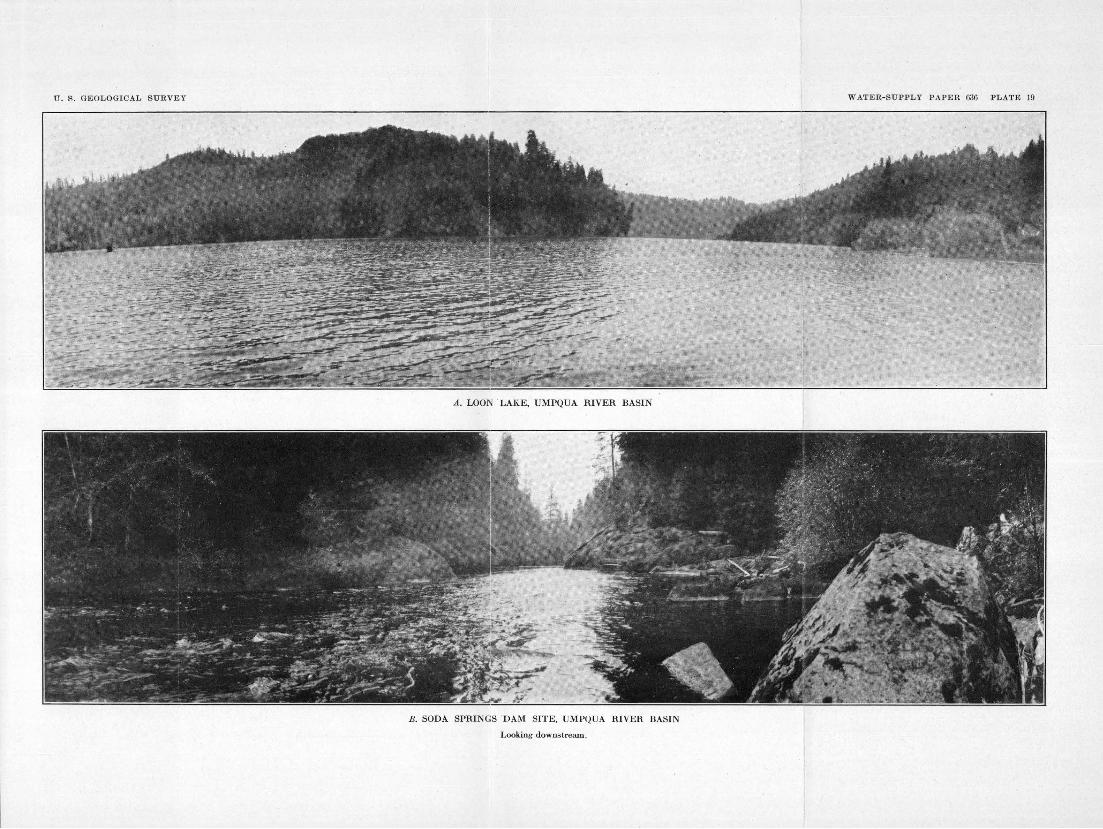
U. S. GEOLOGICAL SURVEY
A. LOON . LAKE, UMPQUA RIVER BASIN
B. SODA SPRINGS DAM SITE, UMPQUA RIVER I.IASIN
Looking downstream.
WATER-SUPPLY PAPER 636 PLATE 19
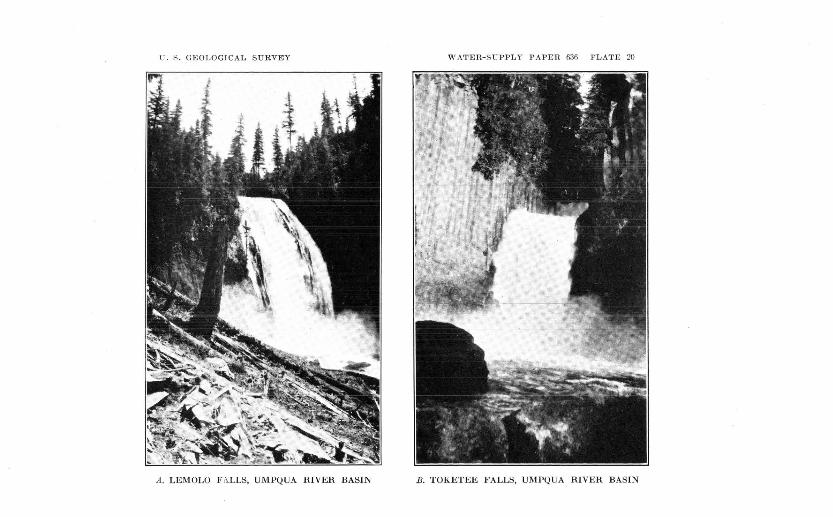
l J. ~ - GEOLOG ICAL SURVEY WATER-SUPPLY PAPER 636 PLAT E 20
A. LEMOLO F t\.LLS, UMPQUA RIVER BASIN B. TOKETEE FALLS, UMPQUA RIVER BASIN
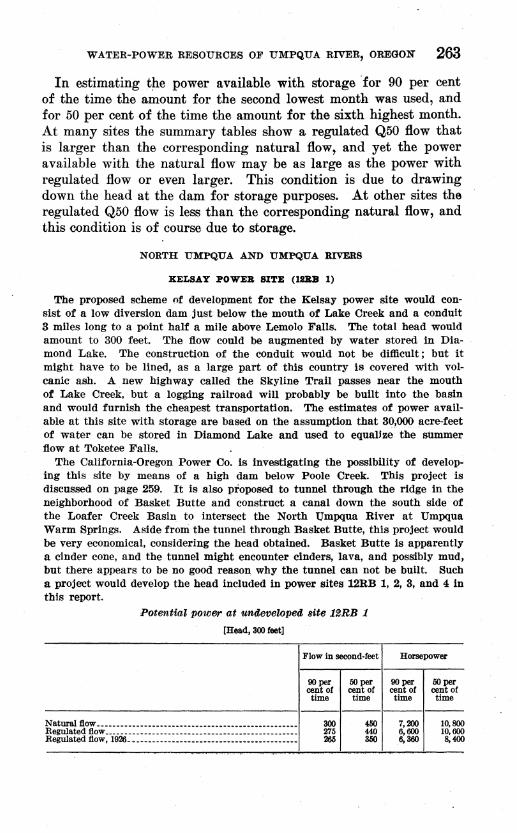
WATER-POWER RESOURCES OF UMPQUA RIVER, OREGON 263
In estimating the power available with storage for 90 per cent of the time the amount for the second lowest month was used, and for 50 per cent of the time the amount for the sixth highest month. At many sites the summary tables show a regulated Q50 flow that is larger than the corresponding natural flow, and yet the power available with the natural flow may be as large as the power with regulated flow or even larger. This condition is due to drawing down the head at the dam for storage purposes. At other sites the regulated Q50 flow is less than the corresponding natural flow, and this condition is of course due to storage.
NORTH UMPQUA AND UMPQUA RIVERS
KELSAY POWER SITE (18BB 1)
The proposed scheme of development for the Kelsay power site would consist of a low diversion dam just below the mouth of Lake Creek and a conduit 3 miles long to a point half a mile above Lemolo Falls. The total head would amount to 300 feet. The flow could be augmented by water stored in Diamond Lake. The construction of the conduit would not be difficult; but it might have to be lined, as a large part of this country is covered with volcanic ash. A new highway called the Skyline Trail passes near the mouth of Lake Creek, but a logging railroad will probably be built into the basin and would furnish the cheapest transportation. The estimates of power available at this site with storage are based on the assumption that 30,000 acre-feet of water can be stored in Diamond Lake and used to equalize the summer flow at Toketee Falls.
The California-Oregon Power Co. is investigating the possibility of developing this site by means of a high dam below Poole Creek. This project is discussed on page 259. It is also proposed to tunnel through the ridge in the neighborhood of Basket Butte and construct a canal down the south side of the Loafer Creek Basin to intersect the North Umpqua River at Umpqua Warm Springs. Aside from the tunnel through Basket Butte, this project would be very economical, considering the head obtained. Basket Butte is apparently a cinder cone, and the tunnel might encounter cinders, lava, and possibly mud, but there appears to be no good reason why the tunnel can not be built. Such a project would develop the head included in power sites 12RB 1, 2, 3, and 4 in this report.
Potentia~ power at unaeve~opea site 12RB 1 [Head, 300 feet]
Flow in second-feet
90per cent of time
50 per cent of time
Horsepower
90per cent of time
50 per cent of time
--------------------11---1---------Natural flow---------------------------------------------------Regulated flow _________________________________ ------ _________ _ Regulated flow, 1926. ___________ -------------------------- ____ _
300 275 265
450 440 350
7,200 6,600 6,360
10,800 10,600 8,400
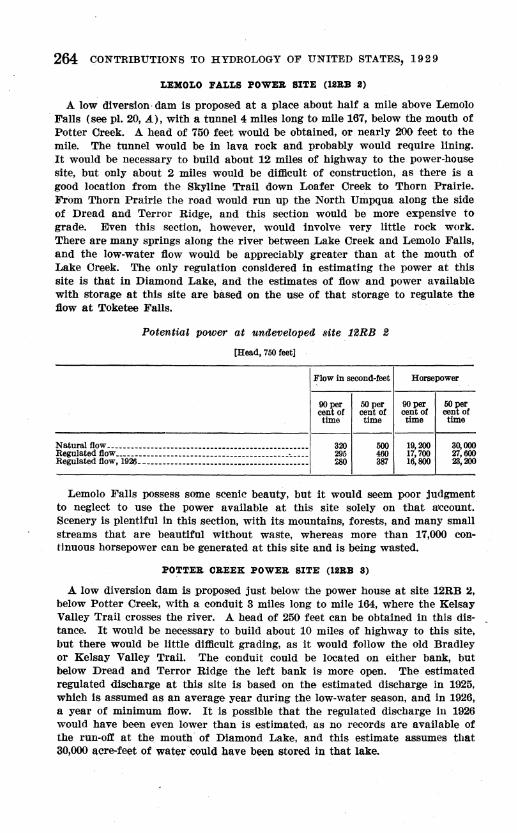
264 CONTRIBUTIONS TO HYDROLOGY OF UNITED STATES, 19 2 9
LEMOLO FALLS POWER SITE (ll!RB ll)
A low diversion· dam is proposed at a place about half a mile above Lemolo Falls (see pl. 20, A), with a tunnel 4 miles long to mile 167, below the mouth of Potter Creek. A head of 750 feet would be obtained, or nearly 200 feet to the mile. The tunnel would be in lava rock and probably would require lining. It would be necessary to build about 12 miles of highway to the power-house site, but only about 2 miles would be difficult of construction, as there is a good location from the Skyline Trail down Loafer Creek to Thorn Prairie. From Thorn Prairie the road would run up the North Umpqua along the side of Dread and Terror Ridge, and this section would be more expensive to grade. Even this section, however, would involve very little rock work. There are many springs along the river between Lake Creek and Lemolo Falls, and the low-water flow would be appreciably greater than at the mouth of Lake Creek. The only regulation considered in estimating the power at this site is that in Diamond Lake, and the estimates of flow and power available with storage at this site are based on the use of that storage to regulate the flow at Toketee Falls.
Potential power at undeveloped site 12RB 2
[Head, 750 feet]
Flow in second-feet Horsepower
OOper cent of time
50 per cent of time
90per cent of time
50 per cent of time
---------------------------------1---------------------Natural flow __________________________ ------- ________ ----- ____ _ Regulated flow----- __ ----- ________ -------------- ___ ----------- __ Regulated flow, 1926. __________ ------- ___ ------------ _________ _
320 295 :.so
500 19,200 460 17,700 387 16,800
30,000 27,600 23,200
Lemolo Falls possess some scenic beauty, but it would seem poor judgment to neglect to use the power available at this site solely on that a!ccount. Scenery is plentiful in this section, with its. mountains, forests, and many small streams that are beautiful without waste, whereas more than 17,000 continuous horsepower can be generated at this site and is being wasted.
POTTER CREEK POWER SITE (lliRB 8)
A low diversion dam is proposed just below the power house at site 12RB 2, below Potter Creek, with a conduit 3 miles long to mile 164, where the Kelsay Valley Trail crosses the river. A head of 250 feet can be obtained in this distance. It would be necessary to build about 10 miles of highway to this site, but there would be little difficult grading, as it would follow the old Bradley or Kelsay Valley Trail. The conduit could be located on either bank, but below Dread and Terror Ridge the left bank is more open. The estimated regulated discharge at this site is based on the estimated discharge in 1925, which is assumed as an average year during the low-water season, and in 1926, a year of minimum flow. It is possible that the regulated discharge in 1926 would have been even lower than is estimated, as no records are available of the run-off at the mouth of Diamond Lake, and this estimate assumes that 30,000 acre-feet of water cc;mld have been stored in that lake.
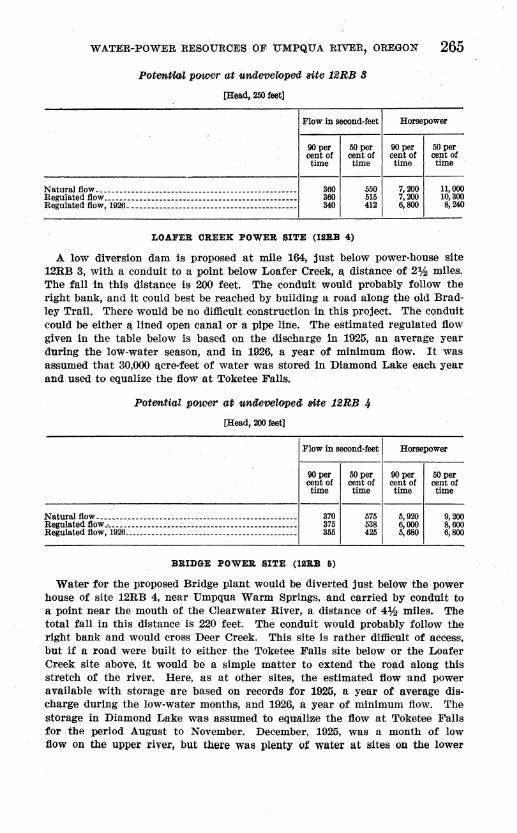
WATER-POWER RESOURCES OF UMPQUA RIVER, OREGON 265
Poten'UGJ power at undeveloped Bite 12RB 8
[Head, 250 feet]
Flow In second-feet
90per cent of time
50 per cent of time
Horsepower
90per cent of time
50 per cent of time
--------------------1------------Natural flow __ -------------------------------- __ ---------------Regulated flow _______________________________________ • _____ ----
Reguleted flow, 1926.------------------------------------------
360 360 340
LOAFER CREEX POWER SITE (llllll 4)
550 515 412
7,200 7,200 6,800
11,000 10,300 8,240
A low diversion dam is proposed at mile 164, ;lust below power-house site 12RB 3, with a conduit to a point below Loafer Creek, a, distance of 2% miles. The fall in this distance is 200 feet. The conduit would probably follow the right bank, and it could best be reached by building a road along the old Bradley Trail. There would be no difficult construction in this project. The conduit could be either f! lined open, canal or a pipe line. The estim.ated regulated flow given in the table below ·is based on the discharge in 1925, an average year during the low-water season, and in 1926, a year of minimum :flow. It was assumed that 30,000 acre-feet of water was stored in Diamond Lake each year and used to equalize the flow at Toketee Falls.
Potential ptMer at undeooZOped rite 12RB 4 [Head, 200 feet]
Flow In second-feet
90per cent of time
50 per cent of time
Horsepower
90per cent of time
50 per cent of time
-------------------1------------Natural flow __ ------------------- ___ ---------------------------
~=~::a g~: ;·"ili:lii:.::::::::::::::::::::::::::::::::::: ::::::: 370 375 355
BRIDGE POWER SITE (12RB li)
575 538 425
5,920 6,000 5,680
9,200 8,600 6,800
Water for the proposed Bridge plant would be diverted just below the power house of site 12RB 4, near Umpqua Warm Springs, and carried by conduit to a ·point near the mouth of the Clearwater River, a distance of 4% miles. The total fall in this distance is 220 feet. The conduit would probably follow the right bank and would cross Deer Creek. This site is rather difficult of access, but if a road were built to either the Toketee Falls site below or the Loafer Creek site above, it would be a simple matter to extend the road along this stretch of the river. Here, as at other sites, the estimated flow and power available with storage are based on records for 1925, a year of average discharge during the low-water months, and 1926, a year of minimum flow. The storage in Diamond Lake was assumed to equalize the flow at Toketee Falls for the period August to November. December, 1925, was a month of low flow on the upper river, but there was plenty of water at sites on the lower
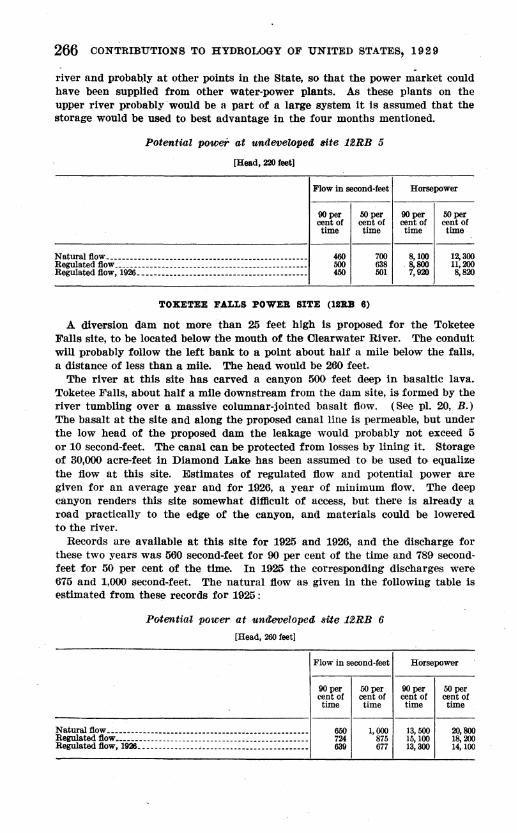
266 CONTRffiUTIONS TO HYDROLOGY . OF UNITED STATES, 19 2 9
-river and probab,ly at other points in the State, so that the power market could have been supplied from other water-power plants. As these plants on the upper river probably ·would be a part of a large system it is assumed that the storage would be used to best advantage in the four months mentioned.
Potential power at undeveZopecZ Bite 12BB 5
[Head, 220 feet]
Flow In second-feet
DOper cent of time
50 per cent of time
Horsepower
DOper cent.of time
50 per cent of time
---------------------------------r-----1---------------Natural flow. ___ -------------- ______ -------------------- __ -----
=:~ :~:;iii26.:-:::::::::::::::::::::::::::::::::::::::::: 460 liOO 400
TOKETEE FALLS POWER SITE (liiBB 8)
700 638 501
8,100 8,800 7,931
12,300 11,:110 8,820
A diversion dam not more than 25 feet high is proposed for the Toketee Falls site, to be located below the mouth of the Clearwater River. The conduit will probably follow the left bank to a point about half a mile below the falls, a distance of less than a mile. The head would be 260 feet.
The river at this site has carved a canyon 500 feet deep in basaltic lava. Toketee Falls, about half a mile downstream from the dam site, is formed by the river tumbling over a massive columnar-jointed basalt flow. (See pl. 20, B.) The basalt at the site and along the proposed canal line is permeable, but under the low head of the proposed dam the leakage would probably not exceed 5 or 10 second-feet. The canal can be protected from losses by lining it. Storage of 30,000 acre-feet in Diamond Lake has been assumed to be used to equalize the flow at this site. Estimates of regulated flow and potential power are given for an average year and for 1926, a year of minimum flow. The deep canyon renders this site somewhat difficult of access, but there is already a road practically to the edge of the canyon, and materials could be lowered to the river.
Records are available at this site for 1925 and 1926, and the discharge .for these two years was 560 second-feet for 90 per cent of the time and 789 secondfeet for 50 per cent of the time. In 1925 the corresponding discharges were 675 and 1,000 second-feet. The natural flow as given in the following table is estimated from these records for 1925:
Potential po·wer at untlevelopecZ sUe 12BB 6
[Head, 200 feet]
Natural flow __________________________________________________ _
Regulated flow---------- ______ ------- ________ ------------------Regulated flow, 1928 _______ --------"---------------------------
Flow in second-feet
90per cent of time
650 724 639
50 per cent of time
1,000 875 677
Horsepower
90per cent of time
13,500 15,100 13,300
50 per cent of time
20,800 18,:110 14, 100
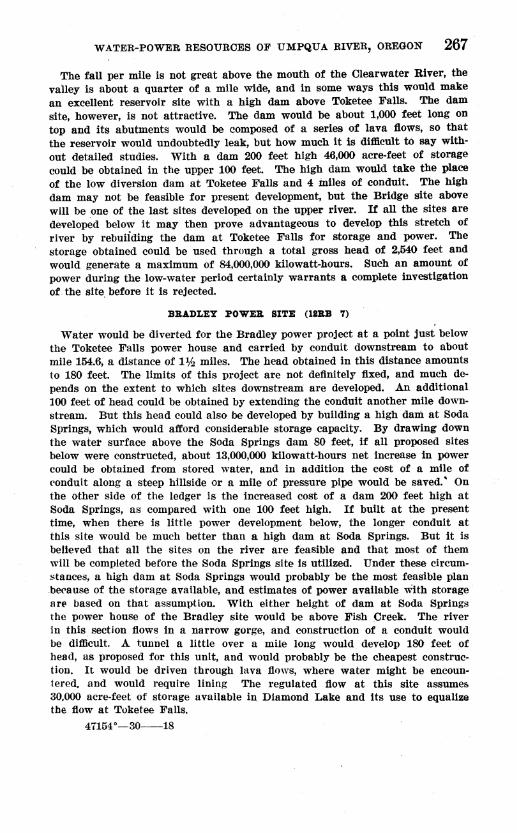
WATER-POWER RESOURCES OF UMPQUA RIVER, OREGON 267
The fall per mile is not great above the mouth of the Clearwater River, the valley is about a quarter of a mile wide, and in some ways this would make an excellent reservoir site with a high dam above Toketee Falls. The dam site, however, is not attractive. The dam would be about 1,000 feet long on top and its abutments would be composed of a series of lava :flows, so that the reservoir would undoubtedly leak, but how much it is difficult to say without detailed studies. With a dam 200 feet high 46,000 acre-feet of storage could be obtained in the upper 100 feet. The high dam would take the place of the low diversion dam at Toketee Falls and 4 iniles of conduit. The high dam may not be feasible for present development, but the Bridge site above will be one of the last sites developed on the upper river. If all the sites are developed below it may then prove advantageous to develop this stretch of river by rebuilding the dam at Toketee Falls for storage and power. The storage obtained could be used through a total gross head of 2,540 feet and would generate a maximum of 84,000,000 kilowatt-hours. Such an amount of power during the low-water period certainly warrants a complete investigation of. the site. before it is rejected.
BRADLEY POWElL SITE (liBB '7)
Water would be diverted for the Bradley power project at a point just below the Toketee Falls power house and carried by conduit downstream to about mile 154.6, a distance of 1% miles. The head obtained in this distance amounts to 180 feet. The limits of this project are not definitely fixed, and much depends on the extent to which sites downstream: are developed. An additional 100 feet of head could be obtained by extending the conduit another mile downstream. But this head could also be developed by building a high dam at Soda Springs, which would afford considerable storage capacity. By drawing down the water surface above the Soda Springs dam . 80 feet, if all proposed sites below were constructed, about 13,000,000 kilowatt-hours net increase in power could be obtained from stored water, and in addition the cost of a mile of <·onduit along a steep hillside or a mile of preseure pipe would be saved. • On the other side of the ledger is the increased cost of a dam 200 feet high at Soda Springs, as compared with one 100 feet high. If built at the present time, when there is little power development below, the longer conduit at this site would be much better than· a high dam at Soda Springs. But it is believed that all the sites on the river are feasible and that most of them will be completed before the Soda Springs site is utilized. Under these circumstances, a high dam at Soda Springs would probably be the most feasible plan .be<'ause of the storage available, and estimates of power available with storage are based on that assumption. With either height of dam at Soda Springs the power house of the Bradley site would be above Fish Creek. The river in this section flows in a narrow gorge, and construction of a conduit would be difficult. A tunnel a little over a mile long would develop 180 feet of head, as proposed for this unit, and would probably be the cheapest construction. It would be driven through lava flows, where water might be encountered. and would require lining The regulated flow at this site assume& 30,000 acre-feet of storage available in Diamond Lake and its use to equallze the flow at Toketee Falls.
47154°--30----18
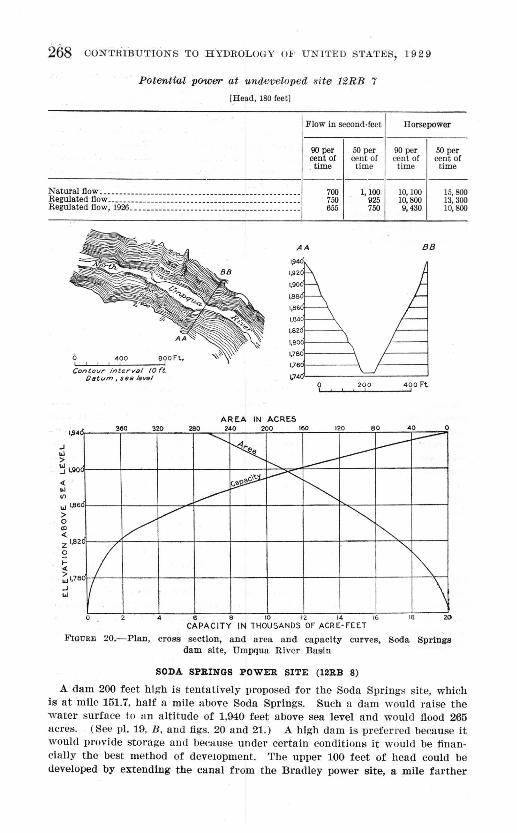
268 CONTRiBUTIONS TO HYDROLOGY OF U N ITED STATES, 1929
Potential power at undev·elopea· si te 1'2RB 7
[Head, 180 feet]
Flow in second-feet Horsepower
90 per cent of time
50 per cent of time
90 per cent of time
50 per cent of time
------------------1--- - - -------Natural !low------------------ --- ------------------- __________ _ 700
750 655
1,100 925 750
10,100 10,800 9, 430
Regulated flow __ ___ ____ ___________ __ __ ______________ _________ _ _ Regulated flow, 1926. __ -- ------ --------------- -----------------
Contour 1ntervel tOrt.
1,94
-' I.J > j I,IXl
< I.J If)
I.J 1,8
> 0
"' < z 1,8
0
t-
60
20
Ot~tum, sea level
300 320
v v
260
AA 1~.0
88
1,780)1-----\
1,760ll------\
~40)L-----~~---~
0 200 400Ft.
AREA IN ACRES 240 200 160 120 eo 40
............
~ --:---1----. --~ ~
e
l----~ ~
~ D,
"' 1\
15,800 13,300 10,800
0
< ;::,\7 -' I.J
8/ 1/ \ 0 4 6 B 10 12. 14 16 18 2()
CAPACITY IN THOUSANDS OF ACRE-FEET
FIGURE 20.-Pian, cross section., and area and capacity curves, Soda Springs dam site, Umpqua River Basin
SODA SPRINGS POWER SITE (12RB 8)
A dam 200 feet high is tentatively proposed for the Soda Springs site, which is at mile 151.7, half a mile above Soda Springs. Such a dam would raise the water surface to an altitude of 1,940 feet above sea level and would flood 265 acres. (See pl. 19, B, and figs. 20 and 21.) A high dam is preferred because it would provide storage and because under certain conditions it would be financially the best method of develOpment. The upper 100 feet of head could be developed by extending the canal from the Bradley power site, a mile farther
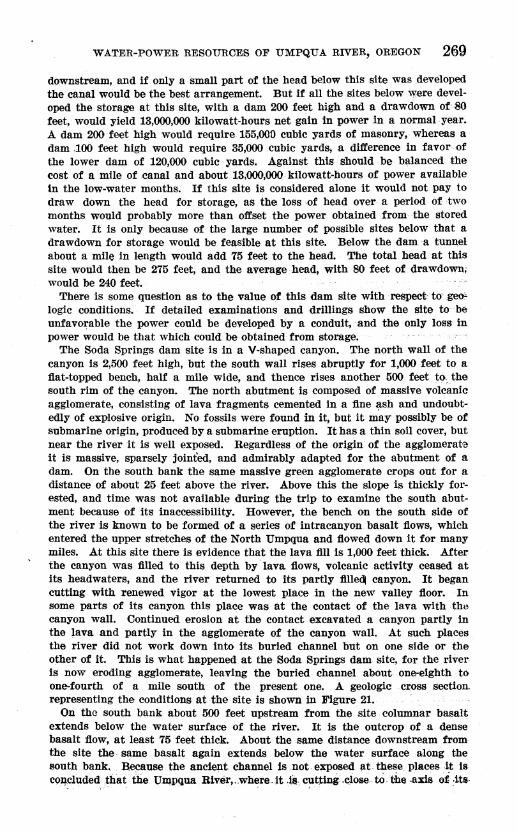
WATER-POWER RESOURCES OF UMPQUA RIVER, OREGON 2(i)9
downstream, and if only a small part of the head below this site was developed the canal would be the best arrangement. But if all the sites below were developed the storage at this site, with a dam 200 feet high and a drawdown of 80 feet, would yield 13,000,000 kilowatt-hours net gain in power in a normal -year. A dam 200 feet high would require 155,000 cubic yards of masonry, whereas a dam .100 feet high would require 35,000 cubic yards, a diJierence in favor {)f the lower dam. of 120,000 cubic yards. Against this should -be balanced the cost of a mile of canal and about 13,000,000 kilowatt-hours of power available tn the low-water months. If this site is considered alone it would not pay to draw down the head for storage, as the loss -of head over a period of -two months would probably more than offset the power obtained from• the stored water. It is only because of the large number of possible sites below that a drawdown for storage would be feasible at this site. Below the dam -a tuni\el about a mile in length would add 75 feet to the head. The total head at thls site would then be 275 feet, and the average head, with 80 feet of drawdown,· would be 240 feet.
There is some question as to the value of this dam site with ·resPect- to- gao"
logic conditions. If detailed examinations and drillings show the site to be unfavorable the power could be developed by a conduit, and the only loss in power would be that which could be obtained- from storage.
The Soda Springs dam site is in a V-shaped canyon. The north wall of the canyon is 2,500 feet high, but the south wall rises abruptly for 1,000 feet to a fiat-topped bench, half a mile wide, and thence rises another 500 feet _to. the south rim of the canyon. The north abutment is composed of massive volcanic agglomerate, consisting of lava fragments cemented in a fine ~sh and undoubtedly of explosive origin. No fossils were found in it, but it may possibly be of submarine origin, produced by a submarine eruption. It has a thin soil cover, but near the river it is well exposed. Regardless of the origin of the agglomerat-e it is massive, sparsely joint'ed, and admirably adapted for the abutment of a dam. On the south bank the same massive green agglomerate crops out for a distance of about 25 feet above the river. Above this the slope is thickly forested, and time was not available during the trip to examine the south abutment because of its inaccessibility. However, the bench on the south side of the river is known to be formed of a series of intracanyon basalt :flows, which entered the upper stretches of the North Umpqua and flowed down it for many miles. At this site there is evidence that the lava fill is 1,000 feet thick. After the canyon was filled to this_ depth by ·lava fiows, volcanic activity ceased at its headwaters, and the river returned to its partly fille~ canyon. It began cutting with renewed vigor at the lowest place in the new valley . fioor. -In some parts of its canyon this place was at the contact of the lava with the canyon wall. Continued erosion at the contact excavated a canyon partly in the lava and partly in the agglomerate of the canyon wall. At such places the river did not work down into its buried channel but on one side or the other of it. This is what happened at the Soda Springs dam site, for the river is now eroding agglomerate, leaving the buried channel about one-eighth tO one-fourth of a mile south of the present one. A geologic cross section. representing the conditions at the site is shown in Figure 21. ·
On the south bank about 500 feet upstream from the site columnar basalt extends below the water surface of the river. It is the outcrop of a. dense basalt fiow, at least 75 feet thick. About the same distance downstream from the site the- same basalt again extends below the water surface along the south bank. Because the anciept. channel is .not. exposed at. these places .it is con,c.l1,1ded ,that. the Umpqua. River, .. where. it ,U!. cu~ .ciose .. tO. the -axis oi :its-.. ., .. · . . '
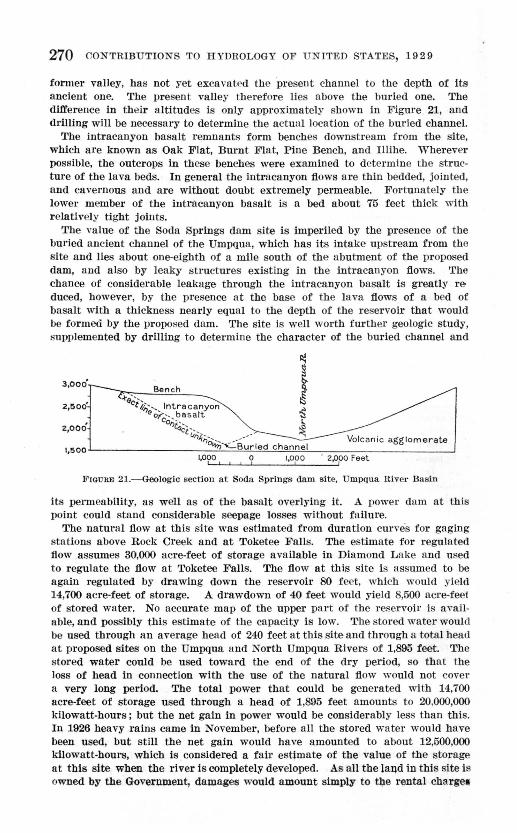
270 CONTRIBUTIONS TO HYDROLOGY OF UNITED STATES, 19 2 9
former valley, has not yet excavated the present channel to the depth of its ancient one. The present valley therefore lies above the buried one. The difference in their a ltitudes is only approximately shown in Figure 21, and drilling will be necessary to determine the actual location of the buried channel.
The intracanyon basalt remnants form benches downstream from the site, which are known as Oak Flat, Burnt Flat, Pine Bench, and Illihe. Wherever possible, the outcrops in these benches were examined to det ermine the structure of the lava beds. In general the intracanyon flows are thin bedded, jo inted, and cavernous and are without doubt extremely permeable. Fortunately the lower member of the intracanyon basalt is a bed about 75 feet thick with r elatively tight joints.
The value of the Soda Springs dam site is imperiled by the presence of the bmied ancient channel of the Umpqua, which has its intake upstream from the site and lies about one-eighth of a mile south of the abutment of the proposed dam, and also by leaky structures existing in the intracanyon flows. The chance of considerable leakage through the intracanyon basalt is greatly re duced, however, by the presence at the base of the lava flows of a bed of basalt with a thickness nearly equal to the depth of the reservoir that would be formed by the proposed dam. 'fhe site is well worth further geologic study, supplemented by drilling to determine the character of the buried channel and
FIGURE 21.---Geologic section at Soda Springs dam site, U mpqua River Basin
its permeability, as well as of the basalt overlying it. A power dam at this point could stand considerable seepage losses without failure.
The natm-al flow at this site was estimated from duration curves for gaging stations above Rock Creek and at Toketee Falls. The estimate for regulated flow assumes 30,000 acre-feet of storage available in Diamond Lake and used to regulate the flow at Toketee Falls. The flow at this site is assumed to be again regulated by drawing down the reservoir 80 feet, which would yield 14,700 acre-feet of storage. A drawdown of 40 feet would yield 8,500 acre-feet of stored water. No accurate map of the upper pa r t of the reservoir is available, and possibly this estimate of the capacity is low. The stored water would be used through an average head of 240 feet at this site and through a total head at proposed sites on the Umpqua and North Umpqua Rivers of 1,895 feet. The stored water could be used toward the end of the dry period, so that the loss of head in connection with the use of the natural flow would not cover a very long period. The total power that could be generated with 14,700 acre-feet of storage used through a head of 1,895 feet amounts to 20,000,000 kilowatt-hours; but the net gain in power would be considerably less than this. In 1926 heavy rains came in November, before all the stored water would have been used, but still the net gain would have amounted to about 12,500,000 kilowatt-hours, which is considered a fair estimate of the value of the storage at this site when the river is completely developed. As all the lalld in this site is owned by the Government, damages would amount simply to the rental charges
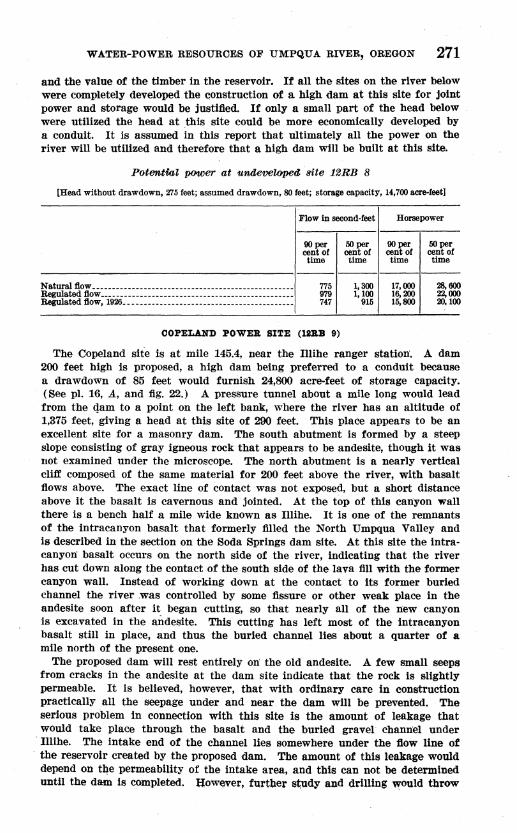
WATER-POWER RESOURCES OF UMPQUA RIVER, OREGON 271
and the value of the timber in the reservoir. If all the sites on the river below were completely developed the construction of a high dam at this site for joint power and storage would be justified. If only a small part of the head below were utilized the head at this site could be more economically developed by a conduit. It is assumed in this report that ultimately all the power on the river will be utilized and therefore that a high dam will be built at this site.
Potern.tml power at undeve/.operl site 1'/!RB 8
[Head without drawdown, 2:75 feet; assumed drawdown, 80 feet; storage capacity, 14,700 acre-feet]
Flow in second-feet Horsepower
OOper cent or time
50 per cent of time
OOper cent of time
50 per cent of time
--------------------------------Natural flow ...... _______________ ._. _______________________ . __ _ Regulated flow ____ . ____ . ________ . __ . _______ .. _________________ _
Regulated flow, 1926. __ ----------------------------------------
775 979 747
COPELAND POWER SITE (lliRB 9)
1, 300 17,000 1, 100 16, 200
915 15,800
28,600 22,000 20, 100
The Copeland sit·e is at mile 145.4, near the Illihe ranger station. A dam 200 feet high is proposed, a high dam being preferred to a conduit because a drawdown of 85 feet would furnish 24,800 acre-feet c>f storage capacity. (See pl. 16, A, and fig. 22.) A pressure tunnel about a mile long would lead from the qam to a point on the left bank, where the river has an altitude of 1,375 feet, giving a head at this site of 290 feet. This place appears to be an excellent site for a masonry dam. The south abutment is formed by a steep slope consisting of gray igneous rc>ek that appears to be andesite, though it was not examined under the microscope. The north abutment is a nearly vertical cliff composed of the same material for 200 feet above the river, with basalt flows above. The exact line of contact was not exposed, but a short distance above it the basalt is cavernous and jointed. At the top of this canyon wall there is a bench half a mile wide known as Illihe. It is one of the remnants c>f the intracanyon basalt that formerly filled the North Umpqua Valley and is described in the section on the Soda Springs dam site. At this site the intracanyon basalt occurs on the north side of the river, indicating that the river has cut down along the contact of the south side of the lava fill with the former canyon wall. Instead of working down at the contact to its former buried channel the river .was controlled by some fissure or other weak place in the andesite soon after it began cutting, so that nearly all of the new canyon is excavated in the andesite. This cutting has left most c>f the intracanyon basalt still in place, and thus the buried channel lies about a quarter of a mile north of the present one.
The proposed dam will rest entirely on the old andesite. A few small seeps from cracks in the andesite at the dam site indicate that the rock is slightly permeable. It is believed, however, that with ordinary care in construction practically all the seepage under and near the dam will be prevented. The serious problem in connection with this site is the amount of leakage that would take place through the basalt and the buried gravel channel under Illihe. The intake end of the channel lies somewhere under the flow line of
· the reservoir created by the proposed dam. The amount of this leakage would depend on the permeability of the intake area, and this can not be determined until the dam is completed. However, furtller study and drilling would throw
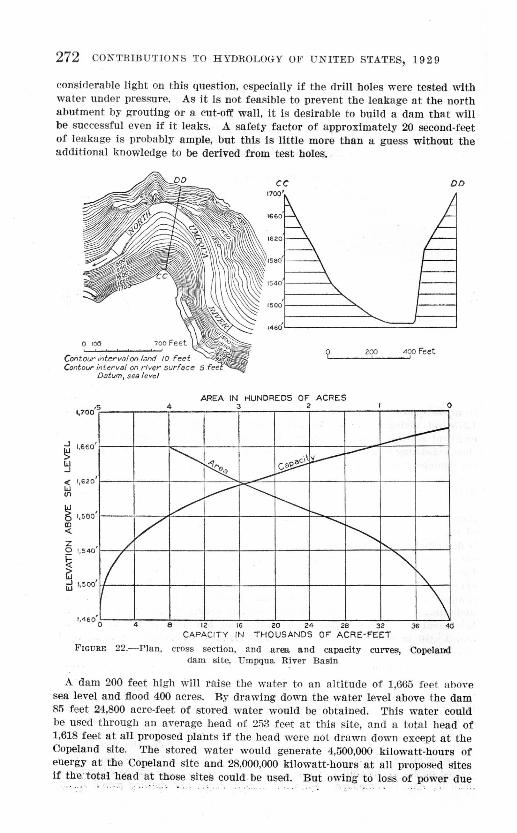
272 CONTRIBUTIONS TO HYDROLOGY OF UNITED STATES, 19 2 9
considerable light on this question, especially if the dril! holes were tested with water under pressure. As it is not feasible to prevent the leakage at the north abutment by grouting or a cut-off wall, it is desirable to build a dam that will be successful even if it leaks. A safety factor of approximately 20 second-feet of leakage is probably ample, but this is little more than a guess without the additional knowledge to be derived from test holes.
o roo
cc 17001
Contour interval on land 10 feet Contour i'nterval on river" surface 5
Ostum, sea leve l
9L ___ z'f.._ __ 4_,'f Feet
voo ·5
~ 1,660
w .J
< 1,~20 w U1
~ 1, 580 (I)
< z
'
'
'
L 0 1,540
~ i;j Ji
/
AREA IN H.UNDREDS OF' ACRES 4 3 2
L---:: ~
~ ~ ~ ~
~ a
~
v v--~ ~
............
~ ' ~
~
DD
0
~ 1,500
\ 1,460 0
4 B 12 16 20 24 28 32 36 CAPACITY IN THOUSANDS OF ACRE-FEET
F IGURE 22.-P!an, cross section, and area and capacity curves, Copela.nd dam site, Umpqua River Basin
A dam 200 feet high will raise the water to an altitude of 1,665 feet above sea level and flood 400 acres. By drawing down the water level above the dam 85 feet 24,800 acre-feet of stored water would be obtained. This water could be used through an average head of 253 feet at this site, and a total head of 1,618 feet at all proposed plants if the head were not drawn down except at the Copeland site. The stored water would generate 4,500,000 kilowatt-hours of energy at the Copeland site and 28,000,000 kilowatt-hours · at all proposed sites if the·total head at those siteseould be used. But owing to loss. of power due
WA'l'ER-POWER RESOURCES OF UMPQUA RIVER, OREGON 273
to loss of head at Copeland and to the decrease in 'head at lower ·sites due to drawing down the level for storage, the net gain from the use of stored water in 1926 would have amounted to 19,000,000 kilowatt.hours. This estiiilate is based on the fact that the natural flow greatly increased by the end of November in 1926. If the flow remained low for December the net gain from the storage would be considerably less. But the chances are greatly in· favor ofa fairly large flow in December on the North Umpqua River below· Steamboat Creek, and such a flow is practically certain on theUmpqua,River proper.. T-he loss of power due to loss of head at the Copeland site would average about 2,520 horsepower, and in 100 days it would equal the power obtained at the dam from the stored water. So if this site is considered by itself the head could be ·drawn down for storage to advantage for 61 days in September and October, assuming that the flow would increase in November. This site, however, will not be utilized until other more accessible sites below are developed, and each will add to the value of the storage that can be obtained by drawing down the head at this site.
The following estimates of regulated flow and power available show the result if the storage had been used in 1925 and 1926 to insure a uniform flow during a period of four months. This scheme does not give the best results at this site, but for the river as a whole it works out fairly well, as the power output can be equalized by the operation of the proposed large reservoir at Wolf Creek.
Summary of potential power at site 1'2RB 9
[Head without drawdown, 290 feet; assumed drawdown, 8li feet; storage capacity, 24,800 acre-feet]
Flow in second-feet Horsepower
90per cent of time
OOper cent of time
90per cent of time
roper cent of time
-------------------11------------Natural flow ........................................ c.......... 825 Regulated flow ... ---------------------------------------------- 1,020 Regulated flow, 1926........................................... 757
STEAMBOAT POWER SITE (liiRB 10)
1, 400 19,100 1, 280 18, 900
940 17,400
32,400 32,400 21,800
The dam site for the Steamboat power project is at mile 137lh, 2lh miles above the mouth of Steamboat Creek. A concrete dam 190 feet high, which would raise the water level to an altitude of 1,375 feet, is proposed. (See pl. M, A, and flg. 23.) The reservoir would help to smooth out the peak flow of floods, as a rise of 1 foot would store a flow of 4,300 second-feet for 1 hour.
At this site the river has 'cut through what appears to be a thick .Uabase sJll intruded into volcanic agglomerate. The walls of the canyon are steep and rugged, and rock is well exposed. _IJ; strikes N. 72" W. and dips 18" NE. The diabase is a member of an old formation, probably of Eocene age. There are enough joints to cause some seepage under and around the dam, hence it will probably pay to grout the foundations to prevent leajkage. The rock is strong and forms a satisf~ctory dam site. As the seepage at this site will not affect lhe stability of the dam nor increase with time, it might even be disregarded with safety. The site is a considerable distance downstream from lllihe, the last large remnant of intracanyon basalt, hence there need be no fear of buried channels on either side of the river.
A dam 190 feet high would flood 365 acres, and by drawing down the water 75 feet 19,000 acre-feet Qf stored water would be obtained. This water could
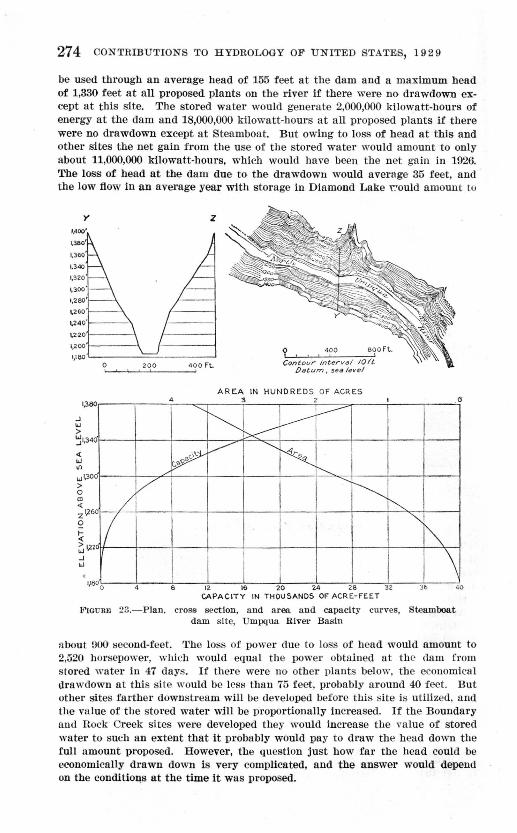
27 4 CONTRffiUTIONS TO HYDROLOGY OF UNITED STATES, 19 2 9
be used through an average head of 155 feet at the dam and a maximum head of 1,330 feet a t all proposed plants on the r iver if there were no drawdown except at this site. The stored water would generate 2,000,000 kilowatt-hours of energy at the dam and 18,000,000 kilowatt-hours at a ll proposed plants if there were no drawdown except at Steamboat. But owing to loss of head at this and other sites the net gain from the use of the stored water would amount to only about 11,000,000 kilowatt-hours, which would have been the net gain in 1926. The loss of head at the dam due to the drawdown would average 35 feet, and the low flow in an average year with storage in Diamond Lake \.'OUld amount to
y
1~oo·
1,180''------==-- ----' 9 . . 400 BOO Ft.
Cont our 1
in~er v8/ IOI'l !Jatum, sea level
0 200 400ft. '--'---"-'--'-------'
1,380
J
"' > 'jl,34
<( w
"' w \30 > 0
"' <(
z'.26 0
~ ~1,2
0/
201 J w .
4
'-.._
~ v
I
AREA IN HUNDRED S Of ACRES 3
~ ------~
tx----v -.........
~ 1'--..
---~ ~
0 \18 0 8 12. 16 20 24 28 32 CAPACITY IN THOUSANDS Of ACRE-FEE:T
""' ""' \
36 40
FIGURE 23.-Pian, cross section, and nrea and capacity curves, Steamboat dam s ite, Umpqua River Basin
about 900 second-feet. The loss of power clue to loss of head would amount to 2,520 horsepower, which would equal the power obtained at the dam from stored water in 47 clays. If there were no other plants below, the economica l drawclown at this site would be less than 75 feet, probably around 40 feet. But other sites farther downstream will be developed before this site is utilized, and the value of the stored water will be proportionally increased. If the Boundary and Rock Creek sites were developed they would increase the value of stored water to such an extent that it probably would pay to draw the head down the full amount proposed. However, the question just how far the head could be economically drawn down is very complicated, and the answer would depend on the conditio~s at the time it was proposed.
WATER-POWER RESOURCES OF· UMPQUA RIVER, OREGON 275
In computing the power available at this site with storage it is assumed that -all sites above will have been developed and that the storage capacity at this site will be used to equalize the flow in August, September, October, and November.
Summary of potentiai power at site 12RB 10
(Head without drawdown, 190 feet; assumed drawdown, 75 feet. Storage capacity, 19,000 acre-feet]
Flow in second-feet
90per cent of time
50 per cent of time
Horsepower
90per cent of time
50 per cent of time
------------------1------------Natural flow---------- _______ -----·---- _____ .------------------Regulated flow---·- __ ... __ .•... __ ... __ ..... __ ... ____ .. __ -------Regulated flow, 1926 ..• ----------------------------------------
850 1,050
767
BOUNDARY POWER SITE (lllli.B 11)
1, 500 1,320
965
12,900 11,900 11,700
22,800 20,100 14,700
A dam 225 feet high is proposed at the Boundary site, which is near the west boundary of the Umpqua National Forest, 1 mile below Fall Creek, in the NW. 1,4 sec. 17, T. 26 S., R. 1 W., on the North Umpqua River. (See pl. 21, B.)
This dam site is in a canyon about 500 feet deep with nearly vertical cliffs of columnar-jointed lava rock 300 feet high. A specimen from this site was determined under the microscope by C. S. Ross, of the United States Geological Survey, to be andesite. It contains large crystals of glassy feldspar in a dark groundmass. It is very similar to the porphyritic andesite of the Rock Creek site. Not all the jointing in the canyon walls is vertical, for some of it is nearly horizontal or lies at intermediate angles.
Drilling by the California-Oregon Power Co. was in progress at this site in 1926, and Mr. E. C. Koppen furnished the available logs. Surprising as it may seem, the immense igneous mass that forms the canyon at this place has been nearly sawed through by the river. One drill hole 85 feet deep had been completed on the north bank of the river at the time of visit. This hole passed through the andesite in 28 feet and encountered a bed oj. gray basalt 27 feet thick, beneath which lay 23 feet of black shaly tuff and agglomerate. A hole inclined 45" had just been started in the river bed. The log of the completed hole is given in the table below :
Log of hole No. 1 of Boundary dam site, North Umpqua River
Columnar andesite·-------------------------------------------------------------
~:~t~~~~-t-~~=~~~~:::~~=~:::::::::::::::::::::::::::::::::::::::::::::::::::: Shaly tutl (?) ••• ------------------------------ ___ -------------------------------Basalt.._ ... ____ •.. __ .......... ----.--.-----------------------------------------Hard black tufL ............... c •••••••••••••••••••••••••••••••••••••••• ~-------Agglomerate ___________________________________________________________________ _
Thickness Depth
Feet 28 3 2 2
27 8
15
Feet 28 31 33 35 62 70 85
It is evident that the basalt between 35 and 62 feet in this hole is a sill and has been intruded into the sediments. The 2-foot bed of basalt above it Is probably a thin offshoot from this sill. The massive andesite that would form the abutments of the dam site is probably a sill also, although this
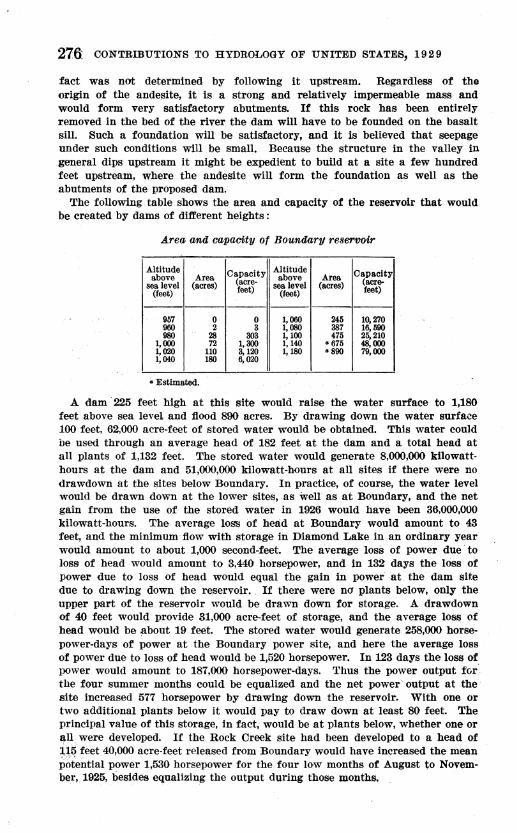
276: CONTRIBUTIONS .TO HYDROLOGY OF UNITED STATES, 1929
fact was not determined by following it upstream. Regardless of the origin of the andesite, it is a strong and relatively impermeable mass and would form very satisfactory abutments. If this rock has been entirely removed in the bed of the river the dam will have to be founded on the basalt sill. Such a foundation will be satisfactory, and it is believed that seepage under such conditions will be small. Because the structure in the valley in general dips upstream it might be expedient to build at a site a few hundred feet upstream, where the andesite will form the foundation as well as the abutments of the proposed dam.
The following table shows the area and capacity of the reservoir that would be created by dams of ditrerent heights:
Area and capacUy of Boundary rese1'1X)ir
Altitude Capacity Altitude Capacity above Area above Area sealevel {acres) (acre- sealevel {acres) (acre-
(feet) feet) (feet) feet)
---------957 0 0 1,060 245 10,270 960 2 3 1,080 387 16,5110 980 28 303 1,100 475 25,210
1,000 72 1,300 1,140 • 675 48,000 1,020 110 3,120 1,180 •890 79,000 1,040 180 6,020
• Estimated.
A dam· 225 feet high at this site would raise the water surface to 1,180 feet above sea level and flood 890 acres. By drawing down the water surface 100 feet, 62,000 acre-feet of stored water would be obtained. This water could be used through an average head of 182 feet at the dam and a total head at all plants of 1,132 feet. The stored water would generate 8,000,000 kilowatthours at the dam and 51,000,000 kilowatt-hours at all sites if there were no drawdown at the sites below Boundary. In practice, of course, the water level would be drawn down at the lower sites, as well' as at Boundary, and the net gain from the use of the stored water in 1926 would have been 36,000,000 kilowatt-hours. The average loss of head at Boundary would amount to 43 feet, and the minimum· flow with storage in Diamond Lake in an ordinary year would amount to about 1,000 second-feet. The average loss of power due to loss of head would amount to 3,440 horsepower, and in 132 days the loss of power due to loss of head would equal the gain in power at the dam site due to drawing down the reservoir .. If there were nO' plants below, only the upper part of the reservoir would be drawn down for storage. A drawdown of 40 feet would provide 31,000 acre-feet of storage, and the average loss of head would be ~bout 19 feet. The stored water would generate 258,000 horsepower-days of power at the Boundary power site, and here the average loss of power due to loss of head would be 1,520 horsepower. In 123 days the loss of power would amount to 187,000 horsepower-days. Thus the power output for~ the four summer months could be equalized and the net power' output at the· site increased 577 horsepower by drawing down the reservoir. With one or two additional plants below it would pay to draw down at least 80 feet. The principal value of this storage, in fact, would be at plants below, whether one or f!.ll .. were developed. If the Rock Creek site had been developed to a head of H~ feet 40,000 acre-feet released from Boundary would have increased the mean potential power 1,530 horsepower for the four low months of August to November, 1925, I)esides equalizing the output during those months.
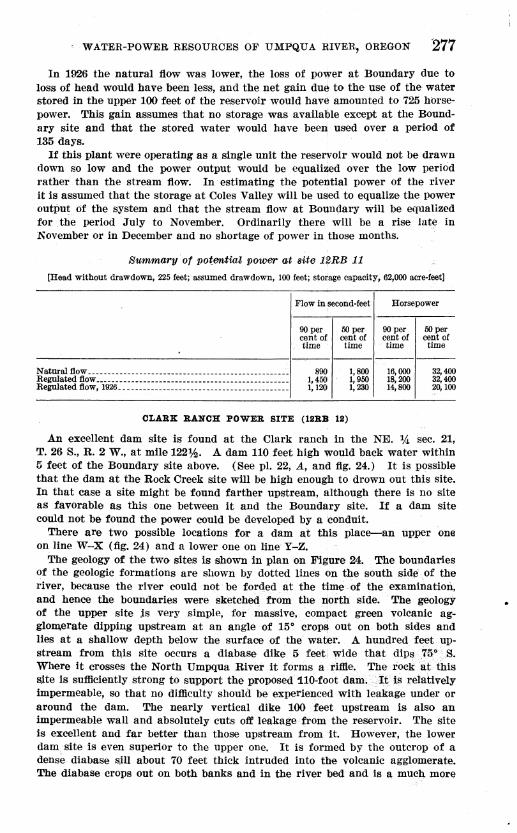
· WATER-POWER RESOURCES OF UMPQUA RIVER, OREGON '277
In 1926 the natural flow was lower, the loss of power at Boundary due to loss of head would have been less, and the net gain du~ to the use of the water stored in the upper 100 feet of the reservoir would have amounted to 725 horsepower. This gain assumes that no storage was availa'llle except at the Boundary site and that the stored water would have been used over a period of 135 days.
If this plant were operating as a single unit the resemoir would not be drawn down so low and the power output would be equali~ed over the low period rather. than the stream flow. In estimating the potellltial power of the river it is assumed that the storage at Coles Valley will be used to equalize the power output of the system and that the stream flow at Boq.ndary will be equalized for _the period July to November. Ordinarily there will be a rise lat~ in November or in December and no shortage of power in those months.
Summary' of potential power at site 1~RB 11
[Head without drawdown, 225 feet; assumed drawdown, 100 feet; stotage capacity, 62,000 acre-feet]
Flow In ;second-feet
90 per cent or time
50 per cent of time
Horsepower
90per cent of time
50 per cent of time
---'------------------1------------Natural tlow ............. ------------------ _________________ -'~ Regulated tlow ..•............••.••••••••••••••................. Regulated tlow, 1926 ... ----------------------------------------
890 1,450 1,120
OLARX RANCK POWER SITE (liiRB 111)
1,800 1,950 1,230
16,000 18,200 14,800
32,400 32,400 20, 100
.An excellent dam site is found at the Clark ranch in the NE. :14 sec. 21, T. 26 S., R. 2 W., at mile 122¥.!. A dam 110 feet high would back water within 5 feet of the Boundary site above. (See pl. 22, A., and fig. 24.) It is possible that the dam at the Rock Creek site will be high enough to drown out this site. In that case a site might be found farther upstream, although there is no site as favorable as this one between it and the Boundary site. If a dam site could not be found the power could be developed by a :condUit.
There are two possible locations for a dam at this place--an upper one on line W-X (fig. 24) and a lower one on line Y-Z.
The geology of the two sites is shown in plan on Figure 24. The boundaries of the geologic formations are shown by dotted lines 9n t)J,e south si~ of the river, because the river could not be forded at the tl.me of the examination, and hence the boundaries were sketched . from the . north. side. The geology of the upper site ,is very simple, for massive, compact green volcanic agglom,erate dipping upstream at an angle of 15• crops out on both sides and lies at a shallow depth below the surface of the wa~r. A hundred_ feet upstream from tbis site occurs a diabase dike 5 feeti wide that dips '7a.o _· S. Where it crosses the North Umpqua River it forms a- ri111e. The rock: it this s.ite is sufficiently strong to support the proposed 110-foot dam.-<.·:ft iS relatively impermeable, so that no difficulty should be experienced with leakage under or around the dam. The nearly vertical dike 100 feet upstream is also an impermeable wall and absolutely cuts oJr leakage from the reservoir. The site is excellent and far better than those upstream from it. However, the lower dam. site is even superior to the upper one. It is formed by the outcrop of a dense diabase s.ill about 70 feet thick intruded into the volcanic agglomerate. The diabase crops out on both banks and in the river bed and is a much more
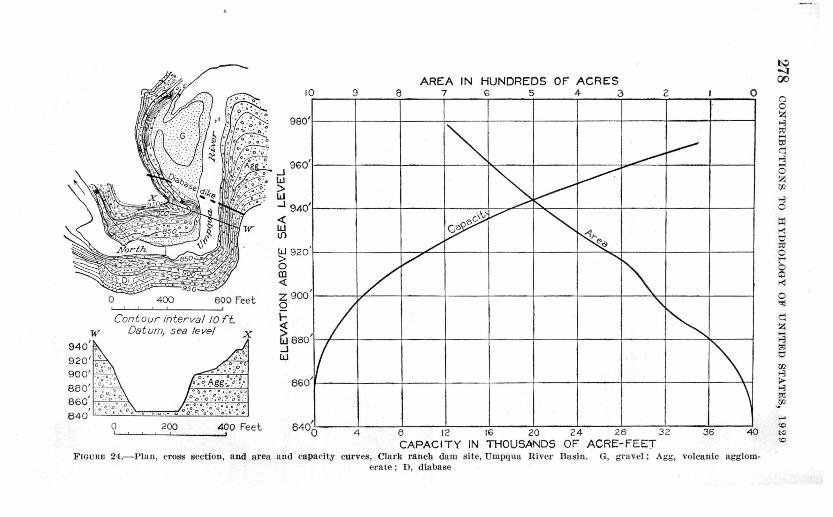
0 400 800 Feet
Contour interval 10ft. Datum, sea le vel X
0 200 400 Feet '---'~--'----'------'
10
980 I
...J 960 w
I
> w I ...J 940
<( w U1
~ 920 0 al <{
z 900 0
~ W880 ...J w
860
I
I
I
I
I
AREA IN HUNDREDS OF ACRES 9 8 7 G 5 4 3 2
~ ...--...--') v ~·
~ v ~ '0
~ / cy
/ / ........
"\ I " ~
!\ \
4 B 12 16 20 24 28 32 36 CAPACITY IN THOUSANDS OF ACRE-FEET
F wuuE 24.-Plan, cross section, and a rea and capacity curves, Cla rk ranch dam site, Umpqua River Basin. G, gravel ; Agg, volcanic agglomerate ; D, diabase
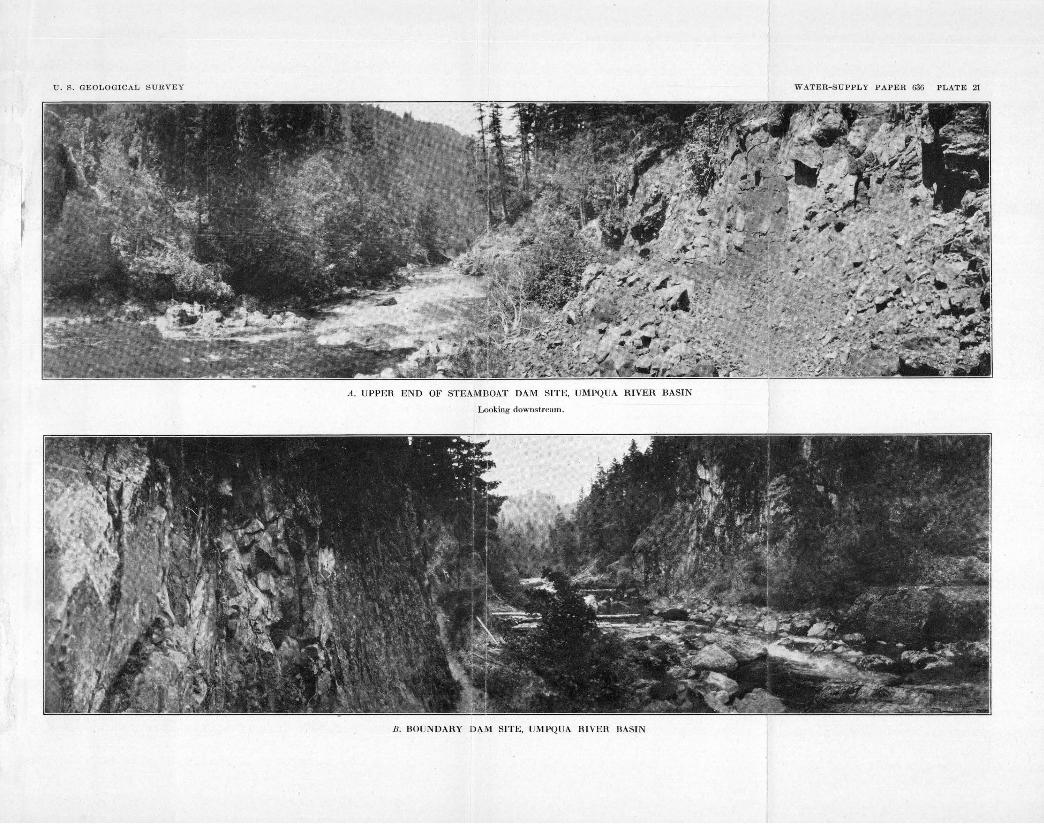
U. S . GEOLOGICAL SURVEY WATER-SUPPLY PAPER 636 PLATE 21
A. UPPER END OF STEAMBOAT DAM SITE , UMPQUA RIVER BASIN
Looking downstrearr1.
B . BOUNDARY DAM SITE, UMPQUA RIVER RASIN
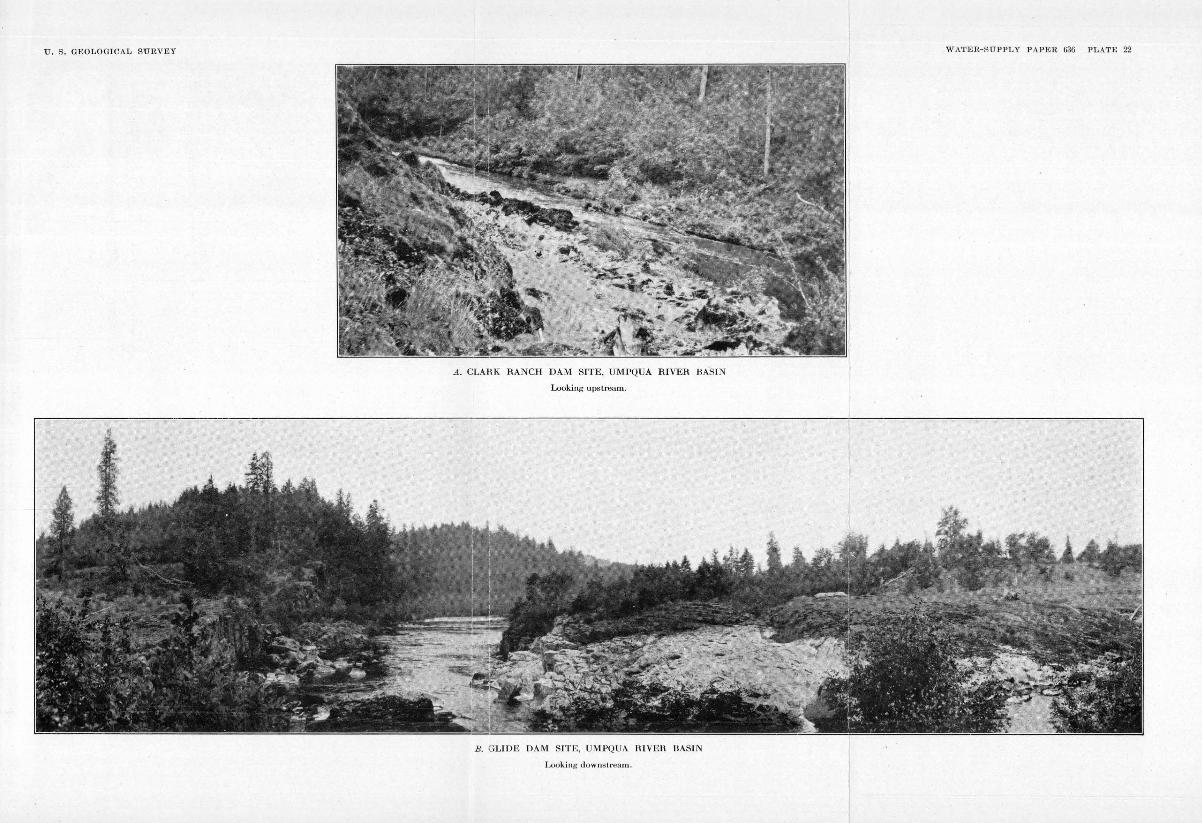
U. S. GEOLOGICAL SURVEY
A. CLAHK RANCH DAM SITE, UMPQUA RIVER BASIN
Looking upstream.
B . GLIDE DAM SIT E, UMPQUA RIVER BASIN
Looking downs tream.
WATE R-SU PPLY P APER 636 PT.AT E 22
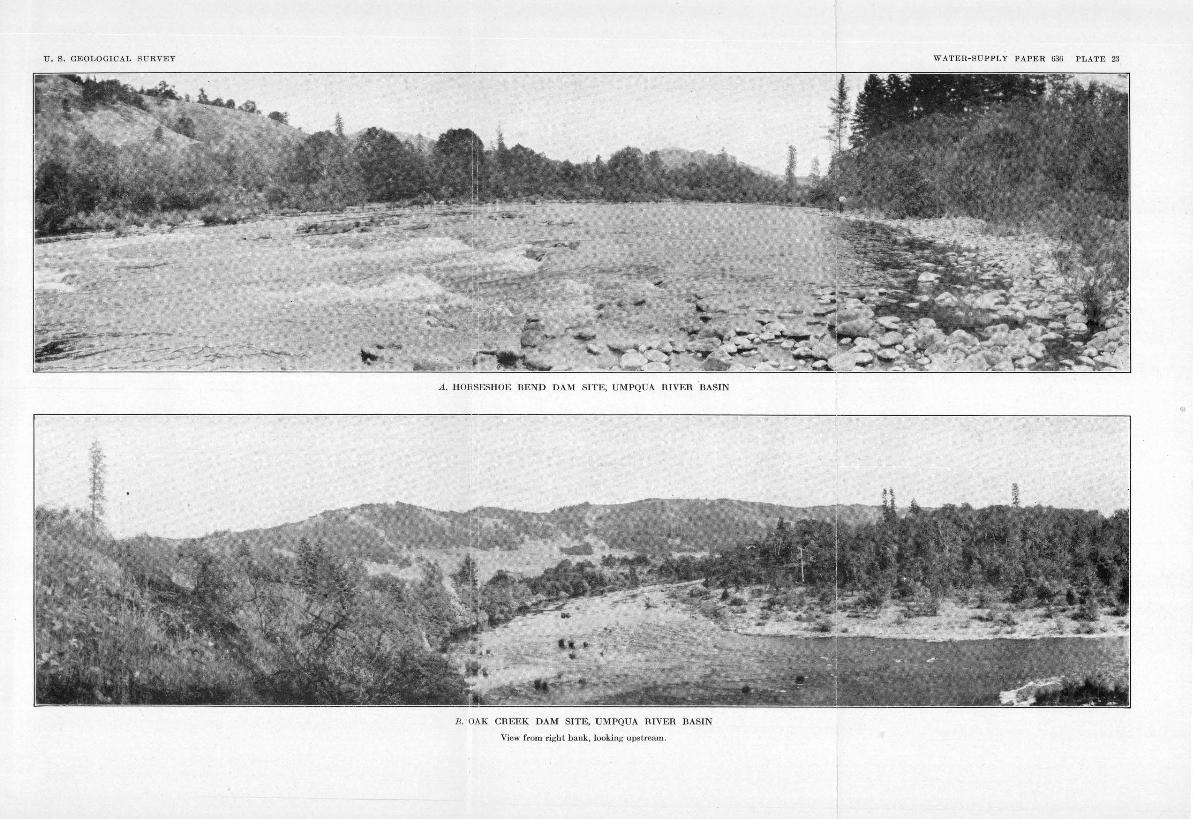
U. S. GEOLOGICAL SURVEY
A. HORSESHOE BEND DAM SITE, UMPQUA RIVER .BASIN
B. OAK CREEK DAM SITE, UMPQUA RIVER BASIN
View from right bank, looking upstream.
WATER-SUPPLY PAPER 636 PLATE 23
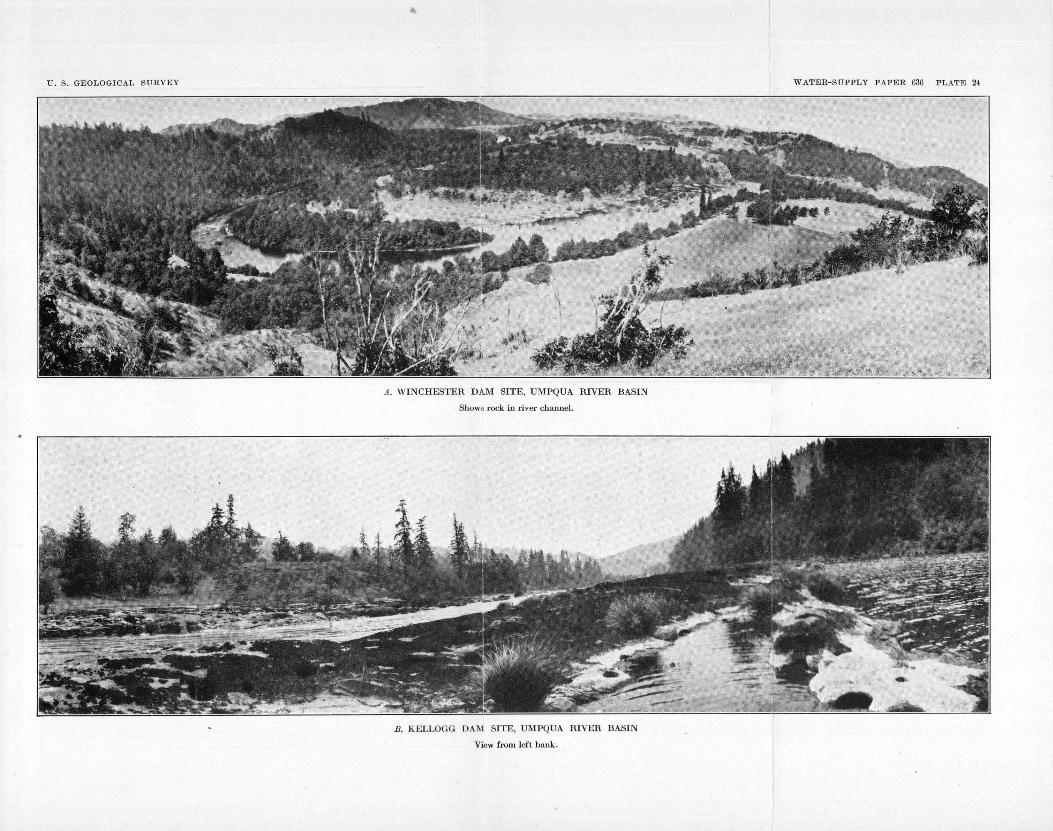
U. S. GEOLOGICAL SURVEY
A . WINCHESTER DAM SITE, UMPQUA RIVER BASIN
Shows rock in river channel.
B. KELLOGG DAM SITE, UMPQUA RIVER BASIN
View from lefL bank.
WATER-SUPPLY PAPER 636 PLATE 24
WATER-POWER RESOURCES OF UMPQUA ltiVER, OREGON 279
satisfactory rock than the agglomerate to key in the proposed dam. It has a higher crushing strength, is a much firmer rock, and is less permeable. The agglomerate is a deposit of volcanic ash and ejectamenta consolidated by time, whereas the diabase is an intrusive rock. Moreover, the 5-foot dike upstream from the upper site would afford the same protection against seepage losses from a reservoir formed by a dam at the lower site. For these reasons it ;is recommended that the lower site be developed.
A dam about 110 feet high at this site would raise the water surface to an altitude of 955 feet and flood 565 acres. By drawing down the water surface 35 feet 16,000 acre-feet of stored water could be obtained. This water
. could be used through an average head of 95 feet at the dam and a total head of 935 feet at all proposed plants if there were no drawdown except at this site. Under these conditions the stored water would generate 1,000,000 kilowatt-hours of power at the dam and 11,000,000 kilowatt-hours at all proposed sites; but owing to drawdown at other sites and loss of power due to loss of head at this site the net gain from the stored water in 1926 would have been about 7,000,000 kilowatt-hours, which is assumed to be a rough approximat,ion of the value of this stored water. The loss of head due to drawing down the reservoir surface would amount to 15 feet, and the low-water flow with storage in Diamond Lake would amount to about 1,000 second-feet. The average loss of power due to loss of head would amount to 1,200 horsepower. This loss would equal the power obtained from the stored water at this site in 51 days, or less than two months. If no other sites were developed below, the reservoir capacity could be used to equalize the monthly flow and to ,increase the flow in a very dry month. If the river were completely developed it probably would not pay to draw down the head at this plant before September, because of the small amount of storage. It has been assumed that the stored water would be used during September, October, and November, but that ordinarily little water would be required in November.
Summary of potential power at site 12RB 12
[Head without drawdown, 110 feet; assumed drawdown, 35 feet; storage capacity, 16,"000 acre-feet]
Flow in second-feet I Horsepower
90 per 50 per 90 per 50 per cent of cent of cent of cent of time time time time
--------------------·--------------------1----------------------Natural flow---------------------------------------------------Regulated flow.------------------------------------------------Regulated flow, 1926. __ ------------------------------------ ____
1
900 1,460 1,140
1,Wi0 1,980 1,330
7,900 11,000 9,280
17,200 17,200 10,700
Owing to the loss of head caused by drawing down the water for storage, the potential power for 50 per cent of the time is the same for natural and regulated flow, although the estimated regulated flow is somewhat greater.
ROCK CREEK POWER SITE (12RB 13)
The Rock Creek dam site is about a mile above Rock Creek, in the vicinity of mUe 119, in sec. 12, T. 26 S., R. 3 W. The dam proposed in this report would be 60 feet high, and a conduit through the bend in the river below would increase the head at the power house to 120 feet. It would not pay to draw down
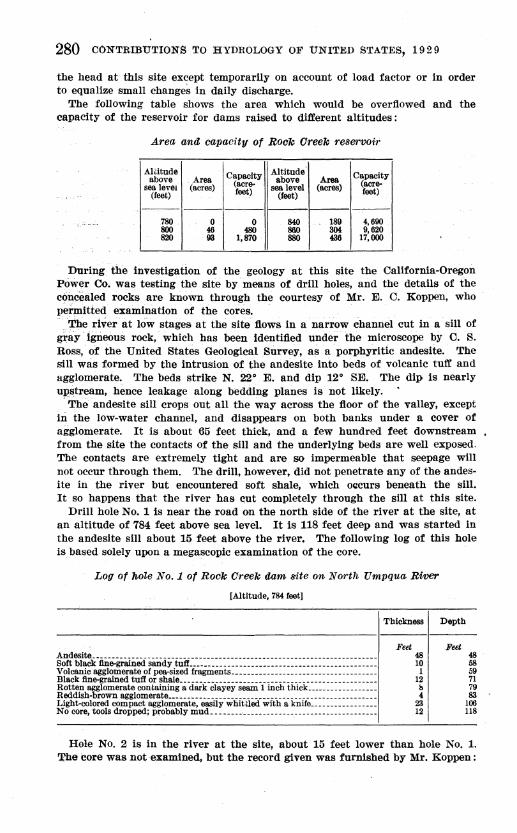
280 CONTRIBUTIONS TO HYDROLOGY OF UNITED STATES, 19 2 9
the head at this site ex<:ept temporarily on account of load factor or in order to equalize small changes in daily discharge.
The following table shows the area which would be overflowed and the capacity of the reservoir for dams raised to different altitudes :
Area and capacity of Rock Oreek reservoir
Alii tude Capacity Altitude Capacity above _Area above Area sealevel <acres> (acre- sealevel (acres) (acre-
(feet) feet) (feet) feet)
------. . ------780 0 0 840 189 4,690 800 4.6 480 860 3M 9,620 820 93 1;870 880 436 17,000
During the investigation of the geology at this site the California-Oregon Power Co. was testing the site by ·means of drill holes, and the details of the conceilied rocks are known through the courtesy of Mr. E. C. Koppen, who permitted eXamination of the coreS. . . . Tl:le river at low stages at the site :flows in a narrow channel cut in a sill of graY· igneous rock,· which has been identified under· the microscope by c. · s. Ross,· of the United States Geological Survey, as a· porphyritic andesite. The sill was formed by the intrusion of the andesite into beds of volcanic tuff and ugglomerate. The beds strike N. 22• E. and dip 12• SE. The dip is nearly up,stream, hence leakage along bedding planes is not likely.
-The andesite sill crops out all the way across the floor of the valley, except iii the low-water channel, and disappears on both banks under a cover of agglomerate. It is about 65 feet thick, and a few hundred feet downstream from the site the contacts of the sill and the underlying beds are well exposed. The contacts are extremely tight and are so impermeable that seepage will not occur through them. The drill, however, did not penetrate any of the andesite in the river but encountered soft shille, which oc:curs beneath the sill. It so happens that the river has cut completely through the sill at this site.
Drill hole No. 1 is near the road on the north side of the river at the site, at an altitude of 784 feet above sea level. It is 118 feet deep and was started in the andesite sill about 15 feet above the river. The following log of this hole isbased solely upon a megascopic examination of the core.
Log of 'lwle No.1 of Rock Creek dam Bite on North Umpqua Ri'Ver
[Altitude, 784 feet]
Thickness Depth
t~t¥!:k · fiD.e:.graiD.eci sanci:Y.-iiifi:.:·_:::::::::: :::::::::::::::::::::::::::::::::: Volcanic agglomerate of~ fragments ••..•..•• ---------------------------Biack fine-grained tuff or sbale .....•.••.••••••.... ------------------------------Rotten agglomerate containing a dark clayey seam 1 inch thick ................. . Reddish-brown agglomerate •••.•....•.•.•••••.....•• ---------------------------Ligbt-colored compact agglomerate, easily whittled with a knife ..............•.. No core, tools dropped; probably mud ..•..... ·----------------------------------
Feet 48 10 1
12 b 4
23 12
Feet 48 58 59 71 79 sa
106 118
Hole No. 2 is in the river at the site, about 15 feet lower than hole No. 1. The core was not examined, but the record given was furnished by Mr. Koppen:
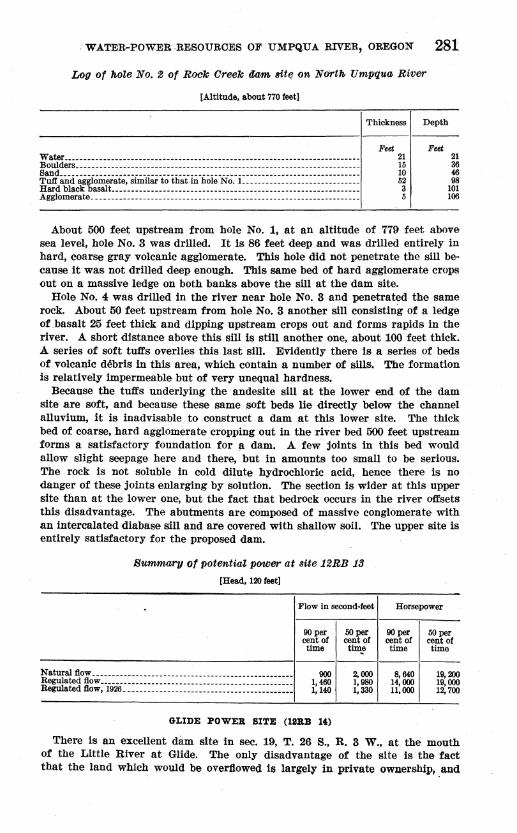
:WATER--POWER -RESOURCES OF UMPQUA RIVER, OREGON 281
Log of hoZe No. 2 of Rock Greek OOm. Bit~ on Nfh'th Umpqua. River
[Altitude, about 770 feet]
Thickness Depth
Feet Water----_---_----------------------------------------------------------------•-Boulders. __________________________________________________________ • ___________ _ Sand .. _______________ -______________________ • __ , _______________________________ _ Tuft and agglomerate, similar to that in hole No.1.-----------------------------Hard black basalt ________________ ------ ____________ ------ ___ --------------------Agglomerate. ________________________________________ ~ _________________________ _
21 15 10 52 3 5
Feet 21 36 46 98
101 106
About 500 feet upstream from hole No. 1, at an altitude of 779 feet above sea level, hole No.3 was drilled. It is 86 feet deep and was drilled entirely in hard, coarse gray volcanic agglomerate. This hole did not penetrate the sill because it was not drilled deep enough. This same bed of hard agglomerate crops out on a massive ledge on both banks above the sill at the dam site.
Hole No.4 was drilled in the river near hole No. 3 and penetrated the same rock. About 50 feet upstream from hole No. 3 another sill consisting of a ledge of _basalt 25 feet thick and dipping upstream crops out and forms rapids in the river. A short distance above this sill is still another one, about 100 feet thick. A series of soft tuffs overlies this last sill. Evidently there is a series of beds of volcan,ic debris in this area, which contain a number of sills. The formation is relatively impermeable but of very unequal hardness.
Because the tuffs underlying the andesite sill at tlle lower end of the dam site are soft, and because these same soft beds lie directly below the channel alluvium, it is inadvisable to construct a dam at this lower site. The thick bed of coarse, hard agglomerate cropping out in the river bed 500 feet upstream forms a satisfactory foundation for a dam. A few joints in this bed would allow slight seepage here and there, but in amounts too small to be serious. The rock is not soluble in cold dilute hydrochloric acid, hence there is no danger of these joints elilarging by solution. The section is wider at this upper site than at the lower one, but the fact that bedrock occurs in the river offsets this disadvantage. The abutments are composed of massive conglomerate with an intercalated diabase sill and are covered with shallow soil. The upper site is entirely satisfactory for the proposed dam.
Summa.ry of potential power at Bite 12RB 18
[Head, 120 feet]
Flow in second-feet Horsepower
90per cent of time
50 per cent of tiiJte
90per cent of time
50 per cent of time
---------------------------------1---------------------900
1,460 1,140
GLIDE POWEll SITE (llltB 14)
2, 000 8, 640 1, 980 14, 000 1, 330 11, 000
19,200 19,000 12,700
There is an excellent dam site in sec. 19, T. 26 S., R. 3 W., at the mouth of the Little River at Glide. The only disadvantage of the site is the fact that the land which would be over11.owed is largely in private ownership, . and
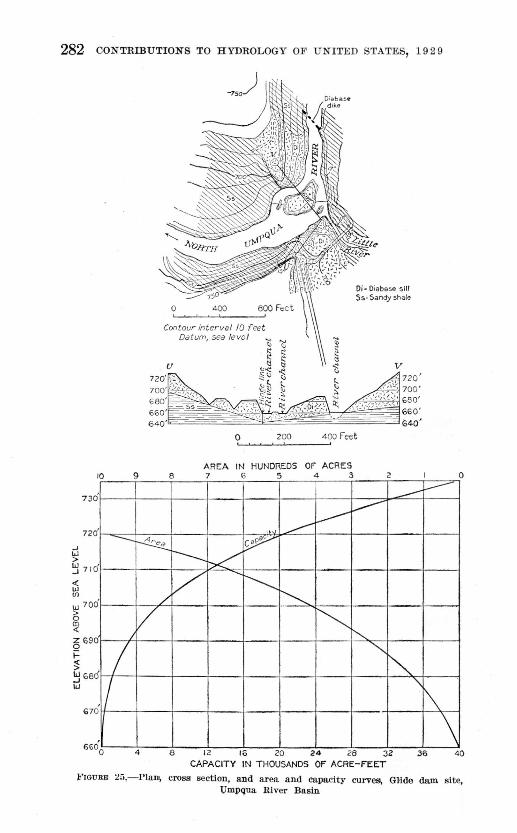
282 CONTRIBUTIONS TO HYDROLOGY OF UNITED STATES, 19 2 9
10 9
730
n o
Di- Diabase sill 55· Sandy shale
Contour 1nterval 10 f'eet
u
8
Datum, sea level
200 4 00 Feet
AREA IN HUNDREDS OF ACRES 7 6 5 4 3
l.---~
----
v
2
--- f.---
..J w >
--~ 1----~
~ k' ~ 71 0
<( w Ul
w 700
~ ~ z 690 0 i= I ~ ~ 680
.I w
v v ~
~ /
~ "' " "' '\[\
0
0 \ G70
66 0 4 8 12 16 20 24 28 3Z 36 40 CAPACITY IN THOUSANDS OF ACRE-FEET
J!'IGURE 25,-Pia.II\ cross section, and area and capacity curves, Gl1de dam site, Vmpqua River Basin
WATER-POWER RESOURCES OF UMPQUA RIVER, OREGON 283
the damages would be considerable. .A dam 60 feet high is proposed at this site. (See pl. 22, B, and fig. 25.)
It is feasible to build an open conduit from this dam site to the location of the proposed Horseshoe Bend power plant, thus increasing the head from 60 to 150 feet. The canal would be 7 miles long. The fiow for 50 per cent of the time at this site is 2,400 second-feet, but it probably would not pay to build the canal to so large a capacity. .As there is a fairly good dam site at Horseshoe Bend the head can probably be developed to best advantage by means of a dam.
The maximum recorded peak flow at· the Oak Creek gaging station, not far below this site, was 90,000 second-feet, on November 23, 1909 .
.A detailed topographic survey, a geologic map, and a geologic cross section of the site are shown on Figure 25. The falls at the site are made by the outcrop of a diabase sill that is intruded into sandstone and shale of the Umpqua formation.' .A bed of fossils of Eocene age occurs in the sandstone under the highway bridge on the north bank of the Little River. The sill is about 25 feet thick where it crosses the road on the south bank and is underlain at this place by soft, black, sandy shale. The sill thickens on the north side of the river and finally disappears under sedimentary rock. The river ,at the site probably flows on the shale underlying the diabase, although there may be a few feet of diabase in the river bed. About 500 feet upstream from the site a nearly vertical diabase dike about 3 feet thick, which is probably an offshoot from the sill, crosses the river and has the appearance of a partly destroyed dam.
Because of the occurrence of thin-bedded soft shale directly below the sill, and because the diabase has been nearly. if not entirely eroded away in the channel at the site, it is believed advisable if pOSSible to build the dam 50 feet or more upstream to obtain a thicker diabase foundation. In this way the problem of the shale in the foundation would be overcome, and the dam would be more securely anchored and would be free from seepage through the adjacent rocks. The contact of the sill with the underlying and overlying sediments is tight wherever ~xposed, hence no leakage should occur along it. The site should be thoroughlY drilled to determine the best location for the dam. It is not impossible t~t the sill thickens eastward, so that a shift of only a few feet would be req ired for the dam .
.A dam 60 feet high would aise the water surface to an altitude of 720 feet and flood 980 acres. By dra ing down the water surface 20 feet 14,000 acrefeet of stored water would · e obtained. This water could be used 1:hrough an average head of 53 feet t this site and a total head of 713 feet at all proposed plants .if there wer no drawdo~ except at this site. The stored water would generate 500,0 kilowatt-hours of power at the Glide site and 7,000,000 kilowatt-hours at all proposed sites, if there were no drawdown except at Glide. But the loss of po er due to loss of head at this site and the loss of head at lower sites due to d awdown for storage would reduce the net gain, so that in 1926 it would h ve amounted to 3,500,000 kilowatt-hours, which is probably a fair estimate o the value of this storage with complete develop· ment of the river. The ave age loss of head would be 7 feet, and the low fiow in an average year with torage in Diamond. Lake would amount to about 1,050 second~feet. The avera e loss of power due to loss of head would be 588 horsepower, which would equal the power obtained from stored water at this site in 51 days. If this site were considered by itself the head should
1 Diller, J. S., U. S. Geol. Surv y Geol. Atlas, Roseburg folio (No. 49), 1898.
47154°-30--19
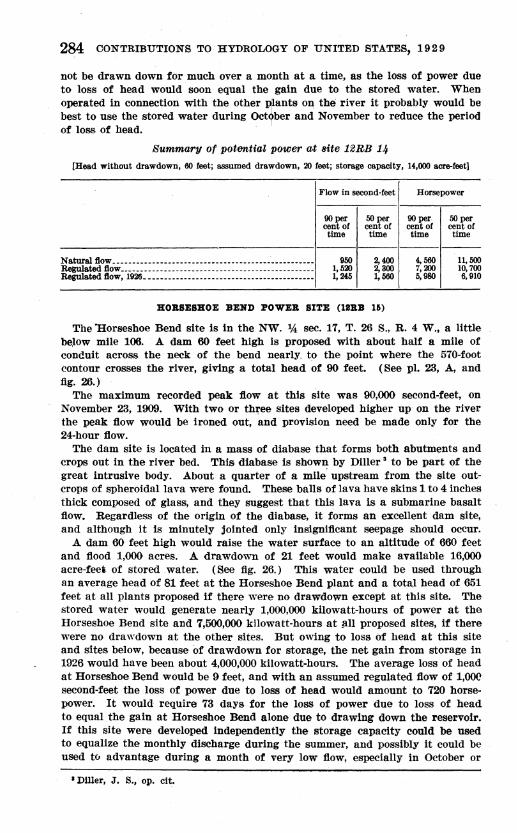
284 CONTRffiUTIONS TO HYDROLOGY OF UNITED STATES, 19 2 9
not be drawn down for much over a month at a time, as the loss of power due to loss of head would soon equal the gain due to the stored water. When operated in connection with the other plants on the river it probably would be best to use the stored water during October and November to reduce the period of loss of head.
Summary of potootiaZ power at site 12RB 14
[Head without drawdown, 60 feet; assumed drawdown, 20 feet; storage capacity, 14,000 acre-feet]
Flow in second-feet
OOper cent of time
50 per cent of time
Horsepower
OOper cent of time
50 per cent of time
------------------1------------Natural ftow .••.. --------- .....•...•••.•. --.-- __ ----- •• -- .. ---.
=~ g~:;-1926~=======:=:=:=:::::::::::=::::::::::::::::= 950
1,520 1,245
2,400 2,300 1,560
liORBESliOE BEND POWER BITE (lliRB 16)
4,560 7, 200 5,980
11,500 10,700 6, 910
The 'Horseshoe Bend site is in the NW. 1,4 sec. 17, T. 26 S., R. 4 W., a little be,low mile 106. A dam 60 feet high is proposed with about half a mile of conduit across the· neck of the bend nearly to the point where the 570-foot contour crosses the river, giving a total head of 90 feet. (See pl. 23, A, and fig. 26.)
The maximum recorded peak flow at this site was 90,000 second-feet, on November 23, 1909. With two or th~ee sites developed higher up on the river the peak flow would be ironed out, and provision need be made only for the 24-hour flow.
The dam site is located in a mass of diabase that forms both abutments and crops out in the river bed. This diabase is shown by Diller • to be part of the great intrusive body. About a quarter of a mile. upstream from the site outcrops of spheroidal lava were found. These balls of lava have skins 1 to 4 inches thick composed of glass, and they suggest that this lava is a submarine basalt flow. Regardless of the origin of the diabase, it forms an excellent dam site, and although it is minutely jointed only insignificant seepage should occur.
A dam 60 feet high would raise the water surface to an altitude of 660 feet and flood 1,000 acres. A drawdown of 21 feet would make available 16,000 acre-feei of stored water. (See fig. 26.) This water could be used through an average head of 81 feet at the Horseshoe Bend plant and a tota.I head of 651 feet at all plants proposed if there were no drawdown except at this site. The stored water would generate nearly 1,000,000 kilowatt-hours of power at the Horseshoe Bend site and 7,500,000 kilowatt-hours at ~ll proposed sites, if there were no drawdown at the other sites. But owing to loss of head at this site and sites below, because of drawdown for storage, the net gain from storage in 1926 would have been about 4,000,000 kilowatt-hours. The average loss of head at Horseshoe Bend would be 9 feet, and with an assumed regulated flow of 1,()()(1 second-feet the loss of power due to loss of head would amount to 720 horsepower. It would require 73 days for the loss of power due to loss of head to equal the gain at Horseshoe Bend alone due to drawing down the reservoir. If this site were developed independently the storage capacity could be used to equalize the monthly discharge during the summer, and possibly it could be used tv advantage during a month of very low flow, especially in October or
• Diller, J. S., op. cit.
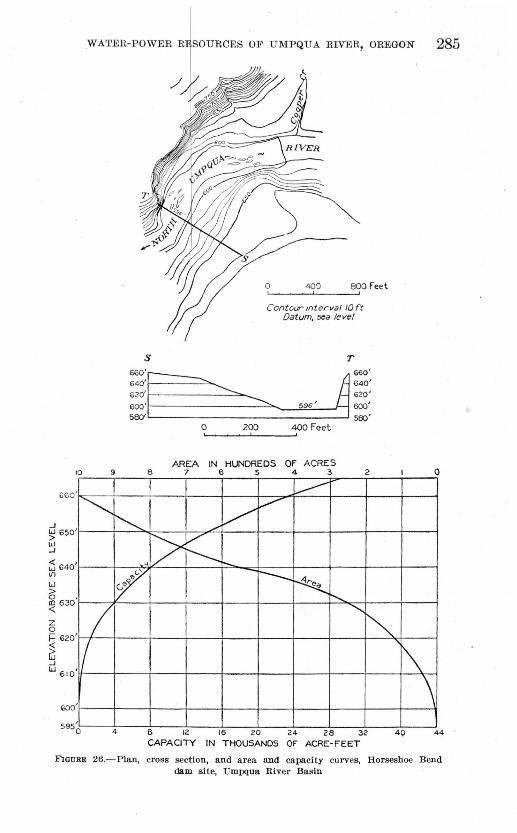
WATER-POWER S OF UMPQUA UIVER, OREGO N
10 9
660
s
0 400 800 F~et
Contour mterval 10ft Datum, 5ea le vel
T
:::~ ~:~: 620' -.............. 600 620: 600'- ------..__._ 596' .
580''-------------------' 500' 0 200 400 Feet
AREA IN HUNDREDS OF ACRES 8 7 6 5 4 3
L.----v
.J ~ 6 50 w
~ ' ~ ./
v .J
;;} 640 II)
'
w > 0 !Il 630 <(
z 0 i= 620
~ .J
w.sto
roo
. I I
'
'
[> v 1--.~--.
~ r--~ ~
t-...... ..........
""' 4 B 12 16 20 24 28 3 2
CAPACITY IN THOUSANDS OF ACRE-FEET
\
4 0
285
0
\ 44
FiGURE 26.-Plan, cross section, and a rea and capacity curves, Horsesh oe Bend dam site, Umpqua River Basin
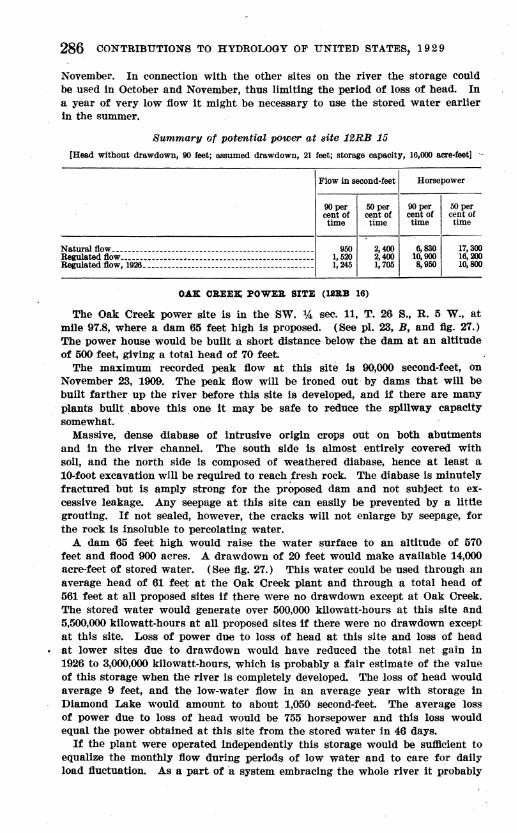
286 CONTRIBUTIONS TO HYDROLOGY OF UNITED STATES, 19 2 9
November. In connection with the other sites on the river the storage could be used in October and November, thus limiting the period of loss of head. In a year of very low flow it might be necessary to use the stored water earlier in the summer.
Summary of potentiaZ power at site 12RB 15
[Head without drawdown, 90. feet; assumed drawdown, 21 feet; storage capacity, 16,000 acre-feet] -
Flow In second-feet Horsepower
90per cent of time
50 per cent of. time
90per cent of time
50 per cent of time
---------------------------------1-------.------.---. -----Naturalllow. -------------------------------------------------. 950 Regulated llow ----------------•--------------------------- ••••• 1, 520 Regulated llow, 1926------------------------------------------- 1, 245
OAK CREEK; POWER SITE (UJUI 18)
2, 400 6,830 2, 400 10, 900 1, 705 8, 950
17,300 16,200 10,800
The Oak Creek power site is in the SW. 1,4 sec. 11, T. 26 S., R. 5 W., at mile 97.8, where a dam 65 feet high is proposed. (See pl. 23, B, and flg. 27.) The power house would be built a short distance below the dam at an altitude of 500 feet, giving a total head of 70 feet.
The maximum recorded peak flow at this site is 90,000 second-feet, on November 23, 1909. The peak flow will ·be ironed out· by dams that will be built farther up the river before this site is developed, and if there are many plants built . above this one it may be safe to reduce the spillway capacity somewhat.
Massive, dense diabase of . intrusive origin crops out on both abutments and in the river channel. The south side is almost entirely covered with soU, and the north side is composed of weathered ·diabase, hence at least a 10-foot excavation will be required to reach .fresh rock. The diabase is minutely fractured but is amply strong for the proposed dam. and not subject to excessive leakage. Any seepage at this site can easily be prevented by a littte grouting. If not sealed, however, the cracks will not enlarge by seepage, for the rock is insoluble to percolating water.
A dam 65 feet high would raise the water surface to an altitude of 570 feet and flood 900 acres. A drawdown of 20 feet would make available 14,000 acre-feet of stored water. (See flg. 27.) This water could be used through an average head of 61 feet at the Oak Creek plant and through a total head of 561 feet at all proposed sites if there were no drawdown except at Oak Creek. The stored water would generate over 500,000 kilowatt-hours at this site and 5,500,000 kilowatt-hours at all proposed sites if there were no drawdown except at this site. Loss of power due to loss of head at this site and loss of head
• at lower sites due to drawdown would have reduced the total net gain in 1926 to 3,000,000 kilowatt-hours, which is probably a fair estimate of the value of this storage when the river is completely developed. The loss of head would average 9 feet, and the low-water flow in an average year with storage in Diamond Lake would amount to about 1,050 second-feet. The average loss of power due to loss of head would be 755 horsepower and this loss would equal the power obtained at this site from the stored water in 46 days.
If the pll:mt were operated independently this storage would be sufficient to equalize the monthly flow during periods of low water and to care for daily load fluctuation. As a part of ·a system embracing the whole river it probably
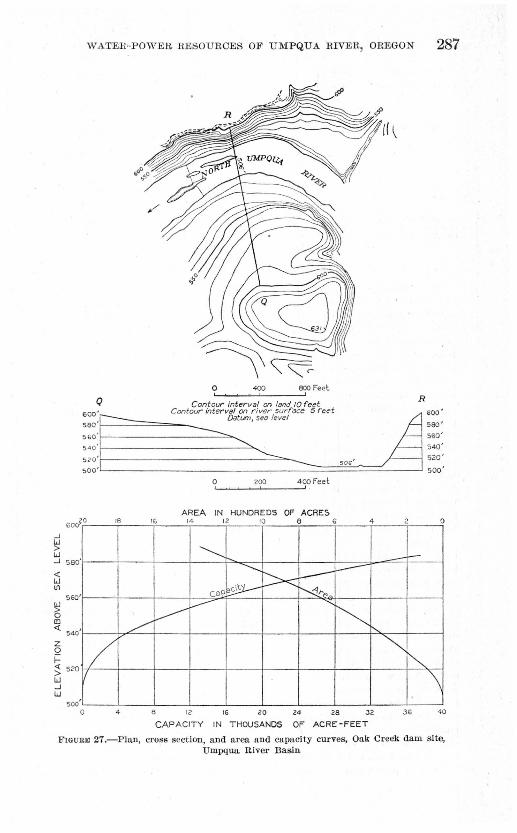
..J w > w
WATER·POWER HESOURCES OF UMPQUA RIVER, OREGON 287
Q
0 000 Feel ....... ~~'------'
Contour ;nterval on land 10 feet R
• Contour interval on river surface 5 f'et:t 600 ·
600 ~ Datum, sea level _A :;~: ::::::---... ::0,. ::: 520' - ~-- 500,. 520' soo•L ________________ __::::::===:::::::=~--_j 5oo'
20 600
18 16
0 200 400 Feet L........~ ............ ~---'
AREA IN HUNDREDS OF ACRES 14 12 10 8 6
~
4 0
---............ ----...J 580
<! w In
~ ID <!
z 0 f=
560
540
L :; 520
w II ...J w
' 500 0 4
~ --eel'. ~ '-....::!_,.,,._
l--" v-- "~ I
/ '-
""' ~ \
6 12 16 20 Z4 26 3 2 36 40
CAPACITY IN THOUSANDS OF ACRE -FEET
FIGURE 27.-Plan, cross section, and area and capacity curves, Oak Creek dam site, Umpqua River Basin
288 CONTRmUTIONS TO HYDROLOGY OF UNITED STATES, 1929
would be best to regard this as storage to be held for emergency use in a very dry October and November.
Summary of potential power at site 12RB 16
[Head without drawdown, 70 feet; assumed drawdown, 20 feet; storage capacity, 14,000 acre-feet]
Flow In second-feet
90per cent of time
50 per cent of time
Horsepower
90 per cent of time
50 per cent of time
---------------------------------1---------------------Natural flow •••••....•••.•....•..•.•.•...•...........•..•.•••..
~=:~~ :~:;-1926~:::::::::::::::::::::::::::::::::::::::::: 955
1,530 1,250.
WINOKESTE:B. POWER SITE (18:B.B 1'7)
2,410 2,470 1,830
6,350 8,570 6,990
13,500 12,800 8,630
The Winchester power site is near the corner common to sees. 19, 20, 29, and 30, T. 26 S., R. 5 W., about 1% miles above the constructed power plant at Winchester. A. dam 60 feet high is proposed. (See pl. 24, B, and fig. 28.) A. pressure pipe line along the right bank would lead to a point near the present dam, giving a total head of 80 feet, or the present dam could be raised to a height of 20 feet to use the total head available below the proposed dam above, and an automatic plant could be installed at the site of the present plant.
The maximum recorded peak flow at this site, 92,000 second-feet, occurred on November 23, 1909.
Jointed intrusive diabase occurs on the north bank and in the river channel a short distance downstream from the site. This rock also crops out· on the south bank at the water's edge, where it disappears under a soil-covered gravel bench that forms a terrace about 20 feet above the river. It will be necessary to excavate the gravel, which is unconsolidated. The underlying diabase will make an excellent rock to key in a dam, and seepage losses under and around the dam will be insignificant: The depth to bedrock under the gravel bench can be determined only by drilling, but it is probably not over 30 feet in any place. The feasibility of this site rests entirely upon economic conditions, because the width of the dam is great and the amount to be excavated is large.
A. dam 60 feet high would raise the water level to 500 feet and flood 650 acres. A. drawdown of 25 feet would provide 12,o0o acre-feet of stored water, which could be used through an average head of 69 feet· at the Winchester plant and through a total head of 489 feet at all proposed plants if there were no drawdown except at Winchester. The power that could be generated by the stored water would amount to over 500,000 kilowatt-hours at the Winchester site and to 4,000,000 kilowatt-hours at all proposed plants that could utilize the stored water, if there were no drawdown except at Winchester. Owing to loss of head at Winchester und at the sites lower down, the net gain in power due to the use of the storage would have amounted to 2,000,000 kilowatt-hours in 1926. The average loss of head would be 11 feet. If no plants were constructed below the Winchester site the value of this storage would be limited, for with a mean discharge of 1,000 second-feet the loss of power due to loss of head would equal the power obtained from storage in 38 days. It would be possible to equalize the monthly flow from this storage and to increase the output somewhat in the month of minimum flow. If all plants were developed below this one the power obtained from stored water would be considerably greater than the loss in power due to loss of head, and the total amount of storage could
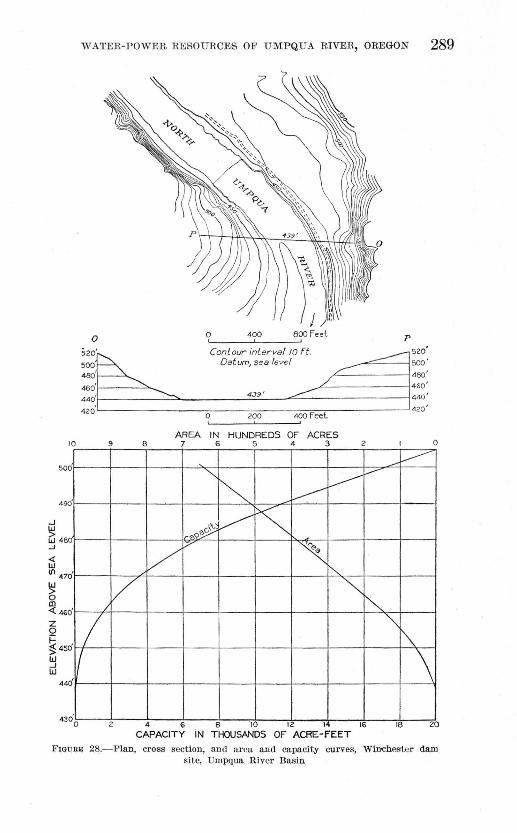
WATER-POWER RESOURCES OF U MPQUA RIVER, OREGON 289
10
500
490
..J
~ w 460 ..J
<( w (f) 470
~ 0 m <( 460
z 0 i= ~450 w ..J w
440
0
I I
o' 43 0
0 400 800 Feet p
Contour interval tO ft. ~szo: Datum, sea level --:= -500
~~----------~400' / 460'
439' ..c=:: 440 '
4 20' 0 200 400 Feet
AREA IN HUNDREDS OF ACRES 9 B 7 6 5 4 3 2 0
~
""" ----v
~ ~ lr'<'~~ ~
v P'
' "" / "" "" /
"" 1'\
\ 2 4 6 6 \0 12 14 16 16 20
CAPACITY iN THOUSANDS OF ACRE-FEET
FIGUI.UI 2&.- Plan, cross section, and a rea and capacity curves, Winchester dam site, Umpq_ua River Basin
290 CONTRmUTIONS TO HYDROLOGY OF UNITED STATES, 19 2 9
be used during the summer at whatever time would give the greatest net in- , crease in power at all the points a1fected.
Summarv- of potentia' power at Bite 1~RB 11
[Head without drawdown, 80 feet .i. assumed drawdown, 25 feet; storage capacity, l:o::,OOO acre-feet.
Flow in second-feet Horsepower
DOper cent of time
DOper cent of time
DO per cent of time
DOper cent of time
------------------~-------------1---------------------Natural flow __ ._ .• ________________________ . _________ .•.... ____ _
~=:l t:~-i926~:::::::::::::::::::::::::::::::::::::::::: 960
1,520 1,250
2,420 6;140 2, 570 9, 700 1, 950 ' 7, 980
PAOIFIO HIGB:WA.Y POWElL SITE (la:aB 18)
15,500 14,900 10,100
The Paci1lc Highway project is proposed to develop the fall below the Winchester site in case the Wolf Creek or Coles Valley dam is not built to the 400-foot contour. A dam about 5 feet high would be built at the point whertl the 415-foot contour crosses the river, in the NW. * sec. 25, T. 26 S., R. 6 W. A tunnel a mile long would ~ross the bend to the little creek on the west side, and a conduit would extend downstream to the point where the 380-foot contour crosses the river, giving a total head of 4o feet. If, as is assumed in this report, a dam is built to flood Coles Valley to the 400-foot contour, then a fall of 20 feet would be available between the Winchester power house and the backwater from Coles Valley. This head could be developed by a 10-foot dam at the point where the 410-foot contour crosses the river and a mile of open-cut canal. It might be possible to build a 20-foot dam lower down, but the valley is wide at this point.
The maximum recorded peak flow was 92,000 second-feet. The flow at this site, both natural and regulated, would be the same as at the Winchester site.
8fllni.Jm(Jif'1J of potentia' p()IW8r at Bite 1~RB 18
[Head, 20 feet]
Flow In second-feet
DOper cent of time
Natural flow----------------------------------------- __ -------- 960 Regulated ftow_________________________________________________ 1, 520 Regulated ftow, 1926 •• ------------------~---------------------- 1, 2DO
DOper cent of time
2,420 2,570 1,950
COLES VALLEY POWER SITE (18li.B 19)
Horsepower
DOper cent of time
1,540 2,420 2,000
DOper cent of time
3,870 4,120 3,120
The Coles Valley site is an alternative dam site to be used in case conditions are not satisfactory at the Wolf Creek site. It is in theN. lh sec. 16, T. 25 S., R. 7 W., at mile 69. The principal value of this site is for a reservoir, and a ~am at either the Wolf Creek or the Coles Valley site could be built to a height su:fllcient to flood Coles Valley. (See flg. 15.) The Wolf Creek site is believed preferable, and the power and reservoir possibilities are discussed in connection with it. 'l'he right abutment at Cole~;~ Valley would require consideral>le
WATER-POWER RESOURCES OF UMPQUA RIVER, OREGON 291
excavation ; otherwise there is no apparent difficulty connected with building a dam at this site. The damages to lands and improvements that would be caused by a reservoir at this point are so great that it may be many years before the demand for power will be sufficient to justify. the cost. The capacity of the reservoir would be greater if the dam is built at Wolf Creek. If the reservoir is not built to the full capacity the section of the river in the proposed reservoir site that is not occupied by the reservoir can be developed for power by means of low dams and conduits. A dam 110 feet high is proposed at this site. A reservoir covering 12,000 acres, or most of Coles Valley; would be formed by a dam of this height. Most ·of the reservoir :floor is covered with soil, but exposures here and there indicate that it is underlain by thin-bedded green and black shales and sandstone of the Umpqua formation, all of which are sufficiently impermeable to form a water-tight reservoir. Near the dam site these thin beds give way to massive sandstone.
The left abutment is a cliff of massive light-colored sandstone with a dip of about 10• upstream. Some of the beds exceed 10 feet in thickness. Sandstone is exposed also all the way across the river channel but disappears on the right abutment under the end of a soil-covered terrace that forms· a bench about 20 feet above the river. It will be necessary to drill to determine the exact depth to bedrock at this abutment. Probably at least 15 feet of soil and partly weathered sandstone will have to be removed on this bank to anchor a dam properly. The massive sandstone forms an excellent dam site, and the fact that it dips upstream indicates that seepage through the joints and along the bedding planes will be small. Moreover, the reservoir site appears to be equally impermeable, hence the geology of both the dam site and the reservoir site is favorable to the proposed construction. ·
Estimates of the power in this section of the river are given on page 292;
WOLF CREEK POWEll. SITE (lllBB 110)
The Wolf Creek Site is near the east quarter corner of sec. 6, T. 25 S., R. 7 w,, at mile 62.8. A dam 145 feet high would raise the water surface to the 400-foot contour and afford a storage capacity of 422,000 acre-feet, with a drawdown of 80 feet. (See fig. 16.) The property damages are discussed under the Coles Valley and Wolf Creek reservoir sites. This dam site is preferable to the Coles Valley site, because of the greater capacity of the reservoir and the increased head at the dam for development of power. If the dam is not built to the full height the head not developed at the dam can be utilized by low dams and conduits. The maximum recorded peak at this site was 172,000 second-feet on February 21, 1927. If the reservoir were built to capacity the peak :flow would be ironed out, but the 24-hour :flow must be provided for:
Even-bedded, nearly horizontal sound yellow sandstone i.s exposed all th~ way across the river channel and up both abutments. The sandstone is suffi.ciently permeable to allow a small amount of seepage, but this could be prevented by grouting with cement. 'The foundation and abutments will require practically no excavation; hence this is an unusually :fine site in that .respect.
If the Wolf Creek Reservoir is· built to full capacity the storage provided at sites iiownstream would not te so valuable, for the regulated :flow under these conditions would be around 4,000 second-feet, and that means a, loss of 320 horsepower for each foot of loss of head. A draw down of 10 feet for 60 days would mean a loss of 192,000 horsepower-days. It has been as~tumed that the stored water below Coles Valley would be utilized in November of a very dry year and that a chance would be taken on a rise in December. In an ordinary
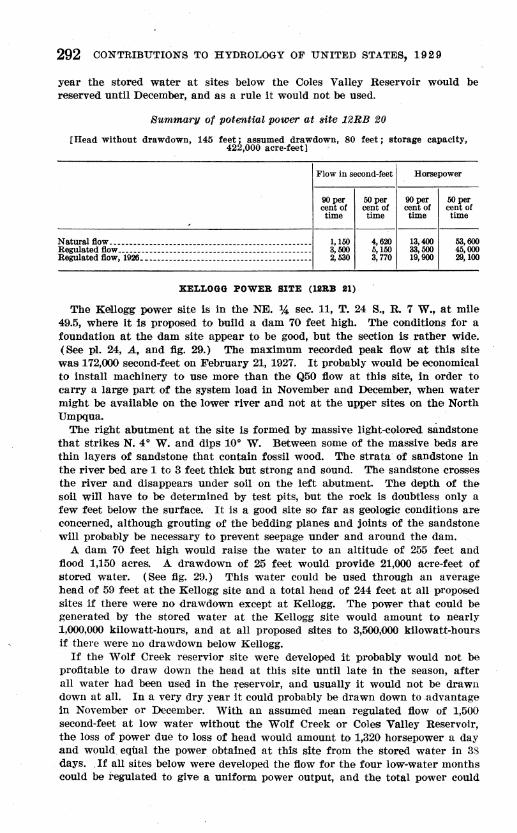
292 CONTRmUTIONS TO HYDROLOGY OF UNITED STATES, 1929
year the stored water at sites below the Coles Valley Reservoir would be reserved until December, and as a rule it would not be used.
Summary of potential power at site 12RB 20
[Head without drawdown, 145 feet;, assumed drawdown, 80 feet; storage capacity, 42:o::,OOO acre-feet] ·
Flow in second-feet
90per cent of time
50 per cent of time
Horsepower
90per cent of time
50 per cent of time
--------------------11------------Natural ftow __ ------------------------ _______________________ __ Regulated ftow -------- __ ----- _________________ -------- _ --------Regulated ftow, 1926. _ ------------ ______________ -------------- _
1,150 3,500 2,530
XELLOGG POWER SI~E (12B.B 21)
4,620 5,150 3,770
13,400 33,500 19,900
53,600 45, ()()() 29,100
The Kellogg power site is in the NE. JA sec. 11, T. 24 S., R. 7 W., at mile 49.5, where it is proposed to build a dam 70 feet high. The conditions for a foundation at the dam site appear to be good, but the section is rather wide. (See pl. 24, A, and fig. 29.) The maximum recorded peak flow at this site was 172,000 second-feet on February 21, 1927. It probably would be economical to install machinery to use more than the Q50 flow at this site, in order to carry a large part of the system load in November and December, when water might be available on the lower river and not at the upper sites on the North Umpqua.
The right abutment at the site is formed by massive light-colored sandstone that strikes N. 4" W. and dips 10" W. Between some of the massive beds are thin layers of sandstone that contain fossil wood. .The strata. of sandstone in the river bed are 1 to 3 feet thick but strong and sound. The sandstone crosses the river and disappears under soil on the left abutment. The depth of the soil will have to be determined by test pits, but the rock is doubtless only a few feet below the· surface. It is a good site so far as geologic conditions are concerned, although grouting of the bedding planes and joints of the sandstone will probably be necessary to prevent seepage under and around the dam.
A dam 70 feet high would raise the water to an altitude of 255 feet and flood 1,150 acres. A drawdown of 25 feet would provide 21,000 acre-feet of stored water. (See fig. 29.) This water could be used through an average head of 59 feet at the Kellogg site and a total head of 244 feet at all proposed sites if there were no drawdown except at Kellogg. The power that could be generated by the stored water at the Kellogg site would amount to nearly 1,000,000 kilowatt-hours, and at all proposed sites to 3,500,000 kilowatt-hours if there were no drawdown below Kellogg.
If the Wolf Creek reservior site were developed it probably would not be profitable to draw down the head at this site until late in the season, after all water had been used in the ~eservoir, and usually it would not be drawn down at all. In a very dry year it could probably be drawn down to .advantage in November or December. With an assumed mean regulated flow of 1,500 second-feet at low water without the Wolf Creek or Coles Valley Reservoir, the loss of power due to loss of head would amount to 1,320 horsepower a day and would equal the power obtained at this site from the stored water in 33 days. . If all sites below were developed the flow for the four low-water months could be regulated to give a uniform power output, and the total power could
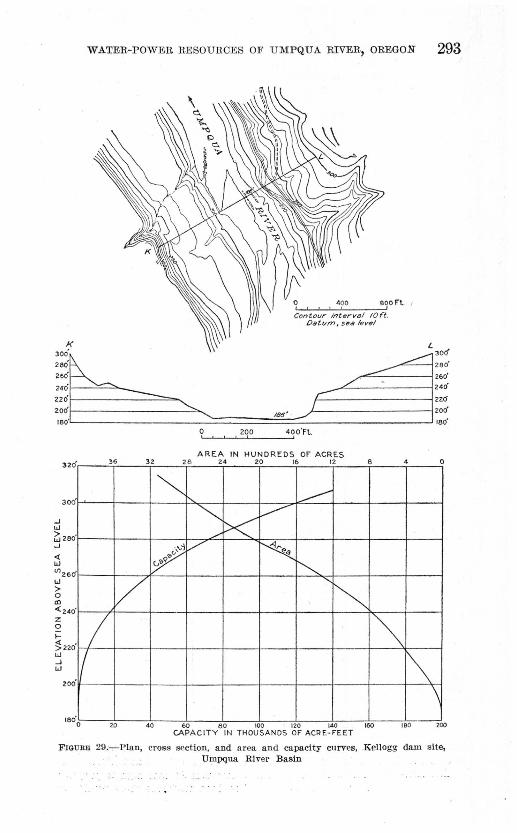
..J w
320
300
1:; 260 .J
< w C/)260 w > 0 Ctl
<240 z 0 f-
;; 220 w ..J w
200
WATER-POWER RESOURCES Ol!' UMPQUA RIVER, ORE GON 293
400 800ft. I
Contour int~rvBI 10 rt. Oatvm, seBievel
AREA IN HUNDREDS Of ACRES 36 32 2 8 24 20 16 12 8 4 0
~ ..---~ >< v
/
c>"'i / ~ v ~ v '~
L ~ I \
\ 20 40 60 60 100 120 140 160 ISO 200
CAPACITY IN THOUSANDS Of ACRE- fEET
FIGURE 29,-,-Pian, cross section, and area and capacity curves, .Kellogg dan1 site, Umpqua River Basin
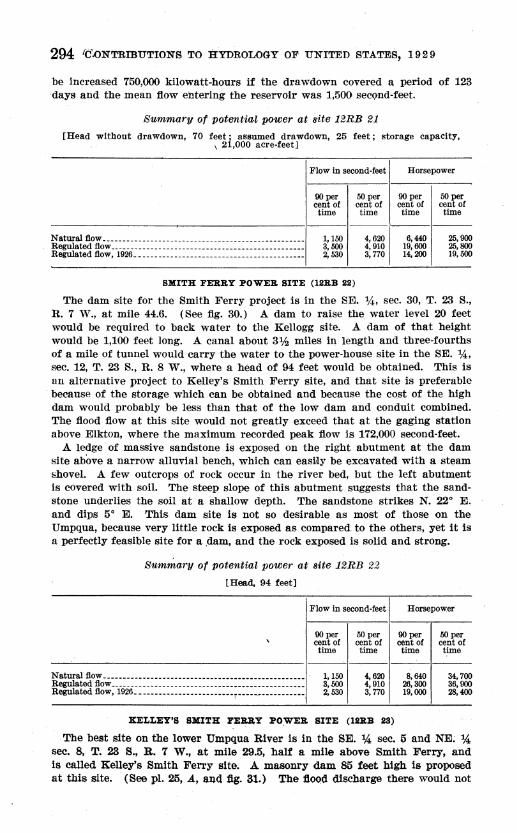
294 1(i.ONTRIBUTIONS TO HYDROLOGY OF UNITED STATES, 19 2 9
be increased 750,000 kilowatt-hours if the drawdown covered a period of 123 ·days and the mean :flow entering the reservoir was 1,500 sec()nd-feet.
Summary of potential power at site 12RB 21
[Head without drawdown, 70 feeti· assumed drawdown, 25 feet; storage capacity, 1 2 ,000 acre-feet]
Flow in second-feet
90per cent of time
50 per cent of time
Horsepower
90per cent of time
50 per cent of time
--------~--------1------------
Natural fiow ______________________________________ -------------Regulated fiow ____________________________________ -------------Regulated fiow, 1926. _____ -------------------------------------
1,150 3,500 2,530
SXITB: FElUI.Y POWER SITE (12RB 211)
4,620 4,910 3, 770
6,440 19,600 14,200
25,000 25,800 19,500
The dam site for the Smith Ferry project is in the SE. :14, sec. 30, T. 23 S., R. 7 W., at mile 44.6. (See :fig. 30.) A dam to raise the water level 20 feet would be required to back water to the Kellogg site. A dam of that height would be 1,100 feet long. A canal about 3¥.! miles in length and three-fourths of a mile of tunnel would carry the water to the power-house site in the SE. :!4, sec. 12, T. 23 S., R. 8 W., where a head of 94 feet would be obtained. This is an alternative project to Kelley's Smith Ferry site, and that site is preferable because of the storage which can be obtained and because the cost of the high dam would probably be less than that of the low dam and conduit combined. The :flood :flow at this site would not greatly exceed that at the gaging station above Elkton, where the maximum recorded peak :flow is 172,000 second-feet.
A ledge of massive sandstone is exposed on the right abutment. at the dam site above a narrow alluvial bench, which can eas!Jly be excavated with a steam shovel. A few outcrops of rock occur in the river bed, but the left abutment is covered with soil. The steep slope of this abutment suggests that the sandstone underlies the soil at a shallow depth. The sandstone strikes N. 22• E. and dips 5• E. This dam site is not so desirable as most of those on the Umpqua, because very little rock is exposed as compared. to the others, yet it is a perfectly feasible site for a .dam, and the rock exposed is solid and strong.
Summary of potential power at site 12RB 22
[Head, 94 feet]
Flow In second-feet
90per cent of time
50 per cent of time
Horsepower
90per cent of time
50 per cent of time
---------------------1~-.----·----
Natural fiow -------------------------------------·-··---------- · Regulated flow _____________________________ ----- ____ ._. _______ _
Regulated fiow, 1926. _ --------------- --------;----'~----------·-
1,150 3,500 2,530
4,620 4,910 3, 770
KELLEY'S SXITB: FE:a:B.Y PO;wER SITE (12RB 23)
8,640 26,300 19,000
34,700 36,900 28,400
The best site on the lower Umpqua River is in the SE. lA, sec. 5 and NE; lA, sec. 8, T. 23 S., R. 7 w., at mile 29.5, half a mile above Smith Ferry, and is called Kelley's Smith Ferry site. A masonry dam 85 feet high is proposed at this site. (See pl. 25, A, and tlg. 31.) The :flood discharge there would not
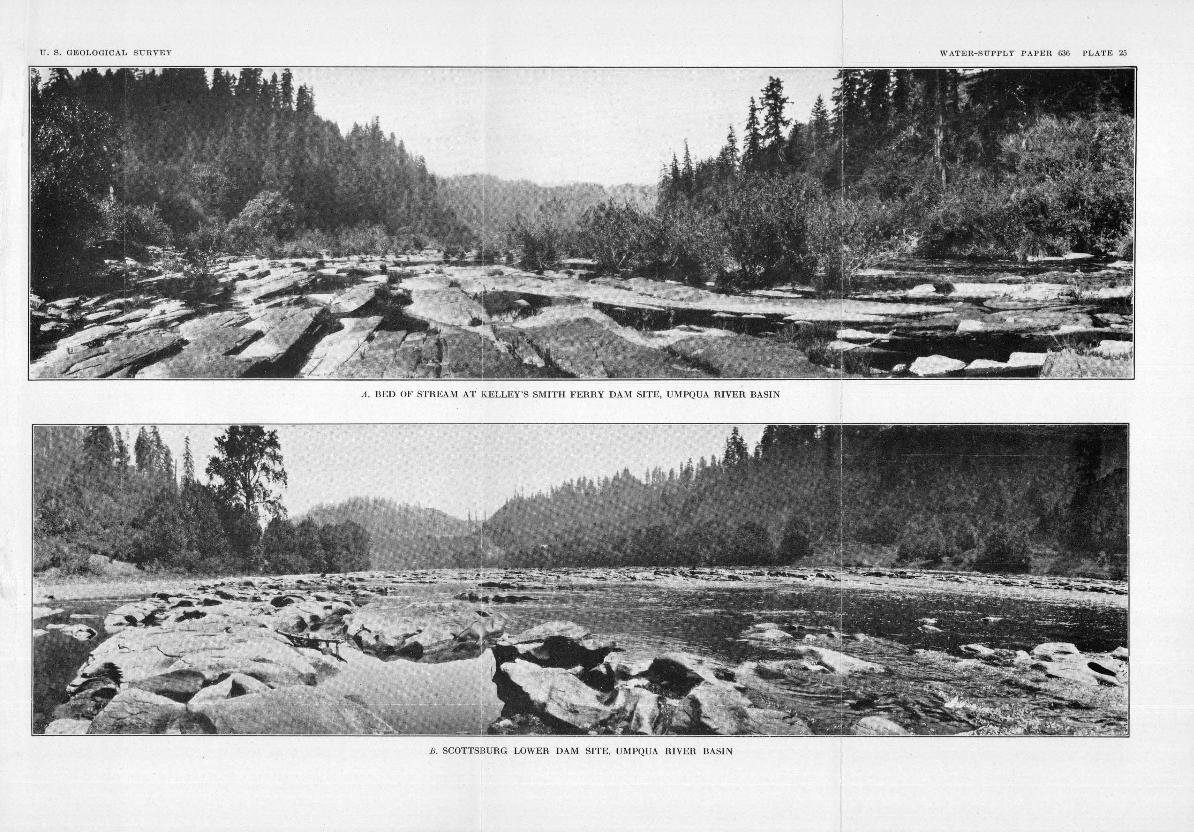
U. S . GEOLOGICAL SUllVEY WATEll-SUPPLY PAPER 1)36 PLATE 25
A. BED OF STREAM AT KELLEY'S SMITH FERRY DAM SITE, UMPQUA RIVER BASIN
B. SCOTTSBURG LOWER DAM SITE, UMPQUA RIVER 13ASIN
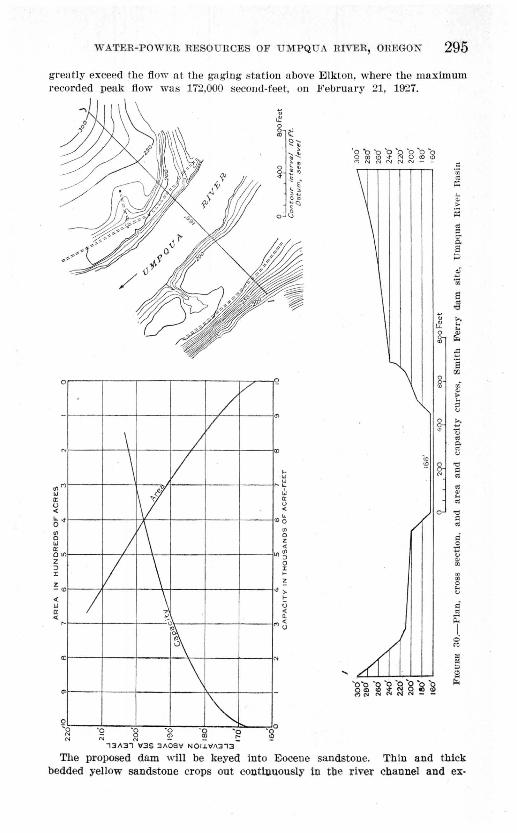
WATER-POWER RESOURCES OF U MPQUA RIVER, OHEGON 295
greatly exceed the flow at the gaging station above Elkton, where the maximum recorded peak flow was 172,000 second-feet, on February 21, 1927.
0
"' '"' w a: () < ~-t
"' 0 w a: Olll z :) J:
" -<O
< w a: A(
1/ I
\ \
J I \
\ ~
/ v
v I v
0
Q)
... ... ... ~
"' cr u ~
~ <Oo
"' 0 z ~
Ill ~ 0 J: ... z
"> ... 0 ~
"'~
0
\ ·;n "' 1):1
;;; >
\ ~
" :::> C"
"' 8 p
g "'
\ a " "" ';; t: ~ ...
0 ~ 2 z
"'\ \
"8 00
0
~ ,;; "' > ... " "
0 !' 0 ~
" .. "' "' "' "
!!? 8 "" c N
" " ~ "
// 0 "" 0
" §
:;;J
" <1>
"' ~ 0 ... " c " ii: I I\ ~
\ N Q) A
0 00
01
" " f='i
0 'o N N
~ -~ ~ ~ ~ ~
0
,31\31 1135 31\06\1 NOI.l.\111:3,3
The proposed dam will be keyed into Eocene sandstone. bedded yellow sandstone crops out con tl.uuously iJ;I tue river
""
Thin and thick cuannel and ex-
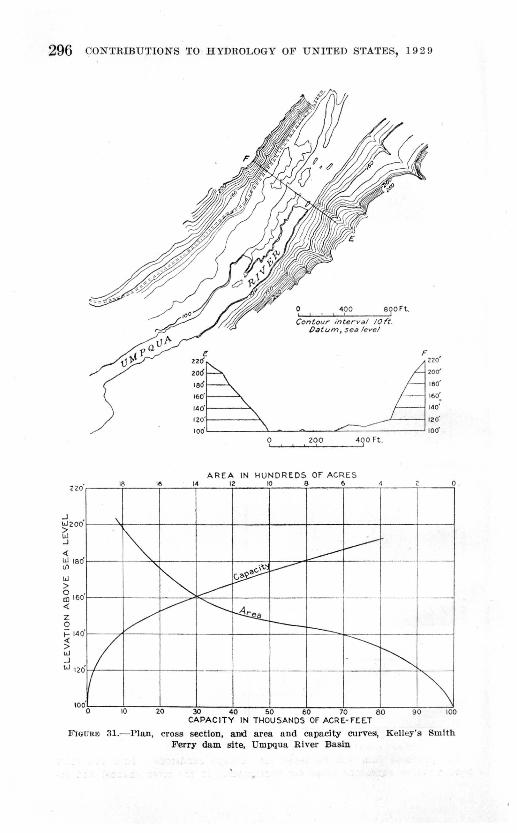
296 CONTRIBUTIONS TO HYDROLOGY OF UN ITED STATES, 19 2 9
2ZO
J W200 (;j J
<( w ISO
"' w > ~ 160 <(
IS
\
~
16
I!
::~~ 180
160'
140' f---->.,
12~.: \
100· - \
0
4po soo Ft. C!:-o-nl...t-ou._r_._in_tJ....e_r_v_ai.,---,IO~ft. 0
IJa tum, sea level
. F
ZOO 400Ft.
AREA IN HUNDREDS OF ACRE S ~ ~ ~ s 6
-----------~ ~ ----~
-----
:~~: 180'
160:
140'
IZO'
100'
0
·- -
z 0 ;::: 140 ~
y.---- ~ ~ r-----~
w .J w 120 I
I 10 0
0 10
--........ ~
\ 20 30 40 50 60 70 80 90 100
CAPACITY IN THOUSANDS OF ACRE-FEET
F'JGURH 31.-Plan, cross section, allld area and capacity curves, Kelley's Smith Ferry dam site, Umpqua River Basin
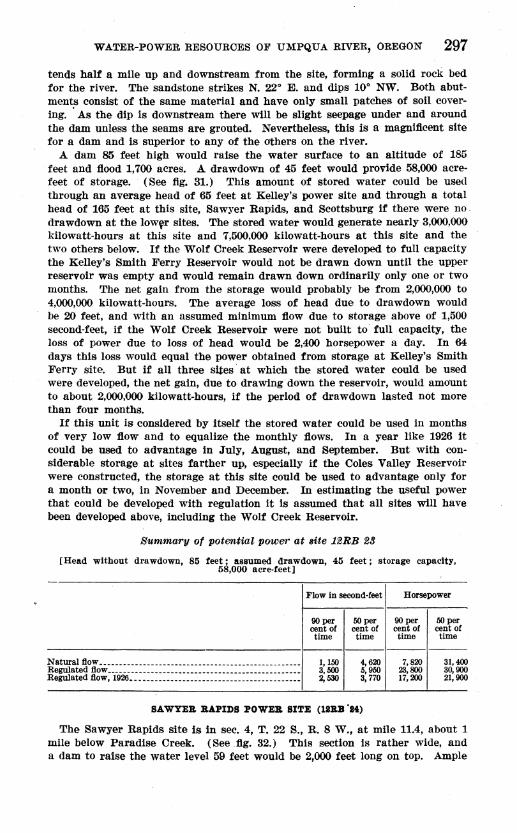
WATER-POWER RESOURCES OF UMPQUA RIVER, OREGON 297
tends half a mile up and downstream from the site, forming a solid rock bed for the river. The sandstone strikes N. 22• E. and dips 10• NW. Both abutments consist of the same material and have only small patches of soil covering. · As the dip is downstream there will be slight seepage under and around the dam unless the seams are grouted. Nevertheless, this is a magnifl.cent site for a dam and is superior to any of the others on the river.
A dam 85 feet high would raise the water surface to an altitude of 185 feet and fiood 1,700 acres. A drawdown of 45 feet would provide 58,000 acrefeet of storage. (See fig. 31.) This amount of stored water could be used through an average head of 65 feet lit Kelley's power site and through a total head of 165 feet at this site, Sawyer Rapids, and Scottsburg if there were no drawdown at the low\'r sites. The stored water would generate nearly 3,000,000 kilowatt-hours at this site and 7,500,000 kilowatt-hours at this site and the two others below. If the Wolf Creek Reservoir were developed to full capacity the Kelley's Smith Ferry Reservoir would not be drawn down until the upper reservoir was empty and would remain drawn down ordinarily only one or two months. The net gain from the storage would probably be from 2,000,000 to 4,000,000 kilowatt-hours. The average loss of head due to drawdown would be 20 feet, and with an assumed minimum fiow due to storage above of 1,500 second-feet, if the Wolf Creek Reservoir were not built to· full capacity, the loss of power due to loss of head would be 2,400 horsepower a day. In 64 days this loss would equal the power obtained from storage at Kelley's Smith Ferry site. But if all three sites· at which the stored water could be used were developed, the net gain, due to drawing down the reservoir, would amount to about 2,00o,OOO kilowatt-hours, if the period of drawdown lasted not more than four months.
If this unit is considered by itself the stored water could be used in months of very low fiow and to equalize the monthly fiows. In a year like 1926 it could be used to advantage in July, August, and September. But with considerable storage at sites farther up, especially if the Coles Valley Reservoir were constructed, the storage at this site could be used to advantage only for a month or two, in November and December. In estimating the useful power that could be developed with regulation it is assumed that all sites will have been developed above, including the Wolf Creek Reservoir.
Summary of potmtial power at Bite 12RB 23
[Head without drawdown, 85 feet l assumed drawdown, 45 feet; storage capacity, 5!!,000 acre-feet]
Flow in seeond-feet Horsepower
OOper cent of time
liOper cent of time
OOper cent of time
liOper cent of time
------------------1------------Naturaltlow. ----- ___________ ----------------------------------
:::;!l:!:~ i~:;i9~--------======================================= 1, lliO 3,500 2,530
4, 620 7, 820 5, 900 23, 800 3, 770 17, 200
SAWYER RAPIDS POWER SITE (lll:aB '114)
31,400 30,900 21,900
The Sawyer Rapids site is in sec. 4, T. 22 S., R. 8 W., at mile 11.4, about 1 mile below Paradise Creek. (See fig. 32.) This section is rather wide, and a dam to raise the water level 59 feet would be 2,000 feet long on top. Ample
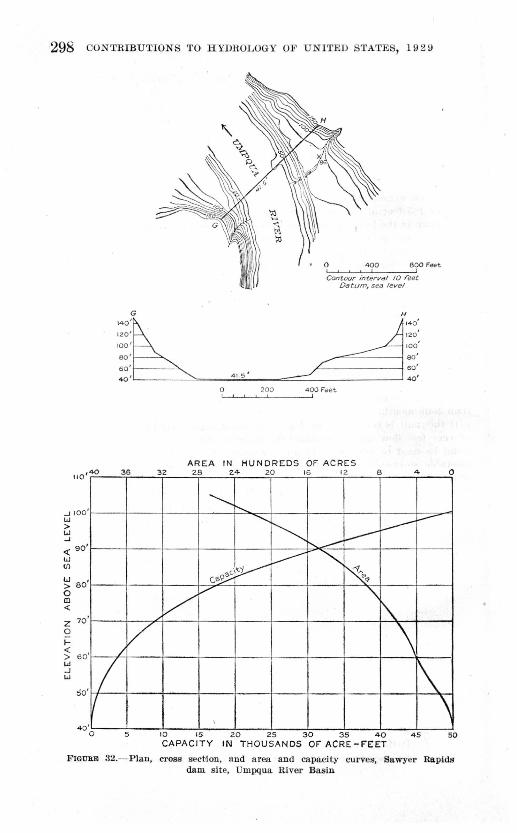
298 CONTRIBUTIONS TO HYDROLOGY OF UNITED STA'rES, 19 2 9
I 11 0 40
....J 100 w > w ..J
<( 90 w
,
(/)
w > 80 0 m <(
z 70 0 i= <
'
'
,
G
140'~ IZ0 1
10 0 '
eo ' 60'1--- --"'. 40' ~ 41.5
1
0 200
0 8 00 F"eet
'=-Co~nt-ou'-r~in_tec_rv-al-1--:-0 --::fe_Jet 400
/Jd tvm, s ea level
A RE A I N H UN D RE D S OF A C RE S 36 32 2 8 Z4 20 16 12 8 4
'-....... 1'---. ..........
~ l------" !--
!..---~-... --
~ "" ~ c:~ (,~~ cy
v v "\ ~
/v \ .I
> 6 0 w ..J w 1\
0
so if \
4 0 0 5
\
10 15 20 2 5 30 35 40 CA PA CIT Y IN TH OU SAN DS OF AC RE - F'EET
45 50
F IGURE 32.- P ian, cross sedlon , and a rea a.nd capacity curves, Sawyer Rapids dam site, Umpqua River Basin
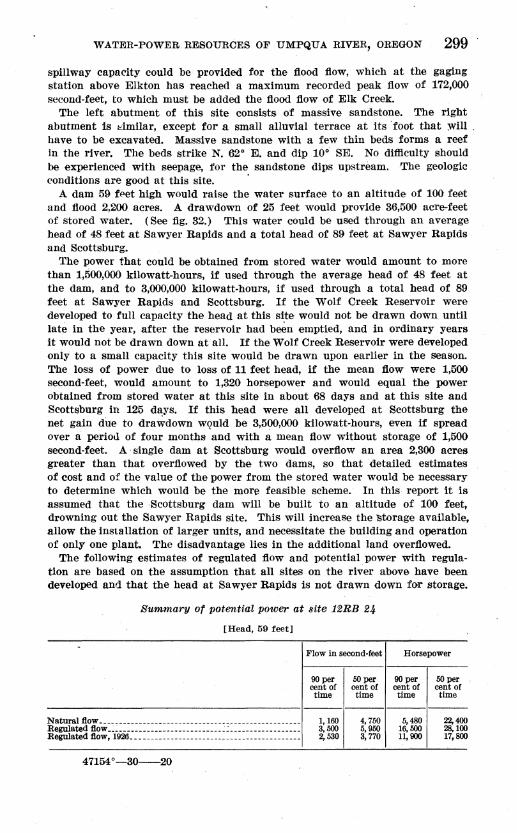
WATER-POWER RESOURCES OF UMPQUA RIVER, OREGON 299
spillway capacity could be provided for the ·:flood flow, which at the gaging station above Elkton has reached a maximum recorded peak flow of 172,000 second-feet, to which must be added the flood flow of Elk Creek.
The left abutment of this site consists of massive sandstone. The right abutment is toimilar, except for a small alluvial terrace at its ·foot that :will . have to be excavated. Massive sandstone with a few .thin beds forms a reef In the river. The beds strike N. 62" E. and dip 10" SE. No difficulty should be experienced with seepage, for the sandstone dips upstream. The geologic conditions are good at this site. ·
A dam 59 feet high would raise the water surface to an altitude of 100 feet and flood 2,200 acres. A drawdown of 25 feet would provide 36,500 acre-feet of stored water. (See fig. 32.) This water could be used through an average head of 48 feet at Sawyer Rapids and a total head of 89 feet at Sawyer Rapids and Scottsburg.
The power that could be obtained from stored water would amount to more than 1,500,000 kilowatt-hours, .tf used through the average head of 48 feet at the dam, and to 3,000,000 kilowatt-hours, if used through a total head of 89 feet at Sawyer Rapids and Scottsburg. If the Wolf Creek Reservoir were developed to full capacity the head at this s~te would not be drawn down until late in the year, after the reservoir had been emptied, and in ordinary years it would not be drawn down at all. If the Wolf Creek Reservoir were developed only to a small capacity this site would be drawn upon earlier in tlle season. The loss of power due to loss of 11 feet head, if the mean flow were 1,500 second-feet, would amount to 1,320 horsepower and would equal the power obtained from stored water at this site in about 68 days and at this site and Scottsburg in 125 da,ys. If this head were all developed at Scottsburg the net gain due to drawdown wquld be 3,500,000 kilowatt-hours, even if spread over a periou of four months and with a mean flow without storage of 1,500 second-feet. A· single dam at Scottsburg would overflow an area 2,300 acres greater than that overflowed by the two dams, so that detailed estimates of cost and of the value of the power from the stored water would be necessary to determine which would be the more feasible scheme. In this report it is assumed that the ·Scottsburg dam will be built to an altitude of 100 feet, drowning out the Sawyer Rapids site. This will increase the "Storage available, allow the installation of larger units, and necessitate the building and operation of only one plant. The disadvantage lies in the additional land overflowed.
The following estimates of regulated flow and potential power with regulation are based on the assumption that all .sites on the river above have been developed and that the head at Sawyer Rapids is not drawn down for storage.
Summary of potential power at Bite 12RB 24
[Head, 59 feet]
Flow in second-feet
90per cent of time
50 per cent of time
Horsepower
90per cent of time
50 per cent of time
------------------------------~-1---------------------
Natural ftow ---------------------------------------------------
~=~ :~:;~i926_-::::::::::::::::::::::::::::::::::::::::::
47154"--30----20
1,160 3,500 2, 530
4, 750 5,950 3, 770
5,480 16,500 11,900
22,400 28,100 17,800
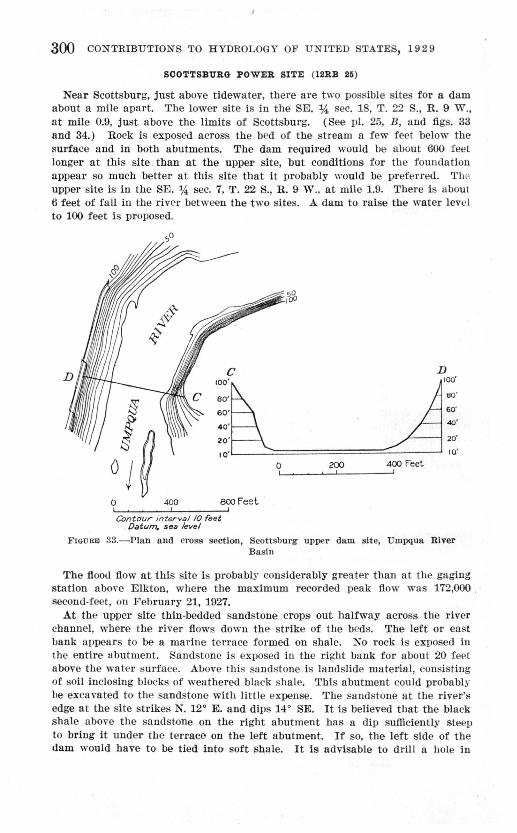
300 CONTRIBUTIONS TO HYDROLOGY OF UNITED STATES, 1929
SCOTTSBURG l'OWER SITE (12RB 25)
Near Scottsburg, just above tidewater, there are two possible sites for a dam about a mile apart. The lower site is in the SE. 1,4 sec. 18, T. 22 S., R. 9 W., at mile 0.9, just above the limits of Scottsburg. (See pl. 25, B, and figs. 33 and 34.) Rock is exposed across the bed of the stream a few feet below the surface and in both abutments. The dam required would be about 600 feet longer at this site . than at the upper site, but conditions for the foundation appear so much better at this site that it probably would be preferred. 'l' hu upper site is in the SE. 1,4 sec. 7, T. 22 S., R. 9 W., at mile 1.9. There is about 6 feet of fall in the river between the two sites. A dam to raise the water level to 100 feet is proposed.
0
c
'~~ 10'-
400 aoo feet
Contdur interval 10 reet Datum,. sea level
0 200 400 Feet
FIGURD 33.-Pian and cross section, Scottsburg upper dam site, Umpqua River Basin
The flood flow at this site is probably considerably greater than at the gaging station aboYe Elkton, where the maximum recorded peak flow was 172,000 . second-feet, on February 21, 1927.
At the upper site thin-bedded sandstone crops out halfway across the river channel, where the river flows down the strike of the beds. The left or east bank appears to be a marine terrace formed on shale. No rock is exposed in the entire abutment. Sandstone is exposed in the right bank for about 20 feet above the water surface. Above this sandstone is landslide material, consisting of soil inclosing blocks of weathered black shale. This abutment could probably he excavated to the sandstone with little expense. The sandstone at the river's edge at the site strikes N. 12° E. and dips 14° SE. It is believed that the black shale above the sandstone on the right abutment has a dip sufficiently steep to bring it under the terrace on the left abutment. If so, the left side of the dam would have to be tied into soft sb,ale. It is advisable to drill a hole in
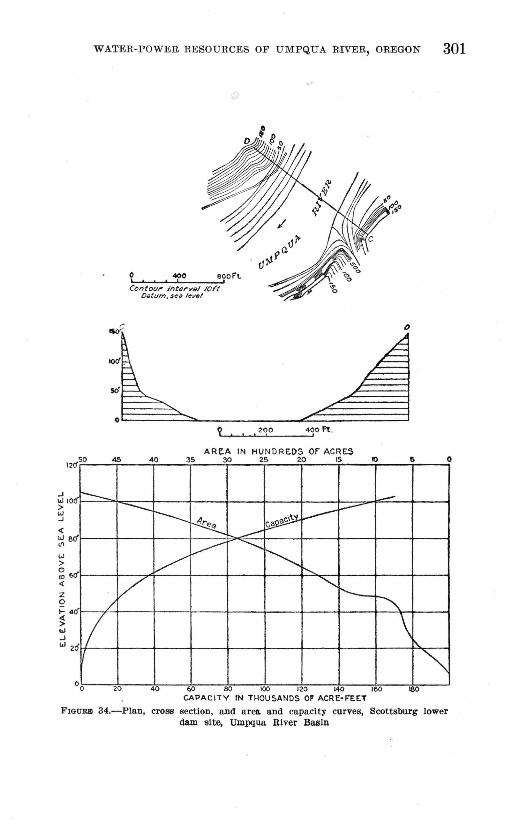
..J Lo.l lOci' > w _J
<(
w eo' "' w > ~6()" <(
z 0
WATER-POWER RESOURCES OF UMPQUA RIVER, OREGON 301
45
~
oL-~~~40~o ____ _;jeooFt Ccntou!' intervs/ IOI't
Datum. sell lf!vl!tl
Ill._._, __._, __._, .:.20.._, 0::._ ____ _.4~0 l't .
AREA IN HVNDR I:.DS OF ACRES 40 H ~ D W B
~ 1--- ~ 1.---1--
~ ~ L.------ ............
~ v "' [7 '""" t--/
0
-
"' 1- 40
6./ ~ w ..J wz
IT
\
"" 0 0 20 40 60 80 100 120 140 160 180
CAPACITY IN THOUSANDS OF ACRE- FEET
FIGURE 34,-Plan, cross section, and· area. and capacity curves, Scottsburg lower dam site, Umpqua River Basin
302 CONTRffiUTIONS TO HYDROLOGY OF UNiTED STATES, 19 2 9
the left abutment to determine the character of the materi!ll in the bench. If it is found to be solid sandstone, and not soft shale, this site will be better than the lower site .because it has a narrower section.
At the lower site massive sandstone crops out on the left bank and in, the river. The right bank has a small, narrow alluvial bench and a soil-covered slope. Massive sandstone similar to that which occurs in the left abutment lies at shallow depths. The sandstone ~n the left bank strikes N. 37" E. and dips 13" SE. The section is wide at the site but is satisfactory for the proposed 100-foot da,m. Because springs are rare in this region it is believed that the sandstone and shale along the Umpqua are poor water bearers and hence not likely> to cause leakage from impounded water. Geologically this dam site is preferable to the Scottsburg upper dam site.
The amount of storage available at this site depends on whether the Sawyer Rapids site is developed or all the head is utilized at .Scottsburg. If a dam is built at the Sawyer Rapids site then the dam at Scottsburg would be. limited to an altitude of 41 feet above sea level. At this altitude the area of the reservoir would be 650 acres, and the total storage would amount to 15,000 acre-feet. It probably would not pay to draw down the reservoir for this small amount of storage, except in an emergency. But a dam could be built at Scottsburg to an altitude of 100 feet, thus destroying the Sawyer Rapids site and flooding 4,500 acres. With a dam of this height a drawdown of 40 feet would provide 120,000 acre-feet of storage. This large storage capacity would.be valuable if the site were developed as an independent unit. (See figs. 33 and 34.) The ~tored water could be used through an average head. of 84 feet and would generate 7,000,000 kilowatt-hours. The net power would be considerably less than this, depending on the length of time the head was drawn down and the mean flow of the stream during the period of. drawdown, including stored water released at reservoirs upstream. If the Wolf Creek Reservoir were not conRtructed the regulated low-water flow at Scottsburg probably would not exceed 1,500 second-feet. The mean loss of head due to a drawdown of 40 feet would be 16 feet, and the loss of power due to loss of head if this drawdown were spread over a period of four months would be 3,000,000 kilowatt-hours. The net gain due to drawing down the reservoir would be 4,000,000 kilowatt-hours, or an average of 1,800 horsepower for a period of four months. If the Wolf Creek Reservoir were built the period of drawdown at Scottsburg could be confined to about one month at the end of the low-water season, thus decreasing the loss of power due to loss of head.
Summary of potential power at site 12RB 25
[Head without drawdown, 100 feet; assumed drawdown, 40 feet; storage capaclt)', 120,000 acre-feet]
Flow In second-feet
90per cent of time
Horsepower
90per cent of time
SOper cent.of time
----------------------~------~-1---------------------Natural flow •..•.••••••...••.••••.••••.•.••.•.••••••.••.••••••.
t:J::t g~:;192tc:======================================== 1,160 3,630 2,570
4,800 6, 210 3,800
9,270 23,700 20,~
38,400 43,000 30,400
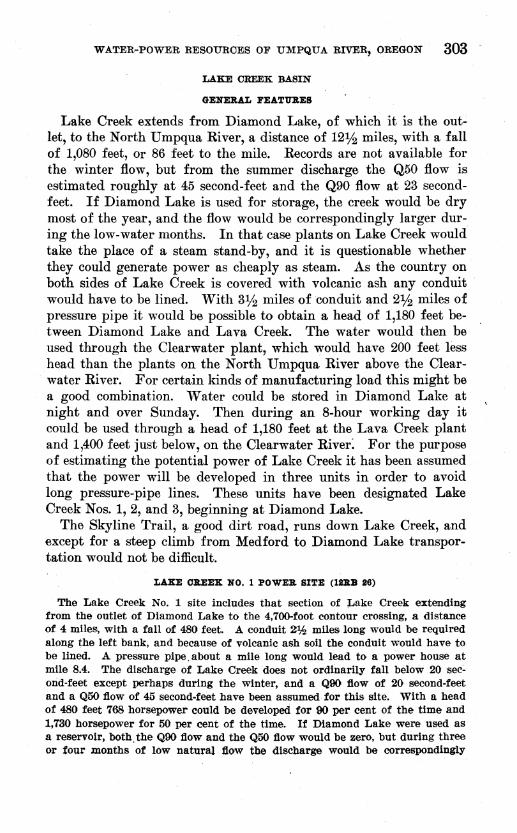
WATER-POWER RESOURCES OF UMPQUA RIVER, OREGON 303 -
LAKE CREEK BASIN
GENERAL FEA.T'U':B.EB
Lake Creek extends from Diamond Lake, of which it is the outlet, to the North Umpqua River, a distance of 12lf2 miles, with a fall of 1,080 feet, or 86 feet to the mile. Records are not available for the winter flow, but from the summer discharge the Q50 flow is estimated roughly at 45 second-feet and the Q90 flow at 23 secondfeet. If Diamond Lake is used for storage, the creek would be dry most of the year, and the flow would be correspondingly larger during the low-water months. In that case plants on Lake Creek would take the place of a steam stand-by, and it is questionable whether they could generate power as cheaply as steam. As the country on both sides of Lake Creek is covered with volcanic ash any conduit would have to be lined. With 3lf2 miles of conduit and 2lf2 miles of pressure pipe it would be possible to obtain a head of 1,180 feet between Diamond Lake and Lava Creek. The water would then be used through the Clearwater plant, which would have 200 feet less head than the plants on the North Umpqua River above the Clearwater River. For certain kinds of manufacturing load this might be a good combination. Water could be stored in Diamond Lake at night and over Sunday. Then during an 8-hour working day it could be used through a head of 1,180 feet at the Lava Creek plant and 1,400 feet just below, on the Clearwater River: For the purpose of estimating the potential power of Lake Creek it has been assumed that the power will be developed in three units in order to avoid long pressure-pipe lines. These units have been designated Lake Creek Nos. 1, 2, and 3, beginning at Diamond Lake.
The Skyline Trail, a good dirt road, runs down Lake Creek, and except for a steep climb from Medford to Diamond Lake transportation would not be difficult.
LAXE O:B.EEX NO. 1 POWER BITE (lDB atl)
The Lake Creek No. 1 site includes that section of ;Lake Creek extending from the outlet of Diamond Lake to the 4, 700-foot contour crossing, a distance of 4 miles, with a fall of 480 feet. A conduit 2lh miles long would be required along the left bank, and because of volcanic ash soil the conduit would have to be lined. A pressure pipe. about a mile long would lead to a power house at mile 8.4. The discharge of Lake Creek does not ordinarily fall below 20 sec~ orid-feet except perhaps during the winter, and a QOO :dow of 20 second-feet and a Q50 :dow of 45 second-feet have been assumed for this site. With a head of 480 feet 768 horsepower could be developed for 00 per cent of the time and 1,730 horsepower for 50 per cent of the time. If Diamond Lake were used as a reservoir, both. the QOO :dow and the Q50 :dow would be zero, but during three or four months of low natural :dow the discharge would be correspondingly
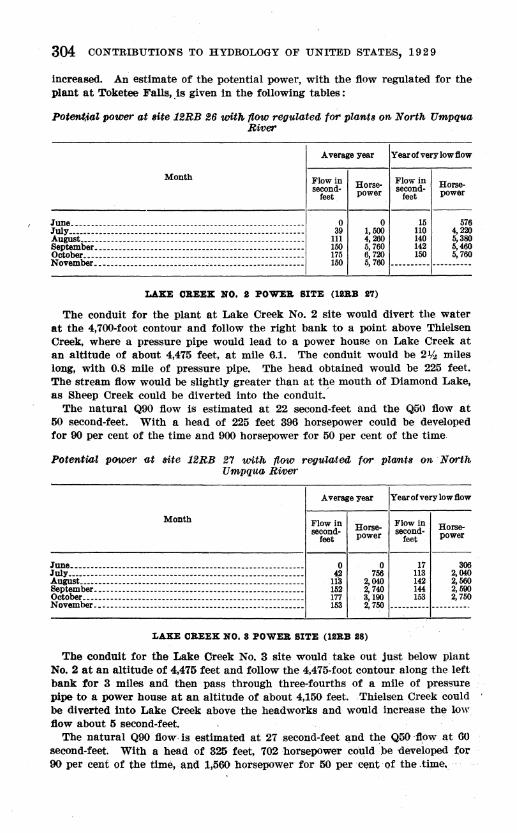
304 CONTRIBUTIONS TO HYDROLOGY OF UNITED STATES, 1929
increased. An estimate of the potential power, with the flow regulated for the plant at Toketee Falls, .is given in the following tables:
Potent,ia' power at Bite 12RB 26 with flow regulated, for plants on North Umpqua River
Month
Average year Yearofverylowflow
Flow in second·
feet Horsepower
Flow in second
feet Horsepower
----------------------------------!---------------------June. __ ._ ••. ___ . ___________________________________ -- __ •.•.•. --July ___________________________________________________________ _
Angust •• -------------------------------------------·-----------September .••... ______________________________________________ _
October •• -----------------------------------------------------November .•....................................... ------------
0 39
111 150 175 150
0 15 576 1, 500 110 4, 220 4, 260 140 5, 380 5, 760 142 5,460 6, 720 150 5, 760 5, 760 ---------- ----------
LAXE CBEEX NO. 2 POWER SITE (12BB 27)
The conduit for the plant at Lake Creek No. 2 site would divert the water at the 4,700-foot contour and follow the right bank to a point above Thielsen Creek, where a pressure pipe would lead to a power house on Lake Creek at an altitude of about 4,475 feet, at mile 6.1. The conduit would be 2li:J miles long, with 0.8 mile of pressure pipe. The head obtained would be 225 feet. The stream flow would be slightly greater than at t~e mouth of Diamond Lake, as Sheep Creek could be diverted into the conduit.
The natural Q90 flow is estimated at 22 second-feet and the Q50 flow at 50 second-feet. With a head of 225 feet 396 horsepower could be developed for 90 per cent of the time and 900 horsepower for 50 per cent of the time.
Potenti-al power at site 12RB 2"1 wit.h, flow regu~too for plamts on Nm-th Umpqua Riloor
Average year Year of very low flow
Month Flow in Horse- Flow in Horse-second- second-feet power feet power
------------June ••• ------------------··-··-------------------···----------- 0 0 17 306
42 756 113 2,040 1f3 2,040 142 2,560 152 2, 740 144 2,590 177 3,190 153 2, 750 153 2, 750 ·-·------- ---------·
e~~ ~ ~ ~ ~ ~ ~ ~ ~ ~ ~ ~ ~ ~ ~ ~ ~ ~ ~ ~ ~ ~ ~ ~ ~ ~ ~ ~ ~ ~ ~ ~ ~ ~ ~ ~ ~ ~ ~ ~ ~ ~ ~ ~ ~ ~ ~ ~ ~ ~ ~ ~ ~ ~ November .• ---------------------------------··----------------
LAXE CBEEX NO. 8 POWER SITE (12BB 28)
The conduit for the Lake Creek No. 3 site would take out just below plant No. 2 at an altitude of 4,475 feet and follow the 4,475~foot contour along the left bank for 3 miles and then pass through three-fourths of a mile of pressure pipe to a power house at an altitude of about 4,150 feet. Thielsen Creek could be diverted into Lake Creek above the headworks and would increase the low :flow about 5 second-feet.
The natural Q90 flow. is estimated at 27 second-feet and the Q50 ·flow at 60 second-feet. With a head of 325 feet, 702 horsepower could ·be 1ieveioped for 90 per cent of the time, and 1,560 horsepower for 50 per cent of the .time,
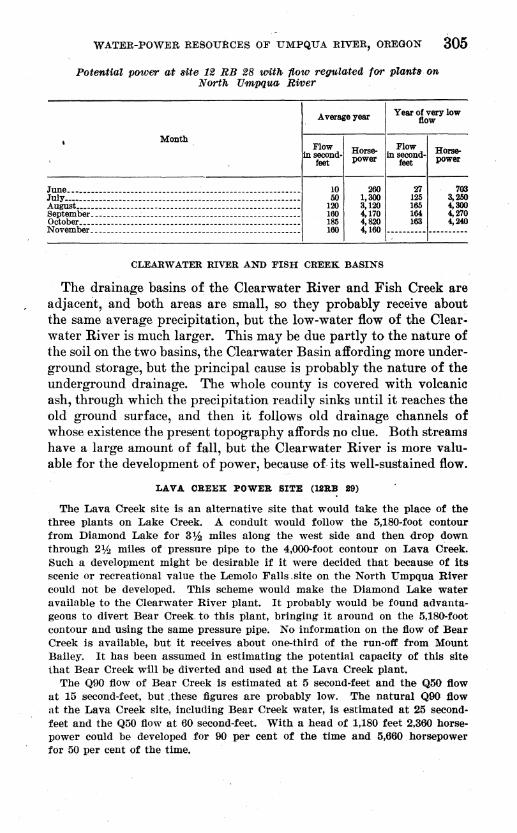
WATER-POWER RESOURCES OF UMPQUA RIVER, OREGON 305
PotentiaJ power at Bite 12 RB 28 with flow refiUZateil for pJtmtB on North Umpqua Rwer
Month
June •••••••••••••••••••••••• _ •••••••••••••••••••. _ •••••.•••••.. July-----------------------------------------------------------August •••• --------------------------------------------------·--September_------- ______________ -------------- ____ --- --•---- ---October _______________________________________________________ _ November_ •• _________________ ,_-------------- __ ---------------
Average year Year of very low flow
In ~=d· Horse- In =d· Horse-feet power feet power
10 lit)
120 160 185 160
260 'n 703 1, 300 125 3, 200 3, 120 165 '· 300 4,170 164 4,'¥10 4,820 163 .. ~ 4,160 ---------- ----------
CLEARWATER RIVER AND FISH CREEK BASINS
The drainage basins of the Clearwater River and Fish Creek are adjacent, and both areas are small, so they probably receive about the same average precipitation, but the low-water flow of the Clear~ water River is much larger. This may be due partly to the nature of the soil on the two basins, the Clearwater Basin affording more underground storage, but the principal cause is probably the nature of the underground drainage. The whole county is covered with volcanic ash, through which the precipitation readily sinks until it reaches the old ground surface, and then it follows old drainage channels of whose existence the present topography affords no clue. Both streams have a large amount of fall, but the Clearwater River is more valuable for the development of power, because of-its well-sustained flow.
LAVA OREEX POWER BITE (liRB 19)
The Lava Creek site is an alternative site that would take the place of the three plants on Lake Creek. A conduit would follow the 5,180-foot contour from Diamond Lake for 3% miles along the west side and then drop down through 21h miles of pressure pipe to the 4,()()()-foot contour on Lava Creek. Suc}l. a development might be desirable if it were decided that because of its scenic or recreational value the Lemolo Falls .site on the North Umpqua _River could not be developed. This scheme would make the Diamond Lake water available to the Clearwater River plant. It probably would be found advantageous to divert Bear Creek to this plant, bringing it around on the 5,18()-foot contour and using the same pressure pipe. No information on the fiow of Bear Creek is available, but it receives about one-third of the run-ofE from Mount Bailey. It has been assumed in estimating the potential capacity of this site that Bear Creek will be diverted and used at the Lava Creek plant.
The Q90 fiow of Bear Creek is estimated at 5 second-feet and the Q50 fiow at 15 second-feet, but .these figures are probably low. The natural Q90 fiow at the Lava Creek site, including Bear Creek water, is estimated at 25 secondfeet and the Q50 fiow at 60 second-feet. With a head of 1,180 feet 2,360 horsepower could be developed for 90 per cent of the time and 5,660 horsepower for 50 per cent of the time.
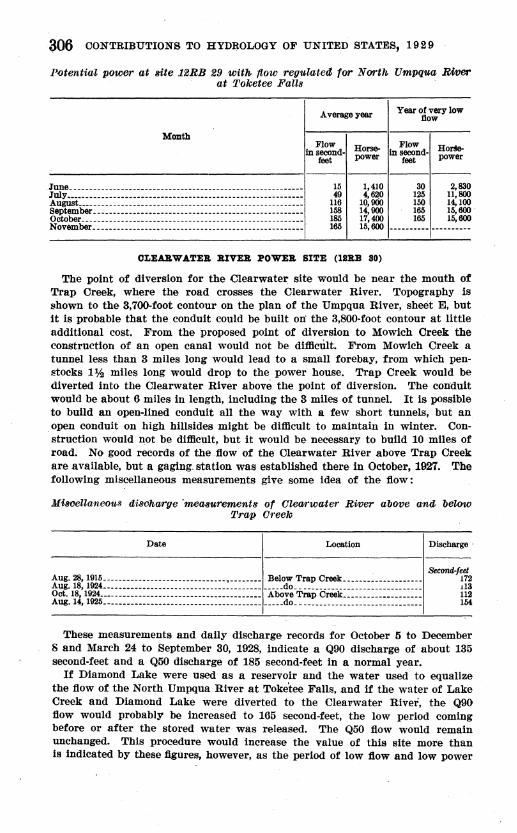
306 CONTRIBUTIONS TO HYDROLOGY OF UNITED STATES, 19 2 9
Potential power at ltite 12RB 29 with, flow regulateit for North, Umpqua RWer at Toketee Falls
Month
.Average year Yearofverylow flow
fn ~~~d- Horse- fn ~:nd- Ho~e-feet power feet power
------------------1------------.Tune __________________________________________________________ _
.July------------------------------------------------------------.August ________________________________________________________ _ September ____ -- ___ ------ _________ ---- ___ ---- _________ ---------October _______________________________________________________ _
November-----------------------------------------------------
15 49
116 158 185 165
1,410 4,6~0
10,900 14,900 17,400 15,600
OLEA.RW ATEB. RIVER POWER SITE (lSB.B 30)
30 2,830 125 11,800 150 14,100 165 15,600. 165 15,600
The point of diversion for the Clearwater site would be near the mouth of Trap Creek, where the road crosses the Clearwater River. Topography is shown to the 3,700-foot contour on the plan of the Umpqua River, sheet E, but it is probable that the conduit could be built on the 3,800-foot contour at little additional cost. From the proposed point of diversion .to Mowich Creek the construction of an open canal would not be difficult. From Mowich Creek a tunnel less than 3 miles long would lead to a small forebay, from which penstocks 1% miles long would drop to the power house. Trap Creek would be diverted into the Clearwater River above the point of diversion. The conduit would be about 6 miles in length, including the 3 miles of tunnel. It is possible to build an open-lined conduit all the way with a few short tunnels, but an open conduit on high hillsides might be difficult to maintain in winter. Construction would not be difficult, but it would be necessary to build 10 miles of road. No good records of the flow of the Clearwater River above Trap Creek are available, but a gaging. station was established there in October, 1927. The following miscellaneous measurements give some idea of the flow:
Miscellaneous discharge ·measurements of Clearwater Ri!Ver above and. below Trap Creek
Date Loca.tlon Discharge·
&ccmd-feet 172 113 112 154
These measurements and daily discharge records for October 5 to December 8 and March 24 to September 30, 1928, indicate a Q90 discharge of about 135 second-feet and a Q50 discharge of 185 second-feet in a normal year.
If Diamond Lake were used as a reservoir and the water used to equalize the flow of the North Umpqua River at Toketee Falls, and if the water of Lake Creek and Diamond Lake were diverted to the CleaFwater River, the Q90 flow would probably be increased to 165 second-feet, the low period coming before or after the stored water was released. The Q50 flow would remain unchanged. This procedure would increase the value of this site more than is indicated by these figures, however, as the period of low flow and low power
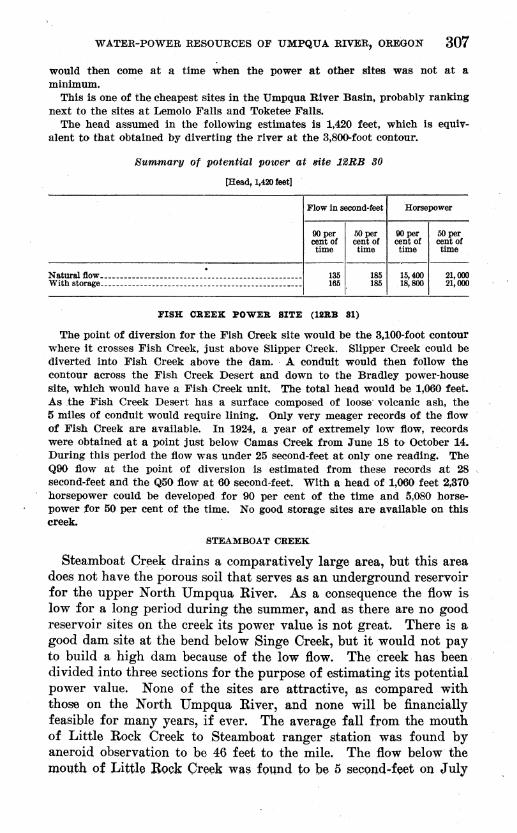
WATER-POWER RESOURCES OF UMPQUA RIVER, OREGON 307
would then come at a time when the power at other sites was not at a minimum.
This is one of the cheapest sites in the Umpqua River Basin, probably ranking next to the sites at Lemolo Falls and Toketee Falls.
The head assumed in the following estimates is 1,420 feet, which is equivalent to that obtained by diverting the river at the 3,800-foot contour.
Summary of potential power at Bite l~RB 80
[Head, 1,420 feet]
Flow In second-feet Horsepower
90per cent of time
/iOper cent of time
90per cent of time
/iOper cent of time
------------------1------------Naturalftow ------------------- ..... .. : •. •....••.•••.•••••...•. With storage .•••••.•.•...••••..••.....•...•................•...
135 165 ,.
FISK OREEX POWER SITE {lOB 81)
185 15,400 185 18,800
21,000 21,000
The point of diversion for the Fish Creek site would be the 3,100-foot contGur where it crosses Fish Creek, just above Slipper Creek. Slipper Creek could be diverted into Fish Creek above the dam. A conduit would then follow the contour across the Fish Creek Desert and down to the Bradley power-house site, which would have a Fish Creek unit. The total head would be 1,060 feet. As the Fish Creek Desert has a surface composed of loose· volcanic ash, the 5 miles of conduit would require lining. Only very meager records of the tlow of Fish Creek are available. In 1924, a year of extremely low tlow, records were obtained at a point just below Camas Creek from June 18 to October 14. During this period the tlow was under 25 second-feet at only one reading. The QOO tlow at the point of diversion is estimated from these records at 28 , second-feet and the Q50 tlow at 60 second-feet. With a head of 1,060 feet 2,370 horsepower could be developed for 90 per cent of the time and 5,080 horsepower for 50 per cent of the time. No good storage sites are available on this creek.
STEAMBOAT OREEK
Steamboat Cr~ek drains a comparatively large area, but this area does not have the porous soil that serves as an underground reservoir for the upper North Umpqua River. As a consequence the flow is low for a long period during the summer, and as there are no good reservoir sites on the creek its power value is not great. There is a good dam site at the bend below Singe Creek, but it would not pay to build a high dam because of the low flow. The creek has been divided into three sections for the purpose of estimating its potential power value. None of the sites are attractive, as compared with those on the North Umpqua River, and none will be financially feasible for many years, if ever. The average fall from the mouth of Little Rock Creek to Steamboat ranger station was found by aneroid observation to be 46 feet to the mile. The flow below the mouth of Little Rock Creek wq.e found to be 5 second-feet on July
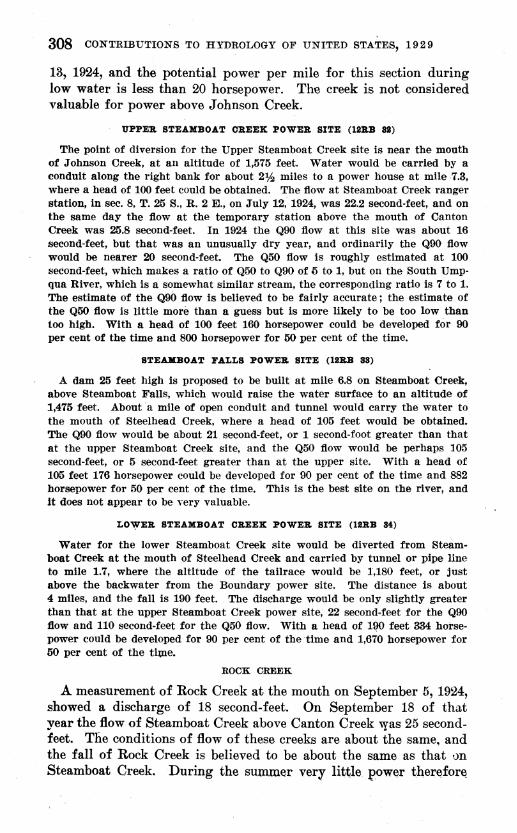
308 CONTRIBUTIONS TO HYDROLOGY OF UNITED STATES, 1929
13, 1924, and the potential power per mile for this section during low water is less than 20 horsepower. The creek is not considered valuable for power above Johnson Creek.
UPPElt. STEAMBOAT OREEX POWER SITE (lliRB 81)
The point of diversion for the Upper Steamboat Creek site is near the mouth of Johnson Creek, at an altitude of 1,575 feet. Water would be carried by a conduit along the right bank for about 2lh miles to a power house at mile 7.3, where a head of 100 feet could be obtained. The flow at Steamboat Creek ranger station, in sec. 8, T. 25 S., R. 2 E., on July 12, 1924, was 22.2 second-feet, and on the same day the flow at the temporary station above the mouth of Canton Creek was 25.8 second-feet. In 1924 the Q90 flow at this site was about 16 second-feet, but that was an unusually dry year, and ordinarily the QOO flow would be nearer 20 second-feet. The Q50 flow is roughly estimated at 100 second-feet, which makes a ratio of Q50 to QOO of 5 to 1, but on the South Umpqua River, which is a somewhat similar stream, the corresponding ratio is 7 to 1. The estimate of the QOO flow is believed to be fairly accurate; the estimate of the Q50 flow is little more than a guess but is more likely to be too low than too high. With a head of 100 feet 160 horsepower could be developed for 90 per cent of the time and 800 horsepower for 50 per cent of the time.
STEAKBOAT FALLS POWEB. SITE (lliRB 88)
A dam 25 feet high is proposed to be built at mile 6.8 on Steamboat Creek, above Steamboat Falls, which would raise the water surface to an altitude of 1,475 feet. About ·a mile of open conduit and tunnel would carry the water to the mouth of Steelhead Creek, where a head of 105 feet would be obtained. The Q90 flow would be about 21. second-feet, or 1 second-foot greater than that at. the upper Steamboat Creek site, and the Q50 flow would be perhaps 105 second-feet, or 5 second-feet greater than at the upper site. With a head of 105 feet 176 horsepower could be developed for 90 per cent of the time and 882 horsepower for 50 per cent of the time. This is the best site on the river, and It does not appear to be Yery valuable.
LO~ER STEAMBOAT OREEX POWEB. SITE (lliB.B 84)
Water for the lower Steamboat Creek site would be diverted from Ste~mboat Creek at the mouth of Steelhead Creek and carried by tunnel or pipe line to mile 1.7, where the altitude of the tailrace would be 1,180 feet, or just above the backwater from the Boundary power site. The distance is about 4 miles, and the fall is 190 feet. The discharge would be only slightly greater than that at the upper Steamboat Creek power site, 22 second-feet for the QOO flow and 110 second-feet for the Q50 flow. With a head of 1~ feet 334 horsepower could be developed for 90 per cent of the time and 1,670 horsepower for 50 per cent of the time.
ROOK CREEK
A measurement of Rock Creek at the mouth on September 5, 1924, showed a discharge of 18 second-feet. On September 18 of that vear the flow of Steamboat Creek above Canton Creek was 25 secondfeet. Tlie conditions of flow of these creeks are about the same, and the fall of Rock Creek is believed to be about the same as that vn Steamboat Creek. During the summer very little power therefore
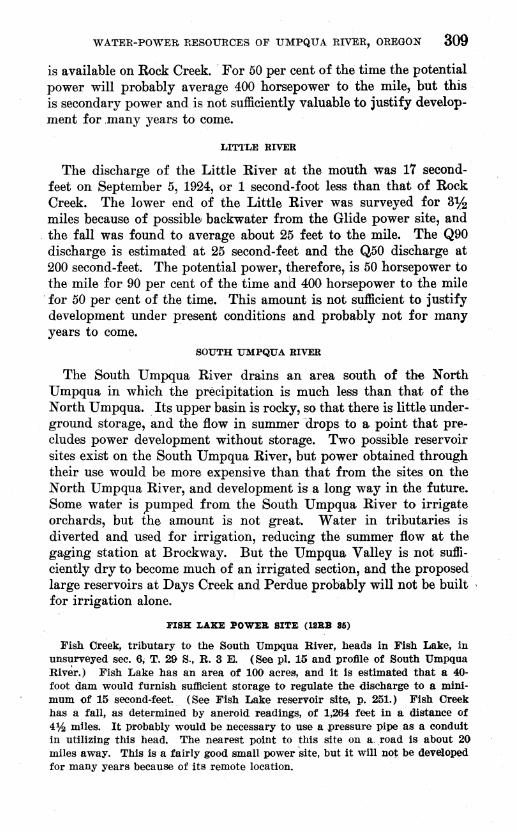
WATER-POWER. RESOURCES OF UMPQUA RIVER, OREGON 309
is available on Rock Creek. ·For 50 per cent of the time the potential power will probably average 400 horsepower to the mile, but this is secondary power and is not sufficiently valuable to justify development for .many years to come.
LITTLE RIVER
The discharge of the Little River at the mouth was 17 secondfeet on September 5, 1924, or 1 second-foot less than that of Rock Creek. The lower end of the Little River was surveyed for 31f2 miles because of possibl{ll backwater from the Glide power site, and the fall was found to average about 25 feet to the mile. The Q90 discharge is estimated at 25 second-feet and the Q50 discharge at 200 second-feet. The potential power, therefore, is 50 horsepower to the mile for 90 per cent of the time an~ 400 horsepower to the mile
·for 50 per cent of the time. This amount is not sufficient to justify development under present conditions and probably not for ronny years to come.
SOUTH UMPQUA RIVER
The South Umpqua River drains an area south of the North Umpqua in which the precipitation is much less than that of the North Umpqua. Its upper basin is rocky, so that there is little underground storage, and the flow in summer drops to a point that precludes power development without storage. Two possible reservoir sites exist on the South Umpqua River, but power obtained through their use would be more expensive than that from the sites on the North Umpqua River, and development is a long way in the future. Some water is .Pumped from the South Umpqua River to irrigate orchards, but the amount is not great. Water in tributaries is diverted and used for irrigation, reducing the summer flow at the gaging station at Brockway. But the Umpqua Valley is not sufficiently dry to become much of an irrigated section, and the proposed large reservoirs at Days Creek and Perdue probably will not be built :for irrigation alone.
FISK LAKE POWER SITE (li!RB 86)
Fish Creek, tributary to the South Umpqua River, heads in Fish Lake, in unsurveyed sec. 6, T. 29 s., R. 3 E. (See pl. 15 and profile of South Umpqua River.) Fish Lake has an area of 100 acres, and it is estimated that a 40-foot dam would furnish sufficient storage to regulate the discharge to a minimum of 15 second-feet (See Fish Lake reservoir site, p. 251.) Fish Creek has a fall, as determined by aneroid readings, of 1,264 feet in a distance of 4lh miles. It probably would be necessary to use a pressure pipe as a conduit in utilizing this head. The nearest point to this site on a. road is about 20 miles away. This is a fairly good small power site, but it will not be developed for many years because of its remote location.
310 CONTRmUTIONS TO HYDROLOGY OF UNITED STATES, 1929
8ummatr11 of potential fJOW8l" atl unde!Jelopetl rite 12RB 85
[Head, 1,264 feet]
Flow In second-teet Horsepower
90per cent of time
50 per cent of time
90per cent of time
50 per cent of time
---------------------------------1---------------------Natural flow ................................................•.. Regulated flow ............. ·-······················c·······-···
1.6 16
BLAOX BOOX POWEll SI'rE (la::aB 88)
10 16
1,010 1,620
The Black Rock site includes a stretch of the South Umpqua River 1:14 miles long, between the mouths of Fish Creek and Black Rock Creek. (See pl. 15.) The power would probably be developed by a conduit. The total head is 67 feet, and the estimated Q50 flow of 51 second-feet gives a potential power capacity of 278 horsepower. This is 218 horsepower to the mile for 50 per cent of the time without storage. With storage in Fish Lake the potential power for 50 per cent of the time would be 240 horsepower to the mile. So even under the best conditions this site is of little value.
8'11411111101f'1 of potential power at undet7eZopedl rite 1SRB 86
[H811d, tr1 teet]
Flow In second-feet Horsepower
Natural flow·······-·-···-··················-·-········-······· Regulated flow·······-··················-·-·-··················
90per cent of time
10 23
50 per cent of time
61 156
SOlJ''rB: lJ'KPQlJ'A FALLS POWE::a SI'rE (lll::aB 8'7)
90per cent of time
50 per cent of time
273 300
The South Umpqua Falls site embraces a 5-mile stretch of the South Umpqua River, extending from Black Rock Creek to a point below South Umpqua Falls. (See pl. 15.) The falls are only 18 feet in height. The total fall in the stretch of river is 347 feet, as determined by aneroid readings, and this head would be developed by a low diversion dam and conduit. There is a good dam site about a mile above the falls, with bedrock exposed in the center of the river and on both banks, but it would not be feasible to construct a dam to create head on a stream of so much slope and so little flow. The only storage would be that in the Fish Lake Reservoir; '
8'Uf1111114ry of potential power at un4eooloped site 1SRB 81
(H811d, 347 feet]
Flow In second-feet Horsepower
90per cent of time
50 per cent of time
DOper cent of time
50 per cent of time
--------------~-------------~---1--------------~=te~O:Ow-::::::::::::::::::::::::::::::::::::::::::::::::: 20
88 11K 109
11156 917
2,8110 8,.020
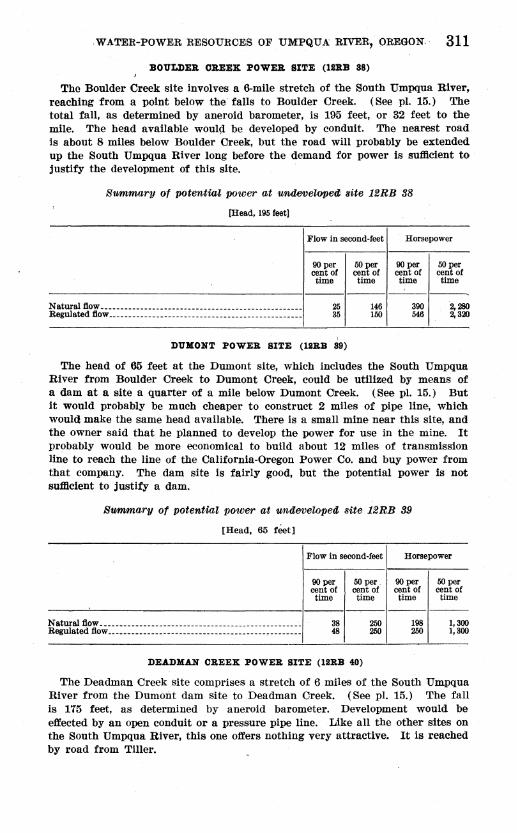
WATER-POWER RESOURCES OF UMPQUA RIVER, OREGON. 311
BOULDER OREEX POWER SITE (llli.B 88)
The Boulder Creek site involves a 6-mile stretch of the South Umpqua River, reaching from a point below the falls to Boulder Creek. (See pl. 15.) The total fall, as determined by aneroid barometer, is 195 feet, or 32 feet to the mile. The head available woulc;l be developed by conduit. The nearest road is about 8 miles below Boulder Creek, but the road will probably be extended up the South Umpqua River long before the demand for power is sufilcient to justify the development of this site.
Summary of potentia' power at undeveloped Bite 12RB 38
[Head, 19li feet]
Flow In second-feet Horsepower
90per cent of time
50 per cent of time
90per cent of time
50 per cent of time
------------------1'------------Natural flow •••..•••••••••..•••••........•.••••••......••.••.•• Regulated flow •..•••..•..•••.•...•.••.•........................
25 35
' DUKONT POWER BITE (llli.B 89)
146 150
390 546
2,280 2, 320
The head of 65 feet at the Dumont site, which includes the South Umpqua River from Boulder Creek to Dumont Creek, could be utilized by means of a dam at a site a quarter of a mile below Dumont Creek. (See pl. 15.) But it would probably be much cheaper to construct 2 miles of pipe line, which would make the same head available. There is a small mine near this site, and the owner said that he planned to develop the power for use in the mine. It probably would be more economical to build about 12 miles of transmission line to reach the line of the California-Oregon Power Co. and buy power from that company. The dam site is fairly good, but the potential power is not sufilclent to justify a dam.
8tw~~mary of potential power at undeveloped. site 12RB 99
[Head, 65 teet]
Flow In second-feet Horsepower
90per cent of time
50 per cent of time
90per cent of time
50 per cent of time
--~--------------1------1------------Natural flow---------------··----- ___________ ----- _____ -----·--Regulated flow------------------ ••• ------- ____________________ _
38 48
DEADKU OREEX POWER BITE (lll:aB 40)
250 250
198 250
1,300 1,300
The Deadman Creek site comprises a stretch of 6 miles of the South Umpqua River from the Dumont dam site to Deadman Creek. (See pl. 15.) The fall is 175 feet, as determined by aneroid barometer. Development would be effected by an open conduit or a pressure pipe line. Like all the other sites on the South Umpqua River, this one offers nothing very attractive. It is reached by road from Tiller.
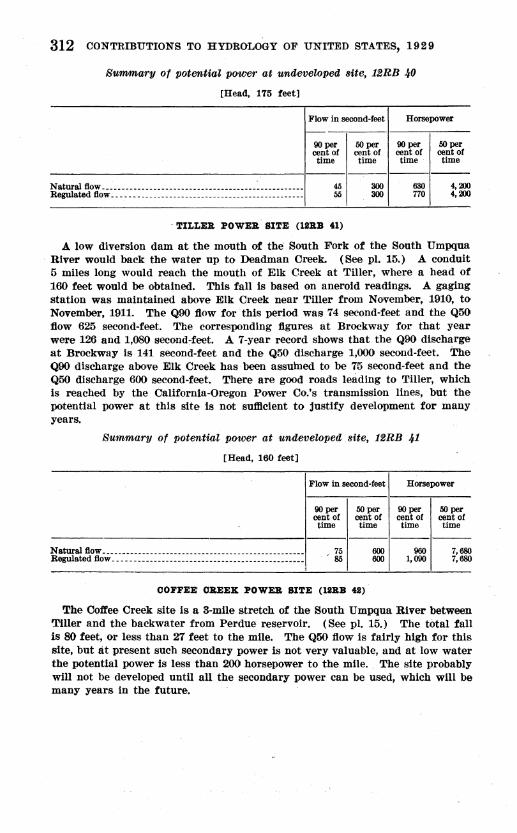
812 CONTRIBUTIONS TO HYDROLOGY OF UNITED STATES, 1929
8u'llllmary of potentiaZ power at undeveloped site, 12RB 40
[Head, 175 feet]
Flow In second-feet Horsepower
-----.------1------.------90per cent of time
50 per cent of time
90per cent of time
50 per cent of time
---------------..,-----1------------Natural flow .....••••.......•.........•........•.• -~-- ..••.•.•• Regulated flow •...... -----------------------------------------
45 55
· TILLER POWER SITE (lliRB 41)
300 300
630 770
4,200 4,200
A low diversion dam at the mouth of the South Fork of the South Uinpqua River would back the water up to Deadman Creek.. (See pl. 15.) A conduit 5 miles long would reach the mouth of Elk Creek at Tiller, where a head of 160 feet would be obtained. This fall is based on aneroid readings. A gaging station was maintained above Elk Creek near Tiller from November, 1910, to November, 1911. The Q90 flow for this period was 74 second-feet and the Q50 flow 625 second-feet. The corresponding figures at Brockway for that year were 126 and 1,080 second~feet. A 7-year record shows that the Q90 discharge at Brockway is 141 second-feet and the Q50 discharge 1,000 second-feet. The Q90 discharge above Elk Creek has been assumed to be 75 second-feet and the Q50 discharge 600 second-feet. There are good roads leading to Tiller, which is reached by the California-Oregon Power Co.'s transmission lines, but the potential power at this site is not sufllclent to justify development for many years.
Summary of potentiaZ power at undeveloped site, 1SRB 41
[Head, 160 feet]
Flow In second-feet Horsepower
90per cent of time
50 per cent of time
90per cent of time
50 per cent of time
--------------------1------------Natural flow .... ----------- ....••••••••.•••.....•••••.....••••• Regulated flow •••••.•••••••••• --~------ .•.•••••...•.•.••••••••
COFFEE OB.EElt POWEll SITE (lliB.B 48)
500 500
960 1,090
7,680 7,680
The Coffee Creek site is a 3-mile stretch of the South Umpqua River between Tiller and th.e backwater from Perdue reservoir. (See pL 15.) The. total fall is 80 feet, or less than 27 feet to the mile. The Q50 1low is fairly high for this site, but at present such secondary power is not very valuable, and at low water the potential power is less than 200 horsepower to the mile. The site probably will not be developed until all the secondary power can be used, which will be many years in the future.
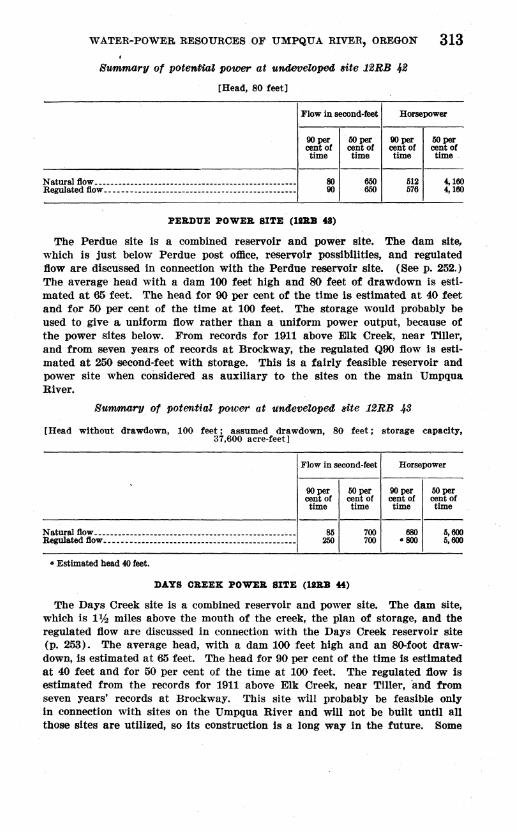
WATER-POWER RESOURCES OF UMPQUA RIVER, OREGON 313
Summary of potefbtiaZ power at u1Wf..ooeloped. site 1'2RB 4'2
[Head, 80 feet]
Flow in second-feet Horsepower
90per cent of time
50 per cent of time
90 per cent of time
50 per cent of time
----------------------------------------1------·l------------------Natural flow··············------------------------------------Regulated flow ....••• -----------------------------------------
80 90
PERDUE POWER SITE (lllllB 48)
650 650
512 576
4,150 4, 160
The Perdue site is a combined reservoir and power site. The dam site, which is just below Perdue post office, reservoir possibilities, and regulated flow are discussed in connection with the Perdue reservoir site. (See p. 252.) The average head with a dam 100 feet high and 80 feet of drawdown is estimated at 65 feet. The head for 90 per cent of the time is estimated at 40 feet and for 50 per cent of the time at 100 feet. The storage would probably be used to give a uniform flow rather than a uniform power output, because of the power sites below. From records for 1911 above Elk Creek, near Tiller, and from seven years of records at Brockway, the regulated Q90 flow is estimated at 250 second-feet with storage. This is a fairly feasible reservoir and power site when considered as auxiliary to the sites on the main Umpqua River.
Summary of potential power at undeveloped; site 1'2RB 43
[Head without drawdown, 100 feet; assumed drawdown, 80 feet; storage capacity, 37,600 acre-feet]
Flow in second-feet
90per cent of time
50 per cent of time
Horsepower
90per cent of time
50 per cent of time
-------------------1------------N aturalflow ------ _____ .• __ ------- ____________________________ _ Regulated flow._._ ••• ------- __ .. ___ .. _______ .. __ •. ___________ _
• Estimated head 40 feet.
85 250
DAYS OREEX POWER SITE (ll!RB t4)
700 700
680 • 800
5,600 5,600
The Days Creek site is a combined reservoir and power site. The dam site, which is 1% miles above the mouth of the creek, the plan of storage, and the regulated flow are discussed in connection with the Days Creek reservoir site (p. 253). The average head, with a dam 100 feet high and an 80-foot drawdown, is estimated at 65 feet. The head for 90 per cent of the time is estimated at 40 feet and for 50 per cent of the time at 100 feet. The regulated flow is estimated from the records for 1911 above Elk Creek, near Tiller, ·and from seven years' records at Brockway. This site will probably be feasible only in connection with sites on the Umpqua River and will not be built until all those sites are utilized, so its construction is a long way in the future. Some
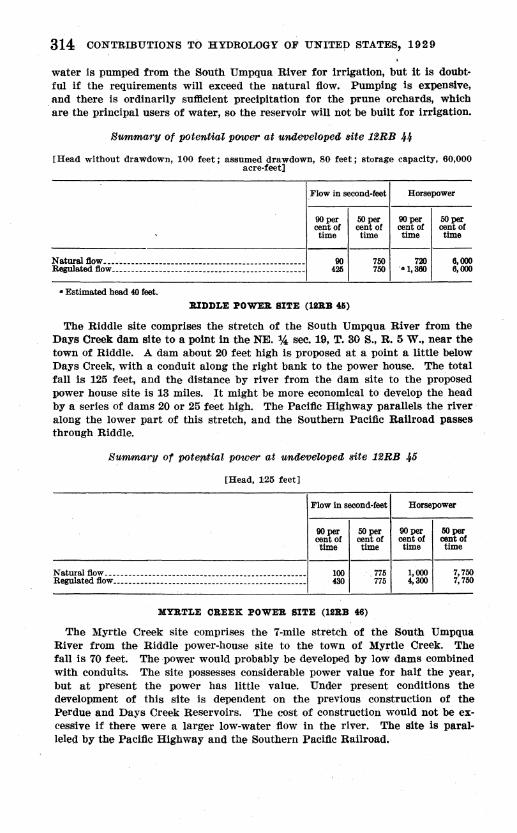
314 CONTRIBUTIONS TO HYDROLOGY OF UNITEP STATES, 1929
water is pumped from the South Umpqua River. for irrigation, but it is doubt· ful if the requirements will exceed the natural :flow. Pumping is expensive, and there is ordinarily sufficient precipitation for the prune orchards, which
·are the principal users of water, so the reservoir will not be built for irrigation.
Bummary of potentia~ power at undeveZopea site 12RB 44
[Head without drawdown, 100 feet; assumed drawdown, 80 feet; storage capacity, 60,000 acre-feet]
Flow in second-feet Horsepower
llOper cent of time
50 per cent of time
llOper cent of time
50 per cent of time
-------------------------------------------1---------l---------------N atural11ow __ • _ •. __ •••• _. ------.---------------.-•. -.-.--.-.-. Regulated flow •••••• --------·-··----------------·-·· •••••••••••
• Estimated head 40 feet.
llO 425
:B.IDDLE POWER SITE (lllltB 411)
750 nn 750 ··1,360
6,000 6,000
The Riddle site comprises the stretch of the South Umpqua River from the Days Creek dam site to a point in the NE.%, sec. 19, T. 30 S., R. 5 W., near the town of Riddle. A dam about 20 feet high is proposed at a point a little below Days Creek, with a conduit along the right bank to the power house. The total fall is 125 feet, and the distance by river from the dam site to the proposed power house site is 13 miles. It might be more economical to develop the head by a series of dams 20 or 25 feet high. The Pacific Highway parallels the river along the lower part of this stretch, and the Southern Pacific Railroad passes through Riddle.
B'Ufflm(J,ry of pote,.tiaZ power at tmdevewpea site 1ZRB 45
[Head, 125 feet]
Flow In second-feet
llOper cent of time
50 per cent of time
Horsepower
llOper cent of time
50 per cent of time
---------------------------------l------1---------------Natural flow--····-·····------·············-·········-·-··-·-·-Regulated flow····-·-·-·-·· ....... ··-······----- ...••..•.•.. __ _
100 430
XYB..TLE CREE:S:: POWE'll. SITE (lllB..B 48)
1,000 4,300
7,750 7,750
The Myrtle Creek site comprises the 7-mile stretch of the South Umpqua River from the Riddle power-house site to the town of Myrtle Creek. The fall is 70 feet. The power would probably be developed by low dams combined with conduits. The site possesses considerable power value for half the year, but at present the power has little value. Under present conditions the development of this site is dependent on the previous construction of the Perdue and Days Creek Reservoirs. The cost of construction would not be excessive if there were a larger low-water fiow in the river. The site is paralleled by the Pacific Highway and the Southern Pacific Railroad.
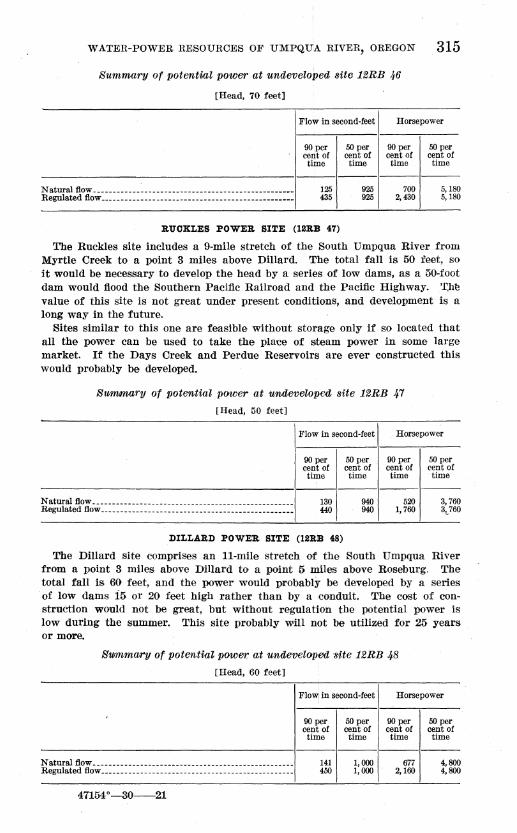
WATER-POWER RESOURCES OF UMPQUA RIVER, OREGON 315
Surnmary of potential power at undeveloped site 12RB 46
[Head, 70 feet]
Flow in second-feet Horsepower
90 per cent of time
50 per cent of time
90 per cent of time
50 per cent of time
--------------------1------------Natural flow ________________________________________ -----------Regulated flow __________________________________________ ------- 125
435
RUCKLES POWER SITE (12RB 47)
925 925
700 2, 430
5,180 5,180
The Ruckles site includes a 9-mile stretch of the South Umpqua River from Myrtle Creek to a point 3 miles above Dillard. T'he total fall is 50 feet, so it would be necessary to develop the head by a series of low dams, as a 50-foot dam would flood the Southern Pacific Railroad and the Pacific Highway. '~htl
value of this site is not great under present conditions, and development is a long way in the future.
Sites similar to tllis one are feasible without storage only if so located that all the power can be used to take the place of steam power in some large market. If the Days Creek and Perdue Reservoirs are ever constructed this would probably be developed.
Summary of potential power at undevelop-ed site 12RB 47
[Head, 50 feet]
Flow in second-feet Horsepower
90 per cent of time
50 per cent of time
90 per cent of time
50 per cent of time
---------------------------------l------1--------------Natural flow __________________________________________________ _ Regulated flow _________________________________________ -------- 130
440
DILLARD POWER SITE (12RB 48)
940 940
520 1, 760
The Dillard site comprises an 11-mile stretch of the South Umpqua River from a point 3 miles above Dillard to a point 5 miles above Roseburg. The total fall is 60 feet, and the power would probably be developed by a series of low dams i5 or 20 feet high rather than by a conduit. The cost of construction would not be great, but without regulation the potential power is low during the summer. This site probably will not be utilized for 25 years or more.
Swrnrnary of potential power: at undeveloped site 12RB 48
[Head, 60 feet]
FloW! in second-feet Horsepower
90 per cent of time
50 per cent of time
90 per cent of time
50 per cent of time
--------------------1------------Nat ural flow _________________________________________________ __ Regulated flow ________________________________________________ _
47154°-30---21
141 450
1,000 1,000
677 2,160
4,800 4,800
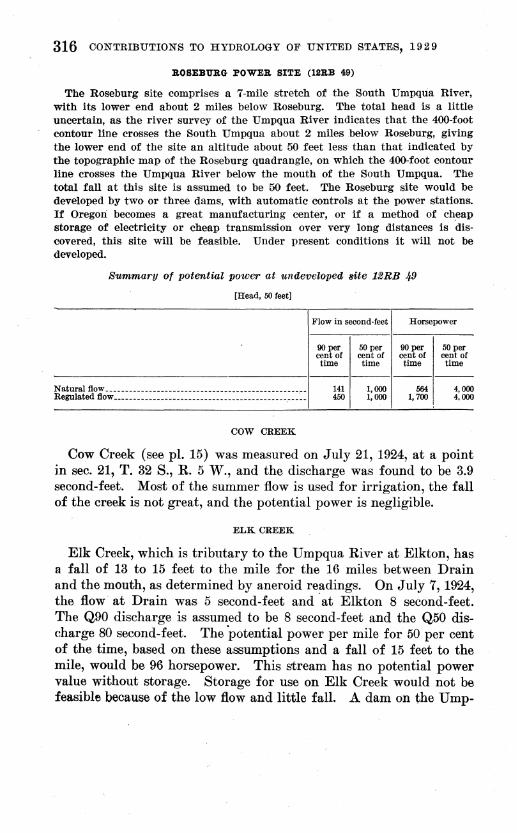
316 CONTRIBUTIONS TO HYDROLOGY OF UNITED STATES, 1929
ROSEBURG POWER SITE (li!RB 49)
The Roseburg site comprises a 7-mile stretch of the South Umpqua River, with its lower end about 2 miles below Roseburg. The total head is a little uncertain, as the river survey of the Umpqua River indicates that the 400-foot contour line crosses the South Umpqua about 2 miles below Roseburg, giving the lower end of the site an altitude about 50 feet less than that indicated by the topographic map of the Roseburg quadrangle, on which the 400-foot contour line crosses the Umpqua River below the mouth of the South Umpqua. The total fall at this site is assumed to be 50 feet. The Roseburg site would be developed by two or three dams, with automatic controls at the power stations. If Oregori becomes a great manufacturing center, or if a method of cheap storage of electricity or cheap transmission over very long distances is discovered, this site will be feasible. Under present conditions it will not be developed.
8"Ummary of potential power at undeveloped site 12RB 49
[Head, 50 feet]
Flow in second-feet Horsepower
OOper cent of time
50 per cent of time
OOper cent of time
50 per cent of time
-------------------1---1---------Natural flow---------- __ -------------------- _____ ----- ________ _ Regulated flow ________________________________________________ ~-
COW CREEK
141 450
1,000 1,000
664 1, 700
4,000 4,000
Cow Creek (see pl. 15) was measured on July 21, 1924, at a point in sec. 21, T. 32 S., R. 5 W., and the discharge was found to be 3.9 second-feet. Most of the summer flow is used for irrigation, the fall of the creek is not great, and the potential power is negligible.
ELK CREEK
Elk Creek, which is tributary to the Umpqua River at Elkton, has a fall of 13 to 15 feet to the mile for the 16 miles between Drain and the mouth, as determined by aneroid readings. On July 7, 1924, the flow at Drain was 5 second-feet and -at Elkton 8 second-feet. The Q90 discharge is assumed to be 8 second-feet and the Q50 discharge 80 second-feet. The ·potential power per mile for 50 per cent of the time, based on these assumptions and a fall of 15 feet to the mile, would be 96 horsepower. This stream has no potential power value without storage. Storage for use on Elk Creek would not be feasible because of the low flow and little fall. .A dam on the Ump-
WATER-POWER, RESOURCES OF UMPQUA RIVER, OREGON 317
qua River to raise the water to an altitude of 100 feet would back water up Elk Creek for a distance of 4 miles. Above this point the stream has little value for power.
MISCELLANEOUS SITES
LOON LAKE POWER SITE (12RB 50)
The Loon Lake project involves the construction of a dam 80 feet high and storage at the Loon Lake reservoir site of 100,000 acre-feet, which is sufficient to equalize the ordinary annual flow. A pressure conduit 1% miles long, inclu-ding a short tunnel, would lead to the power house in the NE. % SW. :14 sec. 35, T. 22 S., R. 10 W., where a mean head of about 360 feet would be obtained. The stream flow and storage possibilities at this site are discussed in connection with the Loon Lake and Lake Creek reservoir sites (p. 254). The minimum regulated flow in the five years for which the records are available would have been 263 second-feet. One of the principal costs of this project would be the lands at the reservoir site. An alternative plan would be the construction of the Lake Creek reservoir at a point farther up the creek, where land values are lower. Under this plan Loon Lake would be used as a small regulating reservoir and would be drawn down about 5 feet to increase the storage capacity. With 45·,000 acre-feet of storage in the Lake Creek reservoir, a Q90 flow of 150 second-feet could be obtained at Loon Lake. If it is economically feasible to build a higher dam at the Lake Creek site to increase the storage capacity to 75,000 acre-feet the Q90 flow can be increased to 220 second-feet.
The Loon Lake dam site is on the crest of a great landslide that dammed Mill Creek, forming Loon Lake. The place of origin of the slide is a reentrant in a cliff about three-quarters of a mile west of the site. The slide at the creek is about half a mile wide and is covered with a dense growth of ferns -and pines. Blocks of sandstone, some of which are 50 feet in diameter, are visible through the vegetation. Great pine trees growing on the slide indicate that it originated more than 200 years ago, and consequently the materials have had plenty of time to settle. Thus there is little danger of the slide belug washed out during flood periods. The absence of springs on the downstream end indicates that it is fairly impermeable. Furthermore, driftwood along the shore shows that the slide holds when the lake is 10 feet higher than it was at the time of visit.
The east abutment consists of loose blocks of sandstone near the creek, and sandstone crops out a few feet up the bank. It is believed that an SO-foot rockfill dam would be successful, so far as leakage is concerned, although the engineering problem of providing a sp.itable core properly anchored in the slide will be the chief difficulty. The huge sandstone blocks in the slide, however, will help to solve this problem. Loon Lake occupies a narrow v:shaped valley underlain by Tertiary shale and sandstone, and there should be practically no leakage through these rocks.
The following table shows the potential power at this site in connection with the Loon Lake and Lake Creek Reservoirs.
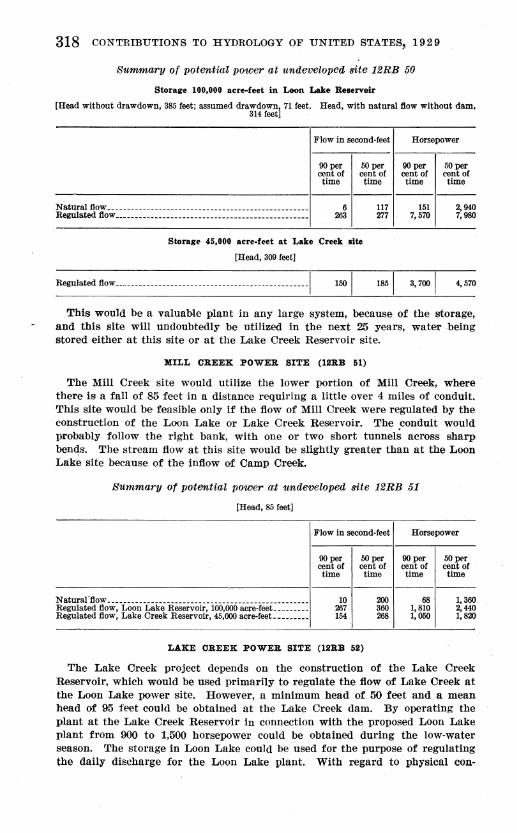
318 CONTRIBUTIONS TO HYDROLOGY OF UNITED STATES, 1929
Summary of potential power at undeveloped site 12RB 50
Stora&"e 100,000 aere-feet in Loon Lake Reservoir
[Head without drawdown, 385 feet; assumed drawdownj 71 feet. Head, with natural flow without dam, 314 feet
Flow in second-feet
90per cent of time
50 per cent of time
Horsepower
90per cent of time
50 per cent of time
---------------------11-------------Natural flow ___________ ----------------------------------------Regulated flow ___ -------------- _______ -------------------------
6 263
Stora&"e 45,000 aere-feet at Lake Creek aite
[Head, 309 feet]
Regulated flow ________________________________________________ -I
117 m
151 7,570
2,040 7,980
4,570
This would be a valuable plant in any large system, because of the storage, and this site will undoubtedly be utilized in the next 25 years, water -being stored either at this site or at the Lake Creek Reservoir site.
MILL CREEK POWER BITE (12RB 51)
The Mill Creek site would utilize the lower portion of Mill Creek, where there is a fall of 85 feet in a distance requiring a little over 4 miles of conduit. This site would be feasible only if the flow of Mill Creek were regulated by the construction of the Loon Lake or Lake Creek Reservoir. The C{)nduit would probably follow the right bank, with one or two short tunnels across sharp ben~s. The stream flow at this site would be slightly greater than at the Loon Lake site because of the inflow of Camp Creek.
Summary of potential power a.t undeooloped site 12RB 51
[Head, 85 feet]
Flow In second-feet Horsepower
90per 50 per 90per 50 per cent of cent of cent of cent of time time time time
---------Natural-flow ___ ----- ____________________________________ ------- 10 200 68 1,360 Regulated flow, Loon Lake Reservoir, 100,000 acre-feet _________ 267 360 1,810 2,440 Regulated I! ow, Lake Creek Reservoir, 45,000 acre-feet. ________ 154 268 1,050 1,820
LAKE CREEK POWER BITE {12RB 52)
The Lake Creek project depends on the construction of the Lake Creek Reservoir, which would be used primarily to regulate the flow of Lake Creek at the Loon Lake power site. However, a minimum head of 50 feet and a mean head of 95 feet could be obtained at the Lake Creek dam. By operating the plant at the Lake Creek Reservoir in connection with the proposed Loon Lake plant from 900 to 1,500 horsepower could be obtained during the low-water season. The storage in Loon Lake could be used for the purpose of regulating the daily discharge for the Loon Lake plant. With regard to physical con-
WATER-POWER RESOURCES OF UMPQUA RIVER, OREGON 319
ditions alone, the Loon Lake reservoir and power project is preferable to a combination of the Loon Lake and Lake Creek sites. But the complications involved in flooding a large area of agricultural land may be prohibitive, whereas the J_,ake Creek site contains no buildings of any kind, and the only damage would be to timber; so, as a practical power project, a combination of the Lake Creek and Loon Lake sites may be most feasible.
The Lake Creek site was not examined by a geologist. The rock at the dam site is sandstone, which is exposed in the bed of the stream and on both banks. It is exposed on the left abutment to a height of about 75 feet and on the right abutment to a height of possibly 50 feet. There is a ridge extending down to the dght abutment, with a small stream just below it. At the dam site the ridge is narrow at the top but gradually increases in width back from the stream. The ridge is sufficiently wide to serve as a base for an earth-fill dam 25 feet high if a dam higher than 125 feet were desired in the stream itself.
Potential power at site 12RB 52
[Head without drawdown, 127 feet; assumed drawdown, 75 feet; storage capacity, 45,000 acre-feet]
Flow in second-feet
90 per cent of time
50 per cent of time
Horsepower
90per cent of time
50 per cent of time
------------------1----------. --Natural tlow---------------------------------------------------Regulated flow ________________________________________________ _ 3
124 58
162 30
894 590
1,460
The survey at this dam site was carried to a height of 125 feet above· the water surface, which gives a storage capacity of 45,000 acte-feet. Adding 25 feet to the height of the dam would necessitate a dike about 1,000 to 1,500 feet long and 25 feet high, but it would add 30,000 acre-feet to the storage capacity and 1,730 horsepower to the power available at Loo.(l Lake. It therefore seems probable that the extra height would be justified.
MARKET
There is only a small market for power at present in the basin of the Umpqua River. Transmission lines, however, are already built north to Portland and south to San Francisco, and power can be transmitted from the Rogue River to both places, so the time of development of the Umpqua River sites depends on the rate of growth of the market for power in Oregon and California, and the relative cost of developing the water-power sites in the Umpqua River Basin compared with the cost of sites nearer those markets. Between 1920 and 1926 the production of electricity by public-utility plants in California and Oregon increased from 4,212,000,000 to 7,729,000,000 kilowatt-hours, an increase of 88 per cent in 6 years. At the end of 1926 the installed capacity of water-power plants in California was 1,917,000 horsepower and in Oregon 242,000 horsepower. From 1921 to 1926 the capacity of developed power plants in California increased 768,000 horsepower. The water-power re-
I
320 CONTRIBUTIONS TO HYDROLOGY OF UNITED STATES, 19 2 9
sources of California are estimated at 4,603,000 horsepower for 90 per cent of the time and 6,67 4,000 horsepower for 50 per cent of the time. The corresponding figures for Oregon are 3,665,000 and 6,715,000 horsepower. Thus California has only 25 per cent more potential power at low water and no more potential power for 50 per cent of the time, and yet the installed capacity of its water-power plants is eight times that of plants in Oregon.
The figures show that a large amount of undeveloped power is still available in California but that most of the cheaper and more easily developed sites have undoubtedly been utilized. In Oregon so far there has been comparatively little development, and there are many sites which can be developed at a low cost. As California uses about eight times as much power as Oregon and has already utilized about eight times as much of its resources, it is probable that the cost of new plants in California will soon exceed the cost of development in Oregon plus the added cost of transmission. The most accessible rivers in Oregon to the California markets are the Klamath, the Rogue, and the Umpqua. The Klamath River in Oregon will soon be completely developed, and most of its power goes to California. The Rogue River would probably supply the market for Oregon power in California for several years, but as the sites on the Umpqua River are somewhat cheaper to develop than most of those on the Rogue River, it is probable that some of the power on the Umpqua River will be "required within 10 years and that in the not very distant future there will be a market sufficient to absorb all the cheaper power on the North Umpqua River that can be developed at sites above. Winchester. In time there will be a market in Oregon and California for practically all the power available on the North Umpqua and Umpqua Rivers.
In addition to the California market there is a growing demand for power in southwestern Oregon which is now supplied by plants on the Klamath, Rogue and Umpqua Rivers. Very possibly some power will be required to the north, in EUgene, Salem, Albany, and Portland.
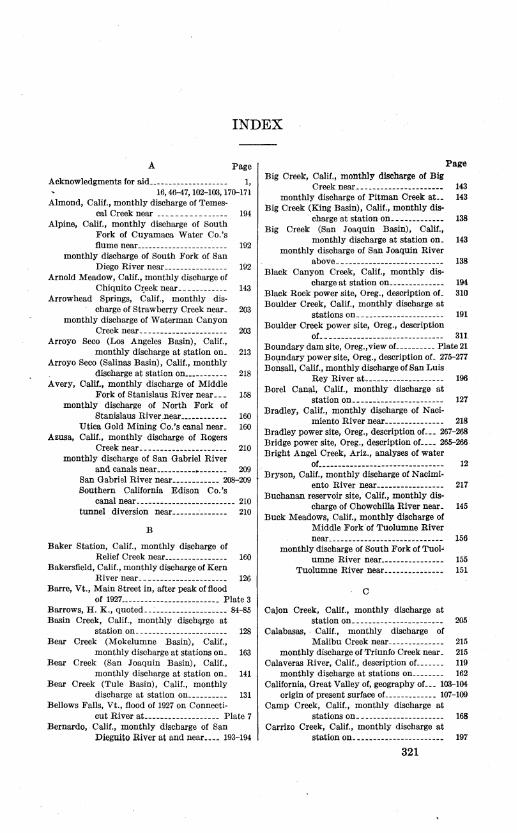
INDEX
A Page
Acknowledgments for aid_____________________ 1, 16, 46-47,102-11X1,17Q-171
Almond, Calif., monthly discharge of Tames-cal Creek near ---------------- 194
Alpine, Calif., monthly discharge of South Fork of Cuyamaca Water Co.'s flume near_______________________ 192
monthly discharge of South Fork of San Diego River near________________ 192
Arnold Meadow, Calif., monthly discharge of Chiquito C~eek near____________ 143
Arrowhead Springs, Calif., monthly discharge of Strawberry Creek near_ 203
monthly discharge of Waterman Canyon Creek near __ -------------------- 203
Arroyo Seco (Los Angeles Basin), Calif., monthly discharge at station on_. 213
Arroyo Seco (Salinas Basin), Calif., monthly discharge at station on___________ 218
A very, Calif., monthly discharge of Middle Fork of Stauislans River near___ 158
monthly discharge of North Fork of Stanislaus RiverJlear____________ 160
Utica Gold Mining Co.'s canal near_ 160 Azusa, Calif., monthly discharge of Rogers
Creek near __ -------------------- 210 monthly discharge of San Gabriel River
and canals near----------•------- 209 San Gabriel River near ____________ 208-209 Southern California Edison Co.'s
canal near _________________________ 210
tunnel diversion near______________ 210
B
Baker Station, Calif., monthly discharge of Relief Creek near________________ 160
Bakersfield, Calif., monthly discharge of Kern River near______________________ 126
Barre, Vt., Main Street in, after peak of flood of 1927------------------------- Plate 3
Barrows, H. K., quoted--------------------- 84-85 Basin Creek, Calif., monthly disch!jl"ge at
station on __ --------------------- 128 Bear Creek (Mokelumne Basin), Calif.,
monthly discharge at stations on_ 163 Bear Creek (San Joaquin Basin), Calif.,
monthly discharge at station on_ 141 Bear Creek (Tule Basin), Calif., monthly
discharge at station on__________ 131 Bellows Falls, Vt., flood of 1927 on Connecti-
cut River at------------------- Plate 7 Bernardo, Calif., monthly discharge of San
Dlegjuto River at and near ____ 193-194
Page Big Creek, Calif., monthly discharge of Big
Creek near ___ ------------------- 143 monthly discharge of Pitman Creek at__ 143
Big Creek (King Basin), Calif., monthly discharge at station on_____________ 138
Big Creek (San Joaquin Baain), Calif., monthly discharge at station on_ 143
monthly discharge of San Joaquin River above __ ------------------------- 138
Black Canyon Creek, Calif., monthly discharge at station on______________ 194
Black Rock power site, Oreg., description oL 310 Boulder Creek, Calif., monthly discharge at
stations on_-------------------·-- 191 Boulder Creek power site, Oreg., description
oL _ ----------------------------- 311 Boundary dam site, Oreg.,view of __________ Plate 21
Boundary power site, Oreg., description oL 275-277 Bonsall, Calif., monthly discharge of San Luis
Rey River at-------------------- 196 Borel Canal, Calif., monthly discharge at
station on __ --------------------- 127 Bradley, Calif., monthly discharge of Naci-
miento River near--------------- 218 Bradley power site, Oreg., description oL -· 267-268 Bridge power site, Oreg., description of ____ 265-266 Bright Angel Creek, Ariz., analyses of water
or_ ___________ --- _____ ----------__ 12
Bryson, Calif., monthly discharge of Nacimi-ento River near----------------- 217
Buchanan reservoir site, Calif., monthly discharge of Chowchilla River near_ 145
Buck Meadows, Calif., monthly discharge of Middle Fork.of Tuolumne River near __ --------------------------- 156
monthly discharge of South Fork of Tuol• umne River near________________ 155
Tuolumne River near--------------- 151
c Cajon Creek, Calif., monthly discharge at
station on_______________________ 205 Calabasas, . Calif., monthly dischllrge of
Malibu Creek near-------------- 215 monthly discharge of Triunfo Creek near_ 215
Calaveras River, Calif., description ot_______ 119 monthly discharge at stations on________ 162
California, Great Valley of, geography or_ __ 103-104 origin of present surface of_ ____________ 107-109
Camp Creek, Calif., monthly discharge at stations on______________________ 168
Carrizo Creek, Calif., monthly discharge at station on_---------------------- 197
321
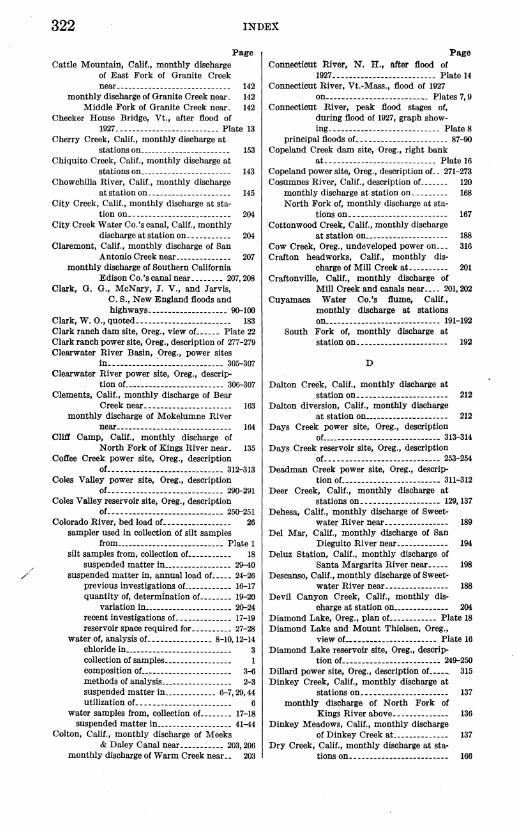
322 INDEX
Cattle Mountain, Calif., monthly discharge of East Fork of Granite Creek
Page
near_____________________________ 142
monthly discharge of Granite Creek near_ 142 Middle Fork of Granite Creek near_ 142
Checker House Bridge, Vt., after flood of 1927-------------------------- Plate 13
Cherry Creek, Calif., monthly discharge at stations on_______________________ 153
Chiquito Creek, Calif., monthly discharge at stations on_______________________ 143
Chowchilla River, Calif., monthly discharge at station on_____________________ 145
City Creek, Calif., monthly discharge at sta-tion ou__________________________ 204
City Creek Water Co.'s canal, Calif., monthly discharge at station on .. _________ 204
Claremont, Calif., monthly discharge of San Antonio Creek near______________ 207
monthly discharge of Southern California Edison Co.'s canal near ________ 207, 208
Clark, G. G., McNary, J. V., and Jarvis, C. S., New England floods and highways ____________________ 90-100
Clark, W. 0., quoted________________________ 183
Clark ranch dam site, Oreg., view of. _____ Plate 22
Clark ranch power site, Oreg., description of 277-279 Clearwater River Basin, Oreg., power sites
in._------- ___ : ________________ 305-307
Clearwater River power site, Oreg., descrip-tion oL _______________________ 306-307
Clements, Calif., monthly discharge of Bear Creek near_.____________________ 163
monthly discharge of Mokelumne River near ___ ----- _____ .. ______________ 164
Cliff Camp, Calif., monthly discharge of North Fork of Kings River near_ 135
Coffee Creek power site, Oreg., description oL _. _ ------------- _________ . __ 312-313
Coles Valley power site, Oreg., description oL .. ---- ______ -- _____________ . 29Q-291
Coles Valley reservoir site, Oreg., description oL .... ---------------------- .. 25Q-251
Colorado River, bed load of_________________ 26
sampler used in collection of silt samples from ___________________________ Plate 1
silt samples from, collection of.__________ 18 suspended matter in _________________ 29-40
suspended matter in, annual load of. ____ 24-26 previous investigations oL __________ 16-17 quantity of, determination of. _______ 19-20
variation in ______________________ 2Q-24
recent investigations oL _____________ 17-19
reservoir space required for_--------- 27-28 water of, analysis of_ _______________ 8-10,12-14
chloride in___________________________ 3 collection of samples ________________ _ composition of_______________________ 3-6 methods of analysis__________________ 2-3 suspended matter in _____________ 6-7,29,44 utilization oL_______________________ 6
water samples from, collection of. _______ 17-18 suspended matter in ___________________ 41-44
Colton, Calif., monthly discharge of Meeks & Daley Canal near------~---- 203,206
monthly discharge of Warm Creek near.. 200
Page Connecticut River, N. H., after flood of
1927 •... ---------------------- Plate 14 Connecticut River, Vt.-Mass., flood of 1927
on. _________________________ Plates 7, 9
Connecticut River, peak flood stages of, during flood of 1927, graph show-ing ____________________________ Plate 8
principal floods oL.--------------------- 87-90 Copeland Creek dam site, Oreg., right bank
at---------------------------- Plate 16 Copeland power site, Oreg., description of._ 271-273 Cosumnes River, Calif., description of.______ 120
monthly discharge at station on_________ 168
North Fork of, monthly discharge at sta-tions on.------------------------ 167
Cottonwood Creek, Calif., monthly discharge at station on_____________________ 188
Cow Creek, Oreg., undeveloped power on_.. 316 Crafton headworks, Calif., monthly dis
charge of Mill Creek at._________ 201
Craftonville, Calif., monthly discharge of Mill Creek and canals near_ ___ 201,202
Cuyamaca Water Co.'s flume, Calif., monthly discharge at stations on ___ . __ .. ___ ...... -----.--____ 191-192
South Fork of, monthly discharge at station on_______________________ 192
D
Dalton Creek, Calif., monthly discharge at station on._. __ .. __ ..... __ . ___ ._. 212
Dalton diversion, Calif., monthly discharge at station on ... ------------------ 212
Days Creek power site, Oreg., description oL ............ __ .. ___ --------- 313-314
Days Creek reservoir site, Oreg., description oL _. __ . ___ .. ______ ...... __ .. __ 253-254
Deadman Creek power site, Oreg., descrip-tion of _________________________ 311-312
Deer Creek, Calif., monthly discharge at stations on ____________________ 129,137
Dehesa, Calif., monthly discharge of Sweetwater River near________________ 189
Del Mar, Calif., monthly discharge of San Dieguito River near------------- 194
Deluz Station, Calif., monthly discharge of Santa Margarita River near..... 198
Descanso, Calif., monthly discharge of Sweetwater River near________________ 188
Devil Canyon Creek, Calif., monthly discharge at station on______________ 204
Diamond Lake, Oreg., plan of. ........... Plate 18 Diamond Lake and Mount Thielsen, Oreg.,
view of. ______________________ Plate 16
Diamond Lake reservoir site, Oreg., descrip-tion oL _______________________ 249-250
Dillard power site, Oreg., description oL___ 315 Dinkey Creek, Calif., monthly discharge at
stations on______________________ 137
monthly discharge of North Fork of Kings River above______________ 136
Dinkey Meadows, Calif., monthly discharge of Dinkey Creek at______________ 137
Dry Creek, Calif., monthly discharge at sta-tions on......................... 166
INDEX 323
Page Duarte, Calif., monthly discharge of Fish
Creek near______________________ 211 Dulzura, Calif., monthly discharge of Cotton-
. wood Creek near________________ 188 monthly discharge of Dulzura conduit
near-----------------------______ 188 Pine Valley Creek near______________ 188
Dulzura conduit, Calif., monthly discharge at station on_____________________ 188
Dumont power site, Oreg., description of____ 311
E
East Fork, Calif., monthly discharge of Deer Creek below_____________________ 137
East Highlands, Calif., monthly discharge of Plunge Creek near_______________ 202
East San Pasqua! ditch, Calif., monthly discharge at station on______________ 194
Eaton Creek, Calif., monthly discharge at station on_______________________ 214
El Dorado, Calif., monthly discharge of North Fork of Cosumnes River near--"-------------------------- 167
Eleanor Creek, Calif., monthly discharge at stations on______________________ 154
Eleanor Trail Crossing, Calif., monthly discharge of Cherry Creek at_______ 153
monthly discharge.' of Eleanor Creek at.. 154 Electra, Calif., monthly discharge of Mo
kelumne River at________________ 163 Elk Creek, Oreg., undeveloped power on __ 316-317 Elsinore, Calif., monthly discharge of San
Jacinto River near·-------c------ 206 monthly discharge of Temescal Creek
·near_____________________________ 207 Temescal Water Co.'s diversion near_ 206
Enosburg Falls, Vt., highway bridge dam-aged by flood of 1927 at ________ Plate 4
Erskine Creek, Calif., monthly discharge at station on_______________________ 128
Escondido, Calif., monthly discharge of East San Pasqua! ditch near__________ 194
monthly discharge of Guejito Creek near_ 194 Santa Ysabel Creek near____________ 193 West San Pasqua! ditch near________ 195
Escondido Mutual Water Co.'s canal, ·calif., monthly discharge at station on_ 197
Exchequer, Calif., monthly discharge of Merced River at----------------- 147
F
Fallbrook, Calif., monthly discharge of Santa Margarita River near____________ 198
Falls Creek, Calif., monthly discharge at sta-tion ~n-------------------------- 153
Farmington, Calif., monthly discharge of South Channel of Littlejohns Creek at_________________________ 163
Fillmore, Calif,. monthly discharge of Santa Clara River at___________________ 215
Fish Creek, Calif., monthly discharge at station on_______________________ 211
Fish Creek' Basin, Oreg., power sites in---- 305,307 Fish Creek power site, Oreg., description of._ 307 Fish Lake power site, Oreg., description of. 309-310
Page
Fish Lake Reservoir site, Oreg., description of ___________________ -------- ___ 251-252
Floods in New England, probability of recur-rence of _________________________ 99-100
Fontana, Calif., monthly discharge of Fon-tana pipe line near_______________ 205
monthly discharge of Lytle Creek near___ 205 Fontana pipe line, Calif., monthly discharge
at station on_____________________ 205 Forest Home, Calif., monthly discharge of
Mill Creek at and near__________ 201 Foster, Caiif., monthly discharge of San
Vicente Creek at________________ 192
Fresno Flume & Lumber Co.'s upper and lower flumes, Calif., monthly discharge at stations on_____________ 144
Fresno River, Calif., description of__________ 117 monthly discharge at station of ________ 144-145
Friant, Calif., monthly.discharge of San Joa-quin River near_________________ 139
Fullers Meadow, Calif., monthly discharge of Jackass Creek near ________ ,_____ 143
monthly discharge of West Fork of Jackass Creek near______________________ 143
G
Galt, Calif., monthly discharge of Dry Creek near.---------------------------- 166
Gila River, Ariz., water of, analyses of_______ 12 Glendora, Calif., monthly discharge of Dalton
Creek near __ -------------------- 212 monthly discharge of Dalton diversion
near----------------------------- 212 Glide dam site, Oreg., view of. ___________ Plate 22 Glide power site, Oreg., description of. ____ 281-284 Golden Rock ditch, Calif., monthly discharge
at station on_____________________ 155
Gorham, N.H., efiects of flood of .1927 at_ __ Plate 7 Grand Canyon, Ariz., suspended matter in
Colorado River near _______ 29-35,41-42
Granite Creek, East Fork of, Calif., monthly discharge at station on___________ 142
Middle Fork of, monthly discharge at station on_______________________ 142
·monthly discharge at station on_________ 142 West Fork of, monthly discharge at sta-
tion on__________________________ 142
Greenspot pipe line, Calif., monthly discharge at station on_____________________ 200
Grunsky, c. E. quoted-----~---------------- 113 Guejito Creek, Calif., monthly discharge at
station on_______________________ 194
H
Haines Creek, Calif., monthly discharge at stations on._-------------------- 213
Haverhill, N.H., flood of 1927 near _______ Plate 12 Havilah, Calif., monthly discharge of Basin
Creek near______________________ 128
Helm Creek, Calif., monthly discharge at station on_______________________ 136
Hernandez, Calif., monthly· discharge of McCoy Creek near______________ 219
monthly discharge of San Benito River at. 219 Herndon, Calif., monthly discharge of San
Joaquin River at---------------- 139
324 INDEX
Page Hetch Hetchy, Calif., monthly discharge of
Cherry Creek near______________ 153 monthly discharge of Eleanor Creek near. 154
Falls Creek near_____________________ 153
Tuolumne River·near --------------- 150 Highland, Calif., monthly discharge of City
Creek near______________________ 204 monthly discharge of City {)reek Water
Co.'s canal near_________________ 204 Hoffman Meadows, Calif., monthly discharge
of South Fork of San Joaquin River near----------------------- 138
Holyoke, Mass., 11ood of 1927 passing over Holyoke Dam at_ _____________ Plate 9
Horseshoe Bend, Calif., monthly discharge of Merced River at_________________ 146
Horseshoe Bend dam site, Oreg., view ot__ Plate 23 Horseshoe Bend power site, Oreg.; description
of _____________ ~________________ 284-286
Hot Springs, Calif., monthly discharge of Deer Creek at___________________ 129
monthly discharge of Tyler Creek near__ 129 White River near____________________ 129
Howard, C. S., analyses by ___________ 3,8-14,29--44 Quality of water of the Colorado River in
1926-1928_- ---------------------- 1-14 Suspended matter in the Colorado River
in 192&-1928 ______________________ 15-44 Hume, Calif., monthly discharge of Kings
River near_______________________ 134
I
IDilouette Creek, Calif., monthly diischarge at station on_____________________ 148
Ione, Calif., monthly discharge of Dry Creek near ___ -------------------------- 166
Iron Creek, Calif., monthly discharge at station on----------------------- 141
monthly discharge of North Fork of San Joaquin River below------------ 141
Isabella, Calif., monthly discharge of Erskine Creek near______________________ 128
monthly discharge of Kern River at______ 125
J
Jackass Creek, Calif., monthly discharge at stations on ____________________ 142-143
West Fork of, monthly discharge at sta-tion on__________________________ 143
Jackass Meadow, Calif., monthly discharge of Jackass Creek near____________ 142
Jacksonville, Calif., monthly discharge of Tuolumne River near___________ 151
monthly discharge of Woods Creek near_ 156 Jarvis, C. S., with Clark, G. G. and McNary,
J. V., New England 11oods and highways _______________________ 90-100
Jenny Lind, Calif., monthly discharge of Calaveras River at______________ 162
Jolon, Calif., monthly discharge of San Antonio River near______________ 218
Jones, B. E., and Stearns, H. T., Waterpower resources of the Umpqua River and its tributaries, Oregon_ 221-
320 JUlian, Calif., monthly discharge of BoUlder
Creek near---------------------- 191
K Page
Kaweah, Calif., monthly discharge of North Fork of Kaweah River at________ 133
Kaweah River, Calif., description of ____ ~---- 116 monthly discharge at station on_________ 132 North Fork of, monthly discharge at
station on_______________________ 133 South Fork of, monthly discharge at
station on_______________________ 133 Keenbrook, Calif., monthly discharge of
Cajon Creek near________________ 205 monthly discharge of Lone Pine Creek
near _____ ------------------------ 206 Kelley's Smith Ferry dam site, Oreg., bed of
stream at _____________________ Plate 25
Kelley's Smith Ferry power site, Oreg., de-scription oL __________________ 294-297
Kellogg dam site, Oreg., view of __________ Plate 24 Kellogg power site, Oreg., description oL 292-294 Kelsay power site, Oreg., description of______ 263 Kelsay Valley reservoir site, Oreg., descrip-
tion of _________________________ ~260
Kern and TUlare Lake Basins, Calif., description of____________________ 112
Kern River, Calif., description of __________ 114-116 monthly discharge at stations on ______ 125-127 South Fork of, monthly discharge at
station on----------------------- 128 Kern River No. 3 Canal, Calif., monthly
discharge at station on___________ 127 Kern River Power Co.'s canal, Calif.,
monthly discharge at station on__ 127 Kernville, Calif., monthly discharge of Kern
River at and near ______________ 125,127 monthly discharge of Kern River Power
Co.'s canals at___________________ 127
Salmon Creek near------------------ 127 Kings City, Calif., monthly discharge of San
Lorenzo Creek near______________ 218 Kings River, Calif., description of___________ 117
monthly discharge at stations on ______ 134-135 North Fork of, monthly discharge of
stations on_------------------- 135-136 Kingsburg, Calif., monthly discharge of
Kings River at__________________ 135 Kinnison, H. B., The New England fiood of
November, 1927--------------- 45-100 Knights Ferry, Calif., monthly discharge of
Oakdale Canal near_____________ 161 monthly discharge of South San Joaquin
Canal near---------------------- . 161 Stanislaus & San J oaqu.in Water Co.'s · canal at.________________________ 162
Stanislaus River at and near------- 158-159 Knowles, Calif., monthly discharge of Fresno
River near--------------------- 144-145
L
La Grange, Calif., monthly discharge of Modesto Canal near_____________ 157
monthly discharge of Sierra & San Fran-cisco Power Co.'s canal near_____ 156
Tuolumne River above______________ 151 Tuolumne River and canals near____ 152 Turlock Canal near_:________________ 157
Lake Creek Basin, Oreg., power sites in ____ 303-305 Lake Creek No. 1 power site, Oreg., descrip-
tion of. ________________________ ~
INDEX 325
Page Lake Creek No. 3 power site, Oreg., descrip-
tion oL _______________________ 304--305
Lake Creek No. 2 power site, Oreg., descrip-tion of___________________________ 304
Lake Creek power site, Oreg., description oL _____________________ -------- 318-319
Lake Creek Reservoir site, Oreg., description of_ _____________________________ 254-259
Lake Florence, Calif., monthly discharge of South Fork of Sau Joaquin River near ___________ ------------------ 138
Lakeside, Calif., monthly discharge of Boulder Creek near______________ 191
monthly discharge of Cuyamaca Water Co.'s flume near _______________ 191-192
San Diego River and flume near_____ 190 San Diego River at aud uear ______ 189-190
Lancha Plana, Calif., monthly discharge of Mokelumne River near__________ 164
Lathrop, Calif., monthly discharge of San Joaquin River at________________ 140
I.ava Creek power site, Oreg., description oL _____________________________ 305--306
Lemolo Falls, Oreg., view oL _____________ Plate 20
Lemolo Falls power site, Oreg., description oL 264 Lemon Cove, Calif., monthly discharge of
Kaweah River near______________ 132
Little Colorado River, Ariz., analyses of water or------------------------- 11
Little River, Oreg., undeveloped power on __ Little Santa Anita Creek, Calif., monthly
discharge at station on __________ _ Littlejohns Creek, South Channel of, Calif.,
monthly discharge at station on_ Livingston, Calif., monthly -discharge of
309
214
163
Merced River near_ ____________ _ 148 Loafer Creek power site, Oreg., description oL 265 Lockeford, Calif., monthly discharge of Bear
Creek near ___ ------------------- 163 Lompoc, Calif., monthly discharge of Santa
Ynez River near_________________ 217
Lone Pine Creek, Calif., monthly discharge at station on ___ --------------,-- 206
Loon Lake, Oreg., view of---------------- Plate 19 Loon Lake power site, Oreg., description oL 317-318 Loon Lake reservoir site, Oreg., description
oL __ -------------------------- 254-259 Los Angeles River Basin, Calif., description
oL _ ----------------------------- 179 Love, S. K., analyses by _____________ 13, 14, 43,44
Lower Steamboat Creek power site, Oreg., description oL------------------ 308
Lytle Creek, Calif., monthly discharge at sta-tions on ______________________ ,_ 204-205
Lytle Creek Canals, Calif., monthly discharge at intake or______________________ 205
M
McCoy Creek, Calif., monthly discharge at station on_______________________ 219
McGlashan, H. D., Surface water supply of Pacific slope basins in southern California, 1894-1927 ___________ 169-219
Surface water supply of San Joaquin River Basin, Calif., 1895--1927 __ 101-168
McNary, J. V., with Clark, G. G., and Jarvis, C. S., New England floods and
Page
highways _______________________ 90-100
Malibu Creek, Calif., monthly discharge at station on_______________________ 215
Malibu Creek Basin, Calif., description oL. 179 Matagual Creek, Calif., monthly discharge
at station on __________________ ·___ 197
Mather, Calif., monthly discharge of Middle Fork or Tuolumne River near__ 155
Meadowbrook, Calif., monthly discharge or North Fork of Kings River be-low------------------------------ 135
Meeks & Daley Canal, Calif., monthly dis-charge at station on ___________ 203, 206
Mendon Road near Rutland, Vt., before and after flood or 1927-------------- Plate 6
Mentone, Calif., monthly discharge of Green-spot pipe line near_______________ 200
monthly discharge of Santa Ana River and canals near__________________ 199
Santa Ana River near ______________ 198-199
Southern California Edison Co.'s canal near----------------------- 200
Merced Falls, Calif., monthly discharge of Merced River near______________ 147
Merced River, Calif., description oL ______ 117-118 monthly discharge at stations on. _____ 145--148
South Fork of, monthly discharge at sta-tion on__________________________ 149
Mesa Grande, Calif., monthly discharge of Black Canyon Creek near------- 194
monthly discharge of San Luis Rey River near----------------------------- 195
Santa Ysabel Creek near____________ 193 Michigan Bar, Calif., monthly discharge of
Cosumnes River at______________ 168
Mill Creek, Calif., monthly discharge at sta-tions on _______________________ 201-202
Mill Creek power canals, Calif., monthly discharge at stations on_____________ 202
Mill Creek power site, Oreg., description oL _ 318 Miller Bridge, Calif., monthly discharge of
Middle Fork of San Joaquin River at.._______________________ 141
Missisquoi River, Vt., flood of 1927 on _____ Plate 4 Modesto, Calif., monthly discharge of Tuol
umne River at__________________ 152
Modesto Canal, Calif., monthly discharge at station on_______________________ 157
Mokelumne River, Calif., description oL___ 120 Licking Fork of, monthly discharge at
station on_______________________ 166 Middle Fork of, monthly discharge at
station on_______________________ 165
monthly discharge at stations on ______ 163-165
North Fork of, monthly discharge at sta-tions on_________________________ Ul3
South Fork of, monthly discharge at sta-tion on__________________________ 165
Mono Creek (San Joaquin Basin), Calif., monthly discharge at station on__ 141
Mono Creek (Santa Ynez Basin), Calif., monthly discharge at station on__ 217
monthly discharge of Santa Ynez River above._------------------------- 216
326 INDEX
Page Monrovia, Calif., monthly discharge of Mon-
rovia pipe line near______________ 211 monthly discharge of Sawpit Creek near_ 211
Monrovia pipe line, Calif., monthly discharge at station on____________________ 211
Montpelier, Vt., Main Street in, after peak of flood in 1927------------------- Plate 3
Moore Creek, Calif., monthly discharge of North Fork of Mokelumne River above __ ---------------------____ 163
Mugler Meadow, Calif., monthly discharge of Chiquito Creek near__________ 143
Myrtle Creek power site, Oreg., description oL- --------------------------- 314-315
N
Nacimiento River, Calif., monthly discharge at stations on __________________ 217-218
Nellie, Calif., monthly discharge of Escondido Mutual Water Co.'s canal near__ 197
monthly discharge of Pauma Creek near_ 197 San Luis Rey River near------------ 196 West Fork of San Luis Rey River
near----------------------------- 196 Nestor, Calif., monthly discharge of Tia
Juana River near________________ 188 New England, map of, showing rainfall' for
storms of October, 1869, and No-vember,1927 ___________________ Plate 2
spillways in, necessity for ________________ 96-97 New England flood of November, 1927, cost
of repairs and replacements of roads and bridges damaged by __ 92-93
damage caused by----------------------- 82-83 effect of reservoirs on flood flow during __ 80-81 extent oL __ ----------------------------- 45 general features oL ______________________ 61-67 maximum discharge oL _________________ 72-79 methods used in determining flood flows
for ____________ ------------------- 68-71 paved highways, superiority of, during __ 95-96 relation of highway damage to total
damage caused by_______________ 94 reopening roads to traffic after ___________ 94-95 structures lost during ____________________ 97-99
survey of flood damages to highways and bridges during ___________________ 91-92
New England floods and highways __________ 90-100 New England highways and bridges, survey
of flood damage to _______________ 91-92 New England storm of November, 1927,
causes oL _______________________ 47-50
intensity and distribution of rainfall during _____________ -------------- 55-60
rainfall records for_ ______________________ 50-55 storms, severe, prior to __________________ 84-1l7
Newman, Calif., monthly discharge of San Joaquin River near______________ 140
North Fork, Calif., monthly discharge of Kings River above______________ 134
North Umpqua River, Oreg., power sites on _____________________________ 290-302
profile of, showing location of dam sites __________________________ Plate 17
variation in flow oL_____________________ 238 North Umpqua River Basin, Oreg., records
at temporary gaging station in_ 241-242
0 Page
Oak Creek dam site, Oreg., view of _______ Plate 23 Oak Creek power site, Oreg., description oL 286-288 Oakdale, Calif., monthly discharge of Stan-
islaus River at___________________ 159 Oakdale Canal, Calif., monthly discharge at
station on_______________________ 161 Oakland Recreation Camp, Calif., monthly
discharge of South Fork of Tuolumne River near_______________ 155
Oceanside, Calif., monthly discharge of San Luis Rey River near____________ 196
Ockenden, Calif., monthly discharge of Dinkey Creek near______________ 137
Ojai, Calif., monthly discharge of Ventura River near______________________ 216
Olivarian Brook, N. H., flood of 1927 on __ Plate 12 Onyx, Calif., monthly discharge of South
Fork of Kern River near________ 128 Oregon, map of southwestern part oL ____ Plate 15 Orford, N. H., bridge at, during flood of
1927 __ ------------------------ Plate 10 Otter Creek, Vt., flood of 1927 on __________ Plate 5
p
Pacific Highway power site, Oreg .. descrip-tion of.__________________________ 290
Pacific slope basins of southern California, gaging stations in ______________ 183-186
maximum and minimum discharges in_ 186-187 measurement of the flow of streams in_ 169-170 monthly discharge at stations in _______ 188-219 reports containing records of flow of
streams in_______________________ 169 Pacoima Creek, Calif., monthly discharge at
station on_______________________ 212 Pajaro River, Calif., monthly discharge at
station on __ --------------------- 219 Pajaro River Basin, Calif., description oL _ 182-183 Pala, Calif., monthly discharge of San Luis
Rey River at and near__________ 196 Park, Calif., monthly discharge of Sly Park
Creek at_________________________ 168 Pasadena, Calif., monthly discharge of Ar-
royo Seco near___________________ 213 monthly discharge of Eaton Creek near__ 214
Precipice Canyon Water Co.'s diversion near___________________ 214
Pauma Creek, Calif., monthly discharge at stations on_--------------------- 197
Peabody River, N.H., after flood of 1927 __ Plate 7 Perdue power site, Oreg., description oL _ _ _ _ 313 Perdue reservoir site, Oreg., description oL 252-253 Piedra, Calif., monthly discharge of Kings
River at _______________________ 134-135 Pierce, C. H., quoted ________________________ 89,90
Piermont, N.H., site of bridge at, after flood of 1927__ ______________________ Plate 14
Pine Valley Creek, Calif., monthly discharge Q[ station on_____________________ 188
Piru, Calif., monthly discharge of Piru Creek near _________________ -------_____ 215
Pitman Creek, Calif., monthly discharge at station on_______________________ 143
Pleasant Valley, Calif., monthly discharge of Camp Creek near_____________ 168
monthly discharge of North Fork of Cosumnes River near----------- 167
INDEX 327
Page Pleyto, Calif., monthly discharge of San
Antonio River at________________ 218
Plunge Creek, Calif., monthly discharge at station on_______________________ 202
Porterville, Calif., monthly discharge of South ForkofTule River near___ 131
monthly discharge of Tule River near___ 130 Potter Creek power site, Oreg., description
oL _ --------------------------- 264-265 Prado, Calif., monthly discharge of Santa
Ana River near__________________ 199
Precipice Canyon Water Co.'s diversion, Calif., monthly discharge at station on_______________________ 214
Proctor, Vt., flood of 1927 at _______________ Plate 5
Public lands, classification and use of_ _____ 222-223 reports on development of water power
on _____________________________ 223-224
R
Railroad Flat, Calif., monthly discharge of Licking Fork of Mokelumne River near_--------------------- 166
monthly discharge of South Fork of Mokelumne River near__________ 165
Ramona, Calif., monthly discharge of Santa Maria Creek near_______________ 195
monthly discharge of Santa Ysabel Creek near______________________ 193
Rancheria Creek, Calif., monthly discharge of Kings River below____________ 136
Relief Creek, Calif., monthly discharge at station on_---------------------- 160
Rialto Canals, head gates of, Calif., monthly discharge of Lytle Creek at______ 205
Richford, Vt., flood scene in 1927 in ________ Plate 4
Richmond, Vt., Checker House Bridge near, after flood of 1927------------- Plate 13
highway in use soon after flood of 1927 near __________________________ Plate 14
Riddle power site, Oreg., description of_____ 314 Rock Creek, Oreg., undeveloped power on_ 308-309 Rock Creek power site, Oreg., description
oL _ --------------------------- 279-281 Rogers Creek, Calif., monthly discharge at
station on_______________________ 210
Roseburg power site, Oreg., description oL. 316 Ruckles power site, Oreg., description oL___ 315 Rutland, Vt., Mendon Road near, before and
after flood of 1927 ______________ Plate 6
s Salinas, Calif., monthly discharge of Salinas
River near______________________ 217
Salinas River, Calif., monthly discharge at stations on______________________ 217
Salinas River Basin, Calif., description oL 181-182 Salmon Creek, Calif., monthly discharge at
station on_______________________ 127
Sampler used in collection of silt samples._ Plate 1 San Antonio Creek, Calif., monthly discharge
at stations on____________________ 207
San Antonio River, Calif., monthly discharge at stations on____________________ 218
San Benito River, Calif., monthly discharge at stations on____________________ 219
Page
San Bernardino, Calif., monthly discharge of Devil Canyon Creek near._______ 204
monthly discharge of Lytle Creek near___ 204 San Diego, Calif., monthly discharge of San
Diego River at__________________ 191
San Diego River, Calif., monthly discharge at stations on __________________ 189-191
South Fork of, monthly discharge at sta-tion on ___ ----------------------- 192
San Diego.River Basin, Calif., description oL 173 San Diegnito River, Calif., monthly dis-
charge at station on .. ___________ 193-194
San Dieguito River Basin, Calif., description oL __ ---------------------------- 174
San Dimas, Calif., monthly discharge of San Dimas Creek near_______________ 212
San Emigdio Creek, Calif., monthly discharge at station on_____________ 129
San Emigdio ranch house, Calif., monthly discharge of San Emigdio Creek at..----------------------------- 129
San Fernando, Calif., monthly discharge of Pacoima Creek near_____________ 212
San Gabriel River, Calif., monthly discharge at stations on __________________ 208-209
San Gabriel River, Basin, Calif., description oL _ --------------------------- 177-179
San Jacinto, Calif., monthly discharge of San Jacinto River near_______________ 206
San Joaquin River, Calif., description of. .. 111-112 Middle Fork of, monthly discharge at
station on_______________________ 141
monthly discharge at stations on ______ 138-140 North Fork of, monthly discharge at sta-
tion on__________________________ 141
South Fork of, monthly discharge at sta· tions on_________________________ 138
San Joaquin River Basin, Calif., gaging sta-tions in ________________________ 12Q-123
geography of_ _________________________ 103-105
maximum and minimum discharges in_ 123-124 measurement of the flow of streams in_ 101-102 monthly discharge at stations in _______ 125-168 precipitation in ________________________ 11Q-111
reports containing record of flow of streams in_______________________ 101
San J oaqnin Valley, Calif., description oL 104-105
geology oL---------------------------- 105-107 soils oL _______________________________ 109-110
San Juan River, Utah, water of, analyses oL. 11 San Lorenzo Creek, Calif., monthly discharge
at station on_____________________ 218
San Luis Rey River, Calif., monthly dis-charge at stations on ___________ 195-196
West Fork of, monthly discharge at sta-tions on._--------------------- 196-197
San Luis Rey River Basin, Calif., description oL ___ ------------------------- 174-175
San Vicente Creek, Calif., monthly discharge at station on_____________________ 192
Sand Meadows, Calif., monthly discharge of Helm Creek at__________________ 136
Santa Ana, Calif., monthly discharge of Santa Ana River at____________________ 200
Santa Ana River, Calif., monthly discharge at stations on.·--·····---·--·---· 198-200
328 INDEX
Page Santa Ana River Basin, Calif., description
oL ___ ----- ______ ----- ________ 175-177
Santa Anita Creek, Calif., monthly discharge at station on_____________________ 214
Santa Barbara, Calif., monthly discharge of Mono Creek near________________ 217
monthly discharge of Santa Y nez River near---------------------________ 216
Santa Clara River, Calif., monthly discharge at station on ________________ ._____ 215
Santa Clara River Basin, ·Calif., description oL ________________ ----- _______ 179-180
Santa Paula, Calif., monthly discharge of Santa Paula Creek near-----~--- 216
Santa Margarita, Calif., monthly discharge of Salinas River near____________ 217
Santa Margarita River, Calif., monthly discharge at stations on_____________ 198
Santa Margarita River Basin, Calif., descrip-tion oL_________________________ 17/i
Santa Maria, Calif., monthly discharge of Santa Maria River near_ _ _ _ _ _ _ _ _ 217
Santa Maria Creek, Calif., monthly discharge at station on __ ~------------------ 195
Santa Maria River, Calif., monthly discharge at station on_____________________ 217
Santa Maria River Basin, Calif., description oL _ _ _ _ _______ _____ _____ _ __ _ __ ___ 181
Santa Ynez River, Calif., monthly discharge at stations on __________________ 216-217
Santa Ynez River Basin, Calif., description oL ____________________________ 18(}-181
Santa Ysabel, Calif., monthly discharge of Santa Ysabel Creek near________ 192
Santa Ysabel Creek, Calif., monthly dis-charge at stations on ___________ 192-193
Santee, Calif., monthly discharge of San Diego River near________________ 190
Santiago Creek, Calif., monthly discharge at station on ____________ -----______ 208
Sawpit Creek, Calif., monthly discharge at station on_______________________ 211
Sawyer Rapids power site, Oreg., descrip-tion of__ _______________________ 297-299
Sequoia, Calif., monthly discharge of Golden Rock ditch near_________________ 155
monthly discharge of South Fork of Tuol-umne River near ______________ 11i4-155
Serrano & Carpenter Canal, Calif., monthiy discharge at station on___________ 208
Sespe, Calif., monthly discharge of Sespe Creek at and near--------------- 215
Shaver, Calif., monthly discharge of Fresno Flume & Lumber Co.'s upper and lower flumes at______________ 144
monthly discharge of Southern California Edison Co.'s flume at.---------- 144
Stevenson Creek at__________________ 144 Scottsburg lower dam site, Oreg., view of
------------------------------ Plate 25 Scottsburg power site, Oreg., description oL 30(}-302 Sierra & San Francisco Power Co.'s canal,
Calif., monthly discharge at sta-tion on-----·---.---------··----- 156
Page Sierra Madre, Calif., monthly discharge of
Little Santa Anita Creek near___ 214 monthly discharge of Santa Anita Creek
near_____________________________ 214
Sly Park, Calif., monthly discharge of Camp Creek near______________________ 168
Sly Park Creek, Calif., monthly discharge at station on _________ --------______ 168
Smith Ferry power site, Oreg., description oL 294 Smith Meadow, Calif., Rancheria Creek
near __ ------------------------___ 136
Soda Springs dam site, Oreg., view oL ___ Plate 19 Soda Springs power site, Oreg., description
oL ____________________ -------- 268-271
Soledad, Calif., monthly discharge of Arroyo Seco near________________________ 218
South Royalton, Vt., bridge at, during flood of 1927----------------------- Plate 10
South San Joaquin Canal, Calif., monthly discharge at station on__________ 161
South Umpqua Falls power site, Oreg., description oL__________________ 310
South Umpqua River, Oreg., power sites on __________________ ----------- 309-316
variation in flow oL_____________________ 238
Southern California Edison Co.'s canal, Calif., monthly discharge at sta-tions on __ ------------- 200, 207,208,210
S<mthern California Edison Co.'s flume, Calif., monthly discharge at sta-tion on__________________________ 144
Springville, Calif., monthly discharge of Bear Creek near_________________ 131
monthly discharge of North Fork of Mid-dle Fork of Tule River near____ 130
South Fork of Middle Fork of Tule River near __________ ,____________ 131
Stanislaus & San Joaquin Water Co.'s canal, Calif., monthly discharge at sta-tion on---~---------------------- 162
Stanislaus River, Calif., description oL _____ · 119 Middle Fork of, monthly discharge at
station on_______________________ 158 monthly discharge at stations on ______ 158-159 North Fork of, monthly dis'charge at sta-
tion on__________________________ 160
South Fork of, monthly discharge at sta-tion on__________________________ 161
Steamboat Creek, Oreg., power sites on __ 307-308 Steamboat dam site, Oreg., view oL _____ Plate 21 Steamboat Falls power site, Oreg., descrip-
tion of___________________________ 308
'Steamboat power site, Oreg., description oL 273-275 Stearns, H. T., with Jones, B. E., Water
power resources of the Umpqua River and its tributaries, Ore-gon ____________________________ 221-320
Stevenson Creek, Calif., monthly discharge at station on_____________________ 144
Stockton, Calif., monthly discharge of Cala-veras River near_________________ 162
Stockton-Mokelumne Canal, Calif., monthly discharge at station on.---------· 166
INDEX 329
Strawberry, Calif., monthly discharge of South Fork of Stanislaus River
Page
at._----------------------------- 161 Strawberry Creek, Calif., monthly discharge
at station on_____________________ 203 Sunland, Calif., monthly discharge of Tu
junga Creek near________________ 213 Susanna Creek, Calif., monthly discharge at
station on._--------------------- 197 Sutter Creek, Calif., monthly discharge of
Sutter Creek at__________________ 167 Sutter Creek, Calif. monthly discharge at
stations on ____________________ 166-167
Sweetwater Reservoir, Calif., inonthly discharge of Sweetwater River at.. 189
Sweetwater River, Calif., monthly discharge at stations on __________________ 188-189
Sweetwater River Basin, Calif., description oL------------------------------- 172
T
Tejon House Creek, Calif., monthly discharge at station on_,___________ 128
Tejon ranch house, Calif., monthly discharge of Tejon House Creek at_________ 128
Temecula, Calli., monthly discharge of Teme-cula Creek near:_________________ 198
Temescal Creek, Calif., monthly discharge at station on--------------------- 194,207
Temescal Water Co.'s diversion, Calif., monthly discharge at station on.. 206
Tenaya Creek, Calif., monthly discharge at station on _____________________ 14&-149
Thornton, Calif., monthly discharge of Mokel-umne River near ____ ------------ 165
Three Rivers, Calif., monthly discharge of Kaweah River near______________ 132
monthly discharge of South Fork of Kaweah River near______________ 133
Tia Juana River, Calif., monthly discharge at station on_____________________ 188
Tia Juana River Basin, Calif., description of ______ -- ______ -- ____________ -- 171-172
Tiller power site, Oreg., descript'.on ot_______ 312 Tilley Creek, Calif., monthly discharge of
Borel Canal at___________________ 127 Timber Knob, Calif., monthly discharge of
West Fork of Granite Creek near. 142 Toketee Falls, Oreg., view oL ___________ Plate 20 Toketee Falls power site, Oreg., description
of______________________________ 266--267
Toketee Falls reservoir site, Oreg., description oL.--.--------------------- ----- 259-260
Tollhouse, Calif., monthly discharge of Big Creek near______________________ 138
Topock, Ariz., suspended matter in Colorado River near _________________ 36--40,42-44
Tres Pinos, Calif., monthly discharge of San Benito River near--------------- 219
monthly discharge of Tres Pinos Creek near----------------------------- 219
Triunfo Creek, Calif., monthly discharge at station on_______________________ 215
Tujunga, Calif., monthly discharge of Haines Creek near.--·-·-··-------·----· 213
Page Tujunga Creek, Calif., monthly discharge at
station on_______________________ 213
'£ulare and Kern Lake Basins, Calif., descrip. tion oL---------------------- 112
Tulare Lake, Calif., description of _________ 113-114 Tule River, Calif., description of____________ 116
monthly discharge at station on--------- 130 North Fork of Middle Fork of, monthly
discharge at station on___________ 130 South Fork of, monthly discharge at
station on----------------------- 131 South Fork of Middle Fork of, monthly
discharge at station on__________ 131 Tuolumne River, Calif., description of_______ 118
Middle Fork of, monthly discharge at stations on ____________________ 155-156
monthly discharge at stations on. _____ 15(}-162 South Fork of, monthly discharge at
stations on ____________________ 154-155
Turlock Canal, Calif., monthly discharge at station on_______________________ 1!)7
Tyler Creek, Calif., monthly discharge at station on._-----------------·--- 129
u Umpqua River, Oreg., power sites on _____ 263-290
profile of, showinglocationofdamsites Plate 17 sources of information on_____________ 224-225 variation in flow of __________________ 235-239
Umpqua River Basin,Oreg.,annualyieldand minimum flow of streams in._ 239-243
climate oL---------------------------- 233-234. discharge measurements in ____________ 242-243
floods in---------------------------·--- 243-244 gaging stations in------------------------ 241 geography of--------------------------- 230-231 geology of.---------------------------- 232-233 hydraulic structures in, factors affecting 234--235 map showing proposed power sites in. Plate 15 market for water power in _____________ 319-320 prior water rights in ___________________ 244-245
requlation of flow in.------------------ 245-246 storage sites, undeveloped in ___________ 246--260
summary of the report on-------------- 225-229 water power, developed, in ________ 225,260-261 water power, undeveloped, in_ 225-229,261-319
Upland, Calif., monthly discharge of San Antonio Creek near_------------ 'lJY1
Upper Steamboat Creek power site, Oreg., description of____________________ 308
Utica Gold Mining Co.'s canal, Calif., monthly discharge at station on.. 160
v Ventura, Calif., monthly discharge of
Ventura River near______________ 216 Ventura River, Calif., monthly discharge at
stations on.--------------------- 216 Ventura River Basin, Calif., description of__ 180 Vermillon Valley, Calif., monthly discharge
of Bear Creek near_______________ 141 monthly discharge of Mono Creek near.. 141
Vernalis, Calif., monthly discharge of San Joaquin River near •••• ~---··-··· HQ
330 INDElX
Page VIlla Park, Calif., monthly discharge of
Santiago Creek near_____________ 208 monthly discharge of Serrano & Carpen-
. ter Canal near------------------ 208 Volcano, Calif., monthly discharge of Sutter
Creek near______________________ 166
w Warm Creek, Calif., monthly discharge at
station on_______________________ 203 Warner Springs, Calif., monthly discharge
of Carrizo Creek near____________ 197 monthly discharge of Matagua) Creek
near_____________________________ 197 San Luis Rey River near____________ 195 Susanna Creek near_________________ 197 West Fork of San Luis Rey River
near----------------------------- 197 Waterbury, Vt., d~brisfromfloodof1927at_ Plate5 Waterman Canyon Creek, Calif., monthly
discharge at station on__________ 203 Watsonville, Calif., monthly discharge of
Pajaro River at__________________ 219 Wawona, Calif., monthly discharge of South
Fork of Merced River near______ 149 West Point, Calif., monthly discharge of
Middle Fork of Mokelumne River at_________________________ 165
monthly discharge of North Fork of Mokelumne River near--------- 163
West San Pasqnal ditch, Calif., monthly discharge at station on___________ 195
0
Page White River, Calif., monthly discharge at
station on __ --------------------- 129 White River, Vt., bridge over, during flood
of 1927 ________________________ Plate 10 Winchester dam site, Oreg., view of_ _______ Plate24 Winchester power site, Oreg., .description of_ 261,
288-290 Winooeki, Vt., pontoon bridge at, aerial
view of _______________________ Plate 11
Winooski River, Vt.,d~brisleftbyfloodon_ Plate5 flood of 1927 on-----~------------- Plates 3, 5
Winooski Valley, Vt., Federal·aid project 68 in, after flood of 1927---------- Plate 13
Wolf Creek power site, Oreg:, description of_ 291-292 Wolf Creek reservoir site, Oreg. See Coles
Valley reservoir site. Woodbridge, Calif., monthly discharge of
Mokelumne River at____________ 1M monthly discharge of Stockton-Moke
lumne Canal at------------------ 166 Woods Creek, Calif., monthly discharge at
station on----------------------- 156
y
Yosemite, Calif., monthly discharge of Illilouette Creek near__________ 148
monthly discharge of Merced River at and near----------------------- 14&-146
Tenaya Creek near---------------- 148-149 Yosemite Creek at__________________ 149
Ysidora, Calif., monthly discharge of Santa Margarita River near----------- 11>8
Related Documents