Welcome message from author
This document is posted to help you gain knowledge. Please leave a comment to let me know what you think about it! Share it to your friends and learn new things together.
Transcript

2
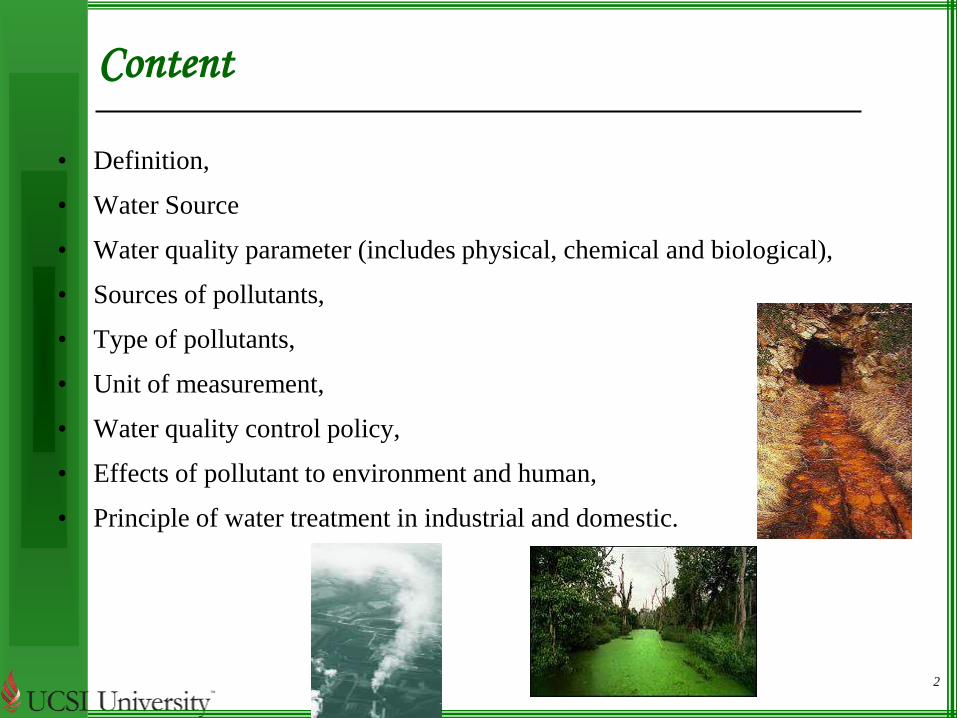
Content
• Definition,
• Water Source
• Water quality parameter (includes physical, chemical and biological),
• Sources of pollutants,
• Type of pollutants,
• Unit of measurement,
• Water quality control policy,
• Effects of pollutant to environment and human,
• Principle of water treatment in industrial and domestic.
3
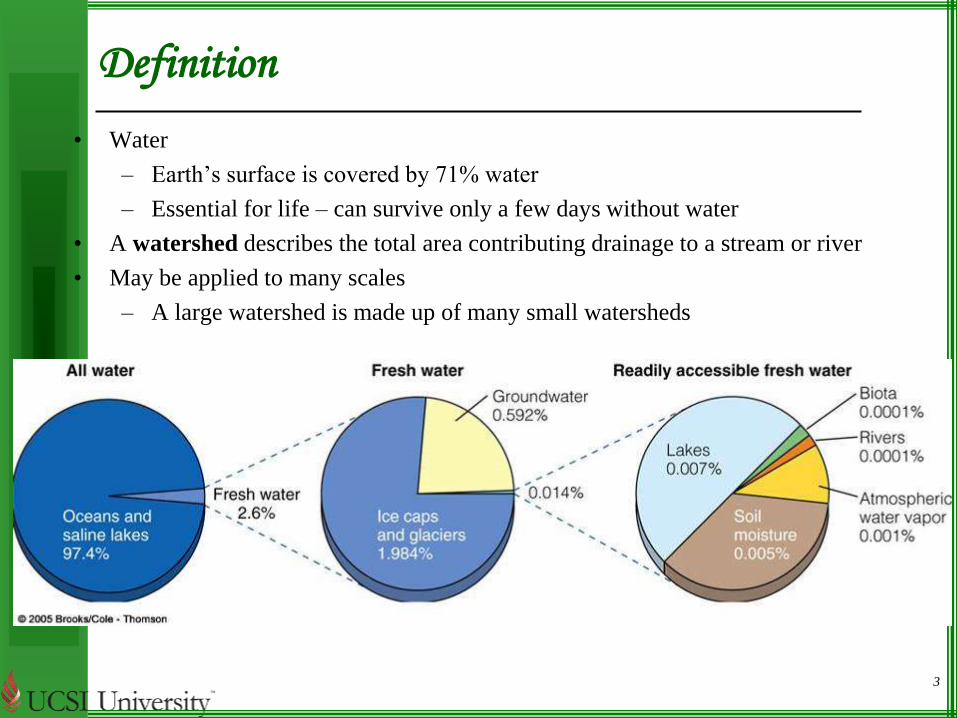
Definition
• Water
– Earth’s surface is covered by 71% water
– Essential for life – can survive only a few days without water
• A watershed describes the total area contributing drainage to a stream or river
• May be applied to many scales
– A large watershed is made up of many small watersheds

4
Use of Water Resources
Humans directly or indirectly use about 54% of reliable runoff
Withdraw 34% of reliable runoff for:
• Agriculture – 70%
• Industry – 20%
• Domestic – 10%
Leave 20% of runoff in streams for human use: transport goods,
dilute pollution, sustain fisheries
Could use up to 70-90% of the reliable runoff by 2025

5
Four Major Types of Water Pollution
6
Safe drinking water
• Free from pathogenic organisms
• Clear
• Not saline
• Free from offensive taste or smell
• Free from compounds that may have adverse effect on human health
• Free from chemicals that cause corrosion of water supply systems
7
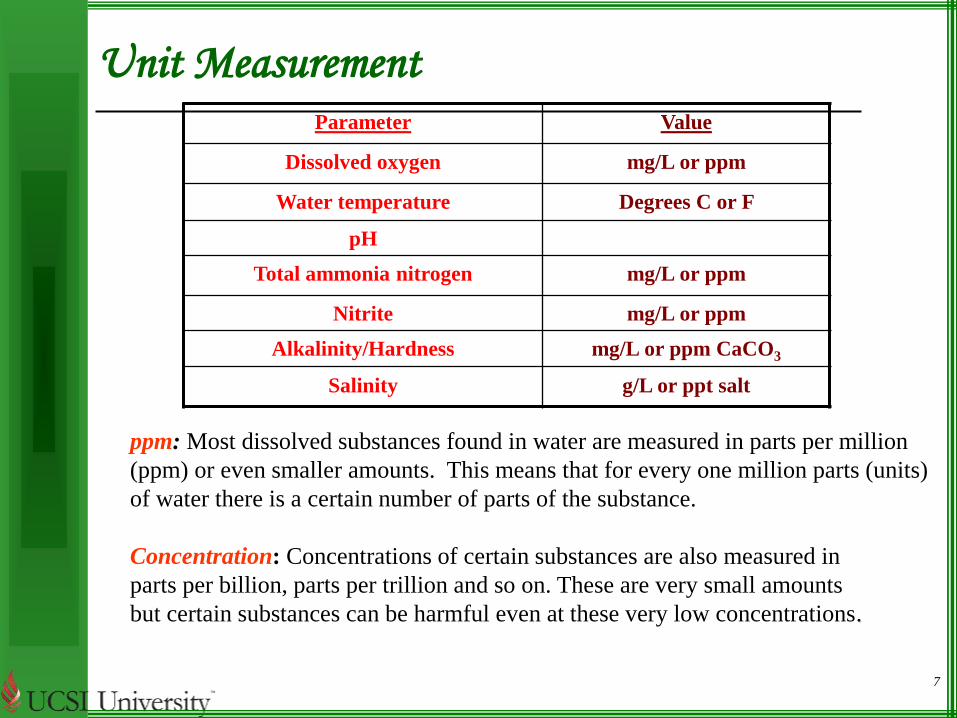
Unit MeasurementParameter Value
Dissolved oxygen mg/L or ppm
Water temperature Degrees C or F
pH
Total ammonia nitrogen mg/L or ppm
Nitrite mg/L or ppm
Alkalinity/Hardness mg/L or ppm CaCO3
Salinity g/L or ppt salt
ppm: Most dissolved substances found in water are measured in parts per million
(ppm) or even smaller amounts. This means that for every one million parts (units)
of water there is a certain number of parts of the substance.
Concentration: Concentrations of certain substances are also measured in
parts per billion, parts per trillion and so on. These are very small amounts
but certain substances can be harmful even at these very low concentrations.

8
Key water quality parameters for various water uses

9
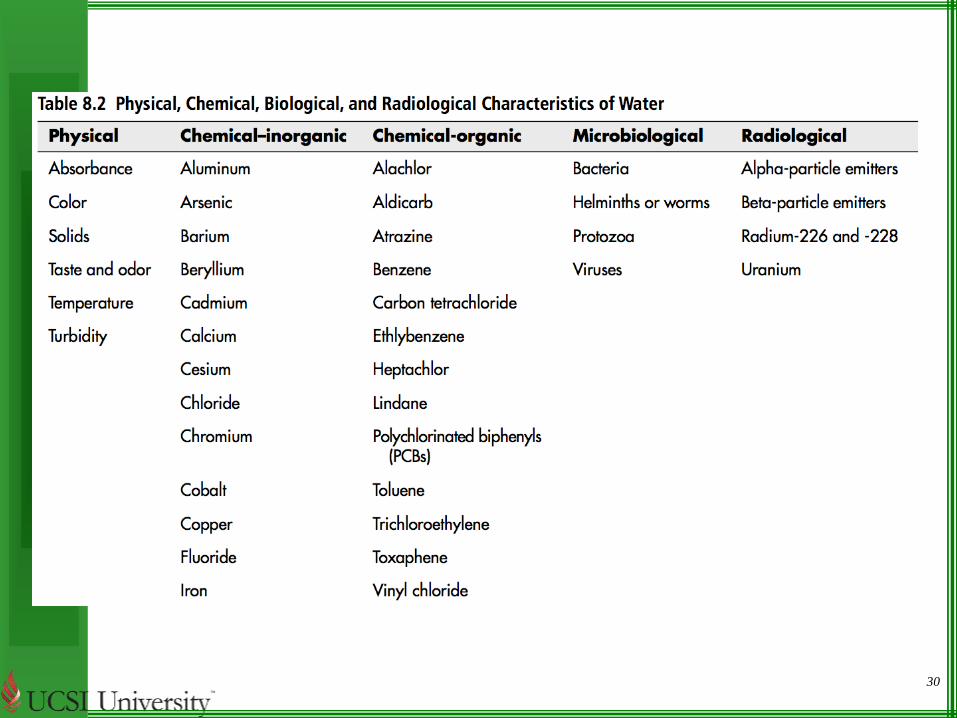
Water Quality Parameters
• Physical parameters
– Characteristics that respond to the sense of sight, touch, taste or smell.
– Six common parameters: Suspended solid, temperature, taste, odor,
color and turbidity
• Chemical Parameter
– Substance that dissolved in water
– Total dissolved solid, alkalinity, hardness, metals, organic compounds,
and nutrients
• Bacteriological/microbiological
– Living organism that can be found in the water.
– It may lead to bad taste, odor, corrosion and slime production
– Pathogen

10
Physical parameters: Suspended Solid (TSS)
• TSS is the measure of the
sediment suspended in the water.
• Water with high TSS usually has
high Total Dissolved Solids
(TDS) as well.
• TSS is related to turbidity.
• Sediments suspended in the
water increase turbidity.

11
Physical Parameter: Taste and Odor
• Mainly due to organic substances, ,Biological activity, industrial pollution
• Taste buds in the oral cavity specially detect inorganic compounds of
metals like magnesium, calcium, sodium, copper, iron and zinc
• Water should be free from objectionable taste and odor.

12
Physical Parameter: Color
• May be due to the Presence of organic matter, metals (iron, manganese) or
highly colored industrial waste
• Desirable that drinking water be colorless
• Desirable limit, 5 Hazen unit
• Permissible limit 25 Hazen Unit

13
Physical Parameter: Turbidity
• Caused by suspended matter
• High level turbidity shield and protect bacteria from the action of
disinfecting agents
• Desirable limit-5NTU (Nephelometric Turbidity Units)
should be below 1 NTU when disinfection is practiced
Permissible limit-10NTU
14
Chemical Parameter: Total Dissolved Solid (TDS)
• TDS is the measure of the material dissolved in water
• This measure is related to hardness, salinity and conductivity
• Hard water has more TDS than soft water.
15
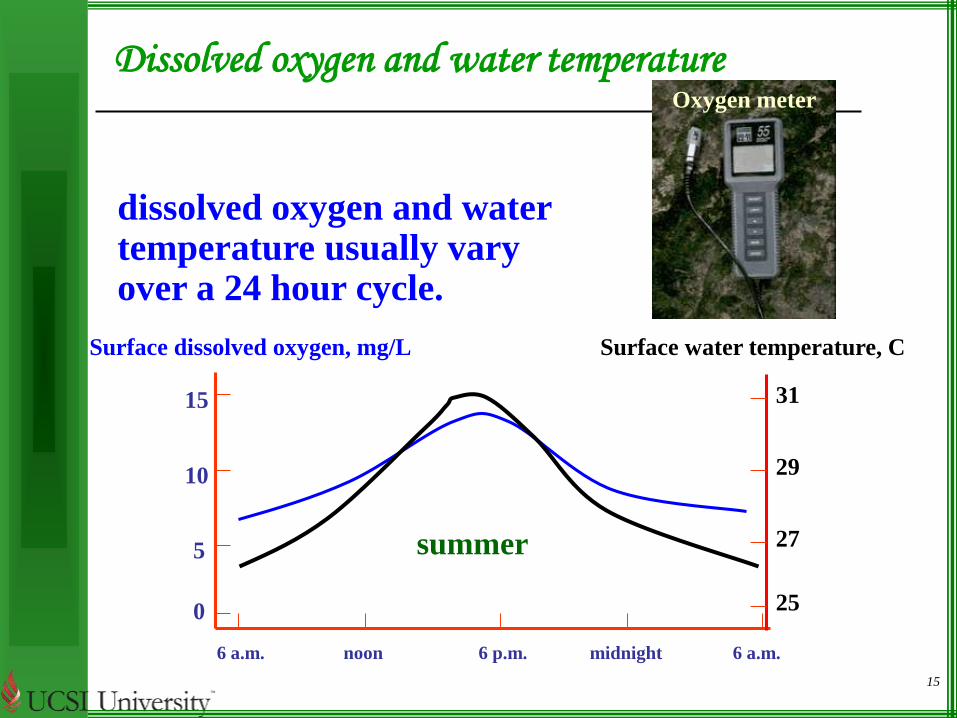
Dissolved oxygen and water temperature
dissolved oxygen and water temperature usually vary over a 24 hour cycle.
6 a.m. 6 a.m.midnight6 p.m.noon
0
15
10
5
Surface dissolved oxygen, mg/L
25
27
29
31
Surface water temperature, C
summer
Oxygen meter
16
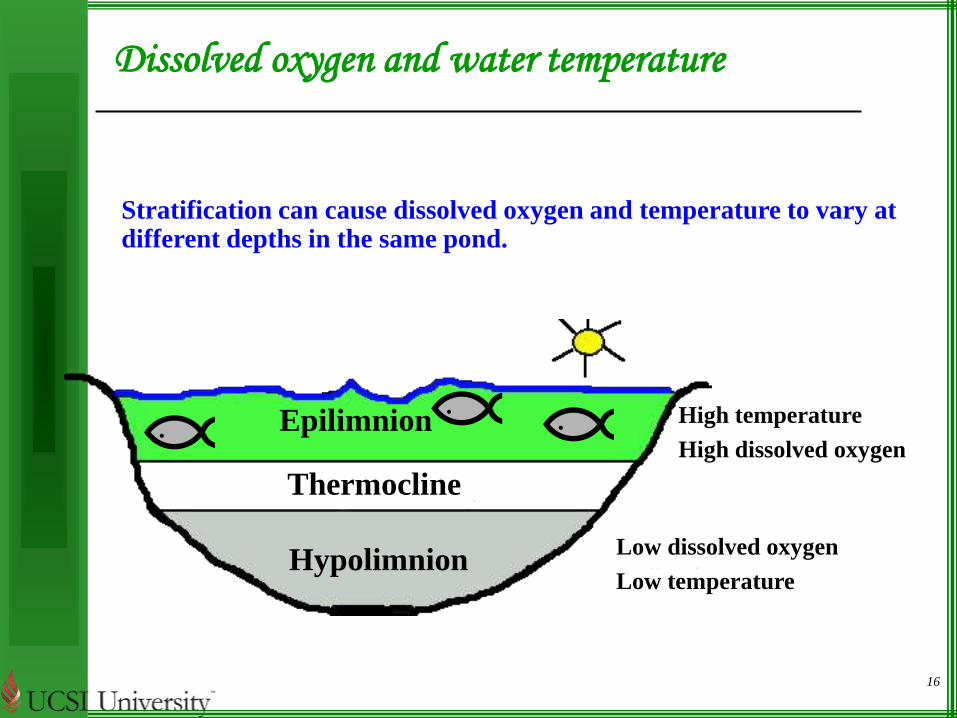
Stratification can cause dissolved oxygen and temperature to vary at different depths in the same pond.
Dissolved oxygen and water temperature
Epilimnion
Thermocline
Hypolimnion
High temperature
High dissolved oxygen
Low dissolved oxygen
Low temperature

17
Chemical Parameter: Alkalinity
• pH is the measure of hydrogen ion concentration
• Neutral water pH-7
• Acidic water has pH below 7
• Basic water has pH above 7
• Desirable limit 6.5-8.5 Beyond this limit the water will affect
the mucous membrane and water supply system
• Capacity to neutralize acid
• Presence of carbonates, bi-carbonates and hydroxide compounds
of Ca, Mg, Na and K
• Alkalinity = hardness, Ca and Mg salts
• Alkalinity > hardness - presence of basic salts, Na, K along with
Ca and Mg
• Alkalinity < hardness – neutral salts of Ca & Mg present
18
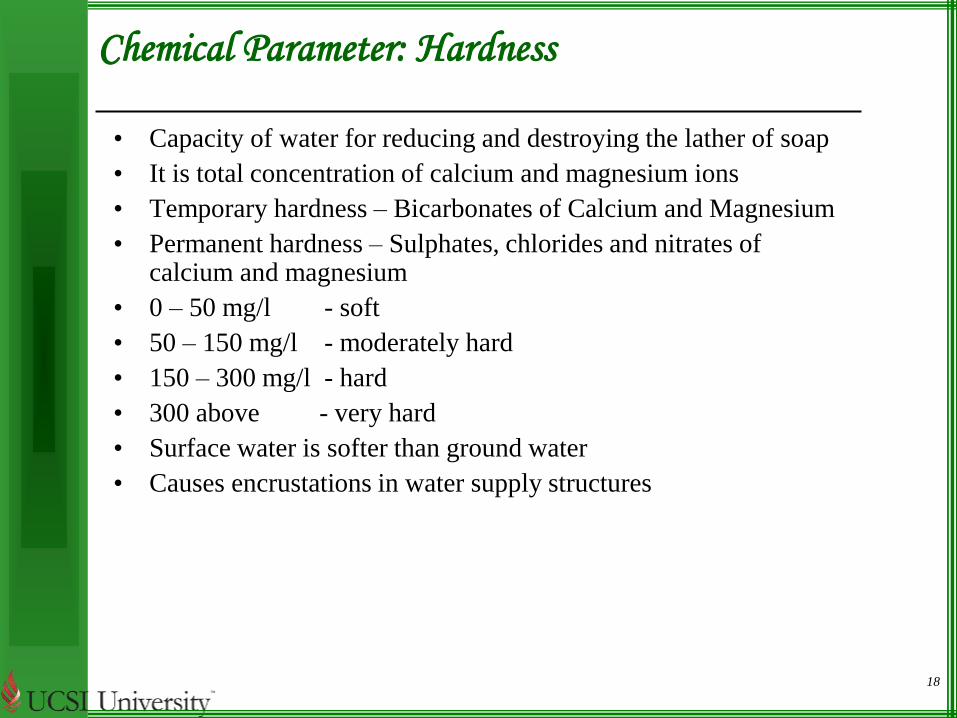
Chemical Parameter: Hardness
• Capacity of water for reducing and destroying the lather of soap
• It is total concentration of calcium and magnesium ions
• Temporary hardness – Bicarbonates of Calcium and Magnesium
• Permanent hardness – Sulphates, chlorides and nitrates of calcium and magnesium
• 0 – 50 mg/l - soft
• 50 – 150 mg/l - moderately hard
• 150 – 300 mg/l - hard
• 300 above - very hard
• Surface water is softer than ground water
• Causes encrustations in water supply structures

19
Alkalinity and Hardness
alkalinity hardness
Total titratable bases Total divalent salts
HCO3-
bicarbonate
CO3--
carbonate calcium magnesium
Mg++Ca++
Calcium bicarbonate
Ca( HCO3 )2
Calcium carbonate
CaCO3
Magnesium
bicarbonate
Mg( HCO3 )2
Magnesium
carbonate
MgCO3

20
Alkalinity is a measure of the bases that can be neutralized by acid.
Most alkalinity in water used for aquaculture is a result of bicarbonates (
HCO3- ) and carbonates ( CO3-- ).
Hardness is a measure of the divalent salts and is normally found in waters
used for aquaculture as calcium ( Ca++ ) and magnesium ( Mg++ ).
Alkalinity and hardness are normally the same concentration in waters used
for aquaculture because calcium and magnesium combine with the
bicarbonates and carbonates. However, some waters can have a high
alkalinity and low hardness or low alkalinity and high hardness.
Total alkalinity and hardness above 25 mg/l is considered adequate for
aquaculture of fishes. Crustaceans require about 40 mg/l total hardness for
best growth.

21
Alkalinity and Hardness
The form alkalinity takes is linked to pH of the system.

22
Chemical Parameter: Metal
IRON
• One of the earth’s most plentiful resource
• High iron causes brown or yellow staining of laundry, household fixtures
• Metallic taste, offensive odour, poor tasting coffee
• Cause iron bacteria
• Acceptable limit – 0.3 mg / l
Fluoride
• Occurs naturally
• Long term consumption above permissible level can cause –
• dental flurosis (molting of teeth)
• Skeletal flurosis
• Acceptable limit – 1 mg / l
• Maximum permissible limit – 1.5 mg / l
• Remedy – 1) Deflouridation
2) Mixing Fluoride free water
3) Intake of vitamin C,D, calcium, antioxidants
23
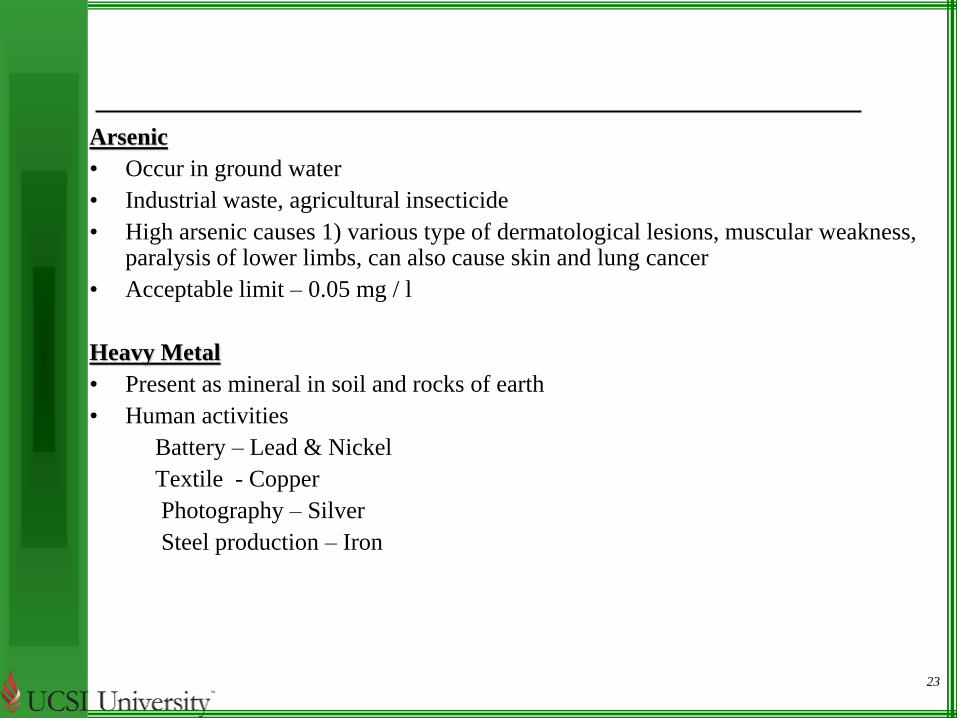
Arsenic
• Occur in ground water
• Industrial waste, agricultural insecticide
• High arsenic causes 1) various type of dermatological lesions, muscular weakness, paralysis of lower limbs, can also cause skin and lung cancer
• Acceptable limit – 0.05 mg / l
Heavy Metal
• Present as mineral in soil and rocks of earth
• Human activities
Battery – Lead & Nickel
Textile - Copper
Photography – Silver
Steel production – Iron

24
Chemical Parameter: BOD & COD
25
Biochemical Oxygen Demand (BOD)
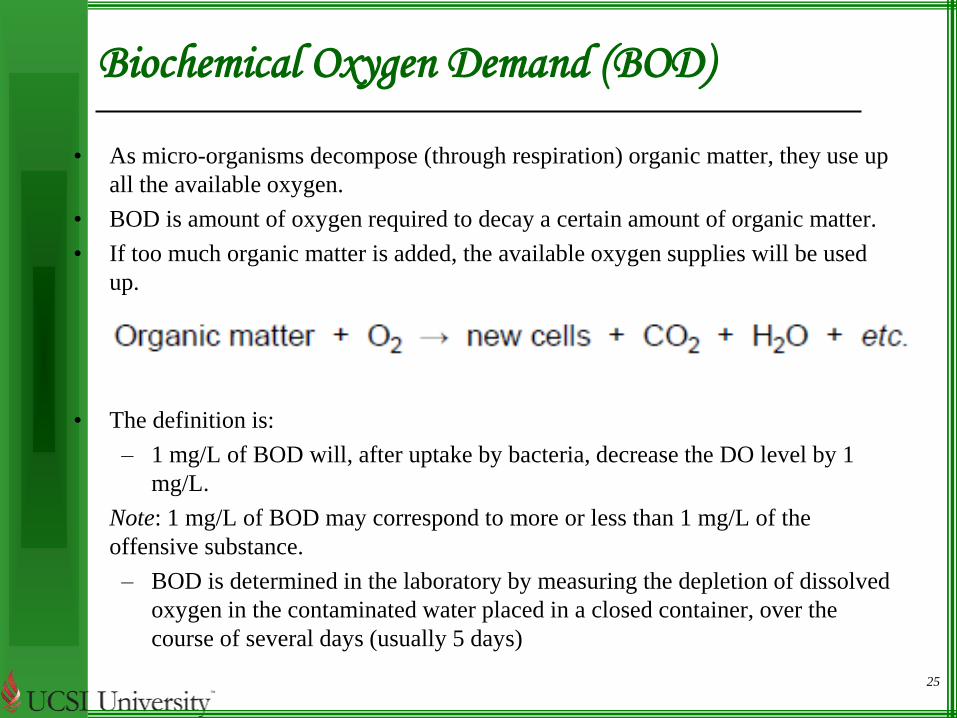
• As micro-organisms decompose (through respiration) organic matter, they use up
all the available oxygen.
• BOD is amount of oxygen required to decay a certain amount of organic matter.
• If too much organic matter is added, the available oxygen supplies will be used
up.
• The definition is:
– 1 mg/L of BOD will, after uptake by bacteria, decrease the DO level by 1
mg/L.
Note: 1 mg/L of BOD may correspond to more or less than 1 mg/L of the
offensive substance.
– BOD is determined in the laboratory by measuring the depletion of dissolved
oxygen in the contaminated water placed in a closed container, over the
course of several days (usually 5 days)
26
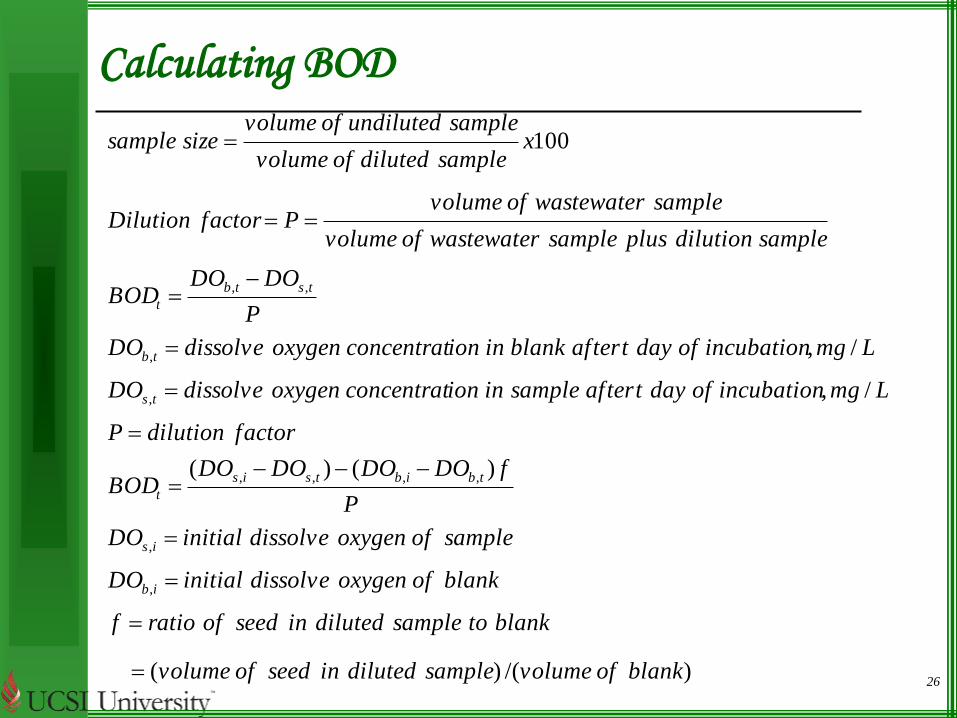
Calculating BOD
)/()(
)()(
/,
/,
100
,
,
,,,,
,
,
,,
blankofvolumesampledilutedinseedofvolume
blanktosampledilutedinseedofratiof
blankofoxygendissolveinitialDO
sampleofoxygendissolveinitialDO
P
fDODODODOBOD
factordilutionP
LmgincubationofdaytaftersampleinionconcentratoxygendissolveDO
LmgincubationofdaytafterblankinionconcentratoxygendissolveDO
P
DODOBOD
sampledilutionplussamplewastewaterofvolume
samplewastewaterofvolumePfactorDilution
xsampledilutedofvolume
sampleundilutedofvolumesizesample
ib
is
tbibtsis
t
ts
tb
tstb
t

27
• The BOD of a wastewater sample is estimated to be 180mg/L.
– What volume of undiluted sample should be added to a 300 mL
bottle? What are the sample size and dilution factor using this
volume? Assume 4 mg/L BOD can be consumed in the BOD bottle.
– What is the BOD5 of wastewater sample if DO values for the blank
and diluted sample after 5days are 8.7 and 4.2 mg/L, respectively.
28
Chemical Parameter: Nutrient
Excess nutrients cause algal blooms. As algae die and decay, the high bacterial
load rapidly consumes dissolved oxygen.
Nitrate
• Increasing level of nitrate is due to Agricultural fertilizers, manure, animal dung,
nitrogenous material ,sewage pollution (blue baby diseases to infants)
• Under normal conditions, the nitrogen cycle keeps the amount of available
nitrogen in balance with the demands. However, excessive use of fertilizers and
nutrient rich sewage release have created a surplus of nitrate. The result is
eutrophication from excess algae and bacteria with reduced dissolved oxygen.
Phosphate
• Phosphate’s concentrations in clean water is generally low; however, phosphorus
is used extensively in fertilizer and other chemicals.
• The primary sources of phosphates to surface water are detergents, fertilizers,
and natural mineral deposits.
• High levels of phosphate can over stimulate the growth of aquatic plants and algae.
29
Biological Parameter: Pathogens
• Capable of infecting and transmitting diseases to human
– Bacteria:
– Virus: smallest microorganisms with sizes range from 0.01 to 0.3 μm.
Could cause certain disease like hepatitis, flu, jaundice, polio
– Protozoa: simplest animal species. Infection are usually characterized
by gastrointestinal disorders.
– Fungi: can produce musty taste and odour as well as colour and
turbidity.
– Algae: Increase the level of DO in water. But too much of algae, will
affect taste and smell and can reduce the intensity of light penetration.
30

31
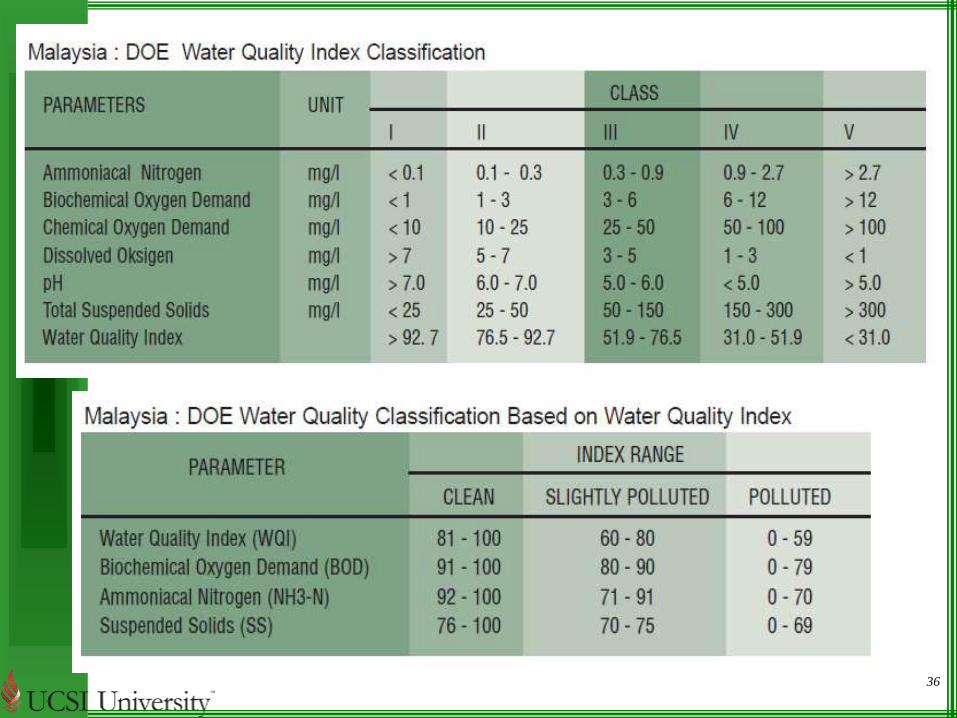
Water quality control
• The WHO guidelines divide water quality parameters into two categories:
– i. Health guidelines, which take into account chemical and radiological
constituents that have the potential to directly adversely affect human health;
and
– ii. Acceptability guidelines, which include parameters that may not have any
direct health effects but result in objectionable taste or odour in the water.

32
33

34
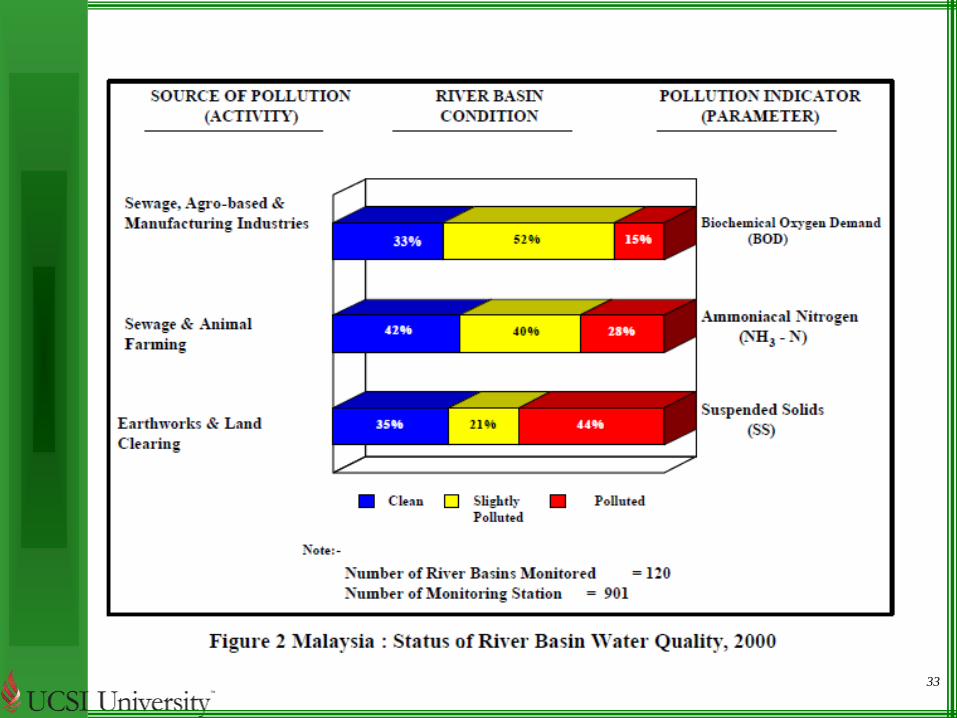
Water Quality Monitoring: Malaysia Perspective
• National Monitoring Network Established in 1978.
• Aims
– to establish the status of river water quality;
– To detect changes in water quality as a result of development
activities.
• To-date, 902 manual stations in 120 basins (462 rivers).
• Program include:
– In-situ measurements (more than 6 parameters: Turbidity, dissolved
oxygen, salinity, temperature, pH and electrical conductivity.)
– Sampling and Laboratory Analyses (24 physicochemical and biological
parameters). 10 Automatic water quality monitoring stations on major
rivers
• To detect changes in river water quality on a continuous basis.
• Water Quality levels violating the ambient standard for specific parameters
will be transmitted real-time to DOE.

35
36
37
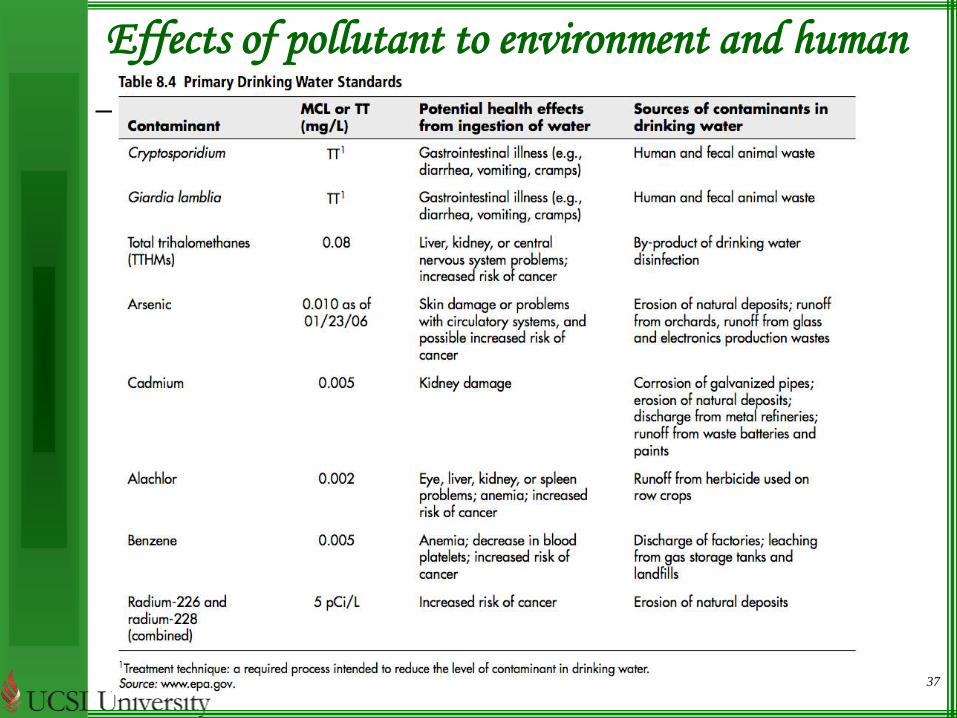
Effects of pollutant to environment and human
38
WHO water treatment guidance
The following should be monitored
• Sources of water
• Treatment procedures
• Water treatment equipment
• Treated water tests
• Monitoring records required
Principle of water treatment
39
Pre-treatment steps
1. Primary filtration and multi-media filter
2. Coagulation or flocculation
3. Desalination
4. Softening
1.A typical water pre-treatment system involves several steps, from physical removal
of impurities to chemical treatment. Water is passed through coarse filters or
screens to remove sticks, leaves and other large objects. Sand and grit settle out of
the water during this stage. Next is filtration with a multi-media filter. The
different media types are effective at removing suspended solids at sizes as small as
5 to 10 micrometers. Some manufacturers may simply use a sand filter. All these
filter types need to be periodically back-washed.
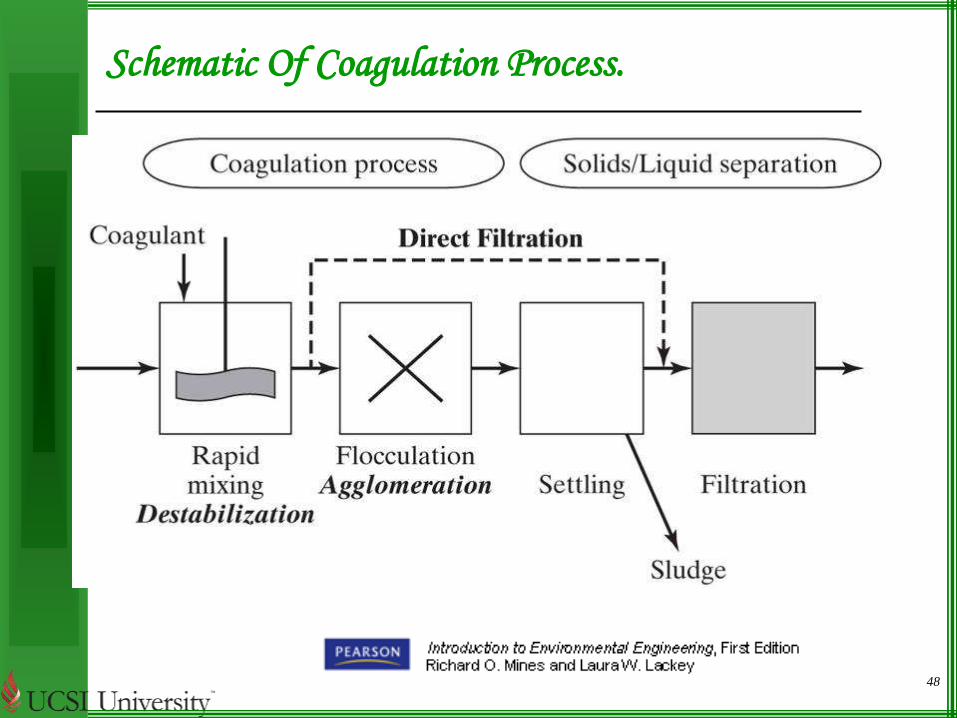
2.Flocculation, coagulation, and sedimentation are the subsequent treatments. During
coagulation, aluminium or iron sulphate is added to the raw water, forming sticky
elements that attach to small particles made up of bacteria, silt and other impurities.
This “floc” sinks. This is called flocculation, sedimentation and clarification.
3.Manufacturers who source their own water should have as a minimum screens and
sand filters before further purification. Desalination is sometimes used by
manufacturers to remove sodium chloride if only brackish water is available.
4.Softening, to remove “hardness” due to calcium and magnesium, is covered in
greater detail in some of the following slides. 40

41
Flow Diagram Of Conventional Surface Water Treatment Plant.
42
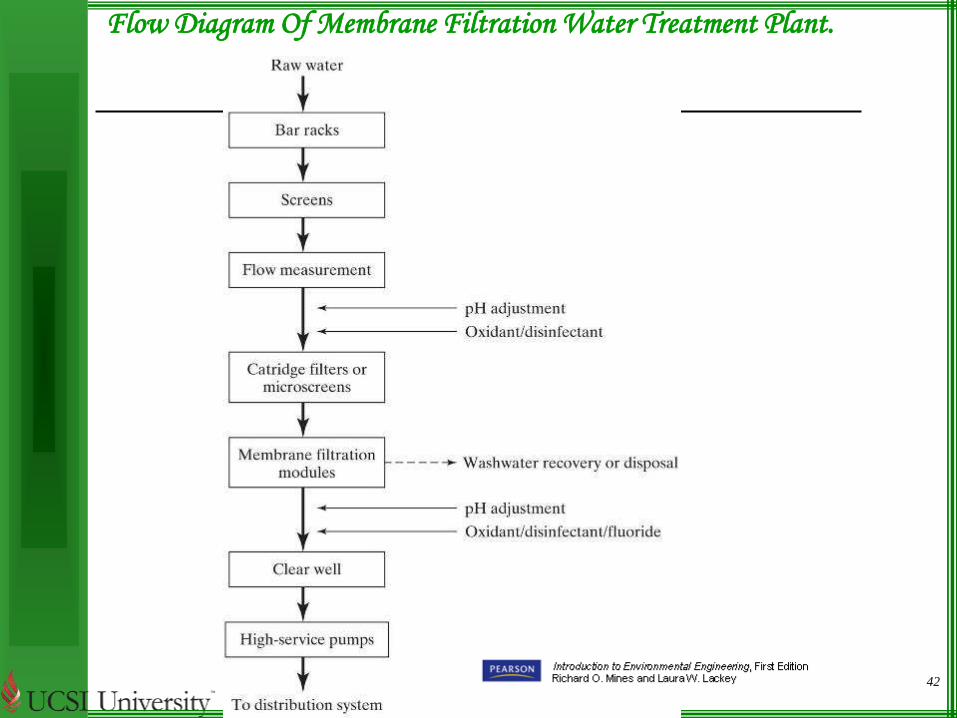
Flow Diagram Of Membrane Filtration Water Treatment Plant.
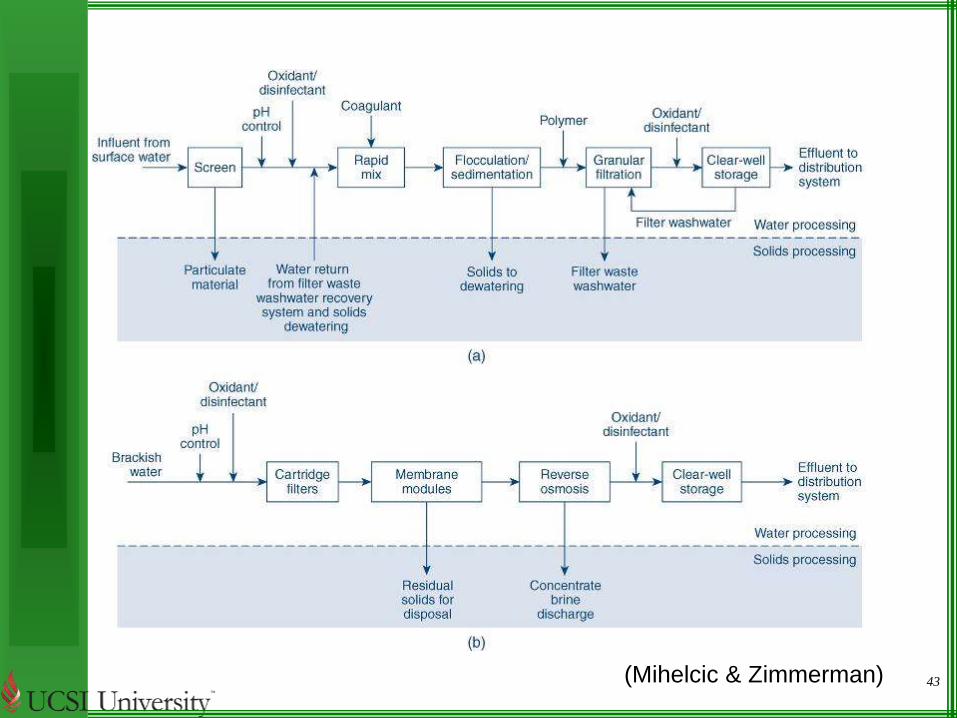
43(Mihelcic & Zimmerman)
44
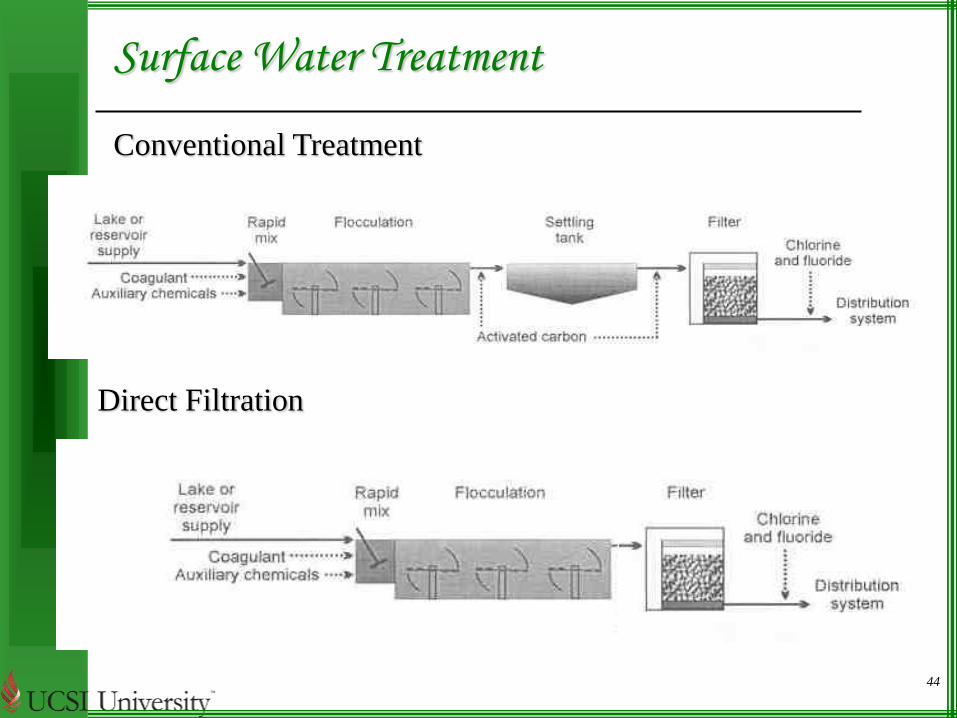
Surface Water Treatment
Conventional Treatment
Direct Filtration

45
Flow Diagram Of Reverse Osmosis Water Treatment Plant.

46
Groundwater Treatment

47
Settling (Sedimentation)
48
Schematic Of Coagulation Process.
49
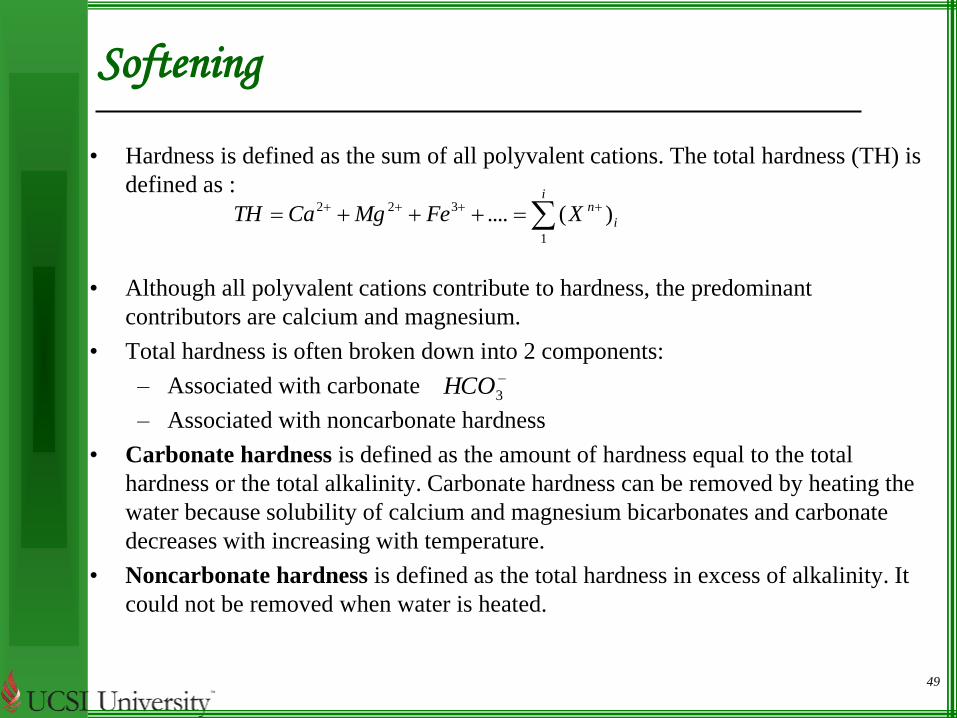
Softening
• Hardness is defined as the sum of all polyvalent cations. The total hardness (TH) is
defined as :
• Although all polyvalent cations contribute to hardness, the predominant
contributors are calcium and magnesium.
• Total hardness is often broken down into 2 components:
– Associated with carbonate
– Associated with noncarbonate hardness
• Carbonate hardness is defined as the amount of hardness equal to the total
hardness or the total alkalinity. Carbonate hardness can be removed by heating the
water because solubility of calcium and magnesium bicarbonates and carbonate
decreases with increasing with temperature.
• Noncarbonate hardness is defined as the total hardness in excess of alkalinity. It
could not be removed when water is heated.
i
inXFeMgCaTH )(....
1
322
3HCO

50
Lime-Soda Softening
• In lime-soda softening:
• The objective is to precipitate the calcium as CaCO3 and magnesium as Mg(OH)2.
• Softening steps:
– Neutralization of carbonic acid:
• To raise the pH, we must neutralize any free acid present in the water.
– Precipitation of carbonate hardness
– Removal of noncarbonate hardness due to calcium by additional of soda ash. To
remove magnesium is by add both lime and soda.
)()(2
)(
2
2
3
2
3
2
sOHMgOHMg
sCaCOCOCa
OHsCaCOOHCaCOH 23232 2)()(
OHsCaCOOHCaHCOCa 2323
2 2)(2)(2
NasCaCOCONaCa 2)(332
2
51
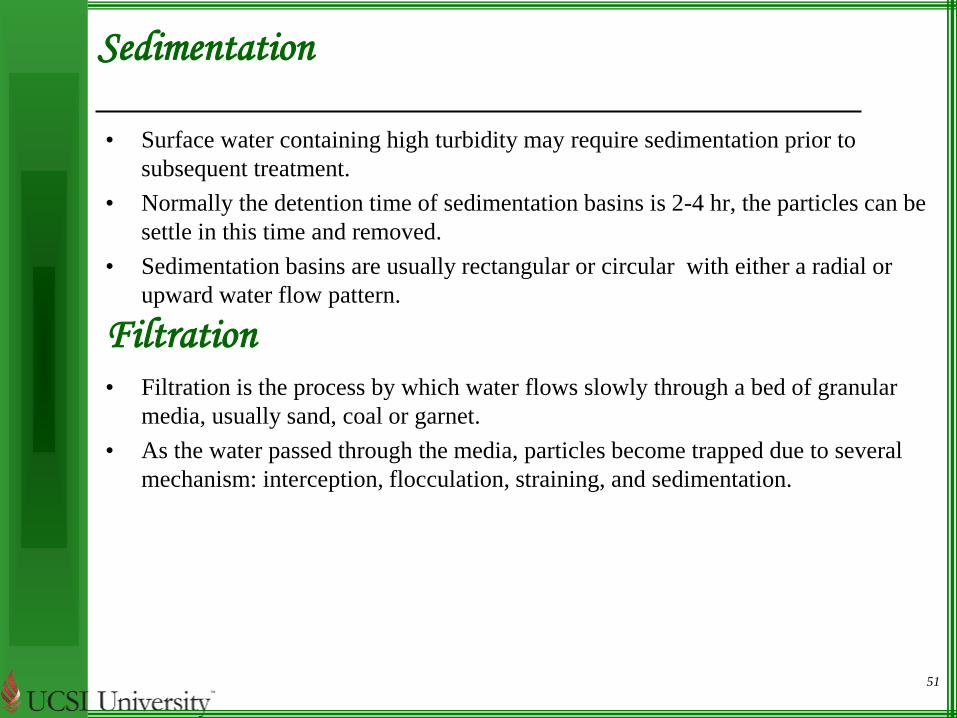
Sedimentation
• Surface water containing high turbidity may require sedimentation prior to
subsequent treatment.
• Normally the detention time of sedimentation basins is 2-4 hr, the particles can be
settle in this time and removed.
• Sedimentation basins are usually rectangular or circular with either a radial or
upward water flow pattern.
Filtration• Filtration is the process by which water flows slowly through a bed of granular
media, usually sand, coal or garnet.
• As the water passed through the media, particles become trapped due to several
mechanism: interception, flocculation, straining, and sedimentation.
52
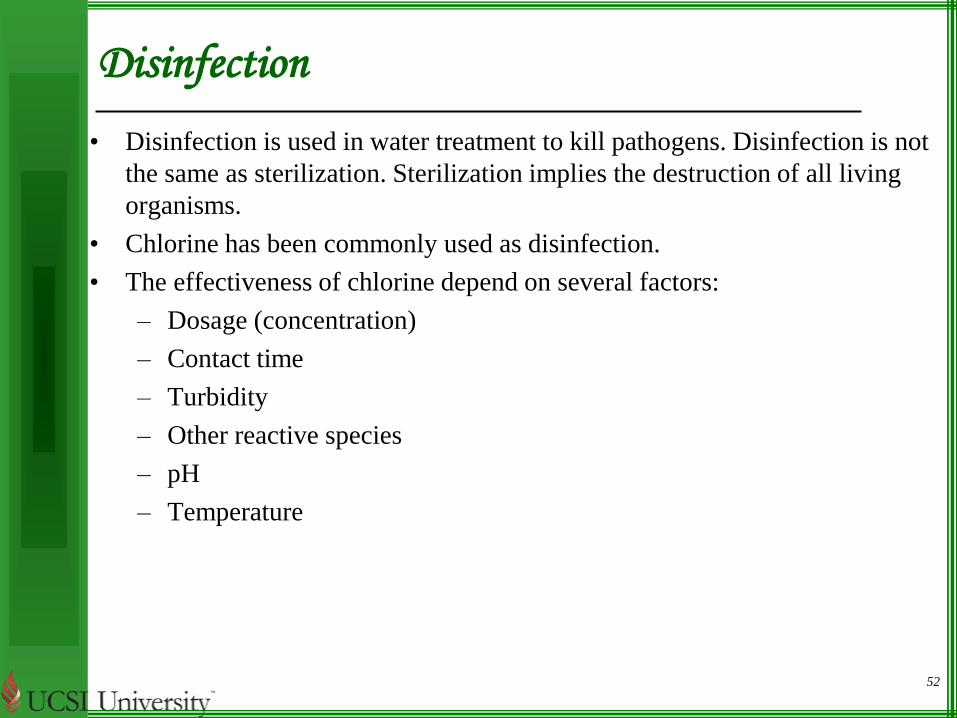
Disinfection
• Disinfection is used in water treatment to kill pathogens. Disinfection is not
the same as sterilization. Sterilization implies the destruction of all living
organisms.
• Chlorine has been commonly used as disinfection.
• The effectiveness of chlorine depend on several factors:
– Dosage (concentration)
– Contact time
– Turbidity
– Other reactive species
– pH
– Temperature
53
Related Documents