Acta Universitatis Cibiniensis Seria F Chemia 9(2006-1):7-19 7 Water-in-Oil Micro emulsion Promoted Thin Layer Chromatographic Separations of Phenol Compounds A. Mohammad 1* and I. A. Khan 1 Abstract The use of water-in-oil (w/o) micro emulsion as mobile phase in thin layer chromatography (TLC) to examine the migration behavior of phenol compounds is described. Twenty-one phenols were chromatographed using (w/o) micro emulsion systems consisting of sodium dodecyl sulphate (SDS) and cetyltrimethyl ammonium bromide (CTAB) with silica gel, alumina, cellulose and kieselguhr TLC plates. A (w/o) micro emulsion system comprising of SDS/pentanol/water/heptane (8g: 25ml: 8ml: 160ml)) was found most useful to separate phenol compounds from their multi component mixtures on silica gel layers. The chromatographic retention pattern of phenols was influenced by the type of co-surfactant, core-phase and surfactant present in micro emulsion. The effects of concentration of surfactant, the addition of electrolytes and complexing carboxylic acids in the microemulsion on separation selectivity of phenols were also examined. The limit of detection of some phenols was determined and the proposed method was applied to detect resorcinol, pyrogallol and α-napththol in spiked biological samples in order to establish the usefulness of micro emulsion systems as mobile phase. Keywords: Cetyltrimethyl ammonium bromide, Phenols, heptane, microemulsion pentanol, silica gel G, alumina, sodium dodecyl sulphate, thin layer plates. 1 Analytical Research Laboratory, Department of Applied Chemistry, Z.H. College of Engineering & Technology Aligarh Musl im University, Aligarh-202002, U .P., (India) * To whom the correspondence should be addressed.

Welcome message from author
This document is posted to help you gain knowledge. Please leave a comment to let me know what you think about it! Share it to your friends and learn new things together.
Transcript

Acta Universitatis Cibiniensis
Seria F Chemia 9(2006-1):7-19
7
Water-in-Oil Micro emulsion Promoted Thin Layer
Chromatographic Separations of Phenol Compounds
A. Mohammad1*
and I. A. Khan1
Abstract
The use of water-in-oil (w/o) micro emulsion as mobile phase in thin layer
chromatography (TLC) to examine the migration behavior of phenol compounds is
described. Twenty-one phenols were chromatographed using (w/o) micro emulsion
systems consisting of sodium dodecyl sulphate (SDS) and cetyltrimethyl ammonium
bromide (CTAB) with silica gel, alumina, cellulose and kieselguhr TLC plates. A (w/o)
micro emulsion system comprising of SDS/pentanol/water/heptane (8g: 25ml: 8ml:
160ml)) was found most useful to separate phenol compounds from their multi component
mixtures on silica gel layers. The chromatographic retention pattern of phenols was
influenced by the type of co-surfactant, core-phase and surfactant present in micro
emulsion. The effects of concentration of surfactant, the addition of electrolytes and
complexing carboxylic acids in the microemulsion on separation selectivity of phenols
were also examined. The limit of detection of some phenols was determined and the
proposed method was applied to detect resorcinol, pyrogallol and α-napththol in spiked
biological samples in order to establish the usefulness of micro emulsion systems as
mobile phase.
Keywords: Cetyltrimethyl ammonium bromide, Phenols, heptane, microemulsion pentanol, silica
gel G, alumina, sodium dodecyl sulphate, thin layer plates.
1Analytical Research Laboratory, Department of Applied Chemistry, Z.H. College of Engineering &
Technology Aligarh Musl im University, Aligarh-202002, U .P., (India)
* To whom the correspondence should be addressed.
A. Mohammad and I. A. Khan
8
I. Introduction
The urgency of rapid and inexpensive methods for the separation and identification
of phenols, which often pollute water bodies, has promoted the development of various
forms of chromatographic techniques for this purpose. Because of its simplicity, ease of
operation, high selectivity, reasonable resolving power and the possibility of simultaneous
analysis of a large number of samples, thin layer chromatography (TLC) has been the most
widely used analytical tool for the analysis of organic and inorganic substances (1-4). The
migration behavior of a substance in a chromatographic method is controlled by molecular
characteristics of the substance itself as well as by physical-chemical properties of the
chromatographic system. Therefore, one may, achieve chromatographic discrimination
within a group of substances by carefully optimizing the chromatographic conditions.
Though numerous mobile phases have been reported in literature (1, 3, 5-8) for the
separation of phenols using silica gel as the most preferred layer material, little effort has
been directed to utilize mobile phases based on aqueous micelle solution of surfactants (9).
Interestingly, none of the reported studies has examined the efficacy of micro emulsion as
eluant in TLC separation and identification of phenols.
Micelle eluants containing surfactant as one of the components has gained
popularity from the very early publication in liquid chromatography because of their
unique separations selectivity (10-15). However, micelle eluants being generally weak,
offer poor efficiency compared to traditional hydro-organic mobile phases, further
investigations (16, 17) suggested that the addition of low concentration of organic
modifiers to micelle mobile phases improves efficiency by reducing the adsorbed amount
of emulsifier (surfactant). This fact, ultimately translated into the formation of micro
emulsions which were used as, normal liquid chromatographic mobile phases by A.
Berthod (18, 19, 20) who examined the separation selectivity and efficiencies of water-in-
oil micro emulsion systems, with or without alcohol. His findings advocating the unique
selectivity along with excellent efficiencies with micro emulsion systems containing
medium chain length alcohol opened a new area for further research on the use of micro
emulsion eluants in normal-phase and reversed-phase liquid chromatography.
Micro emulsions are quaternary systems consisting of an oil (non-polar or of
moderate polarity), water, surfactant and co-surfactant which is generally a medium chain
length alcohol, amine or similar organic polar molecule (21, 22). These systems can be
produced by adding a co-surfactant into a coarse emulsion (water-surfactant-oil) up to the
clarity (23, 24). Micro emulsions are optically clear, transparent, thermodynamically stable
and surfactant-rich isotropic solutions. The order of droplet size (0.01- 0.1µ) of micro
emulsion differs from the size of macro emulsion (1.0-10µ). Micro emulsions are capable
to mix all ratios of oil and water into transparent phases with ultra low interfacial tensions
(25, 26) and the chemical structure of co-surfactant plays an important role in phase
behavior of micro emulsion. As a result of considerable studies during the past quarter
century, three types of micro emulsions such as (a) lower-phase or oil-in-water (o/w) micro
emulsion (oil micro droplets enclosed in a surfactant-co surfactant film and dispersed in
aqueous continuous phase), (b) upper-phase or water-in-oil (w/o) micro emulsion (water
phase dispersed as globules in the continuous oil phase) and (c) middle-phase or bi-

Acta Universitatis Cibiniensis
Seria F Chemia 9(2006-1):7-19
9
continuous (oil and water micro domains overlap in each other) have been well recognized
(27). Micro droplets in a micro emulsion provide an environment that is different from the
bulk solvent (28).
Whereas extensive data are available on the formation and physical-chemical
properties of micro emulsions (21, 29-32), the corresponding analytical studies on these
systems have been performed in much less detail (20). It was therefore considered
worthwhile to examine the possibility of using (w/o) micro emulsion, consisting of
SDS/pentanol/water/heptane as mobile phase in normal-phase TLC for rapid separation of
phenols using silica gel, alumina, keselguhr and cellulose as stationary phases. As a result,
simultaneous separation of α-naphthol (monohydroxy benzene), resorcinol (dihydroxy
benzene) and pyrogallol (trihydrroxy benzene) from their mixture has been achieved on
silica gel G layers.
II. Experimental
A TLC apparatus (Toshniwal, India) was used to prepare thin layer (0.25 mm) of
various adsorbents on 20x3cm glass plates. Glass jars (29x6cm) were used for the
development of TLC plates.
Chemicals and Reagents: SDS (BDH, India); CTAB, n-butanol, n-heptane, potassium
iodide, hexanol, potassium chloride, oxalic acid, tartaric acid, silica gel H,alumina,
kieselguhr and microcrystalline cellulose (CDH, India); silica gel G (E Merck, India); n-
hexane (s.d. fine Chem. Ltd., India); n-pentanol (Fluca AG, Switzerland) were used.
Phenols Studied: Aromatic phenols used in the present study include: phenol (PhI),
pyrogallol (Pol), phloroglucinol (PGL), o-nitrophenol (o-NPhl), m-nitrophenol (m-NPhl),
p-nitrophenol (p-NPhl), resorcinol (Rol), orcinol (001), picric acid (PcA), hydroquinone
(Hqn), o-cresol (o-Crol), m-cresol (m-Crol), p-cresol (p-Crol), vaniline (Vn), gallic acid
(Gla), α-naphthol (α-Nol), pyrocatechol (PCol),o-aminophenol (o-Aphl), m-aminophenol
(m-Aphl), p-aminophenol (p-Aphl), and m-hydroxyacetophenone (m-Han).
Test Solutions: The test solutions (1 %) of all phenols were prepared in methanol.
Detection: All phenols were detected by exposing TLC plates to iodine vapor in a closed
chamber and phenols as dark brown/yellow spots were visualized.
Chromatographic System: Following stationary and mobile phases were used:
Stationary phase:
S1 - Silica gel G
S2 - Alumina
S3 - Microcrystalline cellulose
S4 - Silica gel H
S5 - Kieselguhr.
Mobile Phase: The water-in-oil micro emulsion used as mobile phase was prepared at
30°C by titrating a coarse emulsion of n-heptane or n-hexane (160 ml), water or 0.01 M
aqueous solution of KI, KCI, oxalic acid or tartaric acid (8 ml) and SDS or CTAB (8 gm)
with n-pentanol, hexanol or butanol (25 ml). The various micro emulsion systems given
below were transparent, optically clear and stable at 30°C for several weeks.

A. Mohammad and I. A. Khan
10
M1 - SDS - water - heptane - pentanol (8g: 8ml: 160ml: 25ml)
M2 - CTAB - water – heptane - pentanol (8g: 8ml: 160ml: 25ml)
M3 - CTAB - water heptane - butanol (8g: 8ml: 160ml: 25ml)
M4 - SDS - water - heptane - butanol (8g: 8ml: 160ml: 25ml)
Ms - SDS - water - heptane - hexanol (8g: 8ml: 160ml: 25ml)
M6 - SDS - water - hexane - pentanol (8g: 8ml: 160ml: 25ml)
M7 - SDS - 0.01 M aqueous KI - heptane - pentanol (8g: 8ml: 160ml: 25ml)
Mg - SDS - 0.01 M aqueous KCI - heptane - pentanol (8g: 8ml: 160ml: 25ml)
M9 - SDS - 0.01 M aqueous oxalic acid - heptane - pentanol (8g: 8ml: 160ml: 25ml)
M10 - SDS - 0.01 M aqueous tartaric acid - heptane - pentanol (8g: 8ml: 160ml: 25ml)
Preparation of TLC plates: The TLC plates were prepared by mixing the sorbent with
de-mineralized water in 1:3 ratio (by weight) with constant shaking to obtain a
homogeneous slurry The resultant slurry was applied to clean glass plates with the help of
an applicator to give a 0.25mm thick layer. The plates were dried at room temperature and
activated at 100±5°C by heating in an electrically controlled oven for 1 h. The activated
plates were stored in closed chamber at room temperature (30° C) until used.
Procedure:
Chromatography: The activated plates were marked with two horizontal lines 2 and 12
cm from the base. The test solutions (10µL) of phenols (1%) were spotted separately on
the base line of the activated thin layer plates with the help of a micropipette. The spots
were allowed to air dry and the plates were developed in chosen mobile phase by one-
dimensional ascending technique in glass jar-s. The .solvent ascent was fixed to 10 cm
from the point of application in all cases. After development, TLC plates were dried at
room temperature. These plates were then exposed to iodine vapors for 10 min and then
the spots were visualized, the phenols show yellowish brown spots. The RF values (RF=
(RL +RT)/2] were calculated from RL (RF of leading front) and RT (RF of tailing front)
values of detected spots on TLC plates.
Identification of Pol, α-Nol and Rol from spiked blood tissue, stomach tissue and liver tissue: To separate and identify phenols in biological samples such as human blood, liver
and stomach, the samples were spiked with a mixture of Pol, α-Nol and Rol separately.
The TLC was performed as described above using 10µL sample of spiked samples. The
biological samples were prepared as follows.
(i) For Liver and Stomach Tissue: 10mg liver tissue was dipped in sufficient volume of
conc. H2SO4 and kept overnight. It was digested in glass flask after adding conc. HN03 till
the solution becomes clear. The contents were washed thrice with distilled water and then
25 ml of saturated ammonium oxalate was added. It was diluted with water to required
volume.
(ii) Blood: The sample was treated with a mixture of 10% solution of NaOH and sodium
tungstate and a little quantity of conc. H2SO4 was added to destroy the precipitate. The
contents were filtered and the filtrate was used for detection.
Limit of detection of some phenols were determined by loading different amounts of
phenols on TLC plates, developing the plates and detecting the spots. The method was
repeated with successive lowering of amounts of phenols until no spot was detected. The
lowest detectable amount of phenol on TLC plate was taken as the limit of detection. The
"

Acta Universitatis Cibiniensis
Seria F Chemia 9(2006-1):7-19
11
limit of dilution was determined using the expression:
Dilution limit = 1: (volume of test solution x l06) / [limit of detection (µg)]
III. Results and Discussions
The results of this study are presented in Figs.1-4 and Tables 1-3. From the results
depicted in Figs. l (a) and (b), separation possibilities for phenols are at lowest with
kieselguhr compared to other sorbent phases since almost all phenols show a tendency of
migrating with the mobile phase. Phenols producing compact spots (RL-RT ≤ 0.3) only
have been taken for plotting in Figure. The separation efficiency of various adsorbents,
considering the compactness of spots and detecting clarity was in the following order:
Silica gel G > Alumina = Silica gel H >Cellulose > Kieselguhr.
Fig. 1 (a) and (b) - Mobility of Phenols on Different Sorbent Layers with M1
a
b
A. Mohammad and I. A. Khan
12
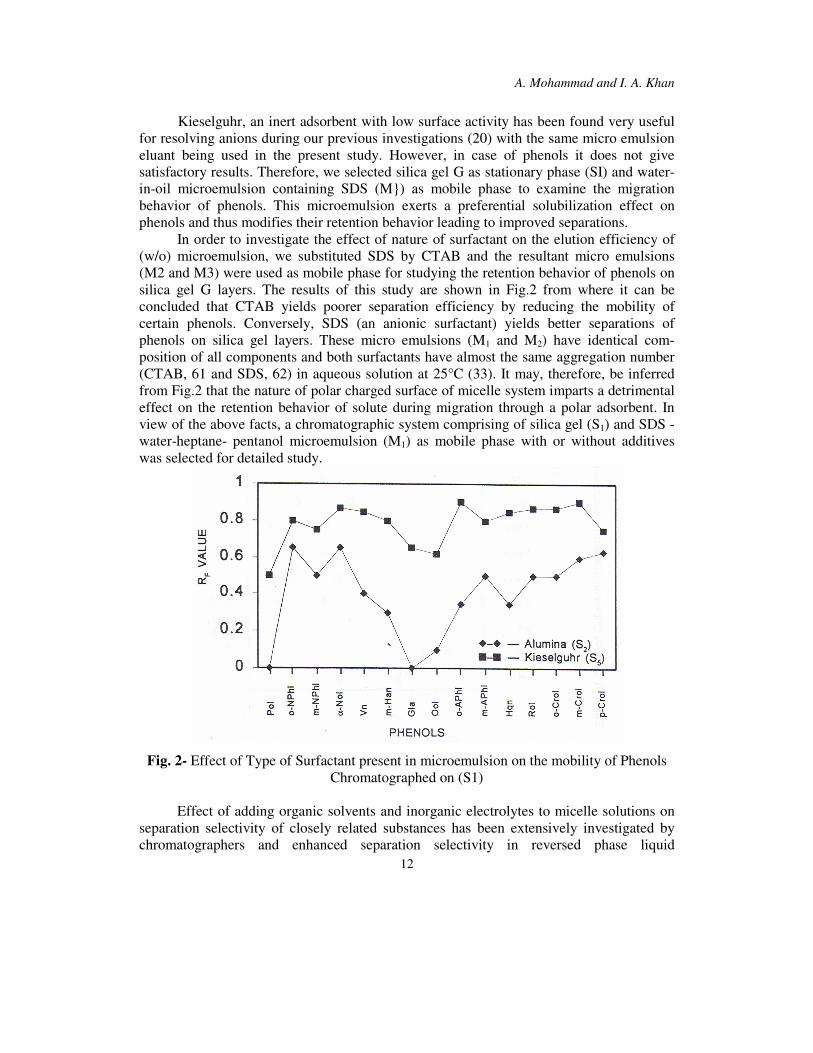
Kieselguhr, an inert adsorbent with low surface activity has been found very useful
for resolving anions during our previous investigations (20) with the same micro emulsion
eluant being used in the present study. However, in case of phenols it does not give
satisfactory results. Therefore, we selected silica gel G as stationary phase (SI) and water-
in-oil microemulsion containing SDS (M}) as mobile phase to examine the migration
behavior of phenols. This microemulsion exerts a preferential solubilization effect on
phenols and thus modifies their retention behavior leading to improved separations.
In order to investigate the effect of nature of surfactant on the elution efficiency of
(w/o) microemulsion, we substituted SDS by CTAB and the resultant micro emulsions
(M2 and M3) were used as mobile phase for studying the retention behavior of phenols on
silica gel G layers. The results of this study are shown in Fig.2 from where it can be
concluded that CTAB yields poorer separation efficiency by reducing the mobility of
certain phenols. Conversely, SDS (an anionic surfactant) yields better separations of
phenols on silica gel layers. These micro emulsions (M1 and M2) have identical com-
position of all components and both surfactants have almost the same aggregation number
(CTAB, 61 and SDS, 62) in aqueous solution at 25°C (33). It may, therefore, be inferred
from Fig.2 that the nature of polar charged surface of micelle system imparts a detrimental
effect on the retention behavior of solute during migration through a polar adsorbent. In
view of the above facts, a chromatographic system comprising of silica gel (S1) and SDS -
water-heptane- pentanol microemulsion (M1) as mobile phase with or without additives
was selected for detailed study.
Fig. 2- Effect of Type of Surfactant present in microemulsion on the mobility of Phenols
Chromatographed on (S1)
Effect of adding organic solvents and inorganic electrolytes to micelle solutions on
separation selectivity of closely related substances has been extensively investigated by
chromatographers and enhanced separation selectivity in reversed phase liquid

Acta Universitatis Cibiniensis
Seria F Chemia 9(2006-1):7-19
13
chromatography was reported (15). Considering microemulsion as daughter system of a
micelle system, we altered the microenvironment of (w/o) microemulsion (M1) by
substituting (a) co surfactant, pentanol with less polar alcohol, butanol (M4) and more polar
alcohol, hexanol (M5), (b) core-phase, heptane with hexane (M6) and (c) water with 0.01M
KI (M7), KCI (M8), oxalic acid (M9) or tartaric acid (M10).
Fig. 3 - (a) Variation in Mobility of phenols on Silica gel G when Pentanol (M1) is
replaced by Butanol (M4) is Microemulsion
-(b) Variation in Mobility of phenols on Silica gel G when Pentanol (M1) is Replaced by
Hexanol (M5) is Microemulsion
The retention behavior of phenols on S1 was examined using M4-M10 microemulsion
systems as mobile phases with the hope of obtaining some new separations of phenols as a
a
b

A. Mohammad and I. A. Khan
14
result of altered solute-microemulsion and solute-stationary phase interactions. The results
have been summarized in Figs. 3a and b and Table 1. In Fig. 3 the ∆RF; the difference in
RF values [∆RF = (mean RF of phenol in M1 - mean RF of the same phenol in M4 (Fig. 3a)
or in M5 (Fig.3b)] have been plotted. The positive and negative ∆RF values of phenols
(Fig.3a and b) are indicative of significant effect of co-surfactant structure on the mobility
of phenols. The positive ∆RF values (Fig.3a) show that almost all phenols move faster with
M1 compared to M4 whereas the negative ∆RF values for some phenols (Fig. 3b) indicate
their higher mobility with M5 compared to M4. The comparative inspection of Figs. 3a and
b reveal that the magnitude of positive ∆RF values is higher in the case of butanol
containing microemulsion (M4) compared to hexanol containing microemulsion (M5). The
mobility of phenols was, generally, found to increases with microemulsion systems
containing different type of alcohols in the order butanol < pentanol < hexanol.
Table 1 - Effect of Electrolyte and Carboxylic Acid Additives in Microemulsion on the
Mobility of Phenols on Silica Layer
Mobile Phase Phenols
M1 M7 M8 M9 M10
Ph1 0.50 0.55 0.45 0.42 0.50
PGL 0.20 0.30 0.20 0.32 0.37
Pol 0.0 0.0 0.12 0.00 0.10
o-NPhl 0.54 0.58 0.70 0.70 0.80
m-NPhl 0.65 0.72 0.70 0.58 0.70
p-NPhl 0.65 0.68 0.70 0.70 0.70
α-Nol 0.72 0.70 0.66 0.70 0.68
Vn 0.63 0.56 0.50 0.46 0.48
PCol 0.55 0.40 0.45 0.32T 0.35T
m-Han 0.64 0.65 0.50 0.47 0.58
Gla 0.0 0.00 0.15 0.00 0.10
Oo1 0.32 0.30T 0.28 0.30T 0.25
o-Aphl 0.42 0.50 0.50 0.47 0.43
m-Aphl 0.35 0.43 0.40 0.40 0.30
p-Aphl 0.20 0.22 0.20 0.20 0.24
PcA 0.28 0.20 0.40 0.20 0.30T
Hqn 0.45 0.48 0.43 0.48 0.50
Rol 0.52 0.48 0.50 0.50 0.52
o-Crol 0.65 0.63 0.72 0.65 0.68
m-Crol 0.63 0.70 0.80 0.68 0.65
p-Crol 0.55 0.67 0.80 0.54 0.65
T - Taile spot (RL - RT > 0.30)
It is also evident from Fig.4 [plot of ∆RF (∆RF = mean RF with M1 - mean RF with
M6) Vs phenols], that the mobility of phenols is strongly influenced by the nature of core-
phase (i.e. hydrocarbon solvent) of the microemulsion system. The positive ∆RF values of
most of the phenols show that phenols are more readily solubilized with microemulsion

Acta Universitatis Cibiniensis
Seria F Chemia 9(2006-1):7-19
15
containing pentane compared to corresponding microemulsion consisting of hexane. The
most effected phenols with ∆RF value of ±0.2 include pholoroglucinol, o-nitrophenol,
vaniline and m-hydroxyacetophenone. The o-cresol (with positive ∆RF value) shows just
opposite retention behavior to that of p-cresol (negative ∆RF) which migrates faster in
hexane containing microemulsion systems.
Fig. 4 -Variation in Mobility of phenols on Silica gel G When Heptane (M1) is
replaced by Hexane (M6) is microemulsion
The water in M1 was substituted by 0.01 M aqueous solution of inorganic
electrolytes KCI and KI and weak carboxylic acids (oxalic and tartaric acids) to prepare
new microemulsion systems which were transparent and stable at room temperature. The
entry of electrolytes into microemulsion increases the ionic strength of the system whereas
the presence of carboxylic acids lowers the pH of the microemulsion system. The RF
values obtained with these systems are listed in Table 1. It is clear from this Table that
these additives influence the selectivity of phenols (though to little extent) by disturbing
the intricate balance between repulsive and attractive intermolecular and inter-aggregate
forces of complicated microemulsion system. Carboxylic acid being a complex agent
deteriorates the resolution of certain phenols by introducing the formation of tailed spots
(Table 1). The presence of KI or KCI does not exert any adverse effect on the separation of
phenols. It is, therefore, not surprising that phenols can be selectively separated from their
two-or-three component mixtures on silica or alumina layers using microemulsion systems.
The RF values of phenols show little variation from their individual RF value when
chromatographed as mixture. A few separations achieved experimentally have been.
tabulated in Table 2. The detection and dilution limits of some phenols presented in Table
3 indicate that the proposed method is highly sensitive for detecting phenols at trace level.

A. Mohammad and I. A. Khan
16
Resorcinol, as low as 0.5µg, can be easily detected on silica layer. The excellent sensitivity
may be attributed to some sort of pre-concentration effect of microemulsion.
Table 2 -Separations Achieved Experimentally on Silica gel (SI) and Alumina (S2) Layers
Developed with Microemulsion Systems
Stationary
Phase
Mobile Phase Separation (RF values)
S1 M1 Gal (0.07) - PCol (0.50)
Gal (0.07) - Vn (0.40)
PcA (0.20) - α-Nol (0.68)
PcA (0.22) - p-NPhl (0.70)
Gla (0.07) - p-NPhl (0.67)
Gla (0.10) - Rol (0.55)
Pol (0.10) - Rol (0.52)
Pol (0.09) - PCol (0.57)
Pol (0.07) - Rol (0.50) - α-Nol (0.74)
S2 M1 Pol (0.0) - p-NPhl (0.35)
Pol (0.0) - α.-Nol (0.65)
Gla (0.0) - p-NPhl (0.35)
Gla (0.0) - α.-Nol (0.75)
Rol (0.10) - α-No I (0.55)
Gla (0.06) - PcA (0.35)
Pol (0.0) - PcA (0.34)
Pol (0.0) - o-NPhl (0.50)
Pol (0.0) - Rol (0.35) - α-Nol (0.75)
Pol (0.0 - p-NPhl (0.42) - α-Nol (0.75)
S1 M2 Pol (0.07) - α-Nol (0.45)
Gla (0.0) - Rol (0.32)
Pol (0.10) - PCol (0.45)
Pol (0.06) - Rol (0.41)
Gla (0.15) - PCol (0.44)
Pol (0.10) - Vn (0.48)
S2 M2 PGI (0.10) - p-NPhl (0.45)
Gla (0.0) - m-NPhl (0.45)
Pol (0.0) - m-NPhl (0.45)
PGL (0.07) - α-Nol (0.62)
Gla (0.0) - α-Nol (0.61)
Gla (0.0) - Ool (0.57) - α-Nol (0.67)
Pol (0.0 - α-Nol (0.68)
S1 M4 Pol (0.05) - p-NPhl (0.65)
Gla (0.10) - pNPhl (0.65)
Gla (0.10) - α-Nol (0.81)
Pol (0.10) - α-Nol (0.78)

Acta Universitatis Cibiniensis
Seria F Chemia 9(2006-1):7-19
17
Po I (0.10) - m-NPhl (0.79)
Gla (0.07) - m-NPhl (0.80)
Gla (0.05) - PcA (0.39) - m-NPhl (0.74)
S2 M4 Pol (0.0) - m-NPhl (0.47)
Pol (0.0) - p-NPhl (0.40)
Pol (0.0) - α-Nol (0.75)
p-NPhl (0.40) - α-Nol (0.69)
Gla (0.0) - m-NPhl (0.42)
Rol (0.35) - α-No I (0.72)
PcA (0.27) - α-Nol (0.75)
Hqn (0.28) - α-Nol (0.75)
PCol (0.30) - α-Nol (0.70)
Pol (0.0) - o-NPhl (0.52)
Table 3 - Detection and Dilution Limits of Some Phenols Achieved on Silica gel G Layers
Developed with M1
Phenols Lower Limit of
Detection (µg)
Dilution Limit*
Pol 1.00 1 : 3.00 x 10⁴
α-Nol 0.66 1 : 3.03 x 10⁴
Ool 0.60 1 : 5.00 x 10⁴
Rol 0.50 1 : 4.00 x 10⁴
*Dilution limit = 1 : (Volume of test solution x 106) / [Limit of detection (µg)]
IV. Conclusions
The proposed method was applied to detect pol, α-Nol and Rol from their mixture in
spiked samples of human liver, stomach and blood tissue with preliminary separation on
silica gel layer. Pol (RF ~ 0.0), Rol (RF ~ 0.49) and α-Nol (RF ~ 0.70)) were clearly
separated and detected in a sample of spiked liver tissue. However, in spiked stomach and
blood tissue samples we were able to detect only Pol (RF ~ 0.0) and Rol (RF ~ 0.5).
Acknowledgement:
The authors are thankful to Prof. H.S. Rathore Chairman, Department of Applied
Chemistry, Aligarh Muslim University, Aligarh, India for providing research facilities.
V. References
1. Sherma, J., Fried, B. (Eds.), Handbook of Thin Layer Chromatography, Marcel
Dekker, New York, 2003
2. Mohammad, A., Ajmal, M., Anwar, S., Iraqi, E., J. of Planar Chromatogr. Mod.
TLC. Vol. 9, 1996, 318
3. Sherma, J., J. Anal. Chem; 1998, 70(12), 7R ().

A. Mohammad and I. A. Khan
18
4. Kirchner, J. C., in Thin Layer Chromatography Quantitative, Environmental and
Clinical Applications, Touehstone, J.C., Rogers D. (Eds.), Wiley Interscience, New York,
1980 5. Wardas, W., Pyka, A., J. Planar Chromatogr.-Mod. TLC,1992, 5,471
6. Dzido, H.T., Polak, B., J. PlanarChromatogr.-Mod. TLC, 1993, 6, 378 ().
7. Baranowska, I., Skotniczna, A., Chromatographia, 1994, 39, 564 ().
8. Garcia–March, F. J., Anton-Fos, G. M., Perez-Gimenez, F., Salabert-Salvador, M.T.,
Cercosdel-Pozo, R.A., de Julian-Ortiz, J. V., J. Chromatogr., 1996, A 719, 45
9. Mohammad, A., Anwar, S., Iraqi, E., Khan, L.A., Acta Chromatographica, 2000,10,
195
10. Armstrong, D. W., Terrill, R.Q., Anal. Chem., 1979, 51, 2160
11. Armstrong, D.W., Bui, K.H., J. Liq. Chromatogr., 1982, 15, 1043
12. Armstrong, D.W., Stine G.Y., J. Am. Chem. Soc., 1983 ,105,2962
13. Berry, J.P., Weber, W.G., J. Chromatogr. Sci., 1987, 25,307
14. Monge, M.C., Marina, M.L., Saz, J.M., J. Liq. Chromatogr. Relat. Technol., 1998,
21(14), 2130
15. Rapado-Martinez, I, Garcia-Alverez-Coque, M.C., Villanueva-Camanog, R.M., J.
Chromatogr., 1997, A. 756(2), 221
16. Dorsey, J.G., De Echegaray, M.T., Landy, J.S., Anal. Chem., 1983, 55, 924
17. Kha1edi, M.G., Strasters, J.K., Rodgers,A.H., Breyer, E.D., Anal. Chem., 1990, 62,
130
18. Berthod, A., De Carvalho, M., Anal. Chem., 1992, 64, 2267
19. Berthod, A, Nicolasarid, O., Porthault, M., Anal. Chem., 1990, 62, 1402
20. Mohammad, A, Tiwari, S., Chahar, J.P.S., Kumar, S., J. Am. Oil Chem. Soc., 1995,
72 (12), 1533,
21. Prince, L.M., Micro emulsions: Theory and Practice, Academic Press, New York,
1977
22. Bellocq, A.M., Biais, J., Bothorel, P., Clin, B., Fourche, G., Lalanne, P., Lemaire, B.,
Lemanceau, B., Roux, D., Adv. Colloid. Interface Sci, 1984, 20, 167
23. Rosen, M. J., Surfactants and Interfacial Phenomena, Wiley Interscience, New York,
1989 24. Rosano, H.L., Clausse, M. (Eds.), Micro emulsions Systems, Surfactant Science
Series 24, Marcel Dekker, New York, 1989
25. Widom, B., J. Chem. Phys., 1986, 84 (12), 6943
26. Shah, D.O., Macro and Micro emulsions: Theory and Applications, ACS Monographs
No. 272, American Chemical Society, Washington DC, 1985
27. Shah, D.O. (ed.), Micelles, Micro emulsions and Monolayers, Science and
Technology, Marcel Dekker, New York, 1998
28. Mackay, R.A., Letts, K., Jones, C. in, Micellization, Solusilization and Micro
emulsions, K.L. Mittal (ed.), Plenum Press, New York, 1977
29. Singh, H.N., Kumar, J. Surface Sci. Technol., 1989, 5(2), 143
30. Scriven, L.E., Nature, 1976, 263, 123
31. Lang, J., Rueff, R., Dinh-Cao, M., Zana, R., J. Colloid Interface Sci Press, 1984, 101,
184

Acta Universitatis Cibiniensis
Seria F Chemia 9(2006-1):7-19
19
32. Kumar, S., Singh, H.N., Colloids Surfaces, 1990, 44, 17
33. Khaledi, M. G., Trends Anal. Chem; 1988, 7, 293
Related Documents
![ars.els-cdn.com · Web viewGradient elution in normal phase HPLC separations separates chiral compounds within a shorter time without impairing the chromatographic resolution [3].](https://static.cupdf.com/doc/110x72/5fdd537ec834a111a82aa411/arsels-cdncom-web-view-gradient-elution-in-normal-phase-hplc-separations-separates.jpg)