8000C - 1 Revision 3 March 2003 METHOD 8000C DETERMINATIVE CHROMATOGRAPHIC SEPARATIONS 1.0 SCOPE AND APPLICATION 1.1 Method 8000 is not a determinative method but instead provides guidance on analytical chromatography and describes calibration and quality control requirements that are common to all SW-846 chromatographic methods. However, more specific quality control requirements that are provided in the applicable determinative method will supersede those noted in Method 8000. Apply Method 8000 in conjunction with all SW-846 determinative chromatographic methods. The methods include, but are not limited to, the following: Method Number Analytes Chromatographic Technique (see Sec. 1.5) Detector 7580 White phosphorus (P 4 ) GC, capillary column NPD 8011 EDB, DBCP GC, capillary column ECD 8015 Nonhalogenated volatiles GC, packed & capillary column FID 8021 Volatiles GC, capillary column PID, ELCD 8031 Acrylonitrile GC, packed column NPD 8032 Acrylamide GC, packed column ECD 8033 Acetonitrile GC, capillary column NPD 8041 Phenols Underivatized or derivatized, GC, capillary column FID, ECD 8061 Phthalates GC, capillary column ECD 8070 Nitrosamines GC, packed column NPD, ELCD, TED 8081 Organochlorine pesticides GC, capillary column ECD, ELCD 8082 Polychlorinated biphenyls GC, capillary column ECD, ELCD 8091 Nitroaromatics and cyclic ketones GC, capillary column ECD 8100 PAHs GC, packed & capillary column FID 8111 Haloethers GC, capillary column ECD

Welcome message from author
This document is posted to help you gain knowledge. Please leave a comment to let me know what you think about it! Share it to your friends and learn new things together.
Transcript

8000C - 1 Revision 3March 2003
METHOD 8000C
DETERMINATIVE CHROMATOGRAPHIC SEPARATIONS
1.0 SCOPE AND APPLICATION
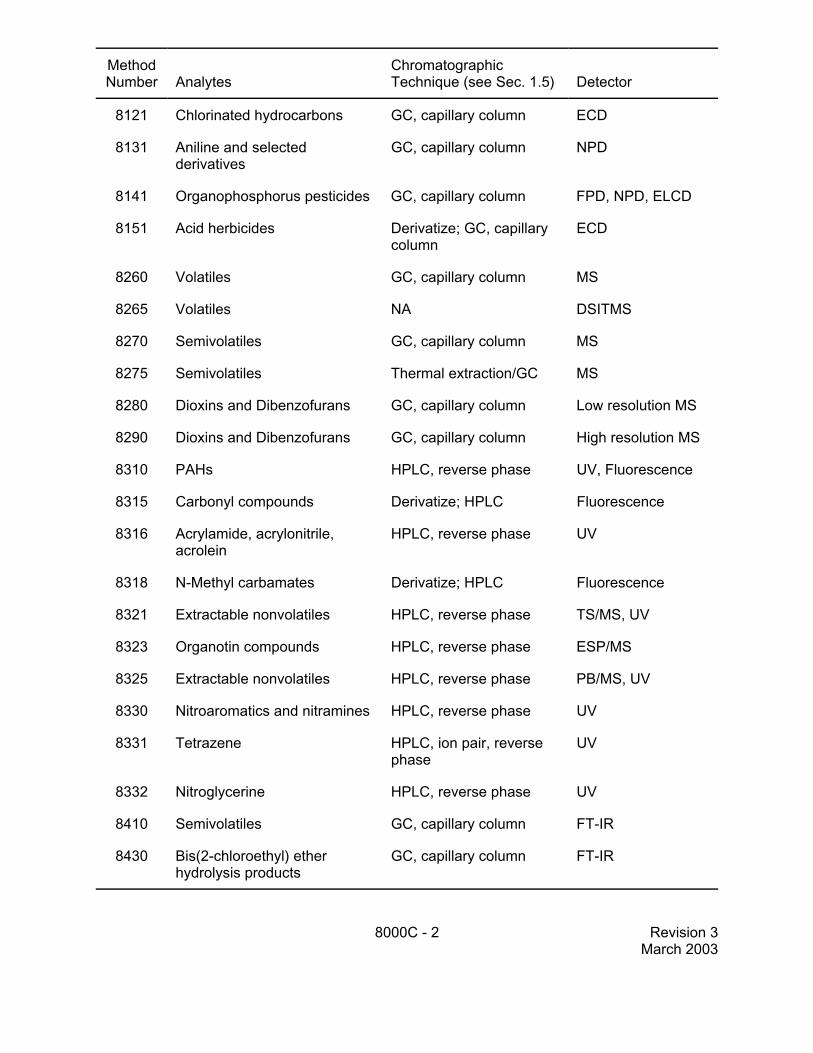
1.1 Method 8000 is not a determinative method but instead provides guidance on analyticalchromatography and describes calibration and quality control requirements that are common to allSW-846 chromatographic methods. However, more specific quality control requirements that areprovided in the applicable determinative method will supersede those noted in Method 8000. ApplyMethod 8000 in conjunction with all SW-846 determinative chromatographic methods. Themethods include, but are not limited to, the following:
MethodNumber Analytes
ChromatographicTechnique (see Sec. 1.5) Detector
7580 White phosphorus (P4) GC, capillary column NPD
8011 EDB, DBCP GC, capillary column ECD
8015 Nonhalogenated volatiles GC, packed & capillarycolumn
FID
8021 Volatiles GC, capillary column PID, ELCD
8031 Acrylonitrile GC, packed column NPD
8032 Acrylamide GC, packed column ECD
8033 Acetonitrile GC, capillary column NPD
8041 Phenols Underivatized orderivatized, GC, capillarycolumn
FID, ECD
8061 Phthalates GC, capillary column ECD
8070 Nitrosamines GC, packed column NPD, ELCD, TED
8081 Organochlorine pesticides GC, capillary column ECD, ELCD
8082 Polychlorinated biphenyls GC, capillary column ECD, ELCD
8091 Nitroaromatics and cyclicketones
GC, capillary column ECD
8100 PAHs GC, packed & capillarycolumn
FID
8111 Haloethers GC, capillary column ECD
MethodNumber Analytes
ChromatographicTechnique (see Sec. 1.5) Detector
8000C - 2 Revision 3March 2003
8121 Chlorinated hydrocarbons GC, capillary column ECD
8131 Aniline and selectedderivatives
GC, capillary column NPD
8141 Organophosphorus pesticides GC, capillary column FPD, NPD, ELCD
8151 Acid herbicides Derivatize; GC, capillarycolumn
ECD
8260 Volatiles GC, capillary column MS
8265 Volatiles NA DSITMS
8270 Semivolatiles GC, capillary column MS
8275 Semivolatiles Thermal extraction/GC MS
8280 Dioxins and Dibenzofurans GC, capillary column Low resolution MS
8290 Dioxins and Dibenzofurans GC, capillary column High resolution MS
8310 PAHs HPLC, reverse phase UV, Fluorescence
8315 Carbonyl compounds Derivatize; HPLC Fluorescence
8316 Acrylamide, acrylonitrile,acrolein
HPLC, reverse phase UV
8318 N-Methyl carbamates Derivatize; HPLC Fluorescence
8321 Extractable nonvolatiles HPLC, reverse phase TS/MS, UV
8323 Organotin compounds HPLC, reverse phase ESP/MS
8325 Extractable nonvolatiles HPLC, reverse phase PB/MS, UV
8330 Nitroaromatics and nitramines HPLC, reverse phase UV
8331 Tetrazene HPLC, ion pair, reversephase
UV
8332 Nitroglycerine HPLC, reverse phase UV
8410 Semivolatiles GC, capillary column FT-IR
8430 Bis(2-chloroethyl) etherhydrolysis products
GC, capillary column FT-IR

8000C - 3 Revision 3March 2003
DBCP = DibromochloropropaneDSITMS = Direct sampling ion trap mass spectrometryECD = Electron capture detectorEDB = Ethylene dibromideELCD = Electrolytic conductivity detectorFID = Flame ionization detectorFPD = Flame photometric detectorFT-IR = Fourier transform-infraredGC = Gas chromatographyHPLC = High performance liquid chromatography
MS = Mass spectrometryNPD = Nitrogen/phosphorous detectorNA = Not applicablePAHs = Polynuclear aromatic hydrocarbonsPB/MS = Particle beam mass spectrometryPID = Photoionization detectorTED = Thermionic emission detectorTS/MS = Thermospray mass spectrometryUV = Ultraviolet
1.2 Analytical chromatography is used to separate target analytes from co-extractedinterferences in samples. Chromatographic methods can be divided into two major categories: gaschromatography (GC) and high performance liquid chromatography (HPLC).
1.2.1 Gas chromatography (more properly called gas-liquid chromatography) is theseparation technique of choice for organic compounds which can be volatilized without beingdecomposed or chemically rearranged.
1.2.2 High performance liquid chromatography (HPLC) is a separation techniqueuseful for semivolatile and nonvolatile chemicals or for analytes that decompose uponheating. Successful liquid chromatographic separation requires that the analyte(s) of interestbe soluble in the solvent(s) selected for use as the mobile phase. Because the solvents aredelivered under pressure, the technique was originally designated as high pressure liquidchromatography, but now is commonly referred to as high performance liquidchromatography.
1.3 All chromatographic processes achieve separation by passing a mobile phase over astationary phase. Constituents in a mixture are separated because they partition differentlybetween the mobile and stationary phases and thus have different retention times. Compoundsthat interact strongly with the stationary phase elute slowly (i.e., long retention time), whilecompounds that remain in the mobile phase elute quickly (i.e., short retention time).
1.3.1 The mobile phase for GC is an inert gas, usually helium, and the stationaryphase is generally a silicone oil or similar material.
1.3.2 In "normal phase" HPLC, the mobile phase is less polar than the stationaryphase. In "reverse phase" HPLC, the converse is true. Reverse phase HPLC is thetechnique of choice for environmental and waste analyses of non-volatile organic targetanalytes.
1.4 A number of specific GC and LC techniques are used for environmental and wasteanalyses. The specific techniques are distinguished by the chromatographic hardware or by thechemical mechanisms used to achieve separations.
1.4.1 GC methods, including those in SW-846, can be categorized on the basis of thechromatographic columns employed.
1.4.1.1 Capillary columns are typically made from open tubular glass capillarycolumns that are 15 - 100 m long with a 0.2 - 0.75 mm ID, and coated with a liquidphase. Most capillary columns are now made of fused silica, although glass columns

8000C - 4 Revision 3March 2003
are still sold for the analysis of volatiles. Capillary columns are inherently more efficientthan packed columns and have replaced packed columns for most SW-846 applications.
1.4.1.2 Packed columns are typically made from glass or stainless steel tubingand generally are 1.5 - 3 m long with a 2 - 4 mm ID, and filled with small particles(60-100 mesh diatomaceous earth or carbon) coated with a liquid phase.
1.4.2 SW-846 HPLC methods are categorized on the basis of the mechanism ofseparation.
1.4.2.1 Partition chromatography is the basis of reverse phase HPLCseparations. Analytes are separated on a hydrophobic column using a polar mobilephase pumped at high pressure (800 - 4000 psi) through a stainless steel column 10 -25 cm long with a 2 - 4 mm ID and packed with 3 - 10 µm silica or divinylbenzene-styrene particles.
1.4.2.2 Ion exchange chromatography is used to separate ionic species.
1.5 SW-846 methods describe columns and conditions that have been demonstrated toprovide optimum separation of all or most target analytes listed in that specific procedure. Mostoften, those columns were the ones used by EPA during method development and testing.Analysts may change those columns and conditions, provided that they demonstrate performancefor the analytes of interest that is appropriate for the intended application. This is especially truewhen limited groups of analytes are to be monitored (i.e., if only a subset of the list of targetanalytes in a method are required, then the chromatographic conditions and columns may beoptimized for those analytes).
1.5.1 Chromatographic performance is demonstrated by the resolution of standardsand the ability to model the response of the detector during calibration, and by the sensitivity,accuracy, precision, frequency of false positives, and frequency of false negatives duringanalysis. The laboratory must demonstrate that any chromatographic procedure that it usesprovides performance that satisfies the analytical requirements of the specific application forwhich it is being used. Such demonstrations should be performed using the proceduresoutlined in Secs. 9.2 to 9.8 of this method and those in Chapter One.
1.5.2 In addition, laboratories must be cautious whenever the use of two dissimilarcolumns is included in a method for confirmation of compound identification. For instance,a DB-5 column generally cannot be used for confirmation of results obtained using an SPB-5column because the stationary phases are not sufficiently dissimilar and the changes inelution order (if any) will not provide adequate confirmation.
1.6 When gas chromatographic conditions are changed, retention times and analyticalseparations are often affected. For example, increasing the GC oven temperature changes the rateof partitioning between the mobile and stationary phases, leading to shorter retention times. GCretention times can also be changed by selecting a column with a different length, stationary-phaseloading (i.e., capillary film thickness or percent loading for packed columns), or alternate liquidphase. As a result, two critical aspects of any SW-846 chromatographic method are thedetermination and/or verification of retention times and analyte separation.
1.7 HPLC retention times and analytical separations are also affected by changes in themobile and stationary phases. The HPLC mobile phase is easily changed by adjusting the

8000C - 5 Revision 3March 2003
composition of the solvent mixture being pumped through the column. In reverse phase HPLC,increasing the ratio of methanol (or acetonitrile) to water shortens retention times. HPLC retentiontimes can also be changed by selecting a column with (1) a different length, (2) an alternate bondedphase, or (3) a different particle size (e.g., smaller particles generally increase column resolution).SW-846 methods provide conditions that have been demonstrated to provide good HPLCseparations using specific instruments to analyze a limited number of samples. Analysts(particularly those using HPLC/MS) may need to tailor the chromatographic conditions listed in themethod for their specific application and/or instrument. HPLC methods are particularly sensitiveto small changes in chromatographic conditions, including temperature. HPLC column temperaturecontrol ovens should be used to maintain constant retention times since ambient laboratorytemperatures often fluctuate throughout the course of a day.
1.8 Chromatographic methods can be used to produce data of appropriate quality for theanalysis of environmental and waste samples. However, data quality can be greatly enhancedwhen the analyst understands both the intended use of the results and the limitations of the specificanalytical procedures being employed. Therefore, these methods are recommended for use onlyby, or under the close supervision of, experienced analysts. Many difficulties observed in theperformance of SW-846 methods for the analysis of RCRA wastes can be attributed to the lack ofskill and training of the analyst.
1.8.1 Methods using selective (e.g., PID, NPD, ELCD) or non-selective (e.g., FID)detectors may present serious difficulties when used for site investigations, including co-elution of target analytes, false negatives due to retention time shifts, and false positives andquantitation errors due to co-eluting non-target sample components.
1.8.2 In contrast, GC methods employing selective or non-selective detectors may beappropriate for remediation activities where the analytes of concern are known, of limitednumber, and of significantly greater concentration than potentially interfering materials.
1.8.3 If the site is not well characterized, and especially if large numbers of targetanalytes are of concern, analysis by GC/MS or HPLC/MS may be more appropriate.
1.9 Each of the chromatographic methods includes a list of the compounds that arerecommended given the procedures as outlined in each method. The lists in some methods arelengthy and it will not be practical or appropriate to attempt to determine all the analytessimultaneously. Such analyte lists do not imply a regulatory requirement for the analysis of any orall of the compounds, but rather, indicate the method(s) which may be applicable to those analytes.
1.10 Analysts should consult the disclaimer statement at the front of the manual and theinformation in Chapter Two for guidance on the intended flexibility in the choice of methods,apparatus, materials, reagents, and supplies, and on the responsibilities of the analyst fordemonstrating that the techniques employed are appropriate for the analytes of interest, in thematrix of interest, and at the levels of concern.
In addition, analysts and data users are advised that, except where explicitly required in aregulation, the use of SW-846 methods is not mandatory in response to Federal testingrequirements. The information contained in this method is provided by EPA as guidance to be usedby the analyst and the regulated community in making judgments necessary to generate results thatmeet the data quality requirements for the intended application.
8000C - 6 Revision 3March 2003
1.11 This method is restricted to use by or under the supervision of analysts experienced inthe use of gas or high performance liquid chromatographs and skilled in the interpretation ofchromatograms. Each analyst must demonstrate the ability to generate an acceptable initialdemonstration of capability (IDC) along with acceptable results according to methodrecommendations and stated project data quality objectives. This method is intended to be asupplement to but it is NOT intended to be a substitute for formal training of an analyst in the basicprinciples of gas or high performance liquid chromatography.
2.0 SUMMARY OF METHOD
Method 8000 describes general considerations in achieving chromatographic separations andperforming calibrations. Method 8000 is to be used in conjunction with all SW-846 determinativechromatographic methods, including, but not limited to, each method listed in Sec. 1.1. Each ofthese chromatographic methods recommends appropriate procedures for sample preparation,extraction, cleanup, and/or derivatization. Consult the specific procedures for additional informationon these crucial steps in the analytical process.
2.1 Sec. 4.2 of this method provides general guidance on minimizing contamination,including cross-contamination between samples. Sample screening procedures are stronglyrecommended, and discussed in Sec. 4.3.
2.2 Before any sample or blank is introduced into a chromatographic system, theappropriate resolution criteria and calibration procedure(s) described in Method 8000 or otherappropriate systematic planning document must be satisfied (see Secs. 4.4 and 9.3).
2.3 Secs. 4.5 and 4.6 provide information on the effects of chromatographic interferences.
2.4 Sec 6.0 of this method contains generalized specifications for the components of bothGC and HPLC systems used in SW-846 analyses.
2.5 Calibration of the analytical system is another critical step in the generation of qualitydata. Sec. 11.5 discusses specific procedures and calculations for both linear and non-linearcalibration relationships. The continued use of any chromatographic procedure requires averification of the calibration relationship, and procedures for such verifications are described in thismethod as well (see Sec. 11.7).
2.6 The identification of target compounds by any chromatographic procedure is based, atleast in part, on retention times. Sec. 11.6 provides procedures for the determination of retentiontimes and retention time windows to be used with the specific methods listed in Sec. 1.1.
2.7 The calculations necessary to derive sample-specific concentration results from theinstrument responses are common to most of the analytical methods listed in Sec. 1.1. Therefore,Sec. 11.10 of Method 8000 contains a summary of the commonly used calculations.
2.8 Preventive maintenance and corrective actions are essential to the generation of qualitydata in a routine laboratory setting. Suggestions for such procedures are found in Sec. 11.11.
2.9 Most of the methods listed in Sec. 1.1 employ a common approach to quality control(QC). While some of the overall procedures are described in Chapter One, Sec. 9.0 describes

8000C - 7 Revision 3March 2003
routinely used procedures for calibration verification, instrument performance checks,demonstrating acceptable performance, etc.
2.10 Before performing analyses of specific samples, analysts should determine acceptablerecovery ranges for all target analytes of interest in the type of matrices to be tested. Theseprocedures are described in Secs. 9.4, 9.5, and 9.7. Analysts must also be able to demonstratethat the sensitivity of the procedure employed is appropriate for the intended application. Oneapproach to such a demonstration is to estimate the method sensitivity for the analytes of interestusing the procedures in Chapter One or other appropriate procedures.
3.0 DEFINITIONS
Refer to the SW-846 chapter of terms and acronyms for other potentially applicabledefinitions.
4.0 INTERFERENCES/CHROMATOGRAPHIC PERFORMANCE
4.1 Solvents, reagents, glassware, and other sample processing hardware may yieldartifacts and/or interferences to sample analysis. All these materials must be demonstrated to befree from interferences under the conditions of the analysis by analyzing method blanks. Specificselection of reagents and purification of solvents by distillation in all-glass systems may benecessary. Refer to each method for specific guidance on quality control procedures and toChapter Four for guidance on the cleaning of glassware.
4.2 Contamination by carryover can occur whenever high-concentration and low-concentration samples are analyzed in sequence. To reduce the potential for carryover, the samplesyringe or purging device must be thoroughly rinsed between samples with an appropriate solvent.Purge and trap devices or headspace devices should be thoroughly baked out between samples.Where practical, samples with unusually high concentrations of analytes should be followed by asolvent blank or by an analysis of organic-free reagent water to check for cross-contamination. Ifthe target compounds present in an unusually concentrated sample are also found to be presentin the subsequent samples, the analyst must demonstrate that the compounds are not due tocarryover. Conversely, if those target compounds are not present in the subsequent sample, thenthe analysis of a solvent blank or organic-free reagent water is not necessary.
Purging vessels may be cleaned by rinsing with methanol, followed by a distilled water rinseand drying in a 105EC oven between analyses. Detergent solutions may also be used, but caremust be taken to remove the detergent residue from the purging vessel. Other approaches tocleaning purging vessels may also be employed, provided that the laboratory can demonstrate thatthey are effective in removing contaminants.
4.3 In addition to carryover of compounds from one sample to the next, the analysis of high-concentration samples can lead to contamination of the analytical instrument itself. This isparticularly true for GC/MS. Eliminating this contamination can require significant time and effortin cleaning the instruments, time that cannot be spent analyzing samples. The most reliableprocedure for ensuring minimum down time during the GC/MS analysis of samples is to screensamples by some other technique. Samples to be analyzed for volatiles can be screened using anautomated headspace sampler (Method 5021) connected to a GC/PID/ELCD detector (Method8021). Samples to be analyzed for semivolatiles can be screened using GC/FID. Other screening

8000C - 8 Revision 3March 2003
methods are also acceptable. The analyst should use the screening results to choose anappropriate dilution factor for the GC/MS analysis that will prevent system contamination yet stillprovide adequate sensitivity for the major constituents of the sample.
4.4 One of the most important measures of chromatographic performance is resolution, theseparation of chromatographic peaks (peak separation/average peak width). Peak separations arefacilitated by good column efficiency (i.e., narrow peak widths) and good column selectivity (i.e.,analytes partition differently between the mobile and stationary phases).
4.4.1 The goal of analytical chromatography is to separate sample constituents withina reasonable time. Baseline resolution of each target analyte from co-extracted materialsprovides the best quantitative results, but is not always possible to achieve.
4.4.2 In general, capillary columns contain a greater number of theoretical plates thanpacked columns. (A theoretical plate is a surface at which an interaction between the samplecomponents and the stationary phase may occur). As a result, capillary columns generallyprovide more complete separation of the analytes of interest. However, packed columns canprovide adequate resolution of some analytes and are most appropriately employed when thelist of analytes to be determined is relatively short.
4.4.3 The ability to resolve individual compounds is generally the limiting factor for thenumber of analytes that can be measured using a single procedure. Some procedures,particularly Method 8081 (Organochlorine Pesticides), Method 8082 (PCBs), and Method8141 (Organophosphorus Pesticides), list analytes that may not all be resolved from oneanother. Therefore, while each of these methods is suitable for the listed compounds, theymay not be suitable to measure the entire list in a single analysis. In addition, some methodsinclude analytes that are isomers or closely related compounds which are well-known as co-eluting or are not completely separable. In these instances, the results should be reportedas the sum of the two (or more) analytes. Laboratories should demonstrate that targetanalytes are resolved during calibration and satisfy the requirements in Sec. 9.3, or shouldreport the results as "totals" or "sums" (e.g., m+p-xylene). Methods that utilize massspectrometry for detection are less affected by resolution problems, because overlappingpeaks may often be mass-resolved. However, even mass spectrometry will not be able tomass resolve positional isomers such as m-xylene and p-xylene if the compounds co-elute.
4.5 Elevated chromatographic baselines should be minimized or eliminated during theseanalyses. Baseline humps can usually be reduced or eliminated by the application of appropriatesample clean-up (see Method 3600), extract dilution, the use of pre-columns and/or inserts, or useof a selective detector. Integration of "hump-o-grams" can result in significant quantitative errors.When elevated baselines are observed during the analysis of blanks and standards, thechromatographic system should be considered contaminated. This contamination may be the resultof impure carrier gas, inadequate gas conditioning, septum bleed, column oxidation, and/orpyrolysis products in the injector or column. Such contamination is unacceptable and should beaddressed through a program of preventive maintenance and corrective action.
4.6 GC preventive maintenance and corrective action
Poor GC performance may be expected whenever a chromatographic system is contaminatedwith high-boiling materials, particularly in the injector. Analysts should perform routinemaintenance, including replacement of septa, cleaning and deactivating injector liners, andremoving as much as 0.5 - 1 m from the injector side of a capillary column.
8000C - 9 Revision 3March 2003
If chromatographic performance or ghost peaks are still a problem, cleaning of the metallicsurfaces of the injection port itself may be necessary. Capillary columns are reliable and easy touse, but several specific actions are necessary to ensure good performance.
4.6.1 Contact between the capillary column and the wall of the GC oven can affectboth chromatographic performance and column life. Care should be taken to prevent thecolumn from touching the oven walls.
4.6.2 Care should be taken to keep oxygen out of capillary columns.
4.6.3 Septa should only be changed after the oven has cooled.
4.6.4 Columns should be flushed with carrier gas for 10 minutes before reheating theoven.
4.6.5 Carrier gas should be scrubbed to remove traces of oxygen and scrubbersshould be changed regularly.
4.6.6 Carrier gas should always be passed through the column whenever the oven isheated.
4.7 HPLC preventive maintenance and corrective action
HPLC band broadening results from improper instrument setup or maintenance. Bandbroadening results whenever there is a dead volume between the injector and the detector.Therefore, plumbing connections should be of minimum length and diameter, and ferrules shouldbe properly positioned on the tubing to minimize dead volume.
4.7.1 Columns should not be subjected to sudden physical stress (e.g., dropping) orsolvent shocks (e.g., changing solvents without a gradient).
4.7.2 Columns can become contaminated with particulates or insoluble materials.Guard columns should be used when dirty samples are analyzed.
4.7.3 High quality columns are packed uniformly with small uniform diameter particleswith a minimum number of free silol groups. Use of such columns will result in optimumchromatographic performance.
4.7.4 Columns should be replaced when performance degrades (e.g., significant bandbroadening, peak splitting, or loss of chromatographic resolution occurs).
4.7.5 Pumping systems should deliver reproducible gradients at a uniform flow rate.Rates can be checked by collecting solvent into a graduated cylinder for a designated timeperiod.
4.7.6 Column temperatures should be regulated by the use of column temperaturecontrol ovens to ensure reproducibility of retention times.
4.7.7 Small changes in the composition or pH of the mobile phase can have asignificant effect on retention times.

8000C - 10 Revision 3March 2003
5.0 SAFETY
5.1 This method does not address all safety issues associated with its use. The laboratoryis responsible for maintaining a safe work environment and a current awareness file of OSHAregulations regarding the safe handling of the chemicals and instrumentation included in thismethod. A reference file of material safety data sheets (MSDSs) should be available to allpersonnel involved in these analyses.
6.0 EQUIPMENT AND SUPPLIES
6.1 The mention of trade names or commercial products in this manual is for illustrativepurposes only, and does not constitute an EPA endorsement or exclusive recommendation for use.The products and instrument settings cited in SW-846 methods represent those products andsettings used during method development or subsequently evaluated by the Agency. Glassware,reagents, supplies, equipment, and settings other than those listed in this manual may be employedprovided that method performance appropriate for the intended application has been documented.
6.2 GC inlet systems
6.2.1 Volatile organics
Volatile organic analytes are introduced into a GC through a purge-and-trap system, bydirect injection, or by other devices. The purge-and-trap apparatus is described in Method5030 for water samples and in Method 5035 for soil and other solid samples. See Method5000 for guidance on all forms of sample introduction of volatiles into the GC and GC/MSsystem.
6.2.2 Semivolatile organics
Sample extracts containing semivolatile organic compounds are introduced into a GCwith a syringe that passes through a septum into an injection port. The injection port allowsthe sample extract to be vaporized prior to being flushed onto the GC column, hence the term"gas" chromatography. Correct set up and maintenance of the injector port is necessary toachieve acceptable performance with GC methods. Septa should be changed frequentlyenough to prevent retention time shifts of target analytes and peak tailing. The schedule forsuch septa changes is dependent on the quality of the septa, the sharpness of the needle,and the operation of the injection system. Appropriate injector liners should be installed, andreplaced as necessary.
6.2.3 Injector difficulties include the destruction of labile analytes and discriminationagainst high boiling compounds in capillary injectors.
6.2.3.1 Packed columns and wide-bore capillary columns (> 0.50 mm ID)should be mounted in 1/4-inch injectors. An injector liner is needed for capillarycolumns.
6.2.3.2 Narrow-bore capillary columns (# 0.32 mm ID) should be mounted insplit/splitless (Grob-type) injectors. Split/splitless injectors require automated valveclosures that direct most of the flow (and sample) onto the head of the analyticalcolumn. After 30 - 45 seconds, the split valve is opened, so that most of the flow is
8000C - 11 Revision 3March 2003
vented during analysis, thus eliminating the solvent tail, and maintaining proper flowthrough the column. The initial oven temperature should be below the boiling point ofthe injection solvent if the solvent front interferes with early eluting analytes or if thesolvent effect is needed to resolve difficult-to-separate analytes.
6.2.3.3 Cool on-column injection and programmable temperature vaporizerinlets allow the analysis of labile compounds that degrade on packed columns and insplit/splitless injectors.
6.3 GC flow control
Precise control of the gas mobile phase is necessary to achieve reproducible GC retentiontimes. Flow controllers within any GC used for SW-846 analyses must deliver a precisely meteredgas flow at a rate appropriate for the GC column mounted in the instrument.
6.3.1 Most GCs have restrictors built into electronic flow controllers that are monitoredusing a digital readout. These restrictors are used to provide precise flow at the carrier gasflow rate listed in the method (e.g., use <20 mL/min restrictors for wide-bore capillarymethods). Carrier gas flow rates should be checked regularly (with both the injector and theoven heated) using a bubble meter or other appropriate procedure.
6.3.2 Cylinder pressures should also be regulated properly. Manifold pressures mustbe sufficiently large that a change in the head pressure of an individual instrument does notaffect the flow through all instruments. Toggle valves that allow instruments to be isolated arerecommended for all multi-instrument gas delivery systems. Analysts should spend time eachweek conducting preventative maintenance in order to ensure that proper flow control ismaintained. One needs to search for leaks using a helium tester or soap solution at eachconnector in the gas delivery systems. Analysts should routinely conduct preventivemaintenance activities, including those designed to ensure proper flow control and to identifypotential leaks in the gas delivery system. The search for leaks may be conducted with ahelium leak tester, soap solutions, performing static pressure tests, or other appropriatemeasures.
6.3.3 Carrier gas should be of high purity and should be conditioned between thecylinder and the GC to remove traces of water and oxygen. Scrubbers should be changedaccording to manufacturers recommendations. Gas regulators should contain stainless steeldiaphragms. Neoprene diaphragms are a potential source of gas contamination, and shouldnot be used.
6.4 Gas chromatographic columns
Each determinative method in SW-846 provides a description of a chromatographic columnor columns with associated performance data. Other packed or capillary (open-tubular) columnsmay be substituted in SW-846 methods to improve performance if (1) the criteria described in Secs.9.3 and 9.4 are satisfied, and (2) target analytes are sufficiently resolved from one another and fromco-extracted interferences to provide data of the appropriate quality for the intended application.
6.4.1 Narrower columns are more efficient (i.e., can resolve more analytes) but havea lower capacity (i.e., can accept less sample without peak distortion).
6.4.2 Longer columns can resolve more analytes, as resolution increases as a function

8000C - 12 Revision 3March 2003
of the square root of column length.
6.4.3 Increasing column film thickness or column loading increases column capacityand retention times.
6.4.4 Use of capillary columns has become standard practice in environmental andwaste analysis. Capillary columns have an inherently greater ability to separate analytes thanpacked columns. However, packed columns can provide adequate resolution of someanalytes and are most appropriately employed when the list of analytes to be determined isrelatively short.
6.4.5 Columns used for SW-846 analyses should be installed properly. Column endsshould be cut square. Contaminated ends should be trimmed off, and columns should beplaced through ferrules before they are trimmed. Columns should not touch the walls of theGC oven during analysis, and the manufacturer's column temperature limits should not beexceeded.
6.4.6 Septa should be changed regularly and septum nuts should not beovertightened. Oxygen should not be introduced into a hot column and carrier gas should bepassed through a column whenever it is heated. New columns, particularly packed columns,should be conditioned prior to analyzing samples.
6.5 GC detectors
Detectors are the transducers that respond to components that elute from a GC column andproduce the electrical signal that is used for quantitative determinations. SW-846 analyses areconducted using selective detectors or mass spectrometers listed in Sec. 1.1. Except whereotherwise recommended by the instrument manufacturer, selective non-MS detectors should bemaintained at least 20EC above the highest oven temperature employed to prevent condensationand detector contamination. The transfer lines between the GC and an MS detector should bemaintained at a temperature above the highest column temperature, or as specified by theinstrument manufacturer, to prevent condensation.
6.6 HPLC injectors
Liquids are essentially non-compressible, so a mechanical device is necessary that allowsintroduction of the sample into a high pressure flow without significant disruption in the flow rate andhydraulic pressure. Normally, a 6-port valve is used for this purpose. A sample loop (generally10-100 µL) is isolated from the flow of the mobile phase and filled with a sample extract. (Largersample loops may be used to increase sensitivity, however, they may degrade chromatographicperformance). The extract is then injected by turning the valve so that the mobile phase flowsthrough the loop. This procedure virtually eliminates dead volume in the injector and is fullycompatible with automated operation.
6.6.1 When the extract is highly viscous, a pressure spike results which canautomatically shut off the HPLC pump.
6.6.2 Contamination of subsequent injections may occur when the extract containsmaterial that is not soluble in the mobile phase.
6.6.3 Injection loops are easily changed but analysts must ensure that the

8000C - 13 Revision 3March 2003
compression fittings are properly installed to prevent leaks. Injectors require maintenance,as the surfaces that turn past each other do wear down.
6.7 HPLC pumps
The mobile phase used for HPLC must be accurately pressurized before it enters the injector.HPLC pumps are generally capable of delivering solvent at 5000 psi with excellent precision. Therate of delivery depends on the column that is used for the separation. Most environmentalmethods recommend flow rates of 0.25-1.0 mL/min. Flow rates should be checked by collectingcolumn effluent in a graduated cylinder for a designated time period.
Most pumping systems are capable of changing solvent concentration during an analysis (i.e.,gradient elution). Gradients are generated by either high pressure mixing of two streams betweenthe pump and the injector or by proportional mixing of the solvents before they are pumped. Ineither case, solvent mixing can cause changes in the solubility of dissolved gases, the formationof bubbles in the mobile phase, or non-reproducible gradients.
6.7.1 Air bubbles tend to cause an erratic baseline and, in the case of low pressuremixing, bubbles can cause the pump to cavitate. Therefore, HPLC solvents should bedegassed prior to use.
6.7.2 Non-reproducible gradients can result in significant changes in retention timesfrom run to run.
6.7.3 HPLC solvents should be filtered to remove particles that cause pump pistonwear. HPLC pump maintenance includes replacing seals regularly. (Use of strong buffersor solvents like tetrahydrofuran can significantly shorten the lifetime of pump seals.) Pumpsshould deliver solvent with minimal pulsation.
6.8 HPLC Columns
These columns must be constructed with minimum dead volume and a narrow particle sizedistribution. HPLC columns are generally constructed of stainless steel tubing and are sealed withcompression fittings. Manufacturers provide columns that are bonded with different alkyl groups(e.g., C18, cyano, TMS), have different percent carbon loading, are packed with different particlesizes (3-10 µm), and are packed with particles of different pore size (smaller pores mean greatersurface area), or are of different dimensions.
6.8.1 Columns with higher percent loading have the capacity to analyze somewhatlarger samples, but extremely high loadings may contribute to problems with the particle beamMS interface.
6.8.2 Columns with free silol groups show less tailing of polar materials (e.g., amines).
6.8.3 A smaller particle (and pore) size generally gives better resolution, higher backpressure, and smaller sample capacity. Columns with 3-µm particle size may have shortlifetimes when they are used for the analysis of complex waste extracts.
6.8.4 Improvements in column packing have resulted in 10- and 15-cm columns thatprovide the separating power necessary for most environmental and waste analyses.

8000C - 14 Revision 3March 2003
6.8.5 Internal diameters of columns used for environmental and waste analysis aregenerally 2-5 mm. Narrower columns are called microbore columns. While they providebetter separations, they become fouled more easily.
6.8.6 The lifetime and performance of HPLC columns can be improved through propermaintenance. Analysts should filter sample extracts, use compatible guard columns, checkfor clogged frits and for column voids. Columns should not be stored dry or containing strongbuffers.
6.9 HPLC column temperature control ovens
HPLC retention times are much more reproducible if the column is held at a constanttemperature. Temperature control ovens capable of maintaining the HPLC column at ± 0.1ECshould be utilized to maintain consistent retention times throughout the course of an HPLC analysis.Normal oven operating temperature would be 3-5EC above ambient laboratory temperature.
6.10 HPLC detectors
Detectors are the transducers that respond to components that elute from a HPLC columnand produce the electrical signal that is used for quantitative determinations. SW-846 analyses areconducted using selective detectors or mass spectrometers listed in Sec. 1.1. HPLC/MS requiresthe use of a sophisticated interface that separates target analytes from the aqueous mobile phase.Examples include the thermospray (TSP), electrospray (ESP), and the particle beam (PB)interfaces.
6.11 Data systems
Raw chromatographic data have to be reduced in order to provide the quantitative informationrequired by analysts. The use of sophisticated data systems is strongly recommended for SW-846chromatographic methods. The ability to store and replot chromatographic data is invaluable duringdata reduction and review. Organizations should establish their priorities and select the system thatis most suitable for their applications.
6.12 Supplies
Chromatographers require a variety of supplies. The specific items that should be stockeddepend on laboratory instrumentation and the analyses performed. At a minimum, laboratoriesneed PTFE tape, stainless steel regulators, acid-washed copper tubing, and syringes, andreplacement parts for instruments.
6.12.1 Laboratories performing GC analyses also require high purity gases, scrubbersfor gas conditioning, gas-tight fittings, capillary cutters, magnifying glasses, septa with propertemperature limits, appropriate ferrules, dichlorodimethylsilane (for deactivating surfaces),glass wool, spare columns and injection port liners.
6.12.2 Laboratories performing HPLC analyses require high purity solvents, columnpacking material, frits, 1/16-inch tubing, appropriate ferrules, solvent filtration apparatus, andsolvent degassing apparatus.
8000C - 15 Revision 3March 2003
7.0 REAGENTS AND STANDARDS
7.1 Reagent grade chemicals must be used in all tests. Unless otherwise indicated, it isintended that all reagents conform to the specifications of the Committee on Analytical Reagentsof the American Chemical Society, where such specifications are available. Other grades may beused, provided it is first ascertained that the reagent is of sufficiently high purity to permit its usewithout lessening the accuracy of the determination.
7.2 See the specific extraction and determinative methods for the reagents and standardsneeded.
8.0 SAMPLE COLLECTION, PRESERVATION, AND STORAGE
See the introductory material to this chapter, Organic Analytes, Sec. 4.1, for information onsample collection, preservation and handling procedures. Additional information may be found insome of the individual sample extraction, preparation, and determinative methods.
9.0 QUALITY CONTROL
9.1 Refer to Chapter One for guidance on quality assurance (QA) and quality control (QC)protocols. Each laboratory should maintain a formal quality assurance program. The laboratoryshould also maintain records to document the quality of the data generated. The development ofin-house QC limits for each method is encouraged, as described in Sec. 9.7. The use ofinstrument-specific QC limits is encouraged, provided such limits will generate data appropriate foruse in the intended application. All data sheets and quality control data should be maintained forreference or inspection. When inconsistencies exist between QC guidelines, method-specific QCcriteria take precedence over both technique-specific criteria and those criteria given in ChapterOne, and technique-specific QC criteria take precedence over the criteria in Chapter One. Ingeneral, the following QC requirements pertain to all the determinative methods listed in Sec. 1.1unless superseded by specific requirements provided in the determinative method.
9.2 Evaluating chromatographic performance
The analyst's expertise in performing chromatography is a critical element in the successfulperformance of chromatographic methods. Successful generation of data requires selection ofsuitable preparation and analysis methods and an experienced staff to use these methods.
9.2.1 For each 12-hour period during which analysis is performed, the performanceof the instrument system should be checked. These checks should be part of a formal qualitycontrol program that includes the analysis of instrument blanks, calibration standards, andother QC as appropriate for that method. In addition to these instrument QC checks, theperformance of the entire analytical system (i.e., preparation, cleanup and analysis) shouldbe checked. These additional checks should include method blanks, matrix spikes, laboratorycontrol samples, replicate samples and other QC as appropriate for that method. It isgenerally advisable, although not required, that all method QC samples be run at the sametime as the samples on the same instrument.
9.2.2 Ongoing data quality checks are compared with established performance criteriato determine if the results of analyses meet the performance characteristics of the method.

8000C - 16 Revision 3March 2003
Therefore, all sample analyses performed using external standard calibration must bebracketed with acceptable calibration verification standards.
9.2.3 In addition to the quantitative measures of comparison described below and inthe individual methods, analysts should evaluate chromatograms and instrument operation.Questions that should be asked include:
Do the peaks look normal (Gaussian)?Is the response obtained comparable to the response from previous calibrations?Do the column fittings need tightening?Are non-target peaks present in calibration analyses? Are contaminants present in the blanks?Is the injector leaking (e.g., does the GC injector septum need replacing)?Does the HPLC guard column need replacement?
9.2.4 Significant peak tailing, leaks, changes in detector response and laboratorycontamination should be corrected. Tailing problems are generally traceable to active siteson the column, cold spots in a GC, improper choice of HPLC mobile phase, the detector inlet,or leaks in the system.
9.2.5 Recalibration of the instrument must take place when the performance changesto the point that the calibration verification acceptance criteria (Sec. 11.7) cannot be achieved.In addition, significant maintenance activities or hardware changes may also requirerecalibration. The sections below provide general guidance on the sorts of procedures thatmay or may not require recalibration.
9.2.5.1 There are various types of instrument maintenance that should notautomatically require recalibration of the instrument. Examples include changing:septa; compressed gas cylinders; syringes; moisture, hydrocarbon, or oxygen traps;solvents in an ELCD; purge tubes; PTFE transfer lines; glow plugs; split seals; columnfittings; or inlet liners. Other procedures include cleaning the MS source; breaking offor changing a guard column; changing an injector port, or filaments; and cleaning theinlet. Whenever such procedures are performed, the analyst must demonstrate that theresults for a calibration verification standard meet the acceptance criteria in Sec. 11.7.before the analysis of any samples. Otherwise, recalibration is required.
9.2.5.2 In contrast to Sec. 9.2.5.1, some maintenance procedures are so likelyto affect the instrument response that recalibration is automatically required, regardlessof the ability to meet the calibration verification acceptance criteria. These proceduresinclude: changing, replacing, or reversing the column; replacing the trap on a purge-and-trap; recoating the bead in a detector; changing nitrogen tubes in an NPD;changing resins; changing the PID seal or lamp; changing the FID jet; changing theentrance lens, draw out lens, or repeller; changing the electron multiplier, and ionsource chamber. Whenever such procedures are performed, the analyst must performa new initial calibration that meets the requirement using Sec 11.5. As noted in Sec.11.6, changing or replacing the column will also require that the retention time windowsbe redetermined.
9.2.6 Before processing any samples, the analyst should demonstrate that all partsof the equipment in contact with the sample and reagents are interference-free. This isaccomplished through the analysis of a method blank. Each time samples are extracted,

8000C - 17 Revision 3March 2003
cleaned up, and analyzed, a method blank should be prepared and analyzed for thecompounds of interest as a safeguard against chronic laboratory contamination. Consult theappropriate 3500 or 5000 series method for the specifics of the preparation of method blanks.The following general guidelines apply to the interpretation of method blank results.
9.2.6.1 Method blanks should be prepared at a frequency of at least 5%, thatis, one method blank for each group of up to 20 samples prepared at the same time, bythe same procedures. For samples analyzed for volatiles by the purge-and-traptechnique, the preparation is equivalent to the analysis. Therefore, one purge-and-trapmethod blank must be analyzed with each group of up to 20 samples analyzed on thesame instrument during the same analytical shift.
9.2.6.2. When samples that are extracted together are analyzed on separateinstruments or on separate analytical shifts, the method blank associated with thosesamples (e.g., extracted with the samples) must be analyzed on at least one of thoseinstruments. A solvent blank should be analyzed on all other instruments on which theset of samples were analyzed to demonstrate that the instrument is not contributingcontaminants to the samples.
9.2.6.3 Unless otherwise described in a determinative method, the methodblank may be analyzed immediately after the calibration verification standard, to ensurethat there is no carryover from the standard, or at another point in the analytical shift.
9.2.6.4 When sample extracts are subjected to cleanup procedures, theassociated method blank must also be subjected to the same cleanup procedures.
9.2.6.5 As described in Chapter One, the results of the method blank shouldbe:
9.2.6.5.1 Less than the laboratory's lowest limit of detection for theanalyte or less than the level of acceptable blank contamination specified in theapproved quality assurance project plan or other appropriate systematicplanning document.
9.2.6.5.2 Less than 5% of the regulatory limit associated with ananalyte.
9.2.6.5.3 Or less than 5% of the sample result for the same analyte,whichever is greater.
9.2.6.5.4 If the method blank results do not meet the acceptancecriteria above, then the laboratory should take corrective action to locate andreduce the source of the contamination and to re-extract and reanalyze anysamples associated with the contaminated method blank.
9.2.6.6 The laboratory should not subtract the results of the method blank fromthose of any associated samples. Such "blank subtraction" is inappropriate for the GCand HPLC methods addressed here, and often leads to negative sample results. If themethod blank results do not meet the acceptance criteria in 9.2.6.5 and reanalysis is notpractical, then the data user should be provided with the sample results, the methodblank results, and a discussion of the corrective actions undertaken by the laboratory.

8000C - 18 Revision 3March 2003
9.2.6.7 Method blanks and/or solvent blanks may also be used to check forcontamination by carryover from a high-concentration sample into subsequent samples(see Sec. 4.2). When the analysis of such blanks is not possible, such as when anunattended autosampler is employed, the analyst should review the results for at leastthe next two samples after the high-concentration sample. If analytes in the high-concentration sample are not present in the subsequent samples, then the lack ofcarryover has been demonstrated. If there is evidence that carryover may haveoccurred, then the samples should be reanalyzed.
9.3 Summary of required and recommended instrument QC
The following criteria primarily pertain to GC and HPLC methods with non-MS or FTIRdetectors, and may be superseded by criteria included in individual determinative methods (e.g.,Methods 8021, 8260, 8270, 8321, 8325, and 8410).
9.3.1 The criteria for linearity of an initial calibration curve based on the average of theresponse factors is an RSD of # 20% for each compound that is included in the calibrationstandard(s) and is considered to be a target analyte. Previous versions of Method 8000introduced an allowance for the grand mean of the calibration or response factors for allanalytes to be used to evaluate linearity under a limited set of circumstances. However, EPAdid not place specific limits on the number of compounds with RSD values over 20% nor anupper limit on the RSD values that could be considered, and as a result, the practice waswidely abused. THEREFORE, THE ALLOWANCE FOR THE USE OF THE GRAND MEANRSD TO EVALUATE CALIBRATION LINEARITY HAS BEEN WITHDRAWN AND ALLTARGET COMPOUNDS SHOULD HAVE RSDs LESS THAN OR EQUAL TO 20% (see Sec.11.5.1.3).
9.3.2 For linear and non-linear calibration curves based on a least squares regression(LSR) model construction coefficients which describe correlation as equal to 1.00 whenrepresenting the best curve fit must be $ 0.99. Examples of coefficients that describecorrelation are the correlation coefficient (r), the coefficient of determination (COD), and r2.They must all be $ 0.99 (see Sec. 11.5.2).
9.3.3 The % Difference as derived from the inspection of the calibration curve (seeSec. 11.5.5.1) is # 20% for every analyte and for every level of calibration. This is not arequirement but a highly recommended practice for the examination of initial calibrationcurves for acceptability.
9.3.4 Retention time (RT) windows must be established for the identification of targetanalytes. See Sec. 11.6 for guidance on establishing the absolute RT windows.
9.3.5 The retention times of all analytes in all verification standards must fall within theabsolute RT windows. If an analyte falls outside the RT window in a calibration verificationstandard, new absolute RT windows must be calculated, unless instrument maintenancecorrects the problem.
9.3.6 The calibration verification results must be within ± 20% of the responsecalculated using the initial calibration. If the limit is exceeded, a new standard curve must beprepared unless instrument maintenance corrects the problem.

8000C - 19 Revision 3March 2003
9.4 Initial demonstration of capability (IDC)
Each laboratory must demonstrate initial capability with each combination of samplepreparation and determinative methods that it utilizes, by generating data of acceptable accuracyand precision for a reference sample containing the target analytes in a clean matrix. Thelaboratory must also repeat this demonstration whenever new staff are trained or significantchanges in instrumentation are made (See Sec. 9.4.10).
9.4.1 The reference samples are prepared from a spiking solution containing eachanalyte of interest. The reference sample concentrate (spiking solution) may be preparedfrom pure standard materials, or purchased as certified solutions. If prepared by thelaboratory, the reference sample concentrate must be made using stock standards preparedindependently from those used for calibration.
Preparation of the reference sample concentrate is dependent upon the method beingevaluated. Guidance for reference sample concentrations for certain methods are listed inMethods 3500 and 5000. In other cases, the determinative methods contain guidance onpreparing the reference sample concentrate and the reference sample. If no guidance isprovided, prepare a reference sample concentrate in methanol (or any water miscible solvent)at a concentration such that the spike will provide a concentration in the clean matrix that is10 - 50 times the lowest limit of detection for each analyte in that matrix.
The concentration of target analytes in the reference sample may be adjusted to moreaccurately reflect the concentrations that will be analyzed by the laboratory. If theconcentration of an analyte is being evaluated relative to a regulatory limit or action level, seeSec. 9.5.1 for information on selecting an appropriate spiking level.
9.4.2 To evaluate the performance of the total analytical process, the referencesamples must be handled in exactly the same manner as actual samples. Use a clean matrixfor spiking purposes (one that does not have any target or interference compounds), e.g.,organic-free reagent water for the aqueous matrix and organic-free sand or soil for the solidmatrix.
9.4.3 Preparation of reference samples
9.4.3.1 Volatile organic analytes
Prepare the reference sample by adding 200 µL of the reference sampleconcentrate (Sec. 9.4.1) to 100 mL of organic-free reagent water. Transfer this solutionimmediately to a 20- or 25-mL (or four 5-mL) gas-tight syringe(s) when validating wateranalysis performance by Method 5030. Alternatively, the reference sample concentratemay be injected directly through the barrel of the 5- or 25-mL syringe. See Method 5000or guidance on other preparative methods and matrices.
9.4.3.2 Semivolatile and nonvolatile organic analytes
Prepare the reference sample by adding 1.0 mL of the reference sampleconcentrate (Sec. 9.4.1) to each of four 1-L aliquots of organic-free reagent water. SeeMethod 3500 for other matrices.
8000C - 20 Revision 3March 2003
9.4.4 Analyze at least four replicate aliquots of the well-mixed reference samples bythe same procedures used to analyze actual samples (Procedure section for each of themethods). This will include a combination of the sample preparation method (usually a 3500series method for extractable organics or a 5000 series method for volatile organics) and thedeterminative method (an 8000 series method).
9.4.5 Calculate the average recovery ( –x ) in µg/L, and the standard deviation of therecovery (s) in µg/L, for each analyte of interest using the four results.
9.4.6 Multiple-laboratory performance data are included in some determinativemethods and may be used as guidance in evaluating performance in a single laboratory. However, comparison with single-laboratory performance data is much more indicativeregarding expectations of how any individual laboratory will perform, than is comparison withmulti-laboratory data. Compare s and –x for each analyte with the corresponding performancedata for precision and accuracy given in the performance data table at the end of thedeterminative method. If s and –x for all analytes of interest meet the appropriate acceptancecriteria, then the system performance is acceptable and analysis of actual samples can begin.If any individual s value exceeds the precision limit or any individual –x value falls outside therange for accuracy, then the system performance may be unacceptable for that analyte.
NOTE: The large number of analytes in each of the methods presents a substantialprobability that one or more analyte will fail at least one of the performancecriteria when all analytes of a given method are determined.
When one or more of the analytes fail at least one of the performance criteria, theanalyst should proceed according to Sec. 9.4.6.1 or 9.4.6.2.
9.4.6.1 Locate and correct the source of the problem and repeat the test for allanalytes of interest, beginning at Sec. 9.4.2.
9.4.6.2 Beginning at Sec. 9.4.2, repeat the test only for those analytes thatfailed to meet criteria. Repeated failure, however, will confirm a general problem withthe measurement system. If this occurs, locate and correct the source of the problemand repeat the test for all compounds of interest beginning at Sec. 9.4.2.
9.4.7 The performance data in many of the methods are based on single-laboratoryperformance. As with the multiple-laboratory data, the criteria in those methods may be usedas guidance when evaluating laboratory performance. When comparing your laboratory datato performance data developed from single-laboratory data, certain analytes may be outsidethe limits, however, the majority should be within the acceptance limits.
9.4.8 Even when the determinative method contains performance data (either multiple-laboratory or single-laboratory), the development of in-house acceptance limits is stronglyrecommended, and may be accomplished using the general considerations described in Sec.9.7.
9.4.9 In the absence of recommended acceptance criteria for the initial demonstrationof capability, the laboratory should use recoveries of 70 - 130% as guidance in evaluating theresults. Given that the initial demonstration is performed in a clean matrix, the averagerecoveries of analyte from the four replicates should generally fall within this range. Inaddition, since the laboratory will repeat the initial demonstration of capability whenever new

8000C - 21 Revision 3March 2003
staff are trained or significant changes in instrumentation are made, the resulting data shouldbe used to develop in-house acceptance criteria, as described in Sec. 9.7.
9.4.10 There are various types of instrument maintenance that require recalibration. However, they do not automatically require the initial demonstration of capability be repeated.They are listed in Sec. 9.2.5.2. Only major changes in instrumentation or procedure shouldrequire this to be repeated. Some examples which would require a new IDC are using adifferent type of detector (ECD to ELCD); using a different mode on the detector (SIM to FullScan); changing the extraction apparatus or solvent; changing derivatization agents; usinga different column phase; changing carrier gas (H2 to He); changing HPLC solvents; orchanging chromatograph to detector interfaces (Thermospray to Particle Beam). Changingtemperature conditions of the analysis will require recalibration but not a new IDC. Newanalysts along with changes in procedures and instruments require a new IDC to beperformed.
9.5 Matrix spike and laboratory control samples
The laboratory must also have procedures for documenting the effect of the matrix on methodperformance (precision, accuracy, and detection limit). At a minimum, this will include the analysisof at least one matrix spike and one duplicate unspiked sample or one matrix spike/matrix spikeduplicate (MS/MSD) pair with each preparation batch of up to 20 samples of the same matrixprocessed together (see Chapter One). If samples are expected to contain the target analytes ofconcern, then laboratories may use one matrix spike and a duplicate analysis of an unspiked fieldsample as an alternative to the MS/MSD pair (see Sec. 9.5.3).
In the case of purge-and-trap methods, the MS/MSD, or MS and duplicate samples, shouldbe prepared and analyzed concurrently with the samples. In the case of samples that involve anextraction procedure, the MS/MSD, or MS and duplicate samples, should be extracted with thebatch of samples but may be analyzed at any time.
In addition, a Laboratory Control Sample (LCS) should be included with each preparationbatch. The LCS consists of an aliquot of a clean (control) matrix similar to the sample matrix andof the same weight or volume. The LCS is spiked with the same analytes at the sameconcentrations as the matrix spike and is processed in the same manner as the samples. Whenthe results of the matrix spike analysis indicates a potential problem due to the sample matrix itself,the LCS results are used to verify that the laboratory can perform the analysis in a clean matrix.
The concentration of the matrix spike sample and/or the LCS should be determined asdescribed in Secs. 9.5.1 and 9.5.2, and the spiking solutions should contain all of the targetanalytes of concern.
9.5.1 If, as in compliance monitoring, the concentration of a specific analyte in thesample is being checked against a regulatory concentration limit or action level, the spikeshould be at or below the limit, or 1 - 5 times the background concentration (if historical dataare available), whichever concentration is higher.
If historical data are not available, it is suggested that a background sample of the samematrix from the site be submitted for matrix spiking purposes to ensure that highconcentrations of target analytes and/or interferences will not prevent calculation ofrecoveries.

8000C - 22 Revision 3March 2003
Recovery ' %R 'Cs & Cu
Cn
x 100
9.5.2 If the concentration of a specific analyte in a sample is not being checked againsta limit specific to that analyte, then the analyst may spike the sample at the sameconcentration as the reference sample (Sec. 9.4.1), at 20 times the estimated limit ofquantitation (LOQ) in the matrix of interest, or at a concentration near the middle of thecalibration range. It is again suggested that a background sample of the same matrix fromthe site be submitted as a sample for matrix spiking purposes.
9.5.3 To develop precision and accuracy data for each of the spiked compounds, theanalyst has two choices: analyze the original sample, and an MS/MSD pair; or analyze theoriginal sample, a duplicate sample, and one spiked sample. If samples are not expected tocontain the target analytes of concern, then the laboratory may use a matrix spike and matrixspike duplicate pair. If samples are expected to contain the target analytes of concern, thenthe laboratory may use one matrix spike and a duplicate analysis of an unspiked field sampleas an alternative to the MS/MSD pair.
Begin by analyzing one sample aliquot to determine the background concentration ofeach analyte. Prepare a matrix spike concentrate according to one of the options describedin Sec. 9.5.1 or 9.5.2.
Prepare a matrix spike sample by adding the appropriate volume of the matrix spikeconcentrate to another aliquot of the sample to yield the desired concentration (see Secs.9.5.1 and 9.5.2). Prepare a matrix spike duplicate sample from a third aliquot of the sample.
Analyze the MS/MSD samples using the same procedures employed for the originalsample, and calculate the concentration of each analyte in the matrix spike and matrix spikeduplicate. Likewise, analyze the LCS samples using the same procedures employed for theoriginal sample, and calculate the concentration of each analyte in the LCS.
9.5.3.1 Calculation of recovery
Accuracy is estimated from the recovery of spiked analytes from the matrix ofinterest. Laboratory performance in a clean matrix is estimated from the recovery ofanalytes in the LCS. Calculate the recovery of each spiked analyte in the matrix spike,matrix spike duplicate (if performed) and LCS according to the following formula.
where:
Cs = Measured concentration of the spiked sample aliquot.Cu = Measured concentration of the unspiked sample aliquot (use 0 for the LCS).Cn = Nominal (theoretical) concentration increase that results from spiking the
sample, or the nominal concentration of the spiked aliquot (for LCS).
9.5.3.2 Calculation of precision
Precision is estimated from the relative percent difference (RPD) of theconcentrations (not the recoveries) measured for matrix spike/matrix spike duplicate

8000C - 23 Revision 3March 2003
RPD '* C1 & C2 *
C1 % C2
2
x 100
pairs, or for duplicate analyses of unspiked samples. Calculate the RPD according tothe formula below.
where:
C1 = Measured concentration of the first sample aliquot.C2 = Measured concentration of the second sample aliquot.
9.5.4 Recommended QC acceptance criteria for matrix spike samples and LCS
It is necessary for the laboratory to develop single-laboratory performance data foraccuracy and precision in the matrices of interest (see Sec. 9.7). In addition, laboratoriesshould monitor method performance in each matrix, through the use of control charts andother techniques.
Many methods may not contain recommended acceptance criteria for LCS results. Thelaboratory should use 70 - 130% as interim acceptance criteria for recoveries of spikedanalytes, until in-house LCS limits are developed (see Sec. 9.7). Where in-house limits havebeen developed for matrix spike recoveries, the LCS results should fall within those limits, asthe LCS is prepared in a clean matrix.
Even where the determinative methods provide performance criteria for matrix spikesand LCS, it is necessary for laboratories to develop in-house performance criteria andcompare them to those in the methods. The development of in-house performance criteriais discussed in Sec. 9.7.
As a general rule, the recoveries of most compounds spiked into samples should fallwithin the range of 70 - 130%, and this range should be used as a guide in evaluating in-house performance. However, as described in Sec. 9.5.4.1, matrix spike recoveries and LCSrecoveries may be affected by the spike-to-background ratio.
Where methods do contain performance data for the matrix of interest, use Secs. 9.5.4.1and 9.5.4.2 as guidance in evaluating data generated by the laboratory.
9.5.4.1 When multiple-laboratory performance data for the matrix of interestare provided in the determinative method, compare the percent recovery (%R) for eachanalyte in a water sample with the performance data. Given that such performancecriteria were developed from multi-laboratory data, they should be met in almost alllaboratories. See Sec. 9.7.10 for more information on comparisons between limits. Theperformance data include an allowance for error in measurement of both thebackground and spike concentrations, and assume a spike-to-background ratio of 5:1.If spiking was performed at a concentration lower than that used for the referencesample (Sec. 9.4), the analyst may use either the performance data presented in thetables, or laboratory-generated QC acceptance criteria calculated for the specific spikeconcentration, provided that they meet the project-specific data quality objectives.

8000C - 24 Revision 3March 2003
Accuracy ' x ) ' (a)C % b
Acceptance range (µg/L) ' Accuracy ± (2.44)Precision
Recovery (%) 'Concentration (or amount) foundConcentration (or amount) added
× 100
9.5.4.2 When the sample was spiked at a spike-to-background ratio other than5:1, the laboratory should calculate acceptance criteria for the recovery of an analyte.Some determinative methods contain a table entitled "Method Accuracy and Precisionas a Function of Concentration" which gives equations for calculating accuracy andprecision as a function of the spiking concentration. These equations may be used asguidance in establishing the acceptance criteria for matrix spike samples.
The equations are the result of linear regression analyses of the performancedata from a multiple-laboratory study. The equations are of the form:
where a is a number less than 1.0, b is a value greater than 0.0, and C is the testconcentration (or true value).
Performance criteria for accuracy may be calculated from these equations bysubstituting the spiking concentration used by the laboratory in place of "C," and usingthe values of a and b given in the table for each analyte.
Performance criteria for precision are calculated in a similar fashion, using thea and b values for precision given in the table for each analyte. Precision may becalculated as single analyst precision, or overall precision, using the appropriateequations from the table. An acceptable performance range may be calculated for eachanalyte as:
9.5.5 Also compare the recovery data from the matrix spike with the LCS data (use theaverage recovery if a matrix spike and matrix spike duplicate were analyzed). If any individualpercent recovery in the matrix spike (or matrix spike duplicate) falls outside the designatedrange for recovery, the laboratory should determine if there is a matrix effect or a laboratoryperformance problem. A matrix effect is indicated if the LCS data are within limits but thematrix spike data exceed the limits. The surrogate recovery data (Sec. 9.6) should also beused to evaluate the data. Recoveries of both matrix spike compounds and surrogates thatare outside of the acceptance limits suggest more pervasive analytical problems thanproblems with the recoveries of either matrix spikes or surrogates alone.
9.6 Surrogate recoveries
9.6.1 It is necessary that the laboratory evaluate surrogate recovery data fromindividual samples versus surrogate recovery limits developed in the laboratory. The generalconsiderations for developing in-house acceptance criteria for surrogate recoveries aredescribed in Sec. 9.7.
9.6.2 Surrogate recovery is calculated as:
8000C - 25 Revision 3March 2003
If recovery is not within in-house surrogate recovery limits, the following procedures arenecessary.
9.6.2.1 Check to be sure that there are no errors in the calculations, surrogatesolutions or internal standards. If errors are found, recalculate the data accordingly.Examine chromatograms for interfering peaks and integrated peak areas.
9.6.2.2 Check instrument performance. If an instrument performance problemis identified, correct the problem and re-analyze the extract (or re-analyze the samplefor volatiles).
9.6.2.3 Some samples may require dilution in order to bring one or more targetanalytes within the calibration range or to overcome significant interferences with someanalytes. This may result in the dilution of the surrogate responses to the point that therecoveries can not be measured. If the surrogate recoveries are available from a less-diluted or undiluted aliquot of the sample or sample extract, those recoveries may beused to demonstrate that the surrogates were within the QC limits, and no further actionis required. However, the results of both the diluted and undiluted (or less-diluted)analyses should be provided to the data user.
9.6.2.4 If no instrument problem is found, the sample should be re-extractedand re-analyzed (or re-analyze the sample for volatiles).
9.6.2.5 If, upon re-analysis (in either 9.6.2.2 or 9.6.2.4), the recovery is againnot within limits, report the data as an "estimated concentration." If the recovery iswithin the limits in the re-analysis, provide the re-analysis data to the data user. If theholding time for the method has expired prior to the re-analysis, provide both the originaland re-analysis results to the data user, and note the holding time problem.
9.7 Generating performance criteria for matrix spike recoveries, surrogate recoveries, initialdemonstration of capability, and laboratory control sample recoveries
It is essential that laboratories calculate in-house performance criteria for matrix spikerecoveries and surrogate recoveries. It may also be useful to calculate such in-house criteria forlaboratory control sample (LCS) recoveries and for the initial demonstration of capability whenexperience indicates that the criteria recommended in specific methods are frequently missed forsome analytes or matrices. The development of in-house performance criteria and the use ofcontrol charts or similar procedures to track laboratory performance cannot be over-emphasized.Many data systems and commercially-available software packages support the use of controlcharts.
The procedures for the calculation of in-house performance criteria for matrix spike recoveryand surrogate recovery are provided below. These procedures may also be applied to thedevelopment of in-house criteria for the initial demonstration of capability and for LCS recoveries.
9.7.1 For each matrix spike sample analyzed, calculate the percent recovery of eachmatrix spike compound added to the sample, in a fashion similar to that described in Sec.9.5.3.3. For each field sample, calculate the percent recovery of each surrogate as describedin Sec. 9.6.

8000C - 26 Revision 3March 2003
9.7.2 Calculate the average percent recovery (p) and the standard deviation (s) foreach of the matrix spike compounds after analysis of 15-20 matrix spike samples of the samematrix, using the equations in Sec. 9.5.3, as guidance. Calculate the average percentrecovery (p) and the standard deviation (s) for each of the surrogates after analysis of 15-20field samples of the same matrix, in a similar fashion.
9.7.3 After the analysis of 15-20 matrix spike samples of a particular matrix (or matrixspike limits) or 15-20 field samples (for surrogate limits), calculate upper and lower controllimit for each matrix spike or surrogate compound:
Upper control limit = p + 3sLower control limit = p - 3s
Calculate warning limits as:
Upper warning limit = p + 2sLower warning limit = p - 2s
For laboratories employing statistical software to determine these limits, the controllimits approximate a 99% confidence interval around the mean recovery, while the warninglimits approximate a 95% confidence interval.
9.7.4 Any matrix spike, surrogate, or LCS results outside of the control limits requireevaluation by the laboratory. Such actions should begin with a comparison of the results fromthe samples or matrix spike samples with the LCS results. If the recoveries of the analytesin the LCS are outside of the control limits, then the problem may lie with the application ofthe extraction and/or cleanup procedures applied to the sample matrix or with thechromatographic procedures. Once the problem has been identified and addressed,corrective action may include the reanalysis of samples, or the extraction and analysis of newsample aliquots, including new matrix spike samples and LCS.
When the LCS results are within the control limits, the problem may either be related tothe specific sample matrix or to an inappropriate choice of extraction, cleanup, anddeterminative methods. If the results are to be used for regulatory compliance monitoring,then the analyst must take steps to demonstrate that the analytes of concern can bedetermined in the sample matrix at the levels of interest.
The laboratory may use the warning limits to guide internal evaluations of methodperformance, track the performance of individual analysts, and monitor the effects of changesto the analytical procedures. Repeated results outside of the warning limits should lead tofurther evaluation.
9.7.5 Once established, control limits and warning limits for matrix spike compoundsshould be reviewed after every 10-20 matrix spike samples of the same matrix, and updatedat least semi-annually. Control limits and warning limits for surrogates should be reviewedafter every 20-30 field samples of the same matrix, and should be updated at least semi-annually. The laboratory should track trends in both performance and in the control limitsthemselves. The control and warning limits used to evaluate the sample results should bethose in place at the time that the sample was analyzed. Once limits are updated, those limitsshould apply to all subsequent analyses of new samples.

8000C - 27 Revision 3March 2003
9.7.6 For methods and matrices with very limited data (e.g., unusual matrices notanalyzed often), interim limits should be established using available data or by analogy tosimilar methods or matrices.
9.7.7 Results used to develop acceptance criteria should meet all other QC criteriaassociated with the determinative method. For instance, matrix spike recoveries from aGC/MS procedure should be generated from samples analyzed after a valid GC/MS tune anda valid initial calibration that includes the matrix spike compounds. Another example is thatanalytes in GC or HPLC methods must fall within the established retention time windows inorder to be used to develop acceptance criteria.
9.7.8 Laboratories are advised to consider the effects of the spiking concentration onmatrix spike performance criteria, and to avoid censoring of data. As noted in Sec. 9.5.4, theacceptance criteria for matrix spike recovery and precision are often a function of the spikeconcentration used. Therefore, use caution when pooling matrix spike/matrix spike duplicatedata for use in establishing acceptance criteria. Not only should the results all be from thesame (or very similar) matrix, but the spiking levels should also be approximately the same(within a factor of 2).
Similarly, the matrix spike and surrogate results should all be generated using the sameset of extraction, cleanup, and analysis techniques. For example, do not mix results fromsolid samples extracted by ultrasonic extraction with those extracted by Soxhlet.
9.7.9 Another common error in developing acceptance criteria is to discard data thatdo not meet a preconceived notion of acceptable performance. This results in a censoreddata set, which, when used to develop acceptance criteria, will lead to unrealistically narrowcriteria. Remember that for a 95% confidence interval, 1 out of every 20 observations likelywill still fall outside the limits.
While professional judgement is important in evaluating data to be used to developacceptance criteria, do not discard specific results simply because they do not meet one'sexpectations. Rather, employ a statistical test for outlier values, or at least calculate theacceptance limits both with and without the results that are considered suspect and observethe effect of deleting suspect data.
9.7.10 In-house QC limits must be examined for reasonableness. It is not EPA's intentto legitimize poor recoveries that are due to the incorrect choice of methods or spiking levels.In-house limits also should be compared with the objectives of specific analyses. Forexample, recovery limits (for surrogates, MS, MSD, LCS, etc.) that include allowance for arelatively high positive bias (e.g., 70 - 170%) may be appropriate for determining that ananalyte is not present in a sample. However, they would be less appropriate for the analysisof samples near but below a regulatory limit, because of the potential high bias.
It may be useful to compare QC limits generated in the laboratory to the performancedata that may be listed in specific determinative methods. However, the analyst must beaware that performance data generated from multiple-laboratory data tend to be significantlywider than those generated from single-laboratory data. In addition, comparisons betweenin-house limits and those from other sources should generally focus more on the accuracy(recovery) limits of single analyses rather than the precision limits. For example, a meanrecovery closer to 100% is generally preferred, even if the ±3 standard deviation range isslightly wider, because those limits indicate that the result is likely closer to the "true value."
8000C - 28 Revision 3March 2003
In contrast, the precision range provides an indication of the results that might be expectedfrom repeated analyses of the same sample.
9.8 It is recommended that the laboratory adopt additional quality assurance practices foruse with these methods. The specific practices that are most productive depend upon the needsof the laboratory, the nature of the samples, and project-specific requirements. Field duplicatesmay be analyzed to assess the precision of the environmental measurements. When doubt existsover the identification of a peak on the chromatogram, confirmatory techniques such as gaschromatography with a dissimilar column, specific element detector, or mass spectrometer(selected ion monitoring or full scan) must be used. Whenever possible, the laboratory shouldanalyze standard reference materials and participate in relevant performance evaluation studies.
9.9 Methanol dilution effect for extracted volatile organic analytes
Methanol extracts for high concentration volatile organics prepared according to Method 5035must be diluted to minimize adverse effects of methanol on the analytical instrumentation.However, solid samples with a significant moisture content (>10%) that are extracted prior toanalysis in a water miscible solvent such as methanol are diluted by the total volume of thesolvent/water mixture. The total mixture volume can only be calculated based on the samplemoisture present as determined by the % moisture determination. Therefore, in order to reportresults for samples containing significant moisture contents on an "as received" basis, the detectedconcentration needs to be corrected by the solvent/water dilution factor. See Sec. 11.10.5 for anexample of how the solvent/water dilution factor is determined and applied to the sampleconcentration calculation.
10.0 CALIBRATION AND STANDARDIZATION
Refer to the appropriate determinative method for detailed calibration and standardizationprocedures and the general guidance as noted in Sec. 11.0.
11.0 PROCEDURE
Extraction and cleanup are critical for the successful analyses of environmental samples andwastes. Analysts should pay particular attention to selection of sample preparation procedures toobtain reliable measurements.
11.1 Extraction
The individual determinative methods for organic analytes in SW-846 often recommendappropriate sample extraction procedures. General guidance on semivolatile extraction procedurescan be found in Method 3500. Guidance on volatile procedures can be found in Method 5000.
11.2 Cleanup and separation
The individual determinative methods for organic analytes in SW-846 often recommendappropriate cleanup procedures. General guidance on cleanup procedures can be found in Method3600. While some relatively clean matrices (such as ground water samples) may not requireextensive cleanups, the analyst should carefully balance the time savings gained by skippingcleanups against the potential increases in instrument down time and loss of data quality that can

8000C - 29 Revision 3March 2003
occur as a result.
11.3 Recommended chromatographic columns and instrument conditions are described ineach determinative method. As noted earlier, these columns and conditions are typically thoseused during the development and testing of the method. However, other chromatographic systemsmay have somewhat different characteristics. In addition, analytical instrumentation continues toevolve. Therefore, SW-846 methods allow analysts some flexibility to change these conditions (withcertain exceptions), as long as they demonstrate adequate performance.
Chromatographic performance is demonstrated by the resolution of standards and the abilityto model the response of the detector during calibration, and by the sensitivity, accuracy, precision,frequency of false positives, and frequency of false negatives during analysis. For anychromatographic procedure or conditions used, the laboratory must demonstrate that the performance satisfies the analytical requirements of the specific application for which thechromatographic procedure is being used. Such demonstrations should be performed using theprocedures outlined in Secs. 9.2 to 9.5 of this method and those in Chapter One.
11.4 Initial Calibration
Calibration of an analytical instrument involves the delineation of the relationship between theresponse of the instrument and the amount or concentration of an analyte introduced into theinstrument. The graphical depiction of this relationship is often referred to as the calibration curve.In order to perform quantitative measurements, this relationship, termed initial calibration, must beestablished before the analyses of any samples.
Historically, many analytical methods have relied on linear models of the calibrationrelationship, where the instrument response is directly proportional to the amount of a targetcompound. The linear model has many advantages, among them, simplicity and ease of use.However, given the advent of new detection techniques and the fact that many techniques cannotbe optimized for all of the analytes to which they may be applied, the analyst is increasingly likelyto encounter situations where the linear model neither applies nor is appropriate.
The initial calibration for SW-846 chromatographic methods involves the analysis of standardscontaining the target compounds at a minimum of five different concentrations covering the workingrange of the instrument. In order to produce acceptable sample results, the response of theinstrument must be within the working range established by the initial calibration.
Extrapolation of the calibration to concentrations above or below those of the actual calibrationstandards is not appropriate and may lead to significant quantitative errors, regardless of thecalibration model chosen. Analysts are advised that it may be necessary to prepare calibrationstandards that cover concentration ranges appropriate for specific projects or type of analyses. Forinstance, the analyst should not necessarily expect to perform a calibration appropriate for sub-ppblevel analyses and use the same calibration data for high-ppb or ppm level samples. Thepreparation of calibration standards is described in general terms in Sec. 11.4.1.
SW-846 methods for quantitative chromatographic analysis rely on one of three commonlyused calibration approaches:
• External standard calibration• Internal standard calibration• Isotope dilution calibration

8000C - 30 Revision 3March 2003
Each of these approaches is described in general terms in Secs. 11.4.2 through 11.4.4.
General calibration criteria are provided in Sec. 11.5 for GC and HPLC procedures usingnon-MS detection. Calibration procedures for GC/MS (e.g., Methods 8260, 8270, 8280, and 8290),HPLC/MS (e.g., Methods 8321 and 8325), and GC/FT-IR (e.g., Method 8410) are described inthose methods. Some determinative methods may provide specific guidance on calibration (e.g.,Method 8085 using GC/AED with compound-independent calibration).
Regardless of the specific calibration technique that is used, introduce each calibrationstandard into the instrument using the same technique used for the actual samples and using thesame volume used for samples. Tabulate the peak area or height responses against the mass orconcentration introduced, as described in Secs. 11.4.2 to 11.4.4.
11.4.1 Preparation of calibration standards
Calibration standards are prepared using procedures indicated in the determinativemethod of interest. However, the general procedure is described here.
11.4.1.1 For each analyte and surrogate of interest, prepare calibrationstandards at a minimum of five different concentrations by adding volumes of one ormore stock standards to volumetric flasks and diluting to volume with an appropriatesolvent. Alternatively, prepared standards may be purchased from commercialsuppliers, provided that they meet the objectives of the intended application.
NOTE: As noted in Sec. 1.9, it may not be practical or appropriate to attempt todetermine all the analytes listed in a given method simultaneously. Theanalyte lists in the determinative methods do not imply a regulatoryrequirement for the analysis of any or all of the compounds, but rather,indicate the method(s) which may be applicable to those analytes.Therefore, if an analyte is not relevant to a specific project, then it need notbe included in the calibration standards associated with that project.
11.4.1.2 The lowest concentration calibration standard that is analyzed duringan initial calibration establishes the method quantitation limit (MQL). The concentrationof the analyte in the lowest standard is related back to a sample concentration using thesample size, dilution, and final volume used for the specific analysis. Thus, changes tothe specific sample size and volumes that are employed will be reflected in the MQL forthose samples.
11.4.1.3 The other concentrations should define the working range of thedetector or correspond to the expected range of concentrations found in actual samplesthat are also within the working range of the detector. Standards that are prepared byserial dilution of a stock solution will typically form a geometric series where theconcentrations or amounts of each standard vary from the adjacent standards by aconstant factor, e.g., 10, 20, 40, 80, and 160 ng, all of which differ by a factor of 2.
However, the relatively wide spacing of the upper standards in a geometricseries could mask the situation where the detector is reaching saturation and theinstrument responses are leveling off somewhere between the last two standards.Therefore, it may be preferable to use a partial arithmetic series, where theconcentrations of the upper standards differ by a constant amount, not a constant factor.Using the same overall calibration range as in the example above, one such series
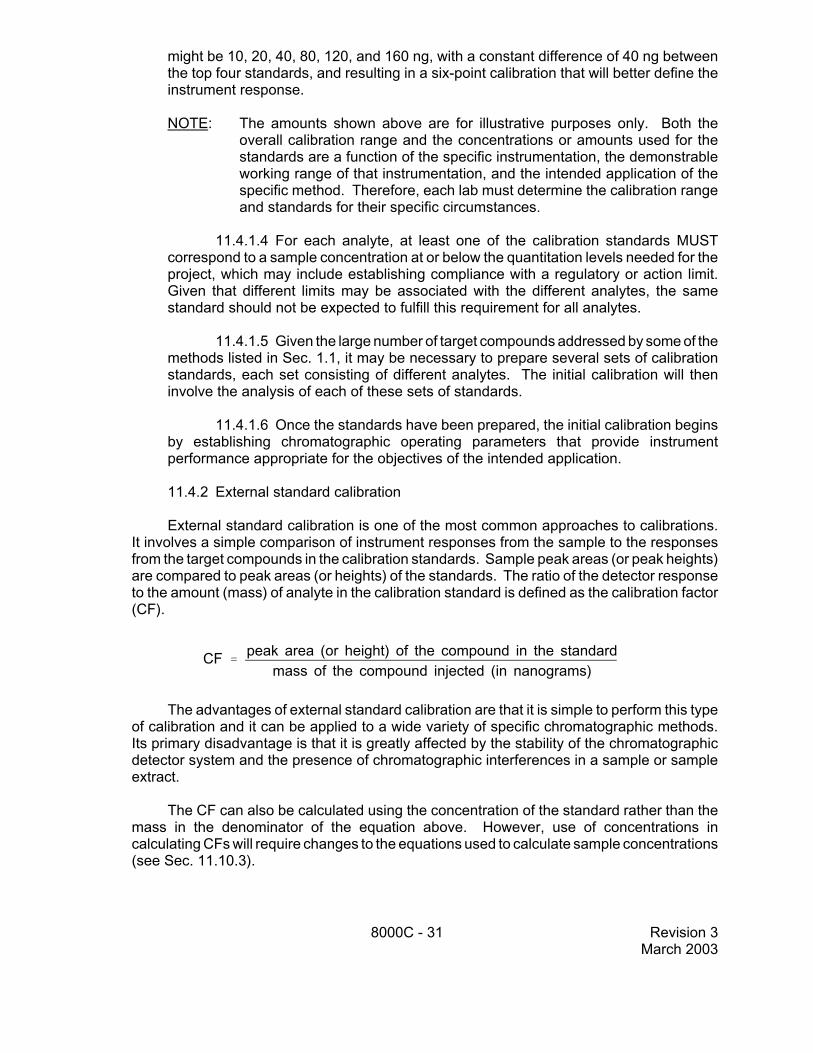
8000C - 31 Revision 3March 2003
CF 'peak area (or height) of the compound in the standard
mass of the compound injected (in nanograms)
might be 10, 20, 40, 80, 120, and 160 ng, with a constant difference of 40 ng betweenthe top four standards, and resulting in a six-point calibration that will better define theinstrument response.
NOTE: The amounts shown above are for illustrative purposes only. Both theoverall calibration range and the concentrations or amounts used for thestandards are a function of the specific instrumentation, the demonstrableworking range of that instrumentation, and the intended application of thespecific method. Therefore, each lab must determine the calibration rangeand standards for their specific circumstances.
11.4.1.4 For each analyte, at least one of the calibration standards MUSTcorrespond to a sample concentration at or below the quantitation levels needed for theproject, which may include establishing compliance with a regulatory or action limit.Given that different limits may be associated with the different analytes, the samestandard should not be expected to fulfill this requirement for all analytes.
11.4.1.5 Given the large number of target compounds addressed by some of themethods listed in Sec. 1.1, it may be necessary to prepare several sets of calibrationstandards, each set consisting of different analytes. The initial calibration will theninvolve the analysis of each of these sets of standards.
11.4.1.6 Once the standards have been prepared, the initial calibration beginsby establishing chromatographic operating parameters that provide instrumentperformance appropriate for the objectives of the intended application.
11.4.2 External standard calibration
External standard calibration is one of the most common approaches to calibrations.It involves a simple comparison of instrument responses from the sample to the responsesfrom the target compounds in the calibration standards. Sample peak areas (or peak heights)are compared to peak areas (or heights) of the standards. The ratio of the detector responseto the amount (mass) of analyte in the calibration standard is defined as the calibration factor(CF).
The advantages of external standard calibration are that it is simple to perform this typeof calibration and it can be applied to a wide variety of specific chromatographic methods.Its primary disadvantage is that it is greatly affected by the stability of the chromatographicdetector system and the presence of chromatographic interferences in a sample or sampleextract.
The CF can also be calculated using the concentration of the standard rather than themass in the denominator of the equation above. However, use of concentrations incalculating CFs will require changes to the equations used to calculate sample concentrations(see Sec. 11.10.3).

8000C - 32 Revision 3March 2003
RRT 'Retention time of the analyte
Retention time of the internal standard
For multi-component analytes (e.g. PCBs and Toxaphene), see the appropriatedeterminative method for information on which peaks to employ for the calculations.
11.4.3 Internal standard calibration
Internal standard calibration involves the comparison of the instrument responses fromthe target compounds in the sample to the responses of other standards added to the sampleor sample extract before injection. The response of the target compound is normalized to theresponse of the other standard. This other standard is called an internal standard becauseit is contained within the aliquot of the sample or sample extract that is actually injected intothe instrumentation.
A constant amount of the internal standard is added to all samples or extracts. Thatsame amount of the internal standard is also included in each of the calibration standards.The ratio of the peak area (or height) of the target compound in the sample or sample extractto the peak area (or height) of the internal standard in the sample or sample extract iscompared to a similar ratio derived for each calibration standard. This ratio is termed theresponse factor (RF) or relative response factor (RRF), indicating that the target compoundresponse is calculated relative to that of the internal standard.
The advantages of internal standard calibration include the fact that it can be used toaccount for routine variation in the response of the chromatographic system as well asvariations in the exact volume of sample or sample extract introduced into thechromatographic system. In addition to normalizing the response (peak area) of the targetcompound to the response of the internal standard in that sample or extract for that injection,the retention times of the target compound and the internal standard may be used to calculatethe relative retention time (RRT) of the target compound.
The RRT is expressed as a unitless quantity:
The RRT of each target analyte in each calibration standard should agree within ± 0.06RRT units. It is recognized here that with increasing retention times of the internal standard,target analytes will be able to more easily meet this criterion. Thus, care should be exercisedwhen selecting the appropriate internal standards by retention times. The process ofselecting internal standards to quantify target analytes should also include consideration ofretention times as they should be similar.
The RRT of the sample component should be within ± 0.06 RRT units of the RRT of thestandard component. If this criterion is not met and unless there are no other indicators ofa component’s identification such as a very unique but a high probability mass spectral matchthen that component may not be considered as identified by relative retention time.
The RRT evaluation allows the analyst to compensate for modest shifts in thechromatographic conditions that can occur due to interferences and simple day-to-dayinstrument variability. Many methods that employ internal standard calibration use more than

8000C - 33 Revision 3March 2003
one internal standard, and the target compounds are related to the internal standards on thebasis of the similarity of their respective chromatographic retention times.
The principal disadvantage to internal standard calibration is that the internal standardsmust be compounds that are not found in the samples to be analyzed and they must producean unambiguous response on the chromatographic detector system. Many SW-846 methodsrecommend brominated or fluorinated compounds and/or stable isotopically-labeled analogsof target compounds (e.g., a compound containing a deuterium atom instead of a hydrogenatom, or a 13C atom instead of a 12C atom) as internal standards. The isotopically-labeledcompounds are most often employed in methods that use mass spectrometric detectionsystems, since the detector can differentiate between the target compound and the internalstandard based on the added mass of the internal standard, even when the two compoundselute from the chromatographic system at the same retention time.
In many cases, internal standards are recommended in SW-846 methods. Thoserecommendations are based on the internal standards used during the development of themethod. Analysts may employ other internal standards in place of, or in addition to those thatmay be recommended. If internal standards are not recommended in the method, then theanalyst needs to select one or more internal standards that are similar in analytical behaviorto the compounds of interest, and not expected to be found in the samples.
Whichever internal standards are employed, the analyst needs to demonstrate that themeasurement of the internal standard is not affected by target analytes, surrogates, or bymatrix interferences. In general, internal standard calibration is not as useful for GC andHPLC methods with non-MS detectors because of the inability to chromatographically resolvemany internal standards from the target compounds. The use of MS detectors makes internalstandard calibration practical because the masses of the internal standards can be resolvedfrom those of the target compounds even when chromatographic resolution cannot beachieved.
When preparing calibration standards for use with internal standard calibration, add thesame amount of the internal standard solution to each calibration standard. Therefore, theconcentration of each internal standard is the same in each calibration standard, whereas theconcentrations of the target analytes will vary. The internal standard solution will contain oneor more internal standards and the concentration of the individual internal standards maydiffer within the spiking solution (e.g., not all internal standards need to be at the sameconcentration in this solution). The mass of each internal standard added to each sampleextract immediately before injection must be the same as the mass of the internal standardin each calibration standard. The volume of the solution spiked into sample extracts shouldbe such that minimal dilution of the extract occurs (e.g., 10 µL of solution added to a 1 mLfinal extract results in only a negligible 0.1% change in the final extract volume which can beignored in the calculations).
An ideal internal standard concentration would yield a response factor of 1 for eachanalyte. However, this is not practical when dealing with more than a few target analytes.Therefore, as a general rule, the internal standard should produce an instrument response(e.g., area counts) that is no more than 100 times that produced by the least responsive targetanalyte associated with the internal standard at the same concentration. This should resultin a minimum response factor of approximately 0.01 for the least responsive target compound.

8000C - 34 Revision 3March 2003
RF 'As × Cis
Ais × Cs
For each of the initial calibration standards, calculate the RF values for each targetcompound relative to one of the internal standards as follows:
where:
As = Peak area (or height) of the analyte or surrogate.Ais = Peak area (or height) of the internal standard.Cs = Mass of the analyte or surrogate in the sample aliquot introduced into the
instrument, in nanograms.Cis = Mass of the internal standard in the sample aliquot introduced into the instrument,
in nanograms.
Response factors for GC/MS methods may also be calculated using the sums of theareas of two ions (m/zs) for each target analyte and each internal standard.
Note that in the equation above, RF is unitless, i.e., the units from the two area termsand the two mass terms cancel out. Therefore, units other than nanograms may be used forthe amounts of the analyte, surrogate, and internal standard, provided that they are uniform.Previous versions of this method have used the concentration of the compound and theinternal standard, and the analyst may continue to employ the concentrations in thecalculations, but will have to make adjustments to the equations for the calculation of thesample results if the concentration is used here.
Because internal standards are used to compensate for routine variations in thechromatographic separation of the target compounds, there is a significant advantage to usingmore than one internal standard when dealing with a large number of target compounds, orwhen those compounds elute over a long time frame. When multiple internal standards areemployed, the target compounds are associated with the internal standards on the basis oftheir respective retention times, so the internal standards should be chosen to cover the rangeof expected retention times of the target compounds. When used in this fashion, the internalstandards can compensate for small retention time shifts or responses changes in the portionof the chromatographic run in which they occur, rather than affecting all of the targetcompounds. Ideally, the analyst will employ enough internal standards to result in a relativeretention time (RRT) for each target compound in the range of 0.80 to 1.20. However, otherRRT ranges may be appropriate as well.
Many methods that utilize internal standard calibration include acceptance limits for theresponses of the internal standards in the calibration standards, the samples, or both. Thoselimits are typically expressed in terms of peak areas, since the actual concentration of theinternal standard cannot be measured directly (e.g., one has to assume that what wasinjected into the sample or sample extract is all present during analysis). Common consensuslimits are 50 to 200% of the area of the internal standard in a recent calibration standard. Thisis simply a factor of 2, and the limits are used as a gross diagnostic check on the addition of

8000C - 35 Revision 3March 2003
the internal standards to the samples or extracts, and on the injection of the sample aliquotinto the instrument.
In the absence of observed interferences, very low internal standard areas, especiallywhen all the internal standards are affected, suggest an incorrect injection by the analyst orthe autosampler. Internal standard areas well above 200% may indicate other problems. Thefactor of 2 simply provides reasonable protection against gross errors during the analysis;however, other acceptance limits may serve the same diagnostic purpose. The limits are alsouseful in delineating those samples where interferences make it difficult to measure theinternal standard areas accurately, which in turn, may indicate difficulties in measuring theresponses of the target analytes.
11.4.4 Isotope dilution calibration
Isotope dilution calibration is essentially a special case of internal standard calibration.In isotope dilution, the internal standards are stable isotopically-labeled analogs of the targetanalytes and they are added to the sample prior to any sample handling steps, includingsample extraction. Because the spiked compounds differ from the target compounds only inthe presence of the stable isotopes, the physical and chemical behavior of each labeledcompound is virtually the same as its unlabeled "native" analog. Thus, any losses of thetarget compound that may occur during any of the sample preparation, extraction, cleanup,or determinative steps will be mirrored by a similar loss of the labeled standard. The samesimilarities between the labeled compounds and their native analogs means that the responsefactors and relative retention times for the unlabeled compounds are both very close to 1.0.
The labeled compounds are spiked into the sample at a constant amount, and thatamount of labeled standard is also present in the calibration standards. The response factorsdeveloped from the calibration standards assume that all of the labeled compound added tothe sample reaches the instrument. Thus, for example, if one adds 100 units of labeledanalog to the sample, then there must be 100 units of the labeled analog in each of thecalibration standards, and the calibration routine assumes that all 100 units are present in thealiquot that is analyzed. This assumption allows one to correct the observed concentrationof the target compound for the loss (or apparent gain) of the labeled compound. Thiscorrection is termed the recovery correction.
The degree to which the labeled compounds meet this assumption is monitored throughthe use of traditional internal standards that are added to the sample extract immediately priorto injection. Separate response factors relate the concentrations of the labeled compoundsto the traditional internal standards. Most isotope dilution methods include some limits on theapparent recovery of the labeled compounds. However, those limits are often consensuslimits that may be overly conservative. As long as the responses for both the native andlabeled compounds can be distinguished from the background instrumental noise, isotopedilution calibration can provide excellent results, even when the apparent recovery of thelabeled compound is as low as 5 to 10% of its spiked concentration. The limits allow labeledcompound recoveries over 100% as well. Such recoveries can occur as a result of theinherent variability in the calibration of the labeled compounds themselves, and are notindicative of contamination or other problems.
The built-in recovery correction is one of the principal advantages of isotope dilutioncalibration. Early studies by EPA demonstrated that, compared to traditional internal standard

8000C - 36 Revision 3March 2003
analyses, isotope dilution generally produces data that are more precise as well as with lessbias.
The principal disadvantages of isotope dilution calibration are that it can only beemployed for methods that use a mass spectrometric detection system, that not all targetcompounds of interest have labeled analogs, and that it involves added expense for thelabeled compounds. The mass spectrometer is necessary in order to distinguish the nativeand labeled compounds from one another on the basis of their masses when they may notbe completely separated by the chromatographic system. Isotope dilution would be difficult,if not impossible, to accomplish with an electron-capture detector or other non-specificdetector.
Labeled analogs are available for a wide range of compounds that are environmentalcontaminants, in part because these compounds are used in isotope dilution methods fromother EPA programs (e.g, the 1600 Series methods from the EPA Office of Water began asisotope dilution versions of the common 600 Series GC/MS methods). However, not allcompounds of interest to RCRA have labeled analogs that are commercially available.
The added cost of the labeled compounds is a disadvantage, but it can often be offsetby the added precision and accuracy of the results, as well as the possibility of eliminatingsome routine QC analyses that are used with internal standard calibration. For example, ifthe labeled analogs of the target compounds are all spiked into each sample prior toextraction, then there is relatively little added benefit to preparing the more traditional matrixspike/matrix spike duplicate pair, since the MS/MSD pair will not tell you much newinformation that cannot be derived from the recoveries of the labeled compounds measuredrelative to the traditional internal standards. Moreover, even if MS/MSD results are produced,it would never be appropriate to apply an additional recovery correction to the results from anisotope dilution method. However, the decision to prepare MS/MSD aliquots or not shouldbe described in an approved QA plan or sampling and analysis plan for a given project, andnot left to the analyst's discretion.
Isotope dilution calibration is often used in conjunction with selected ion monitoring(SIM) GC/MS procedures, such as those for polychlorinated dibenzo-p-dioxins andpolychlorinated dibenzofurans. Using these procedures the relatively small list of targetcompounds allows the instrument to be operated in a mode that looks only at those ions(m/zs) that correspond to the target compounds and their labeled analogs, therebysignificantly increasing the sensitivity of the method and reducing interferences.
Because isotope dilution methods have acceptance limits for the recoveries of thelabeled analogs added to the samples prior to extraction or other sample preparation steps,they typically do not also contain limits on the responses of the traditional internal standardsused to monitor those recoveries. This is because, as noted above, as long as the responseof the labeled analog can be distinguished from the instrumental noise, the recoverycorrection inherent in the isotope dilution procedure provides sufficient control over theanalytical process. Formal limits on internal standard areas in this case would provide littleadded benefit in routine sample analyses, and would be of diagnostic value in only a verysmall portion of analyses.
The response factor calculations for isotope dilution calibration parallel those for internalstandard calibration. Response factors are calculated for each target compound relative toits labeled analog and for each labeled analog relative to the traditional internal standard
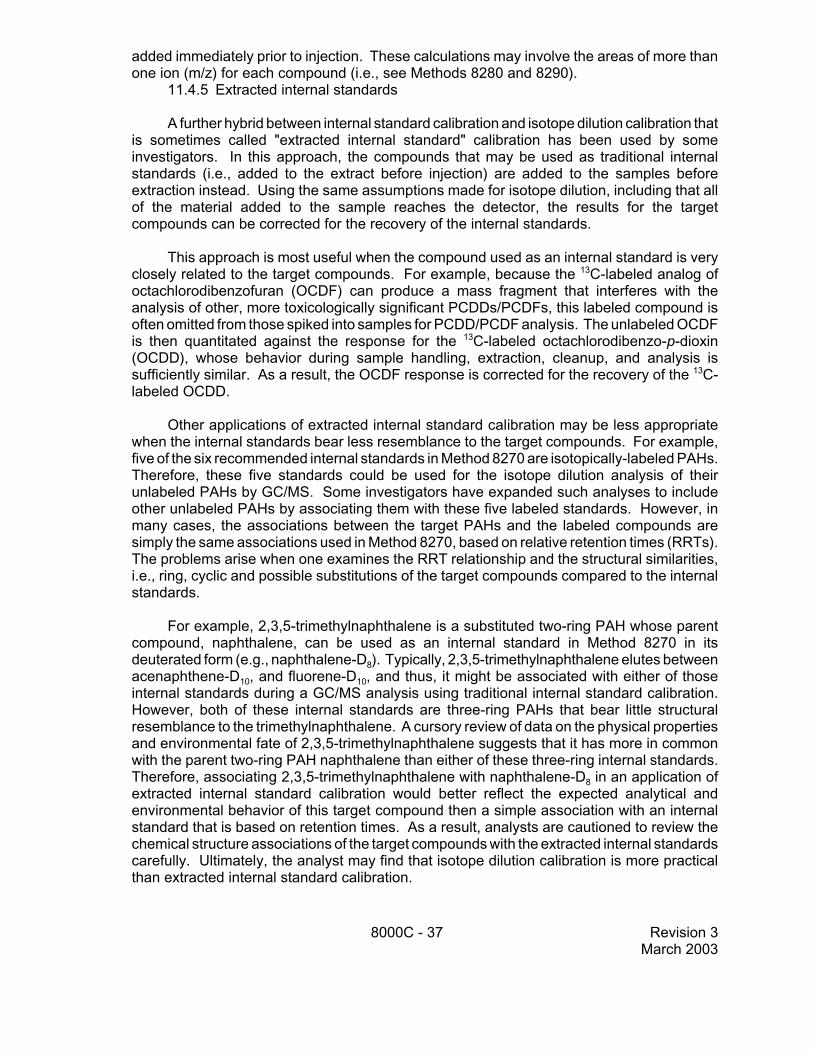
8000C - 37 Revision 3March 2003
added immediately prior to injection. These calculations may involve the areas of more thanone ion (m/z) for each compound (i.e., see Methods 8280 and 8290).
11.4.5 Extracted internal standards
A further hybrid between internal standard calibration and isotope dilution calibration thatis sometimes called "extracted internal standard" calibration has been used by someinvestigators. In this approach, the compounds that may be used as traditional internalstandards (i.e., added to the extract before injection) are added to the samples beforeextraction instead. Using the same assumptions made for isotope dilution, including that allof the material added to the sample reaches the detector, the results for the targetcompounds can be corrected for the recovery of the internal standards.
This approach is most useful when the compound used as an internal standard is veryclosely related to the target compounds. For example, because the 13C-labeled analog ofoctachlorodibenzofuran (OCDF) can produce a mass fragment that interferes with theanalysis of other, more toxicologically significant PCDDs/PCDFs, this labeled compound isoften omitted from those spiked into samples for PCDD/PCDF analysis. The unlabeled OCDFis then quantitated against the response for the 13C-labeled octachlorodibenzo-p-dioxin(OCDD), whose behavior during sample handling, extraction, cleanup, and analysis issufficiently similar. As a result, the OCDF response is corrected for the recovery of the 13C-labeled OCDD.
Other applications of extracted internal standard calibration may be less appropriatewhen the internal standards bear less resemblance to the target compounds. For example,five of the six recommended internal standards in Method 8270 are isotopically-labeled PAHs.Therefore, these five standards could be used for the isotope dilution analysis of theirunlabeled PAHs by GC/MS. Some investigators have expanded such analyses to includeother unlabeled PAHs by associating them with these five labeled standards. However, inmany cases, the associations between the target PAHs and the labeled compounds aresimply the same associations used in Method 8270, based on relative retention times (RRTs).The problems arise when one examines the RRT relationship and the structural similarities,i.e., ring, cyclic and possible substitutions of the target compounds compared to the internalstandards.
For example, 2,3,5-trimethylnaphthalene is a substituted two-ring PAH whose parentcompound, naphthalene, can be used as an internal standard in Method 8270 in itsdeuterated form (e.g., naphthalene-D8). Typically, 2,3,5-trimethylnaphthalene elutes betweenacenaphthene-D10, and fluorene-D10, and thus, it might be associated with either of thoseinternal standards during a GC/MS analysis using traditional internal standard calibration.However, both of these internal standards are three-ring PAHs that bear little structuralresemblance to the trimethylnaphthalene. A cursory review of data on the physical propertiesand environmental fate of 2,3,5-trimethylnaphthalene suggests that it has more in commonwith the parent two-ring PAH naphthalene than either of these three-ring internal standards.Therefore, associating 2,3,5-trimethylnaphthalene with naphthalene-D8 in an application ofextracted internal standard calibration would better reflect the expected analytical andenvironmental behavior of this target compound then a simple association with an internalstandard that is based on retention times. As a result, analysts are cautioned to review thechemical structure associations of the target compounds with the extracted internal standardscarefully. Ultimately, the analyst may find that isotope dilution calibration is more practicalthan extracted internal standard calibration.

8000C - 38 Revision 3March 2003
11.5 Calibration acceptance criteria
Guidance is provided on the handling of initial calibration curve modeling. The ensuingsections address the construction (Secs. 11.5.1, 11.5.2, and 11.5.3), statistics (Secs. 11.5.1.2,11.5.2.2, and 11.5.3.2), an additional recommended check of the model (Sec. 11.5.5.1),recommended corrective actions (Sec. 11.5.5.2), and the calculations of sample amounts (Secs.11.5.1.4 and 11.5.3.3). The acceptance criteria for an initial calibration are based on the statisticsgenerated from curve construction. Acceptance criteria found in the determinative methodsupercede criteria found in this method. Problematic compounds cannot be addressed in thismethod - see the determinative method for specific guidance.
SW-846 chromatographic methods allow the use of both linear and non-linear models for thecalibration data, as described below. Given the limitations in instrument data systems, it is likelythat the analyst will have to choose one model for all analytes in a particular method. Both modelscan be applied to either external or internal standard calibration data. This section providesrecommended acceptance criteria for initial calibrations using either linear or non-linear models.
NOTE: The option for non-linear calibration may be necessary to address specific instrumentaltechniques. However, it is not EPA's intent to allow non-linear calibration to be used tocompensate for detector saturation or to avoid proper instrument maintenance.
The calibration model must be continuous and monotonic. In addition to the acceptancecriteria found for each of the calibration models, it is recommended that each calibration model beinspected to ensure that the data are representative of the model chosen. This inspection isdescribed in Sec. 11.5.5.1.
Whatever calibration model is selected, samples with concentrations that exceed thecalibration range must be diluted to fall within the range.
NOTE: The following sections describe various options for initial calibration and provide thecalibration acceptance criteria used to evaluate each option. The criteria listed in thesesections are designed for quantitation of trace level concentrations of the analytes ofinterest. If data of lesser quality will satisfy project-specific data needs, then lessstringent criteria may be employed provided that they are documented and approvedin a project-specific QA project plan.
The choice of a specific calibration model should be made in one of two ways. The first wayis to begin with the simplest approach, the linear model through the origin, and then progressthrough other options until the calibration acceptance criteria are met. The second way is to usea priori knowledge of the detector response to the target compound to choose the calibration model.Such knowledge may come from previous experience, knowledge of the physics of the detector,or specific manufacturer's recommendations.
11.5.1 Linear calibration using the average calibration or response factor
When calculated as described in Sec. 11.4, both calibration factors and response factorsare measures of the slope of the calibration relationship. Each calibration or response factorrepresents the slope of the line between the response for a given standard and the origin.Under ideal conditions, the factors will not vary with the concentration of the standard. Inpractice, some variation is to be expected. However, when the variation, measured as therelative standard deviation (RSD) of the factors, is less than or equal to 20%, then the slopes

8000C - 39 Revision 3March 2003
SD '
jn
i'1(CFi&CF)2
n&1SD '
jn
i'1(RFi&RF)2
n&1
mean CF ' CF '
jn
i'1CFi
nmean RF ' RF '
jn
i'1RFi
n
RSD 'SDCF
× 100 RSD 'SDRF
× 100
of the lines for each standard are sufficiently close to one another that the use of the linear modelis generally appropriate over the range of standards that are analyzed.
NOTE: Although each calibration or response factor involves a theoretical line from theorigin to the response for a given standard, linearity through zero is amathematical model which is used to help define the relationships between thepoints of the calibration range and it is NOT a rationale for reporting resultsbelow the calibration range demonstrated by the analysis of the standards.
To evaluate the linearity of the initial calibration, calculate the mean CF (externalstandard calibration) or RF (internal standard calibration), the standard deviation (SD), andthe RSD as follows:
where n is the number of calibration standards and RSD is expressed as a percentage (%).
11.5.1.1 If the RSD of the calibration or response factors is less than or equalto 20% over the calibration range, then the slopes of the lines for each standard aresufficiently close to one another that the use of the linear model is generally appropriateover the range of standards that are analyzed, and the average calibration or responsefactor may be used to determine sample concentrations.
NOTE: There is no direct relationship between the historically-used RSDacceptance limit of 20% and a specific value of the correlationcoefficient, r, from a linear regression, and none should be inferred.
11.5.1.2 Given the potentially large numbers of analytes that may be analyzedin some methods, it is likely that some analytes may exceed the 20% acceptance limitfor the RSD for a given calibration. In those instances, it is recommended, but notrequired, that corrective actions as described in section 11.5.5.2 be followed. Sections

8000C - 40 Revision 3March 2003
xs 'As
CFand xs '
As
RF×
Cis
Ais
11.5.1.3 and 11.5.5.2 also provide alternative uses for initial calibrations that do notmeet their criteria of acceptability.
11.5.1.3 Grand mean RSD
The previous version of Method 8000 introduced an allowance for the grandmean of the calibration or response factors for all analytes to be used to evaluatelinearity under a limited set of circumstances. EPA's intent was to allow the analyst touse the linear model and the RSD to calibrate the target compounds even when a smallnumber of individual RSD values were not unreasonably above the 20% acceptancelimit.
However, EPA did not place specific limits on the number of compounds withRSD values over 20% nor an upper limit on the RSD values that could be considered,and as a result, the practice was widely abused. THEREFORE, THE ALLOWANCEFOR THE USE OF THE GRAND MEAN RSD TO EVALUATE CALIBRATIONLINEARITY HAS BEEN WITHDRAWN AND ALL TARGET COMPOUNDS SHOULDHAVE RSDs LESS THAN OR EQUAL TO 20%. Should the criteria for the %RSD notbe met by a targeted analyte this would not invalidate the acceptability of the initialcalibration for other analytes that have met their criteria. Information obtained from theinitial calibration of targeted analytes not meeting the acceptability criteria may haveother uses such as screening and estimation of quantitation (see Sec. 11.5.5.2), butthose alternative uses should still fit the needs of the project objectives. Depending onthe circumstances and specific project requirements there may be exceptions for otheroptions such as data qualification and alternative means of target analyte quantitation.
11.5.1.4 Calculation of sample amounts
If all of the conditions in Secs. 11.5.1.1 and 11.5.1.2 are met, then the averagecalibration or response factor may be used to determine sample concentrations, asdescribed in Sec. 11.10. It is recommended that the curve generated by the averagecalibration or response factor be examined for acceptability using the re-fitting checkdescribed in Section 11.5.5.1. The calculations for the amount introduced into theinstrument, xs, are:
where:
xs = Calculated mass of the analyte or surrogate in the sample aliquot introducedinto the instrument (in nanograms).
As = Peak area (or height) of the analyte or surrogate in the sample.Ais = Peak area (or height) of the internal standard in the sample.Cis = Mass of the internal standard in the sample aliquot introduced into the
instrument (in nanograms).C&F& = The average calibration factor from the most recent initial calibration.R&F& = The average response factor from the most recent initial calibration.
The units for the mass of analyte should be the same units used to calculate thecalibration or response factors. If alternate units are used for the amount (e.g., µg/L),
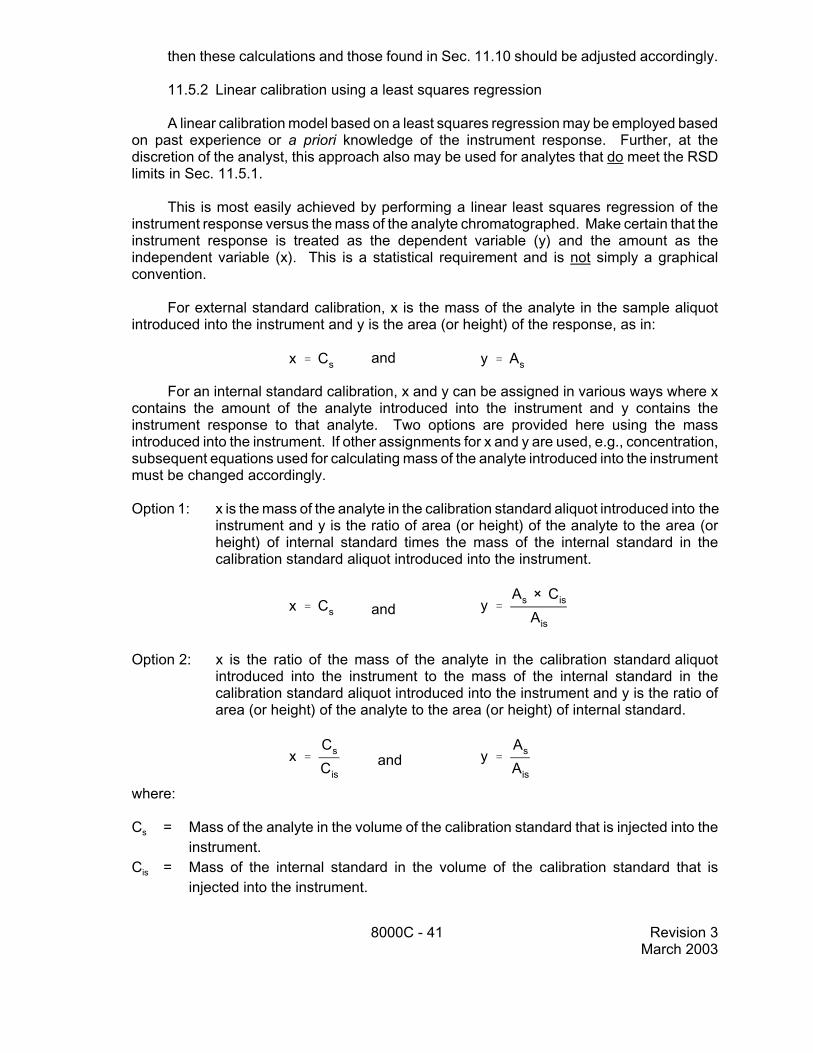
8000C - 41 Revision 3March 2003
x ' Cs
x 'Cs
Cis
y 'As × Cis
Ais
y 'As
Ais
x ' Cs y ' As
then these calculations and those found in Sec. 11.10 should be adjusted accordingly.
11.5.2 Linear calibration using a least squares regression
A linear calibration model based on a least squares regression may be employed basedon past experience or a priori knowledge of the instrument response. Further, at thediscretion of the analyst, this approach also may be used for analytes that do meet the RSDlimits in Sec. 11.5.1.
This is most easily achieved by performing a linear least squares regression of theinstrument response versus the mass of the analyte chromatographed. Make certain that theinstrument response is treated as the dependent variable (y) and the amount as theindependent variable (x). This is a statistical requirement and is not simply a graphicalconvention.
For external standard calibration, x is the mass of the analyte in the sample aliquotintroduced into the instrument and y is the area (or height) of the response, as in:
and
For an internal standard calibration, x and y can be assigned in various ways where xcontains the amount of the analyte introduced into the instrument and y contains theinstrument response to that analyte. Two options are provided here using the massintroduced into the instrument. If other assignments for x and y are used, e.g., concentration,subsequent equations used for calculating mass of the analyte introduced into the instrumentmust be changed accordingly.
Option 1: x is the mass of the analyte in the calibration standard aliquot introduced into theinstrument and y is the ratio of area (or height) of the analyte to the area (orheight) of internal standard times the mass of the internal standard in thecalibration standard aliquot introduced into the instrument.
and
Option 2: x is the ratio of the mass of the analyte in the calibration standard aliquotintroduced into the instrument to the mass of the internal standard in thecalibration standard aliquot introduced into the instrument and y is the ratio ofarea (or height) of the analyte to the area (or height) of internal standard.
and
where:
Cs = Mass of the analyte in the volume of the calibration standard that is injected into theinstrument.
Cis = Mass of the internal standard in the volume of the calibration standard that isinjected into the instrument.
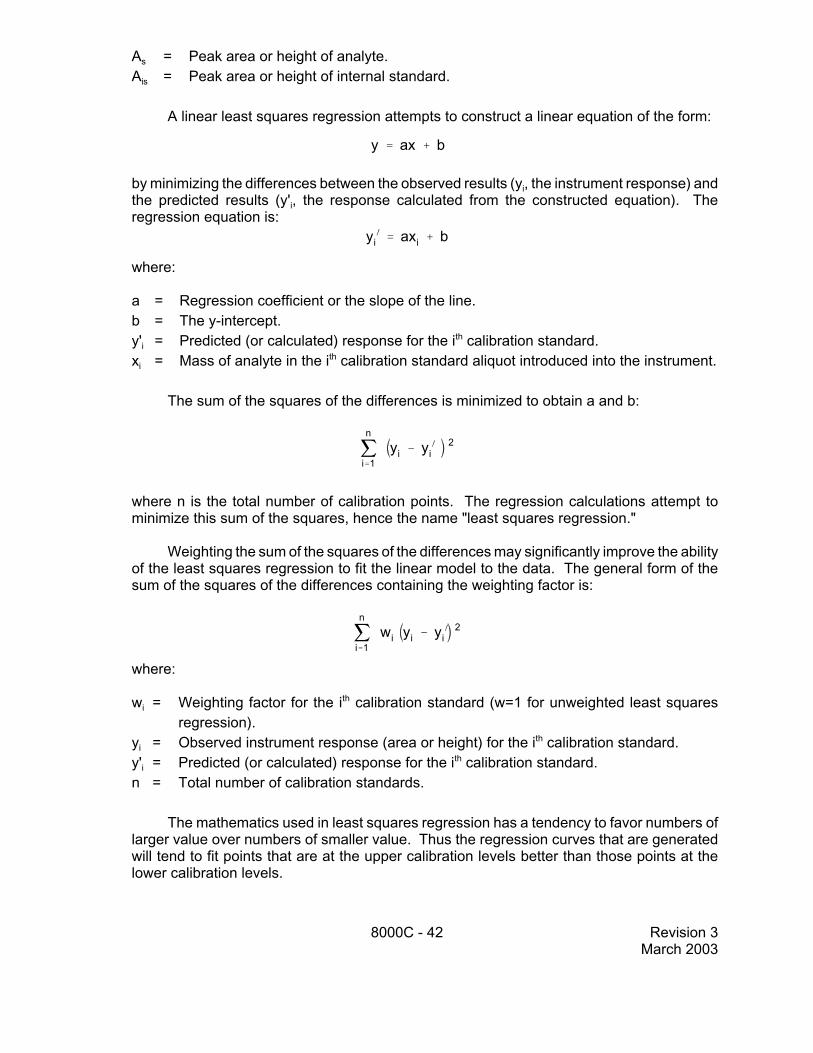
8000C - 42 Revision 3March 2003
jn
i'1wi yi & yi
) 2
jn
i'1yi & yi
) 2
y ' ax % b
yi) ' axi % b
As = Peak area or height of analyte.Ais = Peak area or height of internal standard.
A linear least squares regression attempts to construct a linear equation of the form:
by minimizing the differences between the observed results (yi, the instrument response) andthe predicted results (y'i, the response calculated from the constructed equation). Theregression equation is:
where:
a = Regression coefficient or the slope of the line.b = The y-intercept.y'i = Predicted (or calculated) response for the ith calibration standard.xi = Mass of analyte in the ith calibration standard aliquot introduced into the instrument.
The sum of the squares of the differences is minimized to obtain a and b:
where n is the total number of calibration points. The regression calculations attempt tominimize this sum of the squares, hence the name "least squares regression."
Weighting the sum of the squares of the differences may significantly improve the abilityof the least squares regression to fit the linear model to the data. The general form of thesum of the squares of the differences containing the weighting factor is:
where:
wi = Weighting factor for the ith calibration standard (w=1 for unweighted least squaresregression).
yi = Observed instrument response (area or height) for the ith calibration standard.y'i = Predicted (or calculated) response for the ith calibration standard.n = Total number of calibration standards.
The mathematics used in least squares regression has a tendency to favor numbers oflarger value over numbers of smaller value. Thus the regression curves that are generatedwill tend to fit points that are at the upper calibration levels better than those points at thelower calibration levels.
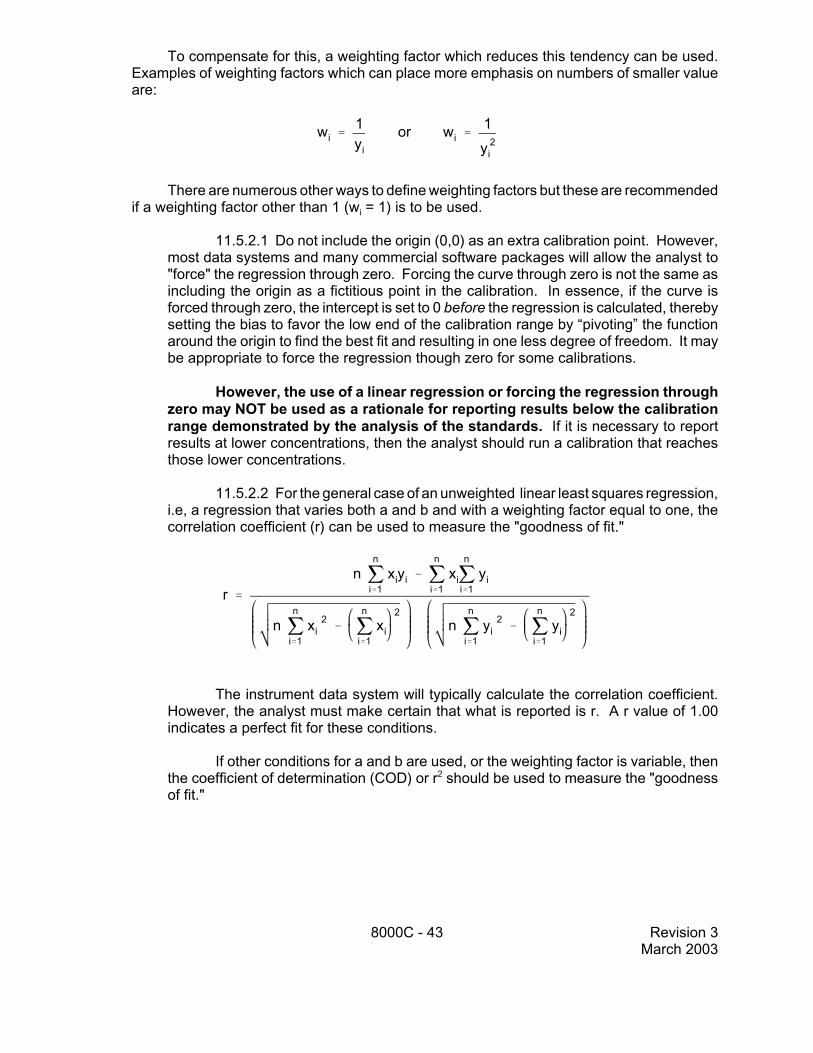
8000C - 43 Revision 3March 2003
wi '1yi
or wi '1y 2
i
r '
n jn
i'1xiyi & j
n
i'1xij
n
i'1yi
n jn
i'1x 2
i & jn
i'1xi
2n j
n
i'1y 2
i & jn
i'1yi
2
To compensate for this, a weighting factor which reduces this tendency can be used.Examples of weighting factors which can place more emphasis on numbers of smaller valueare:
There are numerous other ways to define weighting factors but these are recommendedif a weighting factor other than 1 (wi = 1) is to be used.
11.5.2.1 Do not include the origin (0,0) as an extra calibration point. However,most data systems and many commercial software packages will allow the analyst to"force" the regression through zero. Forcing the curve through zero is not the same asincluding the origin as a fictitious point in the calibration. In essence, if the curve isforced through zero, the intercept is set to 0 before the regression is calculated, therebysetting the bias to favor the low end of the calibration range by “pivoting” the functionaround the origin to find the best fit and resulting in one less degree of freedom. It maybe appropriate to force the regression though zero for some calibrations.
However, the use of a linear regression or forcing the regression throughzero may NOT be used as a rationale for reporting results below the calibrationrange demonstrated by the analysis of the standards. If it is necessary to reportresults at lower concentrations, then the analyst should run a calibration that reachesthose lower concentrations.
11.5.2.2 For the general case of an unweighted linear least squares regression,i.e, a regression that varies both a and b and with a weighting factor equal to one, thecorrelation coefficient (r) can be used to measure the "goodness of fit."
The instrument data system will typically calculate the correlation coefficient.However, the analyst must make certain that what is reported is r. A r value of 1.00indicates a perfect fit for these conditions.
If other conditions for a and b are used, or the weighting factor is variable, thenthe coefficient of determination (COD) or r2 should be used to measure the "goodnessof fit."

8000C - 44 Revision 3March 2003
COD '
jn
i'1yi & y 2
&n & 1n & p j
n
i'1yi & yi
) 2
jn
i'1yi & y 2
x '(y & b)
a
xs '(As & b)
a
where:
yi = Observed instrument response (area or height) for the ith calibration standard.–y = Mean observed instrument response for n calibration standards.yi' = Predicted (or calculated) response for the ith calibration standard.n = Total number of calibration standards.p = Number of adjustable parameters in the equation (if a and b are made to vary
for a normal linear equation then p=2; for a second order polynomial wherethe adjustable parameters are a, b, and c, p=3; if any of these parameters areheld constant, then p is reduced by one).
A COD value of 1.00 indicates that all the known variability is equal to the totalvariability between the calibration data and the regression model.
Most instrument data systems calculate an r2 term as a coefficient describingcorrelation. This statistic should not be confused with the correlation coefficient (r); theyare NOT related. The r2 term is more closely related to the COD as described above.As with the COD, a r2 value of 1.00 indicates a perfect fit.
In order for the linear regression model to be used for quantitative purposes, r,COD, or r2 must be greater than or equal to 0.99 and it is recommended that theresulting calibration "curve" be inspected by the analyst, as described in Sec. 11.5.5.1.
11.5.2.3 To calculate the mass of the analyte in the sample aliquot introducedinto the instrument (x), the regression equation is rearranged to:
Using external standard calibration, the mass of the analyte in the sample aliquotintroduced into the instrument is calculated as:
For the internal standard method, the calculation will depend on which of the twooptions was chosen earlier.

8000C - 45 Revision 3March 2003
option 1 xs '
As × Cis
Ais
& b
a
option 2 xs '
As
Ais
& b
a× Cis
y ' ax 3 % bx 2 % cx % d
where:
xs = Calculated mass of the analyte or surrogate in the sample aliquot introducedinto the instrument (in nanograms).
As = Peak area (or height) of the analyte or surrogate in the sample.Ais = Peak area (or height) of the internal standard in the sample.Cis = Mass of the internal standard in the sample aliquot introduced into the
instrument (in nanograms).
The units for the mass of analyte should be the same units used to determine theregression equation. If alternate units such as concentrations are used, then the calculationsfor the final sample concentrations found in Sec. 11.10 should be adjusted accordingly.
11.5.3 Non-linear calibration
In situations where the analyst knows that the instrument response does not follow alinear model over a sufficiently wide working range, or when the other approaches describedhere have not met the acceptance criteria, a non-linear calibration model may be employed.
NOTE: It is not EPA's intent to allow non-linear calibration to be used to compensate fordetector saturation or to avoid proper instrument maintenance. Thus, non-linearcalibration should not be employed for methods or instruments previously shownto exhibit linear calibration for the analytes of interest.
When using a calibration model for quantitation, the curve must be continuous,continuously differentiable and monotonic over the calibration range. The model chosenshould have no more than four parameters, i.e., if the model is polynomial, it may be no morethan third order, as in the equation:
As noted above, the model must be continuous. A curve is continuous when it hasconsecutive numerical values along the function, whether increasing or decreasing, andwithout having breaks in the function (i.e., the pen shall never leave the paper from theminimum to the maximum range of the calibration). The model must also be continuouslydifferentiable, such that all derivatives of the function are continuous functions themselves,

8000C - 46 Revision 3March 2003
y ' f(a,b,c,d,x)
and monotonic, such that all tangent lines of the derivative to all of the points on thecalibration curve have either only positive or negative slopes.
For any model, including polynomials as described previously, the model chosen shouldinclude no more than four parameters, i.e.,
where "f" indicates a function with up to four parameters, a through d, and x is theindependent variable.
As for the linear regression model, in estimating model parameters for the calibrationdata, the instrumental response (y) must be treated as the dependent variable, and theamount of the calibration standard (x) must be the independent variable. Unless a true zeroamount has been fully characterized for calibration, the origin (0,0) should not be included.
Model estimates from the regression must be used as calculated, e.g., no term (a, b,c, or d) calculated as a result of the least squares regression can be modified. Weighting ina calibration model may significantly improve the ability of the least squares regression to fitthe data.
11.5.3.1 The statistical considerations in developing a non-linear calibrationmodel require more data than the more traditional linear approaches described above.Whereas SW-846 methods employ five standards for a linear (first order) calibrationmodel, a quadratic (second order) model requires six standards, and a third orderpolynomial requires seven standards.
Linear and non-linear least squares regressions are mathematical methods thatminimize the differences (the residuals) between the observed instrument response, yi,and the calculated response, yi’, by adjusting the coefficients of the polynomial (a, b, c,and d, above) to obtain the polynomial that best fits the data.
The coefficient of determination (COD) or r2 can be used as a measure of the“goodness of fit.” See Sec. 11.5.2.2 for the definition of the COD.
11.5.3.2 Under ideal conditions, with a "perfect" fit of the model to the data, thecoefficient of the determination or r2 will equal 1.00. In order to be an acceptable non-linear calibration, the COD or r2 must be greater than or equal to 0.99 and it isrecommended that the resulting calibration "curve" be inspected by the analyst, asdescribed in Sec. 11.5.5.1.
As noted in Sec. 11.5, whichever of these options is employed, a unique analyteor surrogate concentration must fall within the calibration range. Analysts are advisedto check both second and third order calibration models to ensure that this holds true(i.e., all tangents to the curve within the calibration range are of the same sign and notangent is zero). Samples with concentrations that exceed the calibration range mustbe diluted to fall within the range.
11.5.3.3 Non-linear equations such as second and third order polynomials aredifficult to use when solving for x given a y which contains the response of aninstrument. Quadratic equations such as:

8000C - 47 Revision 3March 2003
xs '&b ± b 2 & 4a(c & As)
2a
xs '
&b ± b 2 & 4a(c &As×Cis
Ais
)
2a
xs '
&b ± b 2 & 4a(c &As
Ais
)
2a× Cis
f(x) ' f(a,b,c,d,x) & y ' 0
y ' f(a,b,c,d,x)
y ' ax 2 % bx % c
x '&b ± b 2 & 4a(c & y)
2a
can be evaluated by using the following formula:
However, care MUST be exercised to assure that the results from this equation are real,positive, and fit the range of the initial calibration.
For external standard calibration, calculate the mass of the analyte in the sampleintroduced into the instrument with:
When using the internal standard technique the calculated mass of the analytein the sample introduced into the instrument is determined as follows depending on thepreviously selected option for the x and y terms:
Option 1:
Option 2:
Other non-linear models can be evaluated using Newton’s method forapproximating the root of the equation. This method is an iterative procedure that canconverge on a result very rapidly.
Given the equation from Section 11.5.3
Define the equation:
Make a rough estimate for f(x1) using a response factor or linear least squarescalculation. Then iterate the following equation:

8000C - 48 Revision 3March 2003
xn%1 ' xn &f(xn)fN(xn)
xs ' xn%1
xs ' xn%1
xs ' xn%1 Cis
where:
xn+1 = the next rough estimate.f’(xn) = the first derivative of f(xn).
until xn and xn+1 are approximately equal to each other to at least three significantfigures.
Caution should also be taken here to assure that there is convergence and thatthere is neither a maximum nor minimum inflection within the range of the initialcalibration (i.e., all tangents to the curve are of the same sign and not zero).
Thus, by the external standard calibration method, the mass of the analyte in thesample aliquot introduced into the instrument is calculated as:
where:
xn+1 = the result of the final iteration.y = As, the observed instrument response and used to determine f(x).
and by the internal standard calibration method:
option 1:
option 2:
where:
xs = Calculated mass of the analyte or surrogate in the sample aliquot introducedinto the instrument (in nanograms).
xn+1 = The result of the final iteration.Cis = Mass of the internal standard in the sample aliquot introduced into the
instrument.y = The ratio of observed instrument responses of analyte to internal standard
dependent on the choice of options.
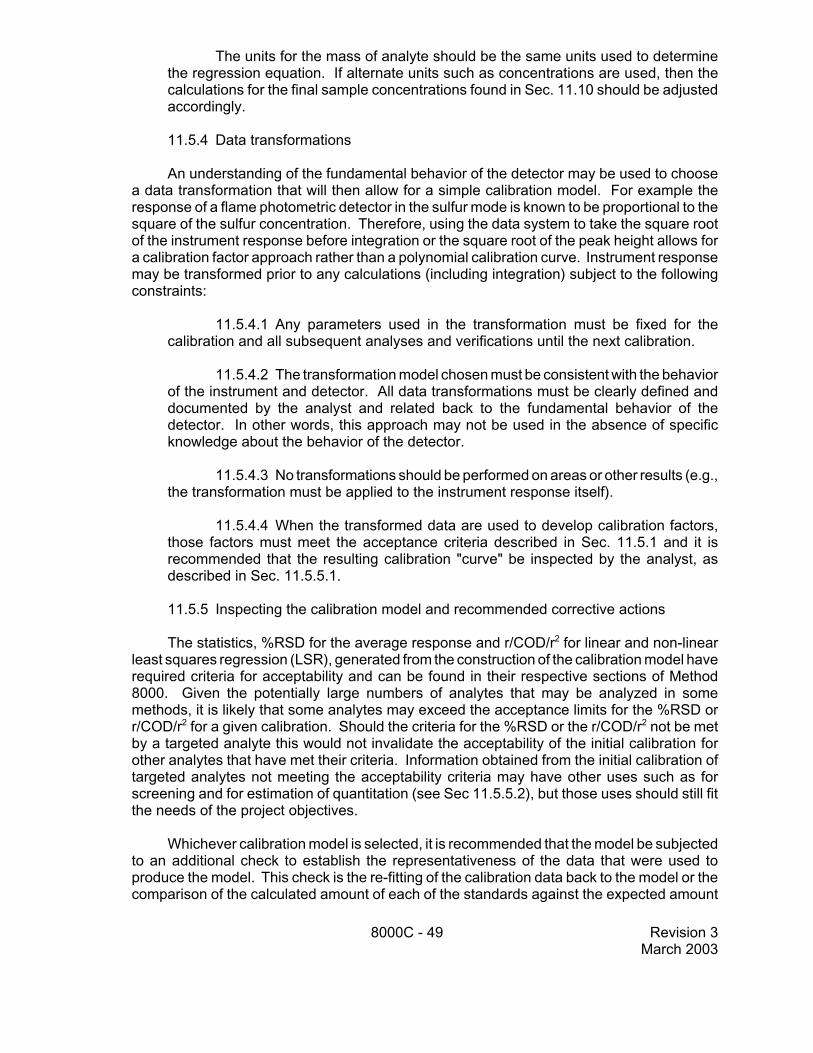
8000C - 49 Revision 3March 2003
The units for the mass of analyte should be the same units used to determinethe regression equation. If alternate units such as concentrations are used, then thecalculations for the final sample concentrations found in Sec. 11.10 should be adjustedaccordingly.
11.5.4 Data transformations
An understanding of the fundamental behavior of the detector may be used to choosea data transformation that will then allow for a simple calibration model. For example theresponse of a flame photometric detector in the sulfur mode is known to be proportional to thesquare of the sulfur concentration. Therefore, using the data system to take the square rootof the instrument response before integration or the square root of the peak height allows fora calibration factor approach rather than a polynomial calibration curve. Instrument responsemay be transformed prior to any calculations (including integration) subject to the followingconstraints:
11.5.4.1 Any parameters used in the transformation must be fixed for thecalibration and all subsequent analyses and verifications until the next calibration.
11.5.4.2 The transformation model chosen must be consistent with the behaviorof the instrument and detector. All data transformations must be clearly defined anddocumented by the analyst and related back to the fundamental behavior of thedetector. In other words, this approach may not be used in the absence of specificknowledge about the behavior of the detector.
11.5.4.3 No transformations should be performed on areas or other results (e.g.,the transformation must be applied to the instrument response itself).
11.5.4.4 When the transformed data are used to develop calibration factors,those factors must meet the acceptance criteria described in Sec. 11.5.1 and it isrecommended that the resulting calibration "curve" be inspected by the analyst, asdescribed in Sec. 11.5.5.1.
11.5.5 Inspecting the calibration model and recommended corrective actions
The statistics, %RSD for the average response and r/COD/r2 for linear and non-linearleast squares regression (LSR), generated from the construction of the calibration model haverequired criteria for acceptability and can be found in their respective sections of Method8000. Given the potentially large numbers of analytes that may be analyzed in somemethods, it is likely that some analytes may exceed the acceptance limits for the %RSD orr/COD/r2 for a given calibration. Should the criteria for the %RSD or the r/COD/r2 not be metby a targeted analyte this would not invalidate the acceptability of the initial calibration forother analytes that have met their criteria. Information obtained from the initial calibration oftargeted analytes not meeting the acceptability criteria may have other uses such as forscreening and for estimation of quantitation (see Sec 11.5.5.2), but those uses should still fitthe needs of the project objectives.
Whichever calibration model is selected, it is recommended that the model be subjectedto an additional check to establish the representativeness of the data that were used toproduce the model. This check is the re-fitting of the calibration data back to the model or thecomparison of the calculated amount of each of the standards against the expected amount

8000C - 50 Revision 3March 2003
% Difference 'Cc & Ce
Ce
× 100
of the standard using the % difference. The criteria for acceptability based upon theadditional check would have a similar impact upon the usability of a calibration for quantitationas is discussed in the above paragraph.
11.5.5.1 Re-fitting the calibration data back to the model or calculating the %difference is determined by using the following equation:
where:
Cc = Calculated amount of standard, in mass or concentration units.Ce = Expected amount of standard, in mass or concentration units.
The absolute value of the percent difference between these two amounts forevery calibration level should be less than or equal to 20%.
NOTE: If every point in a 5-point calibration were off by 20%, then the RSDfrom an average CF or RF would be over 20%, and an r/COD/r2 valuefrom a least squares regression would be less than 0.99. It is morelikely that for any calibration model chosen, all levels will not be closeto 20%. It is also more likely that just one or two levels will exceed the20% criterion, while still meeting the RSD/r/COD/r2 criteria. Thus,when RSD/r/COD/r2 statistics are used in conjunction with theinspection of the curve, more control is placed on the calibrationmodel.
11.5.5.2 Corrective action may be required if the criteria for %RSD, r, COD, orr2 are not met. If any analyte for any calibration standard has a percent difference withan absolute value greater than 20% as described in Sec. 11.5.5.1, then corrective actionmay be required. Some recommended courses of action and additional options formodifying the calibration ranges follow. However, more specific corrective actions thatare provided in the applicable determinative methods will supersede those noted inMethod 8000. Generally, the calibration may not be used for quantitative analyses ofthat analyte when the %RSD, r, COD, r2, or % Difference criteria are not met.
For all calibration models the following options are allowed:
The first step is generally to check the instrument operating conditions. Thesuggested maintenance procedures in Sec. 11.11 may be useful in guiding suchadjustments. This option will apply in those instances where a linear instrumentresponse is expected. It may involve some trade-offs to optimize performance acrossall target analytes. For instance, changes to the operating conditions necessary toachieve linearity for problem compounds may cause the RSD for other compounds toincrease, but as long as all analytes meet the RSD limits for linearity, the calibration isacceptable.

8000C - 51 Revision 3March 2003
If the RSD for any analyte is greater than 20% or correlation less the 0.99, theanalyst may wish to review the results (proper identification, area counts, calibration orresponse factors, and RSD) for those analytes to ensure that the problem is notassociated with just one of the initial calibration standards. If the problem appears tobe associated with a single standard, then that one standard may be reanalyzed once,to rule out problems due to random chance, and the RSD or correlation recalculated.Replacing the standard may be necessary in some cases.
An initial calibration should be considered a single event process and areanalysis of a calibration standard should be performed immediately to ensure that thereanalysis is still part of the original initial calibration event, e.g. within the same tuningperiod for a GC/MS method. It is recommended that if a reanalysis is to be performedit should commence within the time frame of the original initial calibration event or 8hours from the original analysis if such a time frame is undefined by the method. Thisreanalysis should also commence before any samples are analyzed. If this criteriacannot be met then the entire initial calibration should be performed again.
NOTE: Reanalyzing or replacing a single standard must NOT be confusedwith the practice of discarding individual calibration results for specifictarget compounds in order to pick and choose a set of results that willmeet the RSD or correlation criteria for the linear model. The practiceof discarding individual calibration results is addressed as a fourthalternative option and is very specific as to how a set of results arechosen to be discarded. If a standard is reanalyzed or a new standardis analyzed, then ALL of the results from the original analysis of thestandard in question must be discarded. Further, the practice ofrunning additional standards at other concentrations and then pickingonly those results that meet the calibration acceptance criteria isEXPRESSLY PROHIBITED, since the analyst has generated data thatdemonstrate that the linear model does not apply to all of the data.
A third alternative is to narrow the calibration range by replacing one or more ofthe calibration standards with standards that cover a narrower range. If linearity can beachieved using a narrower calibration range, document the calibration linearity, andproceed with analyses. The changes to the upper end of the calibration range will affectthe need to dilute samples above the range, while changes to the lower end will affectthe reliable quantitation of the method at low concentration levels. Consider theregulatory limits or action levels associated with the target analytes when adjusting thelower end of the range. Replacing one or more of the standards is NOT to be confusedwith discarding results from a given standard. Replacing a standard requires that thesame number of standards, i.e., five or more, be used for calibration.
A fourth alternative is to narrow the calibration range by removing data pointsfrom either extreme ends of the range and recalculating the RSD. It is prohibited toremove data points from within a calibration range while still retaining the extreme endsof the calibration range. There must also be a minimum of five standards remaining forthe calculation of the RSD.
NOTE: As noted in Sec. 11.4.1.2, the method quantitation limit (MQL) isestablished by the concentration of the lowest standard analyzedduring the initial calibration. Hence, narrowing the calibration range by

8000C - 52 Revision 3March 2003
changing the concentration of the lowest standard will, by definition,change the MQL. When the purpose of the analysis is to demonstratecompliance with a specific regulatory limit or action level, the analystmust ensure that the MQL is at least as low as the regulatory limit oraction level, and preferably one calibration point below that level.
The range of the calibration may be narrowed and the calibration points at thelowest and/or highest levels are not included in the least squares regression. The totalnumber of points must still meet the minimum of 5 for linear, 6 for second order, and 7for third order functions. The note regarding the MQL also applies here.
If the criteria for RSD and r/COD/r2 have been met for their respective calibrationmodels, the range of the calibration may be narrowed but the calibration points used togenerate the initial curve are retained. The quantitation limit becomes the lowest endof the adjusted calibration range and may not necessarily be the lowest calibration point.The note regarding the MQL also applies here.
NOTE: This guidance allows the use of the calibration model that wasconstructed using ALL the data points but limits the range forusefulness to only those data points that re-fit the model within thecriteria set in 11.5.5.1, i.e., less than or equal to 20% difference. Thecalibration model must also meet the RSD/r/COD/r2 criteria set for theaverage response factor or least squares regression constructionmethods before this option can be used. Examples of how this optioncould be used may help in describing the intended use.
Example 1 – When using the average response factor method of curveconstruction it is usually noticed that the upper level calibration point may fail there-fit criterion when the RSD meets its own criterion. This is especiallynoticeable for curves constructed using calibration levels that progressgeometrically (2, 4, 8, 16, 32, 64, etc.). Analysts using the response factor curveconstruction and relying only on an RSD criterion usually will be unaware of thisproblem at the upper end of the calibration range and will proceed to quantitatein that range.
Since the RSD meets its criterion but only the highest level data point fails there-fit criterion (>20% D), the constructed model for the average response is stillvalid for the range that should not include the highest level data point. Thus therange of the calibration can be adjusted to the next lowest level or levels fromthe upper portion of the calibration range effectively narrowing the calibrationrange without recalculating the average response and an-other RSD.
Example 2 – If least squares regression (linear and non-linear) is used for curveconstruction it is usually noticed that the lower levels of the calibration may failthe re-fit criteria (>20% D) even when the r/COD/r2 criteria have been met.Analysts that use least squares regression and rely only on the r/COD/r2 criteriafor curve acceptance may not be aware of this potential problem at the lowercalibration levels.
As in Example 1, since the statistics for curve construction (r/COD/r2) have beenmet but the lower levels of calibration have failed the re-fit criteria, the curve is

8000C - 53 Revision 3March 2003
still valid for the range of the calibration that excludes those data points thatrepresent the lower levels of the calibration. Thus the range of the calibrationcan be adjusted to the next higher level or levels from the lowest portion of thecalibration range effectively narrowing the calibration range without recalculatingthe regression and the r/COD/r2 statistics.
A fifth alternative is available for targeted analytes that do not meet theacceptability criteria for the initial calibration. Without reanalysis of standards ormanipulations of the model, the initial calibration can be used to estimate quantitationand information from the calibration can be used to verify the identification of targetedanalytes when used to screen samples.
If the initial calibration does not not meet the acceptability criteria it may not beused for quantitative analyses however estimates of the quantitation can be made.Estimates of quantitation can be useful when screening for the level of contaminationand determining the degree of dilutions that may be necessary when high levels ofcontamination are encountered. If estimates of quantitation for a positively identifiedanalyte are not within the scope of the project’s data quality objectives then anacceptable initial calibration should be prepared for that analyte.
Information from the initial calibration can also be used to verify the identificationof a targeted analyte when used for screening purposes. There should be sufficientsensitivity at the screening level to verify identification. Reasonable responses foundat the lowest levels of the calibration standards may be used as verification of identityat that level of concentration.
11.6 Retention time windows
Retention time windows are crucial to the identification of target compounds. Absoluteretention times are used for compound identification in all GC and HPLC methods that do notemploy internal standard calibration. Retention time windows are established to compensate forminor shifts in absolute retention times as a result of sample loadings and normal chromatographicvariability. The width of the retention time window should be carefully established to minimize theoccurrence of both false positive and false negative results. Tight retention time windows mayresult in false negatives and/or may cause unnecessary reanalysis of samples when surrogates orspiked compounds are erroneously not identified. Overly wide retention time windows may resultin false positive results that may not be confirmed .
The following subsections describe one approach that may be used to establish retention timewindows for GC and HPLC methods. Other approaches may be employed, provided the analystcan demonstrate performance appropriate for the intended application.
NOTE: The criteria listed in Sec. 11.6 are provided for GC and HPLC procedures using non-MSor FTIR detection. Identification procedures are different for GC/MS (e.g., Methods8260 and 8270), HPLC/MS (e.g., Methods 8321 and 8325), and GC/FT-IR (e.g., Method8410).
11.6.1 Before establishing retention time windows, make sure that the chromatographicsystem is operating reliably and that the system conditions are optimized for the targetanalytes and surrogates in the sample matrix to be analyzed. Make three injections of allsingle component standard mixtures and multi-component analytes (such as PCBs) over the

8000C - 54 Revision 3March 2003
course of a 72-hour period. Serial injections or injections over a period of less than 72 hoursmay result in retention time windows that are too tight.
11.6.2 Record the retention time (in minutes) for each single component analyte andsurrogate to three decimal places. Calculate the mean and standard deviation of the threeabsolute retention times for each single component analyte and surrogate. Formulti-component analytes, choose three to five major peaks (see the determinative methodsfor more details) and calculate the mean and standard deviation of those peaks.
11.6.3 If the standard deviation of the retention times for a target compound is 0.000(i.e., no difference between the absolute retention times), then the laboratory may eithercollect data from additional injections of standards or use a default standard deviation of 0.01minutes. (Recording retention times to three decimal places rather than only two shouldminimize the instances in which the standard deviation is calculated as 0.000).
11.6.4 The width of the retention time window for each analyte, surrogate, and majorconstituent in multi-component analytes is defined as ± 3 times the standard deviation of themean absolute retention time established during the 72-hour period or 0.03 minutes,whichever is greater.
11.6.5 Establish the center of the retention time window for each analyte and surrogateby using the absolute retention time for each analyte and surrogate from the calibrationverification standard at the beginning of the analytical shift. For samples run during the sameshift as an initial calibration, use the retention time of the mid-point standard of the initialcalibration.
11.6.6 The laboratory must calculate absolute retention time windows for each analyteand surrogate on each chromatographic column and instrument. New retention time windowsmust be established when a new GC column is installed or if a GC column has beenshortened during maintenance. The retention time windows should be reported with theanalysis results in support of the identifications made.
11.6.7 If the instrument data system is not capable of employing compound-specificretention time windows, then the analyst may choose the widest window and apply it to allcompounds. As noted above, other approaches may also be employed, but must bedocumented by the analyst.
11.6.8 The surrogates are added to each sample, blank, and QC sample and are alsocontained in each calibration standard. Although the surrogates may be diluted out of certainsample extracts, their retention times in the calibration standards may be useful in trackingretention time shifts. Whenever the observed retention time of a surrogate is outside of theestablished retention time window, the analyst is advised to determine the cause and correctthe problem before continuing analyses.
11.7 Calibration verification
The calibration relationship established during the initial calibration (Sec. 11.5) must beverified at periodic intervals. The process of calibration verification applies to both externalstandard and internal standard calibration techniques, as well as to linear and non-linear calibrationmodels.

8000C - 55 Revision 3March 2003
% Drift 'Calculated concentration & Theoretical concentration
Theoretical concentration× 100%
As a general rule, the initial calibration in an SW-846 method must be verified at the beginningof each 12-hour analytical shift during which samples are analyzed using a calibration verificationstandard concentration prepared at the appropriate level of concern. (Some methods may specifymore frequent verifications and recommended standard concentrations). The 12-hour analyticalshift begins with the injection of the calibration verification standard (or the MS tuning standard inMS methods). The shift ends after the completion of the analysis of the last sample or standardthat can be injected within 12 hours of the beginning of the shift.
If the response (or calculated concentration) for an analyte is within ±20% of the responseobtained during the initial calibration or the expected concentration of the calibration verificationstandard, then the initial calibration is considered still valid, and the analyst may continue to usethe calibration model from the initial calibration to quantitate sample results. The ±20% criterionmay be superseded in certain determinative methods.
Except where the determinative method contains alternative calibration verification criteria,if the response (or calculated concentration) for any analyte varies from the mean response or theexpected concentration of the calibration verification standard obtained during the initial calibrationby more than ±20%, then the initial calibration relationship may no longer be valid.
NOTE: The process of calibration verification is fundamentally different from the approachcalled "continuing calibration" in some methods from other sources. As described inthose methods, the calibration factors or response factors calculated during continuingcalibration are used to update the calibration factors or response factors used forsample quantitation. This approach, while employed in other EPA programs, isequivalent to a daily single-point calibration, and is not appropriate nor permitted in SW-846 chromatographic procedures for trace environmental analyses.
If the calibration does not meet the 20% limit, check the instrument operating conditions, and,if necessary, restore them to the original settings, and inject another aliquot of the calibrationverification standard. If the response for the analyte is still not within ±20%, then a new initialcalibration may be necessary.
NOTE: As noted in Sec. 11.5.1.3, the allowance for the use of the grand mean difference of allthe analytes has been withdrawn. However, if all of the conditions in Sec. 11.5.1.3 aremet, then the average calibration or response factor may be used to determine sampleconcentrations, as described in Sec. 11.10.11.7.1 Verification of linear calibrations
Calibration verification for linear calibrations involves the calculation of the percent driftor the percent difference of the instrument response between the initial calibration and eachsubsequent analysis of the verification standard. Use the equations below to calculate % Driftor % Difference, depending on the procedure described in the determinative method.
where the calculated concentration is determined using the calibration model from the initialcalibration and the theoretical concentration is the concentration at which the standard wasprepared.

8000C - 56 Revision 3March 2003
% Difference 'CFv & CF
CF× 100% or '
RFv & RF
RF× 100%
where CFv and RFv are the calibration factor and the response factor (whichever applies) fromthe analysis of the verification standard, and ––CF and –– RF are the mean calibration factor andmean response factor from the initial calibration. Except where superseded in certaindeterminative methods, the % Difference or % Drift calculated for the calibration verificationstandard must be within ±20% for each analyte, in order to use the calibration model toquantitate sample results.
11.7.2 Verification of a non-linear calibration
Calibration verification of a non-linear calibration is performed using the percent driftcalculation described in Sec. 11.7.1, above. Except where superseded in certaindeterminative methods, the % Drift calculated for the calibration verification standard must bewithin ±20% for each analyte, in order to use the calibration model to quantitate sampleresults.
It may also be appropriate to employ two standards at different concentrations to verifythe calibration. One standard should be near the quantitation limit or action limit. The choiceof specific standards and concentrations is generally a method- or project-specificconsideration.
11.7.3 Regardless of whether a linear or non-linear calibration model is used, if eitherthe percent drift or percent difference criterion is not met, then no sample analyses may takeplace until the calibration has been verified or a new initial calibration is performed that meetsthe criteria included in Sec. 11.5 and those in the determinative method. If the calibrationcannot be verified after the analysis of a single verification standard, then adjust theinstrument operating conditions and/or perform instrument maintenance (see Sec. 11.11), andanalyze another aliquot of the verification standard. If the calibration cannot be verified withthe second standard, then a new initial calibration must be performed.
11.7.4 All target analytes and surrogates, including those reported as non-detects, mustbe included in a periodic calibration for purposes of retention time confirmation and todemonstrate that calibration verification criteria are being met. The frequency of this periodiccalibration is project-, method-, and analyte-specific.
11.7.5 Calibration verification may be performed using both high and low concentrationstandards from time to time. This is particularly true when the ECD or ELCD is used. Thesedetectors drift and are not as stable as FID or FPD, and periodic use of the high and lowconcentration standards serves as a further check on the initial calibration. Theconcentrations of these standards should generally reflect those observed in samples.
11.7.6 Additional analyses of the mid-point calibration verification standard during a12-hour analytical shift are strongly recommended for methods involving external standardcalibration. If the response for any analyte varies from the average initial calibration responseby more than 20% in these additional determinations, corrective action (see Sec. 11.11) maybe necessary to restore the system or a new calibration curve should be prepared for that
8000C - 57 Revision 3March 2003
compound.
The frequency of verification necessary to ensure accurate measurement is dependenton the detector and the sample matrix. Very sensitive detectors that operate in thesub-nanogram range are generally more susceptible to changes in response caused bycolumn contamination and sample carryover. Therefore, more frequent verification ofcalibration (i.e., after every 10 samples) may be necessary for the electron capture,electrochemical conductivity, photoionization, and fluorescence detectors.
Sec. 9.2.2 states that samples analyzed using external standards must be bracketedby periodic analyses of standards that meet the QC acceptance criteria (e.g., calibration andretention time). Therefore, more frequent analyses of standards will minimize the number ofsample extracts to be reinjected if the QC limits are violated for the standard analysis. Theresults from these bracketing standards must meet the calibration verification criteria in Sec.11.7.1 and 11.7.2 and the retention time criteria in Sec. 11.6. However, if the standardanalyzed after a group of samples exhibits a response for an analyte that is above theacceptance limit, i.e., >20%, and the analyte was not detected in any of the previous samplesduring the analytical shift, then the sample extracts do not need to be reanalyzed, as theverification standard has demonstrated that the analyte would have been detected were itpresent.
11.7.7 Any method blanks described in the preparative methods (Methods 3500 and3600) may be run immediately after the calibration verification analyses to confirm thatlaboratory contamination does not cause false positive results, or at any other time during theanalytical shift. If the method blank indicates contamination, then it may be appropriate toanalyze a solvent blank to demonstrate that the contamination is not a result of carryover fromstandards or samples.
11.8 Chromatographic analysis of samples
11.8.1 Introduction of sample extracts into the chromatograph varies, depending on thevolatility of the compound. Volatile organics are primarily introduced by purge-and-traptechniques (Method 5030, water and Method 5035, soils). Other techniques includeazeotropic distillation (Method 5031), vacuum distillation (Method 5032), headspace (Method5021), or direct aqueous injection. The use of Method 5021, or another headspacetechnique, may be advisable for screening volatiles in some sample matrices to preventoverloading and contamination of the purge-and-trap system. Semivolatile and nonvolatileanalytes are introduced by direct or split/splitless injection.
11.8.1.1 Manual injection (GC)
Inject 1-5 µL of the sample extract. The use of the solvent flush technique isnecessary for packed columns. A typical volume of 1-2 µL of sample extract is used forcapillary columns. However, other injection volumes may be used if the analyst candemonstrate appropriate performance for the intended application.
11.8.1.2 Automated injection (GC)
Automated injectors can provide volumes both larger and smaller than 1-2 µL.The analyst should ensure that the appropriate injector design is used for the volumeto be injected and that the injection volume is reproducible. Other injection volumes

8000C - 58 Revision 3March 2003
may be used if the analyst can demonstrate appropriate performance for the intendedapplication.
Large Volume Injection (LVI) is the injection of large volumes (greater than 5 ul)into cooled inlets that allow the solvent to be vented while retaining analytes. LVI isused to increase the sensitivity of the analysis, either to decrease MQLs or to decreasethe amount of sample extracted, or extraction solvent used. This procedure must bedone in inlets made specifically for this analysis. The analyst must also ensure that allof the quality control requirements of both the preparation and determinative methodsare met.
Retaining analytes while venting the solvent requires that there be a significantdifference between the boiling point of the solvent and the boiling point of the morevolatile analytes. Therefore, the analyst must carefully choose a solvent that iscompatible with both the sample preparation technique and the analysis. Because thesolvent is vented, the analyst must also ensure that area counts are reproducible fromone analysis to the next on both the front and back end of the chromatogram. Injectinglarger volumes of the extract inevitably means that more solvent will be transferred tothe column. This may cause chromatographic problems such as peak splitting andfronting that must be corrected before calibration or analysis of samples begins. Thistype of inlet yields a higher mass transfer to the analytical column and the analyst maywant to adjust concentration ranges accordingly.
11.8.1.3 Purge-and-trap
Refer to Methods 5000, 5030, or 5035 for details.
11.8.1.4 Manual injection (HPLC)
Inject 10-100 µL. This is generally accomplished by over-filling the injection loopof a zero-dead-volume injector. Larger volumes may be injected if better sensitivity isrequired, however, chromatographic performance may be affected.
11.8.1.5 Automated injection (HPLC)
Inject 10-100 µL. Laboratories should demonstrate that the injection volume isreproducible. Larger volumes may be injected if greater sensitivity is required, however,chromatographic performance may be adversely affected.
11.8.2 All analyses, including field samples, matrix spike samples, matrix spikeduplicates, laboratory control samples, method blanks, and other QC samples, are performedduring an analysis sequence. The sequence begins with instrument calibration, which isfollowed by the analysis of sample extracts. Verification of calibration and retention times isnecessary no less than once every 12-hour analytical shift. The sequence ends when the setof samples has been injected or when qualitative and/or quantitative QC criteria areexceeded. As noted in Secs. 11.7.6 and 9.2.2, when employing external standard calibration,it is necessary that a calibration verification standard be run at the end of the sequence tobracket the sample analyses. Acceptance criteria for the initial calibration and calibrationverification are described in Secs. 11.5 - 11.7.

8000C - 59 Revision 3March 2003
Analysis of calibration verification standards every 10 samples is stronglyrecommended, especially for highly sensitive GC and HPLC detectors at sub-nanogramconcentrations. Frequent analysis of calibration verification standards helps ensure thatchromatographic systems are performing acceptably and that false positives, false negativesand poor quantitations are minimized. Samples analyzed using external standard calibrationmust be bracketed by the analyses of calibration standards that meet the QC limits forverification of calibration and retention times. If criteria are exceeded, corrective action mustbe taken (see Sec. 11.11) to restore the system and/or a new calibration curve must beprepared for that compound and the samples reanalyzed.
Certain methods may also include QC checks on column resolution, analytedegradation, mass calibration, etc., at the beginning of a 12-hour analytical shift.
11.8.3 Sample concentrations are calculated by comparing sample responses with theinitial calibration of the system (Sec. 11.5). If sample response exceeds the limits of the initialcalibration range, dilute the extract (or sample) and reanalyze. Extracts should be diluted sothat all peaks are on scale, as overlapping peaks are not always evident when peaks are offscale. Computer reproduction of chromatograms, manipulated to ensure all peaks are onscale over a 100-fold range, is acceptable, as long as calibration limits are not exceeded.When overlapping peaks cause errors in peak area integration, the use of peak heightmeasurements is recommended.
11.8.4 If chromatographic peaks are masked by the presence of interferences, furthersample cleanup is necessary. See Method 3600 for guidance.
11.9 Compound Identification
Tentative identification of an analyte occurs when a peak from a sample extract falls withinthe daily retention time window. Confirmation is necessary when the composition of samples is notwell characterized. Confirmation techniques include further analysis using a second column withdissimilar stationary phase, GC/MS (full scan or SIM) or HPLC/MS (if concentration permits),HPLC/UV data at two different wavelengths, GC or HPLC data from two different detectors, or byother recognized confirmation techniques. For HPLC/UV methods, the ability to generate UVspectra with a diode array detector may provide confirmation data from a single analysis, providedthat the laboratory can demonstrate this ability for typical sample extracts (not standards) bycomparison to another recognized confirmation technique.
When confirmation is made on a second column, that analysis should meet all of the QCcriteria described above for calibration, retention times, etc. Confirmation is not required for GC/MSand HPLC/MS methods.
Confirmation may not be necessary if the composition of the sample matrix is well establishedby prior analyses, for instance, when a pesticide known to be produced or used in a facility is foundin a sample from that facility.
When using GC/MS for confirmation, ensure that GC/MS analysis is performed on an extractat the appropriate pH for the analyte(s) being confirmed, i.e., do not look for basic analytes in anacidic extract. Certain analytes, especially pesticides, may degrade if extraction conditions wereeither strongly acidic and/or strongly basic.
Many chromatographic interferences result from co-elution of one or more compounds withthe analyte of interest, or may be the result of the presence of a non-analyte peak in the retention

8000C - 60 Revision 3March 2003
Concentration (µg/L) '(xs)(Vt)(D)
(Vi)(Vs)
time window of an analyte. Such co-elution problems affect quantitation as well as identification,and may result in poor agreement between the quantitative results from two dissimilar columns.Therefore, even when the identification has been confirmed on a dissimilar column, the analystshould evaluate the agreement of the quantitative results on both columns, as described in Sec.11.10.4.
11.10 Calculations
The calculation of sample results depends on the type of calibration (external or internalstandard) and the calibration model employed (linear or non-linear). The calculations of the massof the analyte in the sample aliquot introduced into the instrument can be found in Secs. 11.5.1.4,11.5.2.3, and 11.5.3.3. The following sections describe the calculations necessary to obtain theconcentrations of analytes in the original sample, based on its volume or weight.
These calculations are provided for illustrative purposes only. Various dilution schemes andconventions for defining final volumes and injection volumes exist and they all cannot be addressedhere. The analyst must clearly document and verify all of the calculations that are employed.Specific determinative methods may also contain additional information on how to perform thesecalculations.
11.10.1 Sample concentration by volume (µg/L), e.g., for aqueous samples
where:
xs = Calculated mass of the analyte (in nanograms) in the sample aliquot introduced intothe instrument. The type of calibration model used determines the derivation of xs.See Secs. 11.5.1.4, 11.5.2.3, and 11.5.3.3.
Vt = Total volume of the concentrated extract (in µL). For purge-and-trap analysis, Vt is thepurge volume and will be equal to Vi. Thus, units other than µL may be used forpurge-and-trap analyses.
D = Dilution factor, if the sample or extract was diluted prior to analysis. If no dilution wasmade, then D=1. The dilution factor is always dimensionless.
Vi = Volume of the extract injected (in µL). The nominal injection volume for samples andcalibration must be the same. For purge-and-trap analysis, Vi is the purge volume andwill be equal to Vt. Thus, units other than µL may be used for purge-and-trapanalyses.
Vs = Volume of the aqueous sample extracted or purged, in milliliters (mL). If units of liters(L) are used for this term, then multiply the results by 1000 mL/L.
Using the units listed here for these terms will result in a concentration in units of ng/mL,which is equivalent to µg/L.

8000C - 61 Revision 3March 2003
Concentration (µg/kg) '(xs)(Vt)(D)(Vi)(Ws)
Concentration (µg/L) '(xs)(Vt)(D)
(Vs)
11.10.2 Sample concentration by weight (µg/kg), e.g., for solid samples and non-aqueous liquids.
where:
xs = Calculated mass of the analyte (in nanograms) in the sample aliquot introduced intothe instrument. The type of calibration model used determines the derivation of xs.See Secs. 11.5.1.4, 11.5.2.3, and 11.5.3.3.
Vt = Total volume of the concentrated extract (in µL). For purge-and-trap analysis wherean aliquot of a solvent (methanol, water, etc.) extract is added to reagent water andpurged, Vt is the total volume of the solvent extract. This also includes anycontribution from water present in samples prior to solvent extraction (see Sec.11.10.5).
D = Dilution factor, if the sample or extract was diluted prior to analysis. If no dilution wasmade, then D=1. The dilution factor is always dimensionless.
Vi = Volume of the extract injected (in µL). The nominal injection volume for samples andcalibration standards must be the same. For purge-and-trap analysis where an aliquotof a solvent (methanol, water, etc) extract is added to reagent water and purged, Vi isthe volume of the solvent extract that is added to the reagent water just prior topurging. Any dilutions made to the initial volume of the solvent extract are accountedfor in the dilution factor (D).
Ws = Weight of sample extracted or purged (in grams). If units of kilograms (kg) are usedfor this term, multiply the results by 1000 g/kg.
Using the units listed here for these terms will result in a concentration in units of ng/g,which is equivalent to µg/kg. See Sec. 11.10.5 for situations in which the calculatedconcentrations may need to be corrected based on the solvent/water dilution effect forextracted volatile organics.
11.10.3 Sample concentration when xs is expressed as concentration duringcalibration
As noted in Sec. 11.4, the analyst may develop the calibration using the concentrationof the analyte and internal standard instead of the mass. Using such an approach usuallyinvolves expressing the concentrations as the mass of the analyte or internal standard in thevolume that is injected into the instrument (i.e., ng/µL). Thus, the calculations for the finalconcentration of an analyte in a sample in Secs. 11.10.1 and 11.10.2 must be modified toinclude the injection volume, Vi, into the term xs. Therefore, the equation for the sampleconcentration by volume becomes:

8000C - 62 Revision 3March 2003
RPD '* R1 & R2 *
R1 % R2
2
x 100
Concentration (µg/kg) '(xs)(Vt)(D)
(Ws)
And the equation for the sample concentration by weight becomes:
where Vt, D, Vs, and Ws are the same as found in Sections 11.10.1 and 11.10.2 and
xs = Calculated concentration of the analyte (ng/µL) in the sample. The type of calibrationmodel used determines the derivation of xs. See Secs. 11.5.1.4, 11.5.2.3, and11.5.3.3.
Using the units listed here for these terms will result in concentrations in units of ng/mL,which is equivalent to µg/L, or ng/g, which is equivalent to µg/kg. See Sec. 11.10.5 forsituations in which the calculated concentrations may need to be corrected based onthe solvent/water dilution effect for extracted volatile organics.
11.10.4 Comparison between results from different columns or detectors
When sample results are confirmed using two dissimilar columns or with two dissimilardetectors, the agreement between the quantitative results should be evaluated after theidentification has been confirmed. Large differences in the numerical results from the twoanalyses may be indicative of positive interferences with the higher of the results, which couldresult from poor separation of target analytes, or the presence of a non-target compound.However, they may also result from other causes. Thus, in order to ensure that the resultsreported are appropriate for the intended application, the analyst should make a formalcomparison, as described below.
Calculate the relative percent difference (RPD) between the two results using theformula below.
where R1 and R2 are the results on the two columns and the vertical bars in the equationabove indicate the absolute value of the difference. Therefore, the RPD is always a positivevalue.
11.10.4.1 If one result is significantly higher (e.g., >40%), check thechromatograms to see if an obviously overlapping peak is causing an erroneously highresult. If no overlapping peaks are noted, examine the baseline parameters establishedby the instrument data system (or operator) during peak integration. A rising baselinemay cause the mis-integration of the peak for the lower result.
11.10.4.2 If no anomalies are noted, review the chromatographicconditions. If there is no evidence of chromatographic problems, then it may beappropriate to report the lower result.
Regardless of the presence or absence of chromatographic problems, thedata user MUST be advised of the disparity between the two results, because the user,

8000C - 63 Revision 3March 2003
% moisture 'g of sample&g of dry sample
g of sample× 100
Moisture corrected concentration '(As received concentration)
(100 & % Moisture)× 100
not the laboratory, is responsible for ensuring that the most appropriate result isreported or utilized. Under some circumstances, including those involved in monitoringcompliance with an action level or regulatory limit, further cleanup of the sample oradditional analyses may be required when the two values in question span the actionlevel or regulatory limit.
NOTE: Reporting the lower value as the default is a change from the previousversion of this method. Other data reporting practices may be appropriatefor specific applications, in which case, those practices should bedescribed in an approved QA plan.
11.10.5 Moisture corrected reporting
The results for solid samples may be reported on the basis of the wet weight (asreceived) or the moisture corrected sample concentration. There are merits to eitherapproach, however, many regulatory limits associated with solid wastes and solid samplesare based on the form of the waste as generated, which rarely involves oven-dry solids. Asa result, there is no default preference for one form or the other.
Therefore, the choice of "as received" or moisture corrected reporting is ALWAYS aproject-specific decision that must be based on knowledge of the intended use of the data.
When moisture corrected reporting is required, the concentration results for solidsamples calculated in Secs. 11.10.2 and 11.10.3 may be converted to moisture correctedresults as follows:
where the percent moisture is determined as described in the specific sample preparation ordeterminative method, typically by drying an aliquot of the sample at 105EC overnight. The% moisture is calculated as follows:
The percent moisture determination may also be called the percent solids in somemethods. In this case the percent solids should be subtracted from 100, in order to attain thepercent moisture as noted in the above moisture corrected calculation. The units for the finalresults, e.g., µg/kg or mg/kg, will be the same, regardless of the percent moisture calculation.
Except when the sample is completely dry, i.e., the percent moisture equals 0%), themoisture corrected results will always be higher than the "as received" results. In the absenceof project-specific requirements, it may be most appropriate to report the results on the "asreceived" basis of the sample AND provide the percent moisture for each sample. This willallow the data user to convert the results from one form to another, as needed. Whateverapproach is used, it must be clearly described for the data user.

8000C - 64 Revision 3March 2003
µL solvent/water Vt 'mL of solvent % (% moisture × g of sample)
100× 1000 µL/mL
Solid samples with a significant moisture content (>10%), designated for volatile organicanalysis, that are extracted prior to analysis in a water miscible solvent such as methanol arediluted by the total volume of the solvent/water mixture. The total mixture volume can onlybe calculated based on the sample moisture present as determined by the % moisturedetermination. This total volume is then expressed as Vt in the sample concentrationcalculations provided in Secs. 11.10.2 and 11.10.3. Therefore, in order to report results forvolatiles analysis of samples containing significant moisture content on an "as received"basis, the calculated concentration needs to be corrected using the total solvent/water mixturevolume represented as Vt. This total solvent/water volume is calculated as follows:
Generally, it is recommended that the calculated concentrations of volatile organicssamples that are solvent extracted in a water-miscible solvent such as methanol be correctedfor the solvent/water dilution effect for situations when the sample moisture content is greaterthan 10%. The potential under reporting of volatile concentrations is more pronounced as thepercent moisture content increases.
11.11 Suggested chromatographic system maintenance
Corrective measures may involve any one or more of the following remedial actions. This listis by no means comprehensive and analysts should develop expertise in troubleshooting theirspecific instruments and analytical procedures. The manufacturers of chromatographicinstruments, detectors, columns, and accessories generally provide detailed information regardingthe proper operation and limiting factors associated with their products. The importance of readingand reviewing this information cannot be over-emphasized.
11.11.1 Capillary GC columns
Routine maintenance may compel the analyst to clean and deactivate the glass injectionport insert or replace it with a fresh insert that has been cleaned and deactivated withdichlorodimethylsilane. Cut off 0.5 - 1.0 m of the injector end of the column using a 90E cut.Place ferrule onto the column before cutting.
Exceptional maintenance may compel the analyst to replace gas traps and backflushthe column with solvent according to the manufacturer's instructions. If these procedures failto eliminate the degradation problem, it may be necessary to deactivate the metal injectorbody and/or replace the column.
11.11.2 Metal (GC) injector body
Turn off the oven and remove the analytical column when the oven has cooled. Removethe glass injection port insert. Lower the injection port temperature to room temperature.Inspect the injection port and remove any noticeable foreign material.
Place a beaker beneath the injector port inside the GC oven. Using a wash bottle,serially rinse the entire inside of the injector port with acetone and then toluene, catching therinsate in the beaker.

8000C - 65 Revision 3March 2003
Prepare a solution of deactivating agent (dichlorodimethylsilane) followingmanufacturer's directions. After all metal surfaces inside the injector body have beenthoroughly coated with the deactivation solution, serially rinse the injector body with toluene,methanol, acetone, and hexane. Reassemble the injector and replace the GC column.
11.11.3 HPLC columns
Examine the system and check for drips that are indicative of plumbing leaks. Checkthat tubing connectors are of the shortest possible length to minimize dead volumes andreduce band broadening. Compatible guard columns should be installed to protect analyticalcolumns.
If degradation of resolution or changes in back pressure are observed, the first actionshould be to replace the guard column if one is installed. Secondly, temporarily reverse theflow through the column to dislodge contamination in the frit with the column disconnectedfrom the detector. If this does not correct the problem, place the analytical column in a vise,remove the inlet compression fitting and examine the column.
Analysts should establish that no void volume has developed, that the column packinghas not become contaminated, and that the frit is not clogged. Void volumes can be filled withcompatible packing and frits replaced.
Columns must eventually be replaced as the bonding and end-capping groups used tomodify the silica are lost with time. Loss of these groups will result in chromatographic tailingand changes in analyte retention times. Retention times may also change because ofdifferences in column temperature or because the composition of the solvent gradient is notcompletely reproducible.
12.0 DATA ANALYSIS AND CALCULATIONS
12.1 See Sec. 11.0 and the appropriate determinative method for information regarding dataanalysis and calculations.
12.2 Results must be reported in units commensurate with their intended use and all dilutionsmust be taken into account when computing final results.
13.0 METHOD PERFORMANCE
13.1 Performance data and related information are provided in SW-846 methods only asexamples and guidance. The data do not represent required performance goals for users of themethods. Instead, performance goals should be developed on a project-specific basis, and thelaboratory should establish in-house QC performance criteria for the application of this method.
13.2 Refer to the determinative methods for performance data examples and guidance.
14.0 POLLUTION PREVENTION
14.1 Pollution prevention encompasses any technique that reduces or eliminates the quantityand/or toxicity of waste at the point of generation. Numerous opportunities for pollution prevention
8000C - 66 Revision 3March 2003
exist in laboratory operation. The EPA has established a preferred hierarchy of environmentalmanagement techniques that places pollution prevention as the management option of first choice.Whenever feasible, laboratory personnel should use pollution prevention techniques to addresstheir waste generation. When wastes cannot be feasibly reduced at the source, the Agencyrecommends recycling as the next best option.
14.2 For information about pollution prevention that may be applicable to laboratories andresearch institutions consult Less is Better: Laboratory Chemical Management for Waste Reductionavailable from the American Chemical Society's Department of Government Relations and SciencePolicy, 1155 16th St., N.W. Washington, D.C. 20036, (202) 872-4477.
15.0 WASTE MANAGEMENT
The Environmental Protection Agency requires that laboratory waste management practicesbe conducted consistent with all applicable rules and regulations. The Agency urges laboratoriesto protect the air, water, and land by minimizing and controlling all releases from hoods and benchoperations, complying with the letter and spirit of any sewer discharge permits and regulations, andby complying with all solid and hazardous waste regulations, particularly the hazardous wasteidentification rules and land disposal restrictions. For further information on waste management,consult The Waste Management Manual for Laboratory Personnel available from the AmericanChemical Society at the address listed in Sec. 14.2.
16.0 REFERENCES
For further information regarding these methods, review Methods 3500, 3600, 5000, theindividual sample preparative, cleanup and determinative methods, and Chapter One.
17.0 TABLES, DIAGRAMS, FLOWCHARTS, AND VALIDATION DATA
There are no tables or figures associated with this method.
Related Documents