Walkability: Fact or Myth Does walkability make for a sustainable community? Lane Kendig, Founder Kendig Keast Collaborative

Walkability: Fact or Myth Does walkability make for a sustainable community? Lane Kendig, Founder Kendig Keast Collaborative.
Dec 23, 2015
Welcome message from author
This document is posted to help you gain knowledge. Please leave a comment to let me know what you think about it! Share it to your friends and learn new things together.
Transcript

Walkability:Fact or MythDoes walkability make for a sustainable community?
Lane Kendig, FounderKendig Keast Collaborative
Walkability Values
• Walkability is good planning.• Separating pedestrians from
automobiles makes walking more desirable and safer.
• Planning for pedestrian connectivity is needed.
• Walking is good for health.• Highly promoted as a sustainability
strategy.
Does Walkability = Sustainable?“Walkability reduces automobile trips and thus makes more sustainable community.”
•For this to be true the following must be true:• There must be a significant modal split
change.• Total automobile mileage significantly
reduced.
•Questionable.
Evaluate Whether Trips Walkable?
• Home based trips.• Work.• Shopping.• Socializing• Recreation.• Kids’ activities.
• How long are these trips?
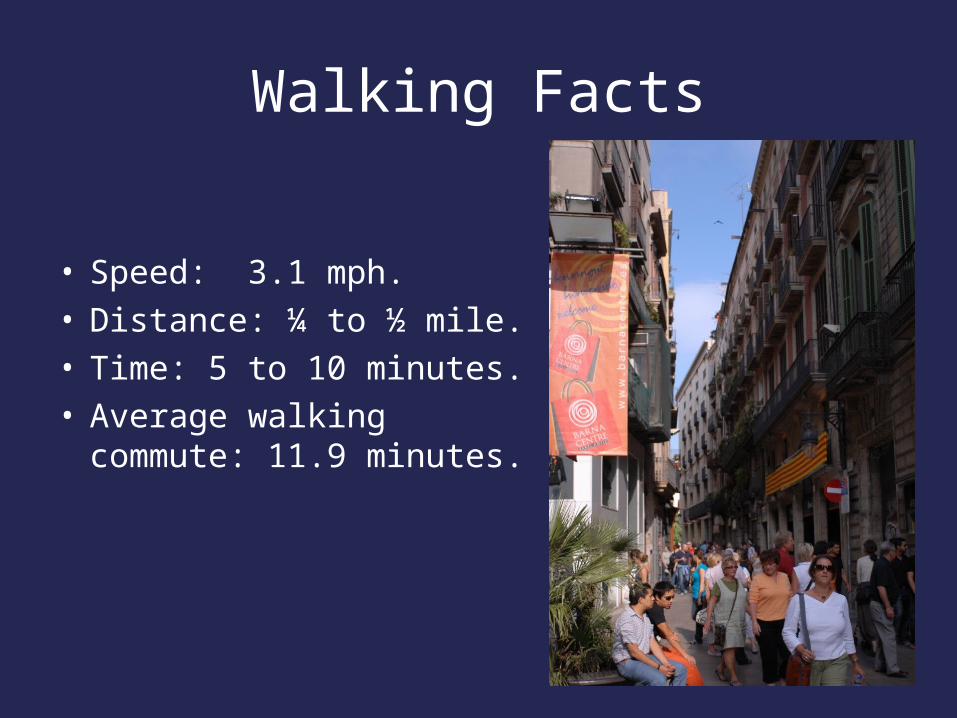
Walking Facts
• Speed: 3.1 mph.• Distance: ¼ to ½ mile.• Time: 5 to 10 minutes.• Average walking
commute: 11.9 minutes.

Commuting Trips
Percent by Mode and Travel Time
ModePercent of Commutes
TravelTime
Car 76.1 28.8
Car Pool 10.0 24.2
Transit 5.0 47.8
Bicycle 0.6 -
Walk 2.9 11.9Source: Commuting in United States 2009National Average

Shopping Trips
• Scale determines walkability.• Neighborhood - Walkable• Drug store, convenience and smaller.• ¼ to ½ mile spacing 1,500 – 4,000 people.
• Community - Automobile• Supermarket and hardware anchors• 2-3 miles spacing7,000 – 13,750 people.
• Regional - Automobile• Regional centers, category killers, building
supply.• 5-10 mile spacing 50,000+ people
Socializing Trips
• How many of these are walkable?• Visiting neighbors.• Church.• Social organizations.• Meeting friends.• Eating out.
Recreation Trips
• How many of these are walkable?• Walking for exercise.• Picnicking.• Movies.• Theater• Trail bikes, skiing, camping, boating.• Museums.• Sporting events.
Trips for Children
• Which are walkable?• Day Care.• Schools – percent of children walking
declining.• After school events• Soccer, baseball, swimming, football,
hockey.• Dance, gymnastics, ice skating.• Scouts
Walking Trips
• Work – few walkable except in highest intensity cities.
• Shopping – only neighborhood stores.
• Social – only neighborhood based.• Recreation – most are auto trips.• Children – most are auto trips that
require parent to make two stops.
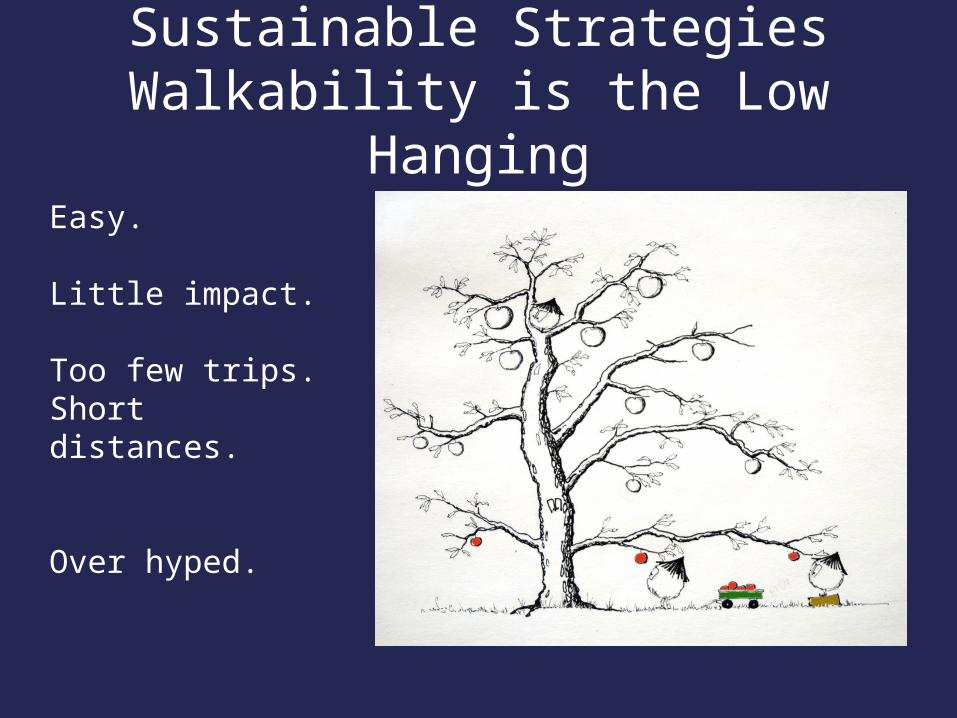
Sustainable StrategiesWalkability is the Low
HangingEasy.
Little impact.
Too few trips.Short distances.
Over hyped.
Case Studies
• A review of New Urbanist communities.• Build-to lines.
• Residential in walking distance?• Market Area for retail?• How is parking handled?• True urban character?
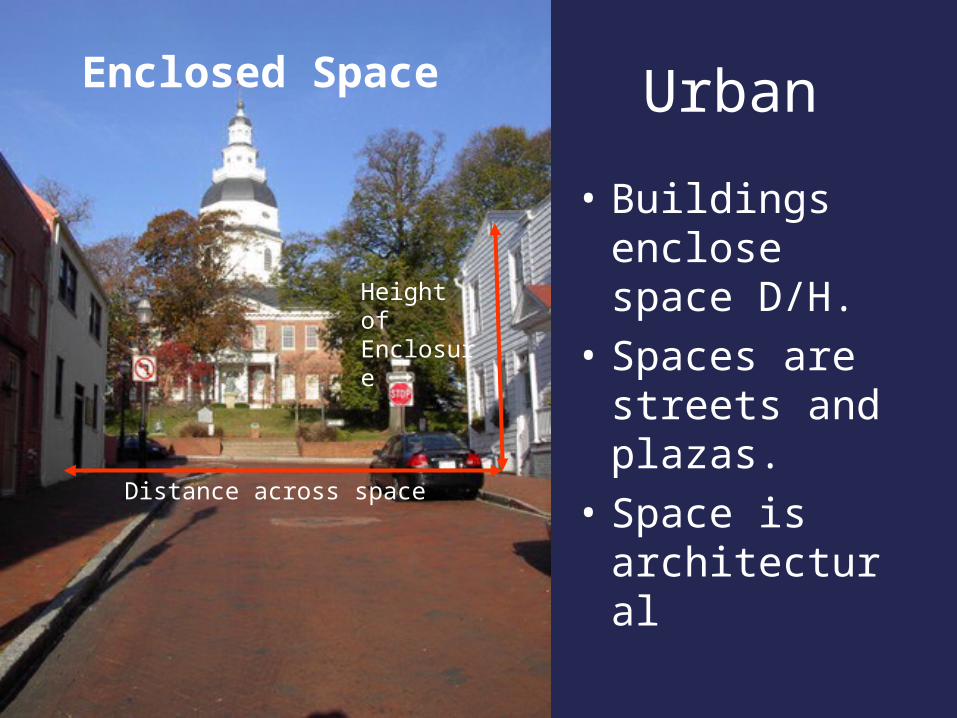
Urban
• Buildings enclose space D/H.
• Spaces are streets and plazas.
• Space is architectural
Enclosed Space
Distance across space
Height of Enclosure
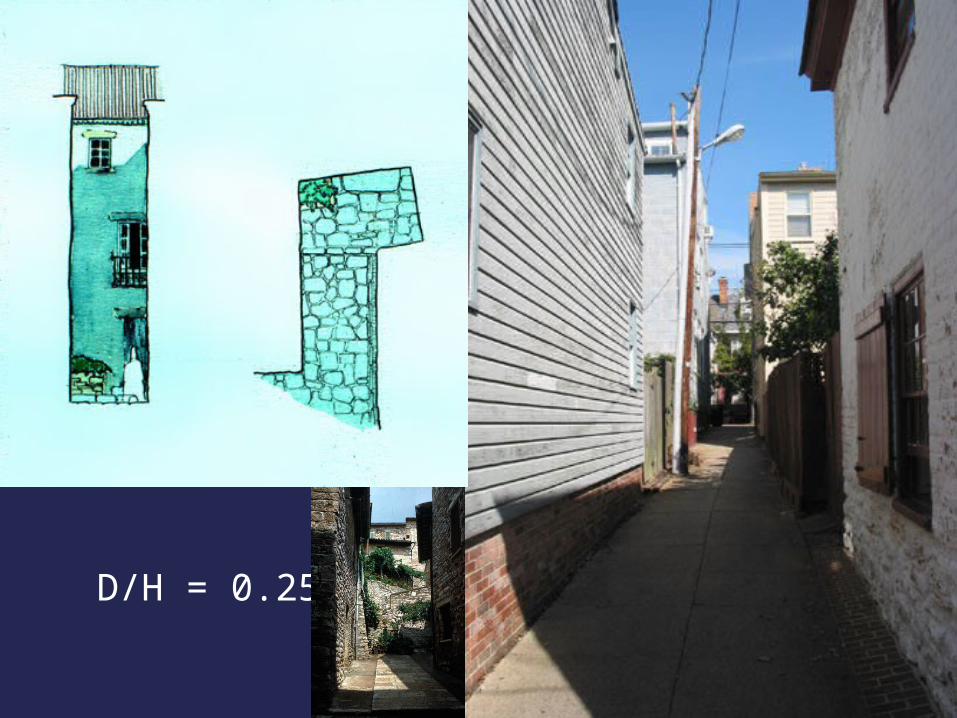
D/H = 0.25
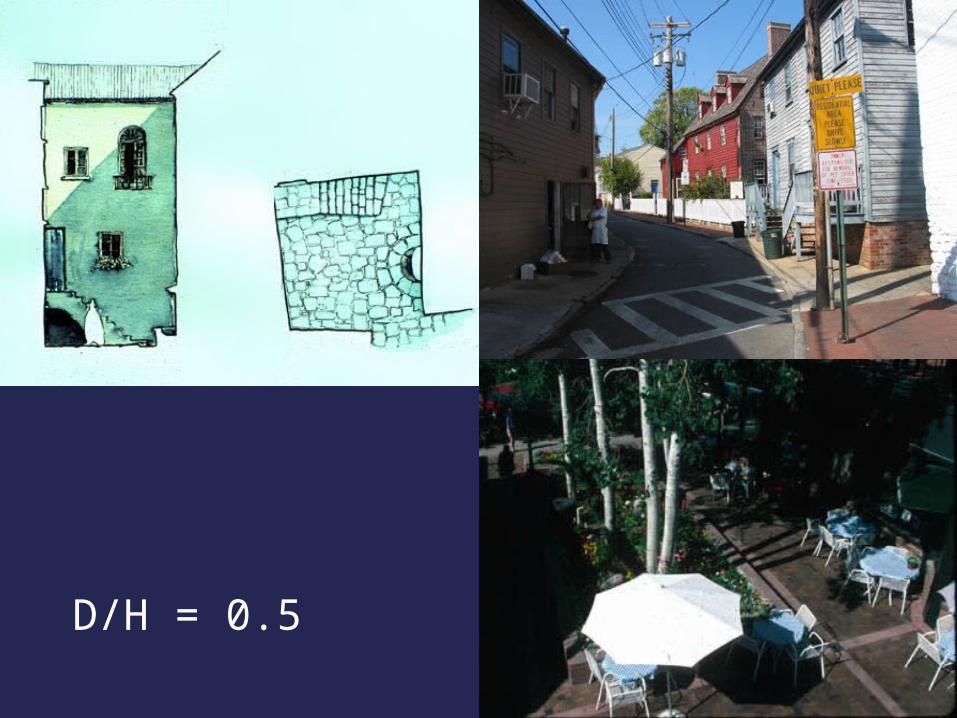
D/H = 0.5
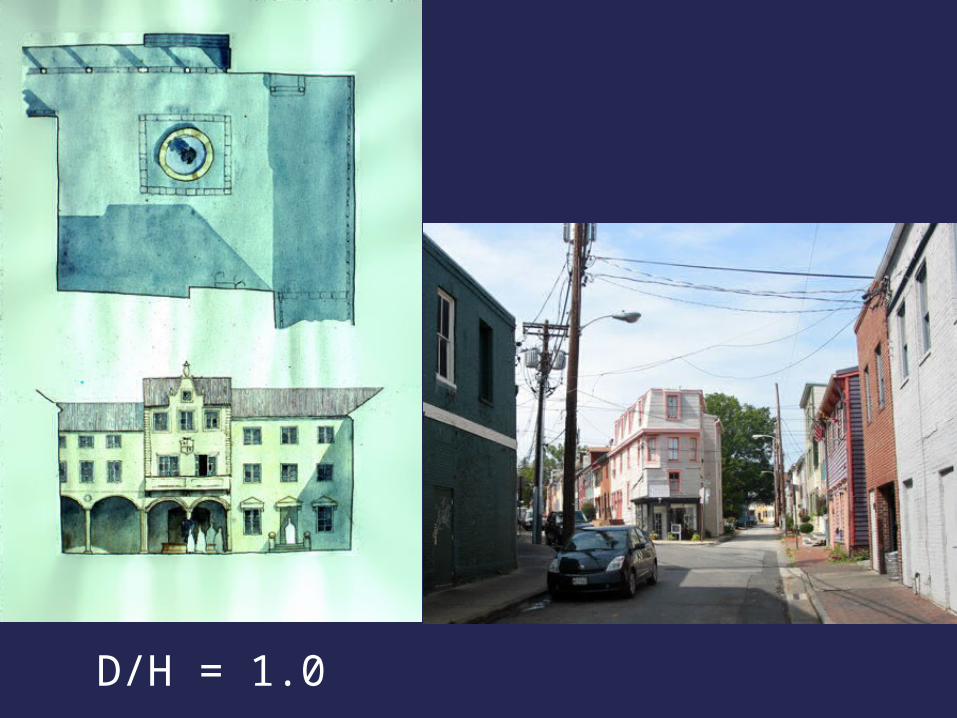
D/H = 1.0
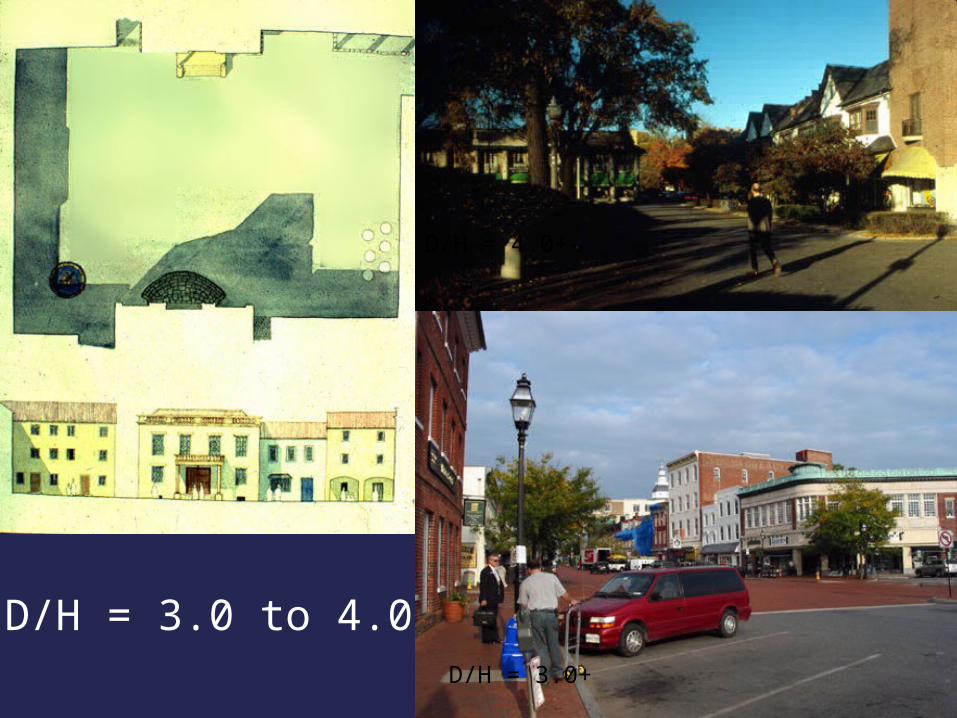
D/H = 3.0 to 4.0
D/H = 4.0+
D/H = 3.0
D/H = 3.0+
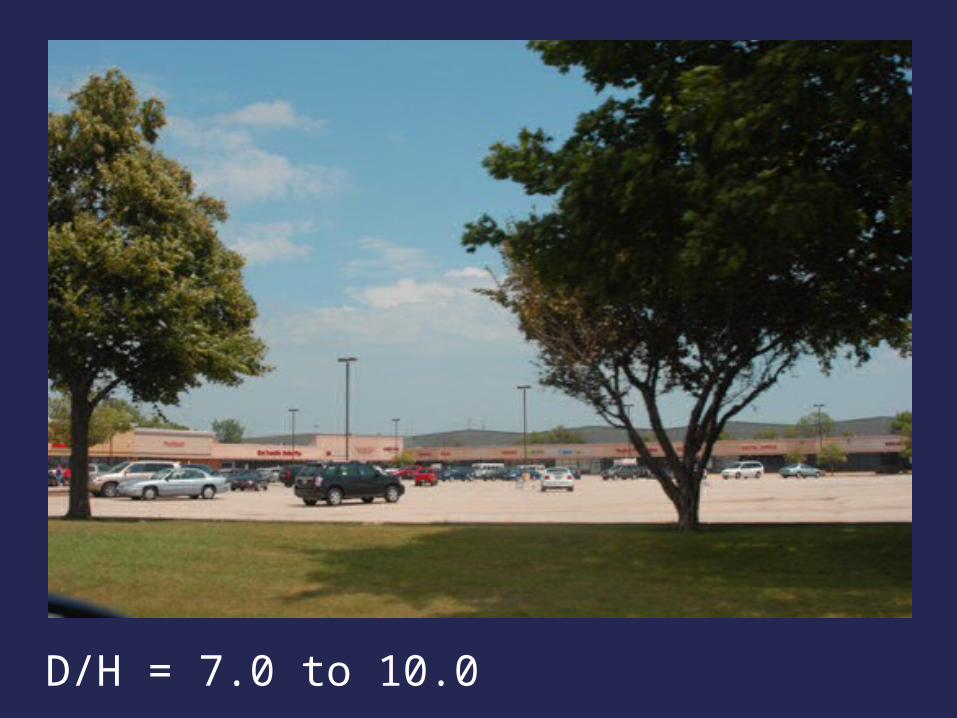
D/H = 7.0 to 10.0
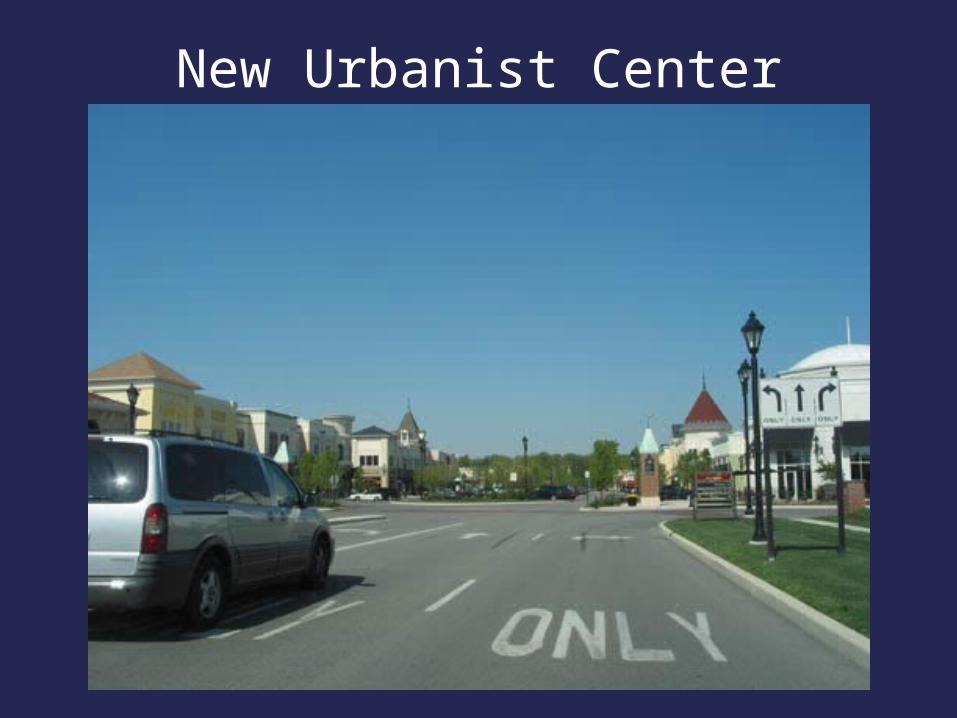
New Urbanist Center
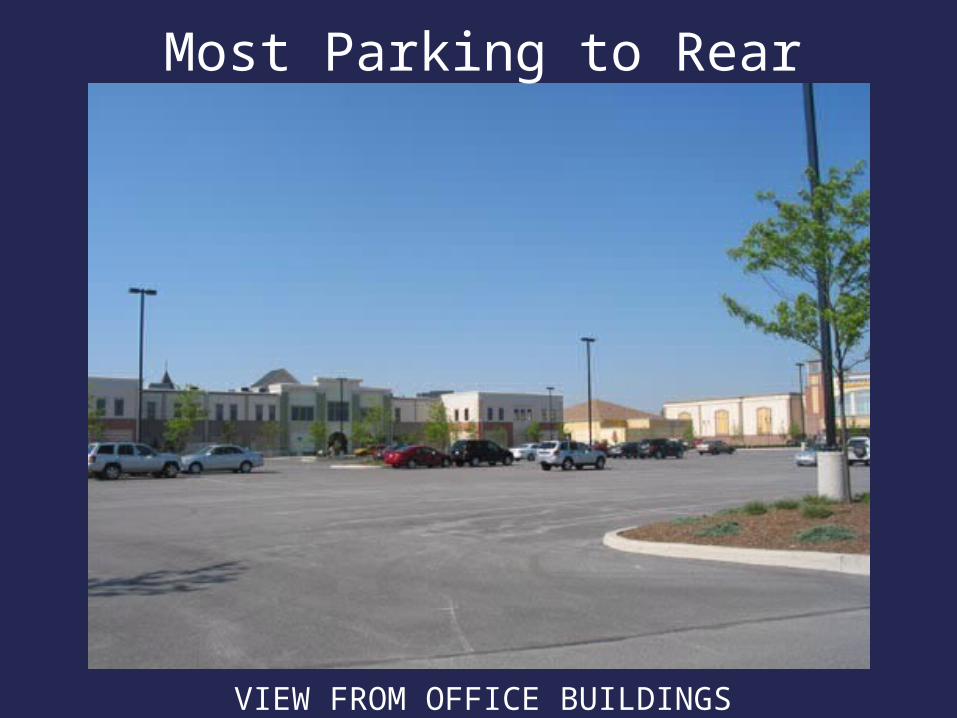
Most Parking to Rear
VIEW FROM OFFICE BUILDINGS
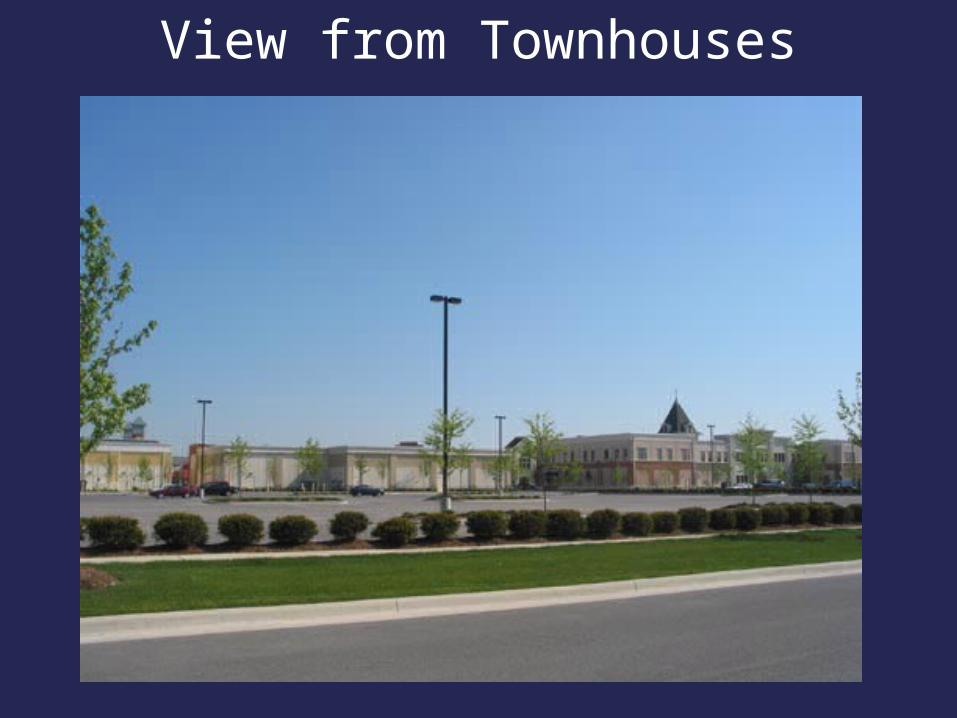
View from Townhouses
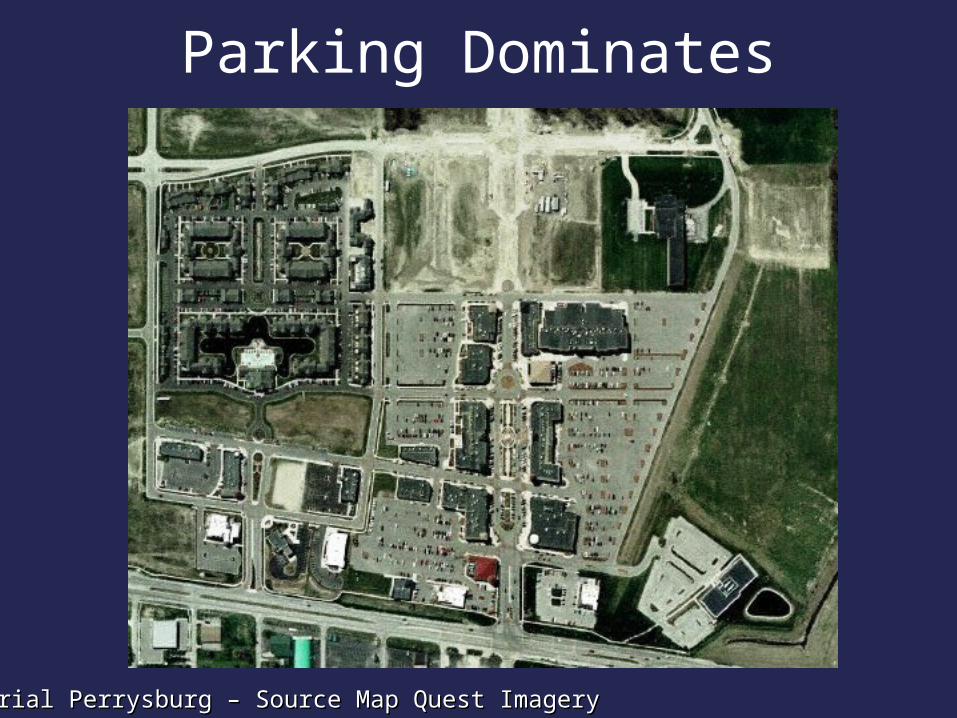
Aerial Perrysburg – Source Map Quest ImageryAerial Perrysburg – Source Map Quest Imagery
Parking Dominates
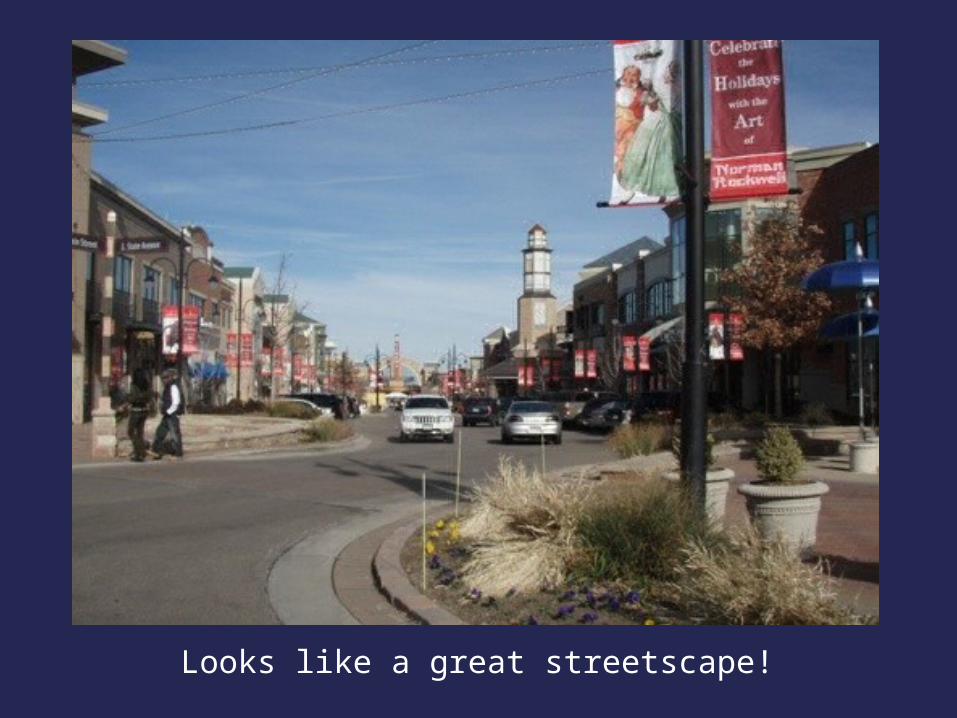
Looks like a great streetscape!
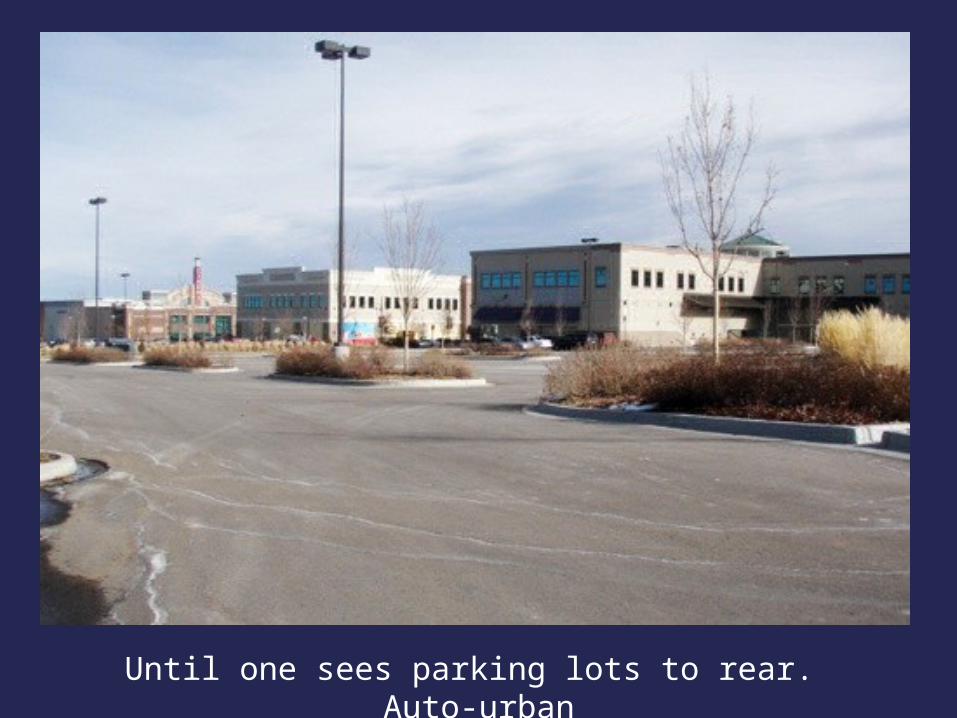
Until one sees parking lots to rear. Auto-urban
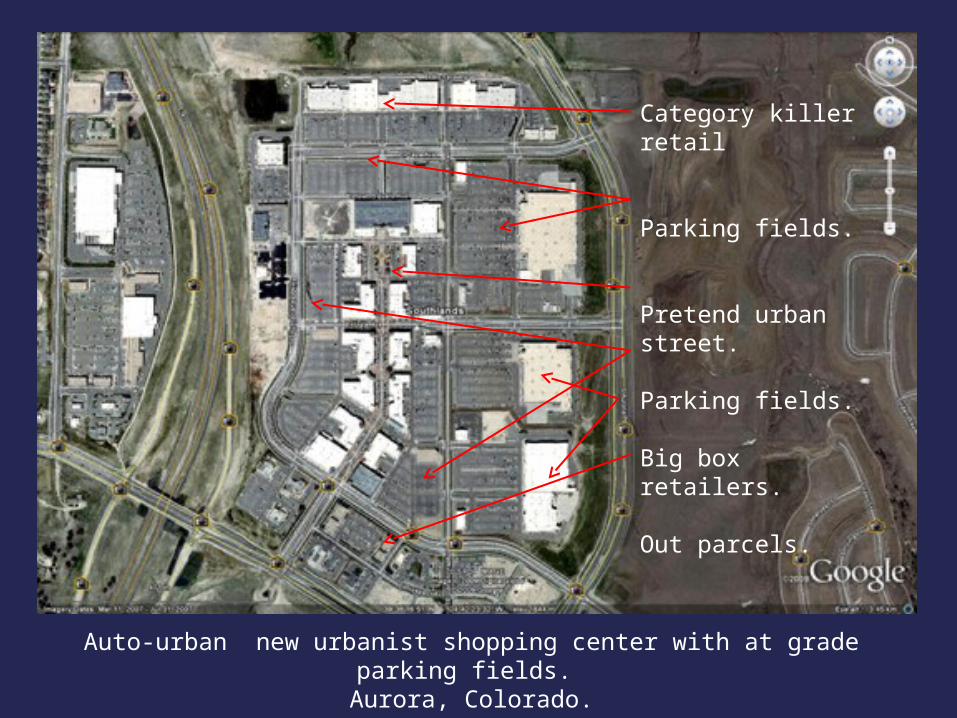
Auto-urban new urbanist shopping center with at grade parking fields.
Aurora, Colorado.
Category killer retail
Parking fields.
Pretend urban street.
Parking fields.
Big box retailers.
Out parcels.
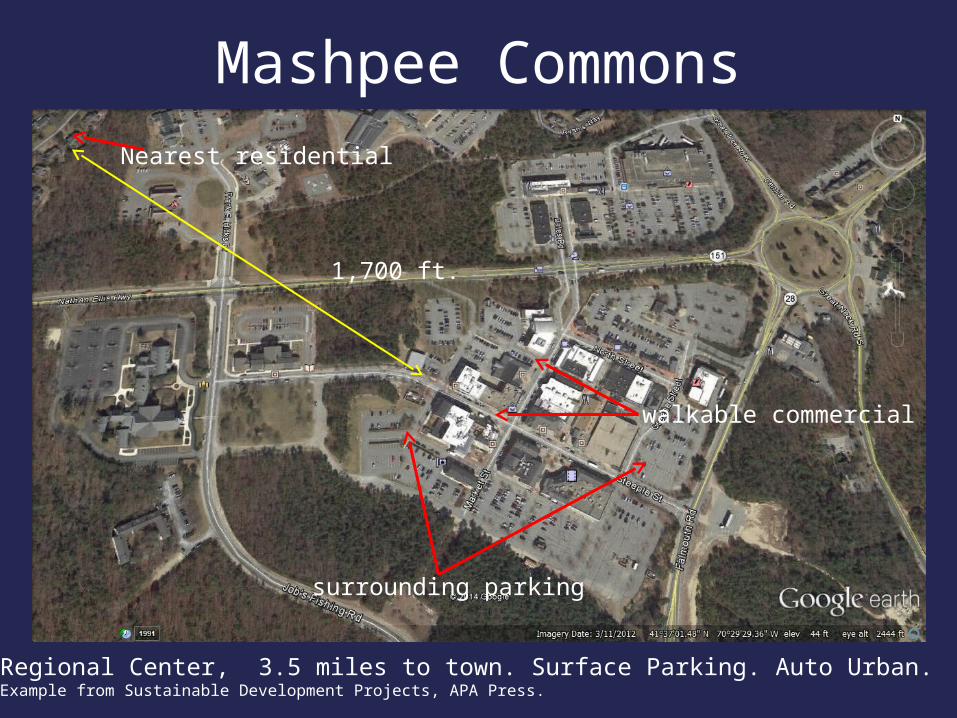
Mashpee Commons
Regional Center, 3.5 miles to town. Surface Parking. Auto Urban. Example from Sustainable Development Projects, APA Press.
Nearest residential
1,700 ft.
walkable commercial
surrounding parking
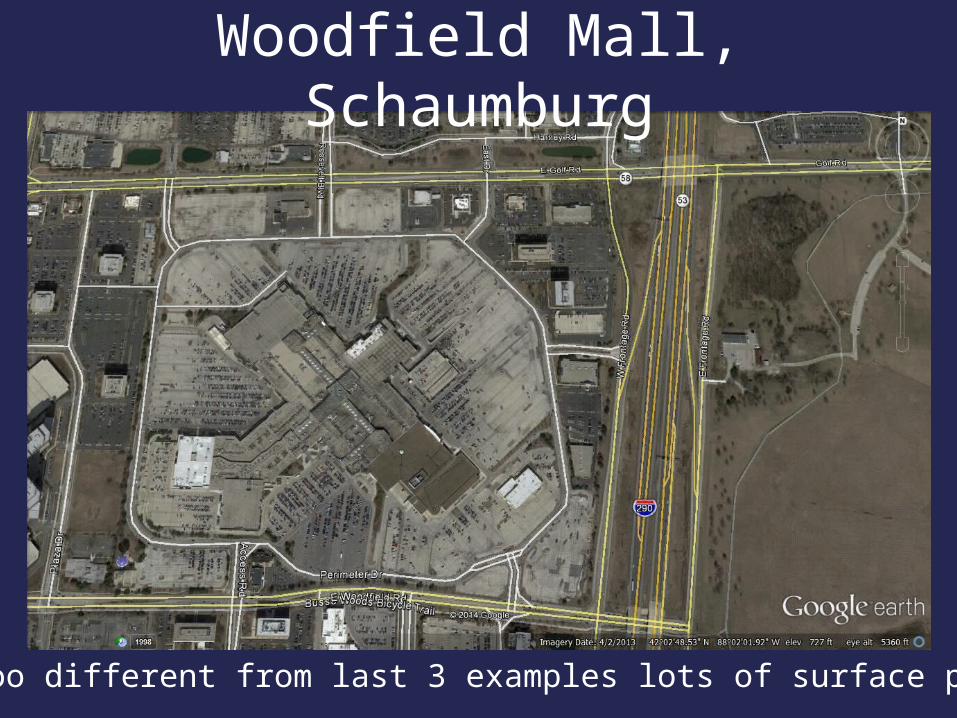
Woodfield Mall, Schaumburg
Not too different from last 3 examples lots of surface parking.

EFFICIENCIES
INTENSITYFLOOR AREA RATIO
Auto-Urban Urban
Stories Surface Parking Structured Parking
Parking Stories
1 0.503 0.619 2
2 0.673 0.897 2
4 0.809 1.493 3
8 0.900 2.571 5
20 0.965 5.073 10
40 0.989 7.508 15
All examples based on offices with 3.3 parking spaces per thousand square feet.

Sustainability Requires Picking
the High Hanging Fruit
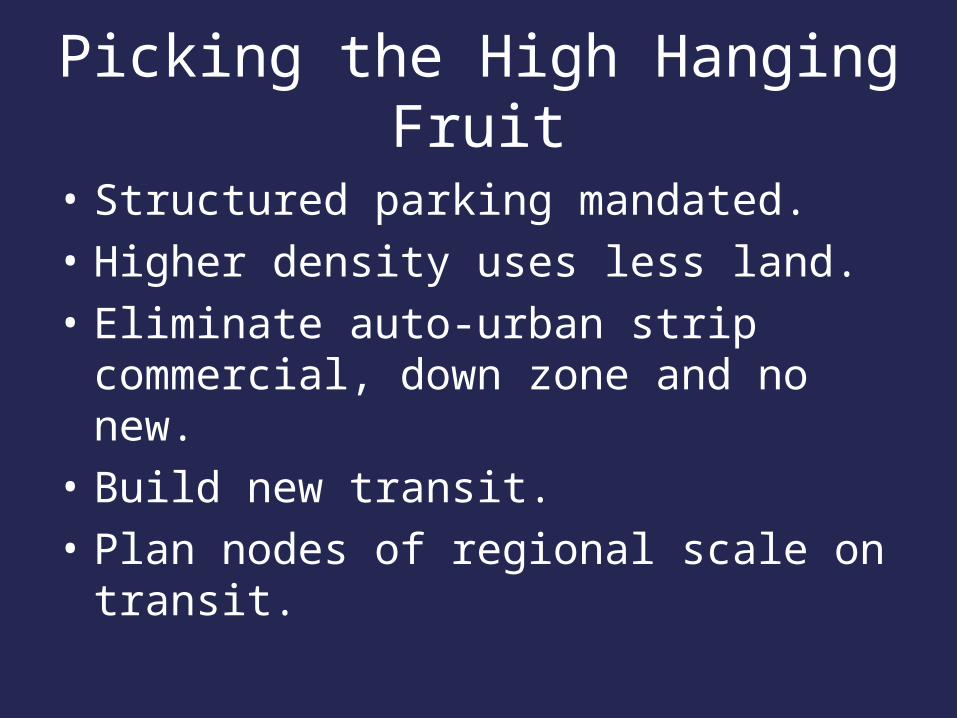
Picking the High Hanging Fruit
• Structured parking mandated.• Higher density uses less land.• Eliminate auto-urban strip
commercial, down zone and no new.• Build new transit.• Plan nodes of regional scale on
transit.
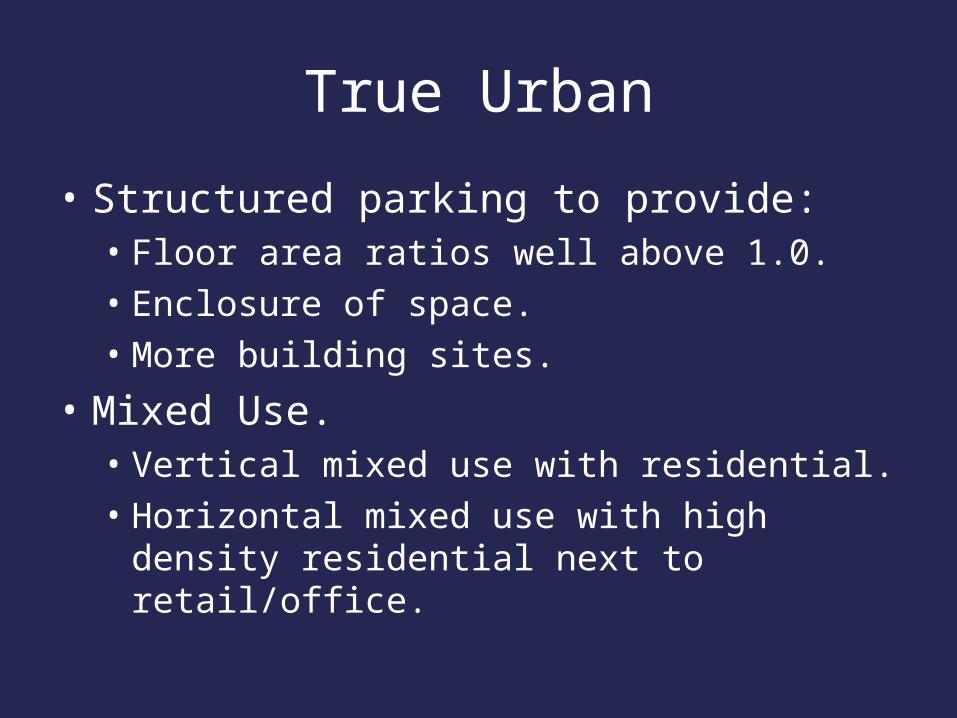
True Urban
• Structured parking to provide:• Floor area ratios well above 1.0.• Enclosure of space.• More building sites.
• Mixed Use.• Vertical mixed use with residential.• Horizontal mixed use with high density
residential next to retail/office.
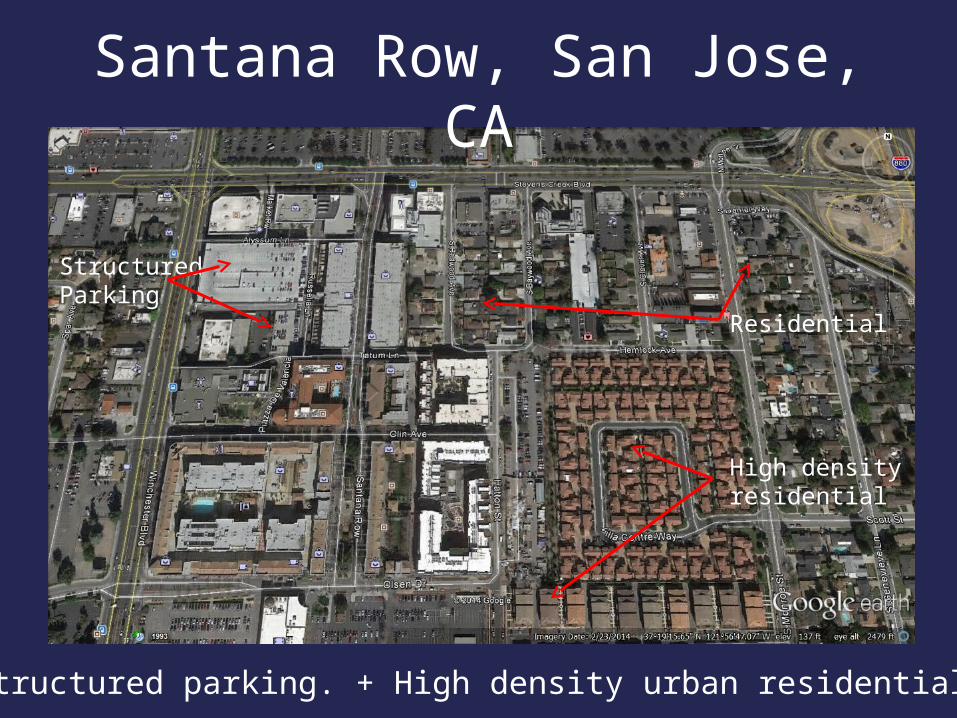
Structured parking. + High density urban residential.
Structured Parking
Residential
High density residential
Santana Row, San Jose, CA
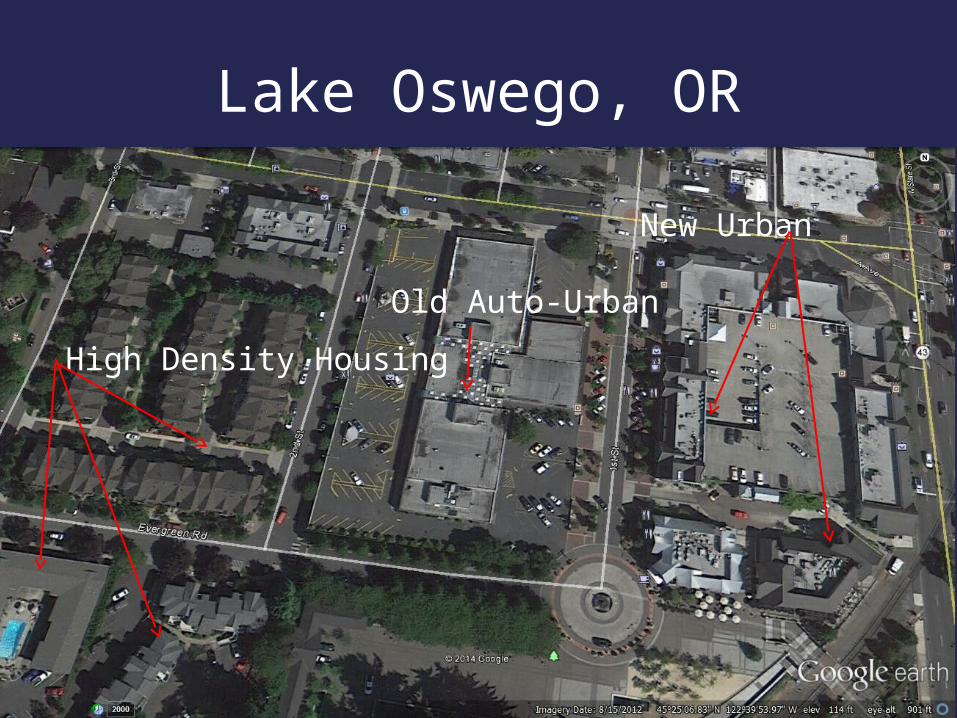
Lake Oswego, OR
New Urban
Old Auto-Urban
High Density Housing

Two story urban of traditional downtown.
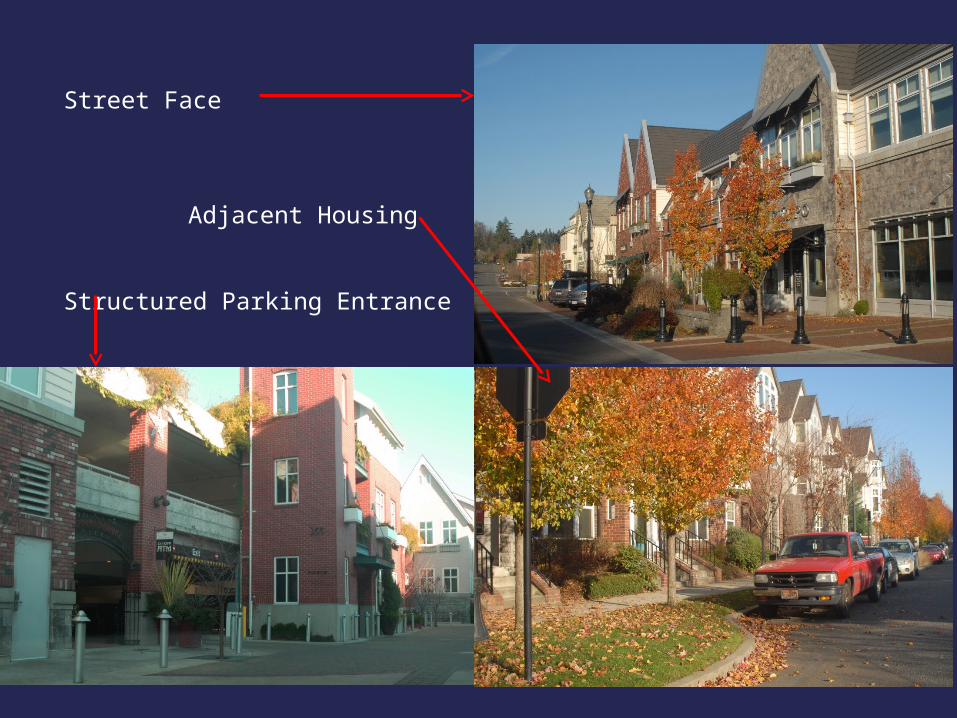
Street Face
Adjacent Housing
Structured Parking Entrance
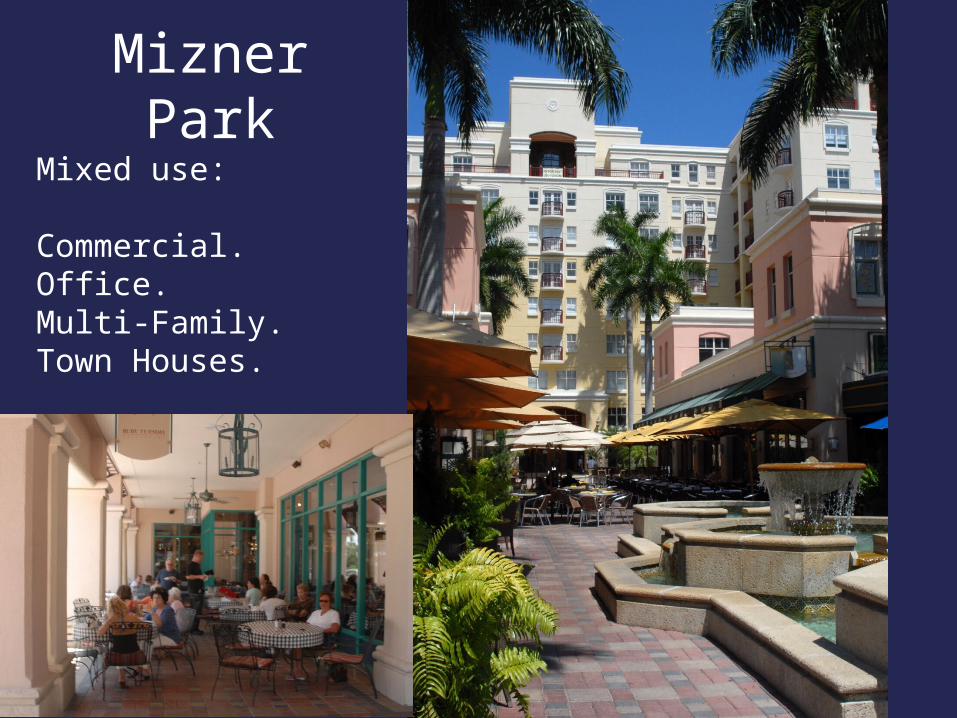
Mizner Park
Mixed use:
Commercial.Office.Multi-Family.Town Houses.
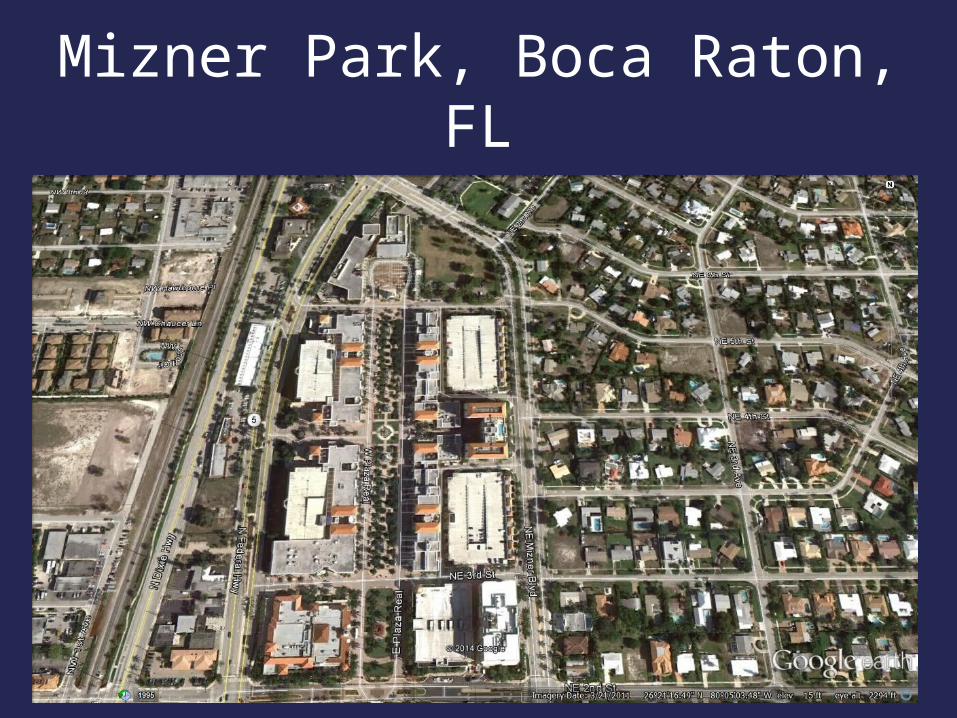
Mizner Park, Boca Raton, FL

Town House
Street Face
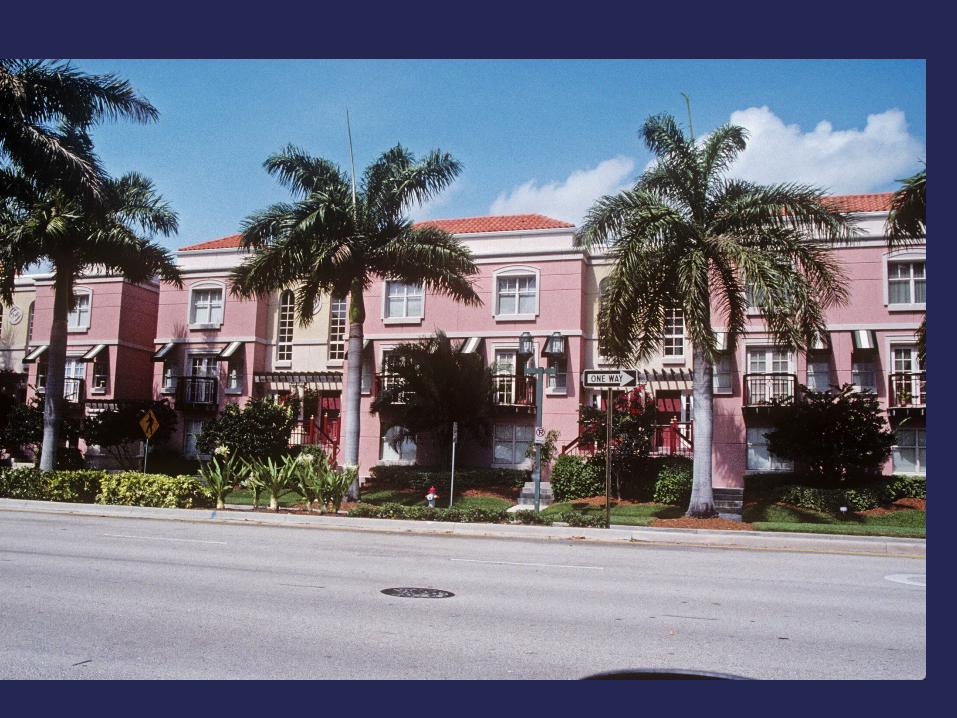
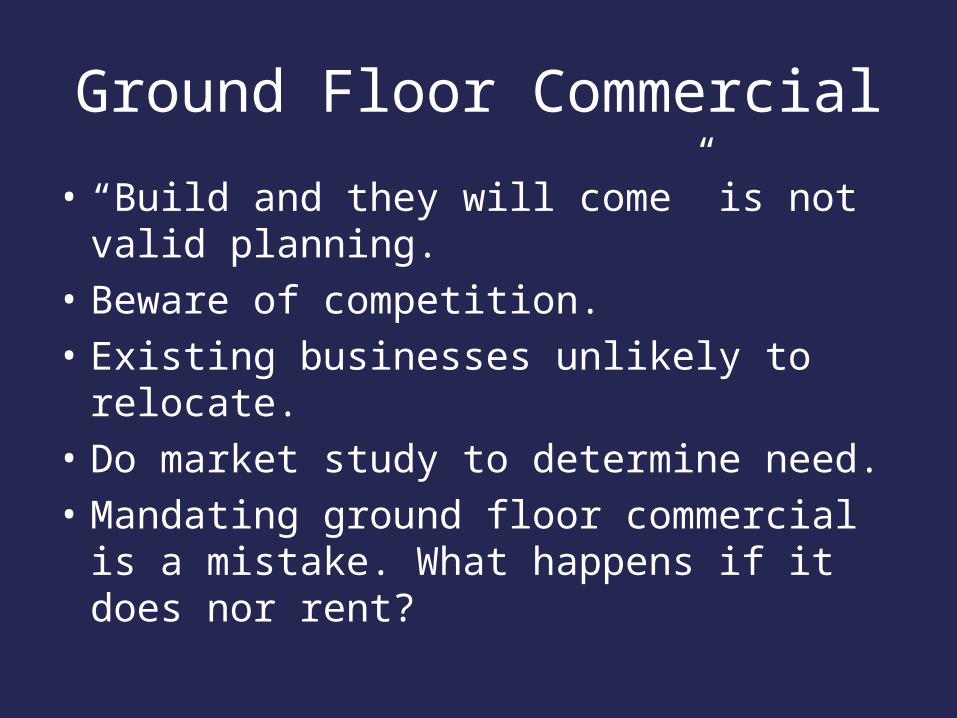
Ground Floor Commercial
• “Build and they will come” is not valid planning.
• Beware of competition.• Existing businesses unlikely to
relocate.• Do market study to determine need.• Mandating ground floor commercial is
a mistake. What happens if it does nor rent?
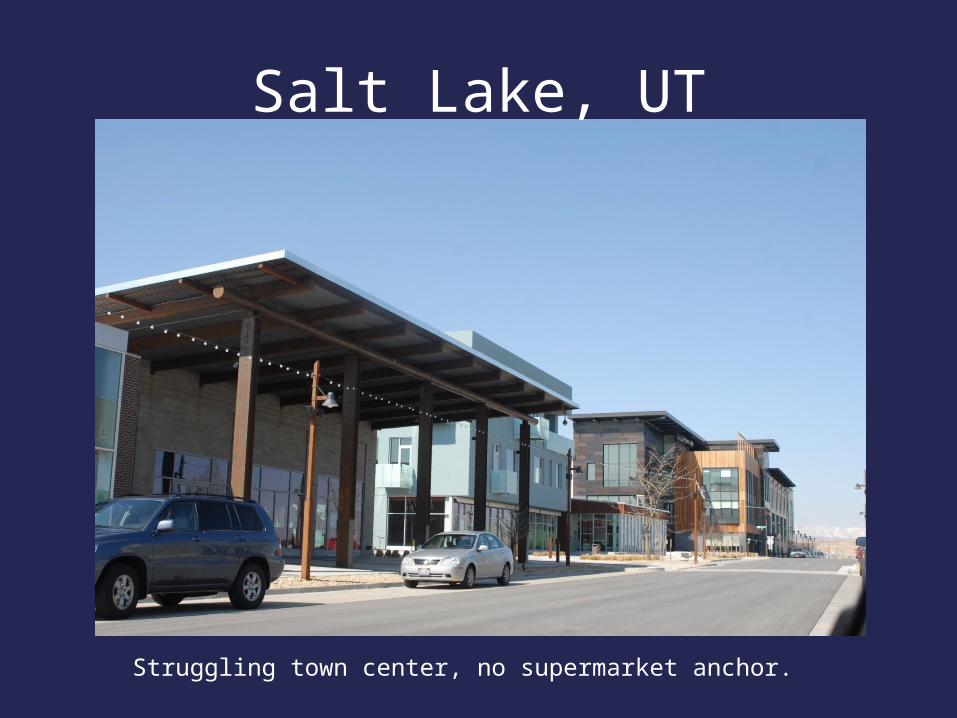
Struggling town center, no supermarket anchor.
Salt Lake, UT
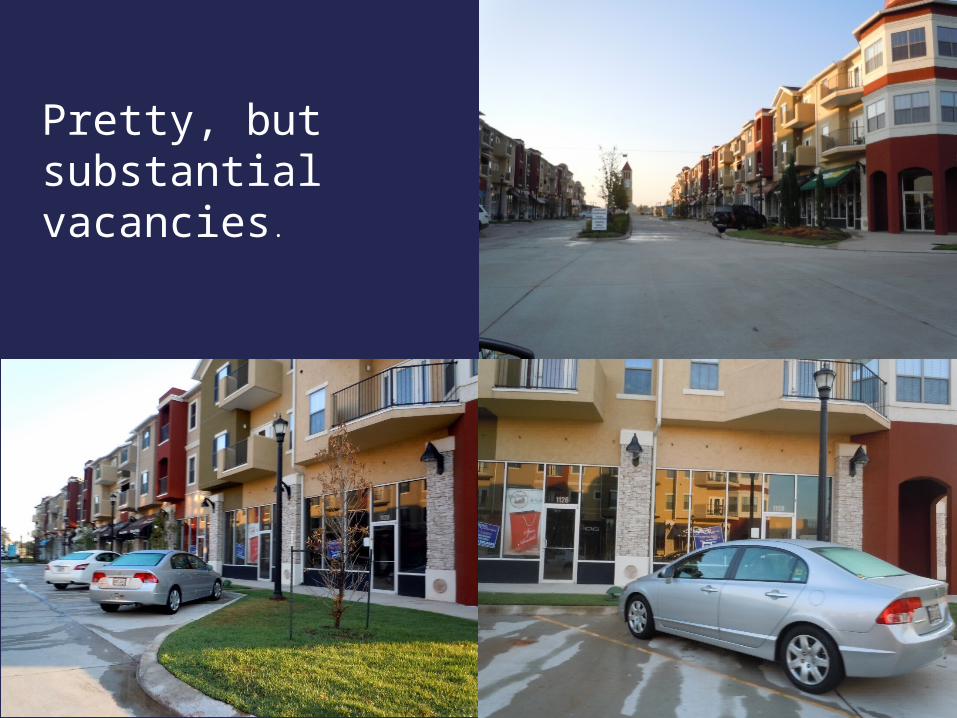
Pretty, but substantial vacancies.
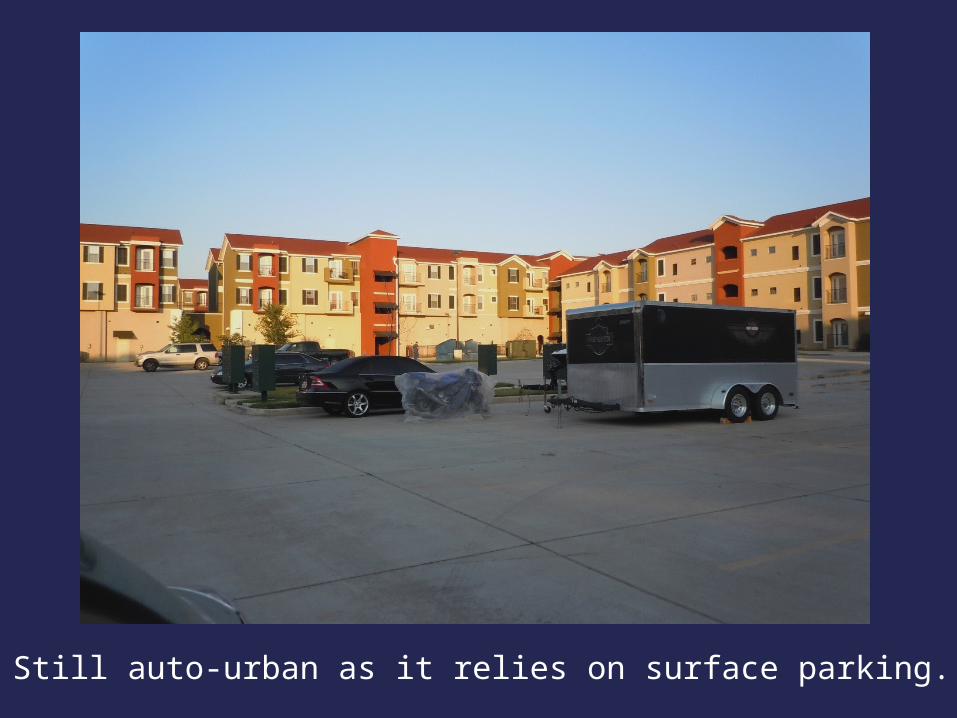
Still auto-urban as it relies on surface parking.
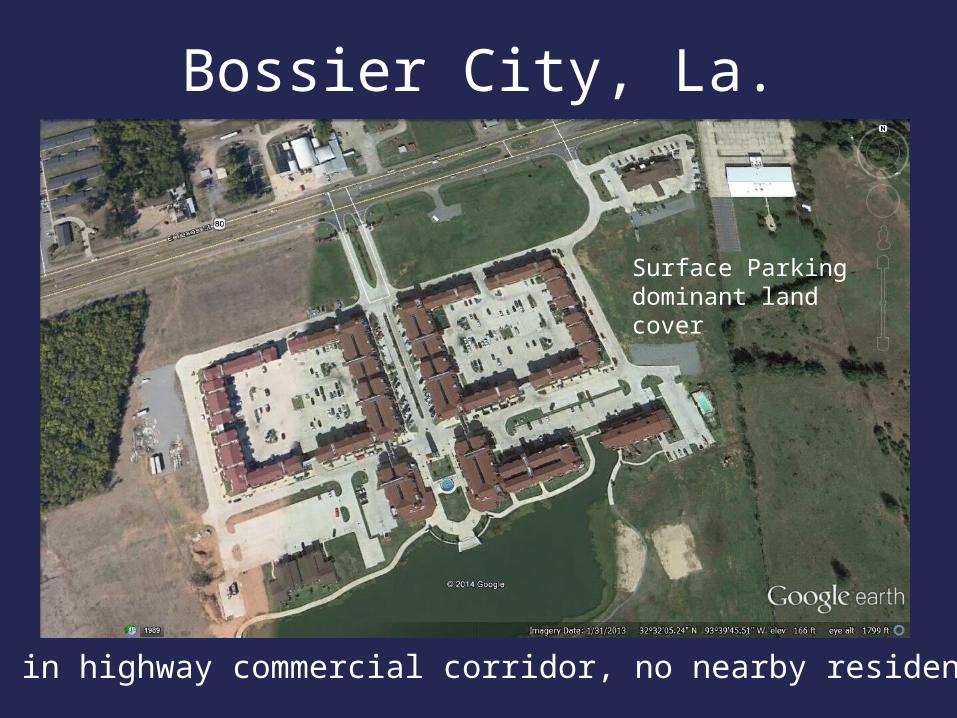
Bossier City, La.
Surface Parking dominant land cover
Build in highway commercial corridor, no nearby residential.

Eliminate Strip Commercial
• Too many communities zoned strip commercial.
• Older cities did it on streets with trolley or bus service.
• Suburbs on all arterials.• The pattern is not sustainable.• Create nodes instead.
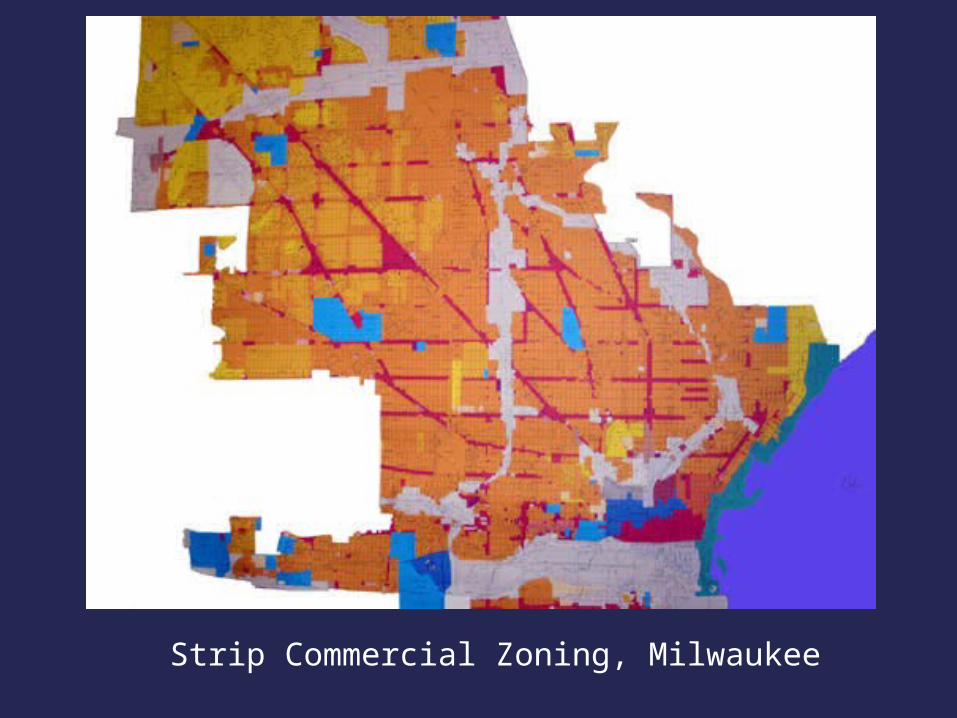
Strip Commercial Zoning, Milwaukee

Strip Commercial
Node surrounded by high density residential
Eliminate Strips Build Nodes
Do Not Fear Height
• Tall building can be integrated into old communities.
• Allows town centers to grow and provide mixed use.
• Height is a design issue and can be handled.
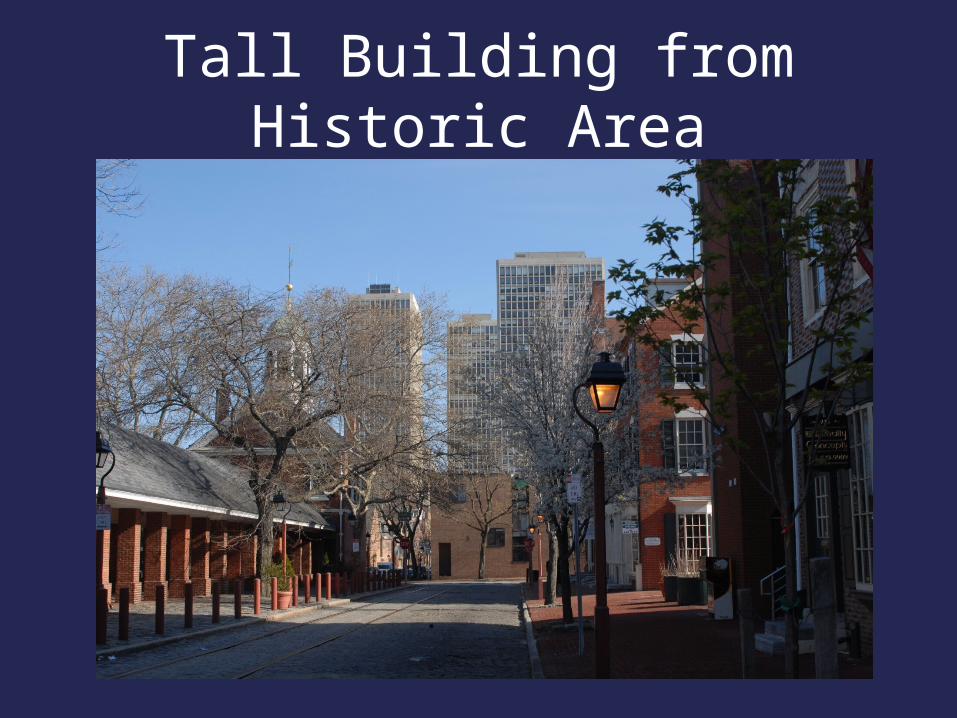
Tall Building from Historic Area
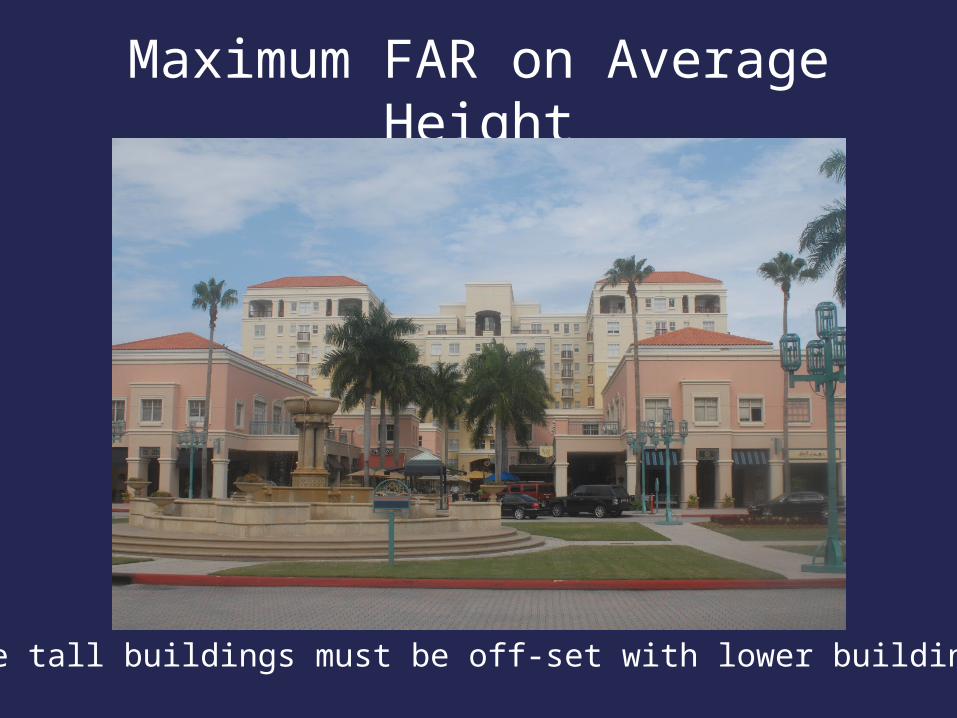
Maximum FAR on Average Height
The tall buildings must be off-set with lower buildings.
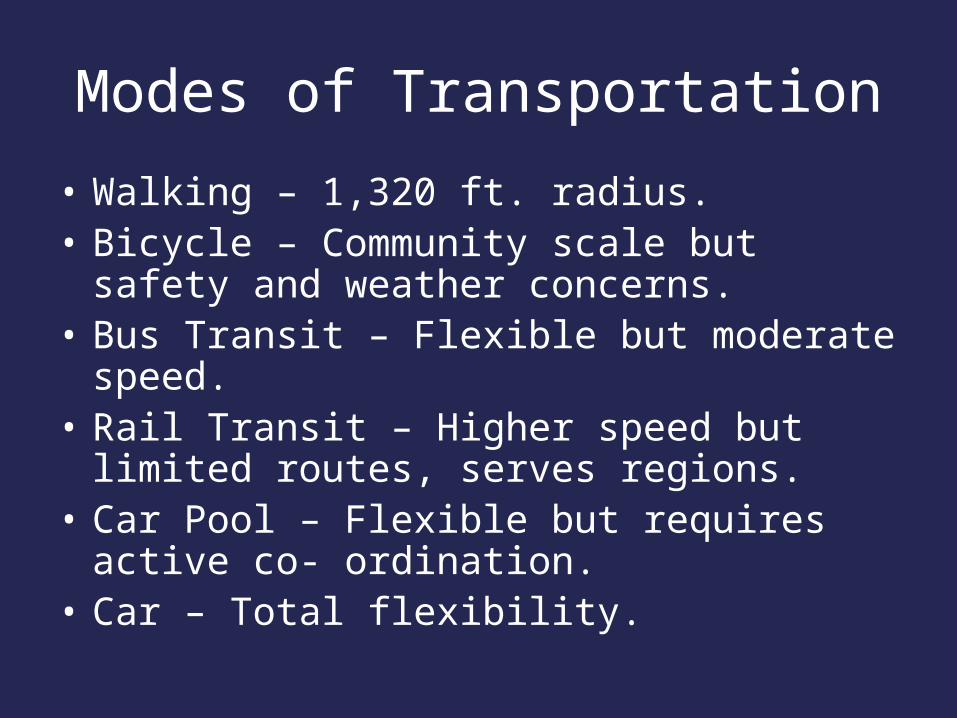
Modes of Transportation
• Walking – 1,320 ft. radius.• Bicycle – Community scale but safety
and weather concerns.• Bus Transit – Flexible but moderate
speed.• Rail Transit – Higher speed but limited
routes, serves regions.• Car Pool – Flexible but requires active
co- ordination. • Car – Total flexibility.
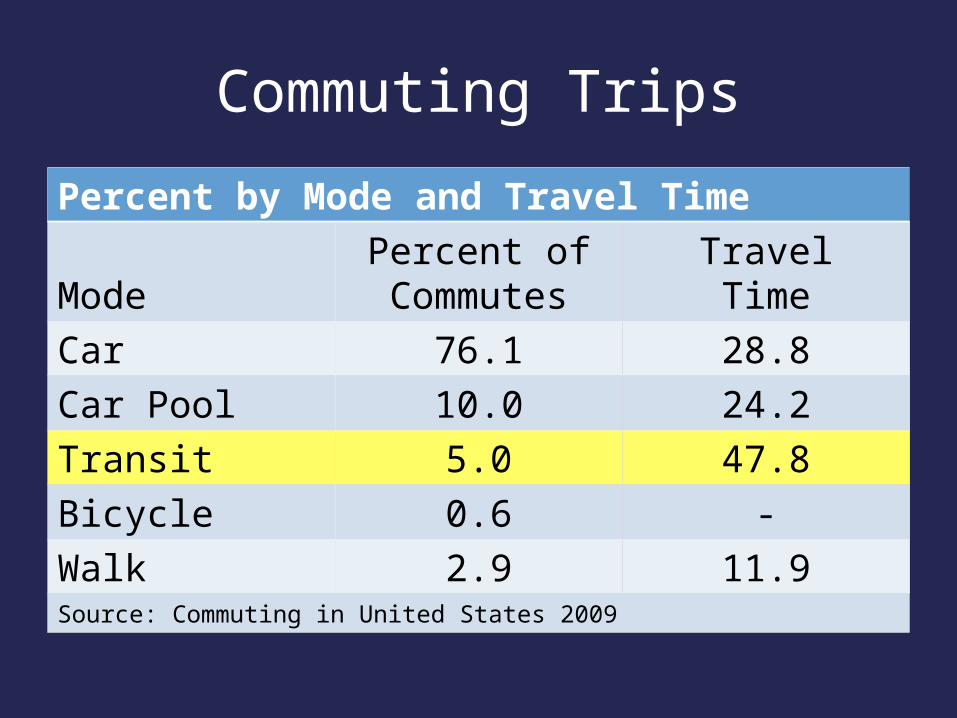
Commuting Trips
Percent by Mode and Travel Time
ModePercent of Commutes
TravelTime
Car 76.1 28.8
Car Pool 10.0 24.2
Transit 5.0 47.8
Bicycle 0.6 -
Walk 2.9 11.9Source: Commuting in United States 2009

Transit
• For the region, this is the mode that can increase sustainability.
• The national average is low – 5%.• New York, Chicago, San Francisco
have much larger rates.• Portland invested and created
increased share.• Planned nodes of shopping,
employment.
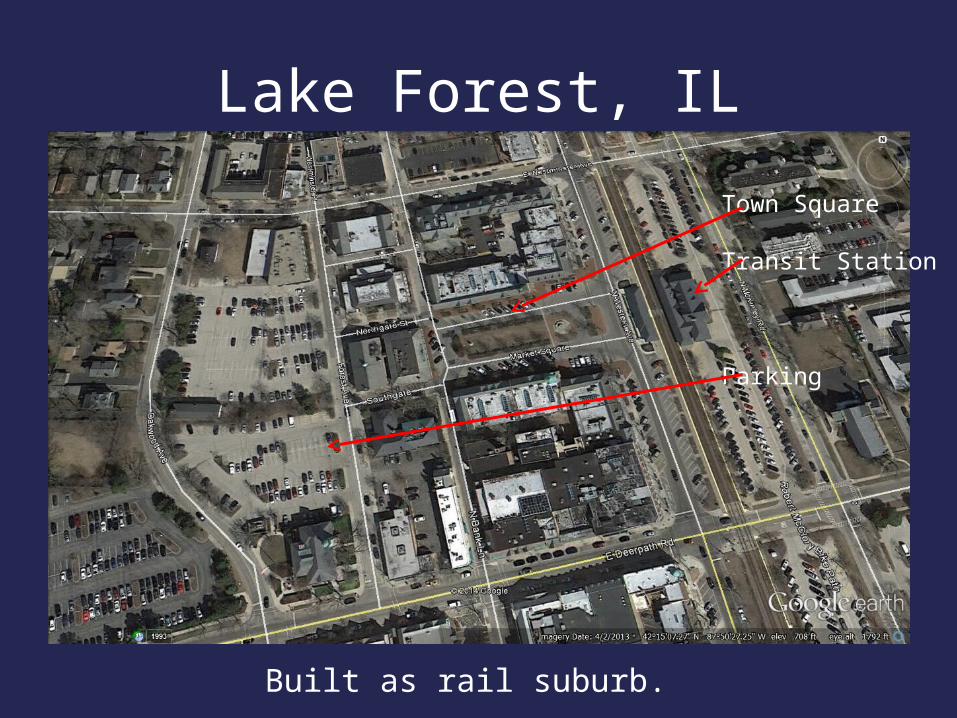
Lake Forest, IL
Town Square
Transit Station
Parking
Built as rail suburb.
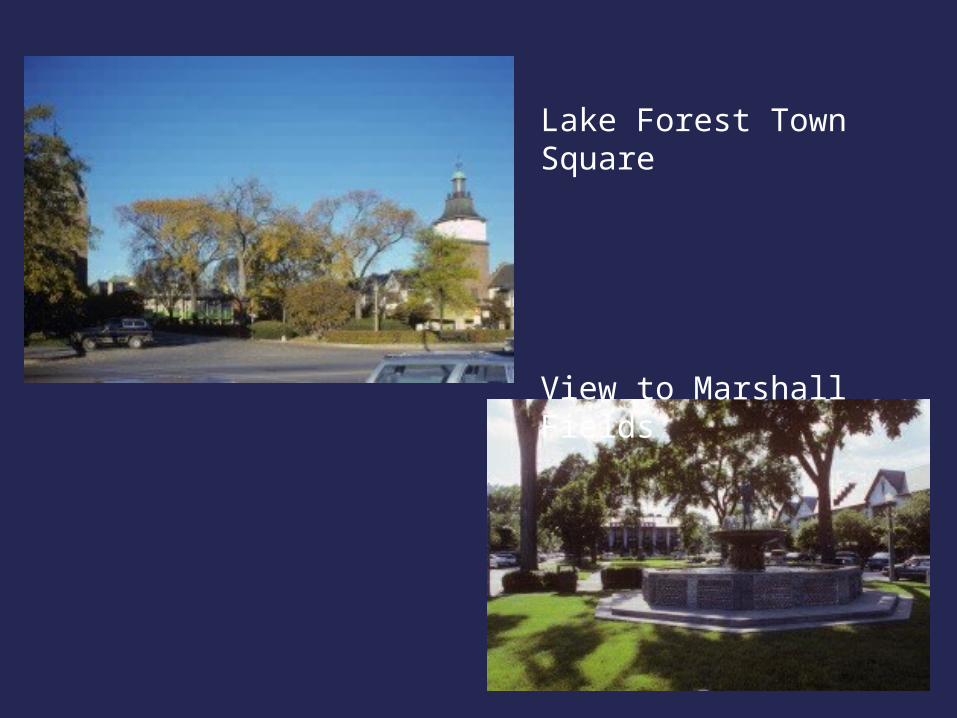
Lake Forest Town Square
View to Marshall Fields
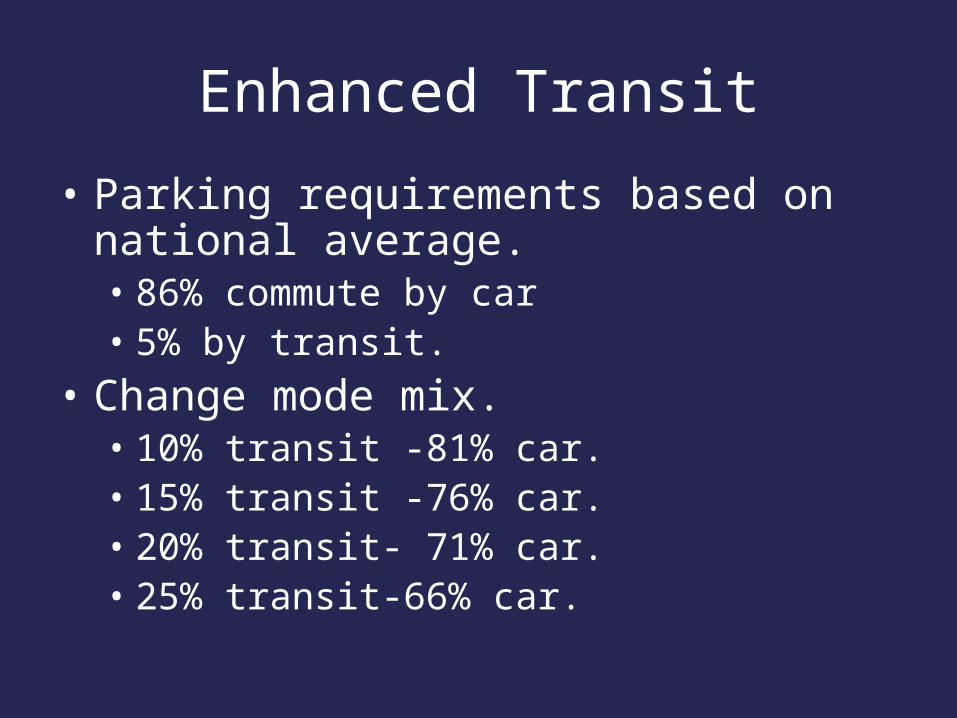
Enhanced Transit
• Parking requirements based on national average.• 86% commute by car • 5% by transit.
• Change mode mix.• 10% transit -81% car.• 15% transit -76% car.• 20% transit- 71% car.• 25% transit-66% car.

Impact on Parking
Transit Car Parking Spaces Per 1,000 sf.
Mode Percent retail office
5% 81% 5 3.3
10% 76% 4.7 3.115% 71% 4.4 2.920% 66% 4.0 2.725% 61% 3.7 2.5

EFFICIENCIES
Office buildings with various parking ratios due to transit ridership.
INTENSITYFLOOR AREA RATIO
Design Parking Spaces per 1,000 sf.
Stories
Parking Stories
3.3 3.1 2.9 2.7 2.5
1 2 0.619 0.633 0.648 0.663 0.679
2 2 0.897 0.927 0.958 0.992 1.028
4 3 1.493 1.548 1.606 1.670 1.738
8 5 2.571 2.668 2.773 2.886 3.009
20 10 5.073 5.262 5.466 5.686 5.924
40 15 7.508 7.784 8.081 8.402 8.749
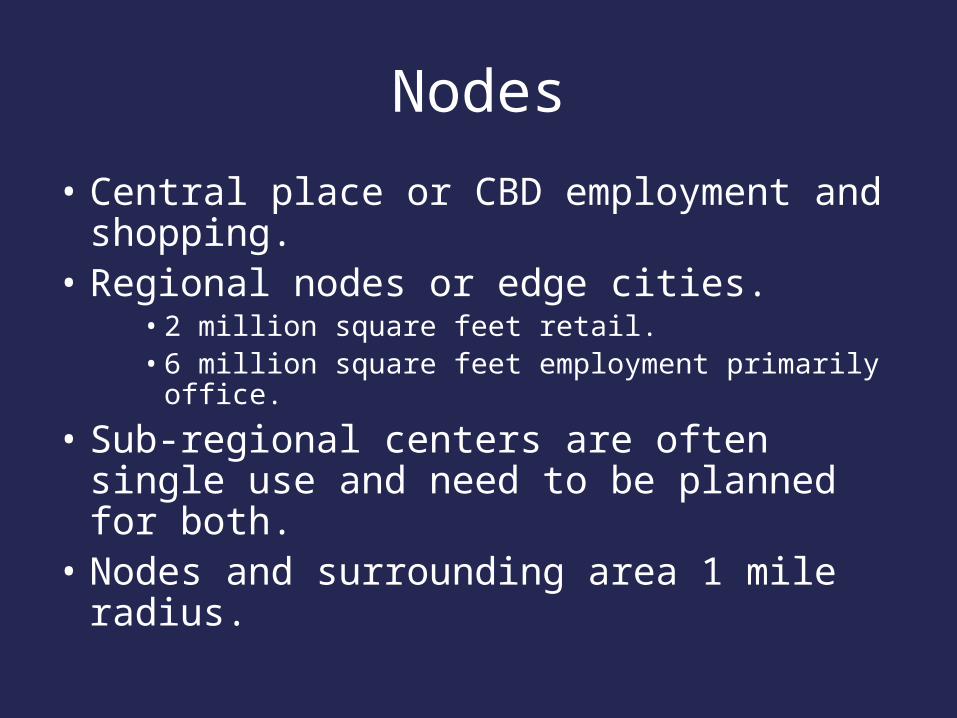
Nodes
• Central place or CBD employment and shopping.
• Regional nodes or edge cities.• 2 million square feet retail.• 6 million square feet employment primarily
office.
• Sub-regional centers are often single use and need to be planned for both.
• Nodes and surrounding area 1 mile radius.
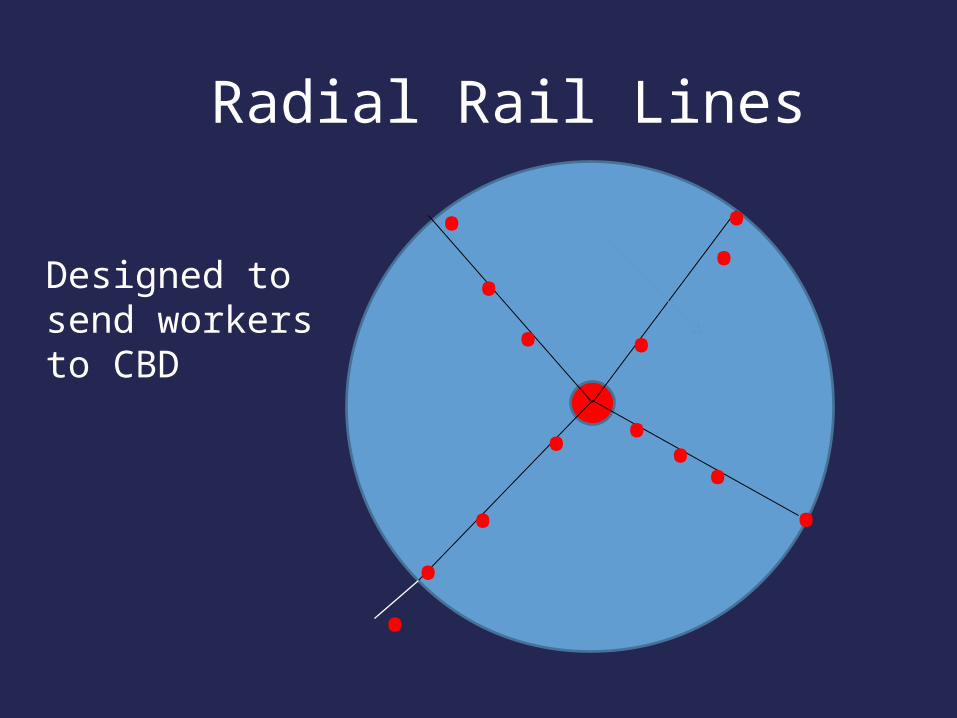
Radial Rail Lines
. ...
... ..
....
.
Designed to send workers to CBD
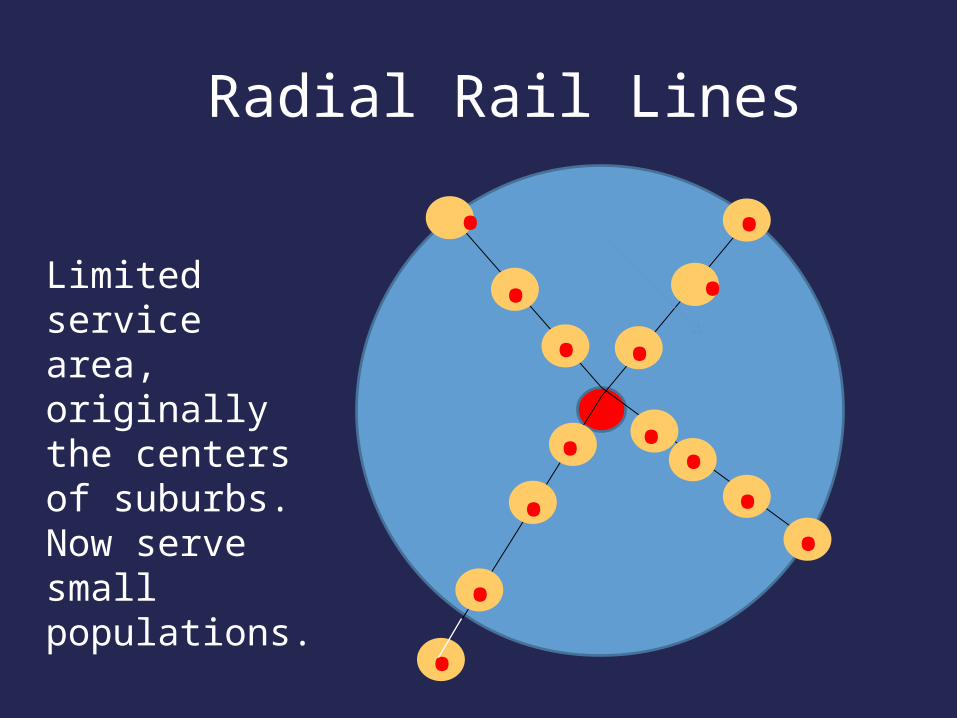
Radial Rail Lines
...
...
...
... .
.
Limited service area, originally the centers of suburbs. Now serve small populations.
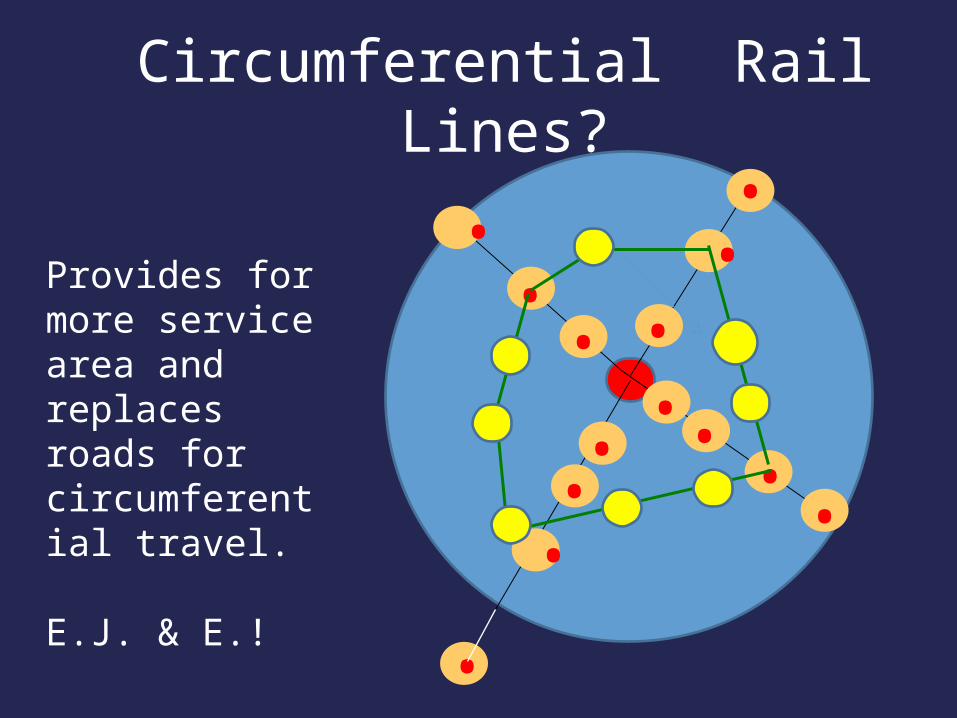
Circumferential Rail Lines?
..
.
...
...
.. ..
.
Provides for more service area and replaces roads for circumferential travel.
E.J. & E.!
Planning
• Needs to be long term.• Nodes and rail lines determined in
advance.• Roads coordinated with these.• Rail service available from start of
nodes.• Rail service at start of development.
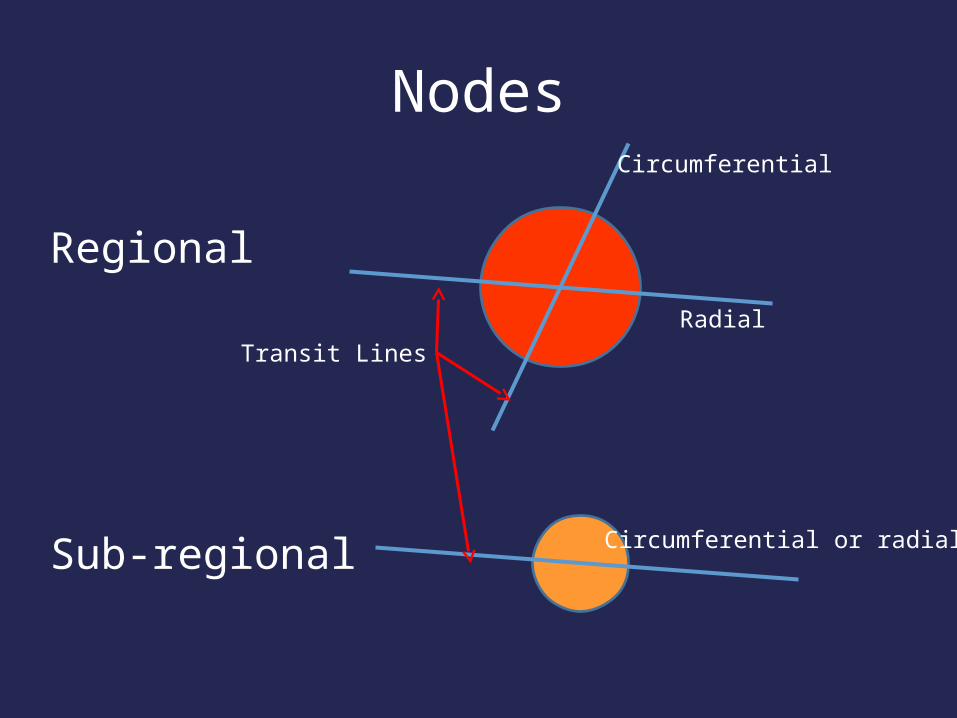
Nodes
Regional
Sub-regional
Circumferential
Circumferential or radial
RadialTransit Lines

High Speed Rail
Heavy Rail
Growth Areas
Urban Areas
Urban Cores
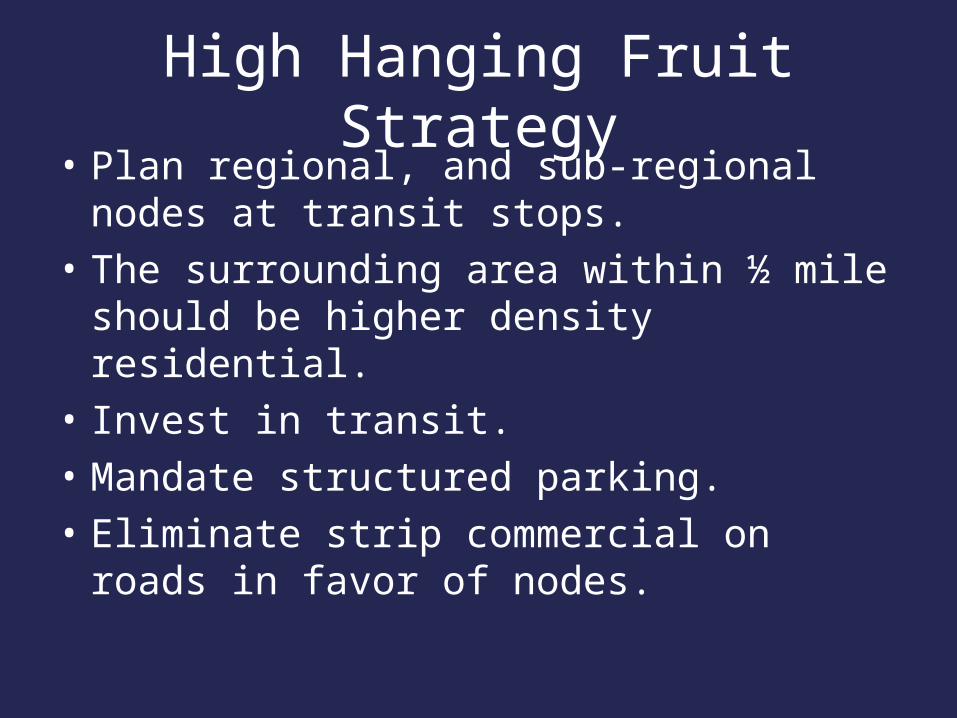
High Hanging Fruit Strategy
• Plan regional, and sub-regional nodes at transit stops.
• The surrounding area within ½ mile should be higher density residential.
• Invest in transit.• Mandate structured parking.• Eliminate strip commercial on roads
in favor of nodes.
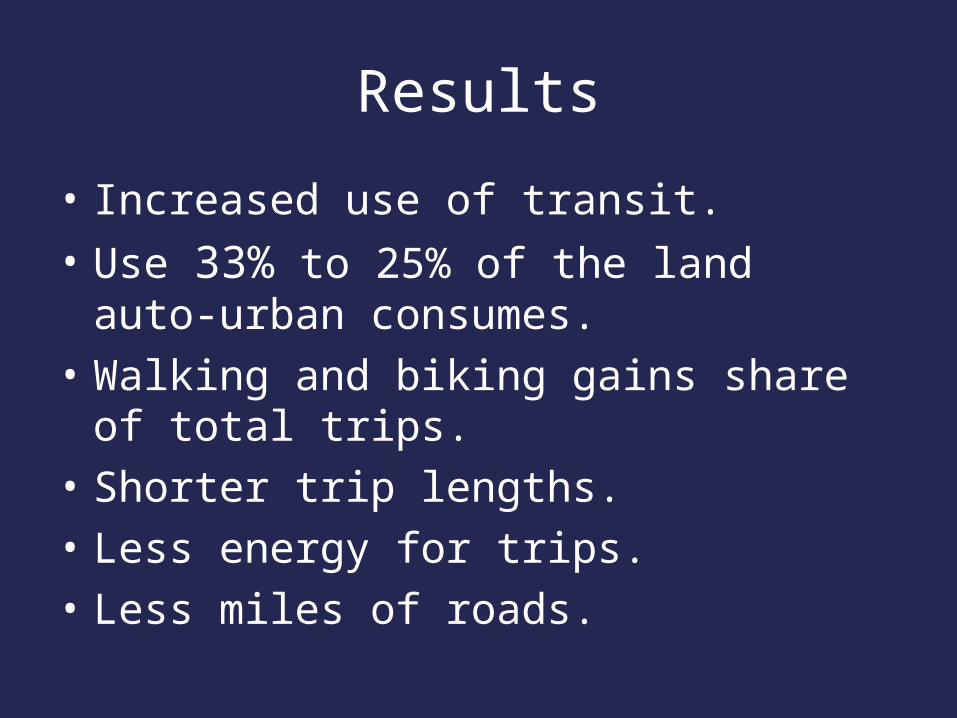
Results
• Increased use of transit.• Use 33% to 25% of the land auto-
urban consumes.• Walking and biking gains share of
total trips.• Shorter trip lengths.• Less energy for trips.• Less miles of roads.

Questions
?
??
????
?
?
??
?
?
?
? ??
?
?
?
?
?
?
?
?
?
?
?
?
?
?
?
?
?
?
?
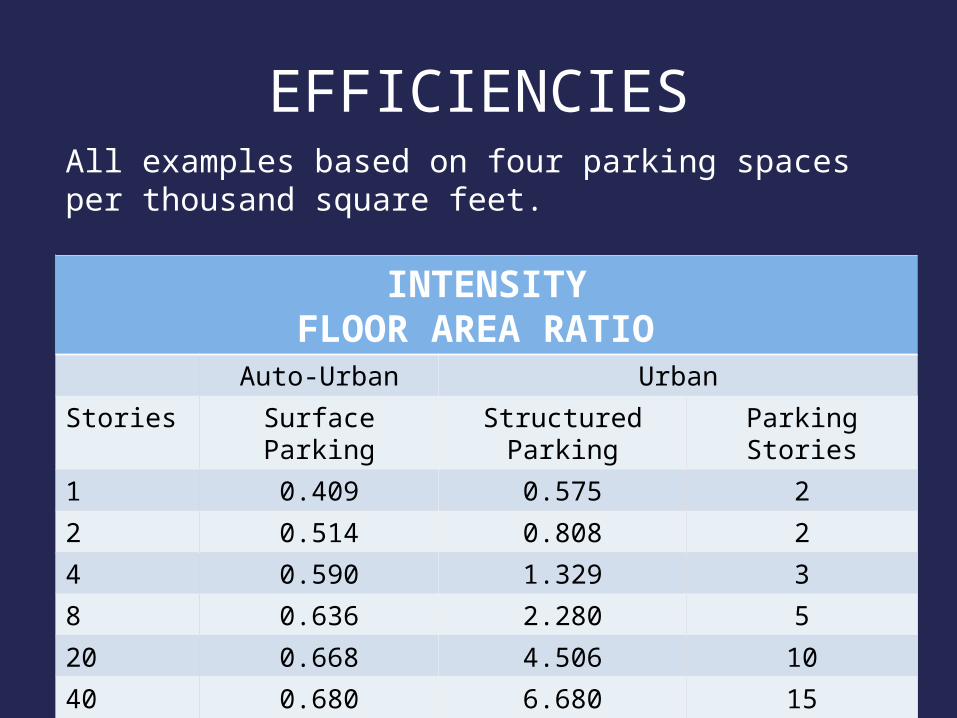
EFFICIENCIES
INTENSITYFLOOR AREA RATIO
Auto-Urban Urban
Stories Surface Parking Structured Parking
Parking Stories
1 0.409 0.575 2
2 0.514 0.808 2
4 0.590 1.329 3
8 0.636 2.280 5
20 0.668 4.506 10
40 0.680 6.680 15
All examples based on four parking spaces per thousand square feet.
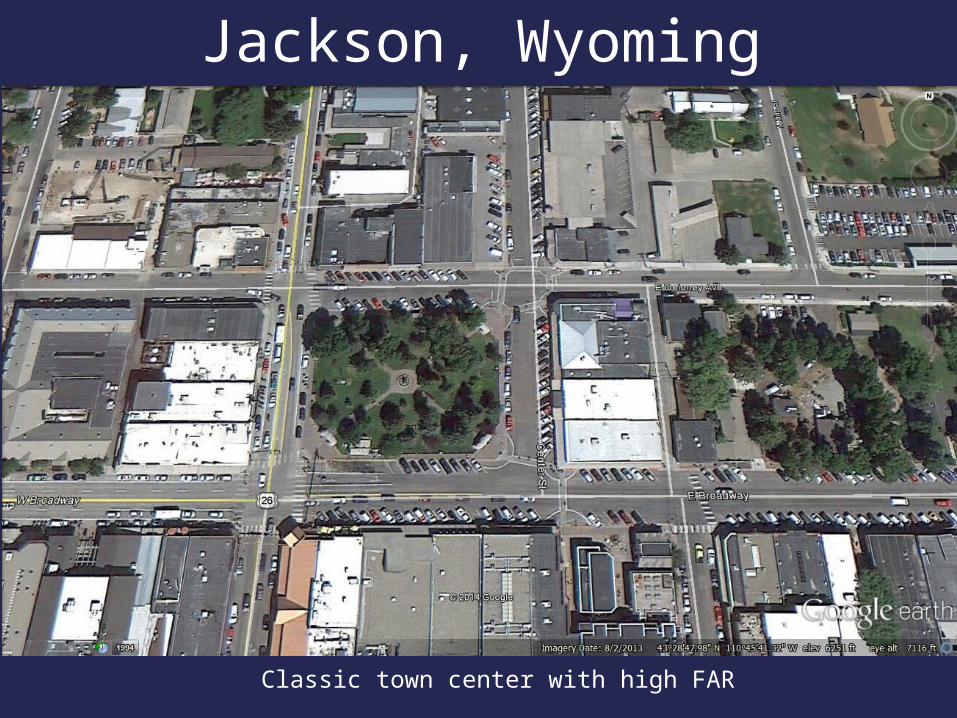
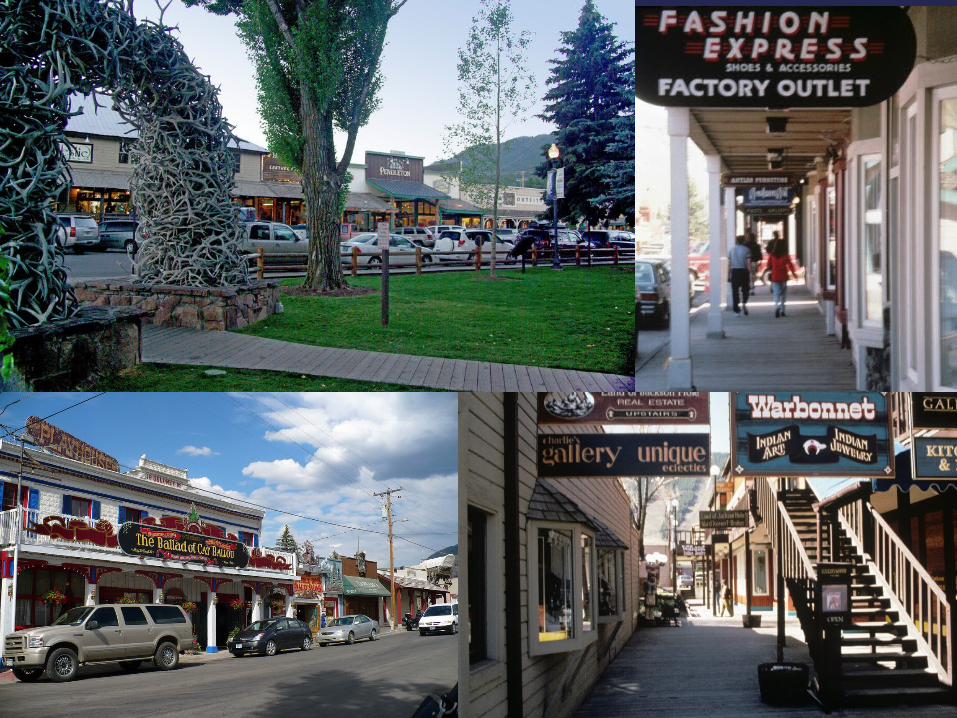
Jackson, Wyoming
Classic town center with high FAR

Surface Parking
On Street Parking
Peripheral parking makes town center work.
Related Documents