Volume 92, Issue 4, 4 April 2013, Pages 489–503 Article Functional Variants at the 11q13 Risk Locus for Breast Cancer Regulate Cyclin D1 Expression through Long-Range Enhancers Juliet D. French 1, 131 , Maya Ghoussaini 2, 131 , Stacey L. Edwards 1, 131 , Kerstin B. Meyer 3, 131 , Kyriaki Michailidou 4 , Shahana Ahmed 2 , Sofia Khan 5 , Mel J. Maranian 2 , Martin O’Reilly 3 , Kristine M. Hillman 1 ,Joshua A. Betts 1 , Thomas Carroll 3 , Peter J. Bailey 1 , Ed Dicks 2 , Jonathan Beesley 6 , Jonathan Tyrer 2 ,Ana-Teresa Maia 3 , Andrew Beck 7 , Nicholas W. Knoblauch 7 , Constance Chen 8 , Peter Kraft 8, 9 , Daniel Barnes 4 , Anna González-Neira 10 , M. Rosario Alonso 10 , Daniel Herrero 10 , Daniel C. Tessier 11 , Daniel Vincent 11 , Francois Bacot 11 , Craig Luccarini 2 , Caroline Baynes 2 , Don Conroy 2 , Joe Dennis 4 , Manjeet K. Bolla 4 , Qin Wang 4 , John L. Hopper 12 , Melissa C. Southey 13 , Marjanka K. Schmidt 14, 15 , Annegien Broeks 15 , Senno Verhoef 16 , Sten Cornelissen 15 , Kenneth Muir 17 , Artitaya Lophatananon 17 , Sarah Stewart-Brown 17 , Pornthep Siriwanarangsan 18 , Peter A. Fasching 19, 20 , Christian R. Loehberg 20 , Arif B. Ekici 21 ,Matthias W. Beckmann 20 , Julian Peto 22 , Isabel dos Santos Silva 22 , Mikael Hartman 116 Soo Hwang Teo 86, 87 , Cheng Har Yip 87 , Char- Hong Ng 87 Open Archive Analysis of 4,405 variants in 89,050 European subjects from 41 case-control studies identified three independent association signals for estrogen-receptor-positive tumors at 11q13. The strongest signal maps to a transcriptional enhancer element in which the G allele of the best candidate causative variant rs554219 increases risk of breast cancer, reduces both binding of ELK4 transcription factor and luciferase activity in reporter assays, and may be associated with low cyclin D1 protein levels in tumors. Another candidate variant, rs78540526, lies in the same enhancer element. Risk association signal 2, rs75915166, creates a GATA3 binding site within a silencer element. Chromatin conformation studies demonstrate that these enhancer and silencer elements interact with each other and with their likely target gene, CCND1.

Welcome message from author
This document is posted to help you gain knowledge. Please leave a comment to let me know what you think about it! Share it to your friends and learn new things together.
Transcript

Volume 92, Issue 4, 4 April 2013, Pages 489–503
Article
Functional Variants at the 11q13 Risk Locus for Breast Cancer Regulate
Cyclin D1 Expression through Long-Range Enhancers
Juliet D. French1, 131, Maya Ghoussaini2, 131, Stacey L. Edwards1, 131, Kerstin B. Meyer3, 131, Kyriaki Michailidou4,
Shahana Ahmed2, Sofia Khan5, Mel J. Maranian2, Martin O’Reilly3, Kristine M. Hillman1,Joshua A.
Betts1, Thomas Carroll3, Peter J. Bailey1, Ed Dicks2, Jonathan Beesley6, Jonathan Tyrer2,Ana-Teresa
Maia3, Andrew Beck7, Nicholas W. Knoblauch7, Constance Chen8, Peter Kraft8, 9, Daniel Barnes4, Anna
González-Neira10, M. Rosario Alonso10, Daniel Herrero10, Daniel C. Tessier11, Daniel Vincent11, Francois
Bacot11, Craig Luccarini2, Caroline Baynes2, Don Conroy2, Joe Dennis4, Manjeet K. Bolla4, Qin
Wang4, John L. Hopper12, Melissa C. Southey13, Marjanka K. Schmidt14, 15, Annegien Broeks15, Senno
Verhoef16, Sten Cornelissen15, Kenneth Muir17, Artitaya Lophatananon17, Sarah Stewart-Brown17, Pornthep
Siriwanarangsan18, Peter A. Fasching19, 20, Christian R. Loehberg20, Arif B. Ekici21,Matthias W. Beckmann20,
Julian Peto22, Isabel dos Santos Silva22, Mikael Hartman116 Soo Hwang Teo86, 87, Cheng Har Yip87, Char-
Hong Ng87
Open Archive
Analysis of 4,405 variants in 89,050 European subjects from 41 case-control studies identified three
independent association signals for estrogen-receptor-positive tumors at 11q13. The strongest signal
maps to a transcriptional enhancer element in which the G allele of the best candidate causative variant
rs554219 increases risk of breast cancer, reduces both binding of ELK4 transcription factor and luciferase
activity in reporter assays, and may be associated with low cyclin D1 protein levels in tumors. Another
candidate variant, rs78540526, lies in the same enhancer element. Risk association signal 2,
rs75915166, creates a GATA3 binding site within a silencer element. Chromatin conformation studies
demonstrate that these enhancer and silencer elements interact with each other and with their likely
target gene, CCND1.

Introduction
One of the strongest breast cancer associations identified to date via genome-wide association studies
(GWASs) is with SNP rs614367 at the 11q13 locus (OR = 1.21; 95% CI 1.17–1.24; p = 10−39). This
association is restricted to estrogen-receptor-positive (ER+) tumors.1 and 2 SNP rs614367 maps to a 350 kb
intergenic region, with MYEOV1 3 (MIM 605625) being the nearest centromeric gene
and CCND1 (MIM168461), ORAOV1 (MIM 607224), and several genes of the fibroblast growth factor
family (FGF3 [MIM164950], FGF4 [MIM 164980], and FGF19 [MIM 603891]) all lying telomeric, any of
which are plausible candidate breast-cancer-susceptibility genes. Although this SNP lies in a gene desert,
chromatin modifications suggest that this region contains multiple regulatory elements. Of note, this
interval also contains risk SNPs for renal (MIM 144700) 3 and prostate (MIM 176807)
cancer. 4, 5, 6 and 7 Here we report the fine-scale mapping of this locus via 731 SNPs directly genotyped on
the custom-designed iCOGS (international Collaborative Oncology Gene-environment Study) Illumina
chip together with multiple analyses aimed at exploring the functions of the top independent signals of
association with breast cancer.
Material and Methods
Genetic Mapping
Tagging Strategy for Fine-Scale Mapping
In March 2010, when the iCOGS chip was designed, the 1000 Genomes Project (2012) had cataloged
10,358 variants at the 11q13 locus (positions 68,935,424–69,666,272; NCBI build 37 assembly), of which
2,259 had a minor allele frequency (MAF) >0.02. From these, we selected all SNPs having r2 > 0.10 with
the originally detected SNP, rs614367, plus a set of SNPs designed to tag all uncorrelated SNPs with r2 >
0.8. After completion of iCOGs genotyping, this initial set was supplemented with a further four SNPs,
selected from the October 2010 (Build 37) release of the 1000 Genomes Project, to improve coverage.
These were genotyped in two large BCAC (CCHS and SEARCH) studies comprising 12,273 cases and
controls, using a Fluidigm array according to manufacturer’s instructions. Using the above data, results for
all the additional known common variants on the January 2012 release of the 1000 Genomes Project
were imputed with IMPUTE version 2.0. Genotypes at 3,674 SNPs were reliably imputed (imputation
r2 score > 0.3) and were analyzed together with the 731 genotyped SNPs—giving a total of 4,405 SNPs
within the ∼730 kb LD region.
iCOGS Genotyping

Samples were drawn from 50 studies participating in the BCAC: 41 from populations of predominantly
European ancestry and 9 of Asian ancestry (unpublished data). Studies were required to provide ∼2% of
samples in duplicate. All BCAC studies had local human ethical approvals.8
Statistical Analysis
For each SNP, we estimated a per-allele log-odds ratio (OR) and standard error by logistic regression,
including study and principal components as covariates. Genotype data for all subjects of European
ancestry in the study were imputed with the IMPUTE V2.0 software with one phased (January 2012
version of 1000 Genomes project data) and one unphased (CCHS and SEARCH data that were
genotyped on the additional four SNPs) reference panel. Association analyses were based on imputed
SNPs with estimated MAF > 0 and imputation accuracy r2 > 0.3.
Conditional analyses were performed to identify SNPs independently associated with the phenotype in
question. To identify the most parsimonious model, all SNPs with a p value <0.0001 and MAF >0.02 in
the single SNP analysis were included in forward selection regression analyses with penalty k = 10 in the
step function in R. Haplotype-specific ORs were estimated by in-house methods based on the tagSNPs
program9and haplo-stats.10 Study and principal components were included as covariates. The contribution
of 11q13 variants to the familial risk of breast cancer was estimated with the formula log(λL)/log(λ0). Here λ
L is the familial relative risk to daughters of individuals with breast cancer explained by the locus under an
additive model, given by
Turn MathJaxon
where K is the number of alleles or haplotypes, pK is the frequency of the kth allele (haplotype), and ψK is
the per-allele (per-haplotype) relative risk. λ0 is the overall familial relative risk to degree relatives of
individuals with breast cancer, assumed to be 2. For ER-positive breast cancer, the same overall familial
relative risk (λ0 = 2) was assumed. p values for evaluation of differences in cyclin D1 protein levels by
SNP genotype were calculated with χ2 test or Fisher’s exact test by SPSS v18.0.2 (SPSS, Inc.).
CCND1 Protein and Gene Expression
Tissue microarrays (TMAs) were previously constructed on 1,348 invasive breast tumors from the HEBCS
study and processed as described,11 including four cores (diameter 0.6 mm) of the most representative
area from each formalin-fixed and paraffin-embedded breast cancer specimen. For cyclin D1 protein

levels, TMA slides were stained with cyclin D1 (Novocastra) antibodies (diluted 1:20). Cyclin D1-positive
cells were counted in one high-power field (objective 40×) in each of the four cores on TMA. Only
unequivocal positive nuclear staining was accepted as a positive reaction. A minimum of 200 breast
cancer cells was counted in each tumor. The result was the percentage of all positive cells from the entire
number of breast cancer cells counted from the four biopsies. Tumors with expression levels below
1% were considered as negative and above 1% as positive (Figure S1). In total, 644 individuals with
breast cancer had both TMA information and genotypic data (genotyped in iCOGS), and 512 of the breast
tumors were ER positive. The correlation of SNP rs554219 and cyclin D1 protein levels was examined in
the presence of SNP rs75915166 common homozygotes.
To perform eQTL analyses with data from breast cancer cases in The Cancer Genome Atlas Project, we
downloaded data from 382 TCGA breast cancer cases from the TCGA data portal. We obtained germline
SNP data by using the birdseed genotype calls from the Level 2 Affymetrix 6.0 arrays on peripheral blood.
We obtained the normalized log2 tumor gene expression profiling data from the level 2 Agilent microarray
data. Germline SNPs were imputed to the 1000 Genomes data set by PLINK. We assessed the
association of the germline risk alleles with tumor CCND1 expression in the 301 ER+ breast cancers.
Cell Lines
Breast cancer cell lines MDAMB415, CAL51, MCF7, MDAMB231, PMC42, and HCC1954 were grown in
DMEM medium with 10% FCS and antibiotics under standard conditions, while T47D was grown in RPMI
medium with the same supplements. Where relevant, cell lines were genotyped with fluorescent 5′
exonulease assay (TaqMan) and the ABI prism 7900 Sequence Detection System (PE Biosystems) in a
384-well format.
Chromatin Interaction Analysis by Paired-End Tag Sequencing Analysis
PETCluster data files representing two ChIA-PET libraries (IHM001F and IH015F) prepared with ER
antibodies in MCF7 cells were downloaded from the ChIA-PET Browser. Analysis of interactions within
the putative regulatory element 1 (PRE1; NCBI build 36 chr11: 69,036,648–69,042,291) was conducted in
R/Bioconductor. Closest neighbor genes were identified with the Bioconductor package ChiPpeakAnno.
Chromatin Conformation Capture
Chromatin conformation capture (3C) libraries were generated with HindIII and DpnII as described
previously.12 3C interactions were quantitated by real-time PCR with primers designed within the
restriction fragments of interest (Table S4). qPCR was performed on a RotorGene 6000 using MyTaq HS
DNA polymerase (Bioline) with the addition of 5 mM of Syto9, annealing temperature of 66°C, and
extension of 30 s. HindIII 3C analysis of MCF7 cells was performed in two independent experiments.
DpnII 3C analysis of MCF7 cells was performed in three independent experiments, and T47D,

MDAMB231, and CAL51 analysis was performed in two independent experiments. Each experiment was
quantified in triplicate. Two BAC clones (RP11-156B3 and RP11-378K8) covering
the 11q13/CCND1 region were used to create an artificial library of ligation products in order to normalize
for PCR efficiency. Data were normalized to the signal from the BAC clone library and, between cell lines,
by reference to a region within GAPDH. All qPCR products were electrophoresed on 2% agarose gels,
gel purified, and sequenced to verify the 3C product.
Plasmid Construction and Luciferase Assays
A CCND1 promoter-driven luciferase reporter construct was generated by inserting a 2,746 bp fragment
containing the CCND1 promoter into the KpnI and HindIII sites of pGL3-basic. To assist cloning, AgeI,
NheI, and SbfI sites were inserted into the BamHI and SalI sites downstream of luciferase. A 3,340 bp
fragment containing PRE1 was inserted into the AgeI and SbfI sites or a 955 bp fragment containing the
putative regulatory element 2 (PRE2) was inserted into the BamHI and SalI sites downstream of
luciferase. Individual SNPs were incorporated into PRE1 and PRE2 via overlap extension PCR. PRE2
was incorporated into PRE1 containing constructs by inserting PRE2 into NheI and SalI sites downstream
of PRE1. All constructs were sequenced to confirm variant incorporation (AGRF, Australia). Primers used
to generate all constructs are listed in Table S4.
MCF7, T47D, or CAL51 cells were transfected with equimolar amounts of luciferase reporter plasmids
and 50 ng of pRLTK with Lipofectamine 2000. The total amount of transfected DNA was kept constant
per experiment by adding carrier plasmid (pUC19). Luciferase activity was measured 24 hr
posttransfection by the Dual-Glo Luciferase Assay System on a Beckman-Coulter DTX-880 plate reader.
To correct for any differences in transfection efficiency or cell lysate preparation, Firefly luciferase activity
was normalized toRenilla luciferase. The activity of each test construct was calculated relative
to CCND1 promoter construct, the activity of which was arbitrarily defined as 1. For knockdown
experiments, MCF7 cells were cotransfected with the relevant luciferase reporter plasmids and either
100 nM of Dharmacon SMARTpool siRNA or shRNA plasmids with Lipofectamine 2000 (Invitrogen). 48 hr
after transfection, the luciferase activity was performed as described above.
siRNA Knockdown
ON-TARGETplus SMARTpool siRNAs for GABPA (MIM 600609; L-011662-00)
and GATA3 (MIM 131320; L-003781-00) and nontargeting siRNA (D-001810-10-20) were purchased from
Dharmacon (Thermo Scientific). Two ELK4 (MIM 600246) small hairpin shRNA constructs corresponding
to two independent shRNA sequences have been described previously. 13
Quantitative PCR

Total RNA was extracted with Trizol (Invitrogen) and reverse transcribed with random hexamers and
SuperScriptIII (Invitrogen) according to manufacturers’ instructions. qPCR was performed on a
RotorGene 6000 (Corbett Research) with TaqMan Gene Expression assays (Hs00360812_m1 for ELK4,
Hs00231122_m1 for GATA3, and Hs01022023_m1 for GABPA) and TaqMan Universal PCR master mix.
All reactions were normalized against β-glucuronidase (MIM 611499; Cat# 4326320E).
Electrophoretic Mobility Shift Assay
Small-scale nuclear extracts and bandshifts were carried out as previously described14 and
oligonucleotide sequences used in the assays are listed in Table S4. Antisera were obtained from Santa
Cruz Biotech: rabbit polyclonal antisera were used against USF1 (sc229x), USF2 (sc862x), SP1
(sc14027x), GABPA (sc228x), and ELK4 (sc13030x). GATA3 (sc268x) was detected with mouse
monoclonal antibodies. Competitor oligonucleotides were used at 10-, 30-, and 100-fold molar excess.
Chromatin Immunoprecipitation
Chromatin immunoprecipitation (ChIP) experiments were carried out as previously described.15 In brief,
cells were crosslinked in 1% formaldehyde for 10 min at room temperature before harvesting and
washing in PBS, 1× protease inhibitors (PI; Roche). Cells were lysed and washed to remove the
cytoplasm and the nuclei resuspended in LB3 (10 mM Tris-HCl [pH 8], 100 mM NaCl, 1 mM EDTA,
0.5 mM EGTA, 0.1% sodium-deoxycholate, 0.5 N-laurylsarcosine, 1× PI) and sonicated for 15 cycles
(30 s on, 30 s off, 4°C, high setting) on a Diagenode Biorupter. Lysates were cleared at 14,000 × g for
10 min and incubated with 10 μg of antibody and 10 μl of Protein-G beads (Dynal) for 12 to 18 hr at 4°C
(antibodies as for EMSA). Beads were washed in RIPA buffer and DNA isolated by standard methods
(QIAGEN). DNA was quantitated with Quant-IT and equal amounts of precipitate and input used in RT-
PCR reaction with primers given in Table S4. Allele-specific PCR was carried out with TaqMan
Genotyping Assays (predesigned assays, ABI). All values obtained are normalized to input and
enrichment is given relative to the negative CCND1 control. 16 Each ChIP has yielded similar results in at
least two independent experiments. The error bars denote the standard deviation in three technical
repeats.
In Silico Analysis of GATA3 Binding
To examine the potential of GATA3 to bind rs75915166, we calculated the enrichment of the 6 bp motif
overlapping the core of the position weight matrix (PWM) of the GATA3 motif around this SNP in the
75 bp either side of all GATA3 ChIP-seq peaks,17 compared to random genomic sequences of the same
length. Furthermore, to examine the differential enrichment underneath GATA peaks for the motif
containing the A allele over the T allele, the relative enrichment between proportions of peaks containing
these motifs was compared to relative enrichments observed within 100,000 sets of random intergenic

sequences. Enrichment of the motif containing the A allele compared to T under GATA peaks was
compared to the bootstrapped distribution of relative enrichments within random genomic regions yielding
a p value of 0.0147.
Results
Case-Control Studies
The original GWAS-associated SNP, rs614367, tags a linkage disequilibrium (LD) block of 683 kb
spanning chromosome 11 positions 68,935,424–69,666,272 (NCBI build 37 assembly), as defined by the
furthest telomeric and centromeric SNPs displaying detectable correlation (r2 > 0.10) with rs614367. With
data from the 1000 Genomes Project, we cataloged 10,358 variants in the region and selected a subset
of these to cover the entire region (see Material and Methods). Of these, 731 SNPs were successfully
designed and genotyped on the iCOGS chip in 41 case-control studies from populations of European
ancestry (89,050 subjects) and 12,893 subjects from 9 case-control studies of Asian ancestry within
BCAC (Supplemental Data). Genotypes of all other known variants in the locus were imputed in the
European studies by using known genotypes in combination with data from the 1000 Genomes Project.
3,674 SNPs were reliably imputed (imputation r2 score > 0.3) and were considered for further analysis
together with the 731 genotyped SNPs.
Based on data from all European studies, 204 genotyped or imputed SNPs were convincingly associated
with overall risk of breast cancer (p values 10−5 to 10−64, Table S1). Stratification by tumor ER status
confirmed that all associations were with ER+ disease with no significant evidence for any SNPs
associated with ER− tumors (Table S1). Thus, all further analyses were confined to risks of ER+ disease. A
Manhattan plot of all considered SNPs at this locus (Figure 1A) demonstrates a complex pattern of
association.

Figure 1.
Genetic Mapping and Epigenetic Landscape at the 11q13 Locus
(A) Manhattan plot of the 11q13 susceptibility locus for breast cancer. Genotyped and imputed SNPs are plotted
based on their chromosomal position on the x axis and their overall p values (log10 values) from the European
BCAC studies on the y axis. The six genes present in the region are indicated in black.
(B) Epigenetic and transcriptional landscape at the 11q13 risk locus for breast cancer in human mammary
epithelial cells (HMECs). Green and red histograms denote ChIP-seq data from HMECs (ENCODE) and MCF7
cells stimulated with estrogen (GEO #GSM594606); blue denotes a heat map of ERα ChIA-PET data from MCF7s
treated with estradiol.16 Red bars denote cohesin (ArrayExpress; #E-TABM-828), ERα (GEO #GSM365926), and
FoxA118 ChIP-seq data from MCF7 cells. Abbreviations are as follows: PRE1, putative regulatory element 1 that
contains SNPs 1–4; PRE2, putative regulatory element 2 that contains SNP5. Below depicts the pattern of linkage
disequilibrium with data from the BCAC population, where white represents r2 = 0 and black r2 = 1. Red stars
denote the positions of SNPs 1–4 in the linkage block.
Figure options
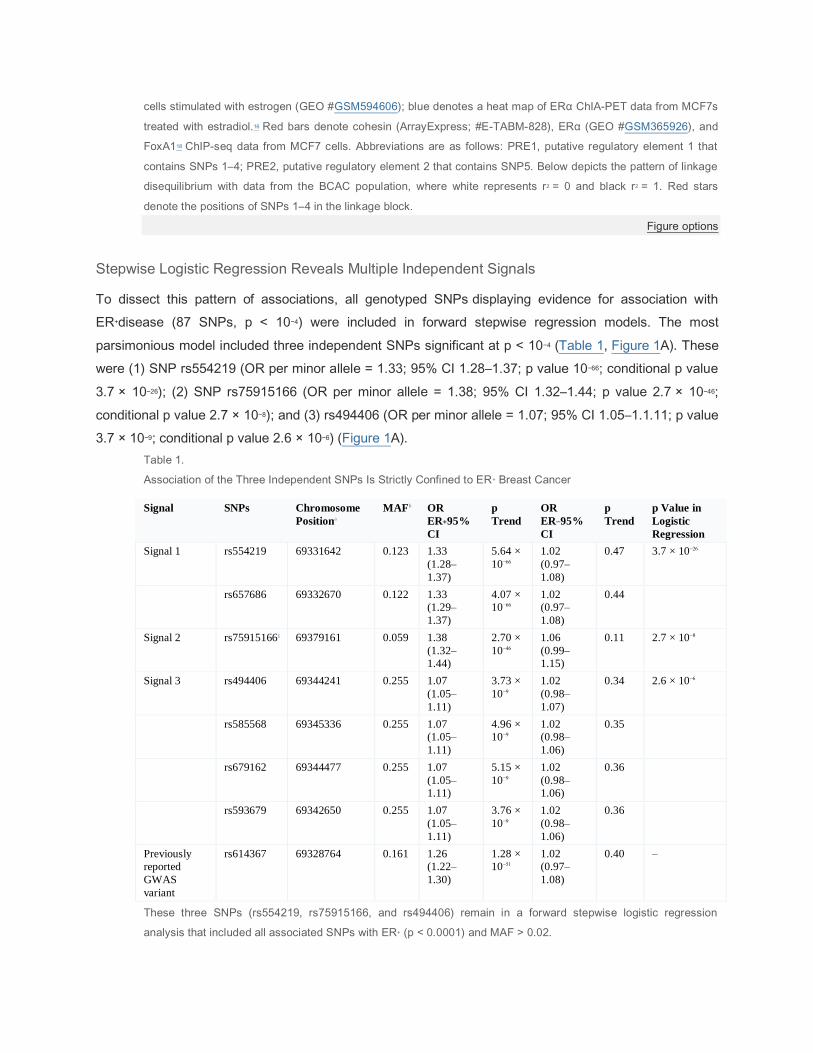
Stepwise Logistic Regression Reveals Multiple Independent Signals
To dissect this pattern of associations, all genotyped SNPs displaying evidence for association with
ER+disease (87 SNPs, p < 10−4) were included in forward stepwise regression models. The most
parsimonious model included three independent SNPs significant at p < 10−4 (Table 1, Figure 1A). These
were (1) SNP rs554219 (OR per minor allele = 1.33; 95% CI 1.28–1.37; p value 10−66; conditional p value
3.7 × 10⁻²⁶); (2) SNP rs75915166 (OR per minor allele = 1.38; 95% CI 1.32–1.44; p value 2.7 × 10−46;
conditional p value 2.7 × 10⁻⁸); and (3) rs494406 (OR per minor allele = 1.07; 95% CI 1.05–1.1.11; p value
3.7 × 10⁻⁹; conditional p value 2.6 × 10⁻⁶) (Figure 1A).
Table 1.
Association of the Three Independent SNPs Is Strictly Confined to ER+ Breast Cancer
Signal SNPs Chromosome
Positiona
MAFb OR
ER+95%
CI
p
Trend
OR
ER−95%
CI
p
Trend
p Value in
Logistic
Regression
Signal 1 rs554219 69331642 0.123 1.33
(1.28–
1.37)
5.64 ×
10−66
1.02
(0.97–
1.08)
0.47 3.7 × 10⁻²⁶
rs657686 69332670 0.122 1.33
(1.29–
1.37)
4.07 ×
10−66
1.02
(0.97–
1.08)
0.44
Signal 2 rs75915166c 69379161 0.059 1.38
(1.32–
1.44)
2.70 ×
10−46
1.06
(0.99–
1.15)
0.11 2.7 × 10⁻⁸
Signal 3 rs494406 69344241 0.255 1.07
(1.05–
1.11)
3.73 ×
10−9
1.02
(0.98–
1.07)
0.34 2.6 × 10⁻⁶
rs585568 69345336 0.255 1.07
(1.05–
1.11)
4.96 ×
10−9
1.02
(0.98–
1.06)
0.35
rs679162 69344477 0.255 1.07
(1.05–
1.11)
5.15 ×
10−9
1.02
(0.98–
1.06)
0.36
rs593679 69342650 0.255 1.07
(1.05–
1.11)
3.76 ×
10−9
1.02
(0.98–
1.06)
0.36
Previously
reported
GWAS
variant
rs614367 69328764 0.161 1.26
(1.22–
1.30)
1.28 ×
10−51
1.02
(0.97–
1.08)
0.40 –
These three SNPs (rs554219, rs75915166, and rs494406) remain in a forward stepwise logistic regression
analysis that included all associated SNPs with ER+ (p < 0.0001) and MAF > 0.02.

a
Build 37.
b
MAF in controls.
c
Also named pos69088342 in build 36.
Table options
Variants for subsequent functional analysis were selected, on the basis of the above analysis of
genotyped SNPs, according to the following criteria: assuming a single causative variant for each of the
independent signals, we calculated the likelihood ratio of each SNP relative to best independent signal
with which it was correlated. SNPs with a likelihood of <1:100 compared with the most significant SNP for
each signal were excluded from consideration as being potentially causative. For signal 1, four SNPs
clustered in a 20 kb region (position: 69,320,000–69,340,000 build 37) remained after this exclusion
process: rs661204 (SNP1), rs78540526 (SNP2), rs554219 (SNP3), and rs657686 (SNP4). For signal 2,
only SNP rs75915166 (SNP5) remains; all other SNPs correlated with this one had much less significant
effects. Of note rs75915166 is partially correlated with the signal 1 SNPs (r2 with rs554219 = 0.61) but
conditional analysis indicates it is clearly independent (p value 5 × 10⁻⁸ after conditioning on rs554219).
For signal 3, four SNPs (rs494406, rs585568, rs593679, rs679162) remain as potentially causal, but
these are associated with much smaller effect sizes (Table 1). Further investigations were thus focused
on the five SNPs (SNP1–SNP5; listed above) for which there was strongest evidence for likely causation.
When the stepwise regression was repeated, after imputation of all SNPs in the locus to the January
2012 release of the 1000 Genomes data, the most parsimonious model included (1) SNP rs78540526
(SNP2; conditional p value 4 × 10⁻¹⁰); (2) SNP rs554219 (SNP3; conditional p value 9 × 10⁻⁸); and (3) a
newly discovered variant at chromosome 11: SNP rs12575120 (conditional p value 3 × 10⁻⁶). No overall
evidence of heterogeneity was observed for the genotyped SNPs, which we selected for functional
analysis, among the European or Asian studies (p > 0.08) (Figure S2). The minor allele frequencies
(MAFs) of these SNPs are much rarer in Asian populations than in Europeans (rs554219 and rs657686,
MAF = 0.017; rs75915166 and rs661204, MAF < 0.01) although SNP rs78540526 appeared to be
monomorphic in Asians (Table S3). Despite this, the SNPs with detectable minor alleles in Asians have
risk estimates for ER+ tumors consistent with those in Europeans (rs554219 [SNP3]: OR = 1.64; 95% CI
1.27–2.11; p value = 1.3 × 10⁻⁴; rs657686 [SNP4]: OR = 1.61; 95% CI 1.25–2.07; p value = 2.2 × 10⁻⁴;
rs75915166 [SNP5], OR = 1.42, p value = 3.6 × 10⁻²). These significant associations, despite the rarity of
the minor alleles in Asian populations, provide further support that these SNPs may have directly
causative effects.
Three Distinct Haplotypes Confer Increased Risks with Different Magnitudes
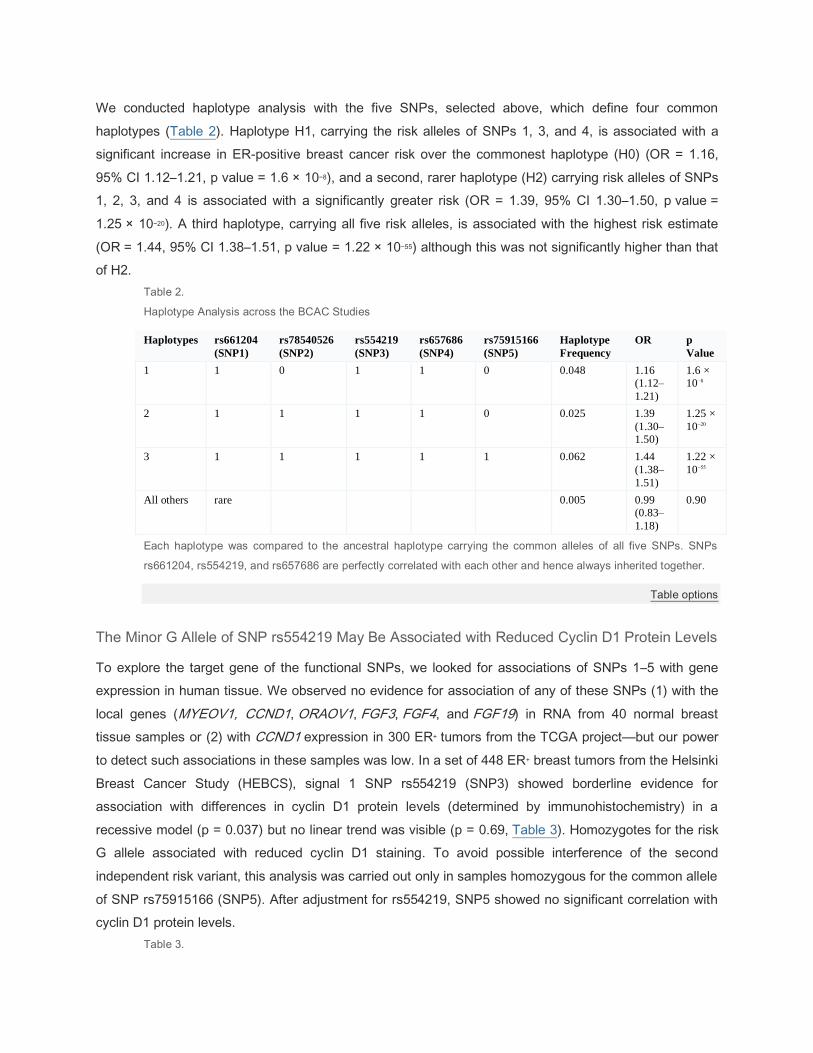
We conducted haplotype analysis with the five SNPs, selected above, which define four common
haplotypes (Table 2). Haplotype H1, carrying the risk alleles of SNPs 1, 3, and 4, is associated with a
significant increase in ER-positive breast cancer risk over the commonest haplotype (H0) (OR = 1.16,
95% CI 1.12–1.21, p value = 1.6 × 10⁻⁸), and a second, rarer haplotype (H2) carrying risk alleles of SNPs
1, 2, 3, and 4 is associated with a significantly greater risk (OR = 1.39, 95% CI 1.30–1.50, p value =
1.25 × 10⁻²⁰). A third haplotype, carrying all five risk alleles, is associated with the highest risk estimate
(OR = 1.44, 95% CI 1.38–1.51, p value = 1.22 × 10−55) although this was not significantly higher than that
of H2.
Table 2.
Haplotype Analysis across the BCAC Studies
Haplotypes rs661204
(SNP1)
rs78540526
(SNP2)
rs554219
(SNP3)
rs657686
(SNP4)
rs75915166
(SNP5)
Haplotype
Frequency
OR p
Value
1 1 0 1 1 0 0.048 1.16
(1.12–
1.21)
1.6 ×
10−8
2 1 1 1 1 0 0.025 1.39
(1.30–
1.50)
1.25 ×
10−20
3 1 1 1 1 1 0.062 1.44
(1.38–
1.51)
1.22 ×
10−55
All others rare 0.005 0.99
(0.83–
1.18)
0.90
Each haplotype was compared to the ancestral haplotype carrying the common alleles of all five SNPs. SNPs
rs661204, rs554219, and rs657686 are perfectly correlated with each other and hence always inherited together.
Table options
The Minor G Allele of SNP rs554219 May Be Associated with Reduced Cyclin D1 Protein Levels
To explore the target gene of the functional SNPs, we looked for associations of SNPs 1–5 with gene
expression in human tissue. We observed no evidence for association of any of these SNPs (1) with the
local genes (MYEOV1, CCND1, ORAOV1, FGF3, FGF4, and FGF19) in RNA from 40 normal breast
tissue samples or (2) with CCND1 expression in 300 ER+ tumors from the TCGA project—but our power
to detect such associations in these samples was low. In a set of 448 ER+ breast tumors from the Helsinki
Breast Cancer Study (HEBCS), signal 1 SNP rs554219 (SNP3) showed borderline evidence for
association with differences in cyclin D1 protein levels (determined by immunohistochemistry) in a
recessive model (p = 0.037) but no linear trend was visible (p = 0.69, Table 3). Homozygotes for the risk
G allele associated with reduced cyclin D1 staining. To avoid possible interference of the second
independent risk variant, this analysis was carried out only in samples homozygous for the common allele
of SNP rs75915166 (SNP5). After adjustment for rs554219, SNP5 showed no significant correlation with
cyclin D1 protein levels.
Table 3.
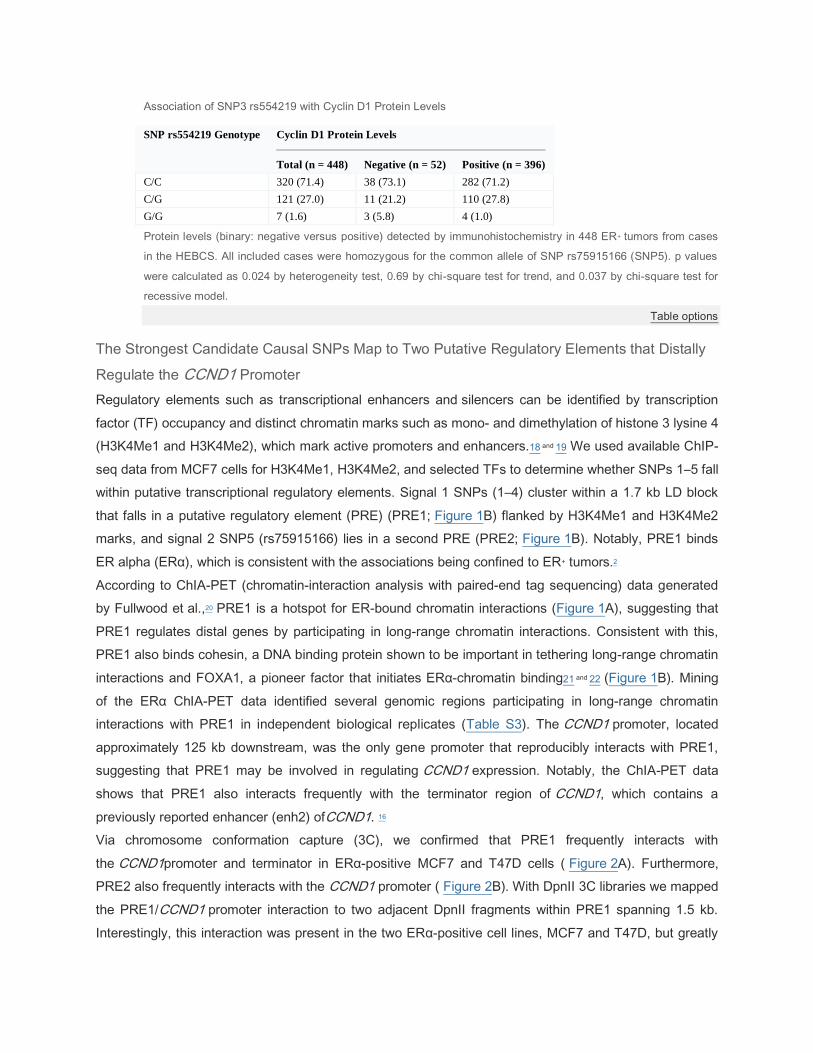
Association of SNP3 rs554219 with Cyclin D1 Protein Levels
SNP rs554219 Genotype Cyclin D1 Protein Levels
Total (n = 448) Negative (n = 52) Positive (n = 396)
C/C 320 (71.4) 38 (73.1) 282 (71.2)
C/G 121 (27.0) 11 (21.2) 110 (27.8)
G/G 7 (1.6) 3 (5.8) 4 (1.0)
Protein levels (binary: negative versus positive) detected by immunohistochemistry in 448 ER+ tumors from cases
in the HEBCS. All included cases were homozygous for the common allele of SNP rs75915166 (SNP5). p values
were calculated as 0.024 by heterogeneity test, 0.69 by chi-square test for trend, and 0.037 by chi-square test for
recessive model.
Table options
The Strongest Candidate Causal SNPs Map to Two Putative Regulatory Elements that Distally
Regulate the CCND1 Promoter
Regulatory elements such as transcriptional enhancers and silencers can be identified by transcription
factor (TF) occupancy and distinct chromatin marks such as mono- and dimethylation of histone 3 lysine 4
(H3K4Me1 and H3K4Me2), which mark active promoters and enhancers.18 and 19 We used available ChIP-
seq data from MCF7 cells for H3K4Me1, H3K4Me2, and selected TFs to determine whether SNPs 1–5 fall
within putative transcriptional regulatory elements. Signal 1 SNPs (1–4) cluster within a 1.7 kb LD block
that falls in a putative regulatory element (PRE) (PRE1; Figure 1B) flanked by H3K4Me1 and H3K4Me2
marks, and signal 2 SNP5 (rs75915166) lies in a second PRE (PRE2; Figure 1B). Notably, PRE1 binds
ER alpha (ERα), which is consistent with the associations being confined to ER+ tumors.2
According to ChIA-PET (chromatin-interaction analysis with paired-end tag sequencing) data generated
by Fullwood et al.,20 PRE1 is a hotspot for ER-bound chromatin interactions (Figure 1A), suggesting that
PRE1 regulates distal genes by participating in long-range chromatin interactions. Consistent with this,
PRE1 also binds cohesin, a DNA binding protein shown to be important in tethering long-range chromatin
interactions and FOXA1, a pioneer factor that initiates ERα-chromatin binding21 and 22 (Figure 1B). Mining
of the ERα ChIA-PET data identified several genomic regions participating in long-range chromatin
interactions with PRE1 in independent biological replicates (Table S3). The CCND1 promoter, located
approximately 125 kb downstream, was the only gene promoter that reproducibly interacts with PRE1,
suggesting that PRE1 may be involved in regulating CCND1 expression. Notably, the ChIA-PET data
shows that PRE1 also interacts frequently with the terminator region of CCND1, which contains a
previously reported enhancer (enh2) ofCCND1. 16
Via chromosome conformation capture (3C), we confirmed that PRE1 frequently interacts with
the CCND1promoter and terminator in ERα-positive MCF7 and T47D cells ( Figure 2A). Furthermore,
PRE2 also frequently interacts with the CCND1 promoter ( Figure 2B). With DpnII 3C libraries we mapped
the PRE1/CCND1 promoter interaction to two adjacent DpnII fragments within PRE1 spanning 1.5 kb.
Interestingly, this interaction was present in the two ERα-positive cell lines, MCF7 and T47D, but greatly

reduced in ERα-negative CAL51 and MDAMB231 cell lines ( Figure 2C). Of note, SNP rs661204 (SNP1)
lies within the restriction fragment shown to be involved in tethering the interaction. However, allele-
specific 3C on MDAMB415 cells, a cell line heterozygous for this SNP, revealed that this SNP had no
significant effect on chromatin looping ( Figure S3). Mapping of the PRE2/CCND1 promoter interaction,
with the same DpnII 3C libraries, showed that PRE2 frequently interacts with the CCND1 promoter in
MCF7, T47D, and MDAMB231 cells but not in CAL51 cells ( Figure 2C), suggesting that this interaction
can occur in a cell-specific manner independent of ERα. We also detected long-range chromatin
interactions between PRE1 and PRE2 in MCF7 and T47D cells, suggesting that these two regulatory
elements may cooperate to regulate CCND1expression ( Figure 2A).
Figure 2.
Long-Range Chromatin Interactions of the 11q13 Risk Regions with CCND1 in Breast Cancer Cell Lines
(A and B) 3C interaction profiles between PRE1 and/or PRE2, the CCND1 promoter (P), and terminator (T)
regions. 3C libraries were generated with HindIII, with the anchor points set at either PRE1 (A) or PRE2 (B). Grey
bars depict the position of the target sites and matches them to the cartoons above each panel.
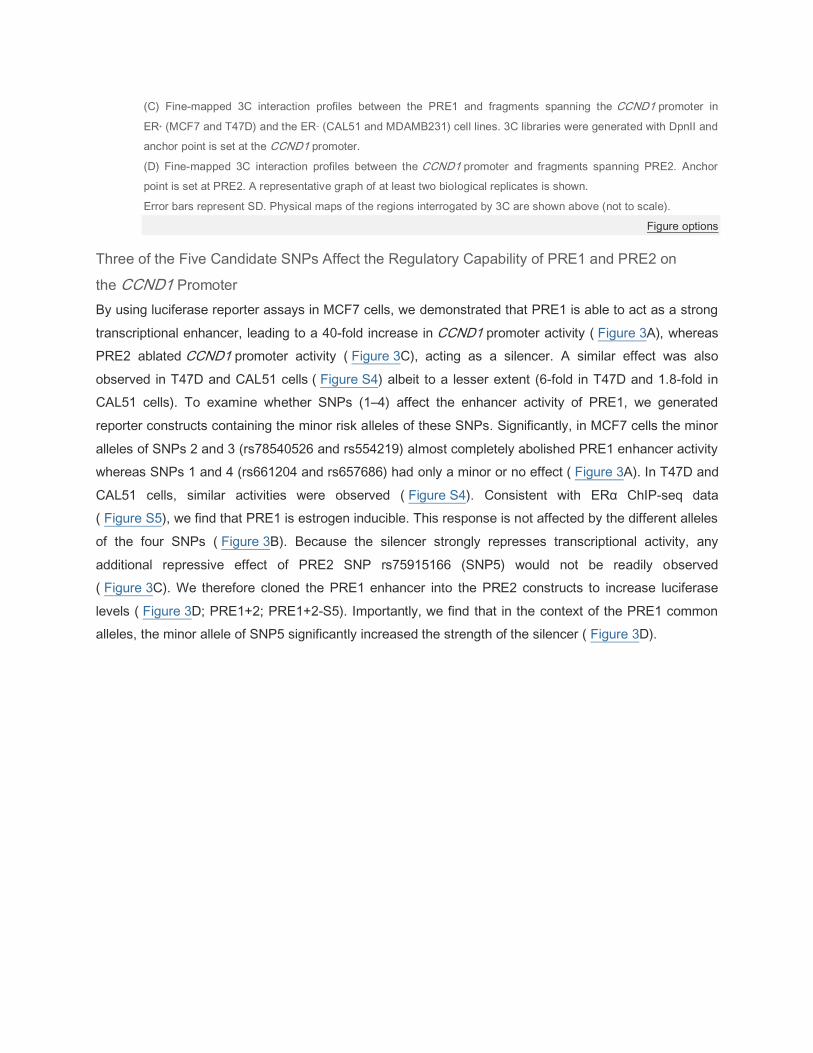
(C) Fine-mapped 3C interaction profiles between the PRE1 and fragments spanning the CCND1 promoter in
ER+ (MCF7 and T47D) and the ER− (CAL51 and MDAMB231) cell lines. 3C libraries were generated with DpnII and
anchor point is set at the CCND1 promoter.
(D) Fine-mapped 3C interaction profiles between the CCND1 promoter and fragments spanning PRE2. Anchor
point is set at PRE2. A representative graph of at least two biological replicates is shown.
Error bars represent SD. Physical maps of the regions interrogated by 3C are shown above (not to scale).
Figure options
Three of the Five Candidate SNPs Affect the Regulatory Capability of PRE1 and PRE2 on
the CCND1 Promoter
By using luciferase reporter assays in MCF7 cells, we demonstrated that PRE1 is able to act as a strong
transcriptional enhancer, leading to a 40-fold increase in CCND1 promoter activity ( Figure 3A), whereas
PRE2 ablated CCND1 promoter activity ( Figure 3C), acting as a silencer. A similar effect was also
observed in T47D and CAL51 cells ( Figure S4) albeit to a lesser extent (6-fold in T47D and 1.8-fold in
CAL51 cells). To examine whether SNPs (1–4) affect the enhancer activity of PRE1, we generated
reporter constructs containing the minor risk alleles of these SNPs. Significantly, in MCF7 cells the minor
alleles of SNPs 2 and 3 (rs78540526 and rs554219) almost completely abolished PRE1 enhancer activity
whereas SNPs 1 and 4 (rs661204 and rs657686) had only a minor or no effect ( Figure 3A). In T47D and
CAL51 cells, similar activities were observed ( Figure S4). Consistent with ERα ChIP-seq data
( Figure S5), we find that PRE1 is estrogen inducible. This response is not affected by the different alleles
of the four SNPs ( Figure 3B). Because the silencer strongly represses transcriptional activity, any
additional repressive effect of PRE2 SNP rs75915166 (SNP5) would not be readily observed
( Figure 3C). We therefore cloned the PRE1 enhancer into the PRE2 constructs to increase luciferase
levels ( Figure 3D; PRE1+2; PRE1+2-S5). Importantly, we find that in the context of the PRE1 common
alleles, the minor allele of SNP5 significantly increased the strength of the silencer ( Figure 3D).
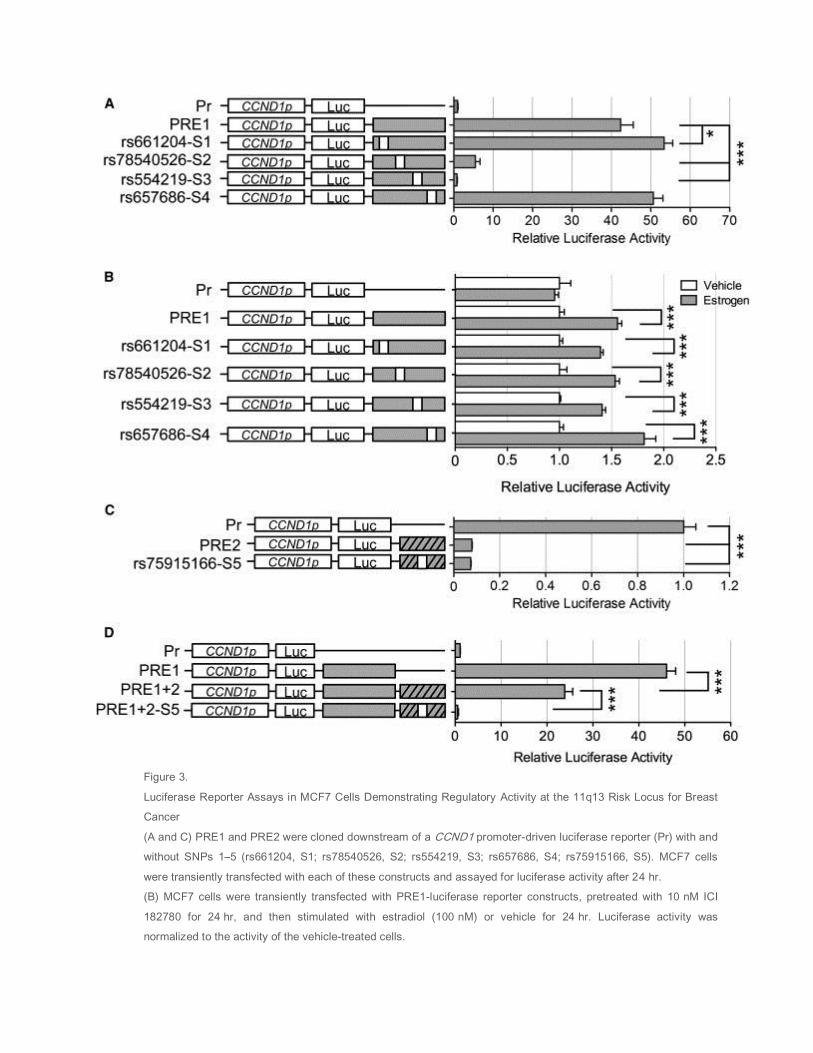
Figure 3.
Luciferase Reporter Assays in MCF7 Cells Demonstrating Regulatory Activity at the 11q13 Risk Locus for Breast
Cancer
(A and C) PRE1 and PRE2 were cloned downstream of a CCND1 promoter-driven luciferase reporter (Pr) with and
without SNPs 1–5 (rs661204, S1; rs78540526, S2; rs554219, S3; rs657686, S4; rs75915166, S5). MCF7 cells
were transiently transfected with each of these constructs and assayed for luciferase activity after 24 hr.
(B) MCF7 cells were transiently transfected with PRE1-luciferase reporter constructs, pretreated with 10 nM ICI
182780 for 24 hr, and then stimulated with estradiol (100 nM) or vehicle for 24 hr. Luciferase activity was
normalized to the activity of the vehicle-treated cells.

(D) PRE1 luciferase constructs were generated containing PRE2 with and without SNP5 (PRE1+2; PRE1+2-S5).
MCF7 cells were transiently transfected with each of these constructs and assayed for luciferase activity after
24 hr. Representative graphs are shown from at least two independent experiments.
Error bars denote SD from one experiment performed in triplicate. p values were determined with a two-tailed t
test. ∗p < 0.05, ∗∗∗p < 0.001.
Figure options
ELK4 and GATA3 Mediate the Effects of PRE1 SNP rs554219 and PRE2 SNP rs75915166,
Respectively
We used electrophoretic mobility shift assays (EMSA) to examine protein-DNA interaction for SNPs 1–5.
All five SNPs displayed TF binding that was allele specific in four cases (Figures 4 and S6A). Competition
with known TF binding sites suggested the identity of each of the bound proteins (data not shown), which
was confirmed in supershift experiments (Figure 4). Inclusion of antisera in the binding reaction
established that the common alleles of SNPs 1 and 2 (rs661204, rs78540526) preferentially bind USF1
and USF2. The common allele of SNP3 (rs554219) is bound by ELK4 and GABPA, whereas the minor
allele of SNP5 (rs75915166) interacts specifically with GATA3. A high-mobility complex bound by the
oligonucleotide containing SNP5 is independent of allelic status and therefore unlikely to be relevant to
cancer risk (Figure S6B). To assess occupancy of the different SNPs in vivo, allele-specific ChIP were
carried out by TaqMan assays. Little or no enrichment was detected for USF1 or USF2 on SNPs 1 and 2
and no allelic discrimination was observed (Figure S7). However, in an ELK4 ChIP assay for SNP3
(rs554219), which mediates one of the strongest effects in the transcriptional assays, the common allele
(C) shows a 7.7-fold enrichment over a negative control and a 7.1-fold enrichment over the risk allele,
indicating that this site is occupied in an allele-specific manner in vivo (Figures 5A and S8). GABPA,
which binds the C allele of this site in EMSAs, does not bind this site in vivo as shown by ChIP assays
(only 2.5-fold enrichment versus 160-fold enrichment of a positive control; Figure S9). The importance of
ELK4 binding was confirmed in cotransfection assays that show that two independent siRNAs against
ELK4 reduce enhancer activity of wild-type enhancer, but not of the enhancer containing the rare allele of
SNP3 (rs554219; Figure 5B), further strengthening the conclusion that ELK4 is an important mediator of
enhancer function.

Figure 4.
Allele-Specific In Vitro Protein-DNA Interactions Detected by EMSA
Nuclear extracts from MCF7 cells were incubated with radioactively labeled oligonucleotides overlapping the SNP
shown at the top of each panel. The effect of the minor (m) and the common alleles are compared as indicated. 4
and 10 μg of antisera were included in the reaction as listed above each lane in panels 1 and 2, and 4 μg were
used in all other reactions. Bands containing antibody-protein-DNA complexes are highlighted by open arrows.
Figure options
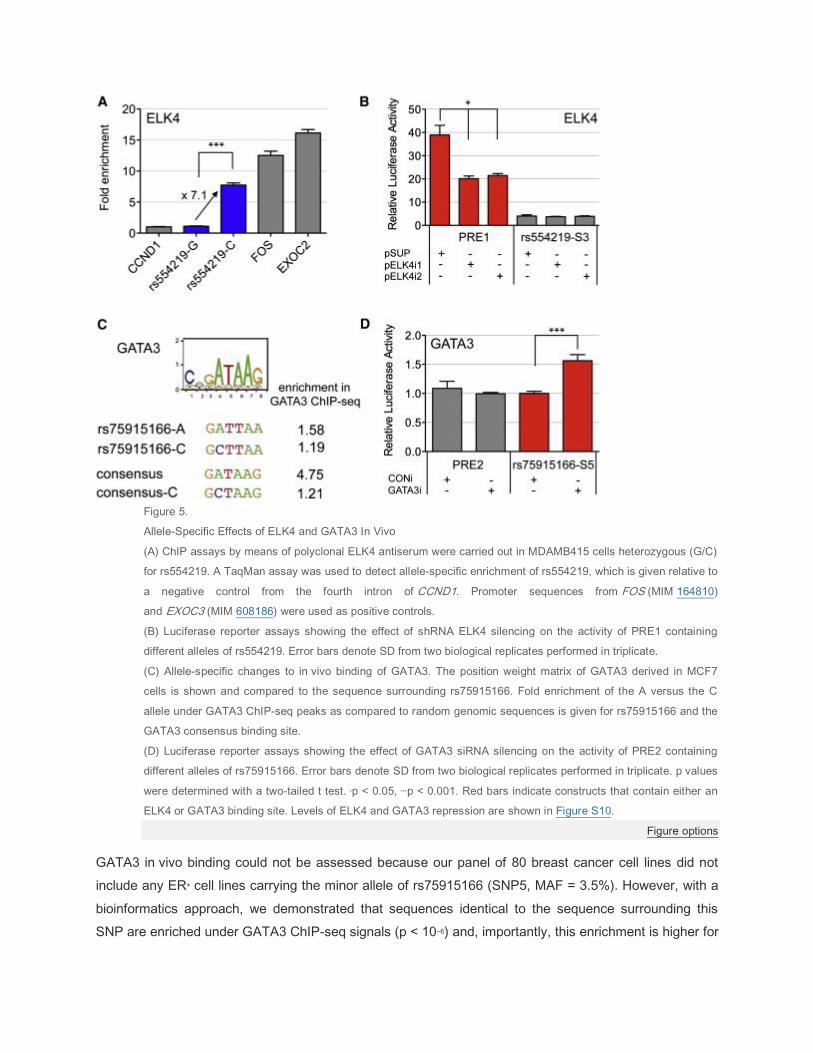
Figure 5.
Allele-Specific Effects of ELK4 and GATA3 In Vivo
(A) ChIP assays by means of polyclonal ELK4 antiserum were carried out in MDAMB415 cells heterozygous (G/C)
for rs554219. A TaqMan assay was used to detect allele-specific enrichment of rs554219, which is given relative to
a negative control from the fourth intron of CCND1. Promoter sequences from FOS (MIM 164810)
and EXOC3 (MIM 608186) were used as positive controls.
(B) Luciferase reporter assays showing the effect of shRNA ELK4 silencing on the activity of PRE1 containing
different alleles of rs554219. Error bars denote SD from two biological replicates performed in triplicate.
(C) Allele-specific changes to in vivo binding of GATA3. The position weight matrix of GATA3 derived in MCF7
cells is shown and compared to the sequence surrounding rs75915166. Fold enrichment of the A versus the C
allele under GATA3 ChIP-seq peaks as compared to random genomic sequences is given for rs75915166 and the
GATA3 consensus binding site.
(D) Luciferase reporter assays showing the effect of GATA3 siRNA silencing on the activity of PRE2 containing
different alleles of rs75915166. Error bars denote SD from two biological replicates performed in triplicate. p values
were determined with a two-tailed t test. ∗p < 0.05, ∗∗∗p < 0.001. Red bars indicate constructs that contain either an
ELK4 or GATA3 binding site. Levels of ELK4 and GATA3 repression are shown in Figure S10.
Figure options
GATA3 in vivo binding could not be assessed because our panel of 80 breast cancer cell lines did not
include any ER+ cell lines carrying the minor allele of rs75915166 (SNP5, MAF = 3.5%). However, with a
bioinformatics approach, we demonstrated that sequences identical to the sequence surrounding this
SNP are enriched under GATA3 ChIP-seq signals (p < 10−6) and, importantly, this enrichment is higher for

the risk A allele than the common C allele (p = 0.015) (Figure 5C), suggesting that our in vitro binding
results (Figure 4) are replicated in vivo. Consistent with this, we find that the introduction of the
nonbinding C allele into the core consensus motif strongly reduces motif enrichment. We again confirmed
the functional importance of GATA3 by using RNAi in luciferase cotransfection assays: a smart pool of
siRNA againstGATA3 increases transcription in the presence of the minor allele, which binds GATA3
( Figure 4) but has no effect on the common allele ( Figure 5D). Thus, we conclude that in this context
GATA3 acts as a repressor of transcription and that the risk alleles of both PRE1 SNP rs554219 (SNP3)
and PRE2 SNP rs75915166 (SNP5) reduce transcriptional activation.
Discussion
Our fine-scale mapping of this 11q13 locus has identified three independent association signals, each
with different effect sizes. We have been able to examine, in detail, the ones with the strongest effects.
The hits are correlated with the originally detected GWAS tag SNP (rs614367; r2 = 0.87 with rs554219
[SNP3], r2 = 0.31 with rs78540526 [SNP2], and r2 = 0.57 with rs75915166 [SNP5]). These strong
candidates for being causative variants are more strongly associated with breast cancer than rs614367
(Table 1). In fact, the effect sizes of these newly recognized 11q13 SNPs are now larger than the effects
of the best GWAS-discovered breast cancer locus, FGFR2 (MIM 176943; OR overall breast cancer per
minor allele = 1.31; 95% CI 1.26–1.36; p value = 2.93 × 10−44 for 11q13 rs75915166 versus 1.27; 95% CI
1.24–1.29; p value 10−129 forFGFR2 rs2981579). Thus, by fine-scale mapping, we have also detected a
little more of the “missing heritability” of breast cancer. On the basis of the estimates from this iCOGs
study, the original GWAS tag SNP, rs614367, explains approximately 0.76% of the familial risk of overall
breast cancer, whereas the combined effects of SNPs rs78540526 (SNP2), rs554219 (SNP3), and
rs75915156 (SNP5) explain approximately 2.0% in Europeans.
Despite its clear value in this study, mapping by genetic epidemiological techniques alone, even in this
very large BCAC consortium, was unable to differentiate three of the four candidates in signal 1 (SNPs 1,
3, and 4), which are very highly correlated in Europeans and rare in Asians, though we were able to
demonstrate an independent effect for SNP2 (rs78540526). Of note, SNPs 3 and 4 (rs554219 and
rs657686) are almost perfectly correlated (r2 = 0.998) across all participating samples in the BCAC
consortium. For signal 2, fine-scale mapping was more successful, because no other SNPs were strongly
correlated with rs75915166 (SNP5). Our combined evidence suggests that SNP rs75915166 is
functionally related to risk. However, it is important to bear in mind that when we selected mapping SNPs
to go onto the iCOGs chip (in March 2010), the catalog of all common variants in the locus was not
complete. Since then, reinterrogation of the 1000 Genomes data set and imputation of missing SNPs,
with the most recent (January 2012) version, has indicated a new candidate (at chromosome 11 SNP
rs12575120). It remains possible that other candidate causal variants may have been missed. It is worth
noting, however, that the existence of three haplotypes associated with different risks makes it extremely
unlikely (even in the absence of functional evidence) that the associations could be driven by rare
variants missed by sequencing, because this would require at least two rare variants on different
haplotypes conferring implausibly large effects.
We used functional studies to further examine the five best candidates. We have demonstrated that SNPs
1–4 all map to a putative CCND1 enhancer (PRE1) and that the most plausible causal variant, SNP
rs554219 (SNP3), alters binding of the ELK4 TF both in vitro and in vivo. The protective C allele of
rs554219 preferably binds ELK4 and absence of binding at the minor allele strongly reduces enhancer
activity in luciferase assays. This effect can be mimicked by transfection of ELK4 siRNA. Furthermore,
presence of the risk allele correlates with reduced cyclin D1 protein levels. Evidence for a functional role
for SNP rs78540526 (SNP2) is also strong: it is present on both haplotypes associated with greatest
breast cancer risk, as well as significantly reducing enhancer activity in luciferase assays and also
displaying allele-specific binding by TFs USF1 and USF2 in in vitro, but not in vivo, studies. Finally, we
demonstrate that the effects of SNP rs75915166 (SNP5) are likely to be mediated via differential binding
of TF GATA3 to this SNP position. SNP rs75915166 lies within a silencer element able to physically
interact with the PRE1 enhancer containing SNPs 1–4. It has not yet been possible in this study to
investigate the functions of the other potential risk variants. However, bioinformatic analysis suggests that
the T allele of SNP rs494406 may form a GATA1 binding site and SNP rs585568 falls in a USF ChIP-seq
peak, with the minor allele forming a MYC-MAX TF binding site. An understanding of the relevance of
these will require even larger association studies and then further functional analyses.
Our data implicate ELK4 and GATA3 as mediators of risk for ER+ disease, which is consistent with
previous reports of the functions of these TFs. Expression of ELK4 is sensitive to ER inhibitors23 and
ChIP-seq data reveal a strong ER binding site upstream of the ELK4 promoter. GATA3 has long been
established as a critical regulator of mammary gland development and luminal epithelial
differentiation, 24 and 25 and loss of GATA3 is associated with marked progression to early carcinoma. 26 At
the molecular level, GATA3 influences ERα binding by modulating chromatin structure and long-range
looping 17 and, along with FOXA1 and ERα, is a critical component of a cooperative network of
transcriptional master regulators, 16, 24 and 27which are sufficient to confer estrogen responsiveness to ER-
negative cell lines. 28 A GATA3 link with ER+breast cancer is further supported by the finding that tumors
carrying GATA3 mutations are all of a luminal subtype. 29 and 30
Our findings support a hypothesis that CCND1 is the target gene of these candidate causative SNPs—
demonstrated by the strong physical interactions between the PREs at this locus and CCND1 and by the
fact that the risk alleles act by reducing the transcriptional activation of CCND1. In luciferase assays, the
functional risk SNPs examined act to reduce transcriptional activity. These conclusions may be supported
by our observation of reduced cyclin D1 protein levels in tumors homozygote for the G allele of rs554219,
but we failed to detect similar associations in RNA expression data. Our power to detect any such
association was limited—we estimate that the 300 TCGA tumors analyzed provided 70% power to detect
a 10% difference in expression associated with this risk allele (MAF = 0.12). However, it is also possible

that any effect of this SNP on expression levels is not apparent in breast tumor cells. There is precedent
for this in that the confirmed multicancer risk SNPs at 8q24 (upstream of MYC) 31 have consistently failed
to show any associations with gene expression in human cell types but have been confirmed as
functionally important in this respect when analyzed in transgenic mouse models. 32
Cyclin D1 is traditionally considered to be an oncogene, based on its overexpression in tumors, its well-
established role in cell cycle control, and its ability to promote cell migration and
differentiation.33 and 34Consequently, germline variants that repress this gene are somewhat at odds with
the accepted dogma of cancer-susceptibility genes. Resolution of this apparent conflict may, however,
come from the complexity of cyclin D1 function, the heterogeneity of cyclin D1 protein levels in human
tumors, and the fact that the moderate risk we describe is likely to work in concert with a number of other
coinherited variants that may facilitate some lesser known activities of this protein.
In terms of function, repression of cyclin D1 has been reported to induce cell migration of breast cancer
cell lines and be associated with the epithelial-mesenchymal transition (EMT).35 Cyclin D1 also interacts
with a range of TFs, including steroid hormone receptors36 and 37 and chromatin-modifying
enzymes,37 and 38 and is able to participate in a broad range of other functions. A recent study provides
evidence that cyclin D1 promotes homologous recombination-mediated DNA repair (HRR) by recruiting
RAD51 to double-strand breaks, a role that is independent of its control of the cell cycle.39 Notably,
depletion of CCND1 levels impairs HRR and increases sensitivity of cells to DNA-damaging agents such
as ionizing radiation in vitro and in vivo. 39 It is thus conceivable that, in a similar way to BRCA1 and
BRCA2 that also function in HRR, reduced cyclin D1 levels may lead to more error-prone repair
mechanisms, potentially promoting genome instability and cancer predisposition.
Many of these roles are in fact more in-line with a tumor suppressor, suggesting that cyclin D1 can
operate both as an oncogene and a tumor suppressor depending on the context, with the latter being
particularly relevant in the case of germline events resulting in loss of cyclin D1. There are certainly
precedents for this:RET (MIM 164761), for example, acts as an oncogene in the thyroid gland and a
tumor-suppressor gene in the colon. 40 Consistent with this, Lehn and colleagues have reported an
association between downregulation of cyclin D1 and unfavorable prognosis in human breast
cancer. 41 We therefore propose that germline events leading to a reduction of cyclin D1, such as
described in the manuscript, contribute to breast tumorigenesis.
Although our data indicate that CCND1 is the target gene, we cannot rule out the possibility that these
SNPs also exert functional effects through long-range control of other nearby genes: MYEOV, ORAOV1,
or FGF3,FGF4, or FGF19, all of which are plausible candidates for breast cancer
susceptibility. MYEOV is very frequently coamplified with CCND1 in ER+ breast cancer 42 and cyclin D1
protein levels are reduced in HeLa cells in which ORAOV1 proto-oncogene levels have been knocked
down to induce apoptosis; 43FGF3,FGF4, and FGF19 belong to the Fibroblast Growth Factor family, which
plays a key role in tumor pathogenesis via their receptors—including FGFR2, the strongest common
breast cancer susceptibility locus reported to date. 44, 45 and 46

This 11q13 genomic interval also contains GWAS hits for renal cancer and functional studies there
indicate that a candidate causal variant affects the activity of an enhancer element probably also
driving CCND1transcription. 47 This region may thus share similarities with the 8q24 interval, where a
large “gene desert” contains multiple tissue-specific enhancers in which risk-associated SNPs affect the
transcription of downstream oncogene(s) and predispose to cancer in a tissue-specific manner. 47 The
variants described here predispose only to ER+ disease and we find that the identified molecular
mechanisms underlying this risk are fully consistent with this observation: long-range physical interactions
between the enhancer and theCCND1 promoter are found only in ER+ cells and GATA3, which binds
PRE1 SNP3 (rs554219), is coregulated with the ER and is part of the network of transcriptional master
regulators able to establish estrogen responsiveness. 28, 29 and 48
In conclusion we have identified three SNPs as being very strong candidates for having a directly
causative effect on breast cancer risk at this locus and we have provided evidence that these act by
controlling CCND1expression—a gene that is a potential target for drug intervention.
Related Documents