Volume 05 – Issue 09, (September 2015)

Welcome message from author
This document is posted to help you gain knowledge. Please leave a comment to let me know what you think about it! Share it to your friends and learn new things together.
Transcript


Editor-In-Chief
Prof. Chetan Sharma Specialization: Electronics Engineering, India
Qualification: Ph.d, Nanotechnology, IIT Delhi, India
Editorial Committees
DR.Qais Faryadi
Qualification: PhD Computer Science
Affiliation: USIM(Islamic Science University of Malaysia)
Dr. Lingyan Cao
Qualification: Ph.D. Applied Mathematics in Finance
Affiliation: University of Maryland College Park,MD, US
Dr. A.V.L.N.S.H. HARIHARAN
Qualification: Phd Chemistry
Affiliation: GITAM UNIVERSITY, VISAKHAPATNAM, India
DR. MD. MUSTAFIZUR RAHMAN
Qualification: Phd Mechanical and Materials Engineering
Affiliation: University Kebangsaan Malaysia (UKM)
Dr. S. Morteza Bayareh
Qualificatio: Phd Mechanical Engineering, IUT
Affiliation: Islamic Azad University, Lamerd Branch
Daneshjoo Square, Lamerd, Fars, Iran
Dr. Zahéra Mekkioui
Qualification: Phd Electronics
Affiliation: University of Tlemcen, Algeria
Dr. Yilun Shang
Qualification: Postdoctoral Fellow Computer Science
Affiliation: University of Texas at San Antonio, TX 78249
Lugen M.Zake Sheet
Qualification: Phd, Department of Mathematics
Affiliation: University of Mosul, Iraq
Mohamed Abdellatif
Qualification: PhD Intelligence Technology
Affiliation: Graduate School of Natural Science and Technology

Meisam Mahdavi
Qualification: Phd Electrical and Computer Engineering
Affiliation: University of Tehran, North Kargar st. (across the ninth lane), Tehran, Iran
Dr. Ahmed Nabih Zaki Rashed
Qualification: Ph. D Electronic Engineering
Affiliation: Menoufia University, Egypt
Dr. José M. Merigó Lindahl
Qualification: Phd Business Administration
Affiliation: Department of Business Administration, University of Barcelona, Spain
Dr. Mohamed Shokry Nayle
Qualification: Phd, Engineering
Affiliation: faculty of engineering Tanta University Egypt

Contents:
S.No. Title Name Page No.
Version I
1. Prevention of SQL injection in E- Commerce Sanchit Narang || Shivam Sharma || Rajendra Prasad Mahapatra
01-04
2.
Stabilization of Marine Clays with Geotextile Reinforced Stone Columns Using Silica-Manganese Slag as a Stone Column Material S. Siva Gowri Prasad || Y.Harish || P.V.V.Satyanarayana
05-12
3. Implementing Visible Light Communication in Intelligent Traffic Management to resolve Traffic Logjams
Pritpal Singh || Gagandeep Singh || Ashmeet Singh
13-17
4. Quantum Anharmonic Oscillator, A Computational Approach Shreti Garg || Sarmistha Sahu
18-20
5. Fourier and Periodogram Transform Temperature Analysis in Soil Afolabi O.M
21-26
6. Design and Analysis of Micro Steam Turbine Using Catia and Ansys S . Upendar || K Hari brahmaiah || N. Vijaya Rami Reddy || B.Rakesh
27-30
7. MECHANICAL CHARACTERIZATION OF BIO-FIBRE AND GLASS FIBRE REINFORCED POLYESTER COMPOSITE LAMINATE JOINTS S.Rameshkumar
31-39

ISSN (e): 2250 – 3005 || Volume, 05 || Issue, 09 ||September – 2015 ||
International Journal of Computational Engineering Research (IJCER)
www.ijceronline.com Open Access Journal Page 1
Prevention of SQL injection in E- Commerce
Sanchit Narang1, Shivam Sharma
2, Rajendra Prasad Mahapatra
3
1,3 Computer Science & Engineering Department, 2 IT Department. SRM University ,NCR Campus,
Modi Nagar , (UP) India.
I. Introduction
In recent years, inclusion of internet in almost every type of business transaction resulted into rapid
advancement in the dependency towards information technologies. The information technology used by the
general masses for the reasons such as commercial transactions, educational transactions and other countless
activities related to finance. The use of the internet to accomplish important odd jobs, such as transactions of
balance from bank accounts, always remains under security threat. Present web sites legging behind to keep
their users data confidential till years of doing secure business online and due to which these industries have
become experts in intelligence information security. The data management systems besides these secure
websites collect non-potent data along with secure information, in this way, the potent information owner‟s
quick access while jamming break-in attempts from intruders. The most common break-in strategy is to try to
access sensitive information from a data storage by generating a query that cause the data parser to malfunction
and thereby applying this query to the desired database. This above said approach to gaining un ethical access to
private information is called SQL injection.
Since databases are anonymous and can be accessed from the internet, combating with SQL injection has
emerges as more important than ever. The current database management system comprises with little
vulnerability, the Computer Security Institutions have discovered that every year about half of the databases
experience at least one security breaching attempt and the revenue losses associated with such attempts has been
estimated more than $4,000,000.00.
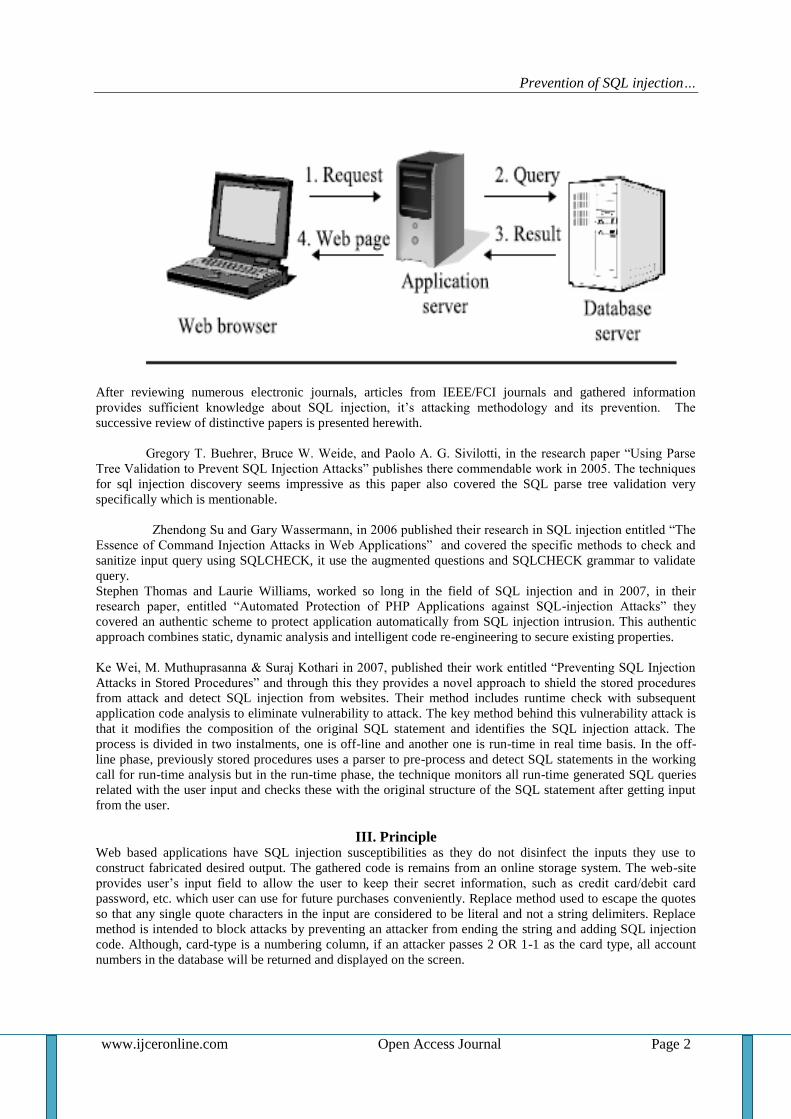
II. Literature Review Moreover, recent researches published by the “Imperva Application Defense Center” propounded that minimum
92% of website data and applications are prone to malicious attacks (M. Muthuprasanna & Kothari, 2007). To
enhance understanding of SQL injection, it is better to have good understanding of the kinds of communications
that take place during a typical session between a user and a web based application. The figure below describes
the typical communication exchange in between all the composites in a typical web application systems.
ABSTRACT Structured Query Language (SQL) injection, in present scenario, emerges as one of the most
challenging fact to effect on the online business, as it can expose all of the business transaction
related sensitive information which is stored in online database, inclusive of most highly secured
sensitive information such as credit card passwords , usernames, login ids, credentials, phone, email
id etc. Structured Query Language injection remain a responsibility that when intruder gets the
ability with SQL related queries which is passed to a back-end database. The query which is passed
by the intruder to the data, can allow the query to data which is an assisting element with database
and required operating system. Every SQL Query that allows the inputs from the attacker sides can
defect our real web application. Intruder which attempts to insert defective SQL query into an entry
field to extract the query so that they can dump the database or alter the database which is known as
“code injection technique” and this type of attacker is also called attack vector for websites and
usually used by any type of SQL database. Through this research paper, our endeavour is to
understand the methodology of SQL injection and also to propose solution to prevent SQL Injection
in one of the most vulnerable field of E commerce.
Keywords: Business, database, effect, Intruder, injection, query, solution, etc
Prevention of SQL injection…
www.ijceronline.com Open Access Journal Page 2
After reviewing numerous electronic journals, articles from IEEE/FCI journals and gathered information
provides sufficient knowledge about SQL injection, it‟s attacking methodology and its prevention. The
successive review of distinctive papers is presented herewith.
Gregory T. Buehrer, Bruce W. Weide, and Paolo A. G. Sivilotti, in the research paper “Using Parse
Tree Validation to Prevent SQL Injection Attacks” publishes there commendable work in 2005. The techniques
for sql injection discovery seems impressive as this paper also covered the SQL parse tree validation very
specifically which is mentionable.
Zhendong Su and Gary Wassermann, in 2006 published their research in SQL injection entitled “The
Essence of Command Injection Attacks in Web Applications” and covered the specific methods to check and
sanitize input query using SQLCHECK, it use the augmented questions and SQLCHECK grammar to validate
query.
Stephen Thomas and Laurie Williams, worked so long in the field of SQL injection and in 2007, in their
research paper, entitled “Automated Protection of PHP Applications against SQL-injection Attacks” they
covered an authentic scheme to protect application automatically from SQL injection intrusion. This authentic
approach combines static, dynamic analysis and intelligent code re-engineering to secure existing properties.
Ke Wei, M. Muthuprasanna & Suraj Kothari in 2007, published their work entitled “Preventing SQL Injection
Attacks in Stored Procedures” and through this they provides a novel approach to shield the stored procedures
from attack and detect SQL injection from websites. Their method includes runtime check with subsequent
application code analysis to eliminate vulnerability to attack. The key method behind this vulnerability attack is
that it modifies the composition of the original SQL statement and identifies the SQL injection attack. The
process is divided in two instalments, one is off-line and another one is run-time in real time basis. In the off-
line phase, previously stored procedures uses a parser to pre-process and detect SQL statements in the working
call for run-time analysis but in the run-time phase, the technique monitors all run-time generated SQL queries
related with the user input and checks these with the original structure of the SQL statement after getting input
from the user.
III. Principle Web based applications have SQL injection susceptibilities as they do not disinfect the inputs they use to
construct fabricated desired output. The gathered code is remains from an online storage system. The web-site
provides user‟s input field to allow the user to keep their secret information, such as credit card/debit card
password, etc. which user can use for future purchases conveniently. Replace method used to escape the quotes
so that any single quote characters in the input are considered to be literal and not a string delimiters. Replace
method is intended to block attacks by preventing an attacker from ending the string and adding SQL injection
code. Although, card-type is a numbering column, if an attacker passes 2 OR 1-1 as the card type, all account
numbers in the database will be returned and displayed on the screen.

Prevention of SQL injection…
www.ijceronline.com Open Access Journal Page 3
Fig: System composition of SQLCHECK
IV. Methodology: SQL injection is widely used hacking technique, in which the intruder adds SQL statements using a web
application as input fields to access to the secret users resources and due to lack of input Validation in web
applications causes intruders to be successful in hacking.
With above said technique, we can assume that a Web application receives a “http//” request from a user client
as Input and generates a SQL statement as output for the back-End database server. For example an
administrator will be authenticated after providing input as -
Typing: employee id - 0112
and password =admin, configure
That describes a login by a suspecious user exploiting sql Injection vulnerability .
Usually, it is structured in three phases,
(1) An Intruder sends the malicious “http//” request to the Web application,
(2). Generates the sql statement,
(3). Dedicatedly Deposited the sql statement to the back end database.
Fig: Example methodology of SQL Injection.
Prevention of SQL injection…
www.ijceronline.com Open Access Journal Page 4
As per the principle, they track through the program and the substrings received from user input and filters that
substrings immediately. The endeavour behind these program remains blocking the malicious queries in which
the incoming substrings changes the syntactic morphology of the rest of the queries. They use the metadata to
analyse user‟s input which displayed as ( „_‟ ) and ( „_,‟ ) to mark the ending and beginning of the each user
incoming string. This said metadata passes the incoming string through an assignments, and concatenations, so
that when a query is ready to be sent to the database, it has a matching pairs of markers that identify the
substring from the input. These annotated queries called an augmented query. To construct a parser for the
augmented grammar and attempt to parse each augmented query Steve use a parse generator. Query meets the
syntactic constraints and considered legitimate if it passes successfully. Else, it fails the syntactic constraints and
interprets it as an SQL injection attack.
As per the system architecture of the checking system shows in Figure above, the Grammar of the outgoing
data language is used to build SQLCHECK and a policy mentioned permitted syntactic forms, it resides on the
web server and taps generated queries. In spite of the input‟s source, each input which is to be passed into some
query, gets augmented with the meta-characters („_‟) and („_,‟).
Finally application creates augmented queries, which SQLCHEKCK attempts to parse, and if a query parses
successfully, SQLCHECK sends it the meta-data to the database, else the query get rejected.
.
V. Observation Moreover, developers deploy defensive coding but they are not enough to stop SQL injections to web
applications, that is why researchers have proposed some of tools to assist developers to prevent there. It is
mentionable that there are more approaches which have not implemented a tool yet. In this paper, we emphasize
more on tools and less on techniques. Huang and colleagues propose WAVES, a black box technique for testing
web applications for SQL injection vulnerabilities. The tool identify all points a web application that can be
used to inject SQLIAs. It builds attacks that target these points and monitors the application how response to the
attacks by utilize machine learning.
VI. Conclusion SQL injection intrusions remain a serious problem for developers as they can be used to break into supposedly
secure systems and copy, alter, or destroy data. It becomes very easy to leave yourself vulnerable to these
attacks, regarding of which version of .NET. In fact, you don't even need to be using .NET to be susceptible to
SQL injection attacks. Any further implecations that queries a database using user- entered data set, including
Windows Forms applications is a potential target of an injection attack.
Protecting user against SQL injection attacks is less difficult. Uses which are immune to SQL injection attacks
validate and sanitize all user input, never use dynamic SQL injection, perform using an account with few
privileges, hash or encrypt their secrets, and present error messages that reveal little if no useful information to
the hacker. By following a multi-layered approach to prevention you can be assured that if one defence is
circumvented, you will still be protected. For information on testing your application for injection
vulnerabilities, see the sidebar "Injection Testing".
References [1] W Ke Wei, M. Muthuprasanna, Suraj Kothari , Dept. of Electrical and Computer Engineering , Iowa State University Ames, IA –
50011 ,Email: {weike,muthu,kothari}@iastate.edu
[2] http://www.appsecinc.com/presentations/Manipulating SQL Server Using SQL Injection.pdf, White Paper. [3] William G.J. Halfond, Jeremy Viegas, and Alessandro Orso College of Computing Georgia Institute of Technology
{whalfond|jeremyv|orso}@cc.gatech.edu
[4] Z. Su and G. Wassermann. The Essence of Command Injection Attacks in Web Applications. In The 33rd Annual Symposium on Principles of Programming Languages (POPL 2006), Jan. 2006.
[5] F. Valeur, D. Mutz, and G. Vigna. A Learning-Based Approach to the Detection of SQL Attacks. In Proceedings of the
Conference on Detection of Intrusions and Malware and Vulnerability Assessment (DIMVA), Vienna, Austria, July 2005.
ISSN (e): 2250 – 3005 || Volume, 05 || Issue, 09 ||September – 2015 ||
International Journal of Computational Engineering Research (IJCER)
www.ijceronline.com Open Access Journal Page 5
Stabilization of Marine Clays with Geotextile Reinforced Stone
Columns Using Silica-Manganese Slag as a Stone Column
Material
S. Siva Gowri Prasad1, Y.Harish
2, P.V.V.Satyanarayana
3
1 Assistant Professor, Department of Civil Engineering, GMR Institute of technology, AP, India. 2 M.Tech student, Department of Civil Engineering, GMR Institute of technology, AP, India.
3 Professor, Department of Civil Engineering Andhra University, Visakha Patnam, AP, India.
I. Introduction
Vast areas covered with thick layers of fills or with layers of soft clay deposits are not suitable for the
construction of a foundation. Due to increase of population in urban areas there is a need to improve the
infrastructural facilities such as buildings, roads, tunnels, bridges etc. With the increasing size of urban areas
and industrial zones, it is necessary to consider the possibilities of foundations on these areas. Construction of
highway embankments using conventional design methods such as preloading, dredging and soil displacement
techniques can often no longer be used due to environmental restrictions and post-construction maintenance
expenses. Among all these methods, the stone column technique is preferred because they provide the primary
aspect of reinforcement and thus improve the strength and reduces the deformation. Stone columns are nothing
but vertical columnar elements formed by replacement of 10 to 35 percent of weak soil with coarse granular
material, such as stone, sand and stone chips- sand mixture. These load bearing piles usually penetrate through
the soft ground/weak strata and resting on firm/stiff strata called end bearing stone columns. Sometimes these
are penetrating partially in to medium stiff soil and not resting on firm strata are known as floating stone
columns. Apparently, the concept was first applied in France in 1830 to improve a native soil.
When the stone columns are installed in very soft clays, they may not give significant load carrying
capacity to low lateral confinement. In order to improve the performance of stone columns when treating weak
deposits, it is imperative that the tendency of the column to bulge should be reduced effectively. The existing
popular method to overcome this situation is by encasing the stone columns with suitable geo-synthetic (Geo-
synthetic encased stone columns) to impart the necessary confinement to improve their strength and stiffness.
Alternatively, the stone columns are reinforced internally by stabilization of column material using concrete
plugs, chemical grouting or by adding internal inclusions (geogrids, plastic fibers etc), which will stiffen the
column and accordingly increase the load carrying capacity of column.
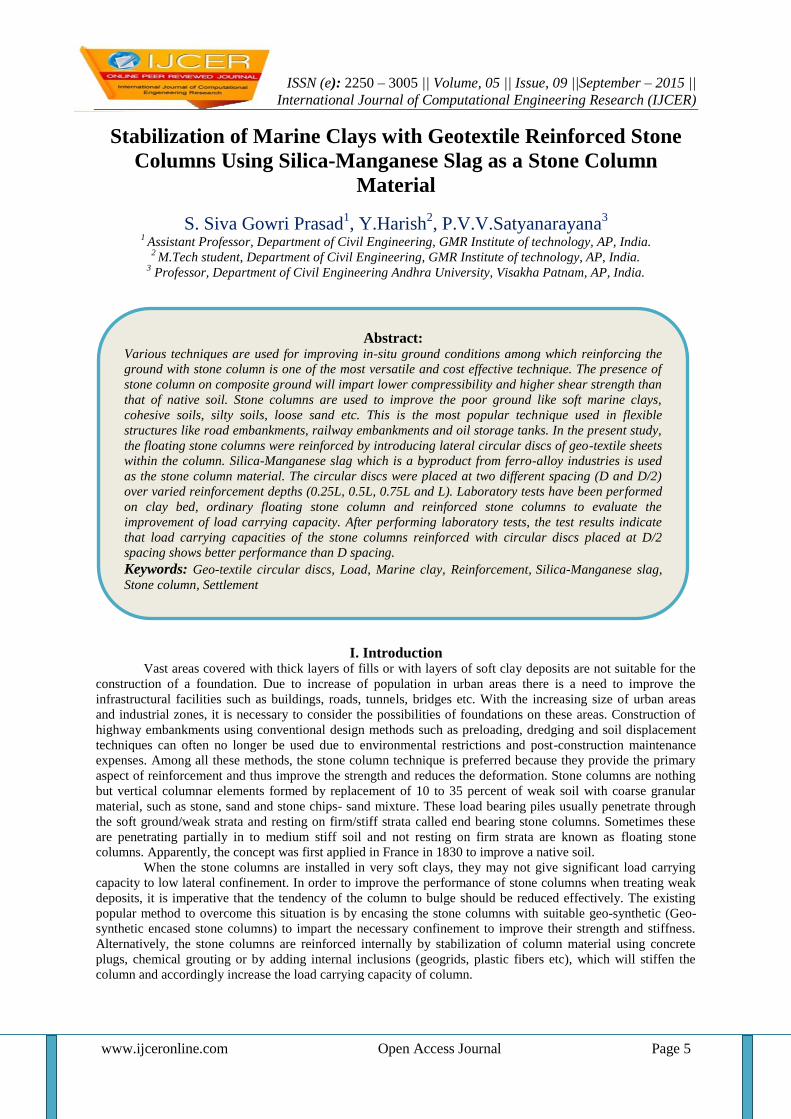
Abstract: Various techniques are used for improving in-situ ground conditions among which reinforcing the
ground with stone column is one of the most versatile and cost effective technique. The presence of
stone column on composite ground will impart lower compressibility and higher shear strength than
that of native soil. Stone columns are used to improve the poor ground like soft marine clays,
cohesive soils, silty soils, loose sand etc. This is the most popular technique used in flexible
structures like road embankments, railway embankments and oil storage tanks. In the present study,
the floating stone columns were reinforced by introducing lateral circular discs of geo-textile sheets
within the column. Silica-Manganese slag which is a byproduct from ferro-alloy industries is used
as the stone column material. The circular discs were placed at two different spacing (D and D/2)
over varied reinforcement depths (0.25L, 0.5L, 0.75L and L). Laboratory tests have been performed
on clay bed, ordinary floating stone column and reinforced stone columns to evaluate the
improvement of load carrying capacity. After performing laboratory tests, the test results indicate
that load carrying capacities of the stone columns reinforced with circular discs placed at D/2
spacing shows better performance than D spacing.
Keywords: Geo-textile circular discs, Load, Marine clay, Reinforcement, Silica-Manganese slag,
Stone column, Settlement

Stabilization Of Marine Clays With Geotextile Reinforced…
www.ijceronline.com Open Access Journal Page 6
A. Zahmatkesh et al. [1] investigated the performance of stone columns in soft clay. Bora [2] et al.
studied the behavior of clay bed reinforced with floating stone columns to understand the load deformation
behavior. R. Gandhi et al.[3] in their experimental study, studied the behavior of single column and group of
seven columns by varying parameters like spacing between the columns, shear strength of soft clay and loading
condition. Malarvizhi S. N et al. [4] studied load versus settlement response of the stone column and geogrid-
encased stone column. M.R. Dheerendra et al. [5] studied a new method of improving the performance of stone
columns reinforced with vertical nails driven along the circumference. K.Balan et al. [6] investigated the effect
of natural geo-textile reinforcement in load carrying capacity of quarry waste column. Kausar ali et al.[7]
studied the behavior of stone columns with and without geo-synthetics to find out the effect of reinforcement
and l/d ratio on the bearing capacity of the composite soil. K.G Sharma et al. [8] in their experimental study
studied the behavior of stone columns with and without reinforcements to evaluate relative improvement in the
failure stress of the composite ground due to different configurations of the reinforcement. Kumar Rakesh et al.
[9] studied soft ground improvement with fiber reinforced granular pile. J. A. Black et al. [10] evaluated the
effects of reinforcing stone columns by jacketing with a tubular wire mesh and bridging reinforcement with a
metal rod and a concrete plug. Ruben Aza-Gnandji et al. [11] investigated the behavior of single rammed stone
columns. K.V.S.B. Raju et al. [12] investigated that the behavior of stone columns subjected to cyclic loading to
improve the characteristics of black cotton soil. It is also seen that the load carrying capacity of the stone
column depends on the fill material. The inclusion of stone as fill material proves to be better than using sand
and gravel when considering load carrying capacity and drainage (Girish M.S et al. [13]). Though the Silica-
Manganese slag is a waste material, it can be used as a column fill material. In the present study, the placing of
geo-textile circular discs within the stone columns in lateral direction is investigated through laboratory strain
controlled load test. The effect of the parameters such as, the depth of geo-textile reinforcement from ground
level, spacing of geo-textiles reinforcement were analyzed.
II. Materials The materials used in this study are Marine clay, Silica-Manganese slag, Geo-textile circular discs,
Sand. The source and the properties of these materials are described below.
Marine clay is collected from Visakhapatnam port trust at EQ-3 berth near Gnanapuram road area. The
soil is highly compressible inorganic clay. Silica-Manganese slag is used as a stone material in this study.
Table.1 shows the index and engineering properties of marine clay. Marine clay is shown in Figure.1 (a).
Table 1. Index and engineering properties of marine clay
The Silica-Manganese slag produced during the primary stage of steel production is referred to as
submerge arc furnace. This slag is obtained from smelting process in ferro-alloy industry. This slag is collected
from Sri Mahalaxmi Smelters (Pvt.) Limited near Garbam (vill), Garividi, Vijayanagaram (Dt) and the
aggregates of sizes between 4.75 mm and 10 mm have been taken for the present study. Major constituents of
Silica-Manganese slag are SiO2 and CaO for about 24% and 45% respectively. Table.2 shows the physical
properties of Silica- Manganese slag. Silica-Manganese slag is shown in Figure.1 (b).
Table 2. Physical Properties of Silica-Manganese slag
Properties Values
Specific Gravity (Gs) 2.79
Water absorption 0.69%
Unit weight 1.88g/cm3
Properties
Values
Liquid limit (%) 72.9
Plastic limit (%) 25.6
Plasticity Index 47.2
Specific Gravity 2.48
Optimum Moisture Content (%) 26.4
Maximum Dry Density (kN/m3) 14.6
Classification (IS : 1498-1972) CH
Unconfined compressive strength(in kPa) at 35%
water content
30

Stabilization Of Marine Clays With Geotextile Reinforced…
www.ijceronline.com Open Access Journal Page 7
The geo-textile sheet used in this study is non woven geo textile which is collected from Ayyappa Geo-
textile installers, Lankelapalem, Vishakhapatnam. Mass of the geotextile is 100g/m2 and Tensile strength is
4.5kN/m. Geo-textile circular discs are shown in Figure.1(c).
The sand used as a blanket is clean river sand collected from Nagavali River, Sankili, Regidi
Amadalavalasa (mandal), Srikakulam (Dt). The sand used as a blanket is sieved through 4.75mm sieve and is
classified as well graded sand.
Figure 1(a).Marine clay Figure 1(b).Silica-Manganese slag Figure 1(c). Geo-textile circular discs
Figure 1(d). Sand
III. Experimental program Experimental program carried out includes the construction and testing procedures of clay bed,
ordinary floating stone column and reinforced stone columns and are discussed below.
3.1. Preparation of clay bed The air-dried and pulverized clay sample was mixed with required quantity of water. The moisture
content (35%) required for the desired shear strength was determined by conducting several vane shear tests on
a cylindrical specimen of 76 mm height and 38 mm depth. After adding the water to the clay powder it was
thoroughly mixed to a consistent paste and this paste was filled in the tank in 50 mm thick layers to the desired
height of 300mm by hand compaction such that no air voids are left in the soil. Before filling the soil in the tank,
the inner surface of the tank wall was first coated with silicon grease to minimize the friction between soil and
the tank wall. For each load test, the clay bed was prepared afresh in the test tank and stone columns were
installed in it. After preparation of clay bed, it is covered with wet gunny cloth and then left for 24 hours for
moisture equalization. Figure. 2 shows the clay bed prepared in the cylindrical tank used in this study. Tests
were conducted on stone columns formed in a clay bed of 200mm diameter and 300mm height. Figure.5 (b)
shows the Schematic view of stone column foundation for test.
Figure 2. Clay bed
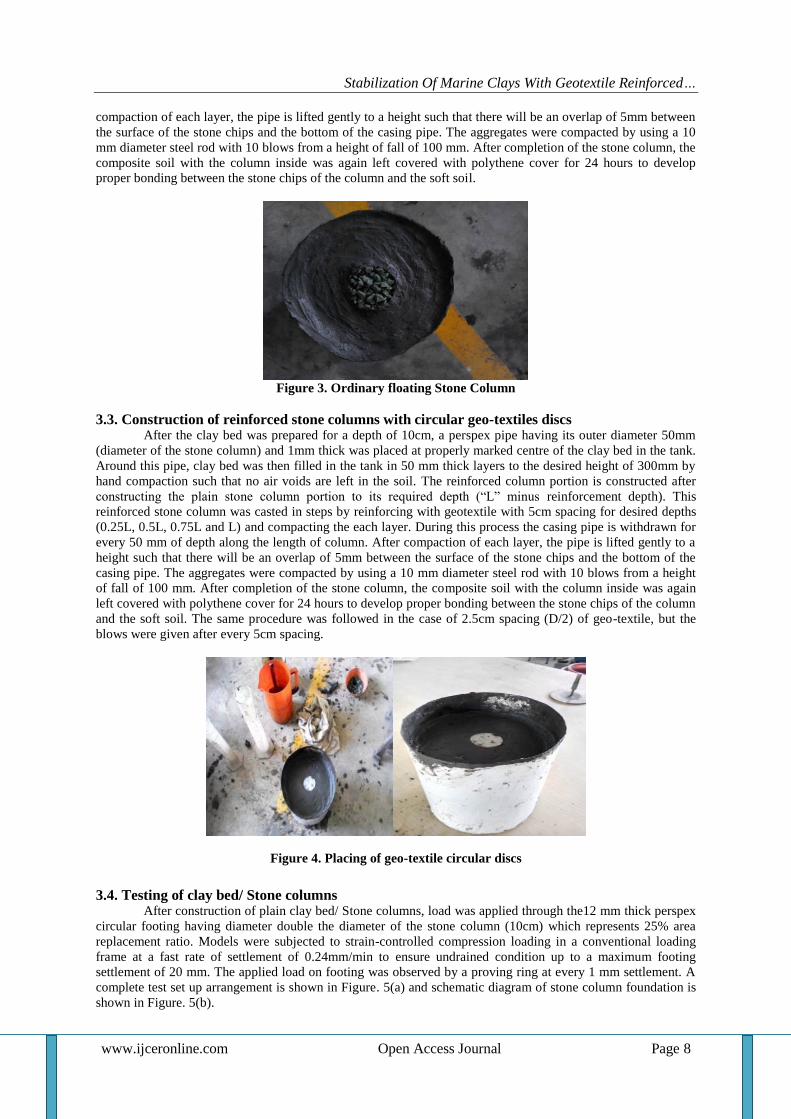
3.2. Construction of ordinary floating stone column After the clay bed was prepared for a depth of 10cm, a perspex pipe having its outer diameter 50mm
(diameter of the stone column) and 1mm thick was placed at properly marked centre of the clay bed in the tank.
Around this pipe, clay bed was then filled in the tank in 50 mm thick layers to the desired height of 300mm by
hand compaction such that no air voids are left in the soil. Silica-Manganese slag is used as the course aggregate
(stone column material) in this study. 5% of water is added to the coarse aggregate to avoid the absorption of
water in the clay bed. The stone column was casted in steps by compacting the course aggregate chips and
withdrawing the casing pipe simultaneously for every 50 mm of depth along the length of column. After
Stabilization Of Marine Clays With Geotextile Reinforced…
www.ijceronline.com Open Access Journal Page 8
compaction of each layer, the pipe is lifted gently to a height such that there will be an overlap of 5mm between
the surface of the stone chips and the bottom of the casing pipe. The aggregates were compacted by using a 10
mm diameter steel rod with 10 blows from a height of fall of 100 mm. After completion of the stone column, the
composite soil with the column inside was again left covered with polythene cover for 24 hours to develop
proper bonding between the stone chips of the column and the soft soil.
Figure 3. Ordinary floating Stone Column
3.3. Construction of reinforced stone columns with circular geo-textiles discs After the clay bed was prepared for a depth of 10cm, a perspex pipe having its outer diameter 50mm
(diameter of the stone column) and 1mm thick was placed at properly marked centre of the clay bed in the tank.
Around this pipe, clay bed was then filled in the tank in 50 mm thick layers to the desired height of 300mm by
hand compaction such that no air voids are left in the soil. The reinforced column portion is constructed after
constructing the plain stone column portion to its required depth (“L” minus reinforcement depth). This
reinforced stone column was casted in steps by reinforcing with geotextile with 5cm spacing for desired depths
(0.25L, 0.5L, 0.75L and L) and compacting the each layer. During this process the casing pipe is withdrawn for
every 50 mm of depth along the length of column. After compaction of each layer, the pipe is lifted gently to a
height such that there will be an overlap of 5mm between the surface of the stone chips and the bottom of the
casing pipe. The aggregates were compacted by using a 10 mm diameter steel rod with 10 blows from a height
of fall of 100 mm. After completion of the stone column, the composite soil with the column inside was again
left covered with polythene cover for 24 hours to develop proper bonding between the stone chips of the column
and the soft soil. The same procedure was followed in the case of 2.5cm spacing (D/2) of geo-textile, but the
blows were given after every 5cm spacing.
Figure 4. Placing of geo-textile circular discs
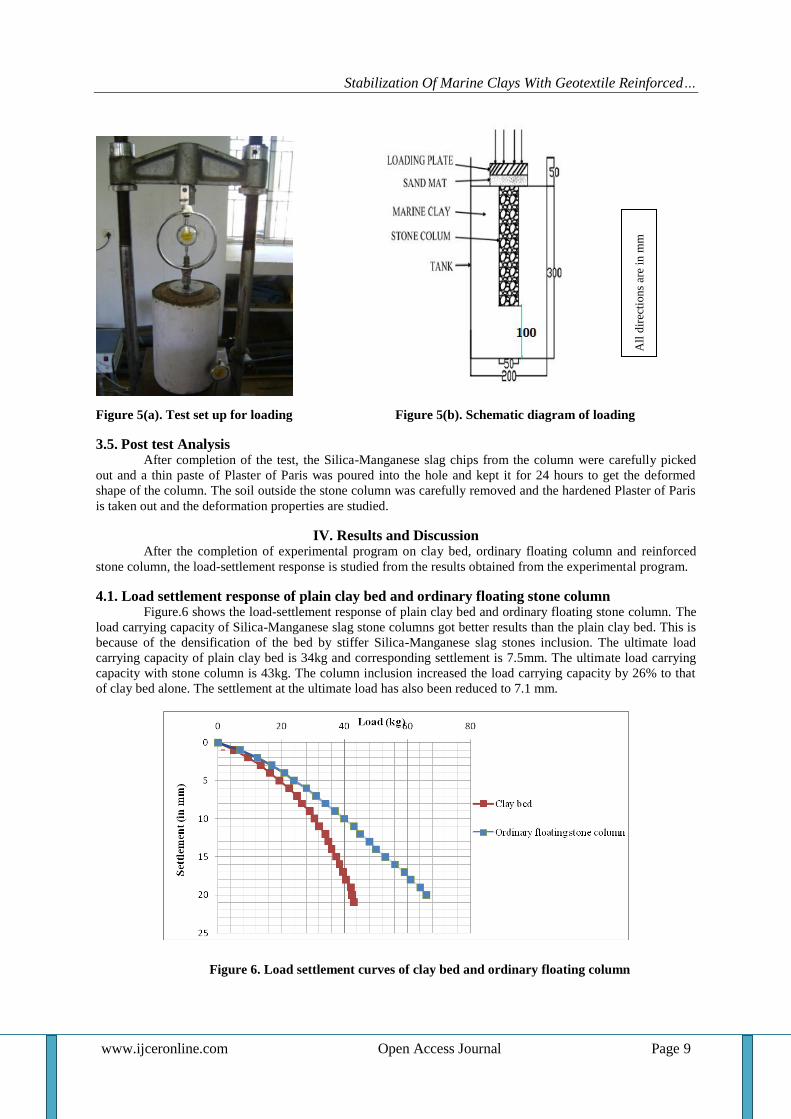
3.4. Testing of clay bed/ Stone columns After construction of plain clay bed/ Stone columns, load was applied through the12 mm thick perspex
circular footing having diameter double the diameter of the stone column (10cm) which represents 25% area
replacement ratio. Models were subjected to strain-controlled compression loading in a conventional loading
frame at a fast rate of settlement of 0.24mm/min to ensure undrained condition up to a maximum footing
settlement of 20 mm. The applied load on footing was observed by a proving ring at every 1 mm settlement. A
complete test set up arrangement is shown in Figure. 5(a) and schematic diagram of stone column foundation is
shown in Figure. 5(b).
Stabilization Of Marine Clays With Geotextile Reinforced…
www.ijceronline.com Open Access Journal Page 9
Figure 5(a). Test set up for loading Figure 5(b). Schematic diagram of loading
3.5. Post test Analysis After completion of the test, the Silica-Manganese slag chips from the column were carefully picked
out and a thin paste of Plaster of Paris was poured into the hole and kept it for 24 hours to get the deformed
shape of the column. The soil outside the stone column was carefully removed and the hardened Plaster of Paris
is taken out and the deformation properties are studied.
IV. Results and Discussion After the completion of experimental program on clay bed, ordinary floating column and reinforced
stone column, the load-settlement response is studied from the results obtained from the experimental program.
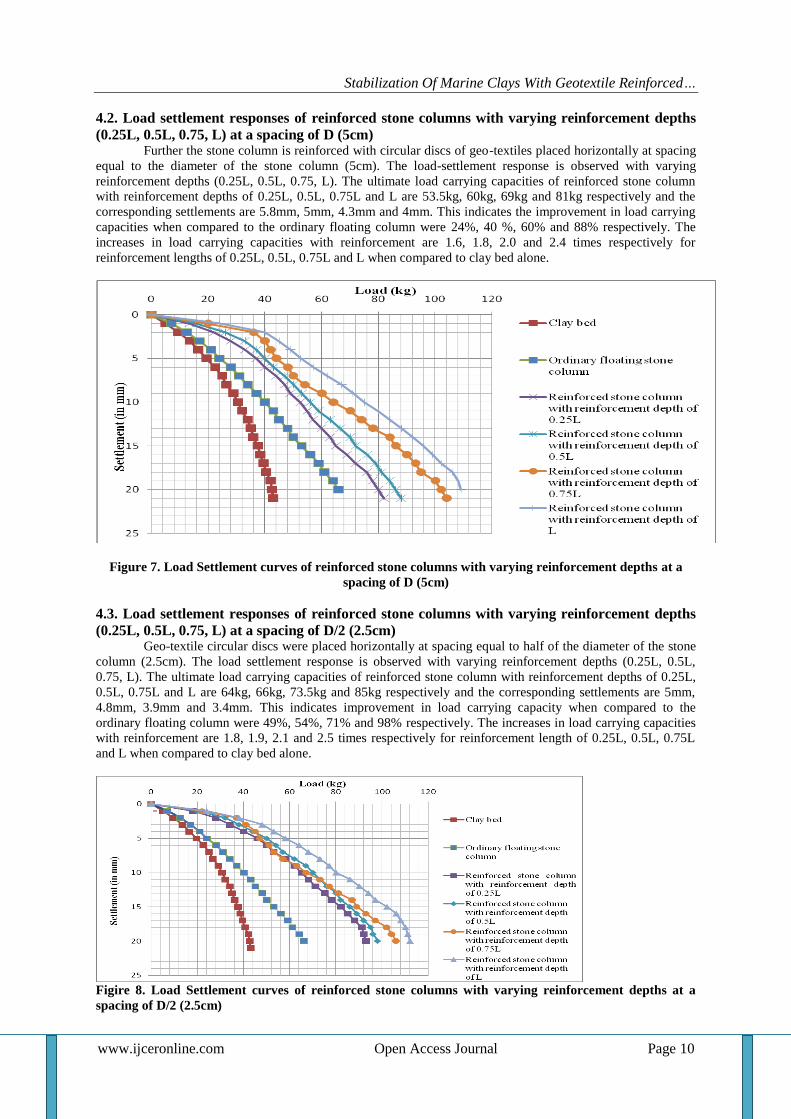
4.1. Load settlement response of plain clay bed and ordinary floating stone column Figure.6 shows the load-settlement response of plain clay bed and ordinary floating stone column. The
load carrying capacity of Silica-Manganese slag stone columns got better results than the plain clay bed. This is
because of the densification of the bed by stiffer Silica-Manganese slag stones inclusion. The ultimate load
carrying capacity of plain clay bed is 34kg and corresponding settlement is 7.5mm. The ultimate load carrying
capacity with stone column is 43kg. The column inclusion increased the load carrying capacity by 26% to that
of clay bed alone. The settlement at the ultimate load has also been reduced to 7.1 mm.
Figure 6. Load settlement curves of clay bed and ordinary floating column
All
dir
ecti
on
s ar
e in
mm
Stabilization Of Marine Clays With Geotextile Reinforced…
www.ijceronline.com Open Access Journal Page 10
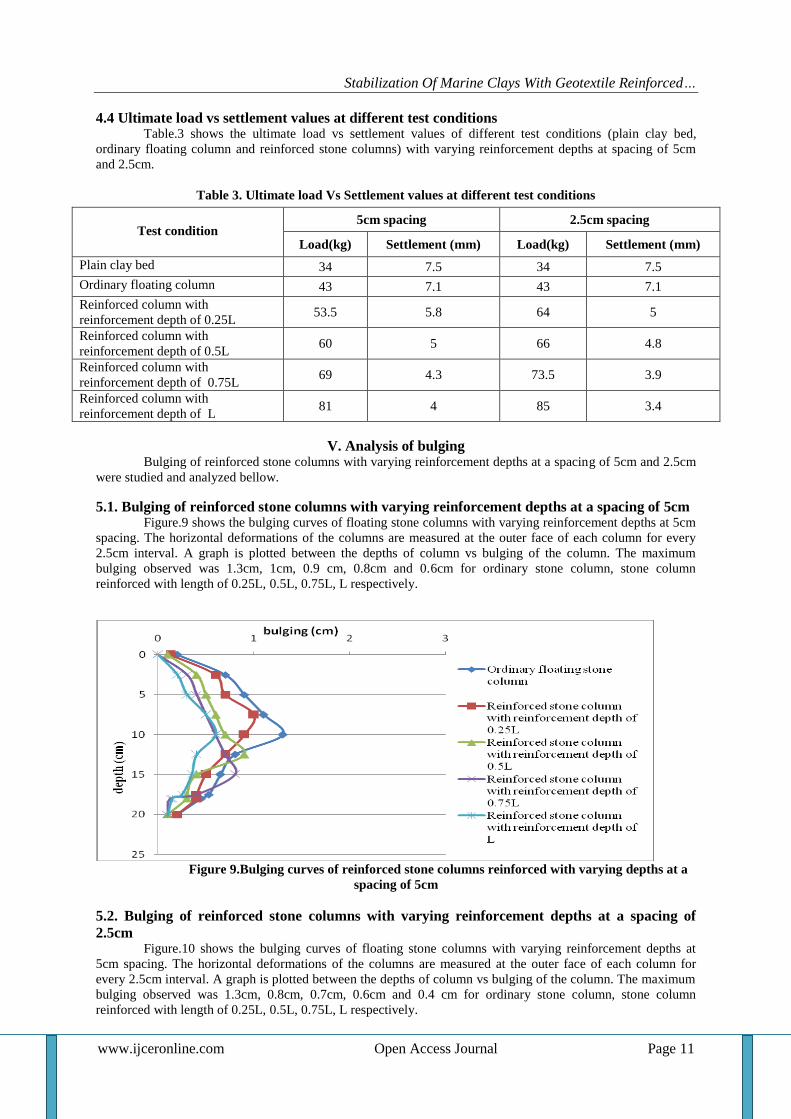
4.2. Load settlement responses of reinforced stone columns with varying reinforcement depths
(0.25L, 0.5L, 0.75, L) at a spacing of D (5cm) Further the stone column is reinforced with circular discs of geo-textiles placed horizontally at spacing
equal to the diameter of the stone column (5cm). The load-settlement response is observed with varying
reinforcement depths (0.25L, 0.5L, 0.75, L). The ultimate load carrying capacities of reinforced stone column
with reinforcement depths of 0.25L, 0.5L, 0.75L and L are 53.5kg, 60kg, 69kg and 81kg respectively and the
corresponding settlements are 5.8mm, 5mm, 4.3mm and 4mm. This indicates the improvement in load carrying
capacities when compared to the ordinary floating column were 24%, 40 %, 60% and 88% respectively. The
increases in load carrying capacities with reinforcement are 1.6, 1.8, 2.0 and 2.4 times respectively for
reinforcement lengths of 0.25L, 0.5L, 0.75L and L when compared to clay bed alone.
Figure 7. Load Settlement curves of reinforced stone columns with varying reinforcement depths at a
spacing of D (5cm)
4.3. Load settlement responses of reinforced stone columns with varying reinforcement depths
(0.25L, 0.5L, 0.75, L) at a spacing of D/2 (2.5cm) Geo-textile circular discs were placed horizontally at spacing equal to half of the diameter of the stone
column (2.5cm). The load settlement response is observed with varying reinforcement depths (0.25L, 0.5L,
0.75, L). The ultimate load carrying capacities of reinforced stone column with reinforcement depths of 0.25L,
0.5L, 0.75L and L are 64kg, 66kg, 73.5kg and 85kg respectively and the corresponding settlements are 5mm,
4.8mm, 3.9mm and 3.4mm. This indicates improvement in load carrying capacity when compared to the
ordinary floating column were 49%, 54%, 71% and 98% respectively. The increases in load carrying capacities
with reinforcement are 1.8, 1.9, 2.1 and 2.5 times respectively for reinforcement length of 0.25L, 0.5L, 0.75L
and L when compared to clay bed alone.
Figire 8. Load Settlement curves of reinforced stone columns with varying reinforcement depths at a
spacing of D/2 (2.5cm)
Stabilization Of Marine Clays With Geotextile Reinforced…
www.ijceronline.com Open Access Journal Page 11
4.4 Ultimate load vs settlement values at different test conditions Table.3 shows the ultimate load vs settlement values of different test conditions (plain clay bed,
ordinary floating column and reinforced stone columns) with varying reinforcement depths at spacing of 5cm
and 2.5cm.
Table 3. Ultimate load Vs Settlement values at different test conditions
Test condition 5cm spacing 2.5cm spacing
Load(kg) Settlement (mm) Load(kg) Settlement (mm)
Plain clay bed 34 7.5 34 7.5
Ordinary floating column 43 7.1 43 7.1
Reinforced column with
reinforcement depth of 0.25L 53.5 5.8 64 5
Reinforced column with
reinforcement depth of 0.5L 60 5 66 4.8
Reinforced column with
reinforcement depth of 0.75L 69 4.3 73.5 3.9
Reinforced column with
reinforcement depth of L 81 4 85 3.4
V. Analysis of bulging Bulging of reinforced stone columns with varying reinforcement depths at a spacing of 5cm and 2.5cm
were studied and analyzed bellow.
5.1. Bulging of reinforced stone columns with varying reinforcement depths at a spacing of 5cm Figure.9 shows the bulging curves of floating stone columns with varying reinforcement depths at 5cm
spacing. The horizontal deformations of the columns are measured at the outer face of each column for every
2.5cm interval. A graph is plotted between the depths of column vs bulging of the column. The maximum
bulging observed was 1.3cm, 1cm, 0.9 cm, 0.8cm and 0.6cm for ordinary stone column, stone column
reinforced with length of 0.25L, 0.5L, 0.75L, L respectively.
Figure 9.Bulging curves of reinforced stone columns reinforced with varying depths at a
spacing of 5cm
5.2. Bulging of reinforced stone columns with varying reinforcement depths at a spacing of
2.5cm Figure.10 shows the bulging curves of floating stone columns with varying reinforcement depths at
5cm spacing. The horizontal deformations of the columns are measured at the outer face of each column for
every 2.5cm interval. A graph is plotted between the depths of column vs bulging of the column. The maximum
bulging observed was 1.3cm, 0.8cm, 0.7cm, 0.6cm and 0.4 cm for ordinary stone column, stone column
reinforced with length of 0.25L, 0.5L, 0.75L, L respectively.

Stabilization Of Marine Clays With Geotextile Reinforced…
www.ijceronline.com Open Access Journal Page 12
Figure 10. Bulging curves of reinforced stone columns reinforced with varying depths at a
spacing of 2.5cm
V. Conclusions The conclusions derived from the present study are listed below. 1. Inclusion of ordinary floating stone column increased the load carrying capacity of plain clay bed by about
26%.
2. The load carrying capacity and stiffness of the floating stone column are increased by lateral reinforcement
of column using geo-textile circular discs.
3. The improvement in load carrying capacity of reinforced column also depends on the reinforcement depth.
Load carrying capacity of the stone column reinforced for full length with D (5cm) and D/2 (2.5cm)
spacings shows 51 % and 33% better performance respectively than that of columns reinforced to top
quarter depth.
4. Load carrying capacities of the stone columns reinforced with circular discs placed at D/2 (2.5cm) spacing
shows better performance than D (5cm) spacing, where as the increment is reduced by increasing the depth
of column. This increment is very less when reinforced with a reinforcement depth of 0.75L and L.
5. The settlement is decreased when the stone column is reinforced with geotextile. The decrement in
settlement of reinforced stone column for full length with D (5cm) and D/2 (2.5cm) spacing shows 78% and
109% respectively when compared to the ordinary floating stone column.
6. Maximum bulging has been found at half of the length of stone column for unreinforced column and for all
reinforced columns, bulging is found just below the reinforcement depth.
References [1] Zahmatkesh, A. and Choobbasti, A. J., “Clay reinforced by stone columns; considering the effect of soil”, International journal of
research and reviews in applied science, 3, pp. 159 -166, 2010.
[2] Bora, Mukul and Sujit Kumar., “Load deformation behaviour of floating stone Columns in soft Clay”, Indian Geotechnical Conference, GEO trendz, IGS Mumbai Chapter & IIT Bombay, December 16–18, 2010.
[3] A. P. Ambily, Shailesh and R. Gandhi., “ Behavior Of Stone Columns Based on Experimental and Fem Analysis”, Journal of
Geotechnical and Geo environmental Engineering, Vol.133,No. 4, ASCE, ISSN 1090-0241/2007/4-405–415, April 1, 2007. [4] Malarvizhi, S. N. and Ilamparuthi. K., “Load versus Settlement of Clay bed stabilized with Stone & Reinforced Stone Columns”,
Proceedings of 3rd Asian Regional Conference on Geosynthetics, pp. 322-329, 2004.
[5] M.R. Dheerendra and J.A Majeed., “Load settlement behavior of stone columns with circumferential nails”, Indian Geotechnical Conference – 2010, GEOtrendz, IGS Mumbai Chapter & IIT Bombay, December 16–18, 2010.
[6] K.Balan, P.K.Jayasri and T.S Thushara., “Studies on natural geo-textile reinforced quarry waste columns for soft clay
stabilization”, Proceedings of Indian Geotechnical Conference Roorkee, December 22-24, 2013. [7] Kausar ali, J.T Shahu and K.G Sharma., “An Experimental Study of Stone Columns in Soft Soils”, Proceedings of Indian
Geotechnical Conference, Kochi, Paper No. H-059, December 15-17, 2011.
[8] K.ali and K.G Sharma., “Model Tests on Stone Columns Reinforced with Lateral Circular Discs” international journal of civil engineering research, ISSN 2278-3652 Volume 5, pp. 97-104, Number 2, 2014.
[9] Kumar Rakesh and Jain P.K.Soft., “Ground improvement with fiber reinforced granular pile”, International journal of advanced
Engineering research and studies E-ISSN 2249-8974, Vol.2, April-June 2013. [10] J.A Black, V. Sivakumar and M.R Madhav., “Reinforced stone columns in weak deposits: laboratory”, Journal of Geotechnical
and Geoenvironmental Engineering, Vol. 133, No. 9, ASCE, ISSN 1090-0241/2007/9-1154–1161, September 1, 2007.
[11] Ruben Aza-Gnandji and Denis Kalumba., “Experimental and numerical analysis of the behaviour of rammed stone columns installed in a South African soft soil”, International Journal of Engineering Science and Innovative Technology, Volume 3, Issue
6, ISSN:2319-5967, November 2014.
[12] K.V.S.B. Raju, L.Govinda raju, Chandrashekhar A.S., “ Cyclic Response of Stone Columns”, International Journal of Scientific & Engineering Research, Volume 4, Issue 5, ISSN 2229-5518, May 2013.
[13] Issac, D. S. and Girish, M. S., “Suitability of Different Materials for Stone Column Construction”, Electronic journal of
Geotechnical Engineering, Vol.14, pp. 1-12, 2009.

ISSN (e): 2250 – 3005 || Volume, 05 || Issue, 09 ||September – 2015 ||
International Journal of Computational Engineering Research (IJCER)
www.ijceronline.com Open Access Journal Page 13
Implementing Visible Light Communication in Intelligent Traffic
Management to resolve Traffic Logjams
Pritpal Singh
1, Gagandeep Singh
2, Ashmeet Singh
3
( Electronics and Communication Department. GTBIT College, GGSIP University, Dwarka, New Delhi 110078,
India)
I. Introduction The Real time traffic situations in metro cities are passing through their worst case scenario as there are millions
of vehicles running every day in metro cities resulting in traffic nuisance and logjams and ultimately lowering
the speed of life and add on the worries for the government too as it tends to cause a lot of delay in
transportation of essentials cum commuters.
The main intension behind Visible Light Communication driven Intelligent Traffic Management System
remains the finding of an efficient way of handling traffic inflow and outflow throughout a city so as to avoid
harsh traffic jams and to prevent the creation of traffic in first place. As accordance with Human intelligence
combining and latest technology, the proposed initiated system can revolutionize traffic management with the
infrastructure already in place and minimal monetary requirements as in this system implementation of the
existing light poles and Infrared (IR) sensors act as communication nodes in distinctive vehicles that can warn
each other of a developing traffic situation and hence can prevent heavy traffic jams in prior to its happening.
Proposed initiative is composed of a transmitter which is a street light which transmit map information required
to crossing vehicles and transfer the map information to each receiver installed in vehicles. In this system, every
street light is having their differentiable unique Identifications (IDs) for the generation of a visible light signal to
transmit the map information by using a Visible Light Transmitter module. Every mobile terminal installed in
vehicle is equipped with a Receiver module for receiving the mapped information generated from the street light
in visual light form and displays this fabricated information in the mobile terminal.
Abstract Véhiculer Traffic is an inevitable phenomenon which is directly linked with the urban
developmental society and cannot be ignored as it acts as a nervous system to the society in general
and individuals in particular. Urban Traffic is emerging as an incurable threat to the modern
society as there is a lack of efficient intelligent traffic management system. Prior attempts to use
radio frequency spectrum, ultrasonic sensors and other alternatives proved to be ineffective as they
are becoming crowded, that forced to develop an alternate means like wireless communication
which can accommodate the exponentially increasing traffic demand. In this proposed research
initiative, a Visible Light Communication (VLC) system is analyzed on its capabilities to provide
an alternative to the current standards of wireless transfer of information using light from LEDs as
the communication medium. The proposed system based upon the blinking of light-emitting diodes
at a rapid rate such that the human eye will not notice the change in light illumination but a highly
sensitive photodiode can read the behavioral changes and decode the information embedded within
it. The proposed VLC methodology is also being tried to get implemented in intelligent wireless
traffic management to resolve traffic logjams that usually occur in metro cities.
Keywords: photodiode, optical communication, LED, infrared, visible light, traffic management,
wireless, etc
Implementing Visible Light Communication…
www.ijceronline.com Open Access Journal Page 14
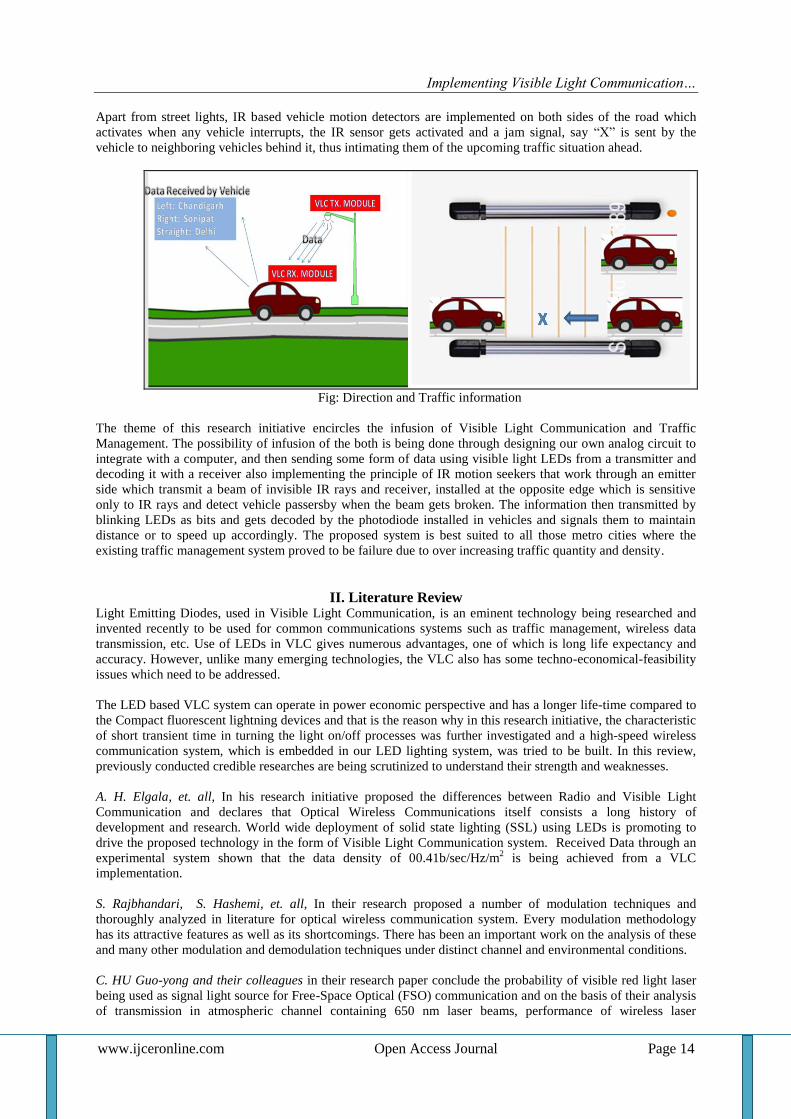
Apart from street lights, IR based vehicle motion detectors are implemented on both sides of the road which
activates when any vehicle interrupts, the IR sensor gets activated and a jam signal, say “X” is sent by the
vehicle to neighboring vehicles behind it, thus intimating them of the upcoming traffic situation ahead.
Fig: Direction and Traffic information
The theme of this research initiative encircles the infusion of Visible Light Communication and Traffic
Management. The possibility of infusion of the both is being done through designing our own analog circuit to
integrate with a computer, and then sending some form of data using visible light LEDs from a transmitter and
decoding it with a receiver also implementing the principle of IR motion seekers that work through an emitter
side which transmit a beam of invisible IR rays and receiver, installed at the opposite edge which is sensitive
only to IR rays and detect vehicle passersby when the beam gets broken. The information then transmitted by
blinking LEDs as bits and gets decoded by the photodiode installed in vehicles and signals them to maintain
distance or to speed up accordingly. The proposed system is best suited to all those metro cities where the
existing traffic management system proved to be failure due to over increasing traffic quantity and density.
II. Literature Review Light Emitting Diodes, used in Visible Light Communication, is an eminent technology being researched and
invented recently to be used for common communications systems such as traffic management, wireless data
transmission, etc. Use of LEDs in VLC gives numerous advantages, one of which is long life expectancy and
accuracy. However, unlike many emerging technologies, the VLC also has some techno-economical-feasibility
issues which need to be addressed.
The LED based VLC system can operate in power economic perspective and has a longer life-time compared to
the Compact fluorescent lightning devices and that is the reason why in this research initiative, the characteristic
of short transient time in turning the light on/off processes was further investigated and a high-speed wireless
communication system, which is embedded in our LED lighting system, was tried to be built. In this review,
previously conducted credible researches are being scrutinized to understand their strength and weaknesses.
A. H. Elgala, et. all, In his research initiative proposed the differences between Radio and Visible Light
Communication and declares that Optical Wireless Communications itself consists a long history of
development and research. World wide deployment of solid state lighting (SSL) using LEDs is promoting to
drive the proposed technology in the form of Visible Light Communication system. Received Data through an
experimental system shown that the data density of 00.41b/sec/Hz/m2 is being achieved from a VLC
implementation.
S. Rajbhandari, S. Hashemi, et. all, In their research proposed a number of modulation techniques and
thoroughly analyzed in literature for optical wireless communication system. Every modulation methodology
has its attractive features as well as its shortcomings. There has been an important work on the analysis of these
and many other modulation and demodulation techniques under distinct channel and environmental conditions.
C. HU Guo-yong and their colleagues in their research paper conclude the probability of visible red light laser
being used as signal light source for Free-Space Optical (FSO) communication and on the basis of their analysis
of transmission in atmospheric channel containing 650 nm laser beams, performance of wireless laser

Implementing Visible Light Communication…
www.ijceronline.com Open Access Journal Page 15
communication link and a low power red laser diode was evaluated. Their proposed system was capable to
achieve maximum range of 300 m at data rate 100 Mb/s on paper. A phenomenal short-range link at data rate 10
Mb/s covering 300 m is also going to be implemented in their university.
It remains feasible to increase the system performance such as link range and data rate by increasing
transmitting power and decreasing laser beam divergence angle or through other approaches.
A. Mishra and Neelesh, and their colleagues in their findings gave the idea of using internet using Visible Light
Communication and also said that wireless communication is the futuristic technology which will keep on
spreading worldwide. In the present scenario, there is an immediate urgency for the improvisation in the means
of connecting. A Wireless network using VLC is a new technical initiative that can easily pave the way for a
comfortable wire-free future of internet as well as transmission and communication means. Such a technology is
useful to establish a smart wireless network grid, underwater communication grid along with mobile services.
Their research aims to explain the phenomenon of VLC through its application to provide Wireless Internet.
III. Principle The Visible light communication is a data communication medium which employs visible light,
ranging between 400-800 THz (usually 780-375nm) and acts as an alternate to optical wireless communications
technologies.
Fig: Block Diagram
In the proposed research initiative, visible light communication in achieved by switching LEDs on and off at a
speed higher than is perceptible to human eye. Eyes are organs that can detect changes in light brightness and
power when these changes occur over a long time scale, but they can not percieve light that is switched on and
off rapidly, say at 200Hz or more depending on the eye. A photodiode on the other hand can easily recognize
the rapid on-off modulation. A photodiode is a photodetector that produces an electrical current that is
proportional to the optical power that is incident on the photodetector surface.
In this research, the above said principle is used to describe the implication of VLC in intelligent traffic
management with the help of LEDs as a transmitter and vehicle installed photodiodes as a decoder and receiver.
AVR Studio is used here as a development tool for the AT90S Series of AVR microcontrollers and embedded
technology is used for circuit development & fabrication.
IV. Methodology The system consists of transmitter & Receiver circuits in which transmitter circuit contains ATMEL
ATMega16L microcontroller, BC 547 push – pull amplifier pair, LM 7805 Voltage regulator, LEDs, resistances
and capacitances. Programmed Controller ATMega16L here acts as a central processing unit which encodes the
data and feeds it to the LEDs via push – pull amplifiers. The voltage supplied to the LEDs fluctuates and
flickers. This flickering is invisible to the human eye.

Implementing Visible Light Communication…
www.ijceronline.com Open Access Journal Page 16
In the receiver side, ATMEL ATMega16L microcontroller, a photodiode, an LCD display, LM 7805 Voltage
Regulator, BC 547 Transistor, resistances and capacitances are installed suitably to make the system complete
and functional.
A photodiode consisting of p–n junction and when a photon of required charge encounters with the diode, it
creates an electron-hole pair and generate inner photoelectric effect. The overall current through the photodiode
remains total of the dark current and the photo-current that means dark current must be standardized to
maximize the sensitivity of the device.
Fig: Schematic of Transmitter and receiver circuit used in proposed VLC based system.
The received signal from the photodiode gets amplified for detection at the microcontroller and then displayed
at the LCD showing the appropriate route required for navigation. Values of resistances and capacitances are
kept high to avoid damage to the electrical components keeping in mind the values mentioned in the data sheets.
High Range capacitors such as 1000 mf installed to avoid damage to the electrical component as they act as
storage units and store charge to avoid sudden increase or decrease in voltage levels. A Robotic vehicle is being
used as a test mobile vehicle to install receiver circuit and when it comes under a street light connected with the
above transmitter, the required route is displayed on the LCD with the help of visible light as medium of
communication.
IR detectors are connected with photocell through microchips that are tuned to act on infrared light. IR here
used as a Motion/ break-beam sensor to detect motion and work by having an emitter side that sends out a beam
of human-invisible IR light. When a vehicle, installed with VLC receiver, passes through the LED street lights
connected to the transmitter, it gives real time traffic information to the car driver and avoids traffic menace and
conjunction.
V. Observation After optimizing the circuit and its simulation, the hardware is developed and fabricated, thereafter installed in
specifically designed robotic vehicle to simulate real time traffic scenario. The photodiode based receiver circuit
is installed in robotic vehicle to facilitate decoding of VLC data and transmitter is being installed along with the
street lights to simulate a conjunction between traffic light and VLC data which is needed to be transmitted.
After the real time implementation set up, up to 100 runs is being performed to analyse the system efficiency
and accuracy towards the integrated VLC range. To facilitate traffic information prior to the driver before hitting
traffic jam, the street light based wireless traffic situation data transmission makes some sense at this proposed
system interlinking all existing amenities to construct a VLC communication system for traffic management.

Implementing Visible Light Communication…
www.ijceronline.com Open Access Journal Page 17
Fig: layout of robotic vehicle subjected to testing of VLC based traffic management system.
VI. Result & Discussion After the realized simulation, the results have been generated and analyzed which compares the disturbances in
the real time situation and artificially simulated situation. The proposed research and its implementation
approach provide an alternative to the existing manual traffic management system that proves to be a failure
many of the times.
Sending information from the street light is being done after conversion into bits through some coding scheme
by a microcontroller and that gets transmitted with blinking LEDs. The transmitting system will be powered
from a wall outlet whereas the receiving system will be powered by batteries and the computer / microcontroller
combination. The fabricated PCB remains efficient even after hundreds of real time simulations which prove the
capabilities of proposed system.
VII. Conclusion The proposed paper produces a novel design in pursue of implementing VLC communication system in
conjunction with wireless traffic management system and is definitely going to address the basic problem of
traffic management. Apart from this, VLC can also be used as a communications medium for ubiquitous
computing which have implications in various fields because light-producing devices such as indoor/outdoor
lamps, TVs, traffic signs, commercial displays and car headlights/taillights are used everywhere. Using visible
light is also economical for high-power applications and implications as human can perceive it and act to protect
their eyes. Further implications include underwater optical/acoustic communication system, VLC based wireless
optical communication, Blind indoor navigation system, etc.
References [1] Z. Ghassemlooy, Fellow IET, Senior member IEEE, W.O.Popoola, S.Rajbhandari, M.Amiri,“Modulation
Techniques for Wireless Infrared Communication” S. Hashemi Optical Communications Research Group,
NCRLab., Northumbria University, Newcastle upon Tyne,UK .
[2] HU Guo-yong†1, CHEN Chang-ying1,2, CHEN Zhenqiang1” Free-Space Optical communication using visible
light”,2(1Institute of Optoelectronic Engineering, Jinan University, Guangzhou 510632, China) (2Department of
Optoelectronic Engineering, Jinan University, Guangzhou 510632, China)..
[3] R.E. Moore, Interval analysis (Englewood Cliffs, NJ: Prentice-Hall, 1966).
[4] Brooks Thomas; Graham Gold; Nick Sertic, The University of British Columbia, Project Number 1076 January
18, 2011.

ISSN (e): 2250 – 3005 || Volume, 05 || Issue, 09 ||September – 2015 ||
International Journal of Computational Engineering Research (IJCER)
www.ijceronline.com Open Access Journal Page 18
Quantum Anharmonic Oscillator, A Computational Approach
1Shreti Garg (B Sc III),
2Sarmistha Sahu
Department of Physics, Maharani lakshmi Ammanni College for Women, Bangalore 560012
I. INTRODUCTION
For anharmonic oscillator [1],[2], the potential is given by
2 412
V kx bx
where b is a constant.
(1)
as shown in Fig. 1
Fig. 1 Anharmonic Potential (darker brown) with b = 0.5
II. THEORY
When Eq. 1 is used in the Schroedinger’s equation, the allowed vibrational energy levels [3] is found to be
2
231 12 2 2
3 2
8
( ) ( )
(34 51 59 21)
0,1,2,...
an
b
E n b n n
n n n
where n
(2)
Abstract
What is anharmonicity?
What happens to the energy levels of an anharmonic oscillator?
What is dissociation energy?
Many such questions can be answered by the computational method. The computational methods
used for solving the second degree differential equation (Schroedinger’s equation) is by Runge-
Kutta fourth order method using Microsoft-Excel.
For anharmonic oscillator, the accuracy of the results is fairly good.
*The computation and animation will be sent along this for publication/ online view

Quantum Anharmonic Oscillator, A Computational…
www.ijceronline.com Open Access Journal Page 19
Thus, the anharmonic oscillator behaves like the harmonic oscillator but with an oscillation frequency that
decreases steadily with increasing n.
For the ground state (n = 0) we have
2
0 0.5 1.5 *0.5 0.125 *21anE b b (3)
The energy difference between consecutive levels decreases successively. Finally, when the energy difference is
zero, the corresponding potential energy is a measure of the dissociation energy of the molecule.
III. METHODOLOGY
The computational output is obtained using Microsoft Excel .Runge Kutta Fourth Order is used for solving
the Schroedinger’s second degree ordinary differential equation. Of course, animation is done using graphics.
IV. RESULT
o The energy is lesser than the harmonic oscillator [4] given by
22 3 23 1
( ) (34 51 59 21)2 2 8
bE b n n n n n (4)
The energy difference decreases with the increase of the quantum number n as shown below. On the other hand,
the energy difference remains a constant for a harmonic oscillator.
Table 1. Comparison of energy in Anharmonic (Ean) and Harmonic Oscillators (Ehar)
For b= 0.001
n Ean
ΔEan=En+1-
En Ehar
0 0.499 0.5
1 1.496 0.997 1.5
2 2.490 0.994 2.5
3 3.481 0.991 3.5
4 4.469 0.988 4.5
5 5.454 0.985 5.5
6 6.435 0.982 6.5
7 7.413 0.978 7.5
8 8.389 0.975 8.5
9 9.361 0.972 9.5
.. ..
100 81.035 100.5
101 81.602 0.567 101.5
.. ..
150 102.036 150.5
151 102.292 0.256 151.5

Quantum Anharmonic Oscillator, A Computational…
www.ijceronline.com Open Access Journal Page 20
.. ..
175 106.325 175.5
176 106.402 0.077 176.5
.. ..
185 106.755 185.5
186 106.756 0.001 186.5
187 106.749 -0.007 187.5
o The dissociation energy is ~ 106.756 units [5].
ACKNOWLEDGEMENT
I am grateful to my teacher, Prof. Sarmistha Sahu who has taught me numerical methods and Microsoft Excel.
She has helped me complete this project successfully.
REFERENCES
[1] RC Verma, PK Ahluwalia, KC Sharma, Computational Physics An introduction, New Age International Publishers pp (1999)
[2] Eyvind Wichman, “Quantum Physics”, Berkeley Physics Course, Vol 4 McGraw Hill Companies Inc.(2011)
[3] Sarmistha Sahu, “Concise Physics”, Vol 5 Statistical Physics and Quantum Mechanics, Subhas Stores (2013)
[4] Sarmistha Sahu, Quantum Harmonic Oscillator, European Journal of Physics, (Submitted)
[5] C N Banwell, Fundamentals of Molecular Spectroscopy Tata McGraw-Hill Publishing Company Limited , 3rd ed (1983)

ISSN (e): 2250 – 3005 || Volume, 05 || Issue, 09 ||September – 2015 ||
International Journal of Computational Engineering Research (IJCER)
www.ijceronline.com Open Access Journal Page 21
Fourier and Periodogram Transform Temperature Analysis in
Soil
Afolabi O.M. Adekunle Ajasin University, Akungba Akoko, Ondo state Nigeria
I. Introduction Temperature measurement on land can be affected by sideways or lateral and subsurface disturbances
and field soils are heterogeneous in constituents. Sampling of soil and the temperature measurement in provides
a best approach to eliminate error contribution from other materials. Time series analysis is associated with the
time domain (i.e. trend component) and the frequency domain (i.e. periodic component). Temperature time
series mainly consist of Trend component in the very short or daily duration and long run comprising of months’
data with not so obvious periodicity.
Many years’ data comprise of seasonal temperature associated with trend or a long term movement in a time
series. It is the underlying direction (upward or downward) and rate of change in a time series, when allowance
has been for random or chaotic residuals. They can account for less than a year’s seasonal or cyclic component
depending on the duration considered (Abdullah et al., 2009).
II. Material and Methods The temperature sensor used is LM35DZ, P.I.C used is PIC18F4520 (programmed in C with MPLAB).
Fig.1 PIC18F4520 temperature circuit modified from http://embedded-lab.com, 2015.
LM7805
9v DC
INPUT
1P3
Abstract Fourier series and periodogram transform of three set of temperature data measured with constructed
PIC 18F4520 based temperature meter were as interpreted. Measurement of 5-minute interval
temperature variation with 3 LM34DZ sensors was made. The results show that Clay has the highest
average Fourier transform (32.472) followed by loam (30.624) and sand (29.428). The periodogram
analysis also varied in similar manner with clay having a mean periodogram 1899.97, loam 1694.84
and sand 1561.03. These show that temperature increasing most in clay caused higher values of
Fourier and periodogram transforms. The average of the absolute deviation indicated loam has highest
Fourier series changes (1.497) followed by sand (0.678) and clay (0.598) while the periodogram has
deviation ranging from loam 165.48, sand 71.31 to clay 0.60. This indicates that loam soil has most
sensitive response to temperature variations.
Keywords: Soil Data, Fourier Transform, Temperature, Periodogram, Variation.

Fourier and Periodogram Transform Temperature…
www.ijceronline.com Open Access Journal Page 22
The display is on 20x4 LCD. The whole constructed circuit was enclosed in a PVC case and the LCD was
underneath a transparent Perspex cover. 2000 ml each of the 3 soils were mixed with 500ml water and the
solution were put in a wooden box underlain inside with cellophane paper, each of all the three LM34DZ ICs 3
pins were insulated with thick masking tape away from the soil solution to avoid short circuit of the IC before
the LM34DZ temperature sensors were immersed 1 cm into the soils. Temperature readings in centigrade were
taken from the constructed temperature meter every 5 minutes from all the soils after switching with 1-pole 3-
throw (1P3) switch (see Fig. 1) to the 3 LM34DZ sensors. .
III. Result and Discussion The temperature data recorded from each soil are in Table 1. Soil temperature data recorded in 7
th March, 2015
were checked and the data were consistent and continuous, Tushar and Keith, 2008
Table 1: Time temperature data for Sand, Loam and Clay Soils
Time
Sand
Temperature
(oC)
Loam
Temperature
(oC)
Clay
Temperature
(oC) Time
(MIN)
11:55 5 27 26.9 31
12 10 27.8 27.9 31.7
12:05 15 28.7 28.1 31.9
12:10 20 28.8 28.9 32.9
12:15 25 28.8 29.9 33
12:20 30 29.9 29.7 33.9
12:25 35 29.8 29.8 32.9
12:30 40 29.9 30.9 32.9
12:35 45 30.1 29.7 32.9
12:40 50 29.9 28.8 33
12:45 55 29.1 30.1 33
12:50 60 30.9 29.7 32.8
12:55 65 30.8 30.9 32.8
13:00 70 29.9 29.9 32.7
13:05 75 29.8 30 32.8
13:10 80 29.8 30.8 32.8
13:15 85 29.9 31.7 32.8
13:20 90 29.8 32 32.7
13:25 95 29.7 32.9 32.8
13:30 100 29.9 32 32.1
13:35 105 29.8 31.8 32.8
13:40 110 28.9 32.8 31.9
13:45 115 28.8 32.9 30.9
13:50 120 28.8 33.9 30.9
13:55 125 29.1 33.6 31.9
Fourier and Periodogram Transform Temperature…
www.ijceronline.com Open Access Journal Page 23
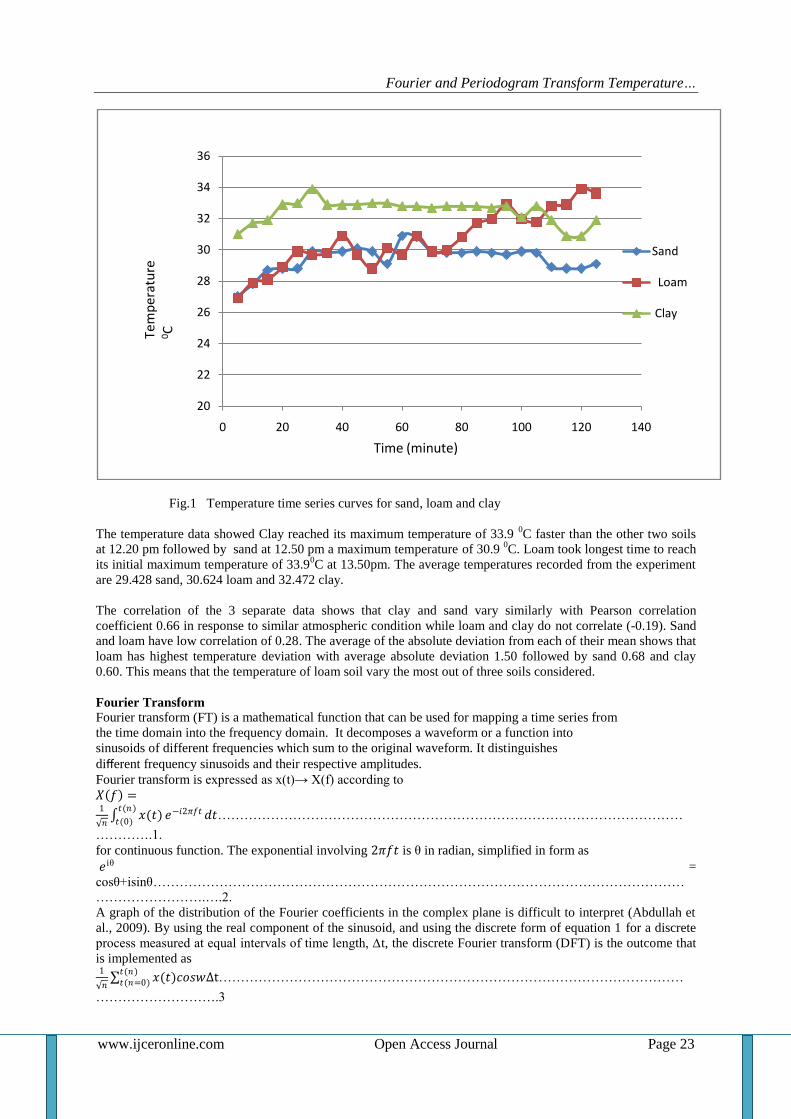
Fig.1 Temperature time series curves for sand, loam and clay
The temperature data showed Clay reached its maximum temperature of 33.9 0C faster than the other two soils
at 12.20 pm followed by sand at 12.50 pm a maximum temperature of 30.9 0C. Loam took longest time to reach
its initial maximum temperature of 33.90C at 13.50pm. The average temperatures recorded from the experiment
are 29.428 sand, 30.624 loam and 32.472 clay.
The correlation of the 3 separate data shows that clay and sand vary similarly with Pearson correlation
coefficient 0.66 in response to similar atmospheric condition while loam and clay do not correlate (-0.19). Sand
and loam have low correlation of 0.28. The average of the absolute deviation from each of their mean shows that
loam has highest temperature deviation with average absolute deviation 1.50 followed by sand 0.68 and clay
0.60. This means that the temperature of loam soil vary the most out of three soils considered.
Fourier Transform
Fourier transform (FT) is a mathematical function that can be used for mapping a time series from
the time domain into the frequency domain. It decomposes a waveform or a function into
sinusoids of different frequencies which sum to the original waveform. It distinguishes
different frequency sinusoids and their respective amplitudes.
Fourier transform is expressed as x(t)→ X(f) according to
𝑋 𝑓 =1
𝑛 𝑥(𝑡)
𝑡(𝑛)
𝑡(0)𝑒−𝑖2𝜋𝑓𝑡 𝑑𝑡……………………………………………………………………………………………
………….1.
for continuous function. The exponential involving 2𝜋𝑓𝑡 is θ in radian, simplified in form as
𝑒iθ =
cosθ+isinθ…………………………………………………………………………………………………………
…………………….….2.
A graph of the distribution of the Fourier coefficients in the complex plane is difficult to interpret (Abdullah et
al., 2009). By using the real component of the sinusoid, and using the discrete form of equation 1 for a discrete
process measured at equal intervals of time length, ∆t, the discrete Fourier transform (DFT) is the outcome that
is implemented as 1
𝑛 𝑥(𝑡)𝑐𝑜𝑠𝑤∆t
𝑡(𝑛)𝑡(𝑛=0) ……………………………………………………………………………………………
……………………….3
20
22
24
26
28
30
32
34
36
0 20 40 60 80 100 120 140
Sand
Loam
Clay
Time (minute)
Tem
per
atu
re
0C

Fourier and Periodogram Transform Temperature…
www.ijceronline.com Open Access Journal Page 24
For the soil temperature data with a finite sequence [xn] of sample from a series x(t), the discrete Fourier
transform is defined by
X(f) =1
𝑛 𝑥 𝑡 𝑐𝑜𝑠2𝜋∆t
𝑘
𝑛
𝑛=5𝑘=1
……………………………………………………………………………………………………………4
Where k is kth
frequency sampled.
Periodogram
The complex magnitude squared of X(f) is called the power or periodogram . This strength of the periodic
component is more often represented by the periodogram defined as
P(f)= 1
𝑛 𝑥 𝑡 (𝑐𝑜𝑠𝑤∆t
𝑡(𝑛)𝑡(𝑛=1) −
𝑖𝑠𝑖𝑛𝑤∆t)2………………………………………………………………………………….5
𝑃 𝑓 =1
𝑛 {𝑥 𝑡 }2{(𝑐𝑜𝑠𝑤∆t
𝑡(5)𝑡(𝑛=1) )2 +
(𝑠𝑖𝑛𝑤∆t)2}……………………………………………………………….6
The real part of equation 6 can be implemented in Microsoft EXCEL as
((H3/SQRT(5))*COS(6.284*5)*(1/5+2/5+3/5+4/5+5/5)+SIN(6.284*5*(1/5+2/5+3/5+4/5+5/5)))^2with the
procedure of equation 5. Equations 5 and 6 are calculated and shown in tables 2 to 4 following.
Table 2. Fourier transform of Sand, Loam and Clay’s temperature
Time (MIN) x(FS) x(FL) x(FC)
5 36.22407 36.0898 41.59052
10 37.2973 37.4315 42.52966
15 38.50477 37.6998 42.79799
20 38.63893 38.7731 44.13962
25 38.63893 40.1147 44.27378
30 40.11473 39.8464 45.48125
35 39.98056 39.9806 44.13962
40 40.11473 41.4564 44.13962
45 40.38305 39.8464 44.13962
50 40.11473 38.6389 44.27378
55 39.04142 40.3831 44.27378
60 41.45636 39.8464 44.00545
65 41.32219 41.4564 44.00545
70 40.11473 40.1147 43.87129
75 39.98056 40.2489 44.00545
80 39.98056 41.3222 44.00545
85 40.11473 42.5297 44.00545
90 39.98056 42.9321 43.87129
95 39.8464 44.1396 44.00545
100 40.11473 42.9321 43.06631
105 39.98056 42.6638 44.00545
110 38.7731 44.0055 42.79799
115 38.63893 44.1396 41.45636
120 38.63893 45.4812 41.45636
125 39.04142 45.0788 42.79799

Fourier and Periodogram Transform Temperature…
www.ijceronline.com Open Access Journal Page 25
Table 3. Periodogram of Sand, Loam and Clay’s temperature
Time
(MIN)
p(FS) p(FL) p(FC)
5 1313.064 1303.359 1730.788
10 1392.001 1402.03 1809.812
15 1483.559 1422.196 1832.714
20 1493.912 1504.301 1949.385
25 1493.912 1610.172 1961.25
30 1610.172 1588.71 2069.655
35 1599.423 1599.423 1949.385
40 1610.172 1719.643 1949.385
45 1631.778 1588.71 1949.385
50 1610.172 1493.912 1961.25
55 1525.187 1631.778 1961.25
60 1719.643 1588.71 1937.556
65 1708.534 1719.643 1937.556
70 1610.172 1610.172 1925.762
75 1599.423 1620.957 1937.556
80 1599.423 1708.534 1937.556
85 1610.172 1809.812 1937.556
90 1599.423 1844.219 1925.762
95 1588.71 1949.385 1937.556
100 1610.172 1844.219 1855.76
105 1599.423 1821.245 1937.556
110 1504.301 1937.556 1832.714
115 1493.912 1949.385 1719.643
120 1493.912 2069.655 1719.643
125 1525.187 2033.196 1832.714
The Fourier transform and Periodogram data from tables 2 and 3 are generally higher than the raw temperature
data. They all show similar trends as the data they originated from. The Fourier transform correlation of sand
and loam is low 0.279863 while that between loam and clay is the lowest -0.18981. The highest correlations of
Fourier transform exist between clay and sand 0.6555599 while periodogram correlations are respectively
similar but slightly lower (0.243921, -0.21756 and 0.650798). The transforms indicate that clay and sand
temperature have similar response to external heat interaction while loam and clay do not have any similar
response to heat as the negative correlation is too low for interpreting opposite response. This is conversely
similar to the response between sand and loam with too low positive Fourier and Periodogram transforms.
Fig.2 Fourier transform time series curves for sand, loam and clay

Fourier and Periodogram Transform Temperature…
www.ijceronline.com Open Access Journal Page 26
Fig.3. Periodogram time series curve for sand, loam and clay
The frequency curves of sand Periodogram data show clear changes due to temperature variation and the highest
periodogram data occur in loam from 120th
and 125th
minutes corresponding to a time from 13.50 to 13.55 pm.
Clay show early increase in Periodogram and frequency in the 30th
minute or 12.20 pm. The periodogram and
Fourier transform are useful to check interpretation error in the principal data and here they corroborate the
earlier interpretation of soil, clay and sand temperature data and all the resulting curves.
IV. Conclusion The 1 pole three throw switch temperature meter permitted the measurement of temperature in the samples of
sand, loam and clay soils. Clay has the highest average temperature (32.472) followed by loam (30.624) and
sand (29.428). The correlation of the 3 temperature data shows that clay and sand vary similarly with Pearson
correlation coefficient 0.66 in response to similar atmospheric condition while loam and clay do not correlate (-
0.19). Sand and loam have poor correlation of 0.28. The average of the absolute deviation indicated loam has
highest temperature changes followed by sand and clay. This result is further confirmed by the Fourier
transform and periodogram data that proved useful for investigating the interpretations from original data.
References [1] Abdullah, S., C.K.E. Nizwan and M.Z. Nuawi, 2009. A study of fatigue data editing using the Short Time
[2] Fourier Transform (STFT). Am. J. Applied Sci., 6: 565-575. http://www.scipub.org/fulltext/ajas/ [3] ajas64565575.pdf.
[4] Lough, J.M., 1995. Temperature variations in a tropical-subtropical environment: Queensland,
[5] Australia, 1910-1987. Int. J. Climatol., 15: 77-95. DOI: 10.1002/joc.3370150109 [6] Tushar S. and Keith A.C. 2008 Time Series Analysis of Soil Freeze and Thaw Processes in Indiana
[7] Journal of Hydrometeorology Vol. 9
[8] Frauenberger C. and Gerhard Eckel A. “ANALYSING TIME SERIES DATA” Proceedings of the 13th [9] International Conference on Auditory Display,Montr´eal, Canada, June26-29,2007

ISSN (e): 2250 – 3005 || Volume, 05 || Issue, 09 ||September – 2015 ||
International Journal of Computational Engineering Research (IJCER)
www.ijceronline.com Open Access Journal Page 27
Design and Analysis of Micro Steam Turbine Using Catia and
Ansys
1.
S . Upendar, 2. K Hari brahmaiah,
3. N. Vijaya Rami Reddy,
4. B.Rakesh
1. (Asst professor Department of Mechanical Engineering),
2. (Asst professor Department of Mechanical Engineering),
3. (Asst professor Department of Mechanical Engineering),
4. (Asst professor Department of Mechanical Engineering),
I. INTRODUCTION TO STEAM TURBINE
A Steam turbine is a rotating engine that extracts energy from a flow of combustion Steams that result
from the ignition of compressed air and a fuel (either a Steam or liquid, most commonly natural Steam). A
Steam turbine is a rotating engine that extracts energy from a flow of combustion Steams that result from the
ignition of compressed air and a fuel (either a Steam or liquid, most commonly natural Steam). The simplest
Steam turbine follows the Brayton cycle .Closed cycle (i.e., the working fluid is not released to the atmosphere),
air is compressed isentropically, combustion occurs at constant pressure, and expansion over the turbine occurs
isentropically back to the starting pressure. As with all heat engine cycles, higher combustion temperature (the
common industry reference is turbine inlet temperature) means greater efficiency.
II. LITERATURE SURVEY Extensive work has been reported in the literature on analysis of steam turbines. Charles F and Orrin J
Crommett [1] have considered Steam was to be admitted to the turbine wheel by a pair of nozzles, but it was
specified that any desired numbers of nozzle could be used. R. K. Sahoo, S. K. Sarangi et.al. [2] Have
considered focuses on design and development of turbo expander.The paper briefly discuses the design
methodology and the fabrication drawings for the whole system, which includes the turbine wheel, nozzle,
diffuser, shaft, brake compressor, two types of bearing, and appropriate housing. Charles Lang's team et.al.[3]
performed including Donald Welbourn and A.R.Forrest, at Cambridge University's Computing Laboratory
began serious research into 3D modeling CAD software.. Avions Marcel Dassault et.al.[4] purchased a source-
code license of CADAM from Lockheed and in 1977 began developing a 3D CAD software program named
CATIA (Computer Aided Three Dimensional Interactive Application) which survives to this day as the most
commercially successful CAD software program in current use.
III. INTRODUCTION TO CAD/CAM/CAE: The Possible basic way to industries is to have high quality products at low costs is by using the
computer Aided Engineering (CAE), Computer Aided Design (CAD) And Computer Aided Manufacturing
(CAM) set up. Further many tools is been introduced to simplify & serve the requirement CATIA, PRO-E, UG
are some among many.
CATIA is a robust application that enables you to create rich and complex designs. The goals of the
CATIA course are to teach you how to build parts and assemblies in CATIA, and how to make simple
drawings of those parts and assemblies.
ABSTRACT Micro turbines are becoming widely used for combined power generation and heat
applications. Micro turbines have many advantages over piston generators such as low emissions
less moving parts, accepts commercial fuels. Steam turbine cycle and operation of micro turbine was
studied and reported. Different parts (Inlet. Storage, Nozzle, Rotor, coupling, outlet, clip, housing) of
turbine are designed with the help of CATIA software. The turbine is of Axial input and axial output
type. ANSYS is used for thermal analysis of a steam turbine and those results are extracted and
following values are shown by applying known temperature when it is in working condition.
Key words: Steam turbine, CATIA, Rapid Prototype, parts of turbine, nozzle, and rotor.
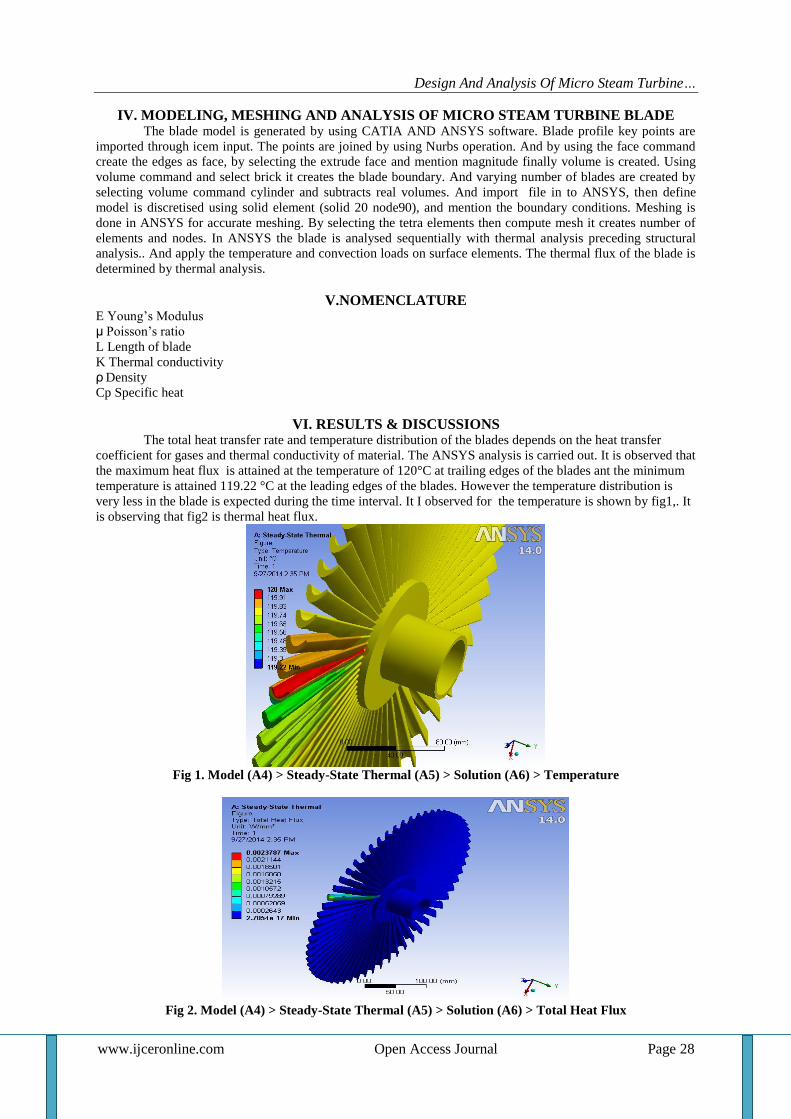
Design And Analysis Of Micro Steam Turbine…
www.ijceronline.com Open Access Journal Page 28
IV. MODELING, MESHING AND ANALYSIS OF MICRO STEAM TURBINE BLADE The blade model is generated by using CATIA AND ANSYS software. Blade profile key points are
imported through icem input. The points are joined by using Nurbs operation. And by using the face command
create the edges as face, by selecting the extrude face and mention magnitude finally volume is created. Using
volume command and select brick it creates the blade boundary. And varying number of blades are created by
selecting volume command cylinder and subtracts real volumes. And import file in to ANSYS, then define
model is discretised using solid element (solid 20 node90), and mention the boundary conditions. Meshing is
done in ANSYS for accurate meshing. By selecting the tetra elements then compute mesh it creates number of
elements and nodes. In ANSYS the blade is analysed sequentially with thermal analysis preceding structural
analysis.. And apply the temperature and convection loads on surface elements. The thermal flux of the blade is
determined by thermal analysis.
V.NOMENCLATURE E Young’s Modulus
μ Poisson’s ratio
L Length of blade
K Thermal conductivity
ρ Density
Cp Specific heat
VI. RESULTS & DISCUSSIONS The total heat transfer rate and temperature distribution of the blades depends on the heat transfer
coefficient for gases and thermal conductivity of material. The ANSYS analysis is carried out. It is observed that
the maximum heat flux is attained at the temperature of 120°C at trailing edges of the blades ant the minimum
temperature is attained 119.22 °C at the leading edges of the blades. However the temperature distribution is
very less in the blade is expected during the time interval. It I observed for the temperature is shown by fig1,. It
is observing that fig2 is thermal heat flux.
Fig 1. Model (A4) > Steady-State Thermal (A5) > Solution (A6) > Temperature
Fig 2. Model (A4) > Steady-State Thermal (A5) > Solution (A6) > Total Heat Flux
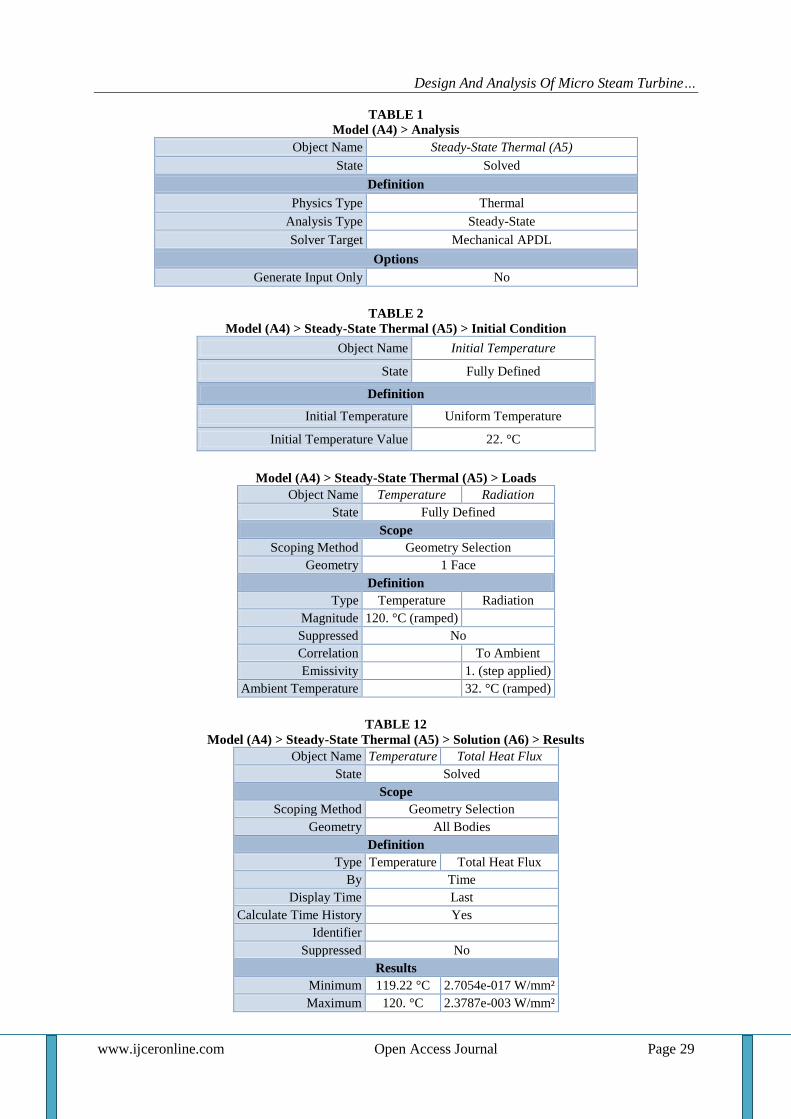
Design And Analysis Of Micro Steam Turbine…
www.ijceronline.com Open Access Journal Page 29
TABLE 1
Model (A4) > Analysis
Object Name Steady-State Thermal (A5)
State Solved
Definition
Physics Type Thermal
Analysis Type Steady-State
Solver Target Mechanical APDL
Options
Generate Input Only No
TABLE 2
Model (A4) > Steady-State Thermal (A5) > Initial Condition
Object Name Initial Temperature
State Fully Defined
Definition
Initial Temperature Uniform Temperature
Initial Temperature Value 22. °C
Model (A4) > Steady-State Thermal (A5) > Loads
Object Name Temperature Radiation
State Fully Defined
Scope
Scoping Method Geometry Selection
Geometry 1 Face
Definition
Type Temperature Radiation
Magnitude 120. °C (ramped)
Suppressed No
Correlation To Ambient
Emissivity 1. (step applied)
Ambient Temperature 32. °C (ramped)
TABLE 12
Model (A4) > Steady-State Thermal (A5) > Solution (A6) > Results
Object Name Temperature Total Heat Flux
State Solved
Scope
Scoping Method Geometry Selection
Geometry All Bodies
Definition
Type Temperature Total Heat Flux
By Time
Display Time Last
Calculate Time History Yes
Identifier
Suppressed No
Results
Minimum 119.22 °C 2.7054e-017 W/mm²
Maximum 120. °C 2.3787e-003 W/mm²

Design And Analysis Of Micro Steam Turbine…
www.ijceronline.com Open Access Journal Page 30
Information
Time 1. s
Load Step 1
Substep 1
Iteration Number 2
Integration Point Results
Display Option Averaged
Model (A4) > Steady-State Thermal (A5) > Temperature
Model (A4) > Steady-State Thermal (A5) > Radiation
VII. CONCLUSION Micro turbines are relatively new in the market and are attracting wide attention due to their varied
applications. Development of a sophisticated engineering product like micro turbine is a continuous process. A
lot of work is yet to be done on the design aspects before the micro turbine can be readied for market
consumption. The design procedure has to take into various other parameters to make it suitable for practical
applications. Also, manufacturing of such complex shapes of minute size is another ongoing research work.
Further research into the design and manufacture process would result in production of even better micro
turbines.
REFERENCES [1 Charles F and Orrin J,” A refrigerative expansion turbine with a tangential inward flow pattern”, International Journal in 1914.
[2]. R. K. Sahoo, S. K. Sarangi., “Focuses on design and development of turbo expander” . [3]. Charles Lang's “Research into 3D modeling CAD software”, in 1965.
[4]. Avions Marcel Dassault, “Purchased a source-code license of CADAM” in 1975.
[5]. www.High Temperature materials.com [7]. www. Steam turbine blade materials.com

ISSN (e): 2250 – 3005 || Volume, 05 || Issue, 09 ||September – 2015 ||
International Journal of Computational Engineering Research (IJCER)
www.ijceronline.com Open Access Journal Page 31
MECHANICAL CHARACTERIZATION OF BIO-FIBRE AND
GLASS FIBRE REINFORCED POLYESTER COMPOSITE
LAMINATE JOINTS
S.Rameshkumar* *Asst.proffesor/Department of Mechanical Engineering , Mahendra college of Engineering,
Tamilnadu, India.
I. Introduction
A hybrid composite which has more than one fiber as a reinforcement phase embedded into a single
matrix phase. Hybridization provides the designers with an added degree of freedom in manufacturing
composites to achieve high specific stiffness, high specific strength, enhanced dimensional stability, energy
absorption, increased failure strain, corrosive resistance as well as reduced cost during fabrication Composites
made of a single reinforcing material system may not be suitable if it undergoes different loading conditions
during the service life. Hybrid composites may be the best solution for such applications. Normally, one of the
fibers in a hybrid composite is a high- modulus and high-cost fiber such as carbon, boron and the other is
usually a low-modulus fiber such as E-glass, Kevlar. The high-modulus fiber provides the stiffness and load
bearing qualities, whereas the low-modulus fiber makes the composite more damage tolerant and keeps the
material cost low. The mechanical properties of a hybrid composite can be varied by changing volume ratio and
stacking sequence of different plies [3-5]. High-modulus fibers such as carbon, boron are widely used in many
aerospace applications because of their high specific modulus. However, the impact strength of composites
made of such high-modulus fibers is generally lower than conventional steel alloys or glass reinforced
composites. An effective method of improving the impact properties of high-modulus fiber composites is to add
some percentage of low-modulus fibers like E-glass [6]. Most composite materials experience time varying
internal disturbance of moisture and temperature during their service life time which can cause swelling and
plasticization of the resin, distortion of laminate, deterioration of fiber/resin bond etc. Because of the high
performance laminates and composites especially in aerospace, the effect of moisture/temperature environment
has become an important aspect of composite material behavior. In this project work the behavior of glass and
jute hybrid composites with polyester resin was described.
II. MATERIALS, METHODS AND PREPARATION OF COMPOSITE This paper describes the details of processing of the composites and the experimental procedures followed for
their mechanical characterization. The raw materials used in this work are
1. Glass fiber
2. Jute fiber
3. Polyester resin
Abstract Composites are versatile and convenient in diverse application such as automotive and aeronaut
industry, constructional materials, civil and military applications and many more. Natural fiber
composites are currently being used in mostly non-structural applications [1]. Natural fibers are
being widely used to substitute artificial glass and carbon fibers in polymer composites. The aim of
present work was to focus on the hybridization of natural fiber (jute) and synthetic fiber (E-glass)
with polyester resin for applications in the aerospace industry [1]. The mechanical properties such
as tensile, impact, flexural test and water absorption rate of hybrid glass/jute fiber reinforced
polyester composites were determined. Laminates were fabricated by hand lay-up technique [2].
Then the mechanical properties of lamina prepared with different compositions of natural and
synthetic fibers are compared. Total fiber weight fraction was maintained at 50%. Specimen
preparation and testing was carried out as per ASTM standards [1], [2].
Key words: natural fiber, synthetic fiber, polyester resin & fiber weight fraction 50%.

Mechanical Characterization Of Bio-Fibre…
www.ijceronline.com Open Access Journal Page 32
2.1. GLASS FIBER
Glass fiber is commonly used as an insulating material. It is also used as a reinforcing agent for
many polymer products; to form a very strong and light fiber-reinforced polymer (FRP) composite
material called glass-reinforced plastic (GRP), popularly known as "fiberglass". Glass fiber has roughly
comparable properties to other fibers such as polymers and carbon fiber. Although not as strong or as rigid as
carbon fiber, it is much cheaper and significantly less brittle. The glass fiber is shown in figure.
Glass Fiber
Glass-reinforced plastic (GRP) is a composite material or fiber-reinforced plastic made of
a plastic reinforced by fine glass fibers. Like graphite-reinforced plastic, the composite material is commonly
referred to as fiberglass. The glass can be in the form of a chopped strand mat (CSM) or a woven fabric. As with
many other composite materials (such as reinforced concrete), the two materials act together, each overcoming
the deficits of the other. Whereas the plastic resins are strong in compressive loading and relatively weak
in tensile strength, the glass fibers are very strong in tension but tend not to resist compression [7-17]. By
combining the two materials, GRP becomes a material that resists both compressive and tensile forces well.
Manufacturers of glass-fiber insulation can use recycled glass. Recycled glass fiber has up to a 40% recycled
glass.
PROPERTIES OF E-GLASS FIBER:
Fiber type Tensile
strength
(MPa)
Compressive
strength
(Mpa)
Density
(g/cm3)
Thermal
expansion
µm/(m·°C)
Softening T
(°C)
E-glass 3445 1080 2.85 5.4 846
2.2. JUTE FIBER
The industrial term for jute fiber is raw jute. The fibers are off-white to brown, and 1–4 meters (3–
13 feet) long. Jute is also called "the golden fiber" for its color and high cash value. Jute is a rain-fed crop with
little need for fertilizer or pesticides, in contrast to cotton's heavy requirements. Production is concentrated
in India, mainly Bengal, and mostly in Bangladesh. The jute fiber comes from the stem and ribbon (outer skin)
of the jute plant [7-17]. The fibers are first extracted by retting. The retting process consists of bundling jute
stems together and immersing them in slow running water. There are two types of retting: stem and ribbon.
After the retting process, stripping begins; women and children usually do this job. In the stripping process, non-
fibrous matter is scraped off, then the workers dig in and grab the fibers from within the jute stem.
Jute fiber
PROPERTIES OF JUTE FIBER:
Density of 1.47 gm/cc.
Average fineness-20 Denier (900 meters of filament).
Average extension at break-1 .2%.
Average toughness index-0.02.
Average stiffness- 330 gm/denier.

Mechanical Characterization Of Bio-Fibre…
www.ijceronline.com Open Access Journal Page 33
2.3. POLYESTER RESIN
Polyester resins are the condensation products of dicarboxylic acid with dihydroxy alcohols. For
example, terene or terylene or Dacron is saturated polyester formed by condensation of ethylene glycol and
terephthaic acid. Polyester resin material is a three-component material. However, the manufacturer mixes the
two reactive parts. At the time of application, a catalyst is added to start the reaction. Then the material is
sprayed onto the roadway. Reflective beads are added using a separate gun located directly behind the paint gun.
COMPONENTS OF RESIN
Pigments
The material is composed of pigments that are very similar to those used in other pavement markings.
The pigments are used to impart color, hiding and other desirable properties, like all other markings. However,
these pigments are pre-ground prior to being blended into the resin.
Resins
The marking has polyester resin that is mixed with a reactive solvent, a styrene compound. Normally,
solvents are expected to evaporate and not participate in the setting up process. In addition to acting as a solvent,
the styrene participates in the polymerization process. In order for this material to begin to react, a catalyst must
be added to initiate the reaction.
Additives Driers are added to assist in the curing process. Beads are uniformly applied across the entire width of
the marking by either a gravity or pressurized bead applicator located immediately behind the polyester spray
gun. Beads are generally applied at a rate of 8 lb/gal.
III. METHODOLOGY The full methodology of this project work is shown in figure.
Fabrication by compression molding method
Testing of Fabricated Fiber composites
Testing of mechanical properties
IV. FABRICATION OF COMPOSITE MATERIALS This topic deals with the fabrication stages carried out to obtain the composite material. The materials used
in our fabrication process are as follows:
E-glass fiber (250 g.s-m).
Polyester (GP resin).
Jute fiber.
Hydrogen peroxide as Accelerator.
Cobalt as catalyst.
HAND LAY-UP METHOD:
The composite laminate is fabricated using hand lay-up method. It is simple and mostly used method.
The process of composite fabrication using hand lay-up process is listed below,
Initially, the E-glass fiber mats are cut into 270 x 270 mm size and jute fibers are cut in the size of 150
mm.
Then, prepare the matrix by mixing the polyester resin and Hardener in the ratio of 10:1
Tensile
Test
Flexural
Test
Impact
Test
Water
absorption
Test
test

Mechanical Characterization Of Bio-Fibre…
www.ijceronline.com Open Access Journal Page 34
Then the wax is applied and the some amount of polyester resin is applied in the die.
Then the required amount of glass fiber and jute fiber is placed layer by layer in the square shaped die
of dimension 300x300x3 mm.
After placing the fibers the polyester resin is poured into the die and again the required amount of
polyester resin is poured into the die.
Then the die is closed for one hour and 70kg of weight is placed on the die.
After one hour, the die is opened and the hybrid laminate of jute fiber and glass fiber is taken out.
Utmost care has been taken to maintain uniformity and homogeneity of the composite. The fabricated
specimen is shown in figure.
Composite Laminates
The composite laminate is fabricated for different fiber weight (%) that is shown in table
Composites Glass fiber
Weight (%)
Jute fiber
Weight (%)
Resin weight (%)
S1 - 50 50
S2 50 - 50
S3 37.5 12.5 50
S4 25 25 50
S5 12.5 37.5 50
Designation of Composites
V. EXPERIMENT PROCEDURE CUTTING OF LAMINATES INTO SAMPLES OF DESIRED DIMENSIONS:
A WIRE HACKSAW blade was used to cut each laminate into smaller pieces, for various experiments
and the sized specimens are shown in the following figures.
TENSILE TEST- Sample was cut into the size of (250x25x3) mm in accordance with ASTM standards D-638.
Tensile test specimen
FLEXURAL TEST- Sample was cut into flat shape (125x13x3) mm, in accordance with ASTM standards D-
790.

Mechanical Characterization Of Bio-Fibre…
www.ijceronline.com Open Access Journal Page 35
Flexural test specimen
IMPACT TEST- Sample was cut into flat shape (65x13x3)mm, in accordance with ASTM standard D-790.
Impact test specimen
WATER ABSORPTION TEST-Sample was cut into flat shape (30x30x3) mm.
Water absorption test specimen
TENSILE TEST WITH BOLT JOINT- Sample was cut into the size of (102x25x3) mm in accordance with
ASTM standard D-5868-01. Two plates are made up of for same size and made the single lab joint for testing
the tensile strength. One hole is drilled at each plate at the size of 6mm diameter and the single lab joint is made
with the help of 6mm bolt and nut.
Tensile test specimen with bolt joint
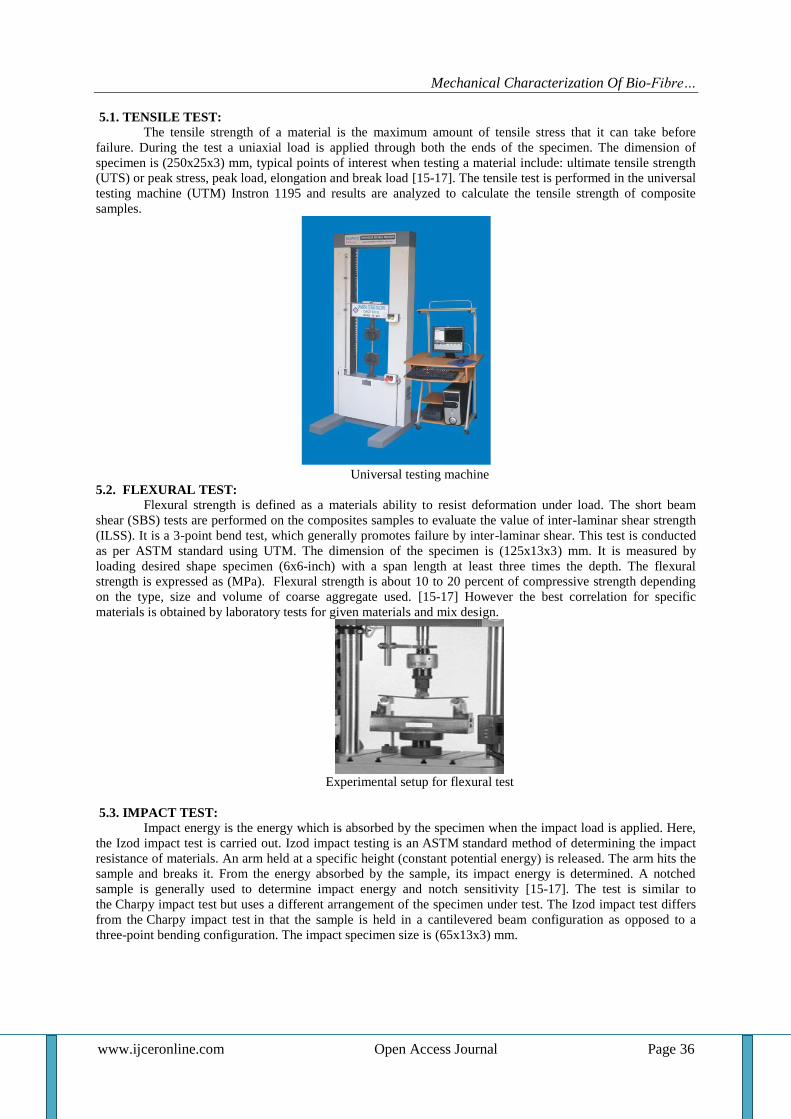
Mechanical Characterization Of Bio-Fibre…
www.ijceronline.com Open Access Journal Page 36
5.1. TENSILE TEST: The tensile strength of a material is the maximum amount of tensile stress that it can take before
failure. During the test a uniaxial load is applied through both the ends of the specimen. The dimension of
specimen is (250x25x3) mm, typical points of interest when testing a material include: ultimate tensile strength
(UTS) or peak stress, peak load, elongation and break load [15-17]. The tensile test is performed in the universal
testing machine (UTM) Instron 1195 and results are analyzed to calculate the tensile strength of composite
samples.
Universal testing machine
5.2. FLEXURAL TEST: Flexural strength is defined as a materials ability to resist deformation under load. The short beam
shear (SBS) tests are performed on the composites samples to evaluate the value of inter-laminar shear strength
(ILSS). It is a 3-point bend test, which generally promotes failure by inter-laminar shear. This test is conducted
as per ASTM standard using UTM. The dimension of the specimen is (125x13x3) mm. It is measured by
loading desired shape specimen (6x6-inch) with a span length at least three times the depth. The flexural
strength is expressed as (MPa). Flexural strength is about 10 to 20 percent of compressive strength depending
on the type, size and volume of coarse aggregate used. [15-17] However the best correlation for specific
materials is obtained by laboratory tests for given materials and mix design.
Experimental setup for flexural test
5.3. IMPACT TEST:
Impact energy is the energy which is absorbed by the specimen when the impact load is applied. Here,
the Izod impact test is carried out. Izod impact testing is an ASTM standard method of determining the impact
resistance of materials. An arm held at a specific height (constant potential energy) is released. The arm hits the
sample and breaks it. From the energy absorbed by the sample, its impact energy is determined. A notched
sample is generally used to determine impact energy and notch sensitivity [15-17]. The test is similar to
the Charpy impact test but uses a different arrangement of the specimen under test. The Izod impact test differs
from the Charpy impact test in that the sample is held in a cantilevered beam configuration as opposed to a
three-point bending configuration. The impact specimen size is (65x13x3) mm.

Mechanical Characterization Of Bio-Fibre…
www.ijceronline.com Open Access Journal Page 37
Izod impact testing machine
5.4. WATER ABSORPTION TEST:
The water absorption test is used to find the water absorption rate. The effect of water absorption on jute and
glass reinforced hybrid composites were investigated. The specimens were dried in an oven at 500C and then
they were allowed to cool till they reached room temperature. The specimens were weighed to an accuracy of
0.1mg. Water absorption tests were conducted by immersing the composite specimens in distilled water in
plastic tub at room temperature for 24 hours duration. Once in 24 hours, the specimens were taken out from the
water and all surface water was removed with a clean dry cloth and the specimens were reweighed to the nearest
0.1 mg. From these two readings, the water absorption rate (%) was calculated. The specimen size is (30×30×3)
mm.
VI. MECHANICAL CHARACTERISTICS OF COMPOSITES The characterization of the composites reveals that the fiber weight (%) is having significant effect on
the mechanical properties of composites. The properties of the composites with different fiber weight (%) under
this investigation are presented in Table
Composites Tensile strength
(MPa)
Tensile strength
with bolt
(MPa)
Flexural
strength
(MPa)
Impact
Energy(J)
Water
absorption (%)
S1 40.05 23.946 122.784 0.833 13.37
S2 195.857 44.187 247.545 2.106 0.24
S3 114.126 34.897 155.220 1.933 1.79
S4 78.395 35.864 66.153 1.733 5.59
S5 46.643 35.856 132.65 2 5.74
Mechanical properties of the composites
6.1. EFFECT OF FIBER WEIGHT (%) ON TENSILE STRENGTH
The test results for tensile strength are shown in Figure. The sample 1 and 2 shows the pure jute and
pure glass reinforced composites and in this composites, pure glass shows high tensile strength. The sample 3, 4
and 5 shows the tensile strength of hybrid composites and in this hybrid composites, the sample 3(i.e 37.5% of
glass and 12.5% of jute fiber) shows the better tensile strength. From the results it is seen that the tensile
strength of the composite increases with increase in glass fiber weight (%).
Effect of fiber weight (%) on tensile strength of composites

Mechanical Characterization Of Bio-Fibre…
www.ijceronline.com Open Access Journal Page 38
6.2. EFFECT OF FIBER WEIGHT (%) ON TENSILE STRENGTH WITH BOLT JOINT
The test results for tensile strength are shown in Figure. The sample 1 and 2 shows the pure jute and pure glass
reinforced composites and in this composites, pure glass shows high tensile strength. The sample 3, 4 and 5
shows the tensile strength of hybrid composites and in this hybrid composites, the sample 3(i.e 37.5% of glass
and 12.5% of jute fiber) shows the better tensile strength. From the results it is seen that the tensile strength of
the composite increases with increase in glass fiber weight (%).
Effect of fiber weight (%) on tensile strength of composites
6.3. EFFECT OF FIBER WEIGHT (%) ON FLEXURAL STRENGTH
The test results for flexural strength are shown in Figure. The sample 1 and 2 shows the pure jute and
pure glass reinforced composites and in this composites, pure glass shows high flexural strength. The sample 3,
4 and 5 shows the flexural strength of hybrid composites and in this hybrid composites, the sample 3(i.e 37.5%
of glass and 12.5% of jute fiber) shows the better flexural strength. From the results it is seen that the flexural
strength of the composite increases with increase in glass fiber weight (%).
Effect of fiber length on flexural strength of composites
6.4. EFFECT OF FIBER WEIGHT (%) ON IMPACT ENERGY
The test results for impact energy are shown in Figure. The sample 1 and 2 shows the pure jute and
pure glass reinforced composites and in this composites, pure glass shows high impact energy. The sample 3, 4
and 5 shows the impact energy of hybrid composites and in this hybrid composites, the sample 3(i.e 37.5% of
glass and 12.5% of jute fiber) shows the better impact energy. From the results it is seen that the impact energy
of the composite increases with increase in glass fiber weight (%).
Effect of fiber length on impact energy of composites.
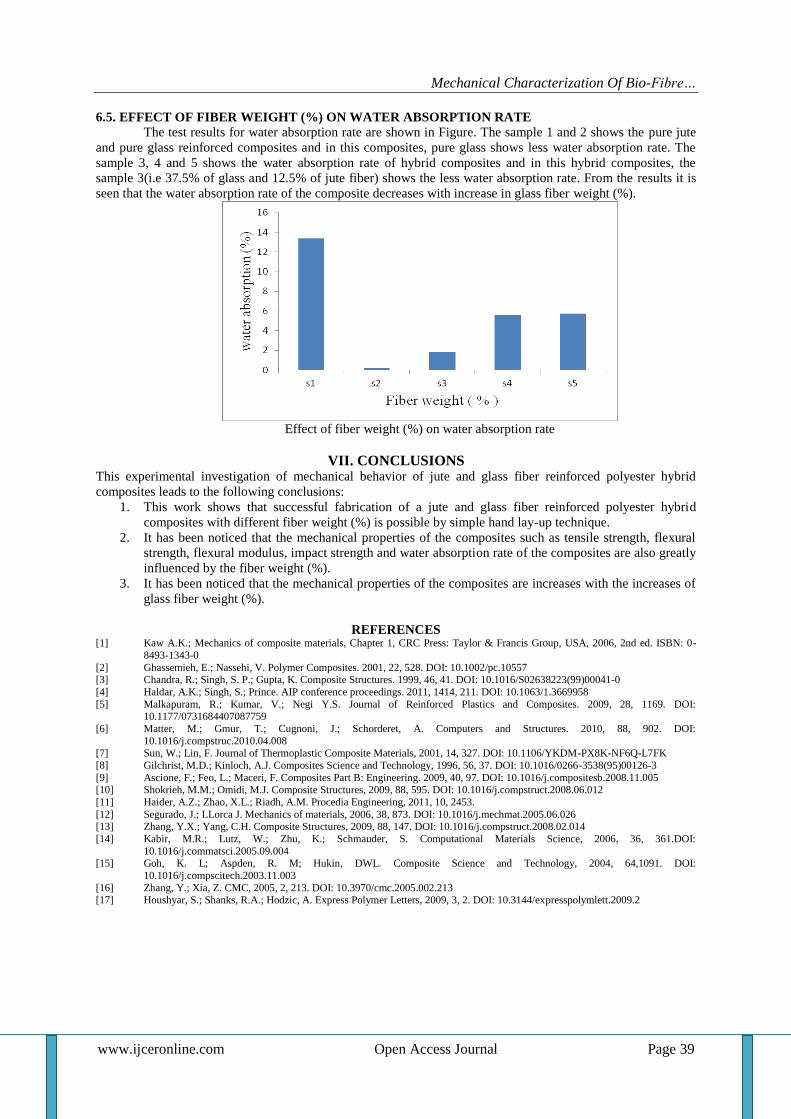
Mechanical Characterization Of Bio-Fibre…
www.ijceronline.com Open Access Journal Page 39
6.5. EFFECT OF FIBER WEIGHT (%) ON WATER ABSORPTION RATE
The test results for water absorption rate are shown in Figure. The sample 1 and 2 shows the pure jute
and pure glass reinforced composites and in this composites, pure glass shows less water absorption rate. The
sample 3, 4 and 5 shows the water absorption rate of hybrid composites and in this hybrid composites, the
sample 3(i.e 37.5% of glass and 12.5% of jute fiber) shows the less water absorption rate. From the results it is
seen that the water absorption rate of the composite decreases with increase in glass fiber weight (%).
Effect of fiber weight (%) on water absorption rate
VII. CONCLUSIONS This experimental investigation of mechanical behavior of jute and glass fiber reinforced polyester hybrid
composites leads to the following conclusions:
1. This work shows that successful fabrication of a jute and glass fiber reinforced polyester hybrid
composites with different fiber weight (%) is possible by simple hand lay-up technique.
2. It has been noticed that the mechanical properties of the composites such as tensile strength, flexural
strength, flexural modulus, impact strength and water absorption rate of the composites are also greatly
influenced by the fiber weight (%).
3. It has been noticed that the mechanical properties of the composites are increases with the increases of
glass fiber weight (%).
REFERENCES [1] Kaw A.K.; Mechanics of composite materials, Chapter 1, CRC Press: Taylor & Francis Group, USA, 2006, 2nd ed. ISBN: 0-
8493-1343-0
[2] Ghassemieh, E.; Nassehi, V. Polymer Composites. 2001, 22, 528. DOI: 10.1002/pc.10557 [3] Chandra, R.; Singh, S. P.; Gupta, K. Composite Structures. 1999, 46, 41. DOI: 10.1016/S02638223(99)00041-0
[4] Haldar, A.K.; Singh, S.; Prince. AIP conference proceedings. 2011, 1414, 211. DOI: 10.1063/1.3669958
[5] Malkapuram, R.; Kumar, V.; Negi Y.S. Journal of Reinforced Plastics and Composites. 2009, 28, 1169. DOI: 10.1177/0731684407087759
[6] Matter, M.; Gmur, T.; Cugnoni, J.; Schorderet, A. Computers and Structures. 2010, 88, 902. DOI:
10.1016/j.compstruc.2010.04.008 [7] Sun, W.; Lin, F. Journal of Thermoplastic Composite Materials, 2001, 14, 327. DOI: 10.1106/YKDM-PX8K-NF6Q-L7FK
[8] Gilchrist, M.D.; Kinloch, A.J. Composites Science and Technology, 1996, 56, 37. DOI: 10.1016/0266-3538(95)00126-3
[9] Ascione, F.; Feo, L.; Maceri, F. Composites Part B: Engineering. 2009, 40, 97. DOI: 10.1016/j.compositesb.2008.11.005 [10] Shokrieh, M.M.; Omidi, M.J. Composite Structures, 2009, 88, 595. DOI: 10.1016/j.compstruct.2008.06.012
[11] Haider, A.Z.; Zhao, X.L.; Riadh, A.M. Procedia Engineering, 2011, 10, 2453.
[12] Segurado, J.; LLorca J. Mechanics of materials, 2006, 38, 873. DOI: 10.1016/j.mechmat.2005.06.026 [13] Zhang, Y.X.; Yang, C.H. Composite Structures, 2009, 88, 147. DOI: 10.1016/j.compstruct.2008.02.014
[14] Kabir, M.R.; Lutz, W.; Zhu, K.; Schmauder, S. Computational Materials Science, 2006, 36, 361.DOI:
10.1016/j.commatsci.2005.09.004 [15] Goh, K. L; Aspden, R. M; Hukin, DWL. Composite Science and Technology, 2004, 64,1091. DOI:
10.1016/j.compscitech.2003.11.003
[16] Zhang, Y.; Xia, Z. CMC, 2005, 2, 213. DOI: 10.3970/cmc.2005.002.213 [17] Houshyar, S.; Shanks, R.A.; Hodzic, A. Express Polymer Letters, 2009, 3, 2. DOI: 10.3144/expresspolymlett.2009.2

ISSN (e): 2250 – 3005 || Volume, 05 || Issue, 09 ||September – 2015 ||
International Journal of Computational Engineering Research (IJCER)
www.ijceronline.com Open Access Journal Page 40
Design and Analysis of a Rocker Arm
Jafar Sharief1, K.Durga Sushmitha
2
1Mtech student, Nimra College of engineering & technology, Ibrahimpattanam, AP, INDIA,
2Guide (Asst.Professor), Nimra College of engineering & technology, Ibrahimpattanam, AP, INDIA.
I. INTRODUCTION 1.1 Introduction and working of Rocker arm
Rocker arm is an important part of the valve train in fuel injection system providing not only the means of
actuating the valves through a fulcrum utilizing the lifter and the push rod but also provide a means of
multiplying the lift ratio. Cam shaft design has advanced in leaps and bounds over last three decades but
overhead valve engines with centrally located camshafts still use lifters and push rod and rocker arms as a
means of opening and closing the intake and exhaust valves in fuel injection pumps. Advancement in materials
used in construction of rocker arm for reducing the noise, weight and higher strength for efficient operation is
going on throughout the globe since long. The usual materials used for such purpose are Steel, Aluminum, and
Forged steel to Stainless steel, alloys and composites. The success to investigate the possibility creating a light
weight rocker arm that could provide a friction reducing fulcrum using needle bearings and a roller tip for
reduced friction between the rocker and the valve stem but still be less expensive than steel lies in the
development of composite rocker arms. Lighter mass at the valve is also allowed for increased speed while
strength of the material caters to durability. The rocker arm usually operates at 40-500 C and the maximum
pressure is exerted by the gas. Therefore in this investigation it has been thought proper to analyze a composite
rocker arm of high density polyethylene (HDPE) reinforced with short S-glass fibers of 10% volume fraction.
Finite element analysis may be carried out to determine the stresses and make a comparison between steel and
composite to predict the failure modes.
Fig.1 Rocker armFig.2 Position of Rocker arm
ABSTRACT Rocker arms are part of the valve-actuating mechanism. A rocker arm is designed to pivot on a pivot
pin or shaft that is secured to a bracket. The bracket is mounted on the cylinder head. One end of a
rocker arm is in contact with the top of the valve stem, and the other end is actuated by the camshaft.
In installations where the camshaft is located below the cylinder head, the rocker arms
are actuated by pushrods. The lifters have rollers which are forced by the valve springs to follow the
profiles of the cams. Failure of rocker arm is a measure concern as it is one of the important
components of push rod IC engines.Present work finds the various stresses under extreme load
condition. For this we are modeling the arm using design software and the stressed regions are
found out usingAnsys software. Here in this thesis we are observing that by changing different
materials how the stresses are varying in the rocker arm under extreme load condition. And after
comparing results we are proposing best suitable material for the rocker arm under extreme load
conditions.
Key words:Ansys, camshaft, pro-e and rocker arm

Design And Analysis of a Rocker…
www.ijceronline.com Open Access Journal Page 41
II. MODELLING BY USING PRO-E
Fig.3 Solid model Fig .4 Wire frame model
III. ANALYSIS BY ANSYS
Fig.5 Imported model Fig.6 Meshed model
Fig.7 Load distribution at endFig.8 Load distribution at pin Fig.9 Load distribution at pin and end
IV. RESULTS AND DISCUSSION 4.1 Structural analysis
4.1.1 Load distribution at end
a) Alloy steel -1
Fig.10 Total deformation Fig.11 Stress intensity
b) Alloy steel -2
Fig.12 Total deformation Fig.13 Stress intensity
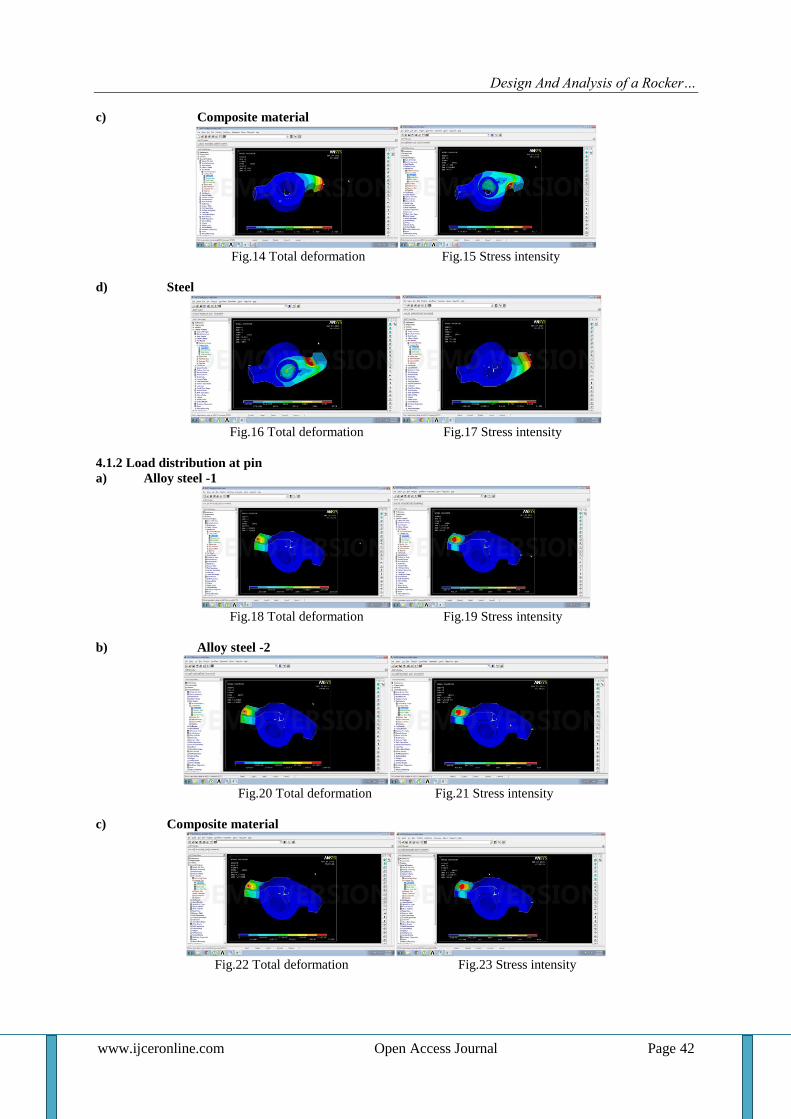
Design And Analysis of a Rocker…
www.ijceronline.com Open Access Journal Page 42
c) Composite material
Fig.14 Total deformation Fig.15 Stress intensity
d) Steel
Fig.16 Total deformation Fig.17 Stress intensity
4.1.2 Load distribution at pin
a) Alloy steel -1
Fig.18 Total deformation Fig.19 Stress intensity
b) Alloy steel -2
Fig.20 Total deformation Fig.21 Stress intensity
c) Composite material
Fig.22 Total deformation Fig.23 Stress intensity

Design And Analysis of a Rocker…
www.ijceronline.com Open Access Journal Page 43
d) Steel
Fig.24 Total deformation Fig.25 Stress intensity
4.1.3 Load distribution atboth pin and end
a) Alloy steel -1
Fig.26 Total deformation Fig.27 Stress intensity
b) Alloy steel -2
Fig.28 Total deformation Fig.29 Stress intensity
c) Composite material
Fig.30 Total deformation Fig.31 Stress intensity
d) Steel
Fig.32 Total deformation Fig.33 Stress intensity
4.2 Results and comparisons
4.2.1 Load at pin
SNO MATERIAL TOTAL
DEFORMATION
STRESS
INTENSITY
1 Alloy steel-1 .2262 4246
2 Alloy steel -2 .2364 4254
3 Composite .1785 4236
4 Steel .2476 4261
Table no.1 Load deformation at pin
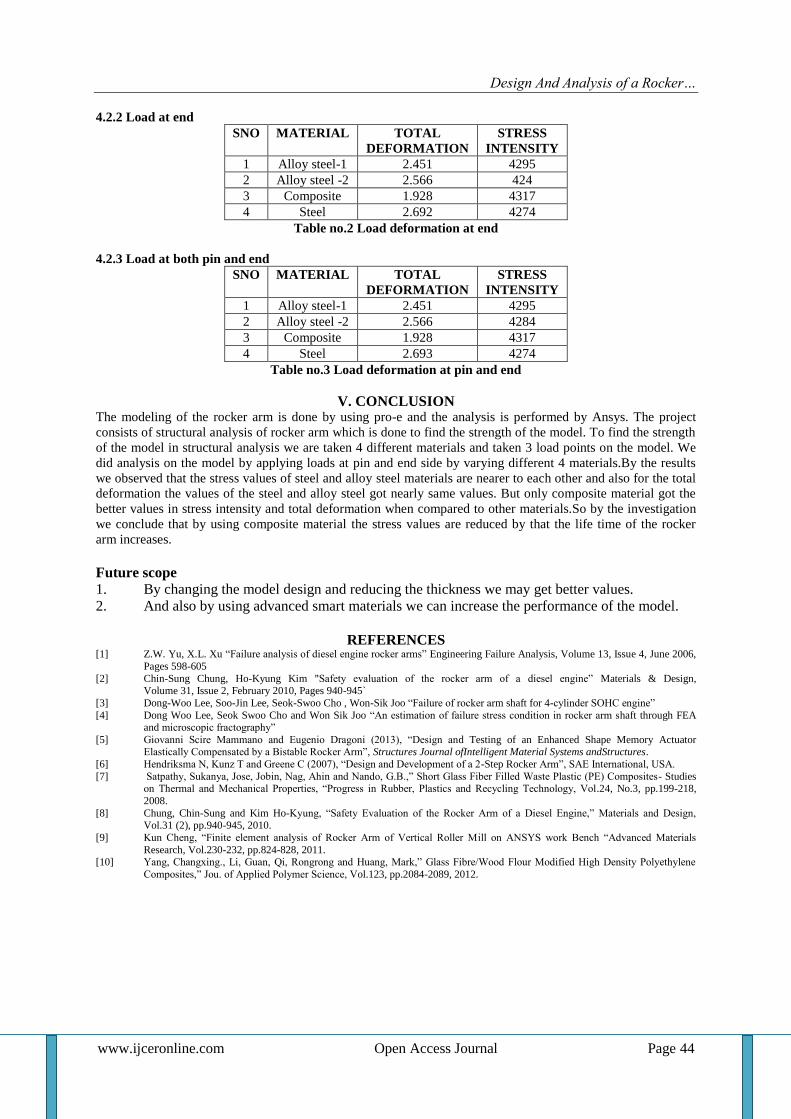
Design And Analysis of a Rocker…
www.ijceronline.com Open Access Journal Page 44
4.2.2 Load at end
SNO MATERIAL TOTAL
DEFORMATION
STRESS
INTENSITY
1 Alloy steel-1 2.451 4295
2 Alloy steel -2 2.566 424
3 Composite 1.928 4317
4 Steel 2.692 4274
Table no.2 Load deformation at end
4.2.3 Load at both pin and end
SNO MATERIAL TOTAL
DEFORMATION
STRESS
INTENSITY
1 Alloy steel-1 2.451 4295
2 Alloy steel -2 2.566 4284
3 Composite 1.928 4317
4 Steel 2.693 4274
Table no.3 Load deformation at pin and end
V. CONCLUSION The modeling of the rocker arm is done by using pro-e and the analysis is performed by Ansys. The project
consists of structural analysis of rocker arm which is done to find the strength of the model. To find the strength
of the model in structural analysis we are taken 4 different materials and taken 3 load points on the model. We
did analysis on the model by applying loads at pin and end side by varying different 4 materials.By the results
we observed that the stress values of steel and alloy steel materials are nearer to each other and also for the total
deformation the values of the steel and alloy steel got nearly same values. But only composite material got the
better values in stress intensity and total deformation when compared to other materials.So by the investigation
we conclude that by using composite material the stress values are reduced by that the life time of the rocker
arm increases.
Future scope
1. By changing the model design and reducing the thickness we may get better values.
2. And also by using advanced smart materials we can increase the performance of the model.
REFERENCES [1] Z.W. Yu, X.L. Xu “Failure analysis of diesel engine rocker arms” Engineering Failure Analysis, Volume 13, Issue 4, June 2006,
Pages 598-605
[2] Chin-Sung Chung, Ho-Kyung Kim "Safety evaluation of the rocker arm of a diesel engine” Materials & Design, Volume 31, Issue 2, February 2010, Pages 940-945`
[3] Dong-Woo Lee, Soo-Jin Lee, Seok-Swoo Cho , Won-Sik Joo “Failure of rocker arm shaft for 4-cylinder SOHC engine”
[4] Dong Woo Lee, Seok Swoo Cho and Won Sik Joo “An estimation of failure stress condition in rocker arm shaft through FEA and microscopic fractography”
[5] Giovanni Scire Mammano and Eugenio Dragoni (2013), “Design and Testing of an Enhanced Shape Memory Actuator Elastically Compensated by a Bistable Rocker Arm”, Structures Journal ofIntelligent Material Systems andStructures.
[6] Hendriksma N, Kunz T and Greene C (2007), “Design and Development of a 2-Step Rocker Arm”, SAE International, USA.
[7] Satpathy, Sukanya, Jose, Jobin, Nag, Ahin and Nando, G.B.,” Short Glass Fiber Filled Waste Plastic (PE) Composites- Studies on Thermal and Mechanical Properties, “Progress in Rubber, Plastics and Recycling Technology, Vol.24, No.3, pp.199-218,
2008.
[8] Chung, Chin-Sung and Kim Ho-Kyung, “Safety Evaluation of the Rocker Arm of a Diesel Engine,” Materials and Design, Vol.31 (2), pp.940-945, 2010.
[9] Kun Cheng, “Finite element analysis of Rocker Arm of Vertical Roller Mill on ANSYS work Bench “Advanced Materials
Research, Vol.230-232, pp.824-828, 2011. [10] Yang, Changxing., Li, Guan, Qi, Rongrong and Huang, Mark,” Glass Fibre/Wood Flour Modified High Density Polyethylene
Composites,” Jou. of Applied Polymer Science, Vol.123, pp.2084-2089, 2012.
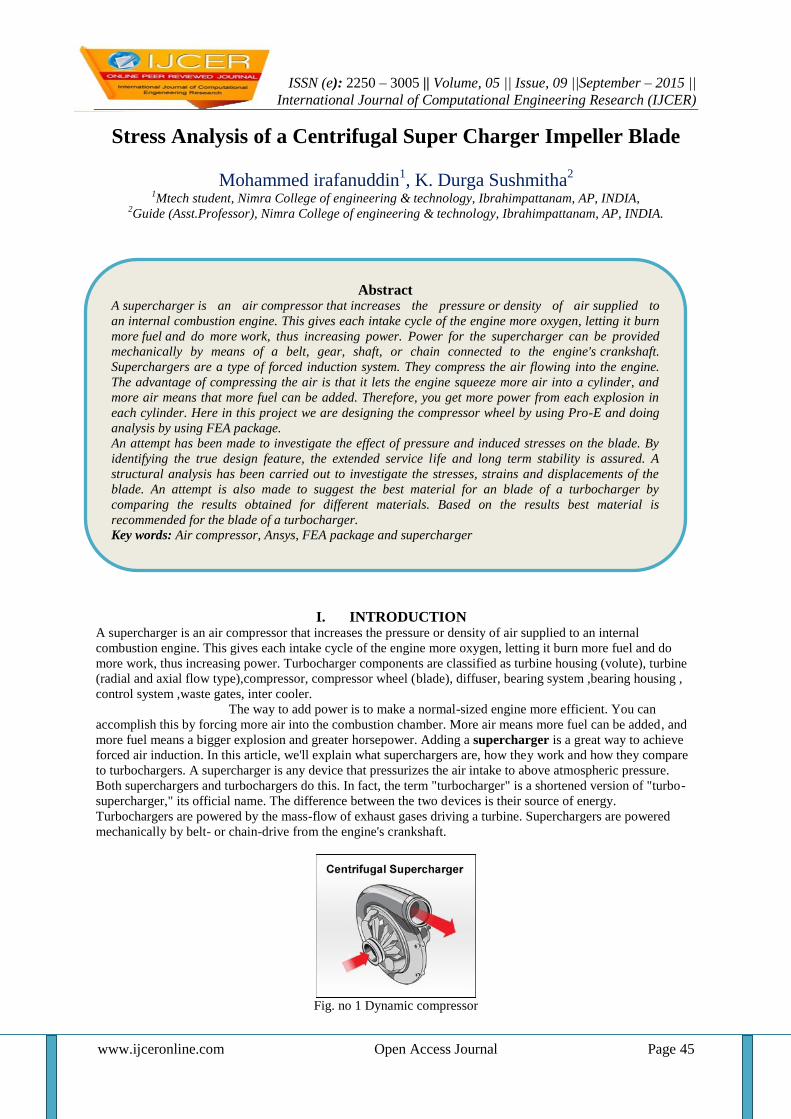
ISSN (e): 2250 – 3005 || Volume, 05 || Issue, 09 ||September – 2015 ||
International Journal of Computational Engineering Research (IJCER)
www.ijceronline.com Open Access Journal Page 45
Stress Analysis of a Centrifugal Super Charger Impeller Blade
Mohammed irafanuddin1, K. Durga Sushmitha
2
1Mtech student, Nimra College of engineering & technology, Ibrahimpattanam, AP, INDIA,
2Guide (Asst.Professor), Nimra College of engineering & technology, Ibrahimpattanam, AP, INDIA.
I. INTRODUCTION A supercharger is an air compressor that increases the pressure or density of air supplied to an internal
combustion engine. This gives each intake cycle of the engine more oxygen, letting it burn more fuel and do
more work, thus increasing power. Turbocharger components are classified as turbine housing (volute), turbine
(radial and axial flow type),compressor, compressor wheel (blade), diffuser, bearing system ,bearing housing ,
control system ,waste gates, inter cooler.
The way to add power is to make a normal-sized engine more efficient. You can
accomplish this by forcing more air into the combustion chamber. More air means more fuel can be added, and
more fuel means a bigger explosion and greater horsepower. Adding a supercharger is a great way to achieve
forced air induction. In this article, we'll explain what superchargers are, how they work and how they compare
to turbochargers. A supercharger is any device that pressurizes the air intake to above atmospheric pressure.
Both superchargers and turbochargers do this. In fact, the term "turbocharger" is a shortened version of "turbo-
supercharger," its official name. The difference between the two devices is their source of energy.
Turbochargers are powered by the mass-flow of exhaust gases driving a turbine. Superchargers are powered
mechanically by belt- or chain-drive from the engine's crankshaft.
Fig. no 1 Dynamic compressor
Abstract A supercharger is an air compressor that increases the pressure or density of air supplied to
an internal combustion engine. This gives each intake cycle of the engine more oxygen, letting it burn
more fuel and do more work, thus increasing power. Power for the supercharger can be provided
mechanically by means of a belt, gear, shaft, or chain connected to the engine's crankshaft.
Superchargers are a type of forced induction system. They compress the air flowing into the engine.
The advantage of compressing the air is that it lets the engine squeeze more air into a cylinder, and
more air means that more fuel can be added. Therefore, you get more power from each explosion in
each cylinder. Here in this project we are designing the compressor wheel by using Pro-E and doing
analysis by using FEA package.
An attempt has been made to investigate the effect of pressure and induced stresses on the blade. By
identifying the true design feature, the extended service life and long term stability is assured. A
structural analysis has been carried out to investigate the stresses, strains and displacements of the
blade. An attempt is also made to suggest the best material for an blade of a turbocharger by
comparing the results obtained for different materials. Based on the results best material is
recommended for the blade of a turbocharger.
Key words: Air compressor, Ansys, FEA package and supercharger

Stress Analysis of a Centrifugal Super…
www.ijceronline.com Open Access Journal Page 46
The Centrifugal supercharger is used in many applications including, but not limited to, automotive, truck,
marine, aircraft, motorcycles and UTV’s. Of these applications, they are most commonly utilized for increasing
horsepower in street vehicles and race applications. While the first practical centrifugal compressor was
designed in 1899, centrifugal superchargers evolved during World War II with their use in aircraft, where they
were frequently paired with their exhaust driven counterpart, the turbo supercharger. This term refers to the fact
that turbochargers are a specific type of centrifugal supercharger, one that is driven by a turbine.
Automotive Superchargers
Aircraft Superchargers
Centrifugal superchargers have become popular in the aftermarket as a bolt-on addition to improve
performance. By design, centrifugal superchargers allow for easy integration of air-to-air or air-to-water inter
cooling.
Superchargers in aircraft play an important role by providing additional air pressure at higher altitudes. Because
air pressure decreases at high altitudes, air compression is necessary in order to keep the airplane’s engine
running at maximum efficiency.
II. MODELLING OF COMPRESSOR BLADE
Fig. no 2 Solid model of compressor
Fig. no 3 Solid model of compressorblade
Fig. no 4 wire frame model of compressor blade
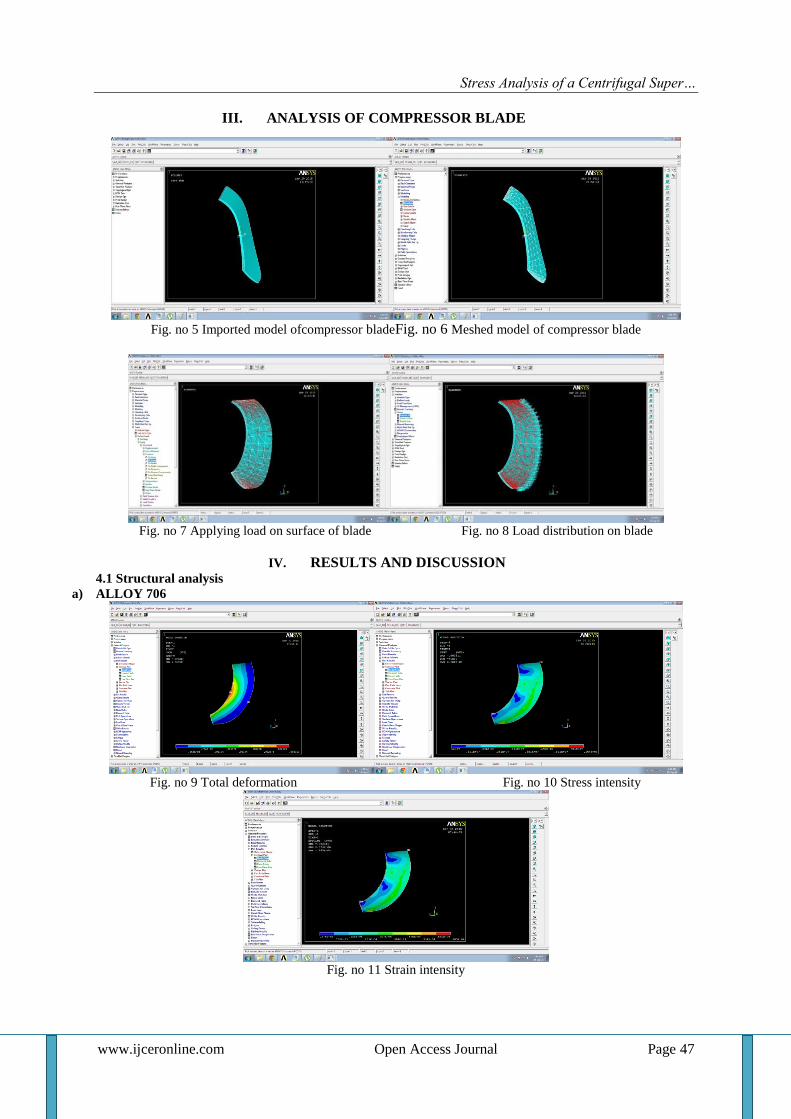
Stress Analysis of a Centrifugal Super…
www.ijceronline.com Open Access Journal Page 47
III. ANALYSIS OF COMPRESSOR BLADE
Fig. no 5 Imported model ofcompressor bladeFig. no 6 Meshed model of compressor blade
Fig. no 7 Applying load on surface of blade Fig. no 8 Load distribution on blade
IV. RESULTS AND DISCUSSION
4.1 Structural analysis
a) ALLOY 706
Fig. no 9 Total deformation Fig. no 10 Stress intensity
Fig. no 11 Strain intensity

Stress Analysis of a Centrifugal Super…
www.ijceronline.com Open Access Journal Page 48
b) Composite alloy
Fig. no 12 Total deformation Fig. no 13 Stress intensity
Fig. no 14 Strain intensity
c) Steel
Fig. no 15 Total deformation Fig. no 16 Stress intensity
Fig. no 17 Strain intensity

Stress Analysis of a Centrifugal Super…
www.ijceronline.com Open Access Journal Page 49
4.2 Results comparison
SNO MATERIAL TOTAL
DEFORMATION
STRAIN
INTENSITY
1 Alloy 706 .003311 .685E-04
2 Composite alloy .002982 .597E-04
3 Steel .003423 .676E-04
Table no 1. Result comparison of compressor blade
V. Conclusion The analysis of supercharger compressor blade done to investigate the effect of pressure and induced stresses on
the blade. A structural analysis has been carried out to observe the stresses, strains and displacements of the
blade.
The analysis is performed by two alloy materials with actual steel material.
After the analysis the comparison is made.
By those values we observed that the stress and deformation values of the actual material steel and alloy
706 are nearly same.
And we conclude that the stress values of the composite alloy are better than the other two materials.
The deformation is also less for the composite alloy when compared to other two materials.
So we suggest composite alloy material to the companies to increase the performance of the super charger
compressor blade.
REFERENCES [1] Dipl.-Ing. Jonas Belz and Dipl.-Ing. Ralph-Peter Müller “rapid Design and Flow Simulations for Turbocharger Components” EASC
ANSYS Conference 2009 RAPID, CFDnetwork® Engineering, CFturbo® Software & Engineering GmbH. [2] MeinhardSchobeiri. Turbo machinery Flow Physics and Dynamic Performance. Springer, 2005.
[3] Kirk, R. G., 1980, “Stability and Damped Critical Speeds: How to Calculate and Interpret the Results,”
[4] Compressed Air and Gas Institute Technical Digest, 12(2), pp. 1-14. [5] Alsaeed, A. A., 2005, “Dynamic Stability Evaluation of an Automotive Turbocharger Rotor- Bearing System,” M.S. Thesis, Virginia
Tech Libraries, Blacksburg, VA.
[6] Encyclopedia [7] Wickypedia
[8] Machine design text book by RS kurmi
[9] Material Handbook of High Performance Alloys, Special Metals Corp., (2001) Mikio Oi, Mariko Suzuki, Natsuko Matsuura “Structural Analysis and Shape Optimization in Turbocharger Development” published in Ishikawajima-Harima Heavy Industries Co.,
Ltd.
[10] V Rammurti (iitm),D.A Subramani (TEL), Dhridhara (TEL) “Free vibration analysis of turbocharger centrifugal compressor blade” published in mech march .theory vol 30,No 4, pp 619-628,1995 Elsevier science Ltd
Related Documents