INDIAN JOURNAL OF VETERINARY AND ANIMAL SCIENCES RESEARCH (Bi-monthly) EDITORIAL BOARD Chief Editor Dr.C.Balachandran Vice-Chancellor Tamil Nadu Veterinary and Animal Sciences University Madhavaram Milk Colony, Chennai – 600 051 Editor Associate Editor Dr.T.J.Harikrishnan Director of Research Tamil Nadu Veterinary and Animal Sciences University Madhavaram Milk Colony Chennai – 600 051 Dr.G.Dhinakar Raj Director, CAHS Tamil Nadu Veterinary and Animal Sciences University, Madhavaram Milk Colony, Chennai – 600 051, India Members Dr.Geetha Ramesh Professor and Head Dept.of Veterinary Anatomy Madras Veterinary College Chennai – 7 Dr.C.Valli Professor and Head Institute of Animal Nutrition Kattupakkam – 603203 Dr.V.Leela Professor and Head Dept.of Veterinary Physiology Madras Veterinary College, Chennai – 7 Dr.Cecilia Joseph Professor and Head Department of Veterinary Gynaecology & Obstetrics, Madras Veterinary College Chennai -7 Dr.P.Kumaravel Professor Directorate of Research Tamil Nadu Veterinary and Animal Sciences University Madhavaram Milk Colony, Chennai – 51 Dr.B.Samuel Masilamoni Ronald Professor Department of Veterinary Microbiology Madras Veterinary College Chennai - 7 Dr.K.Jeyaraja Professor Department of Veterinary Clinical Medicine Madras Veterinary College, Chennai -7 Dr.C.Soundararajan Professor Department of Veterinary Parasitology Madras Veterinary College, Chennai -7 Dr.K.Tilak Pon Jawahar Professor Department of Animal Genetics & Breeding Madras Veterinary College, Chennai -7 Dr.M.Parthiban Professor Department of Animal Biotechnology Madras Veterinary College, Chennai -7 Vol. 48 January - February 2019 No. 1

Welcome message from author
This document is posted to help you gain knowledge. Please leave a comment to let me know what you think about it! Share it to your friends and learn new things together.
Transcript
INDIAN JOURNAL OF VETERINARY AND ANIMAL SCIENCES RESEARCH (Bi-monthly)
EDITORIAL BOARD
Chief Editor Dr.C.Balachandran
Vice-Chancellor Tamil Nadu Veterinary and Animal Sciences University
Madhavaram Milk Colony, Chennai – 600 051
Editor Associate Editor
Dr.T.J.Harikrishnan Director of Research
Tamil Nadu Veterinary and Animal Sciences University
Madhavaram Milk Colony Chennai – 600 051
Dr.G.Dhinakar Raj Director, CAHS Tamil Nadu Veterinary and Animal Sciences University, Madhavaram Milk Colony, Chennai – 600 051, India
MembersDr.Geetha Ramesh
Professor and Head Dept.of Veterinary Anatomy
Madras Veterinary College Chennai – 7
Dr.C.Valli Professor and Head Institute of Animal Nutrition Kattupakkam – 603203
Dr.V.Leela Professor and Head
Dept.of Veterinary Physiology Madras Veterinary College, Chennai – 7
Dr.Cecilia Joseph Professor and Head Department of Veterinary Gynaecology & Obstetrics, Madras Veterinary College Chennai -7
Dr.P.Kumaravel Professor
Directorate of Research Tamil Nadu Veterinary and
Animal Sciences University Madhavaram Milk Colony, Chennai – 51
Dr.B.Samuel Masilamoni Ronald Professor Department of Veterinary Microbiology Madras Veterinary College Chennai - 7
Dr.K.Jeyaraja Professor
Department of Veterinary Clinical Medicine Madras Veterinary College, Chennai -7
Dr.C.Soundararajan Professor Department of Veterinary Parasitology Madras Veterinary College, Chennai -7
Dr.K.Tilak Pon Jawahar Professor
Department of Animal Genetics & Breeding Madras Veterinary College, Chennai -7
Dr.M.Parthiban Professor Department of Animal Biotechnology Madras Veterinary College, Chennai -7
Vol. 48 January - February 2019 No. 1

INDIAN JOURNAL OF VETERINARY AND ANIMAL SCIENCES RESEARCH(Bi-monthly)
Dr. Yung-Fu ChangDirector, Infectious Disease Research Laboratory
Animal Health Diagnostic CenterProfessor
Department of Population Medicine and Diagnostic Sciences
C1-114, Vet Medical CenterCollege of Veterinary Medicine
Cornell University, IthacaNew York 14853-5786, USA
Dr. John Gilleard, BVSc, Ph.D, Dip EVPC, MRCVSDirector of Research
Dept. of Comparative Biology and Experimental Medicine
Faculty of Veterinary Medicine University of Calgary
3330, Hospital Drive NWCalgaryAlberta Canada
Dr. Puliyur S. Mohankumar, B.V.Sc., Ph.D.Professor
Department of Biomedical Sciences & Diagnostic ImagingCollege of Veterinary Medicine
University of GeorgiaAthens, GA 30602,USA
Dr. Damer Blake, MSc, Ph.D, PGC Vet Ed, FHEALecturer in Molecular Parasitology
Dept. of Pathology and Pathogen BiologyThe Royal Veterinary College
University of LondonHatfield, Herts AL 9 7TA
United Kingdom
Prof. Dr. Terry SpithillCo-Director of AgriBio
The Centre for AgriBio ScienceFaculty of Science, Technology & Engineering
School of Life Sciences, La Trobe University
5, Ring Road,BundooraMelbourne Victoria 3086
Australia
INTERNATIONAL EDITORIAL ADVISORY

Attention to Contributors
The Editorial Board of Indian Journal of Veterinary and Animal Sciences Research has decided to collect Rs.500/- (Rupees Five hundred only) as processing fee in accordance with the order of Registrar, TANUVAS-(U.S.O.No.500601/G4/2016 Proc.No. 5639/G4/2016 dt 3.5.2016),from the authors at the time of submission of articles for publication in the Journal. This would help the authors to hasten the publication of their articles without any delay.
Hence, the corresponding author is requested to enclose a demand draft for Rs.500/- in favour of “The Editor, IJVASR & Director of Research, TANUVAS, Chennai-600051”along with the manuscript during submission. The articles may be addressed to the Editor, IJVASR & Director of Research, TANUVAS, Chennai-51. The corresponding authors are also requested to mention their contact phone number and E-mail address.
Chief Editor
Review articles invited from eminent Scientists
The Editorial Board of Indian Journal of Veterinary and Animal Sciences
Research invites review articles from eminent research scientists in the field of
Veterinary and Fisheries Sciences on the latest/ current topics of interest for publication
in the Journal. The review article (both hard and soft copy) may please be sent to the
Editor/Associate Editor, Indian Journal of Veterinary and Animal Sciences Research
for publication.
Chief Editor

INDIAN JOURNAL OF VETERINARY AND ANIMAL SCIENCES RESEARCH(Formerly Tamil Nadu Journal of Veterinary and Animal Sciences)
This Journal is published bi-monthly by Tamil Nadu Veterinary and Animal Sciences University, Chennai in February, April, June, August, October and December of every year.
1. Annual Subscription (Inland) - Rs.500/- (Rupees Five hundred only)
2. Life Membership (Inland) - Rs.3000/-(Rupees Three thousand only) (for 10 years)
3. Processing fee (Inland) - Rs.500/- (Rupees five hundred only)
4. Annual Subscription (Foreign) - US $50/- (Fifty US Dollars only)
5. Life Membership (Foreign) - US $250/- (Two hundred and fifty US Dollars only)
6. Processing fee (Foreign) - US $10/- (Ten US Dollar only)
Subscriptions are payable in advance and the subscription rates are inclusive of postal charges.
Demand draft is to be drawn in favour of “The Chief Editor, IJVASR & Director of Research, TANUVAS, Chennai - 51. Advance payment of annual subscription is solicited for uninterrupted supply of the journal.
The first / corresponding authors are requested to inform their email addresses and contact numbers while submitting manuscripts to this journal.
Chief Editor

INDIAN JOURNAL OF VETERINARY AND ANIMAL SCIENCES RESEARCH(Formerly Tamil Nadu Journal of Veterinary and Animal Sciences)
Review article
1. Injectable Anaesthesia in farm animals 1 Dr. Lionel Dawson
Full length articles
2. Methane production potential of feed ingredients estimated by 12 in vitro gas production test M.Ramachandran, A. Bharathidhasan and V.Balakrishnan
3. Effect of accelerated feeding in the growth performance and 21 carcass quality in native kids T.Muthuramalingam, E. Rachel Jemimah, P.Tensingh Gnanaraj, P.Pothiappan and A. Shanmuga sundaram
4. Effect of exogenous enzymes supplementation on growth performance and 31 histo morphology of duodenum of broilers fed cashew apple waste based diets P.Venkatramana, S. Senthil Murugan and H.S. Patki,
5. Development of liquid milk replacer for rearing early weaned piglets 40 K. Roopa, R. Karunakaran, D.Balasubramanyam, H. Gopi and L.Radhakrishnan
6. Development and quality evaluation of low fat functional Paneer 45 Kavya Kuttan and K. Radha
Short Communications
7. Immunogenicity of Pasteurella Multocida cell associated and 56 cell free antigens in mice Sahzad, S. Arya, M. Bora, S. Shebannavar, T. V. S. Rao and G. S. Reddy
8. Occurrence of Proventriculo-Ventricular Intussusception in 60 chicken M. Pradeep and M.R. Reddy
Vol. 48 January - February 2019 No. 1


1
Review article
Ind. J. Vet. & Anim. Sci. Res., 48 (1) 1-11, Jan. - Feb, 2019
Injectable anesthesia in farm animals
Dr. Lionel Dawson Oklahoma State University
Introduction
Injectable anesthesia in farm animals been used on a routine basis in academia and in clinical practice in the United States of America. As an ambulatory clinician, the author has used various pharmaceuticals and combinations for sedation and short term generalized anesthesia, on farm animals in performing various techniques, clinical procedures,major and minor surgeries in the clinic and on the farm. There are many physical and mental challenges in dealing with farm animals when safely restraining or immobilizing them for any surgical or non-surgical procedures performed. The main goal is to effectively control the animal without injuring the /to subject/animal or the personnel involved. In most cases, for performing physical examination or minor surgery a chute, crush, ropes, or local anesthesia is sufficient to accomplish the task. However, on certain situations, sedatives, dissociative, and systemic analgesics can provide the mental distraction needed to reduce reflex reactions and override learned behaviors. This article will review some of the common uses of sedation and anesthesia in performing both minor and major surgeries using injectable anesthetic drugs in farm animals.
Pre-anesthetic Considerations
Important pre-anesthetic considerations involve thorough evaluation of patient health
status and demeanor. This examination helps determine if the patient is a suitable candidate for field anesthesia and may reduce liability should anesthetic complications occur. Major anesthetic challenges peculiar to ruminants include restriction of ventilation due to rumen size, continuous flow of saliva (volumes up to 16 and 200 litres/day in small ruminants and adult cattle respectively), regurgitation and aspiration of rumen content, if the animal is not properly fasted, and patient size. Functioning ruminants should be ideally fasted prior to general anesthesia according to the following guidelines: adult cattle (48-hrs. for hay, 36 hrs. for grain or concentrates and 12 hrs. for water), and small ruminants and camelids (24 to 48 hrs. for hay, 12 hrs. for water). Young livestock on a milk diet (<1.5 - 2 months of age) and swine should be fasted for ~ 12 hrs. (feed & water).
If a surgery or procedure necessitating a recumbent position performed out in the field, the ground surface should ideally be soft to help protect against injury during induction and recovery. Large ruminants are more difficult to physically control and require a somewhat larger “safety zone”. Except for a handful of cases, they typically do not attempt to stand up until they are well awake and functional. Good footing is the primary requirement for achieving a good recovery: an open grassy area is ideal. A stall or pen deeply bedded with shavings,
2
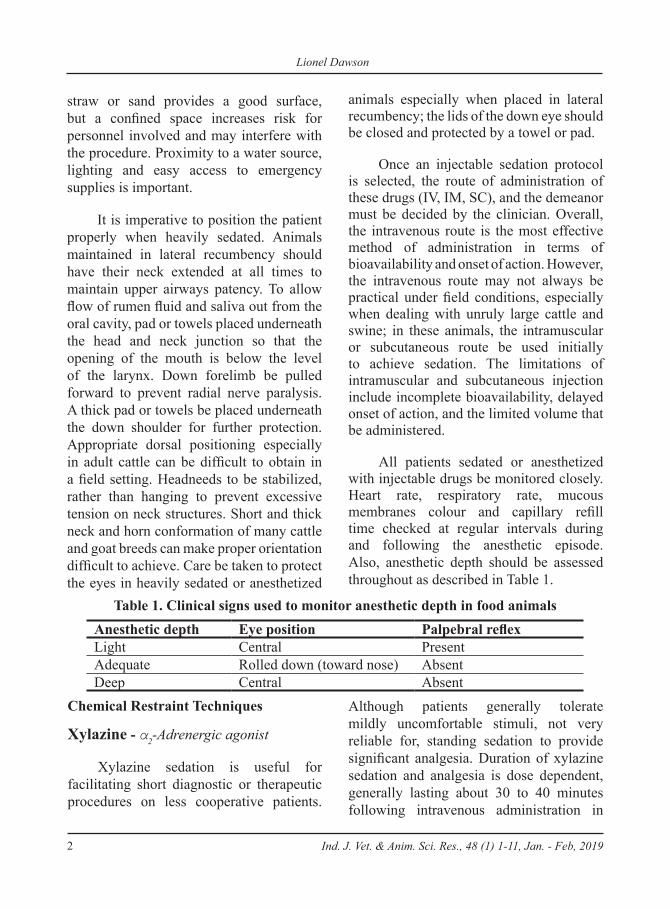
straw or sand provides a good surface, but a confined space increases risk for personnel involved and may interfere with the procedure. Proximity to a water source, lighting and easy access to emergency supplies is important.
It is imperative to position the patient properly when heavily sedated. Animals maintained in lateral recumbency should have their neck extended at all times to maintain upper airways patency. To allow flow of rumen fluid and saliva out from the oral cavity, pad or towels placed underneath the head and neck junction so that the opening of the mouth is below the level of the larynx. Down forelimb be pulled forward to prevent radial nerve paralysis. A thick pad or towels be placed underneath the down shoulder for further protection. Appropriate dorsal positioning especially in adult cattle can be difficult to obtain in a field setting. Headneeds to be stabilized, rather than hanging to prevent excessive tension on neck structures. Short and thick neck and horn conformation of many cattle and goat breeds can make proper orientation difficult to achieve. Care be taken to protect the eyes in heavily sedated or anesthetized
animals especially when placed in lateral recumbency; the lids of the down eye should be closed and protected by a towel or pad.
Once an injectable sedation protocol is selected, the route of administration of these drugs (IV, IM, SC), and the demeanor must be decided by the clinician. Overall, the intravenous route is the most effective method of administration in terms of bioavailability and onset of action. However, the intravenous route may not always be practical under field conditions, especially when dealing with unruly large cattle and swine; in these animals, the intramuscular or subcutaneous route be used initially to achieve sedation. The limitations of intramuscular and subcutaneous injection include incomplete bioavailability, delayed onset of action, and the limited volume that be administered.
All patients sedated or anesthetized with injectable drugs be monitored closely. Heart rate, respiratory rate, mucous membranes colour and capillary refill time checked at regular intervals during and following the anesthetic episode. Also, anesthetic depth should be assessed throughout as described in Table 1.
Table 1. Clinical signs used to monitor anesthetic depth in food animalsAnesthetic depth Eye position Palpebral reflexLight Central PresentAdequate Rolled down (toward nose) AbsentDeep Central Absent
Chemical Restraint Techniques
Xylazine - α2-Adrenergic agonist
Xylazine sedation is useful for facilitating short diagnostic or therapeutic procedures on less cooperative patients.
Although patients generally tolerate mildly uncomfortable stimuli, not very reliable for, standing sedation to provide significant analgesia. Duration of xylazine sedation and analgesia is dose dependent, generally lasting about 30 to 40 minutes following intravenous administration in
Ind. J. Vet. & Anim. Sci. Res., 48 (1) 1-11, Jan. - Feb, 2019
Lionel Dawson

3
standing or laterally recumbent patients. In dorsally recumbent patients, the duration of enhanced cooperation provided by intravenous xylazine may be as short as 20 minutes. Duration typically doubled with intramuscular administration, although intensity is commensurately reduced. Clinicians who have tried the “ketamine stun” technique tend to prefer it to pure xylazine chemical restraint (Table 2).
Xylazine (0.05 mg/kg IV or 0.1 mg/kg IM) results in recumbency in 50% of
tractable cattle. Xylazine (0.1 mg/kg IV or 0.2 mg/kg IM) results in recumbency in most tractable cattle. Anxious or unruly patients are more resistant and somewhat higher doses of xylazine may be required to produce recumbency. Titrated administration (e.g., initial conservative dose that supplemented if necessary) minimizes the amount of xylazine administered and the degree of adverse side effects produced. Physical methods can also be used to produce recumbency once the patient is sufficiently sedated.
Table 2. Dose range of xylazine expected to produce standing sedation with a low incidence of recumbency
Patient type IVa IMDairy breeds 0.0075-0.01 mg/kg 0.015-0.02 mg/kgTractable cattle 0.01-0.02 mg/kg 0.02-0.04 mg/kgAnxious cattle 0.02-0.03 mg/kg 0.04-0.06 mg/kgExtremely anxious or unruly cattle 0.025-0.05 mg/kg 0.05-0.1 mg/kg
Abbreviations: IM, intramuscularly; IV, intravenously.aAdministering the IV dose IM further reduces the possibility of recumbency.
Detomidine
Detomidine is a more potent α2- adrenergic agonist. Because ruminants have increased sensitivity to xylazine, the dose relationship between xylazine and detomidine in ruminants does not reflect
these differences (Table 3). Detomidine doses used in ruminants are similar to those used in equine patients. Detomidine produces greater cardiorespiratory depression than xylazine and not be used in animals to produce recumbent sedation.
Table 3. Dose range of detomidine expected to produce standing sedation with a low incidence of recumbency
Patient type IVa IMTractable cattle 0.002-0.005 mg/kg 0.006-0.01 mg/kgAnxious cattle 0.005-0.0075 mg/kg 0.01-0.015 mg/kgExtremely anxious or unruly cattle 0.01-0.015 mg/kg 0.015-0.02 mg/kg
Information regarding the use of detomidine in ruminants is limited. The dose ranges provided are estimates and should be adjusted based on experience.Abbreviations: IM, intramuscularly; IV, intravenously.aAdministering the IV dose IM further reduces the possibility of recumbency.
Ind. J. Vet. & Anim. Sci. Res., 48 (1) 1-11, Jan. - Feb, 2019
Injectable anesthesia in farm animals

4
α2-Adrenergic agonist and opioids
An opioid is preferred (butorphanol or morphine) be administered to augment the level of systemic analgesia in ruminants when sedated with α2-adrenergic agonists like xylazine or detomidine. Butorphanol (0.05-0.1 mg/kg IV or IM) in smaller ruminants, 0.02-0.05 mg/kg IV or IM in larger ruminants) or morphine (0.05-0.1 mg/kg IV or IM) can be administered with the initial dose of α2, or added in situations when patient’s cooperation needs improvement. The α2 dose can typically be reduced somewhat when used in conjunction with an opioid.
Ketamine
Ketamine is by far the most common injectable anesthetic agent used in large animal or farm animal practice. Ketamine is an N-methyl-D-aspartate receptor antagonist, possesses potent analgesic effects at sub anesthetic doses. Sub anesthetic doses of ketamine used in chemical restraint in “Ketamine Stun”.
Telazol
Telazol is a combination of equal parts by weight of tiletamine hydrochloride a dissociative anesthetic similar to ketamine, a N-methyl-D-aspartate receptor antagonist, and Zolazepam hydrochloride a benzodiazepine with minor tranquilizing properties. Due to high cost of this product, primarily used in large animal practice for capturing intractable patients.
Ketamine Stun
The author prefers ketamine stun in cattle in performing caesarian sections,
vasectomy, caudal epididymectomy etc. Ketamine is a dissociative anesthetic commonly used in veterinary medicine. Ketamine possesses potent analgesic effects when administered at subanesthetic doses. Adding a small dose of ketamine to more traditional chemical restraint combinations greatly enhances the level of patient cooperation. This technique is called the “ketamine stun” (or stun) because of the stunned effect it produces in patients when administered IV at doses that produce recumbency. These patients appeared to be awake, but seem oblivious to surroundings and procedure performed. The intravenous effect is quite brief (approximately 15 minutes) and patients typically stand and appear fairly normal at that time, this state can be referred to as semi-anesthetized, but perhaps chemical hypnosis is more appropriate. Dosing must be more conservative when using the ketamine stun technique in standing patients. This limits the degree of systemic analgesia relative to what can be achieved in recumbent patients, but still provides improved patient cooperation when compared with more traditional methods of standing chemical restraint in both ruminants and horses.
The α2adrenergic agonist (xylazine) possess potent sedative and analgesic effects. Opioids (butorphanol) are analgesic, but they possess central nervous system effects that when combined with a tranquilizer or sedative produces a greater level of mental depression. Ketamine is an N-methyl-D-aspartate receptor antagonist that possesses potent analgesic effects at subanesthetic doses. Ketamine was included in the stun technique for its analgesic properties, likely contributes to the mental aspect of
Ind. J. Vet. & Anim. Sci. Res., 48 (1) 1-11, Jan. - Feb, 2019
Lionel Dawson
5
the enhanced cooperation exhibited by patients under the influence of the ketamine stun technique. By combining drugs, one is able to use smaller doses of the individual components while still achieving the desired level of effect.
Ketamine stun techniques divided into two broad categories: standing and recumbent. The standing ketamine stun
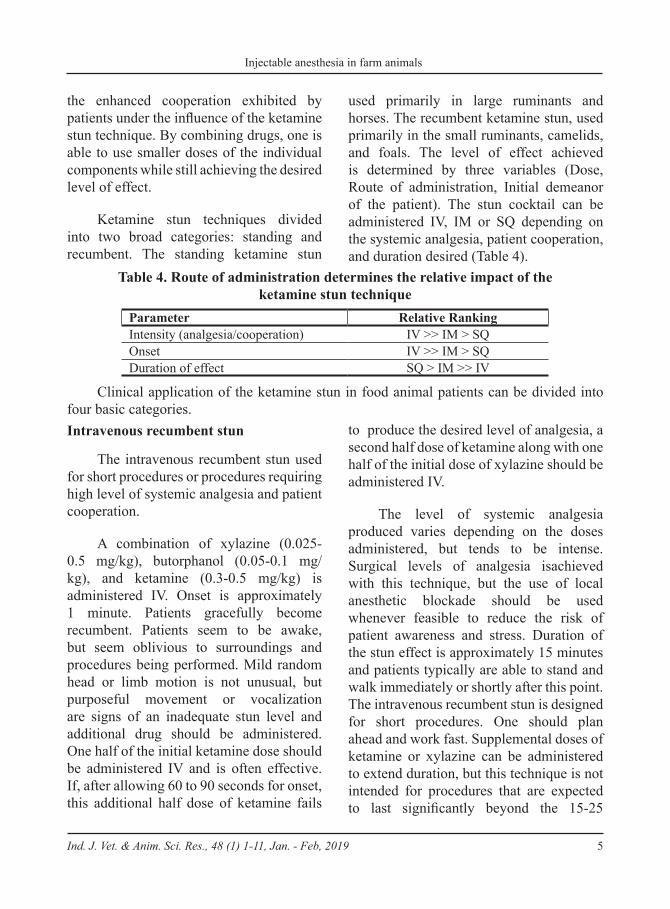
used primarily in large ruminants and horses. The recumbent ketamine stun, used primarily in the small ruminants, camelids, and foals. The level of effect achieved is determined by three variables (Dose, Route of administration, Initial demeanor of the patient). The stun cocktail can be administered IV, IM or SQ depending on the systemic analgesia, patient cooperation, and duration desired (Table 4).
Table 4. Route of administration determines the relative impact of the ketamine stun technique
Parameter Relative RankingIntensity (analgesia/cooperation) IV >> IM > SQOnset IV >> IM > SQDuration of effect SQ > IM >> IV
Clinical application of the ketamine stun in food animal patients can be divided into four basic categories. Intravenous recumbent stun
The intravenous recumbent stun used for short procedures or procedures requiring high level of systemic analgesia and patient cooperation.
A combination of xylazine (0.025-0.5 mg/kg), butorphanol (0.05-0.1 mg/kg), and ketamine (0.3-0.5 mg/kg) is administered IV. Onset is approximately 1 minute. Patients gracefully become recumbent. Patients seem to be awake, but seem oblivious to surroundings and procedures being performed. Mild random head or limb motion is not unusual, but purposeful movement or vocalization are signs of an inadequate stun level and additional drug should be administered. One half of the initial ketamine dose should be administered IV and is often effective. If, after allowing 60 to 90 seconds for onset, this additional half dose of ketamine fails
to produce the desired level of analgesia, a second half dose of ketamine along with one half of the initial dose of xylazine should be administered IV.
The level of systemic analgesia produced varies depending on the doses administered, but tends to be intense. Surgical levels of analgesia isachieved with this technique, but the use of local anesthetic blockade should be used whenever feasible to reduce the risk of patient awareness and stress. Duration of the stun effect is approximately 15 minutes and patients typically are able to stand and walk immediately or shortly after this point. The intravenous recumbent stun is designed for short procedures. One should plan ahead and work fast. Supplemental doses of ketamine or xylazine can be administered to extend duration, but this technique is not intended for procedures that are expected to last significantly beyond the 15-25
Ind. J. Vet. & Anim. Sci. Res., 48 (1) 1-11, Jan. - Feb, 2019
Injectable anesthesia in farm animals
6
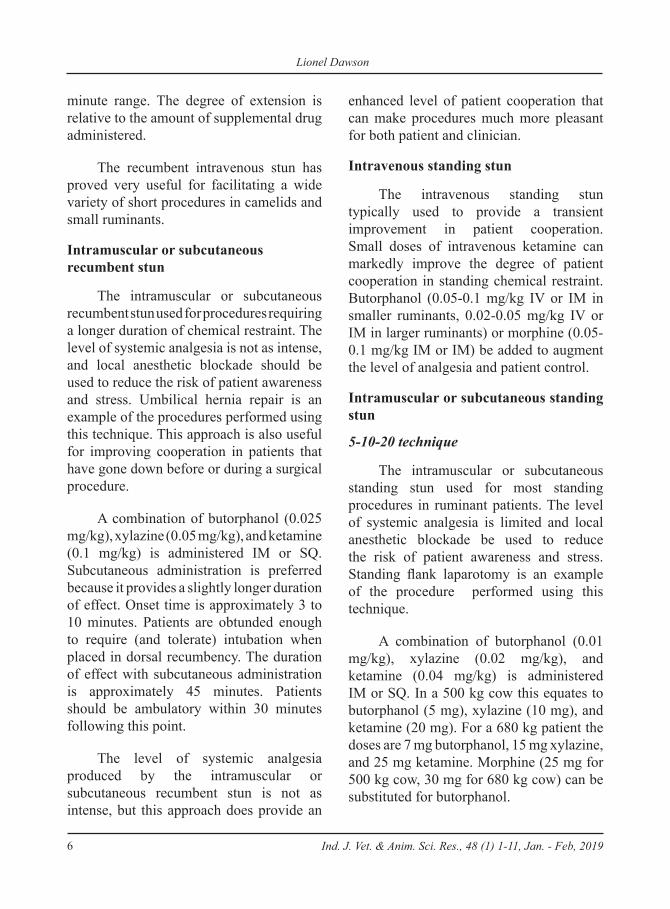
minute range. The degree of extension is relative to the amount of supplemental drug administered.
The recumbent intravenous stun has proved very useful for facilitating a wide variety of short procedures in camelids and small ruminants.
Intramuscular or subcutaneous recumbent stun
The intramuscular or subcutaneous recumbent stun used for procedures requiring a longer duration of chemical restraint. The level of systemic analgesia is not as intense, and local anesthetic blockade should be used to reduce the risk of patient awareness and stress. Umbilical hernia repair is an example of the procedures performed using this technique. This approach is also useful for improving cooperation in patients that have gone down before or during a surgical procedure.
A combination of butorphanol (0.025 mg/kg), xylazine (0.05 mg/kg), and ketamine (0.1 mg/kg) is administered IM or SQ. Subcutaneous administration is preferred because it provides a slightly longer duration of effect. Onset time is approximately 3 to 10 minutes. Patients are obtunded enough to require (and tolerate) intubation when placed in dorsal recumbency. The duration of effect with subcutaneous administration is approximately 45 minutes. Patients should be ambulatory within 30 minutes following this point.
The level of systemic analgesia produced by the intramuscular or subcutaneous recumbent stun is not as intense, but this approach does provide an
enhanced level of patient cooperation that can make procedures much more pleasant for both patient and clinician.
Intravenous standing stun
The intravenous standing stun typically used to provide a transient improvement in patient cooperation. Small doses of intravenous ketamine can markedly improve the degree of patient cooperation in standing chemical restraint. Butorphanol (0.05-0.1 mg/kg IV or IM in smaller ruminants, 0.02-0.05 mg/kg IV or IM in larger ruminants) or morphine (0.05-0.1 mg/kg IM or IM) be added to augment the level of analgesia and patient control.
Intramuscular or subcutaneous standing stun
5-10-20 technique
The intramuscular or subcutaneous standing stun used for most standing procedures in ruminant patients. The level of systemic analgesia is limited and local anesthetic blockade be used to reduce the risk of patient awareness and stress. Standing flank laparotomy is an example of the procedure performed using this technique.
A combination of butorphanol (0.01 mg/kg), xylazine (0.02 mg/kg), and ketamine (0.04 mg/kg) is administered IM or SQ. In a 500 kg cow this equates to butorphanol (5 mg), xylazine (10 mg), and ketamine (20 mg). For a 680 kg patient the doses are 7 mg butorphanol, 15 mg xylazine, and 25 mg ketamine. Morphine (25 mg for 500 kg cow, 30 mg for 680 kg cow) can be substituted for butorphanol.
Ind. J. Vet. & Anim. Sci. Res., 48 (1) 1-11, Jan. - Feb, 2019
Lionel Dawson

7
Subcutaneous administration is preferred to minimize the risk of recumbency. In very unruly cows, intramuscular administration provides better patient control. Onset is 5 to 10 minutes with subcutaneous administration. Cows stood quietly during the caesarean sections (many were ill mannered before the ketamine stun). The duration of effect is approximately 60-90 minutes. Additional xylazine and ketamine can be administered SQ to extend the duration of chemical restraint. Recumbency has occasionally
occurred with re-administration of 50 of all three components. Current recommendation for supplemental drug administration is 25%-50% of the initial xylazine and ketamine doses (0-2.5-5) and (0-5-10), respectively, depending on the degree of cooperation and time required to complete the procedure.A similar approach (10-20-40 technique) has been used successfully in adult bulls. Preputial surgery (with local anesthetic block) is an example of the procedures performed using this technique.
Anesthetic Drugs (Table 5) & Anesthetic Protocols (Table 7 & 8)
Table 5. Indications, dosage and side effects of common anesthetic drugs used in food animals
Anesthetic drug Drug class Indications Side effects to consider Dosage
(mg/kg) Route Duration (min)
Xylazine α-2 AgonistShort-term sedationMuscle relaxant Mild analgesia
Cardiorespiratory depressionBloat, recumbency Hyperglycemia Abortion (3rd trimester)
0.050.1-0.2
IVIM
20-3030-40
Detomidine α-2 AgonistLonger sedation20xanalgesicsedative than xylazine
Similar to Xylazine except:Safe to use in pregnant cows↓ Likelihood of recumbency
0.005-0.020.02-0.04
IVIM
Dosedependent
Ketamine Dissociative In association forgeneral anesthesia
Respiratory depressionNo muscle relaxation
2-33-4
IVIM
15-2020-30
Diazepam Benzodiazepine
AnticonvulsantSedation Cardiorespiratory depression
0.5-1: seizure0.05-0.2: sedation
IV slowIV
slow
30-45
Butorphanol Opioidagonist/ antagonist
AnalgesiaSedation
May induce excitationif given by itself
0.05-0.20.2-0.5
IVIM 45-60
Morphine Pure opioidagonist Analgesia Respiratory depression
↓ GI motility0.05-0.20.05-0.5
IV, IMIM, SC
240-360(4-6 hrs.)
Guaifenesin
CentralSkeletalMuscle Relaxant
Muscle relaxation No analgesia 100 IV drip
Drip ratedependent
Tiletamine/Zolazepam
Dissociative/Benzodiazepine
General anesthesiaAnalgesiaMuscle relaxation
Respiratory depressionLong but smooth recovery 5 IM 60-90
Aceproma-zine
Dopamine &α-1 antagonist
Mild sedationCalming effect
No analgesia, hypotensionPenile prolapse → trauma
0.01-0.020.03-0.1
IVIM
120-240(2-4 hrs.)
Ind. J. Vet. & Anim. Sci. Res., 48 (1) 1-11, Jan. - Feb, 2019
Injectable anesthesia in farm animals

8
Table 6. Dosage of common reversal anesthetic drugs used in food animals
Anestheticdrug Drug class Indications Side effects
to consider
Bo/OV/Cap/Camelids
Dosage (mg/kg)
SwineDosage (mg/kg) Route
Tolazoline α-2 Antagonist Reversalα-2 agonist
Adverse reactionpossible when given IV fast 1-2 1-2 IV slow
IM, SC
Yohimbine α-2 Antagonist Reversalα-2 agonist 0.125-0.2 0.1-0.2 IV
slow, IM
Atipamazole α-2 Antagonist Reversalα-2 agonist
Mostappropriate α- 2 reversal in camelids
0.125-0.2 0.2 IM, SC
Flumazenil Benzodiazepineantagonist
Reversal forbenzodiazepines 0.1 0.01 IV
Naloxone Opioidantagonist
Reversal foropioids 0.03 0.5-2 IV, IM
Table 7. Injectable anesthetic protocols for bovine, ovine and caprine species
Protocol Dosage Route Species IndicationsDuration
(min)
Telazol 500 mgKetamine 250-400mgXylazine 100 mg
1.25-1.5 mL/100Lbs. (Ov, Cap)1 mL/100 lb (Bov)
Pole syringeor dart gun → IM
BovOvCap
Capture & immobilization ~40-60
*Butorphanol*Xylazine*Ketamine
0.025 mg/kg0.05 mg/kg0.1 mg/kg
IV
IM or SCBov
Standing sedations (bucking stock)Recumbent sedation (Routine surgery)
~15-20
~30-40
*Butorphanol*Xylazine*Ketamine
0.05-0.1 mg/kg0.025-0.05 mg/kg0.3-0.5 mg/kg
IV BovShort procedure requiring lateral or sternal recumbency, analgesia, and patient cooperation
*Butorphanol*Xylazine*Ketamine
5 mg or 10 mg10 mg or 20 mg20 mg or 40 mg
IM or SC BovChemical restraint for standing C-section in beef cows ( 340 - 660 Kg Body weight )
~60-90
5%Guaifenesin 1LKetamine 1000mgXylazine 50-100mg “IV triple drip”
Induction: 1mL/kgMaintenance:2 mL/kg/hr.
IV -> catheter (drip set)
BovProcedure requiring good muscle relaxation (ex: cast application)
~60-90
Xylazine (X)Ketamine (K)
(X): 0.05 mg/kg(K): 2 mg/kg
(X): 0.1 mg/kg(K): 4mg/kg
IV
IM
BovOvCap
General anesthesia – routine surgery
Prolongation: administer ½ of initial ketamine dose
~30-40
~40-60
*Ketamine stun
Ind. J. Vet. & Anim. Sci. Res., 48 (1) 1-11, Jan. - Feb, 2019
Lionel Dawson

9
Table 8. Injectable anesthetic protocols for swine
Protocol Dosage Route Indications Duration (min)
Acepromazine 0.2-0.5 mg/kg IM Sedation ~ 30
Xylazine 0.5-3 mg/kg IM Sedation ~ 30MedetomidineButorphanol Midazolam
10-20 mg/kg0.1-0.2 mg/kg0.1-0.5 mg/kg
IM Sedation ~ 60
XylazineGlycopyrrolateButorphanol
1 mg/kg0.01 mg/kg0.05 mg/kg
IM Sedation in pot belly pigs(especially geriatric patients) ~ 60
XylazineMidazolam Ketamine
1 mg/kg0.2 mg/kg2-10 mg/kg
IMSedation for caesarian section(use higher ketamine dosage for heavier sedation)
~ 60
MidazolamKetamine
0.5 mg/kg5-10 mg/kg IM Sedation for geriatric pot belly pigs. ~ 30-40
Pig cocktail #1: 5 mlTelazol 500 mg - powderKetamine 250 mgXylazine 250 mg
1 mL/50kg IM General anesthesia (prolonged recovery) ~ 60-90
Pig cocktail #2: 5 mlTelazol 500 mg - powderXylazine 300 mg Sterile water 2 mL
1 mL/25kg IM
General anesthesia(less chance of apnea compared to pig cocktail #1)Inguinal herniaCastration
~ 60
Pig cocktail #3: 5 mlTelazol 500 mg - powderXylazine 150 mg Sterile water 3.5mL
4 mL/200 kg IMGeneral anesthesiaCesarean sectionHernia repair ~60
*Xylazine 1 mL = 100 mg
Withdrawal Times Suggested
Since most anesthetic drugs have a short half-life and are typically administered once at a low dose on an mg/kg basis, the incidence of volatile residues in meat or milk is fairly rare. In addition, anesthetized food animals going through a surgery are unlikely to be slaughtered shortly after the procedure. The time necessary for recovery
and healing of the surgical wound is usually long enough for most anesthetic drugs to clear before slaughter. It is recognized that tests for anesthetic residue are not performed routinely, in contrast to tests for antibiotic residues. Reaction in people caused by consumption of milk or meat contaminated with anesthetic drugs residues has not been documented.
Ind. J. Vet. & Anim. Sci. Res., 48 (1) 1-11, Jan. - Feb, 2019
Injectable anesthesia in farm animals

10
Table 9. Recommended withdrawal times associated with injectable anesthetic drugs (Bovine)
Anesthetic drug Meat withdrawal (days) Milk withdrawal (hours)Xylazine 4 24Detomidine 3 72Acepromazine 7 48Ketamine 3 72Thiopental 4 Not determined (ND)Tiletamine/Zolazepam 30 NDDiazepam 30 NDMidazolam 14 NDButorphanol 19 72Guaifenesin 3 48Atropine 14 72Tolazoline 8 48Yohimbine 7 72
References
Abrahamsen, E.J. (2008). Ruminant field anesthesia. Veterinary Clinics of North America: Food Animal Practice. 24(3): 429-441.
Abrahamsen, E.J. (2008). Chemical restraint in ruminants. Veterinary Clinics of North America: Food Animal Practice.24(2): 227-243.
Anderson, D.E., Jones, M.L and Miesner, M.D. (2013). Veterinary Techniques for Llamas and Alpacas. Wiley-Blackwell, 360 pages.
Boileau, M. (2017). Injectable anesthesia in food animals. Proceedings for summer OVMA.
Craigmill, A.L., Rangel-Lugo, M., Damian, P and Riviere, J.E. (1997). Extralabel use of tranquilizers and general anesthetics. Journal of the American Veterinary Medical Association. 211(3): 302-304.
Dawson, L.J. (2017). Practice in Large Animals. International Clinical Workshop. Proceedings of Advances in Clinical Practices in Large and Small Animals. Namakkal, Tamilnadu, India.
Haskell, S.R., Gehring, R., Payne, M.A., Craigmill, A.L, Webb, A.L, Bayes, R.E and Riviere, J.E. (2003). Update of FARAD food animal drug withholding recommendations. Journal of the American Veterinary Medical Association. 223(9): 1277-1278.
Haskell, S.R.R, Payne, M.A., Webb, A.I, Reviere, J.E and Craigmill, A.L. (2005). Antidotes in food animal practice. Journal of the American Veterinary Medical Association. 226(6): 884-887.
Lin, H. and Walz, P. (2014). Farm Animal Anesthesia: cattle, small ruminants, camelids, and pigs. Wiley-Blackwell, 2014; 278p.
Ind. J. Vet. & Anim. Sci. Res., 48 (1) 1-11, Jan. - Feb, 2019
Lionel Dawson

11
Miesner, M.D. (2010). Bovine field restraint: physical and chemical techniques for balanced restraint. In: Proceedings of the forty-third annual conference American Association of Bovine Practitioners, Albuquerque, New Mexico, pp.22-25.
Morgan, G.L and Dawson, L.J. (2008). Development of Teaser bulls under Field Conditions. Veterinary Clinics of North America: Food Animal Practice. 24 (3): 443-451.
Newman, K.D and Anderson D.E. (2005). Update in soft tissue surgery. Cesarean
section in cows. Veterinary Clinics of North America: Food Animal Practice. 21(1): 73-99.
Papich, M.G. (1996). Drug residue considerations for anesthetics and adjunctive drugs in food-producing animals. Veterinary Clinics of North America: Food Animal Practice. 2(3): 693-705.
Seddighi, R and Doherty, T.J. (2016). Field sedation and anesthesia of ruminants. Veterinary Clinics of North America: Food Animal Practice. 32: 553-570.
Ind. J. Vet. & Anim. Sci. Res., 48 (1) 1-11, Jan. - Feb, 2019
Injectable anesthesia in farm animals
*Corresponding author: Professor and Head, Livestock Farm Complex, Veterinary College and Research Institute, TANUVAS, Orathanadu, Thanjavur – 614 625, India
Methane production potential of feed ingredients estimated by in vitro gas production test
M.Ramachandran, A. Bharathidhasan and V.Balakrishnan Tamil Nadu Veterinary and Animal Sciences University
Department of Animal Nutrition, Madras Veterinary College, Vepery, Chennai – 600 007, India.
ABSTRACT
This study was conducted to investigate methane production potential of feed ingredients to develop a database on methane production. Feed ingredients such as cereal grains, cereal by-products and protein supplements were tested for methane production potential using in vitro gas production technique. In vitro true digestibility (IVTD) of cereal grains ranged from 60.1 to 96.7% and oats grain (76.2%) and distiller’s grain (60.1%) had lower (P<0.05) values than other cereal grains. Among the cereal by-products, wheat bran showed highest (P<0.05) IVTD (74.9%) than rice bran (42.7%). IVTD of cottonseed oil cake, black gram and sunflower oil cake was lower (P<0.05) than other protein supplements. Methane production potential of cereal grains at half life (t1/2) ranged from 0.66 to 2.85 ml/100 mg truly digested substrate and the difference was significant (P<0.05), however, maize grain, sorghum grain, bajra and broken rice did not vary among themselves. Average methane production potential of cereal by-products at half life (t1/2) and 24 hrs was 1.27 and 1.81 ml/100 mg truly digested substrate, respectively. Average methane production potential of protein supplements at half life (t1/2) and 24 hrs was 1.39 and 1.75ml/100 mg of truly digested substrate, respectively and the difference was statistically significant (P<0.05). Maximum (P<0.05) methane production potential at half life (t1/2) was recorded for black gram (4.07 ml/100 mg truly digested substrate). Lowest methane production potential both at half life (t1/2) and 24 hrs were recorded in fish meal and spirulina. It can be concluded that among cereal grains, methane production potential was higher (P<0.05) in oats grain at half life (t1/2) and all the cereal grains had similar methane production potential at 24 hrs. Among cereal by-products, wheat bran had higher (P<0.05) methane production potential both at half life (t1/2) and 24 hrs. Among protein supplements, black gram had significantly (P<0.05) higher methane production potential at half life (t1/2) and horse gram had significantly (P<0.05) higher methane production potential at 24 hrs.
Key Words: Methane, database, in vitro true digestibility
Full Length Articles
12 Ind. J. Vet. & Anim. Sci. Res., 48 (1) 12-20, Jan. - Feb, 2019

13
INTRODUCTION
Methane is second major gas after carbon dioxide responsible for the warming of environment and ozone layer depletion. It is a potent green house gas as it has 23 times higher global warming potential than carbon dioxide (IPCC, 1996). Estimates of global methane production ranged between 350-820 Tg/year (Khan et al., 2001). Ruminants contribute about 30% of the world total methane production. Global warming and ozone layer depletion due to increased emission of green house gases in the atmosphere have drawn worldwide attention with an alarming stage of iceberg melting, increased ocean level, local and global eco-system upsets, changes in the rainfall patterns, changes in pathogenesis of plants, animals and human beings and alteration in life of the people (Kumar et al., 2008). Several reports of the United Nations inter-governmental panels on climate changes indicated the urgency of the problem. IPCC (2001) has warned that by the mid of this century the globe’s temperature will rise just like anything up to 5.8oC.
Livestock are one amongst the largest single source of methane emission with 80–115 million tonnes per year, equivalent to 15–20% of total anthropogenic methane (IPCC, 2001). Ruminal microorganisms are responsible for the emission of methane from livestock (cattle, buffalo, sheep, goats, camel, etc.). The global cattle population is responsible for 73% of methane emissions of all livestock (McCrabb and Hunter, 1999). Tropical grasses are of low to moderate digestibility (on average 13% lower dry matter (DM) digestibility than
temperate grasses) and are often deficient in critical nutrients such as protein and phosphorus. Under such conditions, methane produced during ruminal fermentation represents a loss of 10–11% of gross energy intake. The enteric methane contributes approximately 30–40 per cent of total methane produced from agricultural sources (Moss et al., 2000). Methane from enteric fermentation by ruminants is not only an important greenhouse gas associated with environmental problems, but it also represents a loss of feed energy (20–150 kJ/MJ) intakes (Singh et al., 2005). Therefore, developing feeding strategies to minimize methane emission is desirable in long-term mitigation of emission of greenhouse gases into the atmosphere and for short-term economic benefits.
This study was conducted to investigate in vitro methane production potential of different feed ingredients to develop a database on methane production to estimate the methane emission from ruminant livestock precisely and to develop methane mitigation strategies to reduce global warming and enhance the efficiency of nutrient utilization.
MATERIALS AND METHODS
Collection, processing and chemical analysis of feed ingredients
Feed ingredients such as cereal grains, cereal by-products and protein supplements were collected from Tamil Nadu and these samples were dried in a hot air oven at about 50-600C and ground using 1 mm sieve. Total ash (TA) and ether extract (EE) content were estimated as per the procedure of AOAC, (1995). Organic matter (OM)
Ind. J. Vet. & Anim. Sci. Res., 48 (1) 12-20, Jan. - Feb, 2019
Methane production potential of feed .... in vitro gas production test
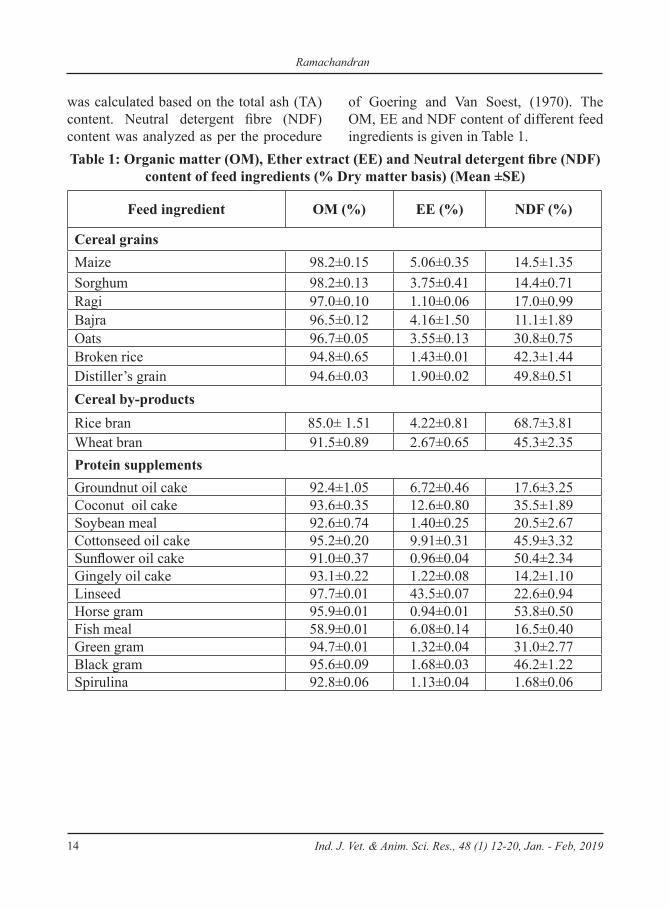
14
was calculated based on the total ash (TA) content. Neutral detergent fibre (NDF) content was analyzed as per the procedure Table 1: Organic matter (OM), Ether extract (EE) and Neutral detergent fibre (NDF)
content of feed ingredients (% Dry matter basis) (Mean ±SE)
Feed ingredient OM (%) EE (%) NDF (%)
Cereal grainsMaize 98.2±0.15 5.06±0.35 14.5±1.35Sorghum 98.2±0.13 3.75±0.41 14.4±0.71Ragi 97.0±0.10 1.10±0.06 17.0±0.99Bajra 96.5±0.12 4.16±1.50 11.1±1.89Oats 96.7±0.05 3.55±0.13 30.8±0.75Broken rice 94.8±0.65 1.43±0.01 42.3±1.44Distiller’s grain 94.6±0.03 1.90±0.02 49.8±0.51Cereal by-productsRice bran 85.0± 1.51 4.22±0.81 68.7±3.81Wheat bran 91.5±0.89 2.67±0.65 45.3±2.35Protein supplementsGroundnut oil cake 92.4±1.05 6.72±0.46 17.6±3.25Coconut oil cake 93.6±0.35 12.6±0.80 35.5±1.89Soybean meal 92.6±0.74 1.40±0.25 20.5±2.67Cottonseed oil cake 95.2±0.20 9.91±0.31 45.9±3.32Sunflower oil cake 91.0±0.37 0.96±0.04 50.4±2.34Gingely oil cake 93.1±0.22 1.22±0.08 14.2±1.10Linseed 97.7±0.01 43.5±0.07 22.6±0.94Horse gram 95.9±0.01 0.94±0.01 53.8±0.50Fish meal 58.9±0.01 6.08±0.14 16.5±0.40Green gram 94.7±0.01 1.32±0.04 31.0±2.77Black gram 95.6±0.09 1.68±0.03 46.2±1.22Spirulina 92.8±0.06 1.13±0.04 1.68±0.06
of Goering and Van Soest, (1970). The OM, EE and NDF content of different feed ingredients is given in Table 1.
Ind. J. Vet. & Anim. Sci. Res., 48 (1) 12-20, Jan. - Feb, 2019
Ramachandran

15
In vitro gas production
Collection of rumen inoculum
Rumen content was collected from male calves fed on paddy straw based rations using stomach tube and strained through 4 layers of muslin cloth. The strained rumen liquor (SRL) was transported to the laboratory in a cud transport container having the facility for CO2 flushing and temperature maintenance.
In vitro gas production test
Five media solutions were prepared individually and were mixed later as specified by Menke and Steingass, (1988). Total volume of buffer required was calculated based on the number of samples incubated. The required quantity of water, micro, macro, buffer and resazurin were mixed in a flat bottom flask and kept in the incubator at about 39oC.
Ground samples (1mm) of about 200 mg were weighed and transferred carefully in to the 100 ml calibrated glass syringes. After weighing all the samples, vaseline was applied to the piston and inserted in to the syringes. The nozzles of the syringes were closed with rubber cork. The syringes were kept in an incubator at 39oC a day before the incubation.
The required volume of strained rumen liquor was measured and added to the medium in the flask. Carbon dioxide was flushed through the medium. Exactly 30 ml of rumen inoculum was dispensed into the syringes through silicone tube fitted to the nozzle. After removing the silicone tube the nozzle was closed using a rubber
cork after removing the gas bubbles. Then the syringes were incubated in a water bath maintained at 39oC in triplicates. The gas production was measured at 2, 4, 6, 8, 12, 24, 36, 48, 72 and 96 hours interval and corrected with blank. The gas production at different intervals was analysed using Graph Pad Prism (version 5.0) to estimate half life (t1/2).
Estimation of in vitro true digestibility (IVTD)
Ground samples (1mm) of about 500 mg were weighed and transferred carefully in to the 100 ml calibrated glass syringes. Media solution for the estimation of in vitro true digestibility was prepared as per the procedure of Makkar et al. (1995). Exactly 40 ml of rumen inoculum with double strength buffer was dispensed into the syringes through silicone tube fitted to the nozzle. After removing the silicone tube the nozzle was closed using a rubber cork after removing the gas bubbles. Then the syringes were incubated in a water bath maintained at 39oC in triplicates. The experiments for the estimation of in vitro true digestibility and methane emission were carried out simultaneously.
After recording total gas production, in vitro true digestibility was estimated at 24 hours of incubation. After the end of incubation, the contents were carefully transferred into spoutless beaker by repeated washing with neutral detergent solution (NDS). The contents were refluxed for one hour using Fibertec equipment and filtered through pre-weighed Gooch crucible (Grade I). The residues were dried in the hot air oven and weighed.
Ind. J. Vet. & Anim. Sci. Res., 48 (1) 12-20, Jan. - Feb, 2019
Methane production potential of feed .... in vitro gas production test

16
DM of feed taken for incubation - NDF residueTrue digestibility (%) = ------------------------------------------------------------- x 100 DM of feed taken for incubation
Estimation of methane emission
Ground samples (1mm) of about 200 mg were weighed and transferred carefully in to the 100 ml calibrated glass syringes. Exactly 30 ml of rumen inoculum was dispensed into the syringes through silicone tube and the nozzle was closed using a rubber cork after removing the gas bubbles. Then the syringes were incubated in a water bath maintained at 39oC in triplicates and the experiment was repeated on 3 different days. Total gas production was recorded both at half life and 24 hours for feedstuffs with less than 16 hours half life. For other feed ingredients gas samples were collected at half life after recording the total gas production. Gas samples were collected in vacuum container to estimate the concentration of methane using Gas Chromatography.
Estimation of methane concentration using Gas Chromatograph
Methane concentration in different gas samples collected during the in vitro studies was estimated using Gas Chromatograph (Claurus 500, Perkin Elmer) fitted with Flame Ionization Detector (FID) and capillary column (30 meter length and 250 micrometer dia) using a calibration gas consisting of 22.53% methane, 1.05% hydrogen, 33.30% carbon dioxide and 43.12% nitrogen. Helium was used as carrier gas with oven temperature at 60o C, injector temperature at 100oC and detector temperature at 200oC.
Based on the true digestibility, methane production potential per 100 mg truly digested substrate was calculated for all the feed ingredients.
Statistical analysis
All the in vitro experiments adopted a completely randomized design (CRD). The methane production potential was statistically analyzed using one way analysis of variance (One Way - ANOVA) to compare the means as per the procedure of statistical analysis system (SAS/ SPSS version 15.0 for windows). When significant difference was detected the multiple range test was used to separate the mean value.
RESULTS AND DISCUSSION
The results of in vitro true digestibility (IVTD), half life and methane production potential of feed ingredients is given in Table 2. Results revealed that IVTD of cereal grains ranged from 60.1 to 96.7% and oats grain (76.2%) and distiller’s grain (60.1%) had lower (P<0.05) values than other cereal grains. Lower (P<0.05) IVTD in oats grain and distiller’s grain might be due to the higher content of structural carbohydrate (NDF) (Table 1) which is not easily available for microbial digestion. High digestibility of maize, sorghum, ragi, bajra and rice is attributed to high content of easily digestible carbohydrate. Similar IVTD for maize and sorghum grains were also reported by Hervas et al., (2004). Cereal by-products comparatively had lower (P<0.05) IVTD than cereal grains
Ind. J. Vet. & Anim. Sci. Res., 48 (1) 12-20, Jan. - Feb, 2019
Ramachandran

17
because of higher cell wall carbohydrate (NDF) (Table 1).
Results of IVTD of protein supplements indicated that significant difference (P<0.05) was found among various protein supplements. Groundnut oil cake, soybean meal, gingely oil cake,
linseed, fishmeal, horse gram and spirulina had similar IVTD values. In vitro true digestibility of cottonseed oil cake, black gram and sunflower oil cake was lower (P<0.05) than other protein supplements which may be attributed to high cell wall content (Table 2).
Table 2: In vitro true digestibility (%), half life (hr) and methane production potential (ml) of feed ingredients
Name of the feed ingredient
In vitro true digestibility
(IVTD) (%)
Half life (t1/2)(hr)
Methane production potential(ml/100 mg truly digested substrate)
Half life (t1/2) 24 hrs
Cereal grains
Maize 89.4 ± 0.30cd 12.2 0.95 ± 0.13ab 1.75 ± 0.33a
Sorghum 96.7 ± 0.54d 9.47 0.82 ± 0.14a 2.31 ± 0.72a
Ragi 87.1 ± 0.39c 15.6 0.66 ± 0.14a 1.59 ± 0.10a
Bajra 87.5 ± 0.50cd 13.4 1.62 ± 0.12abc 3.71 ± 0.24a
Oats 76.2 ± 1.02b 14.9 2.85 ± 0.66c 3.77 ± 0.76a
Broken rice 88.2 ± 0.27cd 12.6 1.72 ± 0.13abc 2.10 ± 0.40a
Distiller’s grain 60.1 ± 1.75a 14.4 2.41 ± 0.19bc 3.78 ± 0.47a
Average 83.6 13.2 1.58 2.72Cereal by-productsRice bran 42.7 ± 0.63a 10.4 0.55 ± 0.13a 0.91 ± 0.33a
Wheat bran 74.9 ± 0.93b 12.4 1.98 ± 0.32b 2.71 ± 0.46b
Average 58.8 11.4 1.27 1.81Protein supplementsGroundnut oil cake 93.8 ± 0.58ef 5.81 1.05 ± 0.05abc 2.00 ± 0.08bcd
Coconut oil cake 84.0 ± 0.99d 7.52 1.38 ± 0.18abc 2.47 ± 0.17cd
Soybean meal 95.0 ± 0.05f 6.51 0.96 ± 0.09abc 1.70 ± 0.09abc
Cottonseed oil cake 45.9 ± 0.82a 24.0 0.75 ± 0.13abc -Sunflower oil cake 70.4 ± 1.14c 10.6 0.72 ± 0.21abc 1.28 ± 0.23abc
Gingely oil cake 95.5 ± 0.25f 6.99 1.18 ± 0.17abc 2.01 ± 0.20bcd
Linseed 87.4 ± 0.42de 17.6 1.35 ± 0.06abc -Horse gram 90.4 ± 0.21def 14.2 1.66 ± 0.57bcd 3.13 ± 0.64e
Fish meal 94.6 ± 0.66f 11.3 0.40 ± 0.27a 0.62 ± 0.33a
Green gram 85.2 ± 3.18d 19.0 2.54 ± 0.18d -Black gram 54.0 ± 3.29b 33.2 4.07 ± 0.07e -Spirulina 96.2 ± 0.37f 9.38 0.59 ± 0.07ab 0.77 ± 0.10ab
Average 82.7 13.8 1.39 1.75
abcde Means with different superscripts in a column with respect to cereal grains/cereal by-products/protein supplements differ significantly (P<0.05).
Ind. J. Vet. & Anim. Sci. Res., 48 (1) 12-20, Jan. - Feb, 2019
Methane production potential of feed .... in vitro gas production test

18
Methane production potential of cereal grains at half life (t1/2) ranged from 0.66 to 2.85 ml/100 mg truly digested substrate and the difference was significant (P<0.05). However, maize grain, sorghum grain, bajra and broken rice did not vary among themselves. Oats grain produced maximum methane at half life (t1/2) (2.85 ml/100 mg truly digested substrate) compared to all other cereal grains which may be due to high NDF (30.8%) and low digestibility (76.2%). Lowest methane was produced by ragi grain at 24 hrs (1.59 ml/100 mg truly digested substrate) and highest methane was produced by bajra grain, oats grain and distiller’s grain at 24 hrs (3.71, 3.77 and 3.78 ml/100 mg truly digested substrate respectively), however, there was no significant difference found among the cereal grains. Average methane production potential of cereal grains both at half life (t1/2) and 24 hrs was 1.58 and 2.72 ml/100 mg truly digested substrate, respectively.
High methane production of cereal grains compared to cereal by-products and protein supplements might be attributed to high contents of easily fermentable starch, sugars or hemicellulose as substrate to rumen microbes for fermentation. Cereal grains contain high amount of NFE which is readily fermented by ruminal microbes and provide the large amount of substrates to microbes for methane production. Besides the high amount of easily fermentable substrates, Bonhomme, (1990) reported that grains rich in soluble carbohydrates increase the population of cilliate protozoa and stimulate their hydrogen transfer to
methanogens resulting in high methane production. Lee et al. (2003) reported that the methane production potential of corn at 6 and 24 hrs was 4.03 and 10.33 ml/0.2g DM, respectively. Methane production potential of oat grain at 6 and 24 hrs was 4.34 and 6.87 ml/0.2 g DM, respectively (Lee et al., 2003).
Methane production potential both at half life (t1/2) and 24 hrs were maximum (P<0.05) in wheat bran (1.98 and 2.71 ml/100 mg truly digested substrate, respectively). Similarly, Lee et al. (2003) reported that methane production potential of rice bran was lower than wheat bran. Average methane production potential of cereal by-products at half life (t1/2) and 24 hrs was 1.27 and 1.81 ml/100 mg truly digested substrate, respectively. Rice bran contains high concentration of unsaturated fatty acid. Czerkawski et al. (1966) reported that unsaturated fatty acids are hydrogenated by rumen microbes resulting in low pressure of hydrogen which is pre-requisite for reduction in methane production. In addition, fat, itself, is considered to inhibit methane production by stimulating propionate production and inhibiting the protozoa activity as well as inhibitory effects on cellulolytic bacteria and feed digestion in rumen.
Average methane production potential of protein supplements at half life (t1/2) and 24 hrs were 1.39 and 1.75 ml/100 mg truly digested substrate, respectively and the difference was significant (P<0.05). Maximum (P<0.05) methane production
Ind. J. Vet. & Anim. Sci. Res., 48 (1) 12-20, Jan. - Feb, 2019
Ramachandran
19
potential at half life (t1/2) was recorded in black gram (4.07 ml/100 mg truly digested substrate). Lowest methane production potential both at half life (t1/2) and 24 hrs were recorded in fish meal and spirulina. Lower methane production potential of protein supplements compared to cereal grains might be due to high crude protein generally more than 20% and low amount of fibre. Protein is degraded to ammonia in rumen and it combines to carbon dioxide resulting in production of ammonium carbonate (Getachew et al., 1998) resulting in its lower methane production.
It can be concluded that among cereal grains, methane production potential was higher (P<0.05) in oats grain at half life (t1/2) and all the cereal grains had similar methane production potential at 24 hrs. Among cereal by-products, wheat bran had higher (P<0.05) methane production potential both at half life (t1/2) and 24 hrs. Among protein supplements, black gram had significantly (P<0.05) higher methane production potential at half life (t1/2) and horse gram had significantly (P<0.05) higher methane production potential at 24 hrs.
ACKNOWLEDGMENT
The authors thankfully acknowledge Indian Council of Agricultural Research (ICAR) for providing financial grant to carry out the research project.
REFERENCES
AOAC, (1995). Official Methods of Analysis. 16th Edition. Association of
Official Analytical Chemists, USDA, Arlington, DC.
Bonhomme, A. (1990). Rumen ciliates: their metabolism and relationships with bacteria and their hosts. Animal Feed Science and Technology. 30: 203-266.
Czerkawski, J.W., Blaxter, K.L. and Wainman, F.W. (1966). The metabolism of oleic, linoleic, and linolenic acids by sheep with reference to their effects on methane production. British Journal of Nutrition. 20: 349- 362.
Getachew, G., Blummel, M., Makkar, H.P.S. and Becker, K. (1998). In vitro gas measuring techniques for assessment of nutritional quality of feeds: a review. Animal Feed Science and Technology. 72: 261- 281.
Goering, H.K. and Van Soest, P.J. (1970). Forage fibre analysis – apparatus, reagents, procedures and some applications. Agricultural Handbook No. 379, ARS, USDA Washington, DC.
Hervas, G., Ranilla, M.J., Mantecon, A.R., Bodas, R. and Frutos, P. (2004). Comparison of in vitro digestibility of feedstuffs using rumen inoculums from sheep or red deer. Journal of Animal and Feed Science. 13(1): 91-94.
IPCC, 1996. Intergovernmental Panel on Climate Changes. Climate Change. The Second IPCC Scientific Assessment, WMO/ UNEP, Cambridge University Press, Cambridge, UK.
Ind. J. Vet. & Anim. Sci. Res., 48 (1) 12-20, Jan. - Feb, 2019
Methane production potential of feed .... in vitro gas production test

20
IPCC, 2001. The scientific basis. Contribution of working group I to the third assessment report of the Intergovernmental Panel on Climate Change. Cambridge, UK: Cambridge University Press.
Khan, M.Y., Khan, F. and Haque, N. (2001). Global Warming and Stratospheric Ozone layer Depletion by Greenhouse Gases with special reference to Methane production from Indian Livestock. Animal Nutrition and Feed Technology. 1(2): 79-96.
Kumar, V., Mayank Tandon, Vermam, M.P. (2008). Environment friendly dairy farming: Nutritional Techniques for Mitigating Methane Production from Ruminants, Dairy Planner. 4 (11): 12-14.
Lee, H.J., Lee, S.C., Kim, J.D., Oh, Y.G., Kim, B.K., Kim, C.W. and Kim, K.J. (2003). Methane production of feed ingredients as measured by in vitro gas test. Asian-Australasian Journal of Animal Science. 16(8): 1143-1150.
Makkar, H.P.S., Blummel, M. and Becker, K. (1995). Formation of complexes between polyvinyl pyrrrolidone and polyethylene glycol with tannins and
their implications in gas production and true digestibility in in vitro techniques. British Journal of Nutrition. 73: 897-913.
McCrabb, G.J. and Hunter, R.A. (1999). Prediction of methane emissions from beef cattle in tropical production systems. Australian Journal of Agricultural Research. 50: 1335–1339.
Menke, K.H. and Steingass, H. (1988). Estimation of the energetic feed value obtained from chemical analysis and in vitro gas production using rumen fluid. Animal Research and Development. 28: 7–55.
Moss, A.R., Jouany, J. and Newbold, J. (2000). Methane production by ruminants: its contribution to global warming. Annales de Zootechnie. 49: 231–253.
SAS. SAS User’s guide. Statistics (SAS / SPSS version 15.Ed) SAS Inst. INC., Cary, NC.
Singh, G.P., Nagpal, A.K. and Sainj, N. (2005). Methane production in relation to productivity of livestock and environment: a review. Indian Journal of Animal Science. 75: 143–148.
Ind. J. Vet. & Anim. Sci. Res., 48 (1) 12-20, Jan. - Feb, 2019
Ramachandran

21
Effect of accelerated feeding in the growth performance and carcass quality in native kids
T.Muthuramalingam1, E. Rachel Jemimah2, P.Tensingh Gnanaraj3, P.Pothiappan4 and A. Shanmuga sundaram5
Tamil Nadu Veterinary and Animal Sciences University University Research Farm,
Madhavaram Milk Colony, Chennai - 600 051, India
ABSTRACT
A trial was conducted to evaluate the effect of accelerated feeding method in the growth and carcass studies of native goat kids. Thirty male country goat (non – descriptive) kids at the age of 30 - 45 days were selected for this study. The kids were divided into two groups, control and treatment groups, each consist of 15 kids. The control group kids were fed with concentrate feed consisting of 15% crude Protein (CP), 75% Total Digestible Nutrient (TDN), CO4 grass as a sole green fodder and sorghum stover, bengal gram and groundnut tops as a dry fodder. The treatment group kids were fed with concentrate feed containing 21% crude Protein (CP), 75% Total Digestible Nutrient (TDN), CO4 grass and COFS 29 grass as a green fodder and sorghum stover, bengal gram and groundnut tops as a dry fodder. In addition the treatment group kids were fed with supplements such as TANUVAS mineral mixture, probiotics, baking soda and Groviplex®, Ostovet®, Brotone®. The study was conducted for a period of 6 months. The body weight of kids was recorded at fortnight intervals. Parameters such as average feed intake per goat, average total body weight gain, average daily body weight gain and cost of production per kg live weight gain were studied.
The kids were slaughtered at the end of study period and carcass parameters like pre slaughter weight, carcass weight, dressed weight and weights of blood, head, feet, stomach with contents, lungs, heart, kidney, spleen, liver and skin were studied. After analysis of data, significant (P< 0.01) difference was noticed between control group and treatment group in terms of final body weight (C -13.28±0.10 kg, T - 17.00±0.06 kg), average total body weight gain (C -6.74 ±0.09 kg, T - 9.98±0.10 kg), average daily body weight gain (P< 0.05) (C - 0.04±0.08 kg, T - 0.06±0.09 kg) and cost of production per kg live weight gain (C – Rs.98.15±0.15, T – Rs.72.48±0.12) . There was also highly significant difference (P < 0.01) was noticed in carcass quality in terms of pre slaughter weight (C -13.28±0.10 kg,
1* Assistant Professor and Corresponding author - 2 Graduate Assistant, 3Professor and Head, 5 Assistant Professor, University Research Farm, Madhavaram Milk Colony, Chennai – 600 051.4 Assistant Professor, PLAFFS, Madhavaram Milk Colony, Chennai – 600 051.
Ind. J. Vet. & Anim. Sci. Res., 48 (1) 21-30, Jan. - Feb, 2019

22
T - 17.00±0.06 kg), carcass weight (C - 6.25±0.10kg, T - 8.00±0.02 kg), dressed weight (C -5.70±0.15 kg, T - 7.55±0.14 kg), dressing percentage (C - 42.22±0.13%, T - 47.06±0.12%), head (C - 1.13±0.22 kg, T - 1.25±0.02 kg) and stomach (C - 5.10±0.26 kg, T - 6.35±0.2kg). Thus it is concluded that, accelerated feeding significantly improves the body weight gain and carcass yield in native goat kids with low production cost per kg live weight gain.
Key Words: Accelerated feeding, native kids slaughter studies.
INTRODUCTION
Goats are important species of livestock in India. They contribute greatly to the agrarian economy, especially in areas where crop and dairy farming are not economical, and play an important role in the livelihood of a large proportion of small and marginal farmers and landless labourers (Meenakshi Sundaram et al., 2012). Their contribution to economy through production of milk, meat, fiber, skin and manure etc., are substantial constituting above 5.4% of GNP of agricultural sector (Sivakumar., 2013). According to FAO (2004), goat contributed about 475 MT of meat worth Rs.4,750 crores to the Indian economy. The demand for goat meat is progressively increasing as Indian consumers prefer goat meat among all and there is no taboo against consumption of chevon. The number of goats available for slaughter is comparatively higher in India; however, the meat yield per animal is lower than the world average as with 11% of the world livestock it only contributes 2.13% of the total meat produced (Sivakumar., 2013). Therefore, it is important to enhance the growth and carcass yield of goats through
valuable interventions. Accelerated feeding is one of the interventions to improve the growth and carcass yield. 104, 106 and 117 g/d of average daily gain were observed in goats which were fed with diets containing 11.2, 12.7 and 15.1% of CP, respectively (Lu and Potchoiba., 1990). With this background the current study was formulated to test the hypothesis that increasing the crude protein level in the diet of country goats will improve the growth and carcass quality of kids.
MATERIALS AND METHODS
Experimental design
Thirty numbers of early weaned male native kids (non – descriptive) at the age of 30-45 days were divided into two group viz., control group and treatment group (Accelerated feeding). Each group consists of 15 kids. Duration of the study was six months.
Feed formulation
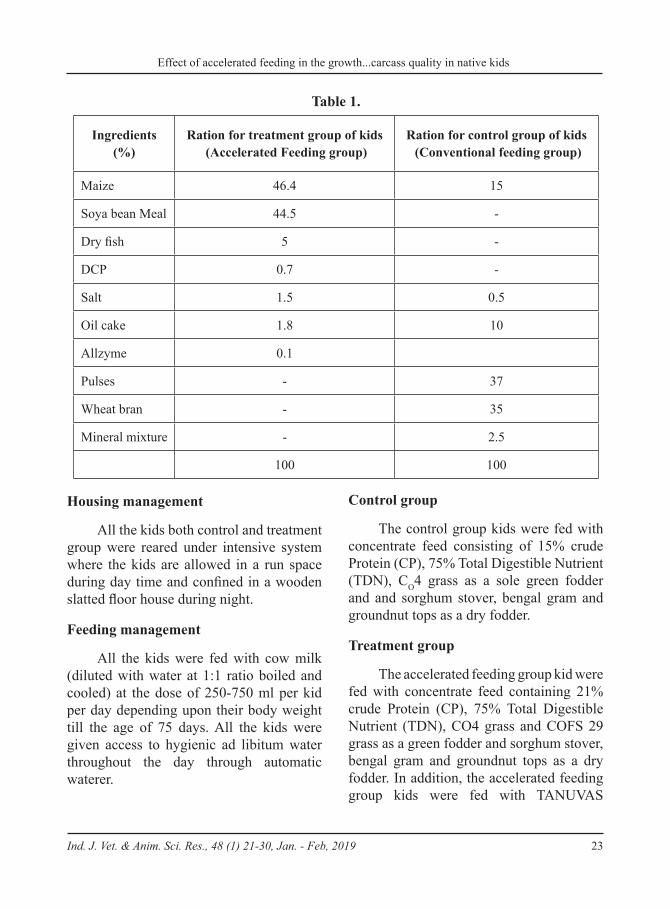
A ration was formulated for control and treatment group under study as given in table 1.
Ind. J. Vet. & Anim. Sci. Res., 48 (1) 21-30, Jan. - Feb, 2019
Muthuramalingam
23
Table 1.
Ingredients(%)
Ration for treatment group of kids (Accelerated Feeding group)
Ration for control group of kids (Conventional feeding group)
Maize 46.4 15
Soya bean Meal 44.5 -
Dry fish 5 -
DCP 0.7 -
Salt 1.5 0.5
Oil cake 1.8 10
Allzyme 0.1
Pulses - 37
Wheat bran - 35
Mineral mixture - 2.5
100 100
Housing management
All the kids both control and treatment group were reared under intensive system where the kids are allowed in a run space during day time and confined in a wooden slatted floor house during night.
Feeding management
All the kids were fed with cow milk (diluted with water at 1:1 ratio boiled and cooled) at the dose of 250-750 ml per kid per day depending upon their body weight till the age of 75 days. All the kids were given access to hygienic ad libitum water throughout the day through automatic waterer.
Control group
The control group kids were fed with concentrate feed consisting of 15% crude Protein (CP), 75% Total Digestible Nutrient (TDN), CO4 grass as a sole green fodder and and sorghum stover, bengal gram and groundnut tops as a dry fodder.
Treatment group
The accelerated feeding group kid were fed with concentrate feed containing 21% crude Protein (CP), 75% Total Digestible Nutrient (TDN), CO4 grass and COFS 29 grass as a green fodder and sorghum stover, bengal gram and groundnut tops as a dry fodder. In addition, the accelerated feeding group kids were fed with TANUVAS
Ind. J. Vet. & Anim. Sci. Res., 48 (1) 21-30, Jan. - Feb, 2019
Effect of accelerated feeding in the growth...carcass quality in native kids

24
mineral mixture @ rate of 10 g/day /kid; baking Soda at the rate of 3g/day/kid to prevent bloat; probiotics at the rate of 5 g/day/kid (Each gram contains Streptococcus faecalis T -110 (2X10⁸) 20 mg, Bacillus mesentericus TO-A (2X10⁶) 20 mg, Clostridium butyricum TO -A (2X10⁶) 20 mg and lactose 40 mg) to improve rumen function; Groviplex®, Ostovet®, Brotone® a cocktail of vitamin B complex, calcium, growth promoter at the rate of 5 ml/ day/ kid along with concentrate feed as a feed supplements.
Health care
Both the control and treatment group kids were given the same health cover like deworming and vaccination during the study period. During the study period, fecal samples were collected once in month and sent for screening of parasitic load. Common parasite detected in the fecal samples was Schistosoma sp. Based on the result the kids were dewormed using Ivermectin oral suspension at the rate of 0.02 mg/kg body weight once in a month.
Slaughter studies
At the end of the experiment, the animals were subjected to overnight fasting, recorded for their empty live weight and humanely slaughtered by the severance of carotid arteries and jugular veins. Slaughtering was carried out in a research abattoir at the Department of Meat Science, Madras Veterinary College and University Research Farm (TANUVAS).
After slaughter, the heads were removed at the atlanto-occipital joint, while the fore and hind legs were removed at the
carpal and tarsal joints respectively. The animals were skinned while suspended by their achilles tendon. Carcass and non-carcass components were weighed immediately after slaughter. The heart, liver, spleen, kidney and lungs were weighed together and designated as pluck. The non-carcass components such as head, skin and feet were also weighed and designated as offal. The weight of digestive contents (gut fills) was computed as the difference between full and empty digestive tract (rumen and intestines). Prior to skinning and the removal of the visceral organs from the carcass, the oesophagus was tied with nylon string to prevent contamination of carcass by the gut contents. Visceral fats were removed and weighed. The carcasses were weighed immediately after dressing which was designated as hot carcass weight. Each carcass was split longitudinally to left and right halves. Each half was further split into fore and hind quarters using a carcass splitting saw and finally expressed as percentages of each tissue per whole carcass weight.
The amount of non-carcass components such as offal (head, legs and skin) was determined as a percentage of slaughter weight. The gut fill was recorded as percentages of total weight of gut (rumen and intestine including their contents) and the viscera (rumen and intestines) were reported as percentages of total weight of gut (including their contents) while the pluck (heart, liver, kidney and lungs) were weighed and recorded as percentages of carcass weight. The compositions of visceral fat, subcutaneous fat, inter-muscular fat as well as fat in pluck (heart, liver, kidney, and lungs) were recorded as percentages of total trimmable fats.
Ind. J. Vet. & Anim. Sci. Res., 48 (1) 21-30, Jan. - Feb, 2019
Muthuramalingam

25
Collection and analysis of data
All the kids were weighed at fortnight interval. The average intake of concentrate feed, green and dry roughages by the kids were recorded daily. The carcass parameters such as pre slaughter weight, carcass weight, dressed weight and weights of blood, head, feet, stomach with contents, lungs, heart, kidney, spleen, liver and skin were also studied. The accumulated data were analyzed by ‘t’ test using Graphpad prism software.
RESULTS AND DISCUSSION
Feeding high quality protein rich diet with added supplements for enhanced growth, feed efficiency and carcass quality is called accelerated feeding. Accelerated milk feeding system have been commonly used in calf rearing by supplementing high quantity of milk than conventional feeding for increased growth rate and earliest first calving. However, in goats accelerated feeding has been tried with either increasing the energy level of concentrate feed or
protein level of concentrate feed. Saeed Ahmed Abbasi et al. (2012) have studied the effect of different dietary energy levels on the growth performance of Kamori goat kids. He concluded that high energy ration is cost effective and positively affects on weight gain and dressing percentage age of goat kids. So it can be used for increasing meat production. Liméa et al. (2009) have studied the growth performance and carcass quality of indigenous Caribbean goats under varying nutritional densities i.e. different protein content of the concentrate diet. Thus increasing the energy or protein level in the diet of goat kids consequently increases the growth and carcass quality. The current study was formulated to test the hypothesis that increasing the crude protein level in the diet of country goats will improve the growth and carcass quality of kids.
Proximate analysis of feed and fodder
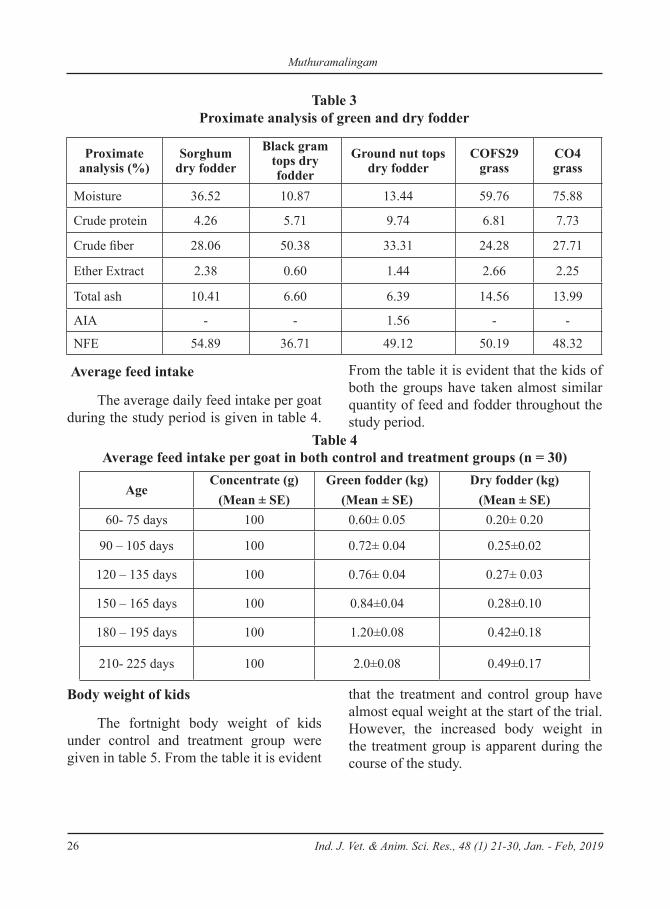
The proximate analysis of concentrate feed, green fodder and dry fodder used in the study were given in table 2 and 3.
Table 2 : Proximate analysis of concentrate feed
Proximate analysis(%)
Concentrate ration for control group of kids
Concentrate ration for treatment group of kids
Moisture 15.18 11.08
Crude protein 15.18 21.02
Crude fiber 15.31 15.14
Ether Extract 2.58 2.58
Total ash 8.57 8.50
AIA 0.87 0.88
NFE 51.79 54.94
Ind. J. Vet. & Anim. Sci. Res., 48 (1) 21-30, Jan. - Feb, 2019
Effect of accelerated feeding in the growth...carcass quality in native kids
26
Table 3 Proximate analysis of green and dry fodder
Proximate analysis (%)
Sorghum dry fodder
Black gram tops dry fodder
Ground nut tops dry fodder
COFS29 grass
CO4 grass
Moisture 36.52 10.87 13.44 59.76 75.88
Crude protein 4.26 5.71 9.74 6.81 7.73
Crude fiber 28.06 50.38 33.31 24.28 27.71
Ether Extract 2.38 0.60 1.44 2.66 2.25
Total ash 10.41 6.60 6.39 14.56 13.99
AIA - - 1.56 - -
NFE 54.89 36.71 49.12 50.19 48.32
Average feed intake
The average daily feed intake per goat during the study period is given in table 4.
From the table it is evident that the kids of both the groups have taken almost similar quantity of feed and fodder throughout the study period.
Table 4 Average feed intake per goat in both control and treatment groups (n = 30)
AgeConcentrate (g)
(Mean ± SE)Green fodder (kg)
(Mean ± SE)Dry fodder (kg)
(Mean ± SE)60- 75 days 100 0.60± 0.05 0.20± 0.20
90 – 105 days 100 0.72± 0.04 0.25±0.02
120 – 135 days 100 0.76± 0.04 0.27± 0.03
150 – 165 days 100 0.84±0.04 0.28±0.10
180 – 195 days 100 1.20±0.08 0.42±0.18
210- 225 days 100 2.0±0.08 0.49±0.17
Body weight of kids
The fortnight body weight of kids under control and treatment group were given in table 5. From the table it is evident
that the treatment and control group have almost equal weight at the start of the trial. However, the increased body weight in the treatment group is apparent during the course of the study.
Ind. J. Vet. & Anim. Sci. Res., 48 (1) 21-30, Jan. - Feb, 2019
Muthuramalingam

27
Table 5 Body weight of kids
Age in daysControl (n=15) Treatment (n=15)
Body weight (kg) (Mean ± SE)
Body weight (kg)(Mean ± SE)
45 days 6.92±0.09 7.022±0.06
60 days 7.02±0.08 7.41±0.06
75 days 7.25±0.70 7.79±0.06
90 days 7.63±0.08 8.15±0.07
105 days 8.05±0.08 8.43±0.07
120 days 7.58±0.98 8.12±0.07
135 days 8.03±0.10 8.71±0.07
150 days 9.13±0.11 10.23±0.07
165 days 9.54±0.11 11.25±0.07
180 days 11.22±0.11 12.9±0.07
195 days 12.81±0.10 14.47±0.06
210 days 13.28±0.10 15.31±0.06
225 days 14.8±0.12 17.0±0.06
Production parameters
The growth parameters of the control and treatment group were given in table 6. Significantly higher total body weight gain (C - 6.74 ±0.09 kg,T - 9.98±0.10 kg) and daily body weight gain weight (C - 0.04±0.08 g, T - 0.06±0.09 g) was noticed in the treatment group fed with concentrate having 21% crude protein level than control group. Bhakt et al. (1987) also reported higher growth rate with increasing dietary
crude protein level in the diet of goats and observed maximum growth rate fed with dietary crude protein level of 25% in indigenous Bihar goats. Significantly higher average daily weight gain was noticed in the treatment group kids i.e. 0.06±0.09 kg/day/kid than control group 0.04±0.08 kg/day/kid. Liméa et al. (2009) also reported that feeding diet containing 20.9% crude protein at 140g/kid/day, 240g/kid/day and 340g/kid/day significantly improve the average daily weight gain indigenous
Ind. J. Vet. & Anim. Sci. Res., 48 (1) 21-30, Jan. - Feb, 2019
Effect of accelerated feeding in the growth...carcass quality in native kids

28
Caribbean goats. The cost of feeding per kg live weight gain was significantly lower in the treatment group (Rs.72.48±0.12) than control group (Rs.98.15±0.15). Thus,
accelerated feeding i.e. feeding high protein diet to kids improves its growth performance with significant reduction in the production cost.
Table 6 Production parameters and economics
Parameters Control TreatmentNo. of kids per treatment 15 15Initial body weight (kg)(30 - 45 days of age) 6.92±0.09 7.02±0.06NS
Final body weight (kg) (210 - 225 days of age) 13.28±0.10 17.00±0.06**
Average total body weight gain (kg) 6.74 ±0.09 9.98±0.10**Average daily body weight gain (kg/day/kid) 0.04±0.08 0.06±0.09*Cost of production per kg live weight gain (Rs.) 98.15±0.15 72.48±0.12**
* - Significant (P<0.05), ** - Significant (P<0.01), NS - Not significant (P>0.05)
Slaughter studies
The carcass parameters studied were given in table 7. From the table, it is evident that the carcass quality of the accelerated feeding group kid was significantly higher than the control group kids. The high protein diet fed kids had significantly higher pre slaughter weight 17.0±0.06 kg, carcass weight 8.00±0.02 kg, dressed weight 7.55±0.14 kg and dressing percentage 47.06±0.12% than control group kids fed with convention feed with 15%
dietary crude protein level. Limea et al. (2014) also found that the carcass weight and the dressing percentage of Creole kids improved with the progressive addition of concentrate with 20.9% crude protein at the rate of at G100 - 140g/kid/day, G200 - 240g/kid/day and G300 - 340g/kid/day. He also stated that the greater dressing percentage for G200 and G300 animals was probably due to better body development. Thus, accelerated feeding with high dietary crude protein level improves the carcass quality and body development in goats.
Ind. J. Vet. & Anim. Sci. Res., 48 (1) 21-30, Jan. - Feb, 2019
Muthuramalingam

29
Table 7 Slaughter studies
Age of the carcass: 225 days
Parameters Control (n=15)(Mean ± SE)
Treatment (n=15)(Mean ± SE)
Pre slaughter weight (kg) 14.8±0.12 17.0±0.06**
Carcass weight (kg) 6.25± 0.10 8.00±0.02**
Dressed Weight (kg) 5.70±0.15 7.55±0.14**
Dressing percentage (%) 42.22±0.13 47.06±0.12**
Blood (kg) 0.41±0.22 0.46±0.31 NS
Head (kg) 1.13±0.22 1.25±0.02**
Feet (kg) 0.51±0.29 0.52±0.27 NS
Stomach (kg) 5.10±0.26 6.35±0.2**
Lungs (kg) 0.25±0.02 0.28±0.21 NS
Heart (kg) 0.07±0.003 0.07±0.00 NS
Kidney (kg) 0.11±0.10 0.09±0.01 NS
Spleen (kg) 0.03±0.00 0.03±0.00 NS
Liver (kg) 0.27±0.25 0.28±0.00 NS
Skin (kg) 1.18±0.04 1.28±0.57 NS
* - Significant (P<0.05) ** - Significant (P<0.01)NS - Not significant (P>0.05)
Ind. J. Vet. & Anim. Sci. Res., 48 (1) 21-30, Jan. - Feb, 2019
Effect of accelerated feeding in the growth...carcass quality in native kids

30
REFERENCES
Bhakt, R., Narayan, P., Prasad, T. and Singh, R.N. 1987. Growth performance of meat producing indigenous goat of bihar fed on different dietary protein levels. Indian Journal of Animal Nutrition., 4(4):243 – 248.
FAO, 2004. Production year book. Food and Agriculture Organization, Rome, Italy.
Limea, L., Boval, M., Mandonnet, N., Garcia, G., Archimede, H. and Alexandre, G. 2009. Growth performance, carcass quality, and non carcass components of indigenous Caribbean goats under varying nutritional densities. Journal of Animal Science., 87:3770-3781.
Lu., C.D. and Potchoiba, M.J. 1990. Feed intake and weight gain of growing goats fed diets of various energy and protein levels. Journal of Animal Science., 68(6):1751-1759.
Meenakshi Sundaram, S., Muthuramalingam, T., Rajkumar, J.S.I., Nishanth, B. and Sivakumar, T. 2012. Growth performance of Tellicherry goats in an organized farm. International Journal of Diary Science Research., 1(3): 9-11.
Saeed Ahmed Abbasi, Muzafar Ali Vighio, Saeed Ahmed Soomro, Allah Bux Kachiwal, Javaid Ali Gadahi and G. L Wang, 2012. Effect of different dietary energy levels on the growth performance of Kamori goat kids. International Journal for Agro Veterinary and Medical Sciences., 6(6): 473-479.
Sivakumar, P., 2013. A study on the effect of pre slaughter weight on carcass traits and meat quality and proximate composition of kanni goat meat. International Journal of Science, Environment and Technology., 2(5): 994 – 999.
Ind. J. Vet. & Anim. Sci. Res., 48 (1) 21-30, Jan. - Feb, 2019
Muthuramalingam

31
INTRODUCTION
Cashew apple waste (CAW) a by-product of cashew apple processing has been identified as an alternative feed resource for poultry but wasted without commercial exploitation (Murugan et al., 2015). Though, CAW is considered as one of the feed resources and shows promising growth performance in broilers (Bhamare et al., 2016); inclusion levels are limited due
Effect of exogenous enzymes supplementation on growth performance and histo morphology of duodenum of broilers fed cashew apple waste
based diets*
P.Venkatramana1, S. Senthil Murugan2 and H.S. Patki3, Department of Animal Nutrition,
College of Veterinary and Animal Sciences, Pookode, Wayanad, Kerala, India.
ABSTRACT
The current experiment was conducted to study the histology of duodenum in broilers fed with different levels of inclusion of cashew apple waste (CAW) as well as enzymes. The study was carried out for a period of 42 days. A sum total of two hundred and ten day-old vencobb-400 broiler chicks were randomly divided into seven groups with three replicates of 10 chicks in each group. Group 1 (G1) received control diet prepared as per BIS (2007) recommendations. G2 and G3 birds received diet prepared with 5 and 10 per cent CAW without any enzyme supplementation, respectively. G4 and G5 birds received 5 per cent CAW with supplementation of 500 g/ton and 750 g/ton of enzymes, respectively. G6 and G7 birds received 10 per cent CAW with supplementation of 500 g/ton and 750 g/ton of enzymes, respectively. It was found that, histomorphological features like villus height and thickness of tunica mucosa were found to be higher in group (G4) where 5 per cent CAW with NSP degrading enzymes at 500 g/ton were fed significantly (p<0.01) when compared to all other groups. The number of goblet cells was observed to be significantly (p<0.01) lesser in the group (G4) when compared to all other groups.
Keywords: Cashew apple waste, duodenum, enzymes, goblet cell, villus
to presence of anti nutritional factors. Due consideration were given to identify anti nutritional factors such as level of condensed tannins and non starch polysaccharides present in CAW (Murugan et al., 2015; Bhamare et al., 2016 and Venkatramana et al., 2018) and these anti nutritional factors were reported to reduce digestibility and influence the growth performance of poultry (Choct, 2006). There are studies on dietary non starch polysaccharides which increases small intestine fermentation and affects the nutrient digestion and absorption for chickens (Bharathidhasan et al., 2010; Nian
Corresponding author email id: *Part of M.V.Sc thesis of the first author submitted to Kerala Veterinary and Animal Sciences University, Pookode, Kerala. 1. MVSc Student 2. Assistant Professor 3. Assistant Professor, Dept. of Anatomy
Ind. J. Vet. & Anim. Sci. Res., 48 (1) 31-39, Jan. - Feb, 2019
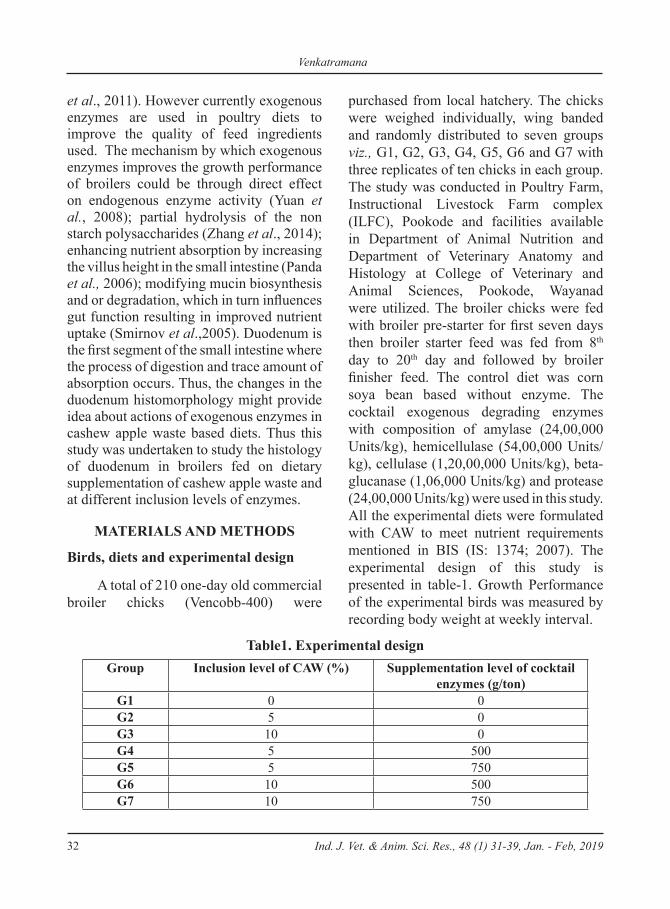
32
et al., 2011). However currently exogenous enzymes are used in poultry diets to improve the quality of feed ingredients used. The mechanism by which exogenous enzymes improves the growth performance of broilers could be through direct effect on endogenous enzyme activity (Yuan et al., 2008); partial hydrolysis of the non starch polysaccharides (Zhang et al., 2014); enhancing nutrient absorption by increasing the villus height in the small intestine (Panda et al., 2006); modifying mucin biosynthesis and or degradation, which in turn influences gut function resulting in improved nutrient uptake (Smirnov et al.,2005). Duodenum is the first segment of the small intestine where the process of digestion and trace amount of absorption occurs. Thus, the changes in the duodenum histomorphology might provide idea about actions of exogenous enzymes in cashew apple waste based diets. Thus this study was undertaken to study the histology of duodenum in broilers fed on dietary supplementation of cashew apple waste and at different inclusion levels of enzymes.
MATERIALS AND METHODS
Birds, diets and experimental design
A total of 210 one-day old commercial broiler chicks (Vencobb-400) were
purchased from local hatchery. The chicks were weighed individually, wing banded and randomly distributed to seven groups viz., G1, G2, G3, G4, G5, G6 and G7 with three replicates of ten chicks in each group. The study was conducted in Poultry Farm, Instructional Livestock Farm complex (ILFC), Pookode and facilities available in Department of Animal Nutrition and Department of Veterinary Anatomy and Histology at College of Veterinary and Animal Sciences, Pookode, Wayanad were utilized. The broiler chicks were fed with broiler pre-starter for first seven days then broiler starter feed was fed from 8th day to 20th day and followed by broiler finisher feed. The control diet was corn soya bean based without enzyme. The cocktail exogenous degrading enzymes with composition of amylase (24,00,000 Units/kg), hemicellulase (54,00,000 Units/kg), cellulase (1,20,00,000 Units/kg), beta-glucanase (1,06,000 Units/kg) and protease (24,00,000 Units/kg) were used in this study. All the experimental diets were formulated with CAW to meet nutrient requirements mentioned in BIS (IS: 1374; 2007). The experimental design of this study is presented in table-1. Growth Performance of the experimental birds was measured by recording body weight at weekly interval.
Table1. Experimental designGroup Inclusion level of CAW (%) Supplementation level of cocktail
enzymes (g/ton)G1 0 0G2 5 0G3 10 0G4 5 500G5 5 750G6 10 500G7 10 750
Ind. J. Vet. & Anim. Sci. Res., 48 (1) 31-39, Jan. - Feb, 2019
Venkatramana
33
Histo-morphological study
At 42nd day of the trial six birds from each group were sacrificed after administrating chloroform anaesthesia and representative pieces from duodenum were collected and fixed using 10 per cent neutral buffered formalin for histo-morphological measurements. The paraffin embedding was done in medium paraffin wax with ceresin and tissue sections were taken at 5 µm thickness by using semi-automatic M-TECH microtome. Haematoxylin and Eosin (H & E) and Per Iodic Acid Schiff (PAS) staining methods were used to study histological and muco-polysaccharides respectively as per Luna (1968). The micrometric measurements were taken using ProgRes® capture 2.8.8.version. JENOPTIKR, Optronics software at 10 X magnification for intestinal villus, thickness of mucosa and 40 X magnification for goblet cells and height of epithelium.
Statistical analysis
The data were analyzed using GLM procedure of statistical Package for social sciences (SPSS) 21st version and comparison of means was done using Ducan’s multiple range test and significance was considered at p < 0.01.
RESULTS AND DISCUSSION
Inclusion of CAW at 5 per cent without NSP degrading enzyme did not show any improved body weight in this study; whereas Bhamare et al. (2016) mentioned better body weight compared against 10 and 20 per cent inclusion level in broilers. Significant increase in live body weight (g/bird) of broilers in CAW (5 per cent) with enzyme supplementation (500 g/ton) at 6th week of its age where recorded when compared against 5 and 10 per cent CAW fed without enzyme supplementation. In this study, the enzyme supplemented groups showed improved body weight comparable to control. The mean weekly body weight of the broilers is presented in table-2.
Ind. J. Vet. & Anim. Sci. Res., 48 (1) 31-39, Jan. - Feb, 2019
Effect of exogenous enzymes supplementation on ..... apple waste based diets*

34
Table 2. Mean weekly body weight of broilers (g/bird) fed CAW with/without enzyme supplementation
Age (week)
G1 G2 G3 G4 G5 G6 G7 F-value p-value
Initial B. wt
42.36±
0.47
44.72±
2.10
44.24±
0.68
44.03±
0.46
45.48±
1.03
43.99±
0.64
46.14±
0.681.42 ns 0.27
I150.58b
±0.59
143.39c
±0.66
161.24a
±1.71
154.01b
±0.30
155.34b
±3.37
165.33a
±1.63
150.89b
±2.11
16.52** <0.001
II391.82a
±6.33
319.56b
±36.44
407.14a
±15.45
440.00a
±1.69
417.20a
±1.11
421.66a
±6.55
417.31a
±7.46
6.29** <0.001
III742.52ab
±6.91
671.02c
±8.28
731.73ab
±24.58
698.02bc
±3.67
715.99abc
±8.97
759.50a
±27.45
764.40a
±2.85
5.03** <0.001
IV1312.58ab
±54.78
1268.14b
±10.78
1322.00ab
±41.01
1414.37a
±35.17
1262.52b
±35.91
1437.75a
±59.45
1369.88ab
±26.48
2.84* <0.05
V1894.26b
±4.68
1833.26b
±10.63
1877.33b
±38.69
2061.90a
±4.47
1937.65b
±27.32
1910.89b
±47.62
1929.72b
±56.59
4.54** <0.001
VI2290.87abc
±35.68
2194.99bc
±56.79
2264.33bc
±35.57
2395.08a
±5.99
2365.93a
±9.61
2268.33bc
±53.22
2288.89abc
±20.96
3.40* <0.02
Mean values with different superscript within a row differ significantly.** Significant at 0.01 level; * significant at 0.05 level; ns-non- significant. G1-without CAW and cocktail enzymes; G2- 5 % CAW without cocktail enzymes; G3- 10% CAW without cocktail enzymes; G4-5 % CAW with cocktail enzymes (500 g/ton); G5-5 % CAW with cocktail enzymes (750 g/ton); G6- 10 % CAW with cocktail enzymes (500 g/ton);G7- 0 % CAW with cocktail enzymes (750 g/ton).
The micrographs depicting histo architecture of villi are as shown in Fig. 1. Per Iodic Acid Schiff stain micrographs of goblets cells are depicted in Fig.2. The
micrometric measurements of duodenum length of villus (μm), thickness of tunica mucosa (μm) and goblet cell numbers recorded are presented in table 3.
Ind. J. Vet. & Anim. Sci. Res., 48 (1) 31-39, Jan. - Feb, 2019
Venkatramana
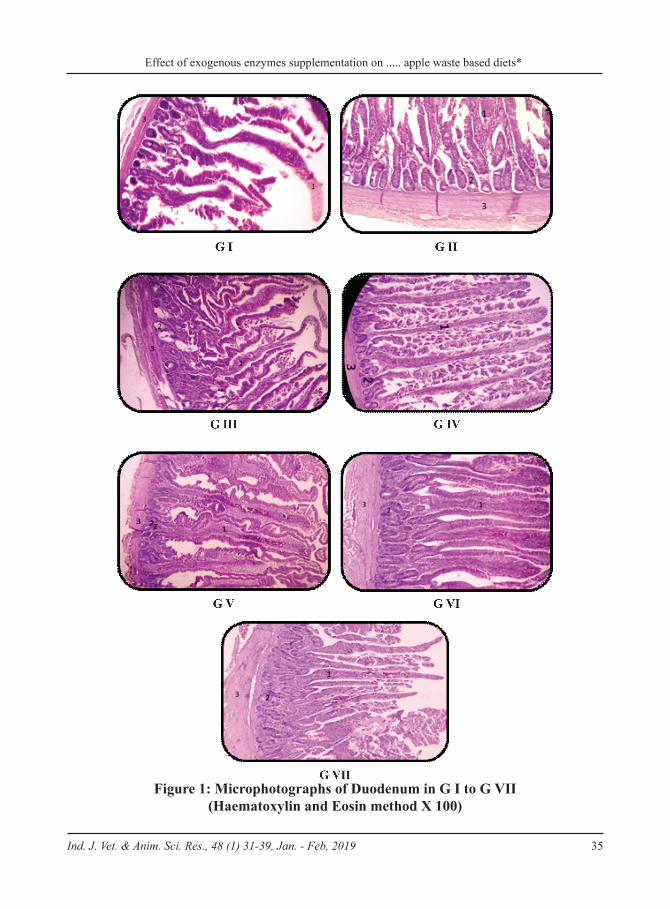
35
Figure 1: Microphotographs of Duodenum in G I to G VII (Haematoxylin and Eosin method X 100)
Ind. J. Vet. & Anim. Sci. Res., 48 (1) 31-39, Jan. - Feb, 2019
Effect of exogenous enzymes supplementation on ..... apple waste based diets*

36
Figure 2: Microphotographs of Duodenum in G I to G VII (Per iodic Acid Schiff method X 400) Arrow indicates goblet cells showing presence of mucopolysaccharides
Ind. J. Vet. & Anim. Sci. Res., 48 (1) 31-39, Jan. - Feb, 2019
Venkatramana

37
Table 3.Micrometric parameters of duodenum
AttributesGroup
F-value p-valueG1 G2 G3 G4 G5 G6 G7
Villi height (μm)(10X)
1292.43bc
±47.55
1389.82b
±32.45
934.63e
±24.96
1601.08a
±71.13
1180.33cd
±28.79
1262.43bcd
±34.26
1154.47d
±50.26
22.22** <0.001
Thickness of mucosa
(μm) (10X)
1522.10abc
±68.68
1688.08ab
±18.93
983.60d
±161.30
1779.43a
±37.72
1420.6bc
±31.88
1293.1cd
±225.84
1413.70bc
±38.97
5.61** <0.001
Goblet cell number (40X)
267.00a
±3.10
203.83b
±3.82
193.83c
±3.20
89.17f±
2.89
107.83e
±2.41
113.00e
±2.67
167.67d
±2.80
448.35** <0.001
Height of Lining
epithelium(μm) (40X)
38.60a
±0.80
24.83d
±0.71
31.50c
±0.67
30.85c
±0.65
35.46b
±1.45
33.20bc
±1.27
35.03b
±1.43
16.99** <0.001
Mean values with different superscripts with in a row differ significantly.** Significant at 0.01 level. G1-without CAW and cocktail enzymes;G2- 5 % CAW without cocktail enzymes;G3- 10% CAW without cocktail enzymes;G4-5 % CAW with cocktail enzymes (500 g/ton);G5-5 % CAW with cocktail enzymes (750 g/ton);G6- 10 % CAW with cocktail enzymes (500 g/ton);G7- 0 % CAW with cocktail enzymes (750 g/ton).
Significant (p<0.01) increase in villi length of duodenum in enzyme supplemented group in current study are in concurrence with Balamurugan et al.(2011); Mazhari et al.(2015) and Thavasiappan et al. (2016).The highest duodenal villus length was recorded in group (G4) where 5 per cent CAW with NSP degrading enzymes at 500 g/ton was fed (p<0.01). However, there was no linear increase in villi length, but a decrease was recorded in 750 g/ton supplemented group with 5 per cent CAW. Similar, observations were given by Yuan et al. (2008) and Luo et al. (2009) where higher dose of enzyme might suppress excretion of endogenous enzymes and damage the structure of small intestine.
Significantly (p<0.01) minimum number of goblet cells have been recorded in duodenum of birds that received 5 per cent CAW with 500 g/ton of enzyme supplementation. Similarly, Balamurugan
et al. (2011) recorded reduced goblet cell numbers compared to control in broiler chicks where cellulase, xylanase, pectinase and phytase enzyme were supplemented.
It could be corroborated that, the birds fed with 5 per cent CAW, supplemented with 500 g/ton enzymes showed increase in duodenum villi length which, increased surface area and allows greater absorption of nutrients. Decrease in goblet cells numbers in response to enzyme supplementation evidenced disruption of mucous layers, decrease in mucin secretion, improved digestibility and better body weight.
CONCLUSION
It could be concluded that the cashew apple waste included in broiler diet and enzyme supplementation improves bird’s performance which correlated with morphometric measurements of duodenum.
Ind. J. Vet. & Anim. Sci. Res., 48 (1) 31-39, Jan. - Feb, 2019
Effect of exogenous enzymes supplementation on ..... apple waste based diets*

38
REFERENCES
Balamurugan, R., Chandrasekaran, D. and Kirubakaran, A. 2011. Effects of multi-enzyme supplementation on gut morphology and Histomorphology in broilers. Indian J. Sci. and Tech.4:15-18
Bhamare, K.S., Dildeep, V., Senthil Murugan, S. and Chavan, S.J. 2016. Nutritive evaluation of cashew apple waste in broilers. Intl. J. Sci. and Nat.7: 629-632
Bharathidhasan A., Chandrasekaran D., Natarajan A., Ravi R and Ezhilvalavan S., 2010. Effect of enzyme supplementation to nutrient reduced diet on performance of broilers. Tamilnadu J. Vet. & Anim. Sci. 6:174-178
Choct, M. 2006. Enzymes for the feed industry: past, present and future. World’s Poul. Sci. 81: 1842-1849
Indian standard for Poultry Feeds, 2007. Bureau of Indian Standards (IS: 1374), 5th revision, New Delhi.
Luna, L.G. 1968. Mannual of Histologic Staining Methods of Armed Forces Institute of Pathology. (3rd Ed.). McGraw Hill Co., New York. 258
Luo, D., Yang, F., Yang, X., Yao, J., Shi, B. and Zhou, Z. 2009. Effects of xylanase on performance, blood parameters, intestinal morphology, microflora and digestive enzyme activities of broilers fed wheat-based diets. Asian-Aust J. Anim. Sci. 22: 1288-95.
Nian, F., Y. M. Guo, Y. J. Ru, F. D. Li, and A. Péron. 2011. Effect of exogenous xylanase supplementation on the performance, net energy and gut microflora of broiler chickens fed wheat-based diets. Asian Australas. J. Anim. Sci. 24:400-406.
Mazhari, M., Golian, A and Kermanshahi, H. 2015. Effect of corn replacement with graded levels of wheat screening and enzyme supplementation on performance, blood lipids, viscosity and jejunal histomorphology of finisher broilers. Spanish J. Agric. Res.13
Murugan, S.S., Sudhis, K., Rajan, J.K., Varshney, L. and Virendra, K. 2015. Cashew apple (Anacardiumoccidentale): Evaluation of physical and chemical composition. Ind. J. Nat. Sci. 5(29): 4255-4259.
Panda., A.K., Ramarao., S.V., Raju., M.V.L.N. and Sharma., S.R. 2006. Dietary supplementation of probiotic Lactobacillus sporogenes on performance and serum bio-chemicolipid profile of broiler chickens. Indian Journal of Poultry Science, 43: 235-240.
ProgRes® capture 2.8.8.version. JENOPTIKR, Optronics.
Smirnov, A., Tako, E., Ferket, P.R. and Uni, Z. 2006. Mucin gene expression and mucin content in the chicken intestinal goblet cells are affected by in ovo feeding of carbohydrates. Poult. Sci. 85: 669-673.
Ind. J. Vet. & Anim. Sci. Res., 48 (1) 31-39, Jan. - Feb, 2019
Venkatramana
39
Snedecor, G.W. and Cochran, W.G. 1989. Statistical Methods, (8th Ed.). Iowa State University, Ames, I.A.
Thavasiappan V., Selvaraj P.., Jayachandran S. Visha P..,.Paramasivan S., Naik. B.R.2016. Influence of enzyme supplementation on intestinal morphology in Broiler Chicken. J. Agric. Vet. Sci.9: 25-28
Venkatramana P., Senthil Murugan, S., Shyama, K., Biju Chacko, Patki, H.S. and Sunanda. Qualitative and Quantitative Analysis of Phyto-Chemicals in CashewApple Waste. Indian. J. Nat. Sci. 8: 976-997
Yuan, J., Yao, J., Yang, F., Yang, X., Wan, X., Han, J., Wang, Y., Chen, X., Liu, Y., Zhou, Z. and Zhou, N. 2008. Effects of supplementing different levels of a commercial enzyme complex on performance, nutrient availability, enzyme activity and gut morphology of broilers. Asian Aust. J. Anim. Sci. 21: 692.
Zhang, L., Xu, J., Lei, L., Jiang, Y., Gao, F. and Zhou, G.H. 2014. Effect of xylanase supplementation on growth performance, nutrient digestibility and non-starch polysaccharides degradation in different sections of the gastrointestinal tract of broilers fed wheat-based diets. Asian Aust. J. Anim. Sci. 27: 855-861.
Ind. J. Vet. & Anim. Sci. Res., 48 (1) 31-39, Jan. - Feb, 2019
Effect of exogenous enzymes supplementation on ..... apple waste based diets*

40
Development of liquid milk replacer for rearing early weaned piglets
K. Roopa, R. Karunakaran, D.Balasubramanyam, H. Gopi and L.Radhakrishnan Tamil Nadu Veterinary and Animal Sciences University.
Department of Animal Nutrition Madras Veterinary College, Chennai - 600 007, India
ABSTRACT
A 28 day feeding trial was conducted to assess the effect of liquid milk replacer on the growth performance of early weaned piglets. Forty piglets (average birth weight 1.18 ± 0.01 kg) of 14 days of age were selected and grouped into five treatments groups viz (control, unweaned), T1,T2,T3 T4 and T5 and fed with liquid milk replacer type I, type II, type III and type IV, respectively. This study revealed that piglets supplemented with liquid milk replacer type I (T2) had comparable body weight gain (5.95 ± 0.08 kg ) compared to control (5.77 ± 0.28 kg) and T3, T4 and T5 had significantly lower weight gain than T2 and control piglets.
Key words: Average daily gain, Feeding trial, Milk replacer, Piglets,
INTRODUCTION
A newborn piglet lacks a fully developed immune system since they are born immature and they have never been exposed to antigens (Rooke and Bland, 2002). The rapid development of the neonate coincides with the rapid changes in composition of mammary secretions consumed by the suckling piglet. Sow milk production is the major factor limiting piglet growth prior to weaning. Weaning weight is quite variable from litter to litter and much of this variation is due to the quantity of milk produced by sows. Due to larger litter sizes and increased competition for sow milk, nutrient availability for newly born piglets is often limited (Kyriazakis et al., 2006).
Milk replacer may also be offered to piglets while they are with the sow in the farrowing crate to increase weaning weights
and reduce variation in weaning weight and mortality in early weaning programme (Hurley, 2016). Hence, an attempt was made in the present study to develop liquid milk replacer for rearing of early weaned piglets.
MATERIALS AND METHODS
The study was undertaken at the Pig Breeding Unit of Post Graduate Research Institute in Animal Sciences (PGRIAS), Kattupakkam, Kanchipuram district, Tamil Nadu. The research station is located in the longitude of 80.0395° E and latitude of 12.8259°N.
Liquid milk replacer preparation
Four types of liquid milk replacers were prepared by fortifying the cow milk with the deficit nutrients. Based on the analyzed chemical composition of sow milk and the cow milk as per AOAC (2016) the
Ind. J. Vet. & Anim. Sci. Res., 48 (1) 40-44, Jan. - Feb, 2019
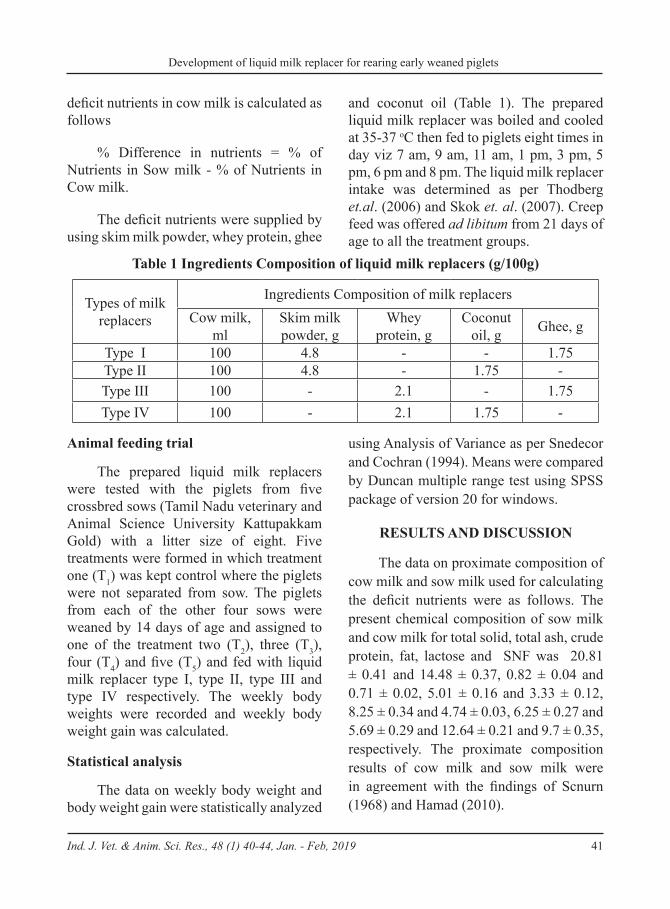
41
deficit nutrients in cow milk is calculated as follows
% Difference in nutrients = % of Nutrients in Sow milk - % of Nutrients in Cow milk.
The deficit nutrients were supplied by using skim milk powder, whey protein, ghee
and coconut oil (Table 1). The prepared liquid milk replacer was boiled and cooled at 35-37 oC then fed to piglets eight times in day viz 7 am, 9 am, 11 am, 1 pm, 3 pm, 5 pm, 6 pm and 8 pm. The liquid milk replacer intake was determined as per Thodberg et.al. (2006) and Skok et. al. (2007). Creep feed was offered ad libitum from 21 days of age to all the treatment groups.
Table 1 Ingredients Composition of liquid milk replacers (g/100g)
Types of milk replacers
Ingredients Composition of milk replacersCow milk,
mlSkim milk powder, g
Whey protein, g
Coconut oil, g Ghee, g
Type I 100 4.8 - - 1.75Type II 100 4.8 - 1.75 -Type III 100 - 2.1 - 1.75Type IV 100 - 2.1 1.75 -
Animal feeding trial
The prepared liquid milk replacers were tested with the piglets from five crossbred sows (Tamil Nadu veterinary and Animal Science University Kattupakkam Gold) with a litter size of eight. Five treatments were formed in which treatment one (T1) was kept control where the piglets were not separated from sow. The piglets from each of the other four sows were weaned by 14 days of age and assigned to one of the treatment two (T2), three (T3), four (T4) and five (T5) and fed with liquid milk replacer type I, type II, type III and type IV respectively. The weekly body weights were recorded and weekly body weight gain was calculated.
Statistical analysis
The data on weekly body weight and body weight gain were statistically analyzed
using Analysis of Variance as per Snedecor and Cochran (1994). Means were compared by Duncan multiple range test using SPSS package of version 20 for windows.
RESULTS AND DISCUSSION
The data on proximate composition of cow milk and sow milk used for calculating the deficit nutrients were as follows. The present chemical composition of sow milk and cow milk for total solid, total ash, crude protein, fat, lactose and SNF was 20.81 ± 0.41 and 14.48 ± 0.37, 0.82 ± 0.04 and 0.71 ± 0.02, 5.01 ± 0.16 and 3.33 ± 0.12, 8.25 ± 0.34 and 4.74 ± 0.03, 6.25 ± 0.27 and 5.69 ± 0.29 and 12.64 ± 0.21 and 9.7 ± 0.35, respectively. The proximate composition results of cow milk and sow milk were in agreement with the findings of Scnurn (1968) and Hamad (2010).
Ind. J. Vet. & Anim. Sci. Res., 48 (1) 40-44, Jan. - Feb, 2019
Development of liquid milk replacer for rearing early weaned piglets

42
The overall body weight of piglets at the start of the feeding trial in T1, T2, T3, T4 and T5 were 3.68 ± 0.11, 3.40 ± 0.04, 2.89 ± 0.12, 4.08 ± 0.27and 4.07 ± 0.37 respectively. The average body weight of piglets at the end of the feeding trial in T1, T2, T3, T4 and T5 were 9.45 ± 0.33, 9.36 ±
0.07, 8 ± 0.60, 8.29 ± 0.60 and 8.39 ± 0.52 respectively (Table 2). The body weight gain at the end of trial in T1, T2, T3, T4 and T5
were 206.18 ± 9.83, 212.59 ± 2.71, 182.54 ± 9.9 150.36 ± 17.73 and 154.24 ± 9.12 respectively (Table 3).
Table 2 The effect of liquid milk replacer on the weekly body weight (kg) of piglets.
Days T1
T2(cow milk+ skim milk
powder + ghee)
T3(cow milk+ skim milk powder + coconut oil)
T4(cow milk+ whey protein + ghee)
T5(cow milk+ whey
protein + coconut oil)Birth weight 1.20 ± 0.02 1.13 ± 0.01 1.16 ± 0.02 1.22 ± 0.04 1.23 ± 0.04
14 3.68 ± 0.11bc 3.40 ± 0.04ab 2.89 ± 0.12a 4.08 ± 0.27c 4.07 ± 0.37c
21 4.90 ± 0.15ab 4.57 ± 0.08ab 4.16 ± 0.24a 5.18 V 0.38b 4.90 ± 0.33ab
28NS 6.39 ± 0.22 6.26 ± 0.11 5.64 ± 0.23 5.79 ± 0.38 5.69 ± 0.39
35 8.05 ± 0.24b 7.88 ± 0.04b 6.58 ± 0.18a 6.83 ± 0.39a 6.86 ± 0.40a
42 9.45 ± 0.33b 9.36 ± 0.07b 8 ± 0.25a 8.29 ± 0.60ab 8.39 ± 0.52ab
P≤0.05, Means with different superscripts in a row differ significantly
Table 3 The effect of liquid milk replacer on the cumulative body weight gain of piglets.
Weeks T1 T2 T3 T4 T5
1 1.22 ± 0.06ab 1.17 ± 0.08ab 1.27 ± 0.19b 1.10 ± 0.15ab 0.83 ± 0.13a
2 2.71 ± 0.13b 2.85 ± 0.12b 2.75 ± 0.24b 1.71 ± 0.21a 1.62 ± 0.20a
3 4.37 ± 0.17b 4.47 ± 0.03b 3.69 ± 0.22b 2.75 ± 0.24a 2.79 ± 0.22a
4 5.77 ± 0.28b 5.95 ± 0.08b 5.11 ± 0.28ab 4.21 ± 0.50a 4.32 ± 0.26a
P≤0.05, Means with different superscripts in a row differ significantly
The piglets fed with liquid milk replacer type I have gained 5.95 ± 0.08 g of body weight when compared with other treatments. There was no significant (P<0.05) difference in body weight and body weight gain between the treatments. This was in agreement with the findings of Ruurd et.al. (1996). However, Dunshea et.al. (1999) found that skim milk feeding before and after weaning could result in cumulative improvements in growth performance in the nursing piglets. André
et. al. (2005) also observed that feeding whey protein as source of protein increased the weight gain by 20 percent when compared with the vegetable protein source. Richard et. al.(1990) concluded that there was no difference in the average daily weight gain between the semiautomatic feeding system group and conventionally fed group, but the diarrhea was commonly seen in conventional system of rearing. Azain et.al. (1996) fed commercial milk replacer on fresh basis (150g/L) ad libitum till
Ind. J. Vet. & Anim. Sci. Res., 48 (1) 40-44, Jan. - Feb, 2019
Roopa

43
weaning (d 21) and observed that the average pig weight and total litter weight at weaning there was no significant difference in litters receiving supplemental milk replacer.
Based on the results obtained from the present study it is observed that there was a significant reduction in the weight gain in the treatments T3, T4 and T5when compared to the T1(control) and T2. However there was no significant difference between the T1 (control) and T2 in body weight and body weight gain at 42nd day of weaning age. Piglets supplemented with liquid milk replacer type I has shown comparable body weight and body weight gain with that of piglets reared with sow’s milk (control).
ACKNOWLEDGEMENT
The authors express the gratitude to the All India coordinated Research Project on Pigs (AICRPF), ICAR New Delhi for financially support and Tamil Nadu Veterinary and Animal Sciences University for providing necessary institutional support.
REFERENCES
Andre, R. Ebert, Adam, S. Berman, Robert, J. Harrell, Alexandre, M. Kessler, Steven G. Cornelius, and Jack Odle. (2005).Vegetable Proteins Enhance the Growth of Milk-Fed Piglets, Despite Lower Apparent Ileal Digestibility. The Journal of Nutrition, 135: 2137–2143.
AOAC. (2016). Official Methods of Analysis. 20thedn. Association
of Official Analytical Chemists, Gaithersburg, MD,USA.
Azain, M. J, Tomkins, T., Sowinski, J. S., Arentson, R. A. and Jewell, D. E. (1996). Effect of Supplemental Pig Milk Replacer on Litter Performance: Seasonal Variation in Response. Journal of Animal Science, 74:2195–2202.
Hamad, Mohamed Nour-Eldin. (2010). Physical Properties and Chemical composition of Cow’s and Buffalo’s Milk in Qena Governorate.Journal of food and Dairy Sciences, Mansoura University., 1: 397 - 403.
Hurley.W.L. (2016).Composition of sow colostrum andmilk. http://www.weigeningenacademic.com.April 20, 2017.IP – 14.139.186.146.
Janko, Skok. Maksimiljan Brus & Dejan S Korjanc. (2007) Growth of piglets in relation to milk intake and anatomical location of Mammary Glands University of Maribor, Faculty of Agriculture, Maribor, Slovenia ActaAgriculturaeScand Section a, 57: 29:135.
Karen, Thodberg. Martin, T. Sørensen. (2006). Mammary development and milk production in the sow: Effects of udder massage, genotype and feeding in late gestation, Denmark Livestock Science 101:16:125
Kerton,D. J, Eason. P. J, and R. H. King. (1999). Supplemental skim milk before and after weaning improves growth
Ind. J. Vet. & Anim. Sci. Res., 48 (1) 40-44, Jan. - Feb, 2019
Development of liquid milk replacer for rearing early weaned piglets
44
performance of pigs. Australian Journal of Agricultural Research, 50:1165-1170.
Kyriazakis, I. Whittemore, C.T. and Whittemore C.T.(2006). Whittemore’s science and practice of pig production. 3rdEdn. Black well Pub., Oxford, UK: Ames, Iowa xvi p 685
Richard, E. McClead, Jr. Mary E, Lentz and Robert, Vieth. (1990). A simple technique to feed newborn piglets.J. PediatrGastroenterol. Nutr.,10:107-110
Rooke, J. A. and Bland, I. M. (2002).The acquisition of passive immunity in the new-born piglet.Livestock Production Science. 78:13-23.
Ruurd, T. Zijlstra, Kwang-Youn Whang, Robert, A. Easter, and Jack Odle. (1996).Effect of Feeding a Milk Replacer to Early-Weaned Pigs on Growth, Body Composition, and Small Intestinal Morphology, Compared with Suckled Littermates.Journal of Animal Science 74:2948:2959.
Schuld, F.W, Bowland, J.P. (1968) Composition of colostrum and milk from sows receiving dietary rapeseed meal or soybean meal Canadian. Journal of Animal Science.,48 (1), 65-69.
Snedecor, G.W. and Cochran,W.G (1994) statistical methods. Eight Edition. The lowa state university press, Ames, lowa, p.313.
Ind. J. Vet. & Anim. Sci. Res., 48 (1) 40-44, Jan. - Feb, 2019
Roopa

45
Development and quality evaluation of low fat functional paneer
Kavya Kuttan and K. Radha
Kerala Veterinary and Animal Sciences University
Department of Dairy Science, College of Veterinary and Animal sciences, Mannuthy-680651, Kerala, India
ABSTRACT
An experiment was conducted to utilize skim milk for the preparation of low fat paneer, a value added product. Low fat paneer was prepared by using whey protein concentrate (WPC) and inulin as fat replacers. Full fat control paneer (C1) was prepared from buffalo milk standardized to 5 per cent fat and 9 per cent SNF. Skim milk control paneer (C2) was prepared from skim milk standardized to 0.3 per cent fat and 9 per cent SNF. WPC was incorporated at 0.25 (T1) and 0.5 per cent levels (T2). Inulin was used at the level of 1.5 (T1) and 2 per cent (T2) for the preparation of low fat paneer. The prepared paneer samples were evaluated for physico-chemical, microbiological and organoleptic qualities. Incorporation of WPC had significantly increased the yield as well as moisture content of low fat paneer. Inulin at 2 per cent level had increased the yield of low fat paneer. Both WPC and inulin had improved the sensory acceptability of low fat paneer prepared from skim milk.
Key words: Paneer, Whey protein concentrate, Inulin, Low fat paneer, Fat replacers
INTRODUCTION
Milk has long been recognized as an ideal and nearly perfect food for all sections of the society. Paneer is an indigenous dairy product obtained by acid coagulation of hot whole milk with subsequent drainage of whey. It is a rich source of milk protein and fat available at a comparatively lower cost. However, it is not preferred by the modern health conscious consumers due to its high fat content. As per the data published by WHO (1965), high intake of fat rich dairy products increased the risk of cardio vascular diseases because of high proportions of saturated fatty acids. This offers an opportunity for development and commercial manufacture of low fat paneer suitable for persons suffering from lifestyle related diseases. Since fat is
largely responsible for the desirable flavor, body and texture of paneer, reducing the fat content will lead to several sensory quality defects such as rubbery, chewy and hard body. These defects could be prevented by the use of fat replacers in low fat products.
Fat replacers are the substances with the same functions, stability, physical and chemical characteristics as regular fat but with low calories. They help to improve the organoleptic qualities of low fat dairy products. Whey protein concentrates (WPC) are protein based fat replacers that have the potential to improve the organoleptic qualities of low fat dairy products. Inulin is a carbohydrate based fat replacer and dietary fiber extracted from chicory root. It also improves the flavor, body and texture of low-fat foods.
Ind. J. Vet. & Anim. Sci. Res., 48 (1) 45-55, Jan. - Feb, 2019

46
MATERIALS AND METHODS
Preparation of paneer
Paneer was prepared as per the procedure suggested by Sachdeva (1983). Milk was heated to 90°C and promptly cooled to 70°C. Then it was coagulated by using 1 per cent citric acid. Then the coagulum was pressed and the yield of paneer was recorded. Full fat control paneer was prepared from milk standardized to 5 per cent fat and 9 per cent SNF (C1). Skim milk control paneer (C2) was prepared from skim milk standardized to 0.3 per cent fat and 9 per cent SNF. Low fat paneer was prepared by incorporating WPC at 0.25 (T1) and 0.5 per cent (T2) levels. Inulin was incorporated at 1.5 (T1) and 2 per cent (T2) levels for the preparation of low fat paneer.
Analysis of the paneer
Chemical analysis
Control and treatment groups of paneer were analyzed for yield, fat, moisture, total solids, and titratable acidity. The fat percent of paneer was analyzed by the procedure suggested by BIS (1977). Moisture and total solids contents of paneer were determined as per the procedure described in BIS (1983). The titratable acidity was determined as per AOAC (2000).
Microbiological quality of paneer
Standard plate count, coliform count and yeast and mould count of paneer samples were determined according to the procedure described by BIS (1980).
Sensory evaluation
The fresh paneer samples were evaluated for their sensory characteristics such as color and appearance, flavor, body and texture and overall acceptability as per the method recommended by BIS (2003). The data obtained from various studies were subjected to statistical analysis by following the procedure described by Snedecor and Cochran (1994). Six replications were done in each category. The statistical studies were carried out for comparing physical, chemical, microbiological and sensory parameters of low fat paneer with control. Duncan’s Multiple Range Test (DMRT) was carried out for pair wise comparison if ‘F’ values are found to be significant in ANOVA.
RESULTS AND DISCUSSION
Physico-chemical quality of low fat paneer incorporated with whey protein concentrate
Table 1 represents the physico-chemical analysis of low fat paneer incorporated with whey protein concentrate
Ind. J. Vet. & Anim. Sci. Res., 48 (1) 45-55, Jan. - Feb, 2019
Kavya Kuttan

47
Table 1: Physico- chemical analysis of low fat paneer incorporated with WPC (Mean±S.E)
Parameters(%)
Full fat con-trol(C1)
Skim milk control(C2)
Skim milk paneer incorporated with
0.25%WPC(T1)
Skim milk paneer incorporated with
0.5%WPC(T2)Yield 18.00±0.50a 13.46±0.57b 14.21±0.61bc 15.73±0.61c
Fat 19.42±0.33a 4.58±0.20b 4.17±0.33b 4.25±0.21b
Moisture 54.53±0.37a 56.56±0.74a 55.43±0.51a 59.03±1.25b
Total solids 45.47±0.37a 43.43±0.73a 44.53±0.50a 39.78±1.19b
Titratable acidity 0.43±0.03a 0.47±0.02a 0.45±0.02a 0.47±0.02a
Means within a row bearing different letters as superscript differ significantly. Means within a row bearing same letters as superscript are homogenous.
Yield
The mean yield of control and treatment groups of (C1, C2, T1 and T2) paneer was 18.00±0.50, 13.46±0.57, 14.21±0.61, 15.73±0.61 respectively. The yield of treatment groups of paneer and skim milk control paneer were significantly lower than full fat control paneer. Addition of WPC had increased the yield of paneer. Lo and Bastion (1998) had reported similar results in low-fat Haverti cheese.
Fat
The mean fat percentage of control and treatment groups of paneer samples were 19.42±0.33 (C1), 4.58±0.20 (C2), 4.17±0.33 (T1) and 4.25±0.21 (T2) respectively. The fat content of treatment groups of paneer and skim milk control was significantly lower than full fat control. Incorporation of WPC had reduced the fat content of treatment groups of paneer when compared to skim milk paneer. Bhatt (2013), observed that there was a decrease in fat recovery with increase in the level of WPC in low fat paneer.
Moisture
The mean moisture content of paneer samples were 54±0.37 (C1), 56.56±0.74 (C2), 55.43±0.51 (T1) and 59.03±1.25 (T2) per cent respectively. There was a significant difference in moisture content between treatment groups and full fat control paneer. Skim milk control paneer (C2) and T1 did not show any significant difference in moisture content whereas, T2 showed significant variation from C2 and T1. Narayanarao (2005) had reported an increase in moisture content in low fat paneer incorporated with whey protein concentrate. In this study also incorporation of WPC at 0.5 per cent level had significantly increased the moisture content of paneer.
Total solids
The mean values of total solids per cent in paneer samples were 45.47±0.37 (C1), 43.43±0.73 (C2), 44.53±0.50 (T1) and 39.78±1.19 (T2) respectively. The total solids content in treatment groups and skim milk control paneer were significantly different from full fat control. Bhatt (2013) had reported that there was an increase in
Ind. J. Vet. & Anim. Sci. Res., 48 (1) 45-55, Jan. - Feb, 2019
Development and quality evaluation of low fat functional paneer

48
total solid recovery in low fat paneer when WPC was incorporated at the rate of 0.2 per cent. However, higher levels of addition of WPC resulted in decrease in total solid recovery.
In the present study also addition of WPC at 0.25 per cent had slightly increased the total solid content but incorporation at 0.5 per cent level had decreased the total solids content.
Titratable acidity
The mean titratable acidity of full fat and skim milk control paneer were
0.43±0.03 and 0.47±0.02 per cent lactic acid respectively. The titratable acidity of treatment groups of paneer were 0.45±0.02 and 0.47±0.02 per cent lactic acid respectively. There was no significant difference in titratable acidity between control and treatment groups of paneer. Narayanarao (2005) reported that the pH and titratable acidity in low fat paneer did not differ much by the addition of WPC.
Microbiological quality
Table 2 represents the results of microbiological analysis of low fat paneer incorporated with whey protein concentrate
Table 2: Microbiological quality of low fat paneer incorporated with WPC (Mean±S.E)
Microbiological analysis
Storage days
Full fat control
(C1)
Skim milk control (C2)
Skim milk paneer
incorporate with 0.25%WPC
(T1)
Skim milk paneer
incorporated with 0.5%WPC (T2)
SPC
0th day 3.98±0.05a 4.05±0.02a 3.98±0.05a 3.99±0.04a
4th day 4.14±0.03b 4.11±0.04a 4.08±0.02a 4.09±0.04a
7th day 4.25±0.01c 4.23±0.02b 4.19±0.03b 4.21±0.02b
Yeast and mould
0th day 1.15±0.07a 1.26±0.09a 1.23±0.08a 1.13±0.09a
4th day 1.48±0.06 a 1.38±0.09 a 1.39±1.39 a 1.35±0.09 a
7th day 1.57±0.04 a 1.45±0.07 a 1.59±0.08 a 1.60±0.03 a
Coliform count
0th day 0.96±0.21 a 0.72±0.23b 0.88±0.18 a 0.72±0.23b
4th day 0.22±0.22 a 0 0.33±0.33ab 0.23±0.17 a
7th day 0 0 0 0
Means within a row bearing different letters as superscript differ significantly.Means within a row bearing same letters as superscript are homogenous.
Ind. J. Vet. & Anim. Sci. Res., 48 (1) 45-55, Jan. - Feb, 2019
Kavya Kuttan

49
Standard plate count
The mean standard plate count of full fat control paneer (C1) was 3.98±0.05, 4.14±0.03 and 4.25±0.01 log cfu/g respectively for the 0th, 4th and 7th day of storage. For C2 paneer the values were 4.05±0.02, 4.11±0.04 and 4.23±0.02 log cfu/g respectively. The values for T1 paneer were 3.98±0.05, 4.08±0.02 and 4.19±0.03 log cfu/g respectively. For T2 paneer, the mean values were 3.99±0.04, 4.09±0.04and 4.21±0.02 log cfu/g respectively. A progressive increase in SPC was noticed during storage in all paneer samples. However, the counts were within the legal limit until seven days of storage.
Yeast and Mould count
The mean yeast and mould count of full fat paneer was 1.15±0.07, 1.48±0.06 and 1.57±0.04 logcfu/g for the 0th, 4th and 7th day of storage respectively. For C2 the counts were1.26±0.09, 1.38±0.09 and 1.45±0.07 log cfu/g respectively. For treatment group one (T1) the mean values were 1.23±0.08, 1.39±1.39 and 1.59±0.08 log cfu/g respectively. In treatment group two (T2), the mean values were 1.13±0.09, 1.35±0.09 and 1.60±0.03 log cfu/g respectively. Addition of WPC had not altered the yeast and mould count of paneer. Even though the yeast and mould count
increased during storage, it was within the legal limit until seven days of refrigerated storage in all groups of paneer samples.
Coliform count
The coliform count of paneer samples were taken during the 0th, 4th and 7thday of refrigerated storage. Coliform count were absent in all paneer samples on 7th day of storage. The coliform count on 0thand 4th day of storage in full fat control paneer (C1) were 0.96±0.21 and 0.22±0.22 log cfu/g respectively. For C2 paneer, the values were 0.72±0.23 and 0.00±0.00 log cfu/g respectively. For T1 paneer the values were 0.88±0.18 and 0.33±0.33 log cfu/g respectively. For T2 the values were 0.72±0.23 and 0.23±0.17 log cfu/g respectively. Coliform count did not show any significant difference between control and treatment groups of paneer. It was within the acceptable limit prescribed by FSSA until seven days of refrigerated storage. The absence of coliform organisms on 7th day of storage might be due to developed acidity which might have prevented the growth of coliform.
Sensory evaluation
Table 3 represents the sensory scores of low fat paneer incorporated with whey protein concentrate
Ind. J. Vet. & Anim. Sci. Res., 48 (1) 45-55, Jan. - Feb, 2019
Development and quality evaluation of low fat functional paneer
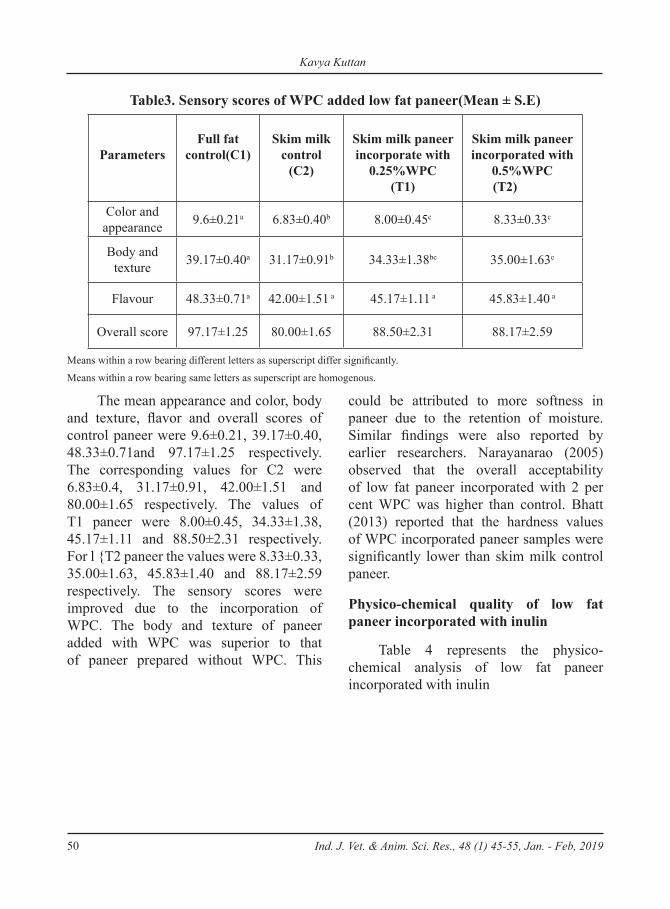
50
Table3. Sensory scores of WPC added low fat paneer(Mean ± S.E)
ParametersFull fat
control(C1)Skim milk
control (C2)
Skim milk paneer incorporate with
0.25%WPC(T1)
Skim milk paneer incorporated with
0.5%WPC (T2)
Color and appearance 9.6±0.21a 6.83±0.40b 8.00±0.45c 8.33±0.33c
Body and texture 39.17±0.40a 31.17±0.91b 34.33±1.38bc 35.00±1.63c
Flavour 48.33±0.71a 42.00±1.51 a 45.17±1.11 a 45.83±1.40 a
Overall score 97.17±1.25 80.00±1.65 88.50±2.31 88.17±2.59
Means within a row bearing different letters as superscript differ significantly.
Means within a row bearing same letters as superscript are homogenous.
The mean appearance and color, body and texture, flavor and overall scores of control paneer were 9.6±0.21, 39.17±0.40, 48.33±0.71and 97.17±1.25 respectively. The corresponding values for C2 were 6.83±0.4, 31.17±0.91, 42.00±1.51 and 80.00±1.65 respectively. The values of T1 paneer were 8.00±0.45, 34.33±1.38, 45.17±1.11 and 88.50±2.31 respectively. For l {T2 paneer the values were 8.33±0.33, 35.00±1.63, 45.83±1.40 and 88.17±2.59 respectively. The sensory scores were improved due to the incorporation of WPC. The body and texture of paneer added with WPC was superior to that of paneer prepared without WPC. This
could be attributed to more softness in paneer due to the retention of moisture. Similar findings were also reported by earlier researchers. Narayanarao (2005) observed that the overall acceptability of low fat paneer incorporated with 2 per cent WPC was higher than control. Bhatt (2013) reported that the hardness values of WPC incorporated paneer samples were significantly lower than skim milk control paneer.
Physico-chemical quality of low fat paneer incorporated with inulin
Table 4 represents the physico-chemical analysis of low fat paneer incorporated with inulin
Ind. J. Vet. & Anim. Sci. Res., 48 (1) 45-55, Jan. - Feb, 2019
Kavya Kuttan

51
Table 4: Physico- chemical analysis of low fat paneer incorporated with inulin (Mean±S.E)
Parameters(%)
Full fat control (C1)
Skim milk control (C2)
Low fat paneer incorporated
with 1.5% inulin (T1)
Low fat paneer incorporated
with 2% inulin (T2)
Yield 17.90±0.48a 12.40±0.44b 12.62±0.41b 13.48±0.60b
Fat 19.50±0.34a 4.58±0.20b 4.25±0.21b 4.13±0.11b
Moisture 54.53±0.37a 57.26±0.23b 57.36±0.23b 59.28±0.29c
Total solids 45.47±0.37a 42.74±0.22b 42.64±0.23b 40.72±0.29c
Titratable acidity 0.48±0.48a 0.48±0.01a 0.48±0.01a 0.49±0.49a
Means within a row bearing different letters as superscript differ significantly.Means within a row bearing same letters as superscript are homogenous.
Yield
The mean yield of control and treatment groups (C1, C2, T1 and T2) of paneer were 17.90±0.48, 12.40±0.44, 12.62±0.41and 13.48±0.60 per cent respectively. The yield of treatment groups of paneer and skim milk control paneer was significantly lower than full fat control paneer. Kantha (2005) also reported a linear and significant increase in the yield, with increasing levels of inulin in low fat paneer.
Fat
The mean fat percentage of control and treatment groups of paneer samples were 19.50±0.34 (C1), 4.58±0.20 (C2), 4.25±0.21 (T1), and 4.13±0.11 (T2) respectively. The fat per cent of treatment groups of paneer and skim milk control paneer were significantly lower than full fat control paneer. The decrease in fat content in inulin added samples might be due to the increase in moisture content caused by the water binding capacity of inulin. Similar findings were reported by the earlier researchers. Megha (2014) reported that
the addition of inulin in goat milk yoghurt decreased the fat percentage. She also reported that the decrease in fat percentage was proportional to the level of addition of inulin. Teresa Grzelak (2016) reported that the addition of inulin to food products did not change their organoleptic features, but it allowed the reduction of fat content in the final product.
Moisture
The mean moisture content of paneer samples were 54.53±0.37, 57.26±0.23, 57.36±0.23 and 59.28±0.29 per cent respectively. There was a highly significant difference in moisture content between the treatment groups and full fat control paneer. Skim milk control paneer (C2) and treatment group one (T1) did not show any significant difference in moisture content; whereas, T2 showed significant variation from T1 and C2 Paneer samples prepared by incorporation of inulin had higher moisture content than skim milk paneer prepared without inulin. According to Kantha (2005), inulin had been reported to have the capacity to retain 1-2 gm moisture per each gram of inulin.
Ind. J. Vet. & Anim. Sci. Res., 48 (1) 45-55, Jan. - Feb, 2019
Development and quality evaluation of low fat functional paneer

52
Total solids
The mean values of total solids content in paneer samples were 45.47±0.37 (C1), 42.74±0.22 (C2), 42.64±0.23 (T1) and 40.72±0.29 (T2) per cent respectively. The total solids content of treatment groups and skim milk control paneer showed significant difference from full fat control paneer. Addition of inulin had increased the moisture content and thereby reduced the total solids content.
Titratable acidity
The mean titratable acidity of control groups of paneer (C1 and C2)
were 0.48±0.48and 0.48±0.01 per cent lactic acid respectively. The titratable acidity of treatment groups of paneer were 0.48±0.01and 0.49±0.49 per cent lactic acid for T1 and T2 respectively. The titratable acidity of treatment groups did not show any significant variation from control paneer. Kantha (2005) also found that there was no significant difference in titratable acidity between control and experimental samples incorporated with inulin.
Microbiological quality of paneer
Table 5 represents the microbiological quality of low fat paneer incorporated with inulin
Table 5: Microbiological quality of low fat paneer incorporated with inulin (Mean±S.E)
Microbiological analysis
Storage days
Full fat control(C1)
Skim milk control
(C2)
Skim milk paneer incorporate with 1.5% inulin (T1)
Skim milk paneer incorporated with
2 % inulin (T2)
SPC0th day 4.05± 0.01a 3.98±0.05a 3.98±0.04a 3.99±0.04a
4th day 4.14±0.03b 4.11±0.033a 4.08±0.02a 4.09±0.03a
7th day 4.23±0.02c 4.25±0.01c 4.18± 0.02b 4.20 ±0.02b
Yeast and mold0th day 1.26±0.09a 1.26±0.09a 1.26±0.09a 1.18±0.08a
4th day 1.33±1.33a 1.33±0.08ab 1.39±0.09a 1.48±0.06b
7th day 1.49±0.04a 1.51±0.05b 1.51±0.08a 1.49±0.07b
Coliform count0th day 0.88± 0.18a 0.72±0.23a 0.22±0.22a 0.72±0.23b
4th day 0 0.22±0.22a 0 017±0.19ab
7th day 0 0 0 0
Means within a row bearing different letters as superscript differ significantly.Means within a row bearing same letters as superscript are homogenous.
Standard plate count
The mean standard plate count of full fat control paneer was 4.04± 0.01, 4.14±0.03 and 4.23±0.02 log cfu/g respectively for 0th, 4th and 7thday of storage. The corresponding values of C2 paneer were 3.98±0.05, 4.11±0.03 and 4.25±0.01 log cfu/g
respectively. The values of T1 paneer were 3.98±0.04, 4.07±0.02 and 4.18±0.02 log cfu/g respectively. For T2, the mean values were 3.99±0.04, 4.08±0.03 and 4.20±0.02 log cfu/g respectively. Standard plate count of paneer samples showed a significant increase during storage. However, all the samples of paneer met with the legal standards.
Ind. J. Vet. & Anim. Sci. Res., 48 (1) 45-55, Jan. - Feb, 2019
Kavya Kuttan

53
Yeast and Mould count
The mean yeast and mould count of full fat paneer were 1.26±0.09, 1.33±1.33 and 1.49±0.04 log cfu/g respectively for 0th, 4th and 7thday of storage. For C2 the counts were 1.26±0.09, 1.33±0.08 and 1.51±0.05 log cfu/g respectively. For treatment group one (T1), the mean values were 1.26±0.09, 1.39±0.09 and 1.51±0.08 log cfu/g respectively. In treatment group two (T2), the mean values were 1.18±0.08, 1.48±0.06 and 1.49±0.07 log cfu/g respectively. Yeast and mould count showed a progressive increase during storage. However, it was within the legal limit until seven days of storage. Yadav et al. (2009) had also reported an increase in yeast and mould count in paneer samples during storage.
Coliform count
The coliform count on 0th day was 0.88±0.18 log cfu/g and it was absent on
4th day of storage in full fat control (C1). For C2 the values were 0.72±0.23 and 0.22±0.22 log cfu/g on 0th and 4th day of storage respectively. For T1 the value was 0.22±0.22 log cfu/g on 0th day and it was absent on 4th day of storage. In treatment group two T2 the values were 0.72±0.23 and 0.33±0.21 log cfu/g respectively. Coliforms were absent in all paneer samples on 7th day of storage due to the increase in acidity of paneer during storage. Viji (2014) also reported that coliform counts were absent on 5th day of refrigerated storage in goat milk paneer samples. In the present study, coliform counts were within the acceptable limit prescribed by FSSA until seven days of refrigerated storage.
Sensory evaluation
Table 6 represents the sensory scores of low fat paneer incorporated with inulin.
Table 6 Sensory scores of inulin added low fat paneer(Mean ± S.E)
ParametersFull fat control
(C1)
Skim milk control
(C2)
Skim milk paneer incorporate with
1.5% inulin(T1)
Skim milk paneer incorporated with
2 % inulin (T2)
Color and appearance 9.42±0.27a 7.67±0.67b 8.83±0.31ab 8.75±0.31ab
Body and texture 37.67±0.95a 29.50±2.01b 33.67±1.48ab 31.50±1.26b
Flavour 48.17±0.87 a 42.67±2.67 a 46.00±1.77 a 45.33±1.54 a
Overall score 95.25±1.61 79.83±3.61 88.50±2.88 85.58±2.48
Means within a row bearing different letters as superscript differ significantly.Means within a row bearing same small letters as superscript are homogenous.
Ind. J. Vet. & Anim. Sci. Res., 48 (1) 45-55, Jan. - Feb, 2019
Development and quality evaluation of low fat functional paneer

54
In inulin added paneer samples the mean appearance and colour, body and texture, flavor and overall scores of full fat control paneer were 9.42±0.27, 37.67±0.95, 48.17±0.87 and 95.25±1.61 respectively. The corresponding values for C2 were 7.67±0.67, 29.50±2.01, 42.67±2.67 and 79.83±3.61 respectively. The values for T1 paneer were 8.83±0.31, 33.67±1.48, 46.00±1.77and 88.50 ±2.88 respectively. For T2 paneer the values were 8.75±0.31, 31.50±1.26, 45.33±1.54 and 85.58±2.48 respectively. Kantha (2005) reported that paneer developed from milk with 1.8% fat and 4.5% inulin had similar sensory attributes to that prepared from full cream milk.
CONCLUSION
From the above results, it can be concluded that good quality low fat paneer could be prepared from skim milk by the addition of WPC or inulin. The yield and moisture content of paneer increased with the addition of WPC or inulin. The sensory scores of low fat paneer were improved due to the incorporation of WPC and inulin. The paneer prepared by the addition of 1.5 per cent inulin showed better sensory scores than 2 per cent inulin. The microbiological qualities of the developed low fat paneer samples were good until seven days of refrigerated storage. Low fat paneer prepared with the incorporation of 0.5 per cent WPC had maximum yield (15.73 per cent).
ACKNOWLEDGEMENTS
The authors acknowledge Kerala Veterinary and Animal Sciences University
for providing financial support and infrastructure facilities required for the conduct of research work.
REFERENCES
Agnihotri, M.K and Pal U.K. (1996). Quality and shelf life of paneer in refrigerated storage.Small Rumin. Res. 20: 75-81.
AOAC (2000).The Official Methods of Analysis of AOAC International. (7th Ed).W. Horwitz (Ed.) Washington D.C. Vol.1, Method 960.52, 991.43 and 991.29.
B.I.S. (1977). Part-II, Determination of Fat by Gerber Method: Milk Products. Indian Standard Institution. Manak Bhavan, New Delhi. 8-9p.
B.I.S. (1983).Specification for Paneer, Bureau of Indian Standards, New Delhi.
B.I.S.(2003).Methods for sensory evaluation of paneer/chhana.Bureau of Indian Standards, New Delhi.
B.I.S. (1981).Methods of sampling and microbiological examination. Handbook of food analysis, SP: 18 PART XI dairy products. Manak Bhavan, New Delhi: Bureau of Indian Standards.
Bhatt, J.D. (2013). Standardization of method for preparation of reduced fat paneer using whey protein concentrates and selected emulsifier. M.Tech Thesis. Anand Agricultural University, Anand. 229p.
Ind. J. Vet. & Anim. Sci. Res., 48 (1) 45-55, Jan. - Feb, 2019
Kavya Kuttan

55
Gupta, M.P. (2009). Effect of various coagulants on sensory, chemical and microbiological quality of paneer.Journal of Rural and Agric Res. 9:11-14.
Kantha, K.L. and Kanawjia, S.K. (2007). Response surface analysis of sensory attributes and yield of low fat paneer enriched with soy fiber. Indian J. Dairy Sci. 60(4):230–238.
Lo, C.G and Bastion, E.D. (1998). Incorporation of natured and denatured whey protein into cheese curd for manufacture of reduced fat cheese.J. Dairy Sci. 81:16-24.
Megha, K.R and Radha, K. 2016. Development and quality evaluation of prebiotic yoghurt from goat milk. Ind. J. Vet. Anim. Sci. Res., 45(3) 655-661.
Narayanarao, S.V. (2005). Preparation of low fat paneer enriched with whey protein concentrates. M.VSc Thesis. College of Veterinary And Animal Sciences, Parbhani. 55p.
Snedecor, G.W. and Cochran, W.G. 1994. Statistical methods.(8th Ed.). Oxford
and IBH Publishing company, New Delhi.
Teresa Grzelak, Joanna Grupinska, Marta Pelczynska, Marcelina Sperling and Krystyna Czyzewska (2016).The merits of fat replacers in low-calorie food. Acta.Sci.Pol.HortorumCultus. 16(2): 87–94.
Thapa, T.B and Gupta, V.K (1996). Chemical and Sensory qualities of processed cheese foods prepared with added whey protein concentrate. Indian J. Dairy Sci. 42(2): 129-137.
Viji, K.S and Radha, K. (2015). Microbiological quality studies of goat milk paneer.Ind. J. Vet. Anim. Sci. Res., 44(3): 181-188.
World Health Organization and Candau, Marcolino Gomes(1965). The work of WHO, 1965: Annual report of the director general. 244p.
Yadav, Y.N. Singh, C. Dwivedi, B.R. and Gupta, M.P. 2009. Effect of various coagulants on sensory, chemical and microbiological quality of paneer.J. Rural and Agric Res. 9: 11-14.
Ind. J. Vet. & Anim. Sci. Res., 48 (1) 45-55, Jan. - Feb, 2019
Development and quality evaluation of low fat functional paneer

56
Immunogenicity of pasteurella multocida cell associated and cell free antigens in mice
Sahzad, S. Arya, M. Bora, S. Shebannavar*, T. V. S. Rao and G. S. Reddy
Brilliant Bio Pharma Private Limited, I.D.A, Pashamylaram, Hyderabad - 502 307, Telangana, India
ABSTRACT
Haemorrhagic septicaemia is an economically important contagious disease of cattle, buffaloes and bison. In the present study, the efficacy of the vaccines prepared from cell free and cell associated antigens of disease causing organism Pasteurella multocida was evaluated in mice. From the present study, it was observed that both cell associated and cell free antigens provided protective immunity to the vaccinated animals in combination with each other and increasing the content of both the antigens improved the efficacy of the vaccine blends. In conclusion, use of both cell associated and cell free antigens in vaccine formulations are warranted for developing improved vaccines against Haemorrhagic septicaemia.
Key words: Haemorrhagic septicaemia, Pasteurella multocida, Cattle, Vaccines, Cell free antigen, Cell associated antigen.
Haemorrhagic septicaemia (HS) is an important fatal and contagious disease of cattle and buffaloes. It is caused by Pasteurella multocida, a Gram negative bipolar bacterium. The organism causes pathological changes in the respiratory tract leading to state of generalized septicaemic condition. The affected animal often leads to death in absence of timely treatment with antimicrobials. Due to its contagious nature, the disease can lead to economic devastation in the lives of farmers. In some
parts of India alone, the disease is estimated to have caused losses to the tune of USD 1,30,000 between 2007 and 2011 (Singh et al., 2014).
Vaccination of susceptible hosts has been the most successful strategy for control of haemorrhagic septicaemia outbreaks. Inactivated vaccines are most commonly used for the purpose and include cell associated and cell free bacterial antigens along with one of the commonly used adjuvants such as alum, aluminium hydroxide and mineral oil. The oil adjuvanted vaccine provides high degree and duration of immunity compared to other adjuvanted vaccines. However, it suffers from the disadvantage of having high viscosity and poor syringibility
Short Communications
*Corresponding authorDr Sunil ShebannavarBrilliant Bio Pharma Pvt LtdPlot No 97, 98, 276 & 277, I.D.A.,Pashamylaram, Sangareddy (Dist)-502307Telangana, IndiaEmail: [email protected]
Ind. J. Vet. & Anim. Sci. Res., 48 (1) 56-59, Jan. - Feb, 2019
57
during administration in the field (Saad and Anna, 2016). Therefore, present study was undertaken to evaluate the usefulness of aluminium hydroxide adjuvant with cell associated antigen and cell free antigens of Pasteurella multocida.
The Pasteurella multocida (P-52) vaccine strain procured from Indian Veterinary Research Institute, Izatnagar was passaged in healthy rabbit and the infected blood was stored in freeze dried form at 2-8°C. Further, the rabbit passaged freeze dried vaccine seed was used for preparation of vaccines with varying antigen payloads. Briefly, one vial of freeze dried rabbit passaged HS seed was inoculated into 200 ml of HS media and incubated at 37°C overnight under constant stirring. The 200 ml of HS vaccine strain seed culture was further inoculated into 10 L of HS media and incubated at 37°C overnight under stirring. The culture was inactivated by adding formalin to final concentration of 0.5% and incubating under stirring at 37°C for 24 h. The inactivated harvest was centrifuged at 6000 rpm for 45 min and, the supernatant and pellet were separated. The cell pellet was resuspended in 200 ml of 0.2% formal saline and again centrifuged at 6000 rpm and for 45 min. Subsequently, the cell pellet was resuspended in 180 ml of 0.2% formal saline and stored at 2-8°C until used for vaccine preparation. The 9.5 litre culture supernatant was concentrated to 460 ml by using synthetic hemodialyzer (ELISIOTM -13M, NIPPRO). Around 80 ml of pellet and concentrated culture
supernatant was stored separately as source of cell associated and cell free antigens of P. multocida, respectively, while preparing vaccine blends. A total of four vaccine blends containing aluminium hydroxide as adjuvant were prepared namely; Blend-I: 1 ml culture equivalent of both cell associated antigen and cell free antigen, Blend-II: 2 ml culture equivalent of both cell associated antigen and cell free antigen, Blend-III: 1 ml culture equivalent of cell free antigen and Blend-IV: 1 ml culture equivalent of cell associated antigen (Table). All the four vaccine blends were tested for potency in mice by challenge with virulent P. multocida as per Indian Pharmacopoeia (2018) with prior approval from Committee for the Purpose of Control and Supervision of Experiments on Animals (CPCSEA). The lethal dose 50 (LD50) for each of the vaccine blends including unvaccinated controls were calculated by using Reed and Muench (1938). The titre of virulent P. multocida as observed in group of control mice was 107.5 LD50. The Protective Index (PI) was calculated as below.
PI = LD50 in control mice ÷ LD50 in vaccinated mice
LD50 = Reciprocal of 50% endpoint dilution.
Log10 50% end point dilution = Log10 of dilution showing a mortality next above 50% - (Proportionate distance x logarithm of dilution factor).
Proportionate distance = [(mortality at dilution next above 50%) – 50%] / [(mortality next above 50%) – (mortality next below 50%)]
Ind. J. Vet. & Anim. Sci. Res., 48 (1) 56-59, Jan. - Feb, 2019
Immunogenicity of pasteurella multocida ....cell free antigens in mice

58
Table 1 Composition of vaccine preparations with cell associated antigens and cell free antigens of Pasteurella multocida
Blend Antigen type Culture volume equivalent/
dose
Antigen volume/dose
Aluminium hydroxide /
dose
0.2% formal saline /
dose
Potency(Protection Index)
Log10 values
I Cell associated + Cell free
1 ml 0.1 ml 0.9 ml 1 ml 4.1
II Cell associated + Cell free
2 ml 0.2 ml 0.9 ml 0.9 ml 4.5
III Cell free 1 ml 0.1 ml 0.9 ml 1 ml 3.5IV Cell associated 1 ml 0.1 ml 0.9 ml 1 ml 3.7
The calculated PIs for Blend-I containing 1 ml culture equivalent of cell associated and cell free antigen /dose was 4.1, Blend-II containing 2 ml culture volume equivalent/dose containing both cell supernatant and cell pellet was 4.5, Blend-III containing 2 ml culture volume equivalent of cell supernatant was 3.5 and Blend-IV containing 1 ml culture volume equivalent/dose of cell associated antigen was 3.7. A close analysis of results reveal that the blends having combination of both cell associated and cell free antigen provided better protection to virulent P. multocida challenge in mice but no protection when administered alone. Increasing the antigen content of both the antigens (2 ml culture equivalent) yielded marginally better protection compared to 1 ml culture volume equivalent of antigens. Various factors such as outer membrane proteins (OMP), lipopolysaccharides, secreted bacterial toxins and stress induced proteins have been identified to play an important role in the pathogenesis and host cell evasion of P. multocida (Ghani et al., 2016). These factors also act as targets for host immune responses leading to development of protective immunity against
the infecting organisms. Recently, Uchida et al., (2003) showed higher protective indices and prompt clearance of toxigenic strains of P. multocida in mice immunized with inactivated cell free antigen than purified and inactivated P. multocida toxin. Similarly, 100% protection in mice immunized with cell associated antigen (OMP) has also been reported (Joshi et al., 2013). In conclusion, present study showed that both cell associated antigens (such as OMP and capsular antigens) and cell free antigens (toxins and stress proteins) elicit immune responses and the protective immunity is enhanced by combining both the antigens in the vaccine formulations.
REFERENCES
Ghani. R.A, Khattak NA, Saqlain M, Asad MJ, Khanum A, Naqui SMS and Raja GK (2016) Comparison of the common immunogenic protein components of Pasterurellamultocida serotypes B:2& B3, 4. KafkasUniv Vet Fak erg, 22(4): 485-491.
Indian Pharmacopoeia. (2018). 8th Edition. Indian Pharmacopoeia Commission (IPC). Ministry of Health and Family Welfare.Government of India.
Ind. J. Vet. & Anim. Sci. Res., 48 (1) 56-59, Jan. - Feb, 2019
Sahzad

59
Joshi S, Tewari K and Singh R. (2013). Comparative immunogenicity and protective efficacy of different preparations of outer membrane proteins of Pasteurella multocida(B:2) in a mouse model. VeterinarskiArhiv. 83(6): 665-676.
Reed. L. J and Muench H (1938). A simple method of estimating fifty per cent endpoints.The American Journal of Hygiene. 27(3): 493-497.
Saad. M. Z and Annas S. (2016). Vaccination against haemorrhagic septicaemia
of bovines: A review. Pakistan Vet J. 36(1): 1-5.
Singh B, Prasad S, Verma MR and Sinha DK (2014) Estimation of economic losses due to haemorrhagic septicaemia in cattle and buffaloes in India. Agric. Econ. Res. Rev.27: 217-279.
Uchida C, Kimura Y, Kubota S and Sasaki O. (2003).Protective effect of Pasteurella multocida cell-free antigen and toxoid against challenge with toxigenic strains of Pasteurella multocida in mice.J.Vet.Med.Sci. 65(6): 737-740.
Ind. J. Vet. & Anim. Sci. Res., 48 (1) 56-59, Jan. - Feb, 2019
Immunogenicity of pasteurella multocida ....cell free antigens in mice

60 Ind. J. Vet. & Anim. Sci. Res., 48 (1) 60-65, Jan. - Feb, 2019
Occurrence of proventriculo-ventricular intussusception in chicken - A one-year perspective study
M. Pradeep* and M.R. Reddy Department of Veterinary Pathology, College of Veterinary and Animal Sciences,
Pookode, Wayanad, Kerala, India
Abstract
Proventriculo-ventricular intussusception is the telescoping of proventricular portion of the avian stomach into the ventriculus. Even though occurrence of intestinal intussusceptions in chickens commonly observed, the reports on proventriculo-ventricular intussusceptions were very scarce. The study was done as a part of screening the gut lesions in the chicken carcasses for a period of one year and 18078 chicken carcasses of multiple age groups belonging to 15 pure line breeds and two commercial breeds were screened. Proventriculo-ventricular intussusceptions noticed in two female PD2/Vanaraja chicks of 4 days and 3 weeks of age and in a 9 weeks old male Nicobari grower. While the intussuscepted proventriculus of Vanraraja chicks had unremarkable inflammatory lesions, severe congestion of proventriculus along with koilin displacement in the anterior portions of ventriculus were evident in Nicobari grower. The present study, point out the occurrence of proventriculo-ventricular intussusception in young synthetic and native lines of chicken.
Key words: Proventriculo-ventricular intussusception, Vanaraja, Nicobari breed.
*Corresponding author: M. Pradeep email: [email protected]
Intussusception is the telescoping of one part of the digestive tube into the lumen of adjacent part often resulting in blockage of feed and fluid passage. The inner telescoped part is called the intussusceptum and the outer receiving part intussuscepiens. Even though the intussusception of intestine is rather common in poultry (Crespo et al., 2013), intussusception involving proventriculus scarcely been reported (Shrivastava et al., 1989). Because of the scarcity of reports, its incidence and aetiological studies are not available. The present study aimed to throw light on the occurrence of proventriculo-
ventricular intussusception in chickens of different breeds and age groups.
The study was based on the necropsy screening of chicken carcasses for gut lesions for a period of one year spanning from December 2015 to November 2016. Necropsy was performed on daily basis on the carcasses from the farms of ICAR- Directorate of Poultry Research, Hyderabad, Telangana, India and on the occasional outbreak based necropsy from the commercial farms. A total of 18078 carcasses belonging to 15 different breeds/lines and multiple age groups were screened during the period. The lines screened included white Leghorn breeder

61Ind. J. Vet. & Anim. Sci. Res., 48 (1) 60-65, Jan. - Feb, 2019
lines such as IWA, IWD, IWF IWH, IWI, IWK (n= 2095), synthetic breeder lines like PD1 (n=1712), PD2/Vanaraja (n=3880), PD3 (n=4223), Gramapriya male line (n=1632), broiler lines like Punjab Broilers (n=2783), single gene lines like Dwarf (n=237) and Naked Neck (n=257), and native breeds like Aseel (n=341), Ghagus (n=392) and Nicobari (n=426). Apart from this pure lines, commercial White Leghorns (n=52) and commercial broiler breeders (n=48) were also screened during the period. Tissue samples were collected in 10% neutral buffered formalin processed by paraffin embedding method, sectioned at 5µ thickness and stained with routine Haematoxylin and Eosin (H&E) stain.
The occurrence of Proventriculo-ventricular intussusceptions was 0.017%
(3/18078). The condition noticed in two female PD2/Vanaraja (0.052%) birds of age, 4 days and 3 weeks, and in one male Nicobari (0.236%) aged 9 weeks. All the three affected chickens were floor reared and belonged to different flocks reared in different sheds. In these chickens, the proventriculus was telescoped into the lumen of anterior thin walled part of the ventriculus. Closer observation revealed that the point of telescoping originated posterior to the proventriculo- oesophageal junction without the eversion of the oesophagus. The intact oesophagus was drawn posteriorly along with the telescoped proventriculus. In the Vanaraja chicks (Fig. 1), very small part of the inverted proventriculus was protruded into the lumen of ventriculus while moderately protruded in Nicobari grower.
Figure 1 Proventriculo-ventricular intussusception (arrow) in the 4 day old Vanaraja chick
Occurrence of proventriculo-ventricular ... chicken- A one-year perspective study

62
Inflammatory lesions were absent in the proventriculus and ventriculus of both Vanaraja chicks. Pulling of proventriculus with mild force, holding the oesophagus relieved the intussusception in the 3 weeks old Vanaraja chick. Histologically mild degeneration and compression of the submucosal glands were found in the Vanarja chicks (Fig. 2). On the other hand,
the intussusception was not relieved with mild pulling of the oesophagus in case of Nicobari grower. Further, the koilin layer of the ventriculus was pealed posterior to the isthmus and pushed into the lumen by the protruding proventriculus (Fig. 3). The intussusceptum was severely congested (Fig. 4). Crop was empty in all the three cases.
Figure 2 Degeneration and compression of proventricular glands (arrow) in the proventriculo-ventricular intussusception. H&E 40x
Figure 3 Proventriculo-ventricular intussusception in the Nicobari grower. Koilin layer can be seen pushed into the lumen of the ventriculus (arrow)
Ind. J. Vet. & Anim. Sci. Res., 48 (1) 60-65, Jan. - Feb, 2019
Pradeep

63
Figure 4 Severe congestion of the intussusceptum proventriculus (arrow) of Nicobari grower
Gross lesions were not observed in the intestines of any of the cases. Coccidial oocysts were randomly noted in the caecal contents of 3 weeks old Vanaraja chicks but not in other birds.
The present study showed that proventriculo-ventricular intussusception even though rare, occurred in young chicken. PD2/Vanaraja is a dual purpose breed developed for backyard rearing with medium growth rate while Nicobari is a native breed with its origin in Andaman and Nicobar islands of India with smaller size and slow growth rate. This indicates that the growth rate may not have significant contribution in the development of the condition. Further, broiler breeds with high growth rate has not affected in the study.
Inflammatory reactions were absent in the telescoped proventriculus in the previous report (Shrivastava et al., 1989) and in both Vanaraja chicks of the present study. This may be due to the acute development of the condition. However, the lesions in the Nicobari were different from the early report with severe vascular
changes in the telescoped proventriculus along with pealing of koilin layer of ventriculus. Absence of fibrous tissue adhesions indicates a subacute nature of the condition.
Studies on aetio- pathogenesis of proventriculo-ventricular intussusception are not available in the literatures. The aetiology of commonly occurring intestinal intussusceptions are also obscure. In human, intestinal intussusceptions are very common in infants (WHO, 2002) and probable aetiology like adenovirus and enterovirus (O’Ryan et al., 2003) and some other infectious, neoplastic and functional disturbances were hypothesized (Cera, 2008), actual aetiology could not be ascertained so far. On the animal side, intestinal intussusception had been found along with parasitism (Wilson and Burt, 1974), foreign bodies, viral enteritis, intestinal surgeries and neoplasia (Levien and Baines, 2011). In fowls, multiple predisposing conditions like coccidiosis, mucosal injury and intestinal hyper motility were considered as the possible causes of the intestinal intussusception (Williams,
Ind. J. Vet. & Anim. Sci. Res., 48 (1) 60-65, Jan. - Feb, 2019
Occurrence of proventriculo-ventricular ... chicken- A one-year perspective study

64
1986). In the present study, coccidial oocysts found only in one case but that too was very insignificant in severity. Hence, coccidiosis and resultant hypermotility will not be the cause of provntriculo-ventricular intussusception. A close follow up with other chicken of the same flocks showed no recurrence of the condition, that excludes possibility of any infectious cause. Chronic dyspepsia, chronic inspiratory difficulty due to upper airway obstruction and increased abdominal pressure were attributed for the development of gastro-oesophageal intussusception in dogs (McGill et al., 2009). Starvation considered as a probable cause of intestinal intussusception in fowls by some workers (Okoye, 1985) but ruled out by others (Williams, 1986). Although, empty crops observed in all the three birds, role of hunger in the development of provntriculo-ventricular intussusception require further study.
The present study revealed rare occurrence of proventriculo-ventricular intussusception in young chickens of dual purpose lines as well as native breeds. Unlike the earlier reports, proventriculus with severe congestion observed in the present study. Actual cause for the development of the proventriculo-ventricular intussusception is unclear. The possibility of occurrence of proventriculo-ventricular intussusception need to be considered while making clinical diagnosis especially in well-priced birds.
Acknowledgement
We thank the Director, ICAR-Directorate of Poultry Research, Rajendranagar, Hyderabad for providing the facilities for the research.
References
Cera, S.M., (2008). Intestinal intussusception. Clinics in Colon and Rectal Surgery, 21: 106-113.
Crespo, R. and Shivaprasad, H.L. (2013). Developmental, metabolic, and other noninfectious disorders. In: Swayne, D.E., Glisson, J.R., McDougald, L.R., Nolan, L.K., Suarez, D.L. and Nair. V, Editors. Disease of Poultry. 13th ed. Wiley-Blackwell Iowoa, USA. Pp. 1232-1270.
Levien, A.S. and Baines, S.J. (2011). Histological examination of the intestine from dogs and cats with intussusception. Journal of Small Animal Practice. 52: 599–606.
McGill, S.E, Lenard, Z.M., See, A.M. and Irwin, P.J. (2009). Nonsurgical treatment of gastroesophageal intussusception in a puppy. Journal of American Animal Hospital Association. 45(4):185-90.
Okoye, J.O.A. (1985). Cases of intestinal intussusception in young fowls. Avian Pathology, 14: 275-279.
O’Ryan, R., Lucero, Y., Pena, A. and Valenzuela, M.T. (2003). Two year review of intestinal intussusception in six large public hospitals of Santiago, Chile. Pediatric Infectious Diseases Journal, 22: 717–21.
Shrivastava, A.B., Katiyar, A.K., Awadhiya, R.P. and Vegad, J.L. (1989). Ventricular intussusception in a domestic fowl. Avian Pathology, 18: 547-550.
Ind. J. Vet. & Anim. Sci. Res., 48 (1) 60-65, Jan. - Feb, 2019
Pradeep

65
WHO vaccines and biological (2002). Geneva: World Health Organization. Acute intussusception in infants and children. Incidence, clinical presentation and management: a global perspective. Pp. 1–98.
Williams, R.B. (1986). On the aetiology of intestinal intussusception in the fowl. Avian Pathology, 15: 301-304.
Wilson, G.P. and Burt, J.K. (1974). Intussusception in the dog and cat: A review of 45 cases. Journal of American Veterinary Medical Association, 164: 515-518.
Ind. J. Vet. & Anim. Sci. Res., 48 (1) 60-65, Jan. - Feb, 2019
Occurrence of proventriculo-ventricular ... chicken- A one-year perspective study

66
INSTRUCTIONS TO AUTHORS
Scope of the Journal
“Indian Journal of Veterinary and Animal Sciences Research” published six times in a year will consider original papers for publication on all aspects of animal and fisheries sciences. The scope of the journal includes animal and fisheries health, management, production and marketing of products. Acceptance of manuscript will be based on scientific merit as judged by referees and Editorial Board.
Submission of manuscripts
Manuscripts should be written in English and the spelling should follow the Oxford English Dictionary. Manuscripts should be submitted in triplicate along with Rs. 500/- as Demand Draft drawn in favour of “The Editor, IJVASR & Director of Research, TANUVAS, Chennai – 600 051” as processing fee to the Editor, “Indian Journal of Veterinary and Animal Sciences Research” , Directorate of Research, Madhavaram Milk Colony, Chennai – 600 051, INDIA.
Manuscripts can also be submitted by email to the email id: [email protected]. Payment can also be made online to the following account.
Account Name: The Editor, IJVASR & Director of Research, TANUVAS, Chennai Account Number: 332902010721641 IFSC Code: UBINO533297 Reg. No.: / Transaction I.D./NEFT :
The authors should give a statement to the effect that the “Articles sent to IJVASR have not been sent elsewhere for publication”. The statement should also be signed by all the authors and certified that the work is done as per the mandate of the respective institute. Email id and contact phone of the first or corresponding author should be provided whereas the authors should submit the copy of the IAEC approval if experimental animals are used.
Preparation of manuscripts
All manuscripts should be typed on one side of the A4 paper, double-spaced throughout, with margins of at least 25mm all around. All contributions will be subjected to editorial revision.
Major headings are centered, all capitals except for scientific names and the full length papers should consist of Abstract, Introduction, Materials and Methods, Results and Discussion, Acknowledgement (optional) and References. First subheadings begin at the left margin and the text that follows a first subheading should be in a new paragraph.
67
Full length papers should normally not exceed 3000 words in length including tables and illustrations i.e. approximately five journal pages and should contain the following section, each written concisely:
A Title page containing (a) the title of the paper in capital letters in exception for scientific names, (b) the names of authors in full with initials at the beginning, (c) the authors’ department and complete postal address. Superscript numbers should be used to link authors with other institution. Provide maximum of five key words for full length paper and three for short communication for subject indexing. The author wise contribution should also be mentioned in nutshell.
An Abstract will be printed at the beginning of the paper. Abstract should not be more than 150 words emphasizing objectives, experimental procedure, results and conclusions. Use complete sentences and limit the use of abbreviations. It should be in a form suitable for abstracting journals to use.
A brief introduction with specific emphasis on the necessity for such a kind of research may be given.
Materials and methods section may refer to previous description of methods whenever possible. This section should include experimental designs and methods of statistical analysis.
Results and Discussion may contain subheading if appropriate. This part should be brief and to the point, without repetition of results.
An Acknowledgement section, if required, may be given.
References section should contain only essential references which should be listed alphabetically and written as indicated below. In the text, give the author’s name followed by the year in parenthesis: Suresh (2009). If there are two authors, use ‘and’: Suresh and Mani (2015); but if cited within parenthesis: (Suresh and Mani, 2015). When reference is made to a work by three or more authors, the first name followed by et.al. should be used: Rama et.al.(2015); but if cited within parenthesis: (Rama et.al., 2015). Reference to unpublished data and personal communications should not appear in the list but should be cited in the text only (e.g. Amutha T, 2015. Unpublished data).
Journal articles and abstracts
Bardbury, J.M., Mc Carthy, J.D and Metwali, A.Z. (1990). Micro immunofluorescence for the serological diagnosis of avian Mycoplasma infection. Avian Pathology, 19:213-222.
Raja, S., Rani, A., Ravi, M and Kumar. K. (2007). Histopathology of CPV infection. Page no. 120-122….Venue…Date…Place…

68
Books and articles within edited books
Rundall, C.J. (1991). A colour Atlas of Diseases of the Domestic Fowl and Turkey. 2nd ed. London. Wolf Publishing Ltd. 175 p.
Handbooks, Technical bulletins, Thesis and Dissertations
Callow, L.L and Dalgliesh, R.J. (1982). Immunity and Immunopathology in Babesiosis. In: S. Choen and K.S. Warren (Ed) Immunology of Parasitic Infections. Blackwell, Oxford. pp 475-526.nded.
Electronic publications
Tables should be typed on separate sheets, numbered consecutively in Arabic Numerals and have a short descriptive heading. Units of measure for each variable measured should be indicated. Appropriate estimates of variation (Standard error, standard deviation) must be provided with means. Use superscript letters for the separation of means in the body of the table and explain these in footnotes.
Illustrations, referred to as “figures” (Fig. 1etc.) should be on separate sheets and submitted Larger than the size desired for reproduction. Information in tables must not be duplicated in figures and vice versa. Legends, should be provided for each illustration. Line drawings should be either in black ink on smooth white paper or thin board or a good quality laser printout. Photographs and photomicrographs should be printed on glossy paper with good contrast. Magnification For photomicrographs should be indicated. Allillustrations should bear on the reverse side, the first author’s name and the figure number, the ‘top’ of the figure should be indicated. While sending the manuscripts in email, and the figures should be separately sent in JPEG format but for gel pictures it should be in TIFF format with good resolution.
Short communications and Case Reports should have a title page as described for full length papers and should comprise approximately 1000 words including tables, illustrations and references. They may contain not more than two tables or illustrations. Methods, results and discussion should be in single section without headings. References should be kept to a minimum and be in the form described above. Review should have a title page as described for full length papers and should contain approximately 4000 words including tables, illustrations and references.
Units, symbols and abbreviations
Units should conform to the International System of Units (refer Baron, D.N. (1994). Units, Symbols and Abbreviations: A Guide for Biological and Medical Authors. 4th ed. London.Royal Society of Medicine). Abbreviations should not be used in the title, section heading or at the beginning of sentences. As a rule, author-coined abbreviations should be in all capital letters. These should be spelled out in full with the abbreviation following in parentheses the first time they are mentioned.

69
Proofs
Proofs will usually be sent to the first or corresponding author. Only typesetter’s errors may be corrected; no changes in, or additions to, the edited manuscript will be allowed. It is a condition of acceptance that the Editors reserve the right to proceed to press without submitting the proofs to the author. While reasonable care will be taken to ensure that proof reading is correctly done, neither the Editors nor the Publishers shall be responsible for any errors.
Reprints
It has been decided to discontinue the supply of 25 reprints as the contents of the articles is hosted as PDF in TANUVAS website. (www.tanuvas.ac.in/ijvasr.html).
Rejected article
Hard copy of the rejected articles will not be referred to the authors. The chief editor has the sole rights to either accept or reject the manuscripts based on their merits without reasoning. The first/corresponding authors are requested to inform their email addresses and contact numbers while submitting manuscripts to this journal.
EDITOR
ATTENTION CONTRIBUTORSThe Editorial Board of Indian Journal of Veterinary and Animal Sciences Research
has decided to collect Rs.500/- (Rupees Five hundred only) as processing fee in accordance with the order of Registrar, TANUVAS-(U.S.O.No.500601/G4/2016 Proc.No. 5639/G4/2016 dt 3.5.2016), from the authors at the time of submission of articles for publication in the Journal. This would help the authors to hasten the publication of their articles without any delay.
Hence, the corresponding author is requested to draw a demand draft for Rs.500/- in favour of “The Editor, IJVASR & Director of Research, TANUVAS, Chennai-600051”along with the manuscript during submission. The articles may be addressed to the Editor, IJVASR & Director of Research, TANUVAS, Madhavaram Milk Colony, Chennai- 51. The authors are also requested to mention their contact phone number and E-mail address.
EDITOR
REVIEW ARTICLES INVITED FROM EMINENT SCIENTISTS
The Editorial Board of Indian Journal of Veterinary and Animal Sciences Research invites review articles from eminent research scientists in the field of Veterinary and Fisheries Sciences, on the latest/ current topics of interest for publication in the Journal. The review article (both hard and soft copy) may please be sent to the Editor/Associate Editor, Indian Journal of Veterinary and Animal Sciences Research for publication.

70
FORM IV (See Rule 8)
1. Place of Publication : University Publication Division (Printing Press) Tamil Nadu Veterinary and
Animal Sciences University, Madhavaram Milk Colony, Mathur Road,
Chennai – 51. Ambattur Taluk Thiruvallur District
2. Periodicity of Publication : Bi-Monthly
3. Printer’s Name : Dr. K.N.Selvakumar Whether citizen of India Yes Address Director of Distance Education Tamil Nadu Veterinary and Animal Sciences University,
Old.No. 327, New No. 485, Anna Salai, Nandanam, Chennai - 600 0354. Publisher’s Name : Dr. K.N.Selvakumar Whether citizen of India Yes Address Director of Distance Education Tamil Nadu Veterinary and Animal Sciences University,
Old.No. 327, New No. 485, Anna Salai, Nandanam, Chennai - 600 0355. Chief Editor’s Name : The Vice-Chancellor Whether citizen of India Yes Vice-Chancellor Tamil Nadu Veterinary and Animal Sciences University, Madhavaram Milk Colony, Chennai – 600 051.
6. Name and address of individuals : The Registrar who own the newspaper and parents Tamil Nadu Veterinary and or share holders holding more than Animal Sciences University, one per cent of the total capital Madhavaram Milk Colony, Chennai – 600 051.
I, Dr. K.N. Selvakumar hereby declare that the particulars given are true to the best of my knowledge and belief.
Dr. K.N. SelvakumarSignature of Publisher
71
All the contributing authors are requested to bestow their personal attention while submitting the revised manuscripts for spelling mistakes and correctness of language.
Chief Editor
The Indian Journal of Veterinary and Animal Sciences
Research (IJVASR) is indexed in the abstracting journals of the
CAB International, Zoological Abstracts of Web of Knowledge
published by Thomson Reuters and Indian Science Abstracts
published by NISCAIR, India.
Related Documents