eISSN : 2287-4577 pISSN : 2287-9099 http://www.jistap.org Vol. 3 No. 1 March 30, 2015 Indexed/Covered by LISA, DOAJ, PASCAL, KSCI, KoreaScience and CrossRef 06 Sentiment Analysis of User-Generated Content on Drug Review Websites 24 Query Formulation for Heuristic Retrieval in Obfuscated and Translated Partially Derived Text 40 Non-Governmental Organization (NGO) Libraries for The Visually Impaired in Nigeria: Alternative Format Use and Perception of Information Services 50 Study of US/EU National Innovation Policies Based on Nanotechnology Development, and Implications for Korea 66 Contribution of Journals to Academic Disciplines

Welcome message from author
This document is posted to help you gain knowledge. Please leave a comment to let me know what you think about it! Share it to your friends and learn new things together.
Transcript

eISSN : 2287-4577 pISSN : 2287-9099http://www.jistap.org
Vol. 3 No. 1 March 30, 2015
Indexed/Covered by LISA, DOAJ, PASCAL, KSCI, KoreaScience and CrossRef
Vol. 3 No. 1 M
arch 30, 2015
06Sentiment Analysis of User-Generated Content on Drug Review Websites
24Query Formulation for Heuristic Retrieval in Obfuscated and Translated Partially Derived Text
40Non-Governmental Organization (NGO) Libraries for The Visually Impaired in Nigeria: Alternative Format Use and Perception of Information Services
50Study of US/EU National Innovation Policies Based on Nanotechnology Development, and Implications for Korea
66Contribution of Journals to Academic Disciplines

2015 Copyright © Korea Institute of Science and Technology Information
Editorial Board
Co-Editors-in-ChiefGary Marchionini
University of North Carolina, USADong-Geun Oh
Keimyung University, Korea
Associate EditorsHeeyoon Choi
Korea Institute of Science and Technology Information, KoreaHonam Choi
Korea Institute of Science and Technology Information, KoreaKiduk Yang
Kyungpook National University, Korea
Managing EditorsHea Lim Rhee
Korea Institute of Science and Technology Information, KoreaYonggu Lee
Keimyung University, Korea
Beeraka Ramesh BabuUniversity of Madras, India
Pia BorlundUniversity of Copenhagen, Denmark
France BouthillierMcGill University, Canada
Kathleen BurnettFlorida State University, USA
Boryung JuLouisiana State University, USA
Noriko KandoNational Institute of Informatics, Japan
Shailendra KumarUniversity of Delhi, India
Mallinath KumbarUniversity of Mysore, India
Fenglin LiWuhan University, China
Thomas MandlUniversiät Hildesheim, Germany
Lokman I. MehoAmerican University of Beirut, Lebanon
Jin Cheon NaNanyang Technological University, Singapore
Dan O’ConnorRutgers University, USA
Alice R. RobbinIndiana University, USA
Christian SchloeglUniversity of Graz, Austria
Ou ShiyanNanjing University, China
Paul SolomonUniversity of South Carolina, USA
Sujin ButdisuwanMahasarakham University, Thailand
Folker CaroliUniversität Hildesheim, Germany
Seon Heui ChoiKorea Institute of Science and Technology Information, Korea
Eungi KimKeimyung University, Korea
Joy KimUniversity of Southern California, USA
Kenneth KleinUniversity of Southern California, USA
M. KrishnamurthyDRTC, Indian Statistical Institute, India
S.K. Asok KumarThe Tamil Nadu Dr Ambedkar Law University, India
Hur-Li LeeUniversity of Wisconsin-Milwaukee, USA
P. RajendranSRM University, India
B. RameshaBangalore University, India
Soo Young RiehUniversity of Michigan, USA
Taesul SeoKorea Institute of Science and Technology Information, Korea
Tsutomu ShihotaSt. Andrews University, Japan
Ning YuUniversity of Kentucky, USA
Editorial Board Consulting Editors

Table of Contents
Articles 06
JISTaP Vol. 3 No. 1 March 30, 2015Journal of Information Science Theory and Practice • http://www.jistap.org
2015 Copyright © Korea Institute of Science and Technology Information
Call for Paper 77
Information for Authors 78
Sentiment Analysis of User-Generated Content on Drug Review Websites- Jin-Cheon Na, Wai Yan Min Kyaing
06
Query Formulation for Heuristic Retrieval in Obfuscated and Translated Partially Derived Text- Aarti Kumar, Sujoy Das
24
Non-Governmental Organization (NGO) Libraries for The Visually Impaired in Nigeria: Alternative Format Use and Perception of Information Services- ’Niran Adetoro
40
Study of US/EU National Innovation Policies Based on Nanotechnology Development, and Implications for Korea- Jung Sun Lim, Kwang Min Shin, Jin Seon Yoon, Seoung Hun Bae
50
Contribution of Journals to Academic Disciplines- Hye-Young Lee
66
6
JISTaPJournal of Information Science Theory and Practice
http://www.jistap.org
Sentiment Analysis of User-Generated Content on Drug Review Websites
Open Access
Accepted date: March 13, 2015Received date: January 24, 2015
*Corresponding Author: Jin-Cheon NaAssociate professorWee Kim Wee School of Communication and Information Nanyang Technological University, Singapore E-mail: [email protected]
All JISTaP content is Open Access, meaning it is accessible onlineto everyone, without fee and authors’ permission. All JISTaP content is published and distributed under the terms of the Creative Commons Attribution License (http:/ creativecommons.org/licenses/by/3.0/). Under this license, authors reserve the copyright for their content; however, they permit anyone to unrestrictedly use, distribute, and reproduce the content in any medium as far as the original authors and source are cited. For any reuse, redistribution, or reproduction of a work, users must clarify the license terms under which the work was produced.
ⓒ Jin-Cheon Na, Wai Yan Min Kyaing, 2015
ABSTRACTThis study develops an effective method for sentiment analysis of user-generated content on drug review web-sites, which has not been investigated extensively compared to other general domains, such as product reviews. A clause-level sentiment analysis algorithm is developed since each sentence can contain multiple clauses dis-cussing multiple aspects of a drug. The method adopts a pure linguistic approach of computing the sentiment orientation (positive, negative, or neutral) of a clause from the prior sentiment scores assigned to words, taking into consideration the grammatical relations and semantic annotation (such as disorder terms) of words in the clause. Experiment results with 2,700 clauses show the effectiveness of the proposed approach, and it performed significantly better than the baseline approaches using a machine learning approach. Various challenging issues were identified and discussed through error analysis. The application of the proposed sentiment analysis approach will be useful not only for patients, but also for drug makers and clinicians to obtain valuable summaries of public opinion. Since sentiment analysis is domain specific, domain knowledge in drug reviews is incorporated into the sentiment analysis algorithm to provide more accurate analysis. In particular, MetaMap is used to map various health and medical terms (such as disease and drug names) to semantic types in the Unified Medical Language System (UMLS) Semantic Network.
Keywords: Sentiment classification, drug reviews, linguistic approach, health and medical domains
Research PaperJ. of infosci. theory and practice 3(1): 06-23, 2015http://dx.doi.org/10.1633/JISTaP.2015.3.1.1
Jin-Cheon Na *Wee Kim Wee School of Communication and Information, Nanyang Technological UniversitySingapore E-mail: [email protected]
Wai Yan Min KyaingCrimsonLogic Pte. Ltd., Singapore E-mail: [email protected]
7 http://www.jistap.org
Sentiment Analysis of User-Generated Content
1. INTRODUCTION
With the explosion of Web 2.0 platforms, there are enormous amounts of user-generated content. We-blogs, discussion forums, user review web sites, and social networking sites (e.g., Facebook and Twitter) are commonly used to express opinions about various sub-jects. Therefore, for the past decade many researchers have been studying effective algorithms for sentiment analysis of user-generated content (Liu, 2012). Senti-ment analysis is a type of subjectivity analysis which analyzes sentiment in a given textual unit with the objective of understanding the sentiment polarities (i.e. positive, negative, or neutral) of the opinions regarding various aspects of a subject. It is still considered as a very challenging problem since user generated content is described in various and complex ways using natural language.
For sentiment analysis, most researchers have worked on general domains (such as electronic prod-ucts, movies, and restaurants), but not extensively on health and medical domains. Previous studies have shown that this health-related user-generated content is useful from different points of view. First, users are often looking for stories from “patients like them” on the Internet, which they cannot always find among their friends and family (Sarasohn-Kahn, 2008). More-over, studies investigating the impact of social media on patients have shown that for some diseases and health problems, online community support can have a positive effect (Jaloba, 2009; Schraefel et al., 2009). Because of its novelty as well as quality and trustwor-thiness issues, user-generated content of social media in health and medical domains is underexploited. It needs to be further studied, understood, and then lev-eraged in designing new online tools and applications.
For instance, when a new drug is released or used, users or patients publish their opinions about the drug on the social Web. The sentiment analysis results of drug reviews will be useful not only for patients to decide which drugs they should buy or take, but also for drug makers and clinicians to obtain valuable summaries of public opinion and feedback. Sentiment analysis can also highlight patients’ misconceptions and dissenting opinions about a drug. Therefore, the purpose of this paper is to develop an effective method for sentiment analysis of drug reviews on health infor-
mation service websites.A clause-level sentiment analysis algorithm has been
developed since each sentence can contain multiple clauses discussing multiple aspects, such as overall opinion, effectiveness, side effects, condition, cost, and dosage. Generally, each clause contains very few sub-jective terms, and therefore the method adopts a pure linguistic approach whereby a set of sentiment anal-ysis rules are used to compute contextual sentiment scores by utilizing the grammatical relations, parts-of-speech (POS), and prior sentiment scores of terms in the clause. Since sentiment analysis is domain specific, domain knowledge on health and medical fields is very important to generate more accurate analysis. Therefore, MetaMap (Aronson & Lang, 2010) is used to map various health and medical terms (e.g., disease, symptom, and drug names) in the review documents to semantic types in the Unified Medical Language System (UMLS) Semantic Network, and the tagged se-mantic information is utilized for sentiment analysis.
We conducted a preliminary study where a clause-level sentiment classification algorithm was developed and applied to drug reviews on a discussion forum (Na et al., 2012). This study is based on our previous work, and we have improved the approach by adding additional rules for both handling more complex relations among words and utilizing domain knowledge further in drug reviews. Moreover, the neu-tral class is tested in addition to positive and negative classes in this study, and the details of sentiment analy-sis rules and implementation are described in the paper.
In the following sections, related work is described first. Then our sentiment analysis method is proposed, and its experiment results and issues are described and discussed. Finally, conclusion information is provided.
2. RELATED WORK
Researchers have used various approaches for sen-timent classification (Liu, 2012; Pang & Lee, 2008). Sentiment analysis approaches often require resources such as sentiment lexicons to determine which words or phrases are positive or negative in general or do-main context. General Inquirer (Stone et al., 1966) is a manually compiled resource often used in sentiment analysis. Many techniques have been proposed for
8
JISTaP Vol.3 No.1, 06-23
learning the polarity of sentiment words (Huang et al., 2014; Lu et al., 2011; Qiu et al., 2009). In our study, general sentiment lexicon was generated using publicly available sentiment lexicons and domain lexicon was compiled from the development dataset.
Most of the early studies were focused on docu-ment-level analysis for assigning the sentiment ori-entation of a document (Pang et al., 2002). However, a document-level sentiment analysis approach is less effective when in-depth sentiment analysis of review texts is required. More recently researchers have car-ried out sentence-level sentiment analysis to examine and extract opinions regarding various aspects of re-viewed subjects (Ding et al., 2008; Jo & Oh, 2011; Kim et al., 2013). Our approach uses clause-level sentiment analysis so that different opinions on multiple aspects expressed in a sentence can be processed separately for each clause. For instance, the sentence “I like this drug, but it causes me some drowsiness” has two clauses expressing two aspects: overall opinion and side effects. Some researchers have studied phrase-level contextu-al sentiment analysis, but phrases are often not long enough to contain both sentiment and feature terms together for aspect-based analysis (Wilson et al., 2009).
Generally there are two main approaches for sen-timent analysis: a machine learning approach and a linguistic approach (i.e. a natural language processing approach) (Shaikh et al., 2008). Since clauses are quite short and do not contain many subjective words, the machine learning approach generally suffers from data sparseness problems. Also, the machine learning approach cannot handle complex grammatical rela-tionships among words in a clause. Some researchers have used various linguistic features in addition to word features in the machine learning approach to overcome the limitations of the bag-of-word (BOW) approach (Liu, 2012). In this study, we are using a pure linguistic approach to overcome these weaknesses in the machine learning approach. We also compare the results of our proposed linguistic approach with the ones of a machine learning approach.
A relatively small number of works have studied social media content in health and medical domains. For instance, Xia et al. (2009) developed a system to classify new posts on a forum according to their topic and polarity. The forum is called “Patient Opinion” and is an online review service for users of the British
National Health Service. Then the users can add re-views on food, staff, treatments, and so on. Both topic and polarity identification were achieved through a rather simple machine learning approach using BOW. Niu et al. (2005) applied Support Vector Machine (SVM) to detect four possibilities of clinical outcome sentences in medical publications (Clinical Evidence: no, positive, negative, or neutral outcome). They argued that combining linguistic features (such as unigrams, bigrams, polarity change phrases, and negation) and domain knowledge (i.e. the semantic types of the UMLS) led to the highest accuracy (79.42%). However, they analysed clinical outcomes instead of user-gener-ated content. Denecke (2008) proposed a classification method for distinguishing affective from informative medical blogs by utilizing both the semantic types of the UMLS and the sentiment lexicon SentiWordNet (Baccianella et al., 2010). The paper work is similar to subjectivity analysis for distinguishing subjective from objective documents (Wiebe & Riloff, 2005). Nikfar-jam and Gonzalez (2011) developed an information extraction system to dig out mentions of adverse drug reactions from drug reviews by using association rule mining. Their evaluation results were 70% precision, 66% recall, and 68% F-measure. Tsytsarau et al. (2011) worked on the problem of identifying sentiment-based contradictions. They applied the proposed approach to a data set of drug reviews collected from the Dru-gRatingz website (http://drugratingz.com), but they used an existing general sentiment classification tool without considering domain knowledge, and focused mainly on the detection of contradictions.
3. SENTIMENT CLASSIFICATION METHOD
3.1. OverviewFor clause-level sentiment analysis of drug reviews,
first, each sentence is broken into independent claus-es, and their review aspects are determined. Since automatic methods for clause separation and aspect detection are also challenging problems, the clauses and their aspects identified by the system are validated by manual coders. Then, for each clause semantic an-notation (such as disorder terms) is performed, and a prior sentiment score is assigned to each word. Then, for the clause the grammatical dependencies are de-
9 http://www.jistap.org
Sentiment Analysis of User-Generated Content
termined using a parser, and the contextual sentiment score (between -1 and 1) is calculated by traversing the dependency tree based on its clause structure.
3.2. Clause Separation and Aspect Detection3.2.1 Clause Separation
In order to produce more accurate and efficient sen-timent analysis, sentences are broken down into multi-ple clauses that can stand alone. For instance, the sen-tence “I took this drug and it worked great.” is separated into two clauses: “I took this drug” and “and it worked great.” Clauses can be dependent or independent. An independent clause (or main clause) is a clause that can stand by itself, also known as a simple sentence. An independent clause contains a subject and a predi-cate, and it makes sense by itself. Multiple independent clauses can be joined by using a semicolon or a comma plus a coordinating conjunction (e.g., for, and, nor, but, or, yet, so, etc.). A dependent clause (or a subordinate clause) is a clause that augments an independent clause with additional information, but which cannot stand alone as a sentence. Dependent clauses can start with conjunctions such as after, although, as, as if, because, and so on. Thus, in our study each clause indicates an independent clause which may include a dependent clause.
For clause separation, we parsed sentences into Tree Structures (i.e. Parse Trees) using Stanford Parser (de
Marneffe, 2006), and investigated the structures of the Parse Trees and their clause separation points. Then we manually constructed heuristics rules to split sentenc-es into clauses. In the study the automatically separat-ed clauses were validated by manual coders to reduce possible errors from the clause separation process.
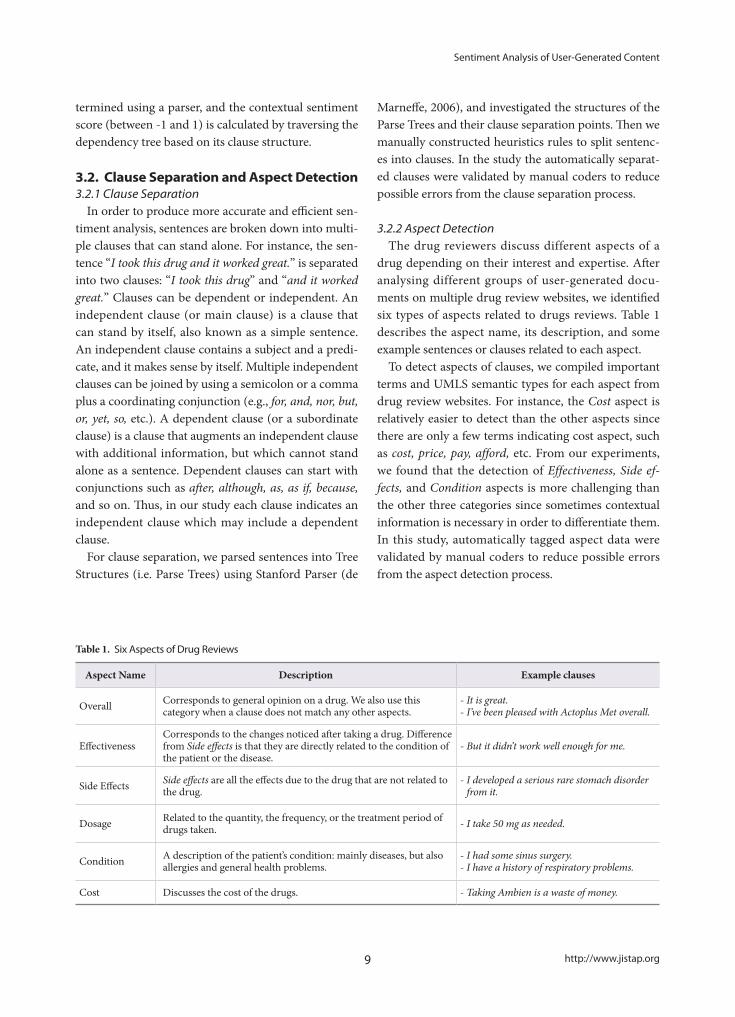
3.2.2 Aspect DetectionThe drug reviewers discuss different aspects of a
drug depending on their interest and expertise. After analysing different groups of user-generated docu-ments on multiple drug review websites, we identified six types of aspects related to drugs reviews. Table 1 describes the aspect name, its description, and some example sentences or clauses related to each aspect.
To detect aspects of clauses, we compiled important terms and UMLS semantic types for each aspect from drug review websites. For instance, the Cost aspect is relatively easier to detect than the other aspects since there are only a few terms indicating cost aspect, such as cost, price, pay, afford, etc. From our experiments, we found that the detection of Effectiveness, Side ef-fects, and Condition aspects is more challenging than the other three categories since sometimes contextual information is necessary in order to differentiate them. In this study, automatically tagged aspect data were validated by manual coders to reduce possible errors from the aspect detection process.
Table 1. Six Aspects of Drug Reviews
Aspect Name Description Example clauses
Overall Corresponds to general opinion on a drug. We also use this category when a clause does not match any other aspects.
- It is great.- I’ve been pleased with Actoplus Met overall.
EffectivenessCorresponds to the changes noticed after taking a drug. Difference from Side effects is that they are directly related to the condition of the patient or the disease.
- But it didn’t work well enough for me.
Side Effects Side effects are all the effects due to the drug that are not related to the drug.
- I developed a serious rare stomach disorder from it.
Dosage Related to the quantity, the frequency, or the treatment period of drugs taken. - I take 50 mg as needed.
Condition A description of the patient’s condition: mainly diseases, but also allergies and general health problems.
- I had some sinus surgery.- I have a history of respiratory problems.
Cost Discusses the cost of the drugs. - Taking Ambien is a waste of money.
10
JISTaP Vol.3 No.1, 06-23
3.3. Sentiment LexiconsWe have created a general lexicon (9,630 terms) and
a domain lexicon (278 terms). For the general lexicon construction, first we collected positive and negative terms (7,611 terms) from Subjectivity Lexicon (SL) (Wilson et al., 2005). SL contains more than 8,000 sub-jective expressions manually annotated as strongly or weakly subjective, and as positive, negative, neutral, or both. We set the prior score +1 to strongly subjective positive terms and -1 to strongly subjective negative terms. Also, we set the prior score +0.5 to weakly subjective positive terms and -0.5 to weakly subjec-tive negative terms. An additional 2,019 terms were collected from SentiWordNet, and they were manually tagged by three manual coders, and conflicting cases were resolved using a heuristic approach.
In addition, we added some domain specific terms to the domain lexicon during the development phase (e.g., work (verb): +1; sugar high: -0.5; sugar in control: +0.5; heartbeat up: -1). To compensate for the small domain lexicon, MetaMap is used to tag disorder terms, such as “pain” and “hair loss,” using the Disor-ders semantic group (Bodenreider & McCray, 2003), and with them set to -1 sentiment score. The Disor-ders semantic group contains a list of UMLS semantic types related to disorder terms, such as “Disease or Syndrome” and “Injury or Poisoning.” In the study we excluded the “Finding” semantic type from it to reduce false positive disorder terms.
3.4. Dependency TreeWe used the Stanford NLP library (de Marneffe,
2006) to process the grammatical relationships of words in a clause. There are fifty-five Stanford typed dependencies which are binary grammatical relation-ships between two words: a governor and a dependent. For example, the sentence “I like the drug.” has the fol-lowing dependencies among the words:
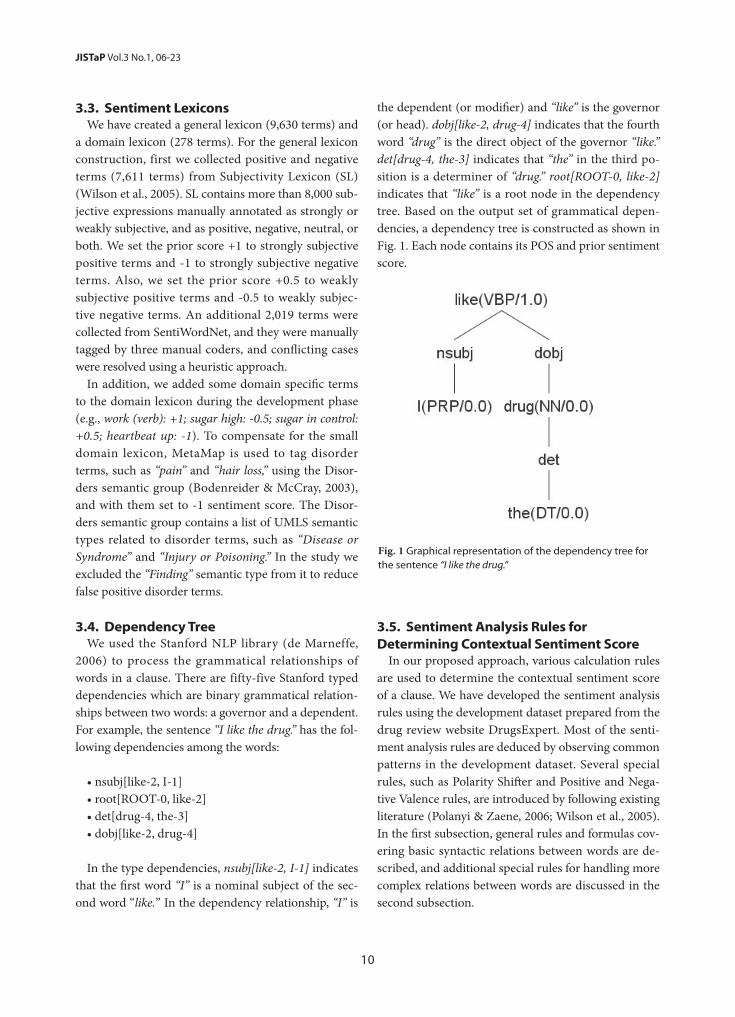
• nsubj[like-2, I-1] • root[ROOT-0, like-2]• det[drug-4, the-3] • dobj[like-2, drug-4] In the type dependencies, nsubj[like-2, I-1] indicates
that the first word “I” is a nominal subject of the sec-ond word “like.” In the dependency relationship, “I” is
the dependent (or modifier) and “like” is the governor (or head). dobj[like-2, drug-4] indicates that the fourth word “drug” is the direct object of the governor “like.” det[drug-4, the-3] indicates that “the” in the third po-sition is a determiner of “drug.” root[ROOT-0, like-2] indicates that “like” is a root node in the dependency tree. Based on the output set of grammatical depen-dencies, a dependency tree is constructed as shown in Fig. 1. Each node contains its POS and prior sentiment score.
3.5. Sentiment Analysis Rules for Determining Contextual Sentiment Score
In our proposed approach, various calculation rules are used to determine the contextual sentiment score of a clause. We have developed the sentiment analysis rules using the development dataset prepared from the drug review website DrugsExpert. Most of the senti-ment analysis rules are deduced by observing common patterns in the development dataset. Several special rules, such as Polarity Shifter and Positive and Nega-tive Valence rules, are introduced by following existing literature (Polanyi & Zaene, 2006; Wilson et al., 2005). In the first subsection, general rules and formulas cov-ering basic syntactic relations between words are de-scribed, and additional special rules for handling more complex relations between words are discussed in the second subsection.
Fig. 1 Graphical representation of the dependency tree for the sentence “I like the drug.”
11 http://www.jistap.org
Sentiment Analysis of User-Generated Content
Table 2. Adjectival Phrase Rules for adverb + adjective (advmod)
ID (Ad)verb (A)djective Output ExamplesAdvmod(adjective, adverb)
F1 + / 0* + / 0 + Enthusiastically Responded (+1)
F2 + / 0 - - Extremely Disappointed (-1)
F3 - + / 0 - Glaringly Stared (-1)
F4 - - - Strictly Prohibitive (-1)
*: 0 indicates neutral.
Formula
F1Positive Ad and Positive A (positive includes neutral) => + (|A| + (1-|A|) * |Ad|)E.g., Enthusiastically Responded: 1 and 0 => + (0 + (1-0) * 1) = +1
F2Positive Ad and Negative A => - (|A| + (1-|A|) * |Ad|)E.g., Extremely Disappointed: -1 and -1 => - (1 + (1-1) * 1) = -1
F3Negative Ad and Positive A => AdE.g., Glaringly Stared: -1 and 0 => -1
F4Negative Ad and Negative A => - (|A| + (1-|A|) * |Ad|) E.g., Strictly Prohibitive: -1 and -0.5 => - (0.5 + (1-0.5) * 1) = -1
3.5.1. General Rules for Contextual Sentiment ScoresPhrase. Phrase rules covering adjectival, verb, and
noun phrases are used to calculate contextual senti-ment scores of phrases which can be a subject, object, or verb phrase in English sentences.
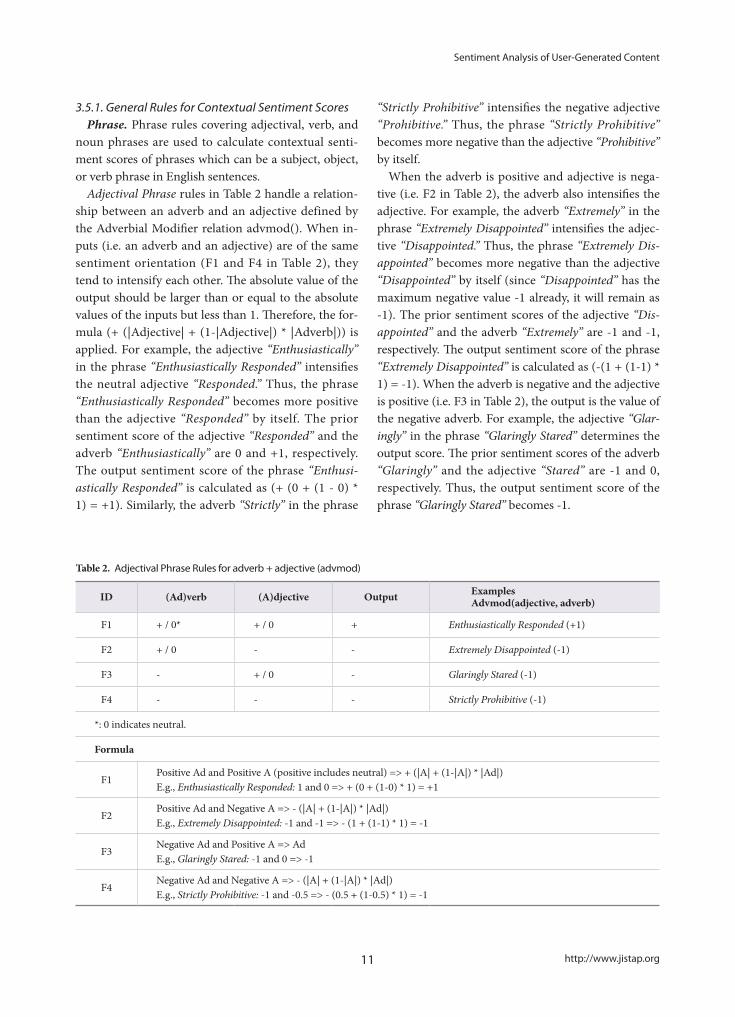
Adjectival Phrase rules in Table 2 handle a relation-ship between an adverb and an adjective defined by the Adverbial Modifier relation advmod(). When in-puts (i.e. an adverb and an adjective) are of the same sentiment orientation (F1 and F4 in Table 2), they tend to intensify each other. The absolute value of the output should be larger than or equal to the absolute values of the inputs but less than 1. Therefore, the for-mula (+ (|Adjective| + (1-|Adjective|) * |Adverb|)) is applied. For example, the adjective “Enthusiastically” in the phrase “Enthusiastically Responded” intensifies the neutral adjective “Responded.” Thus, the phrase “Enthusiastically Responded” becomes more positive than the adjective “Responded” by itself. The prior sentiment score of the adjective “Responded” and the adverb “Enthusiastically” are 0 and +1, respectively. The output sentiment score of the phrase “Enthusi-astically Responded” is calculated as (+ (0 + (1 - 0) * 1) = +1). Similarly, the adverb “Strictly” in the phrase
“Strictly Prohibitive” intensifies the negative adjective “Prohibitive.” Thus, the phrase “Strictly Prohibitive” becomes more negative than the adjective “Prohibitive” by itself.
When the adverb is positive and adjective is nega-tive (i.e. F2 in Table 2), the adverb also intensifies the adjective. For example, the adverb “Extremely” in the phrase “Extremely Disappointed” intensifies the adjec-tive “Disappointed.” Thus, the phrase “Extremely Dis-appointed” becomes more negative than the adjective “Disappointed” by itself (since “Disappointed” has the maximum negative value -1 already, it will remain as -1). The prior sentiment scores of the adjective “Dis-appointed” and the adverb “Extremely” are -1 and -1, respectively. The output sentiment score of the phrase “Extremely Disappointed” is calculated as (-(1 + (1-1) * 1) = -1). When the adverb is negative and the adjective is positive (i.e. F3 in Table 2), the output is the value of the negative adverb. For example, the adjective “Glar-ingly” in the phrase “Glaringly Stared” determines the output score. The prior sentiment scores of the adverb “Glaringly” and the adjective “Stared” are -1 and 0, respectively. Thus, the output sentiment score of the phrase “Glaringly Stared” becomes -1.
12
JISTaP Vol.3 No.1, 06-23
Verb Phrase rules handle a relationship between a verb and an adverb defined by the Adverbial Modifier relation advmod(). For calculating contextual scores of verb phrases, the same formulas used in Adjectival Phrase rules (Table 2) are applied with applicable POSs. Examples of verb phrases are as follows: cheer happily: +1; gossip proudly: -1; liberate badly: -1; fail badly: -1. Noun Phrase rules handle a relationship be-tween an adjective and a noun defined by the Adjec-tival Modifier relation amod(). The subject or object of a clause can be a noun phrase consisting of a noun and an adjective. For calculating contextual scores of noun phrases, the same formulas used in Adjecti-val Phrase rules are also applied. Examples of noun phrases are as follows: great drug: +1; big failure: -0.5; lousy drug: -1; worst disease: -1. In implementation, advmod() is processed before amod() to handle three-word phrases, such as “very nice drug.” In other words, the contextual sentiment score of “very nice” is calculated first with advmod(), and then the resulting value is used as the value of “nice” to calculate the contextual score of “nice drug” using amod(). This al-lows calculating a contextual sentiment score for “very nice drug.” Also, relevant POSs (i.e. adverb, adjective, and noun) are checked with the two functional rela-tions: amod() and advmod().
Conjunct. A conjunct is the relation between two elements connected by a coordinating conjunction: and, or, but, and so on. Conjunct Rules handle a relationship between two terms connected by the Conjunct relations: conj_and(), conj_or(), and conj_but().
When inputs are of the same sentiment orientation, they intensify each other if they are connected by “and” (e.g., He is good and honest: +1; He is bad and dishonest: -1). If they are connected by other connec-tors such as “or,” the average value of the two input values is used. When inputs have different sentiment orientation, their sentiment intensity values are com-pared. If they are the same, the output value becomes 0 (e.g., He is handsome but dishonest: 0). Otherwise, the higher intensity value becomes the output value.
Predicate. Each clause consists of a subject and a predicate. The predicate indicates all the syntactic components except its subject. Predicate rules handle a relationship between a verb phrase and an object / complement defined by the Direct Object, Indi-
rect Object, or Adjectival Complement relationship: dobj(), iobj(), or acomp(). For calculating contextual scores of predicates, the same formulas used in Ad-jectival Phrase rules (Table 2) are also applied. Exam-ples of phrases are as follows: provide goodness: +1; looks beautiful: +1; provide problems: -0.5; lose award: -0.5; suffers pain: -1.
Clausal Complement Relation rules handle a rela-tionship between a verb phrase / adjective phrase and a clausal complement defined by the Open Clausal Complement relationship, xcomp(). These comple-ments do not have their own subjects and are always non-finite, which includes participles, infinitives, or gerunds. For instance, for clauses with “to” depen-dency, the sentiment score of the second clause is in-tensified when the first clause is positive (e.g., I would love to use this great drug again: +1; I will advise any-one to throw away the drug: -0.5), and the sentiment score of the second clause is negated when the first clause is negative (e.g., It is hard to like this drug: -1.0; It is hard to find a problem: +0.5).
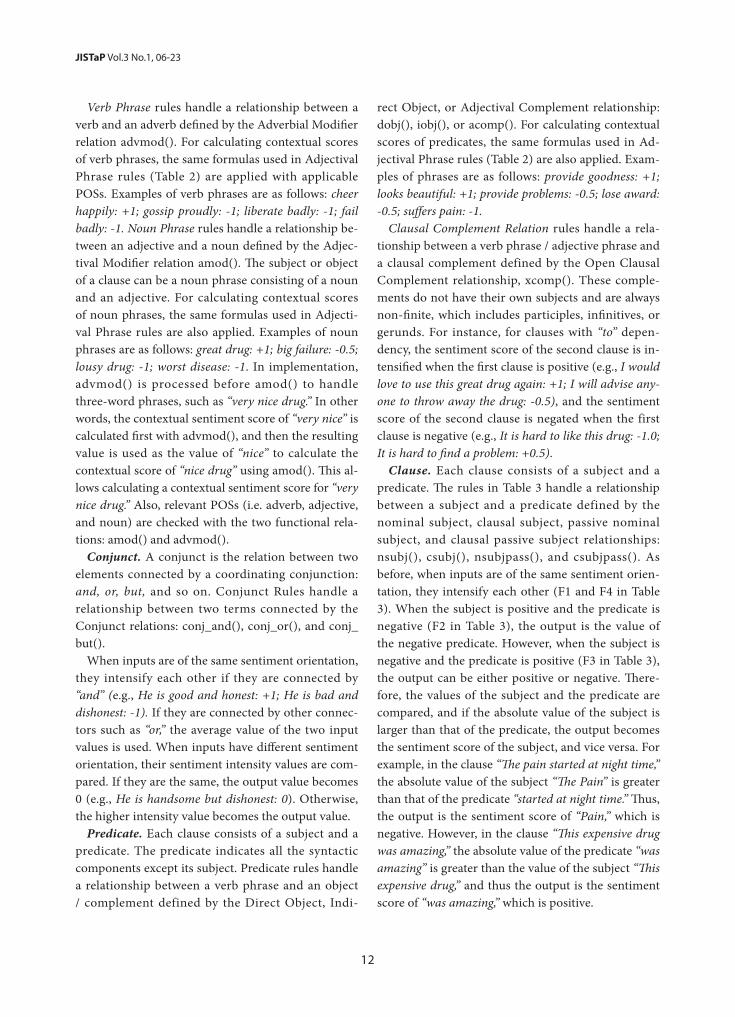
Clause. Each clause consists of a subject and a predicate. The rules in Table 3 handle a relationship between a subject and a predicate defined by the nominal subject, clausal subject, passive nominal subject, and clausal passive subject relationships: nsubj(), csubj(), nsubjpass(), and csubjpass(). As before, when inputs are of the same sentiment orien-tation, they intensify each other (F1 and F4 in Table 3). When the subject is positive and the predicate is negative (F2 in Table 3), the output is the value of the negative predicate. However, when the subject is negative and the predicate is positive (F3 in Table 3), the output can be either positive or negative. There-fore, the values of the subject and the predicate are compared, and if the absolute value of the subject is larger than that of the predicate, the output becomes the sentiment score of the subject, and vice versa. For example, in the clause “The pain started at night time,” the absolute value of the subject “The Pain” is greater than that of the predicate “started at night time.” Thus, the output is the sentiment score of “Pain,” which is negative. However, in the clause “This expensive drug was amazing,” the absolute value of the predicate “was amazing” is greater than the value of the subject “This expensive drug,” and thus the output is the sentiment score of “was amazing,” which is positive.
13 http://www.jistap.org
Sentiment Analysis of User-Generated Content
Table 3. Clause Rules for subject + predicate (nsubj, csubj, nsubjpass, csubjpass)
ID (S)ubject (P)redicate Output
Examplesnsubj (predicate, subject)csubj (predicate, clausal subject)nsubjpass (predicate, subject)csubjpass (predicate, clausal subject)
F1 + /0 + / 0 + The drug did great. (+1)
F2 + / 0 - - It performed poorly. (-1)
F3 - + / 0 +/-This expensive drug was amazing. (+1)The pain started at night time. (-1)
F4 - - - The bad drug spoiled everything. (-1)
Formula
F1Positive S and Positive P => + (|P| + (1-|P|) * |S|)E.g., 0 and +1 => + (1 + (1-1) * 0) = +1
F2Positive S and Negative P => PE.g., 0 and -1 => -1
F3Negative S and Positive P => If |S| > |P| Then S Else PE.g., -0.5 and +1 => +1 -1 and 0 => -1
F4Negative S and Negative P => - (|P| + (1-|P|) * |S|)E.g., -1 and -1 => - (1 + (1-1) * 1) = - 1
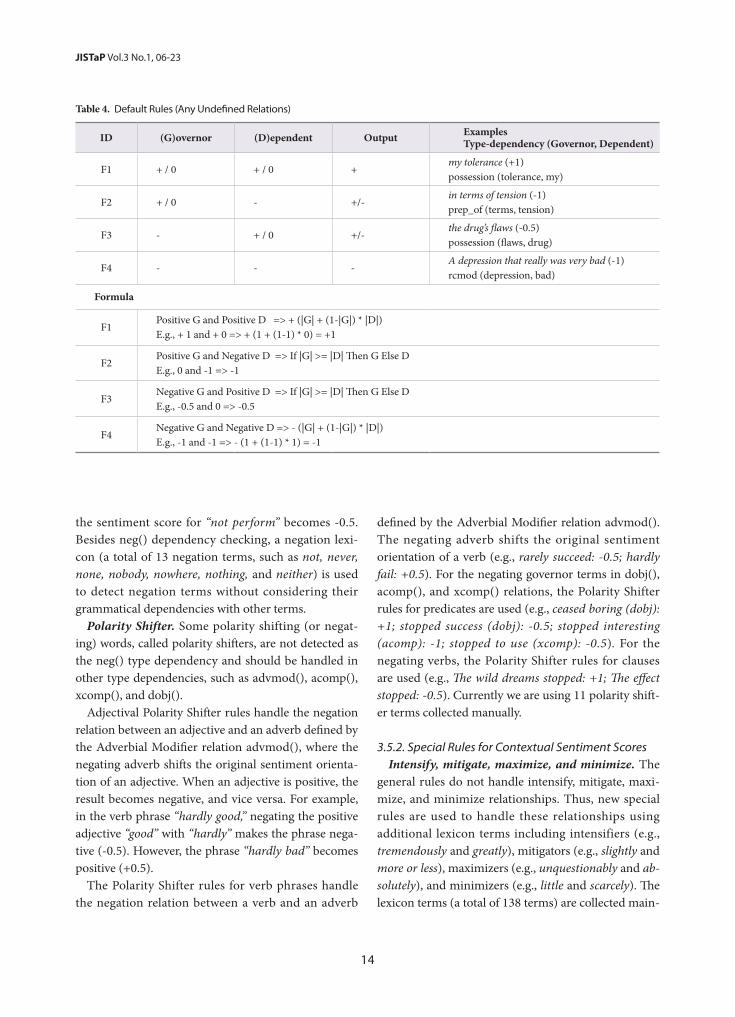
Default Rule. Since the previously defined rules (and subsequently defined rules) cannot comprehensively cover all the grammatical dependencies of words in clauses, the default calculation rules in Table 4 are ap-plied to unmatched phrases. The formulas are gener-alized since the output sentiment orientation can vary in such situations. When both terms are either positive or negative, they intensify each another and the output maintains their original sentiment orientation (F1 and F4 in Table 4). However, when their sentiment orien-tations are different, the term with a greater sentiment score is used as the output (F2 and F3 in Table 4). For instance, in the case of “the drug’s flaws,” “drug” (noun) and “flaws” (noun) are associated with the possession modifier relation. This case is processed using formula F3 in Table 4.
Clause connector. A clause connector is used to connect two clauses in a clause, and it is used to merge their contextual sentiment scores into one value. For instance, the adverbial clause modifier functional dependency defines a relation between a verb phrase and a clause modifying the verb. Therefore, the Clause
Connector rules should be applied after the involved clauses’ sentiment scores are calculated, using the clause rules (i.e. rules in Table 3). The rules handle ad-verbial clause modifier, clausal complement, and pur-pose clause modifier relations: advcl(), ccomp(), and purpcl(). The Clause Connector rules apply the similar formulas used in Default rules (Table 4). Examples clauses are as follows: He says that the drug works well: +0.5; He says that the drug does not work well: -0.5; He misuses drugs in order to sleep well: -1; The pain increased as the night was falling: -1.
Negation of Term. Handling of negation is one of the key processes in sentiment analysis. The negation modifier neg() is the relation between a negation word (such as not, never, and none) and the word it modifies. For example, in the phrase “not good,” the negativity of the word “not” is -1 and the sentiment score of the term “good” is +0.5. The output becomes -0.5 through multiplying +0.5 by -1. For the phrase “not lousy,” the output becomes +1. In addition, a special rule is defined to output the negation of a neutral term as -0.5. For instance, when the score of “perform” is 0,
14
JISTaP Vol.3 No.1, 06-23
the sentiment score for “not perform” becomes -0.5. Besides neg() dependency checking, a negation lexi-con (a total of 13 negation terms, such as not, never, none, nobody, nowhere, nothing, and neither) is used to detect negation terms without considering their grammatical dependencies with other terms.
Polarity Shifter. Some polarity shifting (or negat-ing) words, called polarity shifters, are not detected as the neg() type dependency and should be handled in other type dependencies, such as advmod(), acomp(), xcomp(), and dobj().
Adjectival Polarity Shifter rules handle the negation relation between an adjective and an adverb defined by the Adverbial Modifier relation advmod(), where the negating adverb shifts the original sentiment orienta-tion of an adjective. When an adjective is positive, the result becomes negative, and vice versa. For example, in the verb phrase “hardly good,” negating the positive adjective “good” with “hardly” makes the phrase nega-tive (-0.5). However, the phrase “hardly bad” becomes positive (+0.5).
The Polarity Shifter rules for verb phrases handle the negation relation between a verb and an adverb
defined by the Adverbial Modifier relation advmod(). The negating adverb shifts the original sentiment orientation of a verb (e.g., rarely succeed: -0.5; hardly fail: +0.5). For the negating governor terms in dobj(), acomp(), and xcomp() relations, the Polarity Shifter rules for predicates are used (e.g., ceased boring (dobj): +1; stopped success (dobj): -0.5; stopped interesting (acomp): -1; stopped to use (xcomp): -0.5). For the negating verbs, the Polarity Shifter rules for clauses are used (e.g., The wild dreams stopped: +1; The effect stopped: -0.5). Currently we are using 11 polarity shift-er terms collected manually.
3.5.2. Special Rules for Contextual Sentiment ScoresIntensify, mitigate, maximize, and minimize. The
general rules do not handle intensify, mitigate, maxi-mize, and minimize relationships. Thus, new special rules are used to handle these relationships using additional lexicon terms including intensifiers (e.g., tremendously and greatly), mitigators (e.g., slightly and more or less), maximizers (e.g., unquestionably and ab-solutely), and minimizers (e.g., little and scarcely). The lexicon terms (a total of 138 terms) are collected main-
Table 4. Default Rules (Any Undefined Relations)
ID (G)overnor (D)ependent Output Examples Type-dependency (Governor, Dependent)
F1 + / 0 + / 0 +my tolerance (+1)possession (tolerance, my)
F2 + / 0 - +/-in terms of tension (-1)prep_of (terms, tension)
F3 - + / 0 +/-the drug’s flaws (-0.5)possession (flaws, drug)
F4 - - -A depression that really was very bad (-1)rcmod (depression, bad)
Formula
F1Positive G and Positive D => + (|G| + (1-|G|) * |D|)E.g., + 1 and + 0 => + (1 + (1-1) * 0) = +1
F2Positive G and Negative D => If |G| >= |D| Then G Else DE.g., 0 and -1 => -1
F3Negative G and Positive D => If |G| >= |D| Then G Else DE.g., -0.5 and 0 => -0.5
F4Negative G and Negative D => - (|G| + (1-|G|) * |D|)E.g., -1 and -1 => - (1 + (1-1) * 1) = -1

15 http://www.jistap.org
Sentiment Analysis of User-Generated Content
Table 5. Decrease Disorder Rules for Predicates (dobj)
ID (V)erb Phrase (O)bject Output Examples
F1Decrease-Type Verb (+/0/-)
Disorders Se-mantic Group (-)
+ Decrease the pain (+1)
Formula
F1Decrease-Type Verb V and Disorders Semantic Group Term O => -1* OE.g., decrease the pain: -0.5 and -1 => -1 * -1 = +1
ly from the given lists from Quirk et al. (1985). These modifier terms are checked before the corresponding functional dependencies, such as amod() and adv-mod(), are applied.
In the Intensify rule, the polarity score of the modi-fied word is doubled, but limited to a value of ±1 (e.g., enormously good: +1). If the modified word is neutral, the score becomes +0.5. Conversely, the polarity of the modified word is halved in the Mitigate rule (e.g., slightly better: +0.5). The polarity score is maximized to ±1 in the Maximize rule (e.g., totally bad: -1), and in the Minimize rule, the polarity score of the modified word is reduced to a quarter of its original score (e.g., minimal passion: +0.25).
Positive and negative valence. A positive or neg-ative valence term can determine overall sentiment polarity of a whole clause no matter how it is modified by other terms. We are using 13 positive valence terms (e.g., help and improve) and 8 negative valence terms (e.g., hate and suffer) that are all verbs. If a positive or negative valence term is found in a clause, its senti-ment prior score becomes an output sentiment score of the clause (e.g., helped me escape from pains: +0.5; hate high level drugs: -1). In case the sentiment prior score of the valence term is neutral, the output value becomes +0.5 for a positive valence term and -0.5 for a negative valence term.
Decrease disorder. Rules are defined to handle “de-crease-type verb + disorder object” cases, such as “It reduces the pain.” If the general predicate rules are ap-plied, the output of the clause “It reduces the pain” will be -1, which is wrong. The general rules can handle only “increase-type verb + disorder object” cases, such as “It increases the pain.” The rule in Table 5 handles the direct object relation between a decrease-type verb
and a disorder object defined by the Direct Object dobj(). The output becomes +1 by multiplying the dis-order object value (i.e. -1) by -1. We have collected 23 decrease-type verbs, such as reduce, decrease, lessen, and so on. The Disorders semantic group in UMLS is used to tag disorder terms in clauses using MetaMap. For example, in the sentences “It releases the pain” and “The drug causes me hair loss,” the terms “pain” and “hair loss” are tagged as disorder terms with -1 senti-ment score since they are concepts under the Disor-ders semantic group.
Similarly the Decrease Disorder rules for clauses are used to handle “disorder subject + decrease-type verb” situations (e.g., Symptoms subsided: +1) and the Decrease Disorder rules for noun phrases are used to handle “decrease-type adjective + disorder noun” cases (e.g., Less side effects: +1).
Preposition (for, as, with) and disorder. Rules are defined to handle “(prep_for, prep_as, or prep_with) type dependency + disorder term” cases. For instance, without these rules, the phrase “good drug for fever” would have a negative score -1 by using existing rules, such as Default rules. But by introducing these new rules, “good drug for fever” gets a positive score of +0.5 since the new rules set the sentiment score of the disorder term to 0 and ignore the “for fever” part. Ex-amples of “(prep_for or prep_as) type dependency + disorder term” cases are as follows: Ineffective drug for pain: -0.5; A drug for pain: 0. Additional similar rules are defined to handle “(prep_with) type dependency + disorder term” cases (e.g., Helped with pain: +0.5; Dying with pain: -1). Particularly, in prep_with(G, D), if G is neutral the value of D (i.e. the disorder term) is returned (e.g., A guy with ADHD: -1).
Preposition (because of, due to) and disorder. When
16
JISTaP Vol.3 No.1, 06-23
a “because of ” or “due to” term occurs with a disorder term, it can affect the sentiment score result of the main clause, and so we set the sentiment score of the disorder term to 0. For instance, with the rule the system can return a right negative sentiment score for the clause “I hardly get my work done because of head-aches.” since “because of headaches” is set to score 0 and does not affect the sentiment score calculation of the main part. This rule is applied when the distance between a “because of ” or “due to” term and a disorder term is within the predefined range (i.e. 5).
Disorder and medication. This rule is used to han-dle “disorder term + medication (drug)” cases. For instance, without this rule the noun phrase “cancer drug” would have a negative score -1 by using Default rules. But by introducing this rule, it becomes 0.
Phrasal verb. A phrasal verb (such as back off and break up) is identified by using the phrasal verb par-ticle relation prt(verb, particle), which identifies a re-lation between the verb and its particle. In the case of “back off” that is negative (-1.0); if “back” and “off” are handled by Default rules, it will become +0.75 since “back” and “off ” have the prior scores +0.5 and +0.5 respectively. Currently we are using 121 phrasal verbs collected manually (e.g., blow up: -1; get along: +1).
Contradicting connectors. Using this rule, depen-dent clauses having contradicting connectors such as although, though, however, but, on the contrary, and notwithstanding are ignored, and only their main clauses are considered to calculate contextual senti-ment scores. For instance, in the sentence “Although the drug worked well, it gave me a headache,” the dependent clause “Although the drug worked well” is ignored or neutralized.
Question. This is used to detect question clauses using the question mark “?.” It will set the sentiment polarity of a whole clause to the neutral value 0.
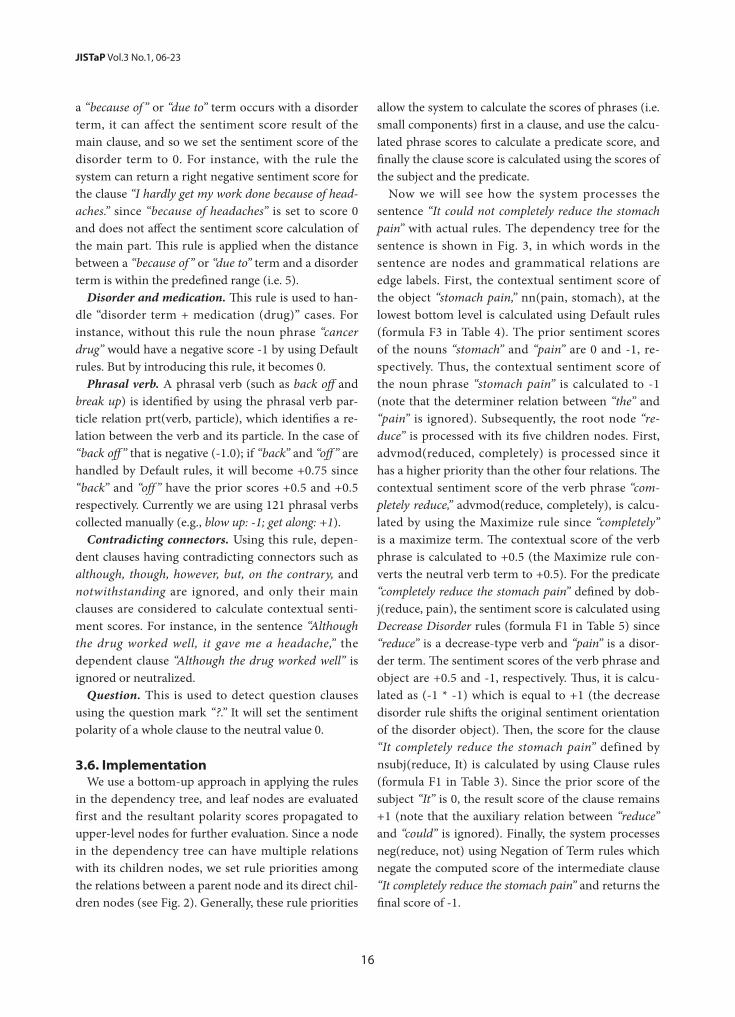
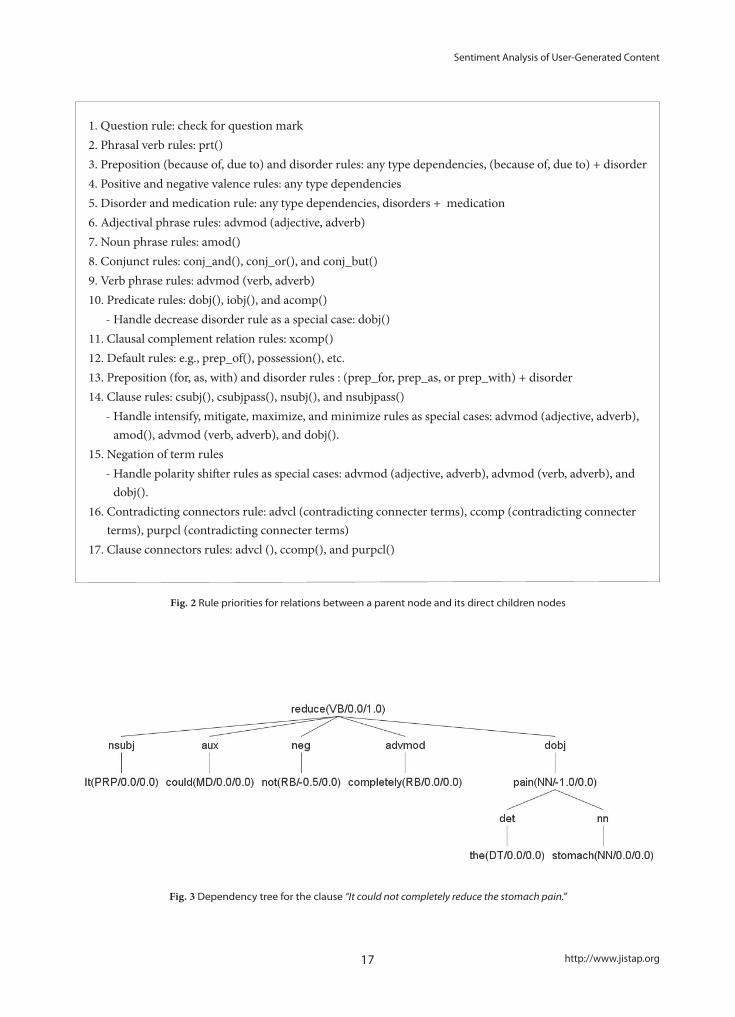
3.6. ImplementationWe use a bottom-up approach in applying the rules
in the dependency tree, and leaf nodes are evaluated first and the resultant polarity scores propagated to upper-level nodes for further evaluation. Since a node in the dependency tree can have multiple relations with its children nodes, we set rule priorities among the relations between a parent node and its direct chil-dren nodes (see Fig. 2). Generally, these rule priorities
allow the system to calculate the scores of phrases (i.e. small components) first in a clause, and use the calcu-lated phrase scores to calculate a predicate score, and finally the clause score is calculated using the scores of the subject and the predicate.
Now we will see how the system processes the sentence “It could not completely reduce the stomach pain” with actual rules. The dependency tree for the sentence is shown in Fig. 3, in which words in the sentence are nodes and grammatical relations are edge labels. First, the contextual sentiment score of the object “stomach pain,” nn(pain, stomach), at the lowest bottom level is calculated using Default rules (formula F3 in Table 4). The prior sentiment scores of the nouns “stomach” and “pain” are 0 and -1, re-spectively. Thus, the contextual sentiment score of the noun phrase “stomach pain” is calculated to -1 (note that the determiner relation between “the” and “pain” is ignored). Subsequently, the root node “re-duce” is processed with its five children nodes. First, advmod(reduced, completely) is processed since it has a higher priority than the other four relations. The contextual sentiment score of the verb phrase “com-pletely reduce,” advmod(reduce, completely), is calcu-lated by using the Maximize rule since “completely” is a maximize term. The contextual score of the verb phrase is calculated to +0.5 (the Maximize rule con-verts the neutral verb term to +0.5). For the predicate “completely reduce the stomach pain” defined by dob-j(reduce, pain), the sentiment score is calculated using Decrease Disorder rules (formula F1 in Table 5) since “reduce” is a decrease-type verb and “pain” is a disor-der term. The sentiment scores of the verb phrase and object are +0.5 and -1, respectively. Thus, it is calcu-lated as (-1 * -1) which is equal to +1 (the decrease disorder rule shifts the original sentiment orientation of the disorder object). Then, the score for the clause “It completely reduce the stomach pain” defined by nsubj(reduce, It) is calculated by using Clause rules (formula F1 in Table 3). Since the prior score of the subject “It” is 0, the result score of the clause remains +1 (note that the auxiliary relation between “reduce” and “could” is ignored). Finally, the system processes neg(reduce, not) using Negation of Term rules which negate the computed score of the intermediate clause “It completely reduce the stomach pain” and returns the final score of -1.
17 http://www.jistap.org
Sentiment Analysis of User-Generated Content
1. Question rule: check for question mark2. Phrasal verb rules: prt()3. Preposition (because of, due to) and disorder rules: any type dependencies, (because of, due to) + disorder4. Positive and negative valence rules: any type dependencies5. Disorder and medication rule: any type dependencies, disorders + medication6. Adjectival phrase rules: advmod (adjective, adverb)7. Noun phrase rules: amod()8. Conjunct rules: conj_and(), conj_or(), and conj_but()9. Verb phrase rules: advmod (verb, adverb)10. Predicate rules: dobj(), iobj(), and acomp() - Handle decrease disorder rule as a special case: dobj()11. Clausal complement relation rules: xcomp()12. Default rules: e.g., prep_of(), possession(), etc.13. Preposition (for, as, with) and disorder rules : (prep_for, prep_as, or prep_with) + disorder14. Clause rules: csubj(), csubjpass(), nsubj(), and nsubjpass() - Handle intensify, mitigate, maximize, and minimize rules as special cases: advmod (adjective, adverb),
amod(), advmod (verb, adverb), and dobj().15. Negation of term rules - Handle polarity shifter rules as special cases: advmod (adjective, adverb), advmod (verb, adverb), and
dobj().16. Contradicting connectors rule: advcl (contradicting connecter terms), ccomp (contradicting connecter
terms), purpcl (contradicting connecter terms)17. Clause connectors rules: advcl (), ccomp(), and purpcl()
Fig. 2 Rule priorities for relations between a parent node and its direct children nodes
Fig. 3 Dependency tree for the clause “It could not completely reduce the stomach pain.”
18
JISTaP Vol.3 No.1, 06-23
4. EXPERIMENT RESULTS AND DISCUSSION
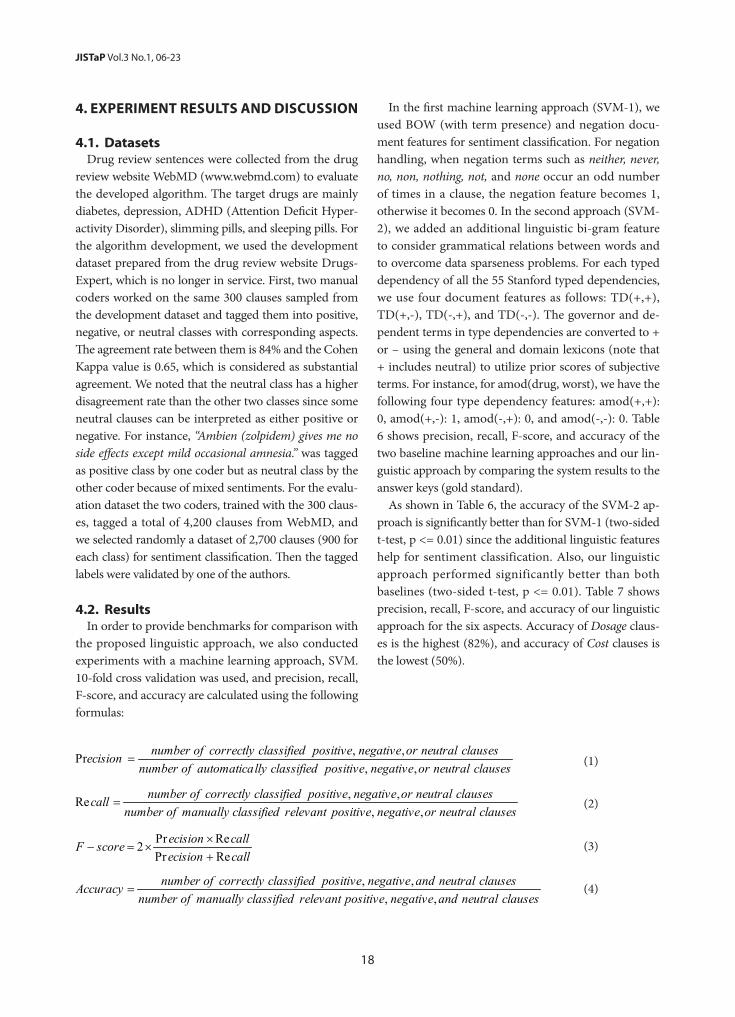
4.1. DatasetsDrug review sentences were collected from the drug
review website WebMD (www.webmd.com) to evaluate the developed algorithm. The target drugs are mainly diabetes, depression, ADHD (Attention Deficit Hyper-activity Disorder), slimming pills, and sleeping pills. For the algorithm development, we used the development dataset prepared from the drug review website Drugs-Expert, which is no longer in service. First, two manual coders worked on the same 300 clauses sampled from the development dataset and tagged them into positive, negative, or neutral classes with corresponding aspects. The agreement rate between them is 84% and the Cohen Kappa value is 0.65, which is considered as substantial agreement. We noted that the neutral class has a higher disagreement rate than the other two classes since some neutral clauses can be interpreted as either positive or negative. For instance, “Ambien (zolpidem) gives me no side effects except mild occasional amnesia.” was tagged as positive class by one coder but as neutral class by the other coder because of mixed sentiments. For the evalu-ation dataset the two coders, trained with the 300 claus-es, tagged a total of 4,200 clauses from WebMD, and we selected randomly a dataset of 2,700 clauses (900 for each class) for sentiment classification. Then the tagged labels were validated by one of the authors.
4.2. ResultsIn order to provide benchmarks for comparison with
the proposed linguistic approach, we also conducted experiments with a machine learning approach, SVM. 10-fold cross validation was used, and precision, recall, F-score, and accuracy are calculated using the following formulas:
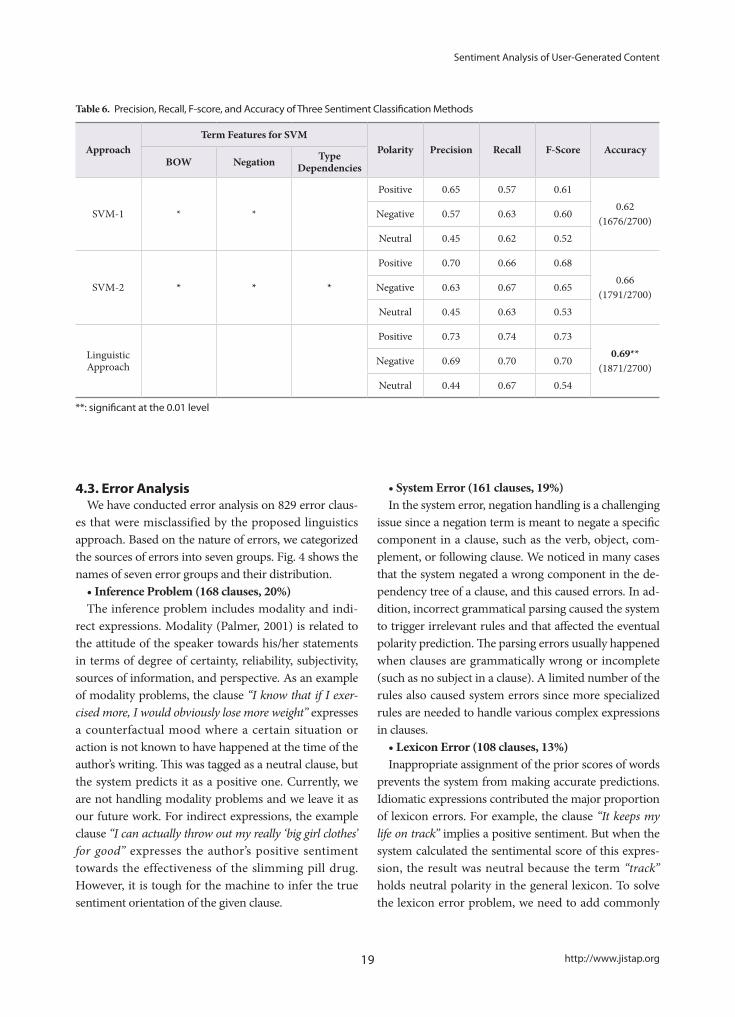
In the first machine learning approach (SVM-1), we used BOW (with term presence) and negation docu-ment features for sentiment classification. For negation handling, when negation terms such as neither, never, no, non, nothing, not, and none occur an odd number of times in a clause, the negation feature becomes 1, otherwise it becomes 0. In the second approach (SVM-2), we added an additional linguistic bi-gram feature to consider grammatical relations between words and to overcome data sparseness problems. For each typed dependency of all the 55 Stanford typed dependencies, we use four document features as follows: TD(+,+), TD(+,-), TD(-,+), and TD(-,-). The governor and de-pendent terms in type dependencies are converted to + or – using the general and domain lexicons (note that + includes neutral) to utilize prior scores of subjective terms. For instance, for amod(drug, worst), we have the following four type dependency features: amod(+,+): 0, amod(+,-): 1, amod(-,+): 0, and amod(-,-): 0. Table 6 shows precision, recall, F-score, and accuracy of the two baseline machine learning approaches and our lin-guistic approach by comparing the system results to the answer keys (gold standard).
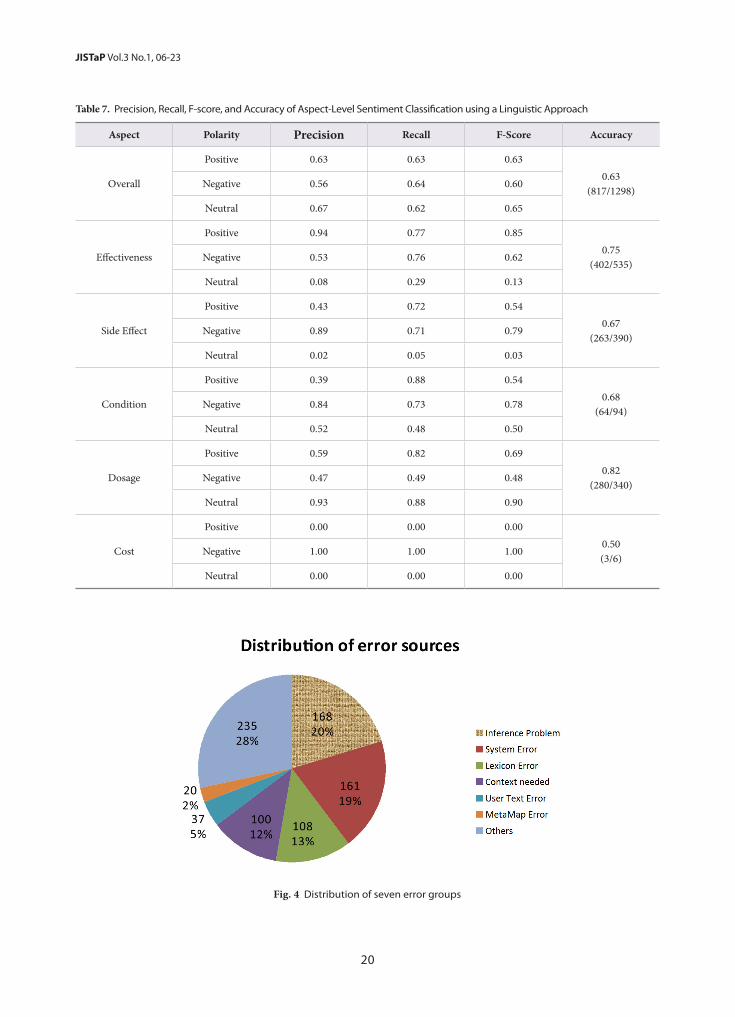
As shown in Table 6, the accuracy of the SVM-2 ap-proach is significantly better than for SVM-1 (two-sided t-test, p <= 0.01) since the additional linguistic features help for sentiment classification. Also, our linguistic approach performed significantly better than both baselines (two-sided t-test, p <= 0.01). Table 7 shows precision, recall, F-score, and accuracy of our linguistic approach for the six aspects. Accuracy of Dosage claus-es is the highest (82%), and accuracy of Cost clauses is the lowest (50%).
(1)
(2)
(3)
(4)
19 http://www.jistap.org
Sentiment Analysis of User-Generated Content
4.3. Error AnalysisWe have conducted error analysis on 829 error claus-
es that were misclassified by the proposed linguistics approach. Based on the nature of errors, we categorized the sources of errors into seven groups. Fig. 4 shows the names of seven error groups and their distribution.
• Inference Problem (168 clauses, 20%)The inference problem includes modality and indi-
rect expressions. Modality (Palmer, 2001) is related to the attitude of the speaker towards his/her statements in terms of degree of certainty, reliability, subjectivity, sources of information, and perspective. As an example of modality problems, the clause “I know that if I exer-cised more, I would obviously lose more weight” expresses a counterfactual mood where a certain situation or action is not known to have happened at the time of the author’s writing. This was tagged as a neutral clause, but the system predicts it as a positive one. Currently, we are not handling modality problems and we leave it as our future work. For indirect expressions, the example clause “I can actually throw out my really ‘big girl clothes’ for good” expresses the author’s positive sentiment towards the effectiveness of the slimming pill drug. However, it is tough for the machine to infer the true sentiment orientation of the given clause.
• System Error (161 clauses, 19%)In the system error, negation handling is a challenging
issue since a negation term is meant to negate a specific component in a clause, such as the verb, object, com-plement, or following clause. We noticed in many cases that the system negated a wrong component in the de-pendency tree of a clause, and this caused errors. In ad-dition, incorrect grammatical parsing caused the system to trigger irrelevant rules and that affected the eventual polarity prediction. The parsing errors usually happened when clauses are grammatically wrong or incomplete (such as no subject in a clause). A limited number of the rules also caused system errors since more specialized rules are needed to handle various complex expressions in clauses.
• Lexicon Error (108 clauses, 13%)Inappropriate assignment of the prior scores of words
prevents the system from making accurate predictions. Idiomatic expressions contributed the major proportion of lexicon errors. For example, the clause “It keeps my life on track” implies a positive sentiment. But when the system calculated the sentimental score of this expres-sion, the result was neutral because the term “track” holds neutral polarity in the general lexicon. To solve the lexicon error problem, we need to add commonly
Table 6. Precision, Recall, F-score, and Accuracy of Three Sentiment Classification Methods
ApproachTerm Features for SVM
Polarity Precision Recall F-Score AccuracyBOW Negation Type
Dependencies
SVM-1 * *
Positive 0.65 0.57 0.610.62
(1676/2700)Negative 0.57 0.63 0.60
Neutral 0.45 0.62 0.52
SVM-2 * * *
Positive 0.70 0.66 0.680.66
(1791/2700)Negative 0.63 0.67 0.65
Neutral 0.45 0.63 0.53
Linguistic Approach
Positive 0.73 0.74 0.730.69**
(1871/2700)Negative 0.69 0.70 0.70
Neutral 0.44 0.67 0.54
**: significant at the 0.01 level
20
JISTaP Vol.3 No.1, 06-23
Table 7. Precision, Recall, F-score, and Accuracy of Aspect-Level Sentiment Classification using a Linguistic Approach
Aspect Polarity Precision Recall F-Score Accuracy
Overall
Positive 0.63 0.63 0.630.63
(817/1298)Negative 0.56 0.64 0.60
Neutral 0.67 0.62 0.65
Effectiveness
Positive 0.94 0.77 0.850.75
(402/535)Negative 0.53 0.76 0.62
Neutral 0.08 0.29 0.13
Side Effect
Positive 0.43 0.72 0.540.67
(263/390)Negative 0.89 0.71 0.79
Neutral 0.02 0.05 0.03
Condition
Positive 0.39 0.88 0.540.68
(64/94)Negative 0.84 0.73 0.78
Neutral 0.52 0.48 0.50
Dosage
Positive 0.59 0.82 0.690.82
(280/340)Negative 0.47 0.49 0.48
Neutral 0.93 0.88 0.90
Cost
Positive 0.00 0.00 0.000.50(3/6)
Negative 1.00 1.00 1.00
Neutral 0.00 0.00 0.00
Fig. 4 Distribution of seven error groups
21 http://www.jistap.org
Sentiment Analysis of User-Generated Content
used idiomatic expressions to the domain lexicon.• Context Needed (100 clauses, 12%)It is hard for the system to determine the polarity of
an individual clause without knowing the whole con-text. For instance, the clause “when I am on this pill, I have no appetite at all!” becomes positive for a slimming pill’s reviews, but on the other hand it becomes negative for other drugs’ reviews. So the introduction of drug specific rules may help to resolve context related issues.
• User Text Error (37 clauses, 5%)User text errors such as spelling and grammatical
mistakes raised a series of issues in grammatical parsing, prior score assignment, and semantic detection, and led the system to make wrong predictions.
• MetaMap Error (20 clauses, 2%)MetaMap cannot detect certain disorder terms cor-
rectly. So we are using our own disorder term list to compensate for MetaMap errors. However, the size of our disorder lexicon is relatively small compared to MetaMap and more work needs to be done to develop a comprehensive disorder terms list.
• Other Error (235 clauses, 28%)We noticed that common sense knowledge is required
to detect the effectiveness or side effects of a drug. For instance, in the clause “went from a bmi of 33 to 31,” it is difficult for the system to determine the user’s sentiment towards the effectiveness of the drug without knowing the desired value range of the BMI value. The acquisi-tion of common sense knowledge by the machine is an-other challenging research area and we did not consider it in this paper. We also observed that some clauses are ambiguous even for human coders.
4.4. LimitationsWe have several limitations in this study. First, auto-
matically separated clauses and tagged aspect data were validated by manual coders to reduce possible errors from clause separation and aspect detection processes. We plan to improve our algorithms to remove the man-ual steps. Second, the system has a limited number of sentiment analysis rules, and it caused various errors. So we plan to mine more specialized rules using a machine learning approach, which could handle various complex expressions in clauses. Third, we conducted evaluation experiments with a relatively small dataset of 2,700 clauses (900 for each class) because manual tagging requires a great deal of human time and effort. We plan
to prepare a larger dataset to validate the effectiveness of the proposed algorithm.
5. CONCLUSION
We have applied the proposed approach to health and medical domains, particularly focusing on public opinions of drugs in various aspects. Experimental re-sults show the effectiveness of the proposed approach, and it performed significantly better than the machine learning approach with SVM. Since there are still vari-ous issues as discussed in the Error Analysis section, we plan to continue improving our linguistic algorithm. For instance, we plan to handle modality, and the developed new rules will be used to detect whether facts described in clauses happened or not. In addition, additional rules will be mined and added by using a machine learning approach, and we will improve aspect detection and clause separation algorithms.
REFERENCES
Aronson, A. R., & Lang, F. M. (2010). An overview of MetaMap: Historical perspective and recent ad-vances. Journal of American Medical Informatics Association (JAMIA), 17, 229-236.
Baccianella, S., Esuli, A., & Sebastiani, F. (2010). Sen-tiWordNet 3.0: An enhanced lexical resource for sentiment analysis and opinion mining. Proceed-ings of the Seventh International Conference on Lan-guage Resources and Evaluation (LREC 2010) (pp. 2200–2204).
Bodenreider, O., & McCray, A. T. (2003). Exploring se-mantic groups through visual approaches. Journal of Biomedical Informatics, 36, 414-432.
de Marneffe, M.-C., MacCartney, B., & Manning, C. D. (2006). Generating typed dependency parses from phrase structure parses. Proceedings of the 5th In-ternational Conference on Language Resources and Evaluation (pp. 449-454).
Denecke, K. (2008). Accessing medical experiences and information. Proceedings of the Workshop on Min-ing Social Data, European Conference on Artificial Intelligence.
Ding, X., Liu, B., & Yu, P. S. (2008). A holistic lexi-
22
JISTaP Vol.3 No.1, 06-23
con-based approach to opinion mining. Proceed-ings of the International Conference on Web Search and Web Data Mining (pp. 231-240). New York: ACM.
Huang, S., Niu, Z., & Shi, C. (2014). Automatic con-struction of domain-specific sentiment lexicon based on constrained label propagation. Knowl-edge-Based Systems, 56, 191-200.
Jaloba, A. (2009). The club no one wants to join: Online behaviour on a breast cancer discussion forum. First Monday, 14(7).
Jo, Y., & Oh, A. H. (2011). Aspect and sentiment unifi-cation model for online review analysis. Proceed-ings of the Fourth International Conference on Web Search and Data Mining (WSDM) (pp. 815-824). Hong Kong.
Kim, S., Zhang, J., Chen, Z., Oh, A., & Liu S. (2013). A hierarchical aspect-sentiment model for online reviews. Proceedings of the Twenty-Seventh AAAI Conference on Artificial Intelligence (pp. 526-533).
Liu, B. (2012). Sentiment analysis and opinion mining. San Rafael, CA: Morgan & Claypool.
Lu, Y., Castellanos, M., Dayal, U., & Zhai, C. X. (2011). Automatic construction of a context-aware senti-ment lexicon: An optimization approach. Proceed-ings of the 20th International Conference on World Wide Web (WWW 2011) (pp. 347-356). Hyder-abad, India.
Na, J.-C., Kyaing, W. Y. M., Khoo, C., Foo, S., Chang, Y.-K., and Theng, Y.-L. (2012). Sentiment classifi-cation of drug reviews using a rule-based linguistic approach. Proceedings of ICADL (International Conference on Asian Digital Libraries) ‘2012 (pp. 189-198). Taipei, Taiwan.
Nikfarjam, A., & Gonzalez, G. H. (2011). Pattern min-ing for extraction of mentions of adverse drug re-actions from user comments. Proceedings of AMIA Annual Symposium (pp. 1019-1026).
Niu, Y., Zhu, X., Li, J., & Hirst, G. (2005). Analysis of polarity information in medical text. Proceedings of the American Medical Informatics Association Sym-posium (AMIA) (pp. 570-574).
Palmer, F. R. (2001). Mood modality. 2nd Edition. New York: Cambridge University Press.
Pang, B., & Lee, L. (2008). Opinion mining and senti-ment analysis. Foundations and Trends in Informa-tion Retrieval, 2(1-2), 1-135.
Pang, B., Lee, L., & Vaithyanathan, S. (2002). Thumbs up? Sentiment classification using machine-learn-ing techniques. Proceedings of the 2002 Conference on Empirical Methods in Natural Language Process-ing (pp. 79-86).
Polanyi, L., & Zaenen, A. (2006). Contextual valence shifters. In J. G. Shanahan, Y. Qu, & J. Wiebe (Eds.), Computing attitude and affect in text: Theory and applications (pp. 1-10), Information Retrieval Se-ries Volume 20. Dordrecht: Springer Netherlands.
Qiu, G., Liu, B., Bu, J., & Chen, C. (2009). Expanding domain sentiment lexicon through double prop-agation. Proceedings of the 21st International Joint Conference on Artificial Intelligence (pp. 1199-1204). San Francisco: Morgan Kaufmann.
Quirk, R., Greenbaum, S., Leech, G., & Svartvik, J. (1985). A comprehensive grammar of the English language. London: Longman.
Sarasohn-Kahn, J. (2008). The wisdom of patients: Health care meets online social media. California Healthcare Foundation, Oakland. Retrieved from http://www.chcf.org/publications/2008/04/the-wis-dom-of-patients-health-care-meets-online-social-media.
Schraefel, M. C., White, R. W., André, P., & Tan, D. (2009). Investigating Web search strategies and forum use to support diet and weight loss. Proceed-ings of the 27th international conference extended abstracts on Human factors in computing systems (CHI ‘09) (pp. 3829-3834).
Shaikh, M. A. M., Prendinger, H., & Ishizuka, M. (2008). Sentiment assessment of text by analyzing linguis-tic features and contextual valence assignment. Applied Artificial Intelligence, 22(6), 558-601.
Stone, P. J., Dunphy, D. C., Smith, M. S., & Ogilvie, D. M. (1966). General Inquirer: a computer approach to content analysis. Cambridge, MA: MIT Press.
Tsytsarau, M., Palpanas, T., & Denecke, K. (2011). Scal-able detection of sentiment-based contradictions. Proceedings of the First International Workshop on Knowledge Diversity on the Web.
Wiebe, J., & Riloff, E. (2005). Creating subjective and objective sentence classifiers from unannotated texts. Proceedings of Sixth International Conference on Intelligent Text Processing and Computational Linguistics (CICLing) (pp. 486-497).
Wilson, T., Wiebe, J., & Hoffmann, P. (2005). Recogniz-
23 http://www.jistap.org
Sentiment Analysis of User-Generated Content
ing contextual polarity in phrase-level sentiment analysis. Proceedings of the Conference on Human Language Technology and Empirical Methods in Natural Language Processing (pp. 347-354).
Wilson, T., Wiebe, J., & Hoffmann, P. (2009). Recogniz-ing contextual polarity: An exploration of features for phrase-level sentiment analysis. Computational Linguistics, 35(3), 399-433.
Xia, L., Gentile, A. L., Munro, J., & Iria, J. (2009). Im-proving patient opinion mining through multi-step classification. Lectures Notes in Artificial Intel-ligence, 5729, 70-76.
24
JISTaPJournal of Information Science Theory and Practice
http://www.jistap.org
Query Formulation for Heuristic Retrieval in Obfuscated and Translated Partially Derived Text
Aarti Kumar *Department of Computer ApplicationsMaulana Azad National Institute of Technology Bhopal, India E-mail: [email protected]
Sujoy Das Department of Computer ApplicationsMaulana Azad National Institute of Technology Bhopal, IndiaE-mail: [email protected]
Open Access
Accepted date: March 10, 2015Received date: August 20, 2014
*Corresponding Author: Aarti KumarResearch FellowDepartment of Computer ApplicationsMaulana Azad National Institute of Technology, Bhopal, IndiaE-mail: [email protected]
All JISTaP content is Open Access, meaning it is accessible onlineto everyone, without fee and authors’ permission. All JISTaP content is published and distributed under the terms of the Creative Commons Attribution License (http:/ creativecommons.org/licenses/by/3.0/). Under this license, authors reserve the copyright for their content; however, they permit anyone to unrestrictedly use, distribute, and reproduce the content in any medium as far as the original authors and source are cited. For any reuse, redistribution, or reproduction of a work, users must clarify the license terms under which the work was produced.
ⓒ Aarti Kumar, Sujoy Das, 2015
ABSTRACTPre-retrieval query formulation is an important step for identifying local text reuse. Local reuse with high obfus-cation, paraphrasing, and translation poses a challenge of finding the reused text in a document. In this paper, three pre-retrieval query formulation strategies for heuristic retrieval in case of low obfuscated, high obfuscated, and translated text are studied. The strategies used are (a) Query formulation using proper nouns; (b) Query for-mulation using unique words (Hapax); and (c) Query formulation using most frequent words. Whereas in case of low and high obfuscation and simulated paraphrasing, keywords with Hapax proved to be slightly more efficient, initial results indicate that the simple strategy of query formulation using proper nouns gives promising results and may prove better in reducing the size of the corpus for post processing, for identifying local text reuse in case of obfuscated and translated text reuse.
Keywords: Heuristic, obfuscated, translated, simulated paraphrasing, retrieval, Hapax, query formulation, pre-retrieval
Research PaperJ. of infosci. theory and practice 3(1): 24-39, 2015http://dx.doi.org/10.1633/JISTaP.2015.3.1.2
1. INTRODUCTION
Text reuse identification has become a challenging problem due to the presence of enormous amounts of
digital data, more so because of obfuscated text reuse. The result of obfuscation is a modified version of the original text. The modification can be at the level of words, phrases, sentences, or even whole texts by ap-
25 http://www.jistap.org
Query Formulation for Heuristic Retrieval
plying a random sequence of text operations such as change of tense, alteration of voice (active to passive, and vice versa), change in treatment of direct speech, abbreviations, shuffling a word or a group of words, deleting a word, inserting a word from an external source, or replacing a word with a synonym, antonym, hypernym, or hyponym. These alterations may or may not modify the original meaning of the source text.
Obfuscation in text reuse can be at different levels of degree. It may be from no obfuscation to a low or high level of obfuscation. The range from word to sen-tence level defines the level of obfuscation from low to high. Translation of text from the language of source document to another language of suspicious target document is also a kind of high level obfuscation which is extremely difficult to deal with, more so when the reuse is local in nature. Local reuse occurs when sentences, facts, or passages, rather than whole docu-ments, are reused and modified.
Therefore, techniques that can be applied in order to identify the different levels of obfuscation and their local nature may also vary due to the complexity of the problem. In a large corpus analyzing complete sets of source documents for local text reuse is an expen-sive affair; therefore, it is better to retrieve a subset of documents and then at the time of post processing, a retrieved set of source documents may be analyzed for local text reuse. Initial filtering is known as heuristic retrieval (Barrón-Cedeño, 2010). Heuristic retrieval, also called pre-retrieval, can therefore be defined as the process of retrieving a small sub-set of a potential reused document for any particular source-document from a large set of documents (corpora), with a view to minimize time and space requirements.
Heuristic retrieval is important due to the (i) enor-mous size of a typical corpus; (ii) presence of large numbers of irrelevant documents for a particular set of suspicious documents; and (iii) the processing cost involved in processing the dataset. Also, while for small document collections it is practicable to perform a complete comparison against every document, this is obviously not possible when the collection size is enor-mous. So it is better to go for heuristic retrieval before post processing.
In this paper an attempt is made to find key terms from a target set of suspicious documents to retrieve an initial set of source documents for further post pro-
cessing. In case of local obfuscated text reuse, generat-ing keywords from the whole text can drift the query and may fetch many unwanted documents. The main focus is, therefore, to formulate effective queries to re-trieve a subset of documents that bears more closeness to any given suspicious document.
In the proposed work three methods have been studied for formation of query, especially when the content of the documents are obfuscated or translated and the text reuse is local in nature. The results are de-rived from the PAN CLEF 2012 training corpus.
In Section 2 existing work in pre-retrieval query per-formance is discussed, Section 3 discusses proposed methodology, and Section 4 and 5 discuss experimen-tal results and conclusions, respectively.
2. RELATED WORK
Hauff, Hiemstra, and Jong (2008) assessed the performance of 22 pre-retrieval predictors on three different TREC collections. As most predictors exploit inverse term/document frequencies in some way, they hypothesize that the amount of smoothing influences the quality of predictors.
Cummins, Jose, and O’Riordan (2011) developed a new predictor based on standard deviation of scores in a variable length ranked list, and showed that this new predictor outperforms state-of-the-art approaches without the need of tuning.
Possas et al. (2005) worked on TREC-8 test collection and proposed a technique for automatically structuring web queries as a set of smaller sub queries. To select representative sub queries, information of distributions is used and a concept of maximal term sets derived from formalism of association rules theory is used for modelling.
Many kinds of text reuse detection techniques have been proposed from time to time by different authors, including: Potthast et al. (2013); Gustafson et al. (2008); Mittelbach et al. (2010); Palkovskii, Muzyka, and Be-lov (2010); Seo and Croft (2008); Clough et al. (2002); Gupta and Rosso (2012); Bar, Zesch, and Gurevych (2012); and Potthast et al. (2013a, b).
Gipp et al. (2013) proposed Citation-based Plagia-rism Detection. Compared to existing approaches, CbPD does not consider textual similarity alone, but
26
JISTaP Vol.3 No.1, 24-39
uses the citation patterns within scientific documents as a unique, language independent fingerprint to iden-tify semantic similarity.
Vogel, Hey, and Tillmann (1996) presented an HMM-based approach for modelling word alignments in parallel texts in English and French. The character-istic feature of this approach is to make the alignment probabilities explicitly dependent on the alignment po-sition of the previous word. The HMM-based approach produces translation probabilities.
Barrón-Cedeño (2012) compared two recently pro-posed cross-language plagiarism detection methods: CL-CNG, based on character n-grams, and CL-ASA, based on statistical translation, to their new approach based on machine translation and monolingual simi-larity analysis (T+MA). Barrón-Cedeño explores the effectiveness of his approach for less related languages. CL-CNG is not appropriate for this kind of language pairs, whereas T+MA performs better than the previ-ously proposed models. The study investigated Basque, a language where, due to lack of resources, cross lan-guage plagiarism is often committed from texts in Spanish and English.
Grozea and Popescu (2009) evaluated cross-language similarity among suspected and original documents using a statistical model which finds the relevance probability between suspected and source documents, regardless of the order in which the terms appear in the suspected and original documents. Their method is combined with a dictionary corpus of text in English and Spanish to detect similarity in cross language.
A plagiarism detection technique based on Semantic Role Labeling was introduced by Osmana et al. (2012). They improved the similarity measure using argument weighting with an aim to studying the argument be-haviour and effect in plagiarism detection.
Pouliquen et al. (2003) have worked on European languages and have presented a working system that can identify translations and other very similar doc-uments among a large number of candidates, by rep-resenting the document content with a vector of the-saurus terms from multilingual thesaurus, and then by measuring the semantic similarity between the vectors.
The approach used by Palkovskii and Belov (2011) implied the usage of automatic language translation (Google Translate web service) to normalize one of the input texts to the target comparison language, and ap-
plies a model that includes several filters, each of which adds ranking points to the final score.
Ghosh, Pal, and Bandyopadhyay (2011) treated cross-language text re-use detection as a problem of Information Retrieval, and it is solved with the help of Nutch, an open source Information Retrieval (IR) sys-tem. Their system contains three phases – knowledge preparation, candidate retrieval, and cross-language text reuse detection.
Gupta and Singhal (2011) tried to see the impact of available resources like Bi-lingual Dictionary, WordNet, and Transliteration, mapping Hindi-English text reuse document pairs and using the Okapi BM25 model to calculate the similarity between document pairs.
The approach used by Aggarwal et al. (2012) in journalistic text reuse consists of two major steps, the reduction of search space by using publication date and vocabulary overlap, and then ranking of the news stories according to their relatedness scores. Their ap-proach uses Wikipedia-based Cross-Lingual Explicit Semantic Analysis (CLESA) to calculate the semantic similarity and relatedness score between two news sto-ries in different languages.
Arora, Foster, and Jones (2013) used an approach consisting of two steps: (1) the Lucene search engine was used with varied input query formulations using different features and heuristics designed to identify as many relevant documents as possible to improve recall; and (2) merging of document list and re-ranking was performed with the incorporation of a date feature.
Pal and Gillam (2013) converted English documents to Hindi using Google Translate and compared them to the potential Hindi sources based on five features of the documents: title, content of the article, unique words in content, frequent words in content, and publication date using Jaccard similarity. A weighted combination of the five individual similarity scores provides an over-all value for similarity.
Tholpadi and Param (2013) describe a method that leverages the structure of news articles, especially the title, to achieve good performance on the focal news event linking task. They found that imposing date con-straints did not improve precision.
IDF, Reference Monotony, and Extended Contextual N-grams were used by Torrejon and Ramos (2013) to link English and Hindi News.
Haiduc et al. (2013) have proposed a recommender,

27 http://www.jistap.org
Query Formulation for Heuristic Retrieval
Refoqus, which automatically recommends a reformu-lation strategy for a given query to improve its retrieval performance in Text Retrieval. Refoqus is based on Machine Learning and its query reformulation strategy is based on the properties of the query.
Carmel et al. (2006), while trying to find a solution to the question “what makes a query difficult,” have de-vised a model to predict query difficulty and number of topic aspects expected to be covered by the search re-sults and to analyze the findability of a specific domain.
The Capacity Constrained Query Formulation meth-od was devised by Hagen and Stein (2010). They fo-cused on the query formulation problem as the crucial first step in the detection process and have presented this strategy, which achieves better results than maxi-mal term set query formulation strategy.
3. PROPOSED METHODOLOGY
Most of the authors listed have worked upon whole corpora, which consume valuable resources with re-spect to space and time. Also, most query formulation and retrieval strategies fail in the case of highly obfus-cated and translated reused documents. In such cases, even the most popular TF-IDF strategy is no exception. Use of thesaurus in query formulation aids in query drifting and results in fetching unwanted irrelevant documents. Devising a simple strategy which can reduce the size of the corpora by retrieving potential reused documents in the pre-retrieval stage, and before going for state-of-the-art text reuse or plagiarism detec-tion techniques, can render the process more efficient in terms of system resources and would produce more accurate results. Our strategy is straightforward and simple and tackles this important pre-computation step that finds promising candidate documents for in-depth analysis.
In this preliminary study, an attempt has been made to analyse proposed strategies on the training corpus of PAN CLEF 2012 which is 1.29 GB in size and contains 12,024 files divided into 8 folders.
The suspicious documents that fall under the catego-ries of low and high obfuscation, simulated paraphras-ing, and translation are studied in this paper. Simulated paraphrasing is intentional obfuscation done by hu-mans with an intention to hide plagiarism attempts.
The steps followed for formulating a query for heu-ristic retrieval are as follows:
3.1. Pre-ProcessingAs we are dealing with local text reuse and obfus-
cation which can be in any part of the document, the document is divided into units. The document unit that we have taken is ‘paragraph,’ with the assumption that even if sentences or a block is reused and obfuscated, that will most likely be a paragraph or a sentence within any paragraph. Therefore, the suspicious document is divided into paragraphs before tokenizing the text. The document is normalized by removing the punctuation. Stop-words, verbs, and adverbs are removed using a pre-compiled list of stop-words,1 verbs, and adverbs2 obtained from the web.
3.2. Query Formulation Queries have been formulated paragraph-wise for
each suspicious document. So the number of para-graphs in the suspicious document decides the number of queries for that document. Relying on a given docu-ment structure like paragraphs bears the risk of failing for some unseen documents that are not well formatted (Potthast et al., 2013); still, the idea behind generating queries for each paragraph is that if reuse is local, then at least keywords from the paragraph which have been reused will maximize the chance of fetching the re-quired source document. The query is generated from
1 List of stop-words available at:http://www.ranks.nl/resources/stopwords.html http://norm.al/2009/04/14/list-of-english-stop-words/ http://www.webconfs.com/stop-words.php http://jmlr.org/papers/volume5/lewis04a/a11-smart-stop-list/english.stop
2 List of verbs and adverbs available at:http://www.englishclub.com/vocabulary/regular-verbs-list.htm
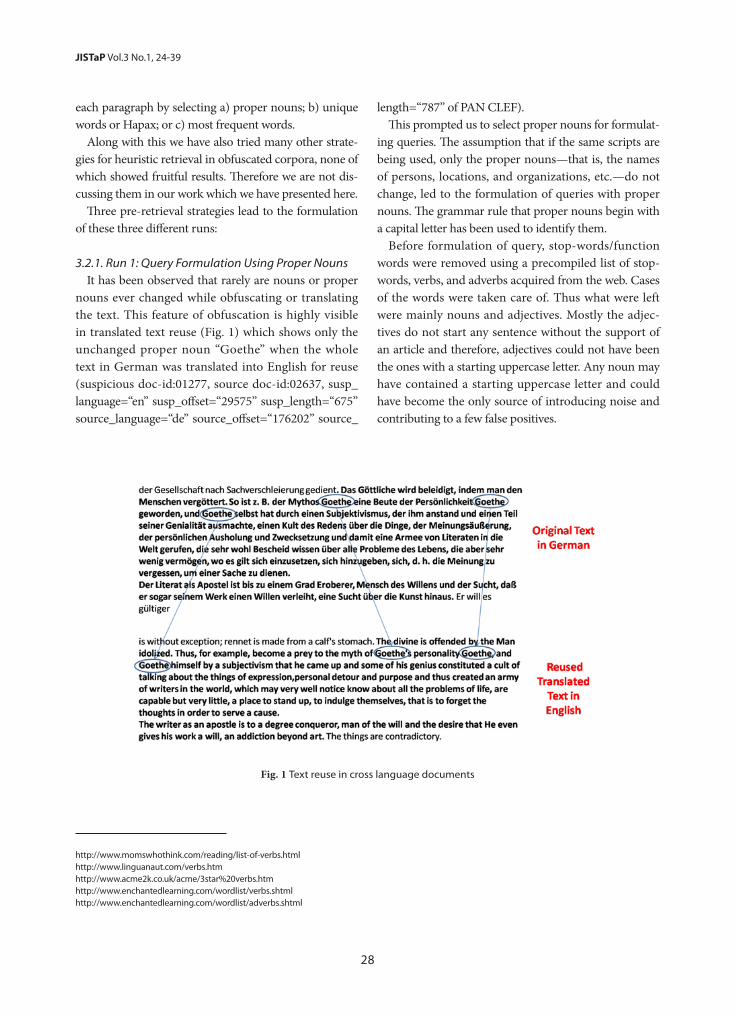
28
JISTaP Vol.3 No.1, 24-39
each paragraph by selecting a) proper nouns; b) unique words or Hapax; or c) most frequent words.
Along with this we have also tried many other strate-gies for heuristic retrieval in obfuscated corpora, none of which showed fruitful results. Therefore we are not dis-cussing them in our work which we have presented here.
Three pre-retrieval strategies lead to the formulation of these three different runs:
3.2.1. Run 1: Query Formulation Using Proper Nouns It has been observed that rarely are nouns or proper
nouns ever changed while obfuscating or translating the text. This feature of obfuscation is highly visible in translated text reuse (Fig. 1) which shows only the unchanged proper noun “Goethe” when the whole text in German was translated into English for reuse (suspicious doc-id:01277, source doc-id:02637, susp_language=“en” susp_offset=“29575” susp_length=“675” source_language=“de” source_offset=“176202” source_
length=“787” of PAN CLEF).This prompted us to select proper nouns for formulat-
ing queries. The assumption that if the same scripts are being used, only the proper nouns—that is, the names of persons, locations, and organizations, etc.—do not change, led to the formulation of queries with proper nouns. The grammar rule that proper nouns begin with a capital letter has been used to identify them.
Before formulation of query, stop-words/function words were removed using a precompiled list of stop-words, verbs, and adverbs acquired from the web. Cases of the words were taken care of. Thus what were left were mainly nouns and adjectives. Mostly the adjec-tives do not start any sentence without the support of an article and therefore, adjectives could not have been the ones with a starting uppercase letter. Any noun may have contained a starting uppercase letter and could have become the only source of introducing noise and contributing to a few false positives.
Fig. 1 Text reuse in cross language documents
http://www.momswhothink.com/reading/list-of-verbs.html http://www.linguanaut.com/verbs.htm http://www.acme2k.co.uk/acme/3star%20verbs.htm http://www.enchantedlearning.com/wordlist/verbs.shtml http://www.enchantedlearning.com/wordlist/adverbs.shtml

29 http://www.jistap.org
Query Formulation for Heuristic Retrieval
3.2.2. Run 2: Query Formulation Using Unique Words (Hapax)
The terms which appear only once in the document are also known as Hapax legomenon or Hapax. Hapax is a term that occurs only once within a context, either in the written record of an entire language, in the works of an author, or in a single text. In run 2 we used such terms from each paragraph for formulating the query.
The reason behind taking Hapax for query formu-lation is that even if one or two words are left out at the time of obfuscation, then these words shall help in iden-tifying the local text reuse.
3.2.3. Run 3: Query Formulation Using Most Frequent Words
In this run the terms which were most frequent in the pre-processed paragraphs were used for query formu-lation. This is the most common strategy used in query formulation. In our approach the most frequent words for query formulation have been included just for com-parison purposes and for analysing the efficiency of this strategy in obfuscated and translated locally reused text.
All of the above-mentioned pre-retrieval query for-mulation strategies are prompted by a set of source documents retrieved during initial experimental inves-tigations. Query words in italics are proper nouns and underlined query words are Hapax under different ob-fuscation (Table 1).
3.3. Indexing and Retrieval The corpus of the source documents is indexed using
the Indri retrieval engine.3 Retrieval on the indexed corpus is also done using Indri, which is based on the Inquery query language and uses an inference network (also known as a Bayesian network). Java platform (jdk1.7.0_07) using Indri was used for testing our algo-rithm and for retrieval of source documents.
3.4. Results and Evaluation The performance of the two strategies of query
formulation for a) proper nouns, b) unique words or Hapax, is analysed against the performance of the most
commonly used method, i.e. queries formed using, c) most frequent words.
The complete process of heuristic retrieval is shown in Fig. 2.
4. EXPERIMENT
In this preliminary study, an attempt has been made to analyse proposed strategies on the training corpus of PAN CLEF 2012, which is 1.29 GB in size and contains 12,024 files divided into 8 sub-folders.
The dataset is comprised of six different sub-sets con-tained in folders named no-plagiarism, no-obfuscation, artificial-low, artificial-high, translation, and simulated paraphrasing. We dealt with the later four categories. We tried to formulate simple querying strategies with a view to retrieving a subset of potential documents. Formu-lating any querying strategies from the terms of English target documents with an aim to retrieve the original German and Spanish documents would fail, because although the English translated documents use the same script they have an altogether different vocabulary when compared to German or Spanish. This would require translation of both texts into one single language which is a tedious task for large corpora. In the proposed work we are not dealing with the complete task of text reuse detec-tion. Our aim is only to reduce the size of the corpora on which state-of-the-art techniques can be used for retriev-ing the reused portions with further refined processes.
The PAN-CLEF training corpus was divided into 8 sub-folders (Fig. 3):
The corpus consists of: /susp: suspicious documents as plain text. /src : source documents as plain text.The suspicious documents contain passages ‘plagia-
rized’ from the source documents, obfuscated with one of five different obfuscation techniques.
Furthermore, the corpus contains 6,000 XML files each of which report, for a pair of suspicious and source documents, the exact locations of the plagiarized pas-sages (Fig. 4). The XML files are split into six datasets:
3 Indri retrieval engine available at: http://sourceforge.net/projects/lemur/files/lemur/indri-5.4/
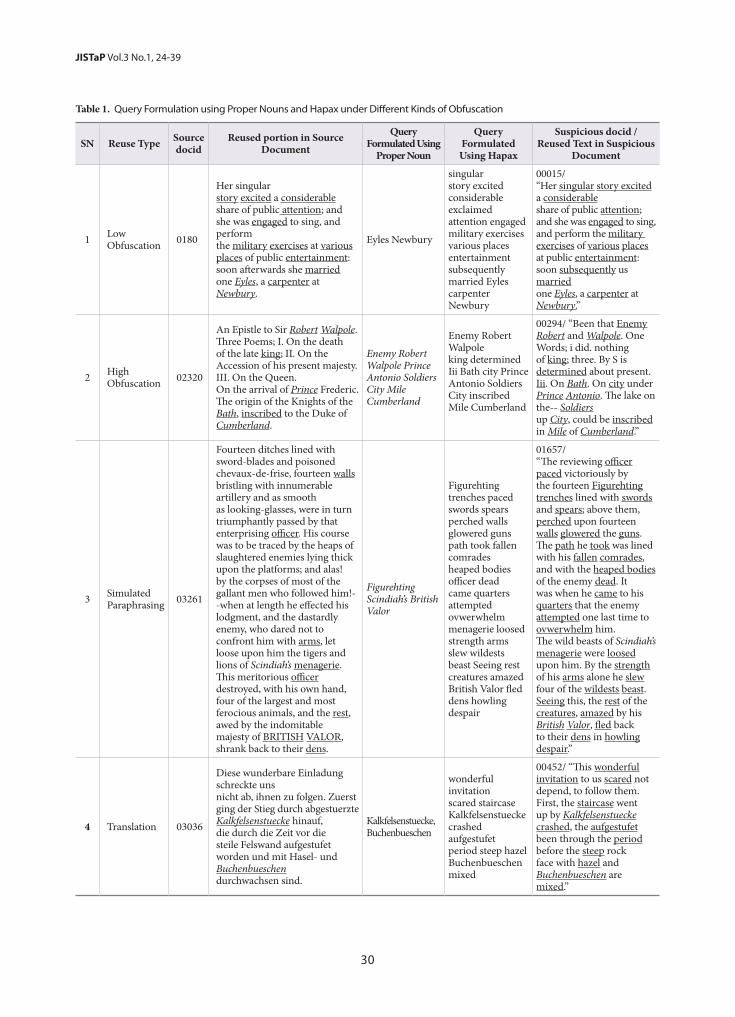
30
JISTaP Vol.3 No.1, 24-39
Table 1. Query Formulation using Proper Nouns and Hapax under Different Kinds of Obfuscation
SN Reuse Type Source docid
Reused portion in Source Document
Query Formulated Using
Proper Noun
Query Formulated Using Hapax
Suspicious docid / Reused Text in Suspicious
Document
1 Low Obfuscation 0180
Her singularstory excited a considerable share of public attention; and she was engaged to sing, and performthe military exercises at various places of public entertainment: soon afterwards she marriedone Eyles, a carpenter at Newbury.
Eyles Newbury
singular story excited considerable exclaimed attention engaged military exercises various places entertainment subsequently married Eyles carpenter Newbury
00015/“Her singular story excited a considerableshare of public attention; and she was engaged to sing, and perform the military exercises of various places at public entertainment: soon subsequently us marriedone Eyles, a carpenter at Newbury.”
2 High Obfuscation 02320
An Epistle to Sir Robert Walpole.Three Poems; I. On the death of the late king; II. On the Accession of his present majesty.III. On the Queen.On the arrival of Prince Frederic.The origin of the Knights of the Bath, inscribed to the Duke of Cumberland.
Enemy Robert Walpole Prince Antonio Soldiers City Mile Cumberland
Enemy Robert Walpoleking determined Iii Bath city Prince Antonio Soldiers City inscribed Mile Cumberland
00294/ “Been that Enemy Robert and Walpole. One Words; i did. nothing of king; three. By S is determined about present. Iii. On Bath. On city under Prince Antonio. The lake on the-- Soldiersup City, could be inscribed in Mile of Cumberland.”
3 Simulated Paraphrasing 03261
Fourteen ditches lined with sword-blades and poisoned chevaux-de-frise, fourteen walls bristling with innumerable artillery and as smoothas looking-glasses, were in turn triumphantly passed by that enterprising officer. His coursewas to be traced by the heaps of slaughtered enemies lying thick upon the platforms; and alas!by the corpses of most of the gallant men who followed him!--when at length he effected hislodgment, and the dastardly enemy, who dared not to confront him with arms, let loose upon him the tigers and lions of Scindiah’s menagerie. This meritorious officer destroyed, with his own hand, four of the largest and most ferocious animals, and the rest, awed by the indomitablemajesty of BRITISH VALOR, shrank back to their dens.
Figurehting Scindiah’s British Valor
Figurehting trenches paced swords spears perched walls glowered guns path took fallen comrades heaped bodies officer dead came quarters attempted ovwerwhelm menagerie loosed strength arms slew wildests beast Seeing rest creatures amazed British Valor fled dens howling despair
01657/“The reviewing officer paced victoriously by the fourteen Figurehting trenches lined with swords and spears; above them, perched upon fourteen walls glowered the guns. The path he took was lined with his fallen comrades, and with the heaped bodies of the enemy dead. It was when he came to his quarters that the enemy attempted one last time to ovwerwhelm him.The wild beasts of Scindiah’s menagerie were loosed upon him. By the strength of his arms alone he slew four of the wildests beast. Seeing this, the rest of the creatures, amazed by his British Valor, fled back to their dens in howling despair.”
4 Translation 03036
Diese wunderbare Einladung schreckte unsnicht ab, ihnen zu folgen. Zuerst ging der Stieg durch abgestuerzte Kalkfelsenstuecke hinauf,die durch die Zeit vor die steile Felswand aufgestufet worden und mit Hasel- und Buchenbueschendurchwachsen sind.
Kalkfelsenstuecke, Buchenbueschen
wonderful invitation scared staircase Kalkfelsenstuecke crashed aufgestufet period steep hazel Buchenbueschen mixed
00452/ “This wonderful invitation to us scared notdepend, to follow them. First, the staircase went up by Kalkfelsenstuecke crashed, the aufgestufet been through the period before the steep rock face with hazel and Buchenbueschen are mixed.”
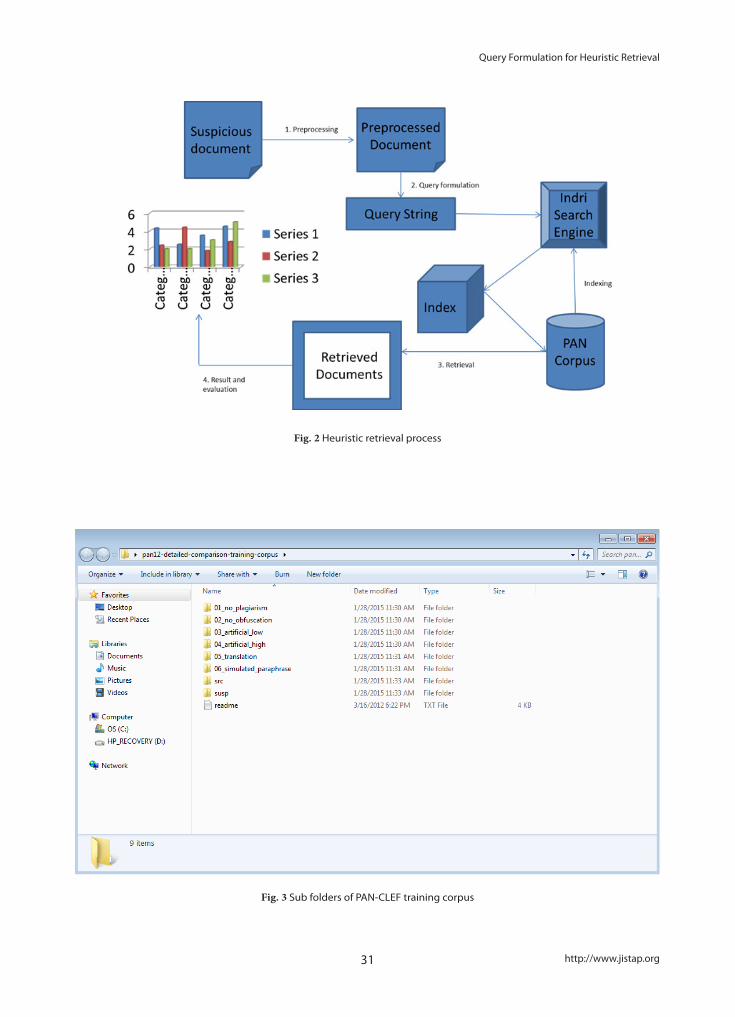
31 http://www.jistap.org
Query Formulation for Heuristic Retrieval
Fig. 2 Heuristic retrieval process
Fig. 3 Sub folders of PAN-CLEF training corpus
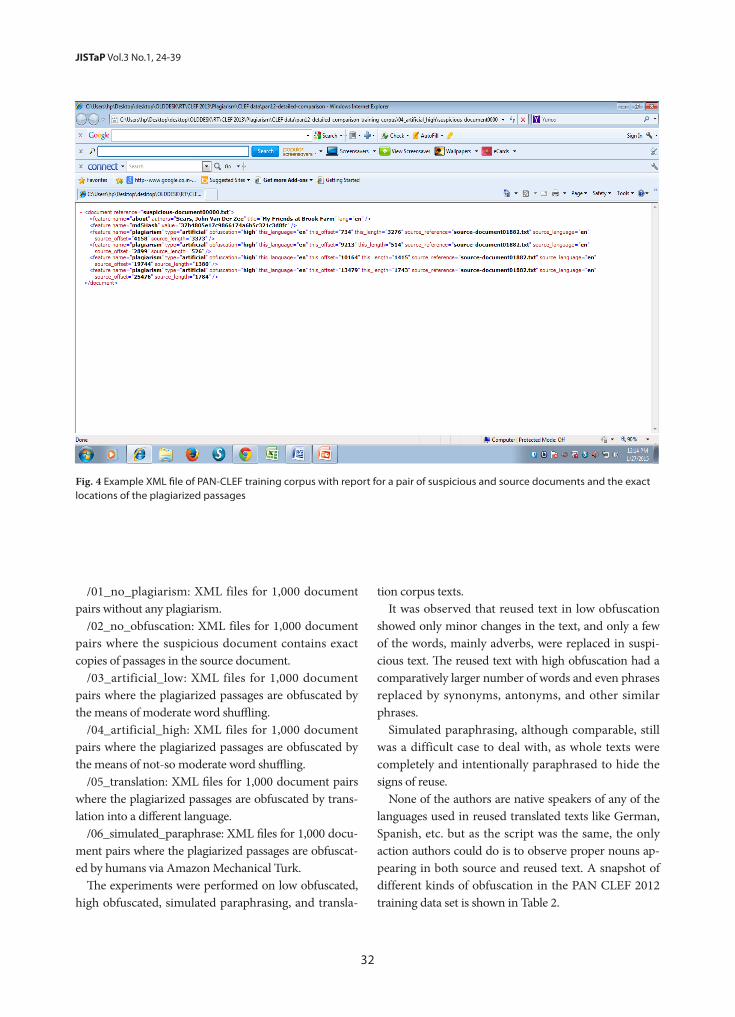
32
JISTaP Vol.3 No.1, 24-39
Fig. 4 Example XML file of PAN-CLEF training corpus with report for a pair of suspicious and source documents and the exact locations of the plagiarized passages
/01_no_plagiarism: XML files for 1,000 document pairs without any plagiarism.
/02_no_obfuscation: XML files for 1,000 document pairs where the suspicious document contains exact copies of passages in the source document.
/03_artificial_low: XML files for 1,000 document pairs where the plagiarized passages are obfuscated by the means of moderate word shuffling.
/04_artificial_high: XML files for 1,000 document pairs where the plagiarized passages are obfuscated by the means of not-so moderate word shuffling.
/05_translation: XML files for 1,000 document pairs where the plagiarized passages are obfuscated by trans-lation into a different language.
/06_simulated_paraphrase: XML files for 1,000 docu-ment pairs where the plagiarized passages are obfuscat-ed by humans via Amazon Mechanical Turk.
The experiments were performed on low obfuscated, high obfuscated, simulated paraphrasing, and transla-
tion corpus texts.It was observed that reused text in low obfuscation
showed only minor changes in the text, and only a few of the words, mainly adverbs, were replaced in suspi-cious text. The reused text with high obfuscation had a comparatively larger number of words and even phrases replaced by synonyms, antonyms, and other similar phrases.
Simulated paraphrasing, although comparable, still was a difficult case to deal with, as whole texts were completely and intentionally paraphrased to hide the signs of reuse.
None of the authors are native speakers of any of the languages used in reused translated texts like German, Spanish, etc. but as the script was the same, the only action authors could do is to observe proper nouns ap-pearing in both source and reused text. A snapshot of different kinds of obfuscation in the PAN CLEF 2012 training data set is shown in Table 2.
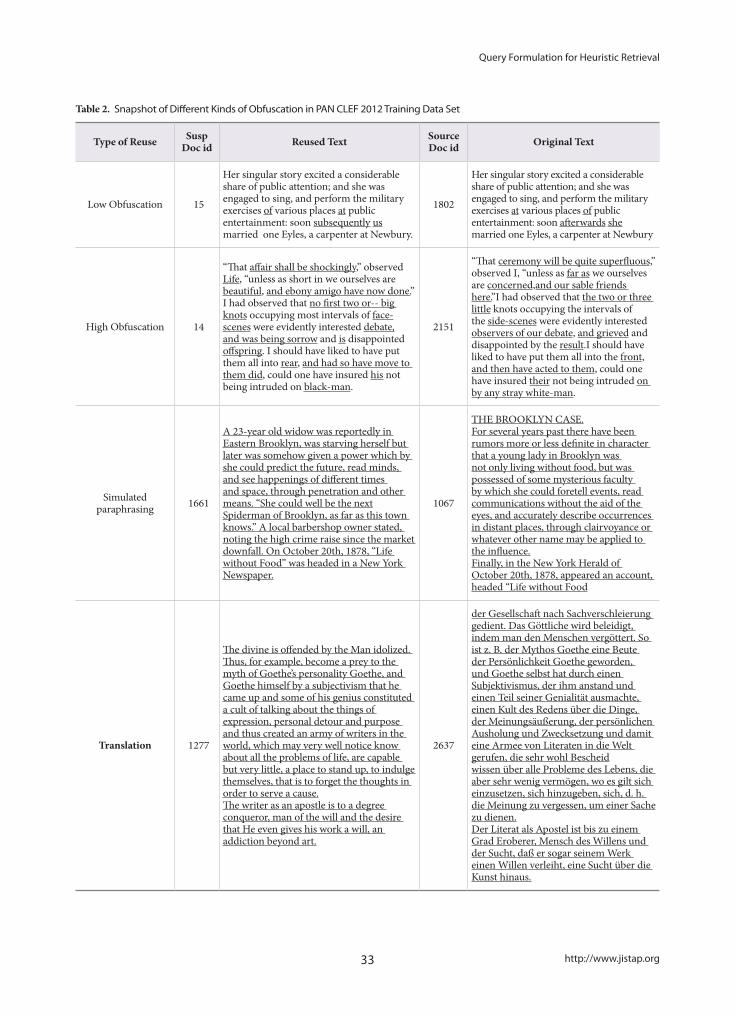
33 http://www.jistap.org
Query Formulation for Heuristic Retrieval
Table 2. Snapshot of Different Kinds of Obfuscation in PAN CLEF 2012 Training Data Set
Type of Reuse SuspDoc id Reused Text Source
Doc id Original Text
Low Obfuscation 15
Her singular story excited a considerable share of public attention; and she was engaged to sing, and perform the military exercises of various places at public entertainment: soon subsequently us married one Eyles, a carpenter at Newbury.
1802
Her singular story excited a considerable share of public attention; and she was engaged to sing, and perform the military exercises at various places of public entertainment: soon afterwards she married one Eyles, a carpenter at Newbury
High Obfuscation 14
“That affair shall be shockingly,” observed Life, “unless as short in we ourselves are beautiful, and ebony amigo have now done.” I had observed that no first two or-- big knots occupying most intervals of face-scenes were evidently interested debate, and was being sorrow and is disappointed offspring. I should have liked to have put them all into rear, and had so have move to them did, could one have insured his not being intruded on black-man.
2151
“That ceremony will be quite superfluous,” observed I, “unless as far as we ourselves are concerned,and our sable friends here.”I had observed that the two or three little knots occupying the intervals of the side-scenes were evidently interested observers of our debate, and grieved and disappointed by the result.I should have liked to have put them all into the front, and then have acted to them, could one have insured their not being intruded on by any stray white-man.
Simulated paraphrasing 1661
A 23-year old widow was reportedly in Eastern Brooklyn, was starving herself but later was somehow given a power which by she could predict the future, read minds, and see happenings of different times and space, through penetration and other means. “She could well be the nextSpiderman of Brooklyn, as far as this town knows.” A local barbershop owner stated, noting the high crime raise since the market downfall. On October 20th, 1878, “Life without Food” was headed in a New York Newspaper.
1067
THE BROOKLYN CASE.For several years past there have been rumors more or less definite in character that a young lady in Brooklyn was not only living without food, but was possessed of some mysterious faculty by which she could foretell events, read communications without the aid of the eyes, and accurately describe occurrences in distant places, through clairvoyance or whatever other name may be applied to the influence.Finally, in the New York Herald of October 20th, 1878, appeared an account, headed “Life without Food
Translation 1277
The divine is offended by the Man idolized. Thus, for example, become a prey to the myth of Goethe’s personality Goethe, and Goethe himself by a subjectivism that he came up and some of his genius constituted a cult of talking about the things of expression, personal detour and purpose and thus created an army of writers in the world, which may very well notice know about all the problems of life, are capable but very little, a place to stand up, to indulge themselves, that is to forget the thoughts in order to serve a cause.The writer as an apostle is to a degree conqueror, man of the will and the desire that He even gives his work a will, an addiction beyond art.
2637
der Gesellschaft nach Sachverschleierung gedient. Das Göttliche wird beleidigt, indem man den Menschen vergöttert. So ist z. B. der Mythos Goethe eine Beute der Persönlichkeit Goethe geworden, und Goethe selbst hat durch einen Subjektivismus, der ihm anstand und einen Teil seiner Genialität ausmachte, einen Kult des Redens über die Dinge, der Meinungsäußerung, der persönlichen Ausholung und Zwecksetzung und damit eine Armee von Literaten in die Welt gerufen, die sehr wohl Bescheidwissen über alle Probleme des Lebens, die aber sehr wenig vermögen, wo es gilt sich einzusetzen, sich hinzugeben, sich, d. h. die Meinung zu vergessen, um einer Sache zu dienen.Der Literat als Apostel ist bis zu einem Grad Eroberer, Mensch des Willens und der Sucht, daß er sogar seinem Werk einen Willen verleiht, eine Sucht über die Kunst hinaus.
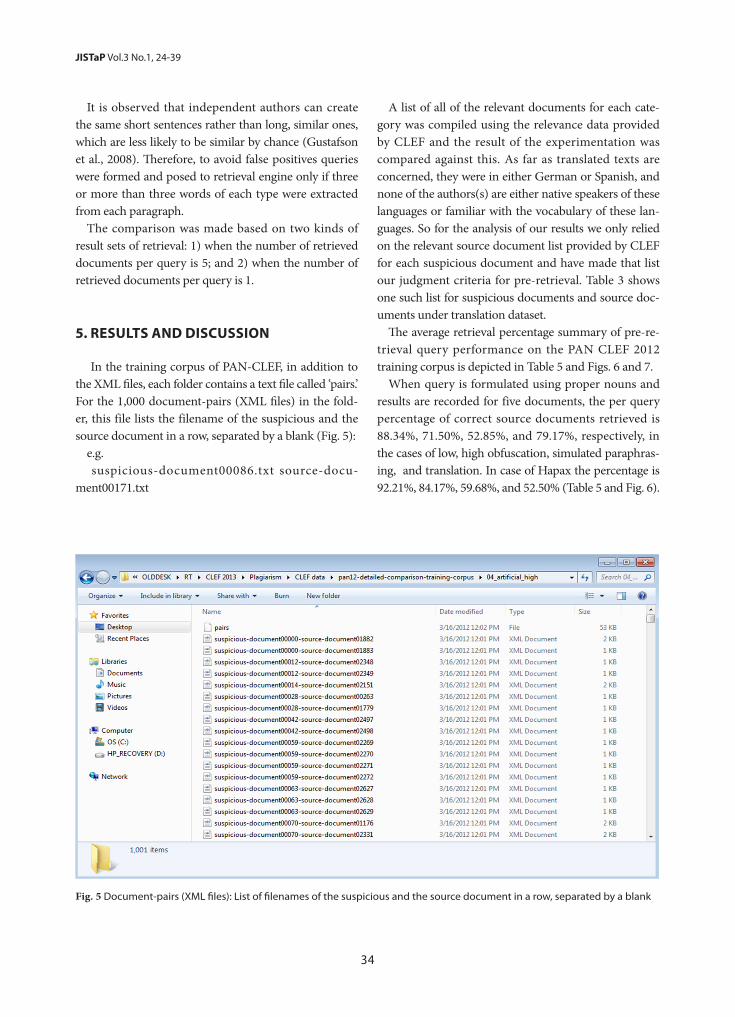
34
JISTaP Vol.3 No.1, 24-39
It is observed that independent authors can create the same short sentences rather than long, similar ones, which are less likely to be similar by chance (Gustafson et al., 2008). Therefore, to avoid false positives queries were formed and posed to retrieval engine only if three or more than three words of each type were extracted from each paragraph.
The comparison was made based on two kinds of result sets of retrieval: 1) when the number of retrieved documents per query is 5; and 2) when the number of retrieved documents per query is 1.
5. RESULTS AND DISCUSSION
In the training corpus of PAN-CLEF, in addition to the XML files, each folder contains a text file called ‘pairs.’ For the 1,000 document-pairs (XML files) in the fold-er, this file lists the filename of the suspicious and the source document in a row, separated by a blank (Fig. 5):
e.g. suspicious-document00086.txt source-docu-
ment00171.txt
A list of all of the relevant documents for each cate-gory was compiled using the relevance data provided by CLEF and the result of the experimentation was compared against this. As far as translated texts are concerned, they were in either German or Spanish, and none of the authors(s) are either native speakers of these languages or familiar with the vocabulary of these lan-guages. So for the analysis of our results we only relied on the relevant source document list provided by CLEF for each suspicious document and have made that list our judgment criteria for pre-retrieval. Table 3 shows one such list for suspicious documents and source doc-uments under translation dataset.
The average retrieval percentage summary of pre-re-trieval query performance on the PAN CLEF 2012 training corpus is depicted in Table 5 and Figs. 6 and 7.
When query is formulated using proper nouns and results are recorded for five documents, the per query percentage of correct source documents retrieved is 88.34%, 71.50%, 52.85%, and 79.17%, respectively, in the cases of low, high obfuscation, simulated paraphras-ing, and translation. In case of Hapax the percentage is 92.21%, 84.17%, 59.68%, and 52.50% (Table 5 and Fig. 6).
Fig. 5 Document-pairs (XML files): List of filenames of the suspicious and the source document in a row, separated by a blank
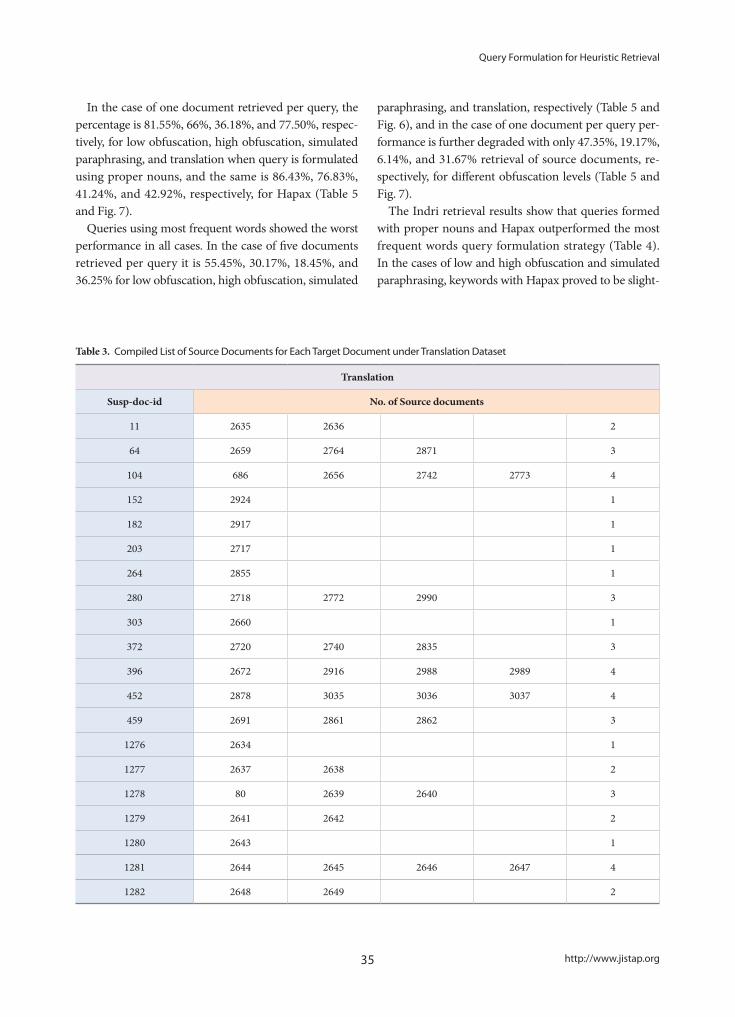
35 http://www.jistap.org
Query Formulation for Heuristic Retrieval
In the case of one document retrieved per query, the percentage is 81.55%, 66%, 36.18%, and 77.50%, respec-tively, for low obfuscation, high obfuscation, simulated paraphrasing, and translation when query is formulated using proper nouns, and the same is 86.43%, 76.83%, 41.24%, and 42.92%, respectively, for Hapax (Table 5 and Fig. 7).
Queries using most frequent words showed the worst performance in all cases. In the case of five documents retrieved per query it is 55.45%, 30.17%, 18.45%, and 36.25% for low obfuscation, high obfuscation, simulated
paraphrasing, and translation, respectively (Table 5 and Fig. 6), and in the case of one document per query per-formance is further degraded with only 47.35%, 19.17%, 6.14%, and 31.67% retrieval of source documents, re-spectively, for different obfuscation levels (Table 5 and Fig. 7).
The Indri retrieval results show that queries formed with proper nouns and Hapax outperformed the most frequent words query formulation strategy (Table 4). In the cases of low and high obfuscation and simulated paraphrasing, keywords with Hapax proved to be slight-
Table 3. Compiled List of Source Documents for Each Target Document under Translation Dataset
Translation
Susp-doc-id No. of Source documents
11 2635 2636 2
64 2659 2764 2871 3
104 686 2656 2742 2773 4
152 2924 1
182 2917 1
203 2717 1
264 2855 1
280 2718 2772 2990 3
303 2660 1
372 2720 2740 2835 3
396 2672 2916 2988 2989 4
452 2878 3035 3036 3037 4
459 2691 2861 2862 3
1276 2634 1
1277 2637 2638 2
1278 80 2639 2640 3
1279 2641 2642 2
1280 2643 1
1281 2644 2645 2646 2647 4
1282 2648 2649 2
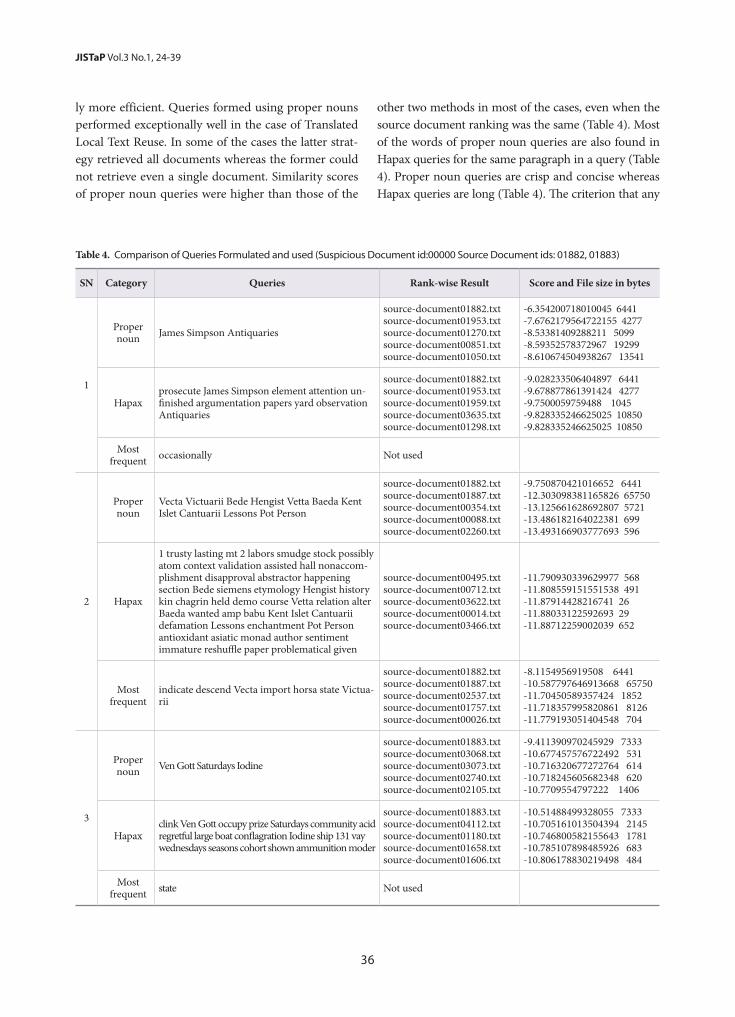
36
JISTaP Vol.3 No.1, 24-39
ly more efficient. Queries formed using proper nouns performed exceptionally well in the case of Translated Local Text Reuse. In some of the cases the latter strat-egy retrieved all documents whereas the former could not retrieve even a single document. Similarity scores of proper noun queries were higher than those of the
other two methods in most of the cases, even when the source document ranking was the same (Table 4). Most of the words of proper noun queries are also found in Hapax queries for the same paragraph in a query (Table 4). Proper noun queries are crisp and concise whereas Hapax queries are long (Table 4). The criterion that any
Table 4. Comparison of Queries Formulated and used (Suspicious Document id:00000 Source Document ids: 01882, 01883)
SN Category Queries Rank-wise Result Score and File size in bytes
1
Proper noun James Simpson Antiquaries
source-document01882.txt source-document01953.txt source-document01270.txtsource-document00851.txt source-document01050.txt
-6.354200718010045 6441-7.6762179564722155 4277-8.53381409288211 5099-8.59352578372967 19299-8.610674504938267 13541
Hapaxprosecute James Simpson element attention un-finished argumentation papers yard observation Antiquaries
source-document01882.txt source-document01953.txtsource-document01959.txt source-document03635.txt source-document01298.txt
-9.028233506404897 6441-9.678877861391424 4277-9.7500059759488 1045-9.828335246625025 10850-9.828335246625025 10850
Most frequent occasionally Not used
2
Proper noun
Vecta Victuarii Bede Hengist Vetta Baeda Kent Islet Cantuarii Lessons Pot Person
source-document01882.txtsource-document01887.txtsource-document00354.txtsource-document00088.txt source-document02260.txt
-9.750870421016652 6441-12.303098381165826 65750-13.125661628692807 5721-13.486182164022381 699-13.493166903777693 596
Hapax
1 trusty lasting mt 2 labors smudge stock possibly atom context validation assisted hall nonaccom-plishment disapproval abstractor happening section Bede siemens etymology Hengist history kin chagrin held demo course Vetta relation alter Baeda wanted amp babu Kent Islet Cantuarii defamation Lessons enchantment Pot Person antioxidant asiatic monad author sentiment immature reshuffle paper problematical given
source-document00495.txt source-document00712.txt source-document03622.txt source-document00014.txt source-document03466.txt
-11.790930339629977 568-11.808559151551538 491-11.87914428216741 26-11.88033122592693 29-11.88712259002039 652
Most frequent
indicate descend Vecta import horsa state Victua-rii
source-document01882.txtsource-document01887.txt source-document02537.txt source-document01757.txtsource-document00026.txt
-8.1154956919508 6441-10.587797646913668 65750-11.70450589357424 1852-11.718357995820861 8126-11.779193051404548 704
3
Proper noun Ven Gott Saturdays Iodine
source-document01883.txt source-document03068.txtsource-document03073.txtsource-document02740.txt source-document02105.txt
-9.411390970245929 7333-10.677457576722492 531-10.716320677272764 614-10.718245605682348 620-10.7709554797222 1406
Hapaxclink Ven Gott occupy prize Saturdays community acid regretful large boat conflagration Iodine ship 131 vay wednesdays seasons cohort shown ammunition moder
source-document01883.txt source-document04112.txtsource-document01180.txt source-document01658.txtsource-document01606.txt
-10.51488499328055 7333-10.705161013504394 2145-10.746800582155643 1781-10.785107898485926 683-10.806178830219498 484
Most frequent state Not used

37 http://www.jistap.org
Query Formulation for Heuristic Retrieval
word which starts with an uppercase letter is considered to be a proper noun has been applied, so a few other terms, mainly nouns which start a sentence, are mistak-enly included in the query.
Query performances are comparable in the cases of
proper nouns and Hapax (Figs. 6 and 7), and retrieval scores are higher in the case of proper noun queries; therefore proper noun queries may be preferred over Hapax queries as those formed using proper nouns also reduce the chances of getting query drift.
Table 5. Table Showing Average Retrieval Percentage Summary
Method used→
Type of reuse↓
Documents per query (Document=5) Documents per query (Document=1)
Proper nouns Hapax(frequency=1) Most frequent Proper nouns Hapax
(frequency=1) Most frequent
Low Obfuscation 88.34% 92.21% 55.45% 81.55% 86.43% 47.35%
High Obfuscation 71.50% 84.17% 30.17% 66.00% 76.83% 19.17%
Simulated Paraphrasing 52.85% 59.68% 18.45% 36.18% 41.24% 6.14%
Translation 79.17% 52.50% 36.25% 77.50% 42.92% 31.67%
Fig. 6 Graph showing query performances (as average percentage) when the result considered per query is 5 documents
Fig. 7 Graph showing query performances (as average percentage) when the result considered per query is 1 document
38
JISTaP Vol.3 No.1, 24-39
6. CONCLUSIONS
The results of these experiments show that a pre-re-trieval strategy of proper nouns and Hapax outper-formed a most frequent words strategy. Initial study reveals that level of obfuscation may also have an influ-ence on pre-retrieval strategy. Whereas Hapax was ob-served to be slightly more efficient than other strategies in the cases of low obfuscation, high obfuscation, and simulated paraphrasing, queries formulated using prop-er nouns were definitely the most efficient in the case of heuristic retrieval for local reuse in translated texts. The Heuristic retrieval strategies that were somewhat more efficient require further study on mono- and cross-lin-gual text reuse with different scripts. Further work is in progress as these are intermediate results of the experi-ments performed on the PAN CLEF 2012 training data set.
ACKNOWLEDGEMENTS
The authors are grateful to the organisers of PAN CLEF for allowing them to work on the PAN CLEF 2012 training corpus.
One of the authors, Aarti Kumar, is thankful to the Maulana Azad National Institute of Technology, Bhopal, India for providing her with the financial support to pursue her doctoral work as a full-time research scholar.
The authors are also thankful to the Indri group for providing us with the software to perform our experi-ments.
REFERENCES
Aggarwal, N., Asooja, K., Buitelaar, P., Polajnar, T.,& Gracia, J. (2012). Cross-lingual linking of news stories using ESA. In FIRE 2012Working Notes for CL!NSS, FIRE ISI, Kolkata, India(2012)
Arora, P., Jones, J., & Jones, G.J.F. (2013). DCU at FIRE 2013. Cross-Language Indian news story search. In FIRE 2013 Working Notes.
Bar, D, Zesch, T., and Gurevych, I. (2012, December). Text reuse detection using a composition of text similarity measures. Proceedings of COLING 2012: Technical Papers (pp. 167-184), COLING 2012,
Mumbai.Barrón-Cedeño, A. (2010, July). On the mono- and
cross-language. Detection of text re-use and plagia-rism. Paper presented at SIGIR’10, Geneva, Swit-zerland. ACM 978-1-60558-896-4/10/07.
Barrón-Cedeño, A. (2012). On the mono- and cross-language detection of text re-use and pla-giarism. Ph.D. thesis. Universitat Politecnica de Valencia, Spain.
Clough, P.D., Gaizauskas, R., Piao, S.S.L., et al. (2002, July). METER: Measuring text reuse. Proceedings of the 40th Annual Meeting of the Association for Computational Linguistics (ACL) (pp. 152-159), Philadelphia.
Clough, P.D. (2001). Measuring text reuse in journalis-tic domain. Proeeedings of the 4th CLUK Colloqui-um. (pp. 53–63), UK.
Cummins, R., Jose, J., & O’Riordan, C. (2011, July). Improved query performance prediction using standard deviation. Paper presented at SIGIR’11, Beijing, China. ACM 978-1-4503-0757-4/11/07.
Ghosh, A., Pal, S., & Bandyopadhyay, S. (2011). Cross-language text re-use detection using infor-mation retrieval. In FIRE 2011 Working Notes.
Gipp, B., et al. (2013, July-August). Demonstration of citation pattern analysis for plagiarism detection. Paper presented at SIGIR’13, Dublin, Ireland. ACM 978-1-4503-2034-4/13/07
Grozea, C., & Popescu, M. (2009). ENCOPLOT: Pair-wise sequence matching in linear time applied to plagiarism detection. In B. Stein, P. Rosso, E. Sta-matatos, M. Koppel, & E. Agirre (Eds.), PAN’09 (pp. 10-18), Donostia, Spain.
Gupta, P., & Rosso, P. (2012, July). Text reuse with ACL (Upward) trends. Proceedings of the ACL-2012 Spe-cial Workshop on Rediscovering 50 Years of Discov-eries (pp. 76–82), Jeju, Korea.
Gupta, P., & Singhal, K. (2011). Mapping Hindi-English text re-use document pairs. In FIRE 2011 Working Notes.
Gustafson, N., & Soledad, M., et al. (2008). Nowhere to hide: Finding plagiarized documents based on sentence similarity. Paper presented at 2008 IEEE/WIC/ACM International Conference on Web Intelli-gence and Intelligent Agent Technology, Provo, Utah, USA. 978-0-7695-3496-1/08 IEEE, DOI 10.1109/WIIAT.2008.16.
39 http://www.jistap.org
Query Formulation for Heuristic Retrieval
Hagen, M., & Stein, B. (2010). Candidate document re-trieval for web-scale text reuse detection? Extended version of an ECDL 2010 poster paper. M. Hagen & B. Stein. Capacity-constrained query formula-tion. Proc. of ECDL 2010 (posters) (pp. 384–388).
Haiduc, S., et al. (2013). Automatic query reformu-lations for text retrieval in software engineering. Paper presented at 2013 IEEE ICSE 2013, San Fran-cisco, CA, USA.
Carmel, D., et al. (2006, August). What makes a que-ry difficult? Paper presented at SIGIR’06, Seattle, Washington, USA.
Hauff, C., Hiemstra, D., & Jong, F. (2008, October). A survey of pre-retrieval query performance predic-tors. Paper presented at CIKM’08, Napa Valley, CA, USA. ACM 978-1-59593-991-3/08/10.
Mittelbach, A., Lehmann, L., Rensing, C., et al. (2010, September). Automatic detection of local reuse. Proceedings of the 5th European Conference on Technology Enhanced Learning no. LNCS 6383 (pp. 229-244). Berlin Heidelberg: Springer-Verlag.
Osman, A.H., et al. (2012). An improved plagiarism detection scheme based on semantic role labeling. Journal of Applied Soft Computing, 12, 1493-1502. doi:10.1016/j.asoc.2011.12.021
Pal, A., & Gillam, L. Set-based similarity measurement and ranking model to identify cases of journalistic text reuse. In FIRE 2013 Working Notes.
Palkovskii, Y., Muzyka, I., & Belov, A. (2012). Detecting text reuse with ranged windowed TF-IDF analysis method. Retrieved from http://www.plagiaris-madvice.org/research-papers/item/detecting-text-reuse-with-ranged-windowed-tf-idf-analysis-method
Palkovskii, Y., & Belov, A. (2011). Using TF-IDF weight ranking model in CLINSS as effective similarity measure to identify cases of journalistic text reuse. Berlin Heidelberg: Springer-Verlag.
Possas, B., Ziviani, N., Ribeiro-Neto, B., et al. (2005, October-November). Maximal termsets as a que-ry structuring mechanism. Paper presented at CIKM’05, Bremen, Germany. ACM 1595931406/ 05/0010.
Potthast, M., Hagen, M., Gollub, T., et al. (2013, Sep-tember). Overview of the 5th International Com-petition on plagiarism detection. Working notes paper presented at CLEF 2013 Evaluation Labs and
Workshop, Valencia, Spain. Potthast, M., Hagen, M., Völske, M., et al. (2013, Au-
gust). Crowdsourcing interaction logs to under-stand text reuse from the web. Proceedings of the 51st Annual Meeting of the Association for Compu-tational Linguistics (Vol. 1: Long Papers) (pp. 1212-1221).
Pouliquen, B., et. al. (2003). Automatic identification of document translations in large multilingual doc-ument collections. Proc. International Conference Recent Advances in Natural Language Processing (RANLP ‘03), pp. 401-408.
Seo, J., & Croft, W.B. (2008, July). Local text reuse de-tection. Paper presented at SIGIR’08, Singapore. ACM 978-1-60558-164-4/08/07.
Tholpadi, G., & Param, A. (2013). Leveraging article titles for cross-lingual linking of focal news events. In FIRE 2013 Working Notes.
Torrejon, D.A.R., & Ramos, J.M.M. (2013). Linking En-glish and Hindi news by IDF, reference monotony and extended contextual N-grams IR engine. In FIRE 2013 Working Notes.
Vogel, S., Ney, H., & Tillmann, C. (1996). HMM-based word alignment in statistical translation. Proc. 16th conference on Computational linguistics (COLING ‘96), Association for Computational Linguistics (vol. 2, pp. 836-841). doi:10.3115/993268.993313
40
JISTaPJournal of Information Science Theory and Practice
http://www.jistap.org
Non-Governmental Organization (NGO) Libraries for The Visually Impaired in Nigeria: Alternative Format Use and Perception of Information Services
’Niran Adetoro *Department of Library and Information ScienceTai Solarin University of Education, Ijagun, Ijebu-OdeE-mail: [email protected], [email protected]
Open Access
Accepted date: December 4, 2014Received date: September 30, 2014
*Corresponding Author: ’Niran AdetoroAssociate Professor Department of Library and Information ScienceTai Solarin University of Education, Ijagun, Ijebu-OdeE-mail: [email protected], [email protected]
All JISTaP content is Open Access, meaning it is accessible onlineto everyone, without fee and authors’ permission. All JISTaP content is published and distributed under the terms of the Creative Commons Attribution License (http:/ creativecommons.org/licenses/by/3.0/). Under this license, authors reserve the copyright for their content; however, they permit anyone to unrestrictedly use, distribute, and reproduce the content in any medium as far as the original authors and source are cited. For any reuse, redistribution, or reproduction of a work, users must clarify the license terms under which the work was produced.
ⓒ ’Niran Adetoro, 2015
Research PaperJ. of infosci. theory and practice 3(1): 40-49, 2015http://dx.doi.org/10.1633/JISTaP.2015.3.1.3
ABSTRACTNigeria’s non-government organization (NGO) libraries for the visually impaired has over the years been at the forefront of information services provision to persons with visual impairment. This study adopted a survey re-search design to investigate use of alternative formats and perceptions of information services to the visually impaired, focusing on two purposively chosen NGO libraries for the visually impaired in Nigeria. Using a complete enumeration approach, data were gathered from 180 users of the libraries through the use of a structured ques-tionnaire with a reliability score (α = 0.74). Data from 112 (62.2%) of the 180 administered copies of a questionnaire that were retrieved were analysed. The study found that Braille materials had a high level of utilization ( -x = 4.46) and were the most frequently utilized (90.9%). Perception of information services by the visually impaired was positive while use of alternative formats was significantly and positively related to users’ perception of information services (r = .041; p < 0.05). The study recommends improved transcription and investment in alternative formats and in e-resources. It also recommends collaborations to widen access as well as constant evaluation of services.
Keywords: Non-governmental organizations, Libraries, Visually Impaired, Alternative formats, Information Services, Nigeria
41 http://www.jistap.org
Non-Governmental Organization (NGO) Libraries
1. INTRODUCTION
An aspiration for library and information services to the visually impaired is that they be equally hos-pitable to users of all kinds and categories. Such ser-vices must essentially disregard artificial boundaries in terms of information (Davies, 2007). The visually impaired just like the sighted need to use and acquire information, but such information would only be rel-evant when available in alternative formats, which in-cludes Braille, audio recordings/materials, large print, and electronic resources. The United Nations docu-ment on the equalization of opportunities for persons with disabilities (UN, 1993) and the UNESCO public library manifesto (1994) espouses that information is a primary and fundamental right for the disabled. With this, libraries have to play key roles in building an inclusive society.
It is crucial for the visually impaired, through the use of information, to become active participants in social life. Just like the sighted, information use will ensure that they partake in modern society’s process-es through the ability to identify, interpret, process, disseminate, use, and reuse information in order to make informed choices and reduce uncertainties (Singh & Mairangthem, 2010). The visually impaired will not achieve these ideals unless libraries provide services geared towards meeting their reading in-terests and information needs (Adetoro & Atinmo, 2012).
Library services for the visually impaired are known to vary from country to country. The services may not be part of the local or national library sys-tem but usually they run on low budgets, focusing on production of accessible formats with limited library services. A few of them have the capacity to leverage on new developments in digital library ser-vices. In many developing countries such as Nigeria, government investment in services to persons with disabilities has been minimal and therefore the space for information services to the visually impaired has been taken over by specialized libraries, especially a few non-governmental organization (NGO) libraries. The demand for information materials in alternative format in Nigeria by the visually impaired through libraries is high (Atinmo, 2007; Adetoro, 2010; Ade-toro, 2012) However, the visually impaired perceive
information services as weak with an inadequate resource base of limited and obsolete alternative in-formation materials for use (Adetoro, 2010).
These perceptions underscore the need for ser-vices to be based on the reading interests and needs of the visually impaired and that such services must provide opportunities and support that will enable them become independent, active, and self-sustain-ing members of their communities. In Nigeria, some NGOs providing information services to the visually impaired go beyond materials production by estab-lishing libraries specifically for the visually impaired. Notable among them are NigerWives, an association of foreign women married to Nigerian men, with the NigerWives library, the Anglo-Nigerian Welfare Association for the Blind (ANWAB) with ANWAB Library, and the Nigerian Society for the Blind with Inlaks Library for the Visually Handicapped. Niger-Wives and ANWAB have over the years been making available reading text for students. ANWAB have been making information available to tertiary level students and blind workers. ANWAB and Inlaks library for the visually handicapped both have an ex-tensive library of Braille and audio recordings. Both libraries have also in recent times trained users in the use of computers and the Internet; they have provid-ed Internet services to their users.
The libraries have a computerized Braille press for transcription of materials into alternative format. They also produce large print editions. Inlaks Library for the visually impaired have a well-equipped sound-proof studio for the production of audio recordings and carrels equipped with audio gadgets that facilitate individualized listening. This article further presents the statement of the problem, research questions and hypothesis raised to guide the study, a review of rele-vant literature, methods adopted, results, discussion of findings, and conclusions and recommendations.
2. STATEMENT OF THE PROBLEM
The responsibility of providing information ser-vices to the visually impaired in Nigeria has been shouldered by NGOs. This is because the education and provision of information services to disabled persons has not received the needed attention and
42
JISTaP Vol.3 No.1, 40-49
investment from the government. There is no data or government statistic indicating this neglect; however, a few public libraries located in some states make avail-able readable materials for the visually impaired in secondary schools and from neighboring towns. These libraries do not produce materials; they are more distributors of information materials in alternative formats. They are poorly equipped, and their materi-als are obsolete and mainly Braille and a few talking books. Their effort is minimal relative to the needs of the visually impaired in Nigeria (Adetoro, 2009; Atin-mo, 2007).
The inadequacies of existing institutions has pro-pelled these NGOs through their libraries to dictate the direction of service provision to the visually im-paired in Nigeria. But how have these NGO libraries fared given the prevailing signs of weak capacity? The demand for information materials in alternative formats by the visually impaired is high in Nigeria (Adetoro, 2010). However, it is believed that the use of alternative formats for study and leisure purposes even in these libraries probably has its shortcomings especially in terms of level and frequency of use. The situation may explain the opinions or perceptions of many visually impaired persons that information ser-vices are generally weak and unable to adequately cater for their information needs for study and recreational purposes. These perceptions may have been shaped by factors relating to weak investment, lack of govern-ment support, and disjointed services, among others.
2.1. Research Questions and HypothesisThe following research questions were investigated
in this study:ⅰ. What is the general level of use of alternative
formats in NGO libraries for the visually im-paired?
ⅱ. How frequently do the visually impaired use the alternative formats in the NGO libraries?
ⅲ. How do the visually impaired perceive the infor-mation services provided by the NGO libraries?
2.2. The Research Hypothesis was Validated at 0.05 Level of Significance
There is no significant relationship between use of alternative formats and perception of information ser-vices in the NGO libraries by the visually impaired.
3. LITERATURE REVIEW
A study on the use of alternative formats by Canadi-an college students with print disabilities (Anne, 2000) found that 56% of the students use tape recordings frequently, 31% use large print, and 19% use Braille frequently. This is an indication of the popularity of audio recordings among the students. Davis, Wisdom, and Greaser (2001) revealed that about 83% of adults who are blind and partially sighted also use tape re-cordings. Other studies with evidence supporting the high level of audio material use include Goft, Cleary, Keil, Franklin, and Cole-Hamilton (2001), and Kennel, Yu, and Greaser (2000). The majority of the users of audio materials, according to Getz (2003), are visually impaired people who generally have no other way to read unless they use Braille. For instance, about 3% of Royal National Institute for the Blind (RNIB) users use Braille. In the USA, 4% of the National Library for the Blind (NLB) users read Braille (NLB, 2002). Only 3.9% use Braille in Israel (Getz, 2003).
Schols (1995) reported that in the Netherlands a high level of use of large print was due to an ageing population who prefer large print materials. In Nige-ria, a study of availability and use of alternative formats by secondary school students (Adetoro, 2011) revealed that 91.3% used Braille daily, 34.6% use audio books daily, and only 2% use large print weekly. Similar re-sults were reported by Atinmo (2007) and Adetoro and Atinmo (2012). According to Basharu (2000), it is amazing to observe the number of users who visit the ANWAB library to borrow alternative formats for use. Basharu adds that about 95% of the users either bor-row from the library or bring materials for transcrip-tion into Braille for their use.
Several studies have investigated library and in-formation services to the visually impaired from the point of view of the provider, such as Harris and Op-penheim (2003) and Bundy (2002) to mention a few. It is important for investigations to consider the percep-tions of the users themselves. User focus studies such as Creaser et al. (2002) are necessary to determine the opinions, perceptions, and activities regarding infor-mation services to the visually impaired. Williamson, Schauder, and Bow (2000) and Berry (1999) reported that users had a high level of satisfaction with services through agencies, though several public libraries were
43 http://www.jistap.org
Non-Governmental Organization (NGO) Libraries
less prepared to give personal attention to their visual-ly impaired users.
Bernardi (2004) identified two basic services that are most currently provided to the visually impaired through libraries as firstly, services based on traditional special formats; those dependent on adaptive technolo-gies, sometimes accompanied by training activities and target services such as access to catalogues, digital texts, and special formats and inter library loans. Karen (2004) reported that Gateshead libraries in the UK provided technology training and other services to the visually impaired with their Access to Reading and Information Services (AIRS) projects.
In the US emphases were on services geared to-wards improving access to library resources through adaptive technologies (Goddard, 2004; Pietrala, 2004). Norwegian libraries have deployed full time informa-tion officers who assist and guide users and essentially ensure that library services are accessible to all visually impaired users (Eymard, 2002).
Users’ favorable perceptions of DAISY (Digital Audio Based Information System) books as a very useful tool for information services provision, and the fact that a growing number of libraries are producing and provid-ing Daisy books, has been widely reported (Graddock, 2003; Tylor, 2004; Goddard, 2004).
Bernardi (2004) reported the introduction of a na-tional catalogue of electronic texts available through the Internet which allows users to search, order, and view electronic books in Braille or text format. Services of this nature are not only innovative but are well received and valued by the visually impaired. A similar initiative was carried out in the UK on an accessible catalogue for traditional and electronic texts for the visually impaired (Brophy & Craven, 1999).
Singh and Moirangthem (2010) found that Delhi libraries provided a wide range of information services to the visually impaired which includes library services, Braille production, audio book recordings, computer training, Internet service, and resource sharing. He adds that these services and other technology-based initia-tives bring smiles to the faces of the visually impaired.
An ideal library and information service according to Machell (1996) is one where individuals, regardless of the degree of their visual impairment, can access in-formation in a relevant and required format as well as in needed quantities where staff respect the needs of the
users.The provision of web based information resources by
libraries providing information services to the visually impaired has in recent times been advocated in order to further widen access to information resources. These resources have moved from a simple text interface to dynamic and interactive designs. There is a need for web accessibility to be designed for all users of the library. “Design for all” in the library environment means that library information technology systems and interfaces must be designed in a way that enable them to be read and interacted with easily by all users, whether visiting or remotely accessing the library, and regardless of any disability of access preference (Brophy & Craven, 2007).
The use of alternative formats in the NGO libraries selected is a critical aspect of this study. It is therefore necessary that the theoretical assumptions for this study must essentially emphasize utilization of information resources as a consequence of users’ perceptions of these services. This study was hinged on information utility theory which relates use of information with val-ue of use and user satisfaction. This theory stresses the dynamics of information consumer behavior, which is a product of how information is perceived by its users. This assumption should help contextualize the research questions raised for the study.
4. METHODS
The descriptive survey research design was adopted for the study. Two (2) NGO libraries were purposively selected for the study because they are the two known libraries for the visually impaired in Nigeria owned by NGOs. Other NGOs providing information services to the visually impaired produce and provide alternative formats but do not own libraries. The ANWAB library and the Inlaks Library for the Visually Handicapped, both located in Lagos, have a total population of 180 visually impaired users according to the library records provided by the two libraries.
A complete enumeration approach was used to col-lect data from all the 180 users in the libraries using a questionnaire named “Visually Impaired Library Users Questionnaire” (VILUQ) (α = 0.77) for a period of six weeks, and with the assistance of the library workers who knew the users well and helped in the administra-
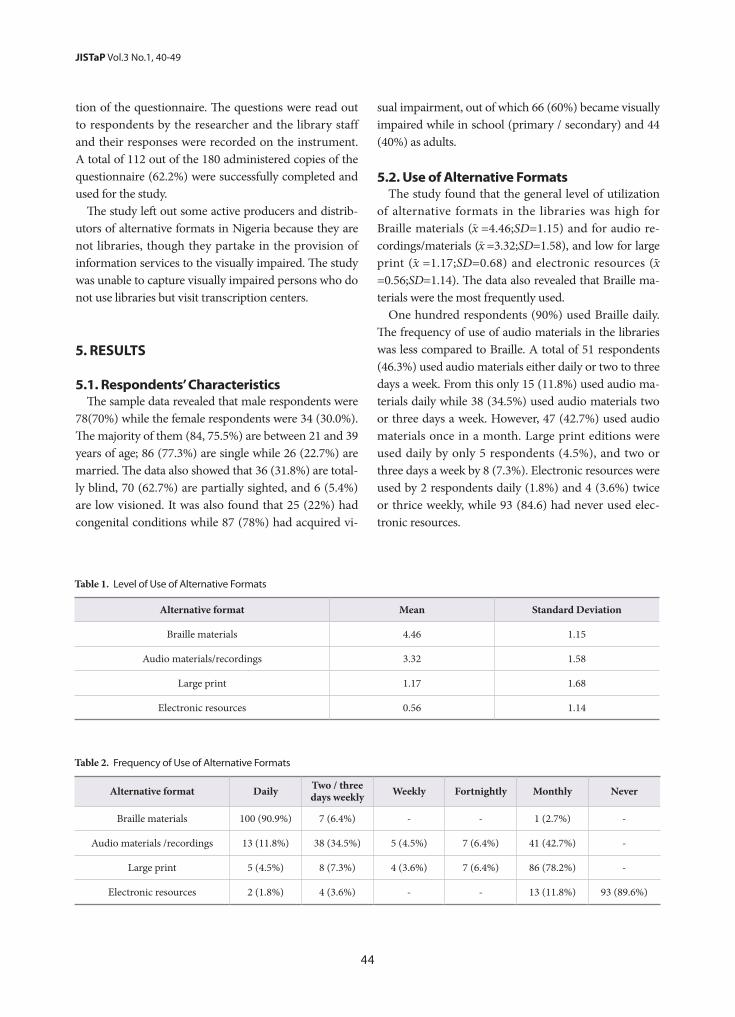
44
JISTaP Vol.3 No.1, 40-49
tion of the questionnaire. The questions were read out to respondents by the researcher and the library staff and their responses were recorded on the instrument. A total of 112 out of the 180 administered copies of the questionnaire (62.2%) were successfully completed and used for the study.
The study left out some active producers and distrib-utors of alternative formats in Nigeria because they are not libraries, though they partake in the provision of information services to the visually impaired. The study was unable to capture visually impaired persons who do not use libraries but visit transcription centers.
5. RESULTS
5.1. Respondents’ CharacteristicsThe sample data revealed that male respondents were
78(70%) while the female respondents were 34 (30.0%). The majority of them (84, 75.5%) are between 21 and 39 years of age; 86 (77.3%) are single while 26 (22.7%) are married. The data also showed that 36 (31.8%) are total-ly blind, 70 (62.7%) are partially sighted, and 6 (5.4%) are low visioned. It was also found that 25 (22%) had congenital conditions while 87 (78%) had acquired vi-
sual impairment, out of which 66 (60%) became visually impaired while in school (primary / secondary) and 44 (40%) as adults.
5.2. Use of Alternative FormatsThe study found that the general level of utilization
of alternative formats in the libraries was high for Braille materials (-x =4.46;SD=1.15) and for audio re-cordings/materials (-x =3.32;SD=1.58), and low for large print (-x =1.17;SD=0.68) and electronic resources (-x =0.56;SD=1.14). The data also revealed that Braille ma-terials were the most frequently used.
One hundred respondents (90%) used Braille daily. The frequency of use of audio materials in the libraries was less compared to Braille. A total of 51 respondents (46.3%) used audio materials either daily or two to three days a week. From this only 15 (11.8%) used audio ma-terials daily while 38 (34.5%) used audio materials two or three days a week. However, 47 (42.7%) used audio materials once in a month. Large print editions were used daily by only 5 respondents (4.5%), and two or three days a week by 8 (7.3%). Electronic resources were used by 2 respondents daily (1.8%) and 4 (3.6%) twice or thrice weekly, while 93 (84.6) had never used elec-tronic resources.
Table 1. Level of Use of Alternative Formats
Alternative format Mean Standard Deviation
Braille materials 4.46 1.15
Audio materials/recordings 3.32 1.58
Large print 1.17 1.68
Electronic resources 0.56 1.14
Table 2. Frequency of Use of Alternative Formats
Alternative format Daily Two / three days weekly Weekly Fortnightly Monthly Never
Braille materials 100 (90.9%) 7 (6.4%) - - 1 (2.7%) -
Audio materials /recordings 13 (11.8%) 38 (34.5%) 5 (4.5%) 7 (6.4%) 41 (42.7%) -
Large print 5 (4.5%) 8 (7.3%) 4 (3.6%) 7 (6.4%) 86 (78.2%) -
Electronic resources 2 (1.8%) 4 (3.6%) - - 13 (11.8%) 93 (89.6%)
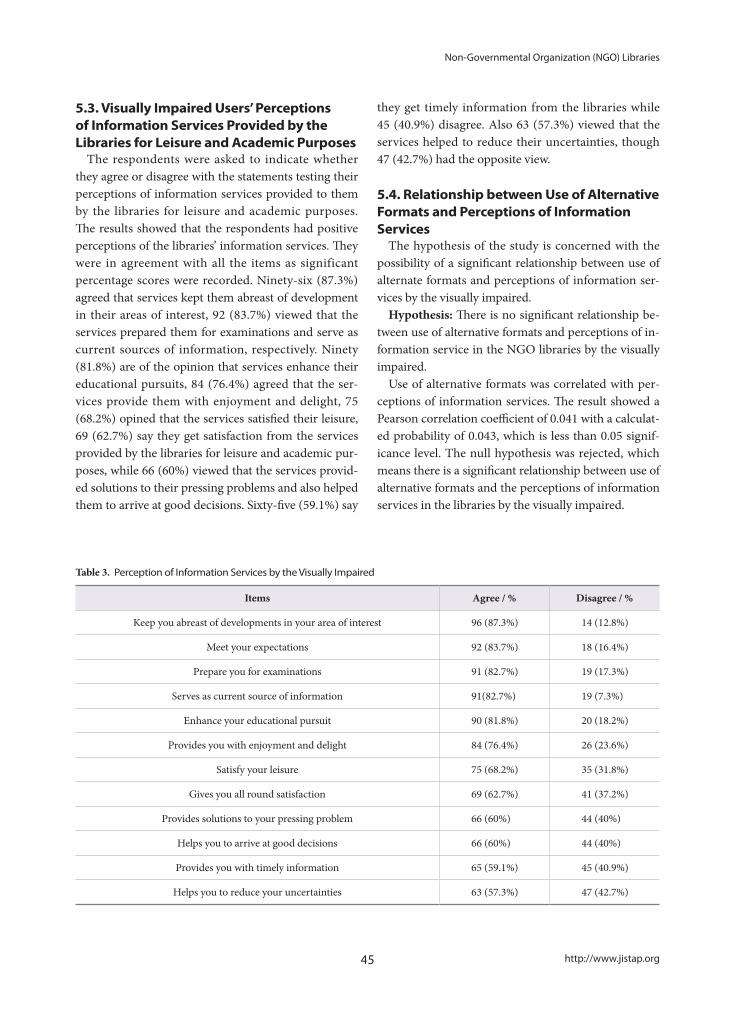
45 http://www.jistap.org
Non-Governmental Organization (NGO) Libraries
5.3. Visually Impaired Users’ Perceptions of Information Services Provided by the Libraries for Leisure and Academic Purposes
The respondents were asked to indicate whether they agree or disagree with the statements testing their perceptions of information services provided to them by the libraries for leisure and academic purposes. The results showed that the respondents had positive perceptions of the libraries’ information services. They were in agreement with all the items as significant percentage scores were recorded. Ninety-six (87.3%) agreed that services kept them abreast of development in their areas of interest, 92 (83.7%) viewed that the services prepared them for examinations and serve as current sources of information, respectively. Ninety (81.8%) are of the opinion that services enhance their educational pursuits, 84 (76.4%) agreed that the ser-vices provide them with enjoyment and delight, 75 (68.2%) opined that the services satisfied their leisure, 69 (62.7%) say they get satisfaction from the services provided by the libraries for leisure and academic pur-poses, while 66 (60%) viewed that the services provid-ed solutions to their pressing problems and also helped them to arrive at good decisions. Sixty-five (59.1%) say
they get timely information from the libraries while 45 (40.9%) disagree. Also 63 (57.3%) viewed that the services helped to reduce their uncertainties, though 47 (42.7%) had the opposite view.
5.4. Relationship between Use of Alternative Formats and Perceptions of Information Services
The hypothesis of the study is concerned with the possibility of a significant relationship between use of alternate formats and perceptions of information ser-vices by the visually impaired.
Hypothesis: There is no significant relationship be-tween use of alternative formats and perceptions of in-formation service in the NGO libraries by the visually impaired.
Use of alternative formats was correlated with per-ceptions of information services. The result showed a Pearson correlation coefficient of 0.041 with a calculat-ed probability of 0.043, which is less than 0.05 signif-icance level. The null hypothesis was rejected, which means there is a significant relationship between use of alternative formats and the perceptions of information services in the libraries by the visually impaired.
Table 3. Perception of Information Services by the Visually Impaired
Items Agree / % Disagree / %
Keep you abreast of developments in your area of interest 96 (87.3%) 14 (12.8%)
Meet your expectations 92 (83.7%) 18 (16.4%)
Prepare you for examinations 91 (82.7%) 19 (17.3%)
Serves as current source of information 91(82.7%) 19 (7.3%)
Enhance your educational pursuit 90 (81.8%) 20 (18.2%)
Provides you with enjoyment and delight 84 (76.4%) 26 (23.6%)
Satisfy your leisure 75 (68.2%) 35 (31.8%)
Gives you all round satisfaction 69 (62.7%) 41 (37.2%)
Provides solutions to your pressing problem 66 (60%) 44 (40%)
Helps you to arrive at good decisions 66 (60%) 44 (40%)
Provides you with timely information 65 (59.1%) 45 (40.9%)
Helps you to reduce your uncertainties 63 (57.3%) 47 (42.7%)
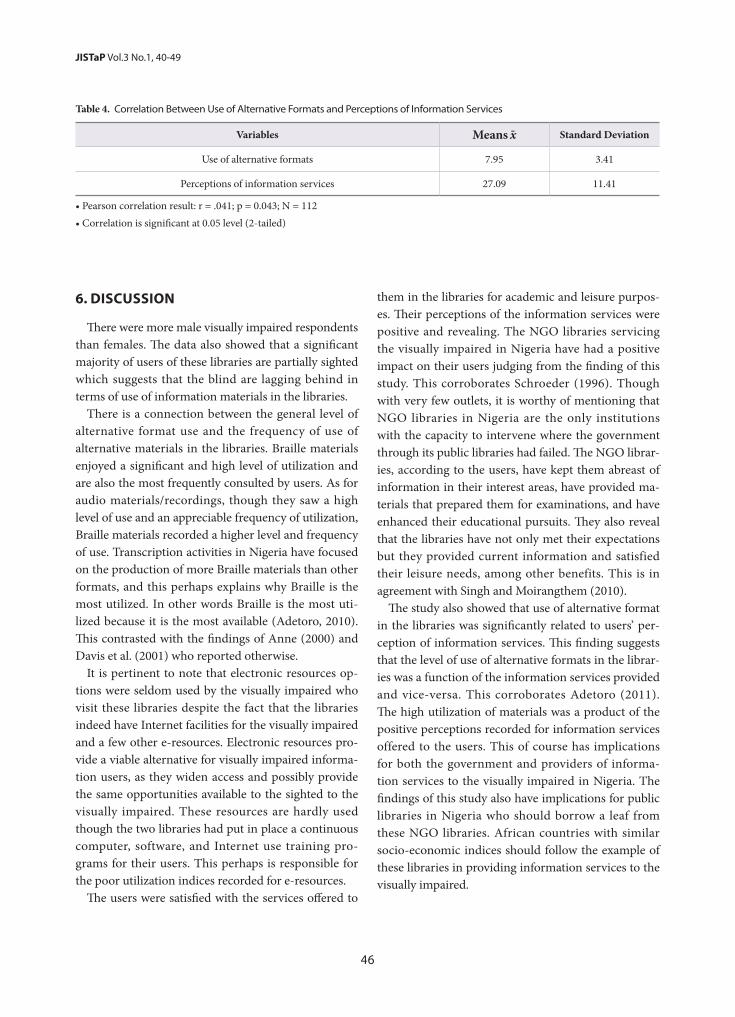
46
JISTaP Vol.3 No.1, 40-49
Table 4. Correlation Between Use of Alternative Formats and Perceptions of Information Services
Variables Means -x Standard Deviation
Use of alternative formats 7.95 3.41
Perceptions of information services 27.09 11.41
• Pearson correlation result: r = .041; p = 0.043; N = 112• Correlation is significant at 0.05 level (2-tailed)
6. DISCUSSION
There were more male visually impaired respondents than females. The data also showed that a significant majority of users of these libraries are partially sighted which suggests that the blind are lagging behind in terms of use of information materials in the libraries.
There is a connection between the general level of alternative format use and the frequency of use of alternative materials in the libraries. Braille materials enjoyed a significant and high level of utilization and are also the most frequently consulted by users. As for audio materials/recordings, though they saw a high level of use and an appreciable frequency of utilization, Braille materials recorded a higher level and frequency of use. Transcription activities in Nigeria have focused on the production of more Braille materials than other formats, and this perhaps explains why Braille is the most utilized. In other words Braille is the most uti-lized because it is the most available (Adetoro, 2010). This contrasted with the findings of Anne (2000) and Davis et al. (2001) who reported otherwise.
It is pertinent to note that electronic resources op-tions were seldom used by the visually impaired who visit these libraries despite the fact that the libraries indeed have Internet facilities for the visually impaired and a few other e-resources. Electronic resources pro-vide a viable alternative for visually impaired informa-tion users, as they widen access and possibly provide the same opportunities available to the sighted to the visually impaired. These resources are hardly used though the two libraries had put in place a continuous computer, software, and Internet use training pro-grams for their users. This perhaps is responsible for the poor utilization indices recorded for e-resources.
The users were satisfied with the services offered to
them in the libraries for academic and leisure purpos-es. Their perceptions of the information services were positive and revealing. The NGO libraries servicing the visually impaired in Nigeria have had a positive impact on their users judging from the finding of this study. This corroborates Schroeder (1996). Though with very few outlets, it is worthy of mentioning that NGO libraries in Nigeria are the only institutions with the capacity to intervene where the government through its public libraries had failed. The NGO librar-ies, according to the users, have kept them abreast of information in their interest areas, have provided ma-terials that prepared them for examinations, and have enhanced their educational pursuits. They also reveal that the libraries have not only met their expectations but they provided current information and satisfied their leisure needs, among other benefits. This is in agreement with Singh and Moirangthem (2010).
The study also showed that use of alternative format in the libraries was significantly related to users’ per-ception of information services. This finding suggests that the level of use of alternative formats in the librar-ies was a function of the information services provided and vice-versa. This corroborates Adetoro (2011). The high utilization of materials was a product of the positive perceptions recorded for information services offered to the users. This of course has implications for both the government and providers of informa-tion services to the visually impaired in Nigeria. The findings of this study also have implications for public libraries in Nigeria who should borrow a leaf from these NGO libraries. African countries with similar socio-economic indices should follow the example of these libraries in providing information services to the visually impaired.
47 http://www.jistap.org
Non-Governmental Organization (NGO) Libraries
7. CONCLUSION AND RECOMMENDATIONS
The use of alternative formats in the NGO libraries studied was high for Braille and audio materials in terms of the level and frequency of use. Overall, the perceptions of the visually impaired with regard to information services were positive and encouraging while use of materials was related to users’ perceptions. These are positive points for the NGO libraries for the visually impaired in Nigeria and indeed for the efforts of the private institutions who are engaged in pro-viding information services to the visually impaired in one way or another. It is crucial to note that these libraries are better placed to adequately provide library and information services to the visually impaired positively if supported by government and other stake-holders. Though users were satisfied with the service provided by the libraries studied, the libraries need to improve service by widening their reach to a bigger community of visually impaired persons who are not library users. They need to intensify their efforts in reaching more users and pressuring the government to invest in services to persons with disabilities gener-ally. There is still much to be done in bringing about equal access to information for the visually impaired in Nigeria. The findings of this study suggest that the attention and policy of government urgently needs to be directed to helping NGO libraries widen their reach and further improve upon information services to the visually impaired. It is clear that available equipment for transcription of materials, Internet, and e-resources to widen access to information are inadequate. These resources and availability of funds are critical to im-proving information services provision to the visually impaired in the libraries and in Nigeria. It is suggested that further studies should examine the information use patterns of visually impaired persons who do not use libraries but patronize other information outlets or media, and to analyze how they perceive information services via such outlets.
This study recommends that NGO libraries invest more in transcription of more materials into readable formats and in electronic resources for their users. This is because the materials available for the visual-ly impaired in the libraries are generally inadequate compared to what is desired. Braille materials have not covered the reading interests of the users. This is also
true for the other resources. They regularly bring in materials of interest in print to be transcribed for their use. The collection of the libraries in terms of subject coverage is not adequate. Audio recordings are much fewer in number than Braille, and the challenge of vol-unteer readers and studio equipment for transcription has kept the number of audio titles low. Large print and electronic resources are few owing to inadequate funds. NGO libraries for the visually impaired should collaborate first to widen resources and access to alter-native formats and lobby government towards building libraries for the visually impaired in Nigeria. Librari-ans and other stakeholders should engage in advocacy to create awareness and seek funds and assistance from corporate bodies and government. They should also look out for linkages with international bodies and funders so as to improve upon what is available. With these, utilization levels can be further improved. The NGO libraries should constantly investigate how well their services meet the expectations and satisfaction of users. This is crucial for sustainability and improved services.
REFERENCES
Adetoro, A. A. (2009). Relationship among reading interest, information materials availability and al-ternative format utilization by persons with visual impairment in selected libraries in southwestern, Ni-geria. Ph.D. Thesis, Department of Library, Archi-val and Information Studies, University of Ibadan, Nigeria.
Adetoro, N. (2010). Characteristics of visually impaired information users in Nigeria. African Research and Documentation, Journal of SCOLMA (UK Libraries and Archives Group on Africa), 114, 47-58.
Adetoro, N. (2011). Alternative format availability and its utilization by the visually impaired students in Nigerian secondary schools. Indian Journal of In-formation Science and Services, 5(2), 31-38.
Adetoro, N. (2012). Alternative format preferences among secondary school visually impaired stu-dents in Nigeria. Journal of Librarianship and Infor-mation Science, 44(2), 90-96.
Adetoro, N., & Atinmo, M. I. (2012). Reading interest and alternative format utilization by person with

48
JISTaP Vol.3 No.1, 40-49
visual impairment in Nigeria. African Journal of Li-braries Archives and Information Science, 22(2), 75-88.
Anne, M. (2000). Library services to Canadian stu-dents. Retrieved from
Atinmo, M. I. (2007). Setting up a computerized cat-alog and database of alternative format materials for blind and visually impaired persons in Nigeria. Library Trends, 55(4), 330-456.
Basharu, D. (2000). Equipping libraries for the blind with reading materials. Journal of Association of Libraries for the Visually Impaired, 1(1), 56-61.
Bernardi, F. (2004). Library services for blind and visually impaired people: Literature review. Retrieved from http://dspace-unipr.cilea.it/bit-stream/1889/1147
Berry, J. (1999). Apart or a part? Access to the Internet by visually impaired and blind people with par-ticular emphasis on assistive enabling technology and user perceptions. Information Technology and Disabilities, 6(3), 1-16.
Brophy P., & Craven, J. (1999). The integrated accessible library, a model of service development for the 21st
century: The final report of the REVIEL project. Manchester: CERLIM.
Brophy P., & Craven, J. (2007). Web Accessibility. Li-brary Trends, 55(4), 959-972.
Bundy, A. (2002). Inquiring into the roles of libraries in the online environment. Senate environment, communications, information technology and the Arts Reference Committee, Blackwood, South Australia. Retrieved from http://www.aph.gov.an/senate committee/ecta_ctte/completed_inquires/2002-04/online_libraries/submissions/sub03.doc .
Craddock, G. M. (2003). Assistive technology shaping the future. London: 105 Press.
Creaser, C., Davis, J. E., & Wisdom, S. (2002). Acces-sible, open and inclusive? How visually impaired people view library and information services and Agencies. Journal of Librarianship and Information Science, 34(4), 2012-214.
Croft, K., Cleary L, Keil, S., Franklin A., & Cole-Ham-ilton, I. (2001). The health and well being of blind and partially sighted children and young people aged 5-25. London: RNIB.
Davies, J. E. (2007). An overview of international re-
search into the library and information needs of vi-sually and information needs of visually impaired people. Library Trends, 55(4), 783-795.
Davis, J. Widom, S., & Creaser, C. (2001). Out of sight but not out of mind: visually impaired people’s per-spectives of library and information services. Lough-borough University library information statistics unit. Available at http://www.nib.uk.org/common/research/202001/dochtml
Eymard, D. (2002). Bibliotheques at handicaps visuals. Libraries and the visually handicapped. Bulletin des bibliotheques de France, 47(20), 117-119.
Getz, I. (2003). What do blind people want from talking books? Published Proceedings of the 69th IFLA General Conference and Council, Berlin, August 1-9. Retrieved from http://www.archive.ifla.org/iv/ifla69/papers/074e-Getz.pdf
Goddard, M. (2004). Access through technology. Li-brary Journal. Spring connected supplement, Apr. 2-6.
Harris, C., & Oppenheim, C. (2003). The provision of library for visually impaired students in UK fur-ther education libraries in response to the special educational needs and disability act (SENDA) Journal of Librarianship and Information Science, 35(4), 243-257.
IFLA/UNESCO (1994). UNESCO public library man-ifesto. The Hague: United Nations. Retrieved from www.unesco.org/webworld/librarias/manifestos/librarian.html
Karen, H. (2004). AIRS: ICT and information for the visually impaired. Multimedia Information and Technology, 30(4), 113-115.
Kennell, M., Yu, M., & Creaser, C. (2000). Public library service for visually impaired people. Report to the li-brary and information commission. Loughborough university: Library and information unit. Retrieved from http://www.alb.uk.org/comm/research/212000dochtml
Machell, J. (1996). Library and information services for the visually impaired people: National guidelines. London: Library Association Publishing.
National Library for the Blind (2002). Out of sight but not out of mind. Visually impaired people’s perspec-tives of library and information services. Research Bulletin 6. Retrieved from http://www.nib.uk.org./common/research/bulleting/202002dochtml
49 http://www.jistap.org
Non-Governmental Organization (NGO) Libraries
Pietrala, M. (2004). Serving the underserved: The vi-sion project. Interface, 26(3), 5-10.
Schols, M. (1995). Extra large: Large print on demand. Paper presented at the 61st IFLA General Confer-ence, Istanbul, Turkey, August 20-25. Retrieved from http://www.ifla.org/contact.html
Schroeder, F. K. (1996). Perception of Braille usage by legally blind adults. Journal of Visual Impairment and Blindness, 90(3). Retrieved from http://www.braille.org/papers/jvib0696/vb960310html
Singh, K. P., & Moirangthem. E. (2010). Are Indian libraries VIP-friendly? Information use and in-formation seeking behavior of visually impaired people in Delhi libraries. Library Philosophy and Practice. Retrieved from http://www.webpages.uidaho.edu/-mbolin/ipp.htm
Tylor, J. M. (2004). Serving blind readers in a digital age. American Libraries, 35(11), 49-51.
United Nations (1993). The standard rules for the equalization of opportunities for persons with disabilities. The Hague: United Nations General Assembly, 48th Session, December, 200, Resolution 48/96. Retrieved from http://www.un.org/esa/soc-dev/enable/dissre04.htm
Williamson, K., Schauder, D., & Bow, A. (2000). In-formation seeking by blind and sight impaired citizens: An ecological study. Information Research, 5(4). Retrieved from http://www.informationr.net/iv/5-4/papers79html
50
JISTaPJournal of Information Science Theory and Practice
http://www.jistap.org
Study of US/EU National Innovation Policies Based on Nanotechnology Development, and Implications for Korea
Jung Sun LimTechnology Innovation Analysis Center Korea Institute of Science and Technology InformationRepublic of KoreaE-mail: [email protected]
Seoung Hun Bae *National Nanotechnology Policy Center Korea Institute of Science and Technology Information Republic of KoreaE-mail: [email protected]
Kwang Min Shin National Nanotechnology Policy CenterKorea Institute of Science and Technology Information Republic of KoreaE-mail: [email protected]
Jin Seon Yoon National Nanotechnology Policy CenterKorea Institute of Science and Technology Information Republic of KoreaE-mail: [email protected]
Open Access
Accepted date: March 18, 2015Received date: November 10, 2014
*Corresponding Author: Seoung Hun BaeDepartment of Information Analysis DirectorNational Nanotechnology Policy Center Korea Institute of Science and Technology Information Republic of KoreaE-mail: [email protected]
All JISTaP content is Open Access, meaning it is accessible onlineto everyone, without fee and authors’ permission. All JISTaP content is published and distributed under the terms of the Creative Commons Attribution License (http:/ creativecommons.org/licenses/by/3.0/). Under this license, authors reserve the copyright for their content; however, they permit anyone to unrestrictedly use, distribute, and reproduce the content in any medium as far as the original authors and source are cited. For any reuse, redistribution, or reproduction of a work, users must clarify the license terms under which the work was produced.
ⓒ Jung Sun Lim, Kwang Min Shin, Jin Seon Yoon, Seoung Hun Bae, 2015
Research PaperJ. of infosci. theory and practice 3(1): 50-65, 2015http://dx.doi.org/10.1633/JISTaP.2015.3.1.4
ABSTRACTRecently US/EU governments are utilizing nanotechnology as a key catalyst to support national innovation poli-cies with economic recovery goals. US/EU nano policies have been serving as a global model to various countries, including Korea. So the authors initially seek to understand US/EU national innovation policy interconnections, and then find the role of nanotechnology development within. To strengthen national policy coherence, nano-technology development strategies are under evolution as an innovation catalyst for promoting commercializa-tion. To strategically support nano commercialization, EHS (Environmental, Health, Safety) and informatics are invested as priority fields to strengthen social acceptance and sustainability of nano enabled products. The current study explores US/EU national innovation policies including nano commercialization, EHS, and Informatics. Then obtained results are utilized to analyze weaknesses of Korean innovation systems of connecting creative economy and nanotechnology development policies. Then ongoing improvements are summarized focusing on EHS and informatics, which are currently prominent issues in international nanotechnology development.
Keywords: nanotechnology, innovation, innovation policy, commercialization
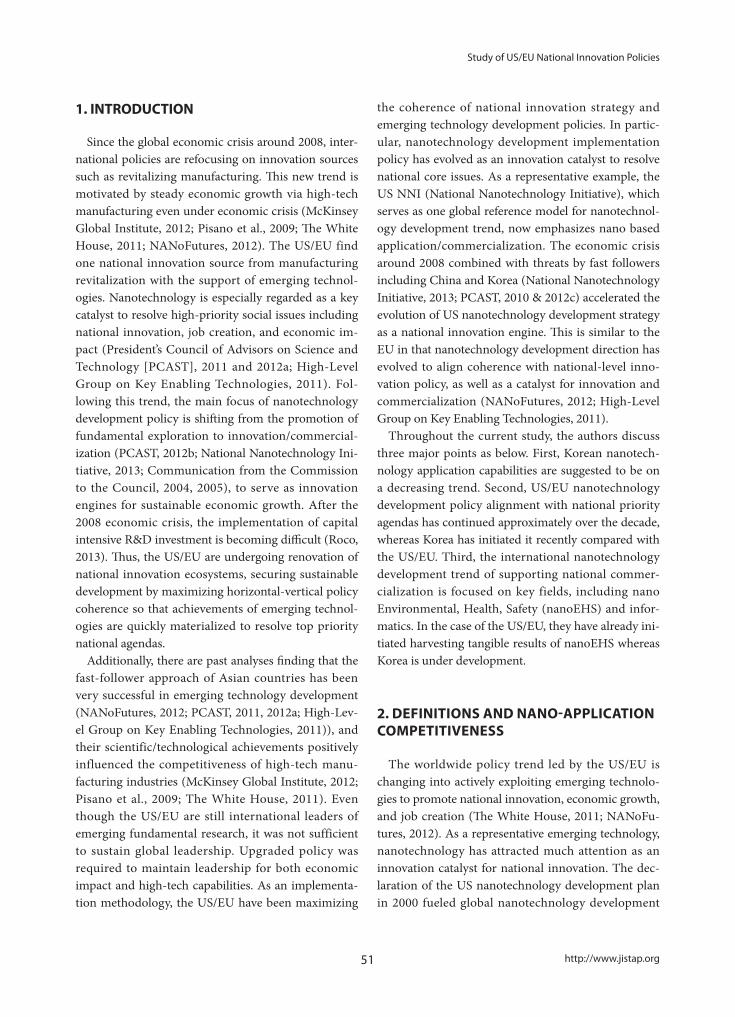
51 http://www.jistap.org
Study of US/EU National Innovation Policies
1. INTRODUCTION
Since the global economic crisis around 2008, inter-national policies are refocusing on innovation sources such as revitalizing manufacturing. This new trend is motivated by steady economic growth via high-tech manufacturing even under economic crisis (McKinsey Global Institute, 2012; Pisano et al., 2009; The White House, 2011; NANoFutures, 2012). The US/EU find one national innovation source from manufacturing revitalization with the support of emerging technol-ogies. Nanotechnology is especially regarded as a key catalyst to resolve high-priority social issues including national innovation, job creation, and economic im-pact (President’s Council of Advisors on Science and Technology [PCAST], 2011 and 2012a; High-Level Group on Key Enabling Technologies, 2011). Fol-lowing this trend, the main focus of nanotechnology development policy is shifting from the promotion of fundamental exploration to innovation/commercial-ization (PCAST, 2012b; National Nanotechnology Ini-tiative, 2013; Communication from the Commission to the Council, 2004, 2005), to serve as innovation engines for sustainable economic growth. After the 2008 economic crisis, the implementation of capital intensive R&D investment is becoming difficult (Roco, 2013). Thus, the US/EU are undergoing renovation of national innovation ecosystems, securing sustainable development by maximizing horizontal-vertical policy coherence so that achievements of emerging technol-ogies are quickly materialized to resolve top priority national agendas.
Additionally, there are past analyses finding that the fast-follower approach of Asian countries has been very successful in emerging technology development (NANoFutures, 2012; PCAST, 2011, 2012a; High-Lev-el Group on Key Enabling Technologies, 2011)), and their scientific/technological achievements positively influenced the competitiveness of high-tech manu-facturing industries (McKinsey Global Institute, 2012; Pisano et al., 2009; The White House, 2011). Even though the US/EU are still international leaders of emerging fundamental research, it was not sufficient to sustain global leadership. Upgraded policy was required to maintain leadership for both economic impact and high-tech capabilities. As an implementa-tion methodology, the US/EU have been maximizing
the coherence of national innovation strategy and emerging technology development policies. In partic-ular, nanotechnology development implementation policy has evolved as an innovation catalyst to resolve national core issues. As a representative example, the US NNI (National Nanotechnology Initiative), which serves as one global reference model for nanotechnol-ogy development trend, now emphasizes nano based application/commercialization. The economic crisis around 2008 combined with threats by fast followers including China and Korea (National Nanotechnology Initiative, 2013; PCAST, 2010 & 2012c) accelerated the evolution of US nanotechnology development strategy as a national innovation engine. This is similar to the EU in that nanotechnology development direction has evolved to align coherence with national-level inno-vation policy, as well as a catalyst for innovation and commercialization (NANoFutures, 2012; High-Level Group on Key Enabling Technologies, 2011).
Throughout the current study, the authors discuss three major points as below. First, Korean nanotech-nology application capabilities are suggested to be on a decreasing trend. Second, US/EU nanotechnology development policy alignment with national priority agendas has continued approximately over the decade, whereas Korea has initiated it recently compared with the US/EU. Third, the international nanotechnology development trend of supporting national commer-cialization is focused on key fields, including nano Environmental, Health, Safety (nanoEHS) and infor-matics. In the case of the US/EU, they have already ini-tiated harvesting tangible results of nanoEHS whereas Korea is under development.
2. DEFINITIONS AND NANO-APPLICATION COMPETITIVENESS
The worldwide policy trend led by the US/EU is changing into actively exploiting emerging technolo-gies to promote national innovation, economic growth, and job creation (The White House, 2011; NANoFu-tures, 2012). As a representative emerging technology, nanotechnology has attracted much attention as an innovation catalyst for national innovation. The dec-laration of the US nanotechnology development plan in 2000 fueled global nanotechnology development
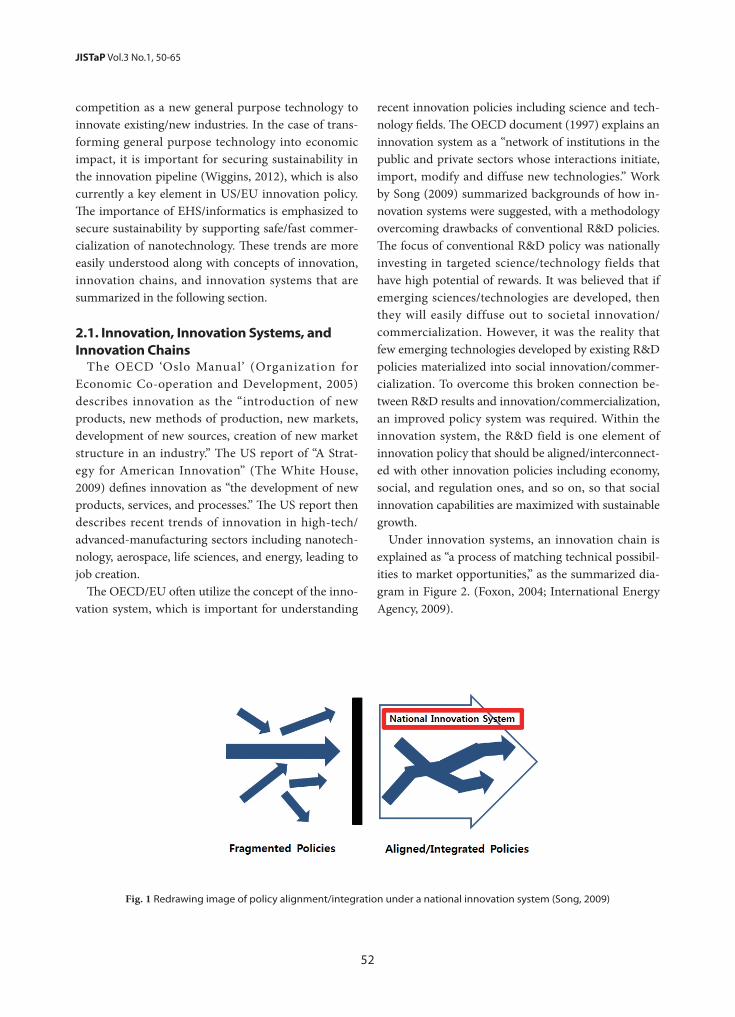
52
competition as a new general purpose technology to innovate existing/new industries. In the case of trans-forming general purpose technology into economic impact, it is important for securing sustainability in the innovation pipeline (Wiggins, 2012), which is also currently a key element in US/EU innovation policy. The importance of EHS/informatics is emphasized to secure sustainability by supporting safe/fast commer-cialization of nanotechnology. These trends are more easily understood along with concepts of innovation, innovation chains, and innovation systems that are summarized in the following section.
2.1. Innovation, Innovation Systems, and Innovation Chains
The OECD ‘Oslo Manual’ (Organization for Economic Co-operation and Development, 2005) describes innovation as the “introduction of new products, new methods of production, new markets, development of new sources, creation of new market structure in an industry.” The US report of “A Strat-egy for American Innovation” (The White House, 2009) defines innovation as “the development of new products, services, and processes.” The US report then describes recent trends of innovation in high-tech/advanced-manufacturing sectors including nanotech-nology, aerospace, life sciences, and energy, leading to job creation.
The OECD/EU often utilize the concept of the inno-vation system, which is important for understanding
recent innovation policies including science and tech-nology fields. The OECD document (1997) explains an innovation system as a “network of institutions in the public and private sectors whose interactions initiate, import, modify and diffuse new technologies.” Work by Song (2009) summarized backgrounds of how in-novation systems were suggested, with a methodology overcoming drawbacks of conventional R&D policies. The focus of conventional R&D policy was nationally investing in targeted science/technology fields that have high potential of rewards. It was believed that if emerging sciences/technologies are developed, then they will easily diffuse out to societal innovation/commercialization. However, it was the reality that few emerging technologies developed by existing R&D policies materialized into social innovation/commer-cialization. To overcome this broken connection be-tween R&D results and innovation/commercialization, an improved policy system was required. Within the innovation system, the R&D field is one element of innovation policy that should be aligned/interconnect-ed with other innovation policies including economy, social, and regulation ones, and so on, so that social innovation capabilities are maximized with sustainable growth.
Under innovation systems, an innovation chain is explained as “a process of matching technical possibil-ities to market opportunities,” as the summarized dia-gram in Figure 2. (Foxon, 2004; International Energy Agency, 2009).
JISTaP Vol.3 No.1, 50-65
Fig. 1 Redrawing image of policy alignment/integration under a national innovation system (Song, 2009)
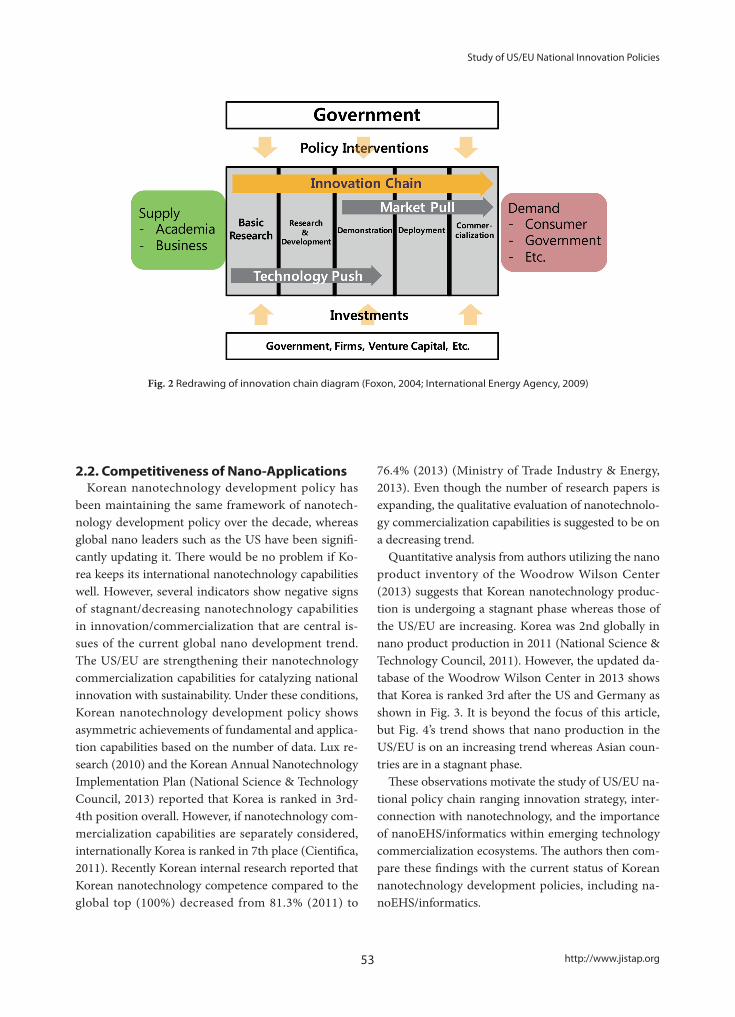
53 http://www.jistap.org
Study of US/EU National Innovation Policies
2.2. Competitiveness of Nano-ApplicationsKorean nanotechnology development policy has
been maintaining the same framework of nanotech-nology development policy over the decade, whereas global nano leaders such as the US have been signifi-cantly updating it. There would be no problem if Ko-rea keeps its international nanotechnology capabilities well. However, several indicators show negative signs of stagnant/decreasing nanotechnology capabilities in innovation/commercialization that are central is-sues of the current global nano development trend. The US/EU are strengthening their nanotechnology commercialization capabilities for catalyzing national innovation with sustainability. Under these conditions, Korean nanotechnology development policy shows asymmetric achievements of fundamental and applica-tion capabilities based on the number of data. Lux re-search (2010) and the Korean Annual Nanotechnology Implementation Plan (National Science & Technology Council, 2013) reported that Korea is ranked in 3rd-4th position overall. However, if nanotechnology com-mercialization capabilities are separately considered, internationally Korea is ranked in 7th place (Cientifica, 2011). Recently Korean internal research reported that Korean nanotechnology competence compared to the global top (100%) decreased from 81.3% (2011) to
76.4% (2013) (Ministry of Trade Industry & Energy, 2013). Even though the number of research papers is expanding, the qualitative evaluation of nanotechnolo-gy commercialization capabilities is suggested to be on a decreasing trend.
Quantitative analysis from authors utilizing the nano product inventory of the Woodrow Wilson Center (2013) suggests that Korean nanotechnology produc-tion is undergoing a stagnant phase whereas those of the US/EU are increasing. Korea was 2nd globally in nano product production in 2011 (National Science & Technology Council, 2011). However, the updated da-tabase of the Woodrow Wilson Center in 2013 shows that Korea is ranked 3rd after the US and Germany as shown in Fig. 3. It is beyond the focus of this article, but Fig. 4’s trend shows that nano production in the US/EU is on an increasing trend whereas Asian coun-tries are in a stagnant phase.
These observations motivate the study of US/EU na-tional policy chain ranging innovation strategy, inter-connection with nanotechnology, and the importance of nanoEHS/informatics within emerging technology commercialization ecosystems. The authors then com-pare these findings with the current status of Korean nanotechnology development policies, including na-noEHS/informatics.
Fig. 2 Redrawing of innovation chain diagram (Foxon, 2004; International Energy Agency, 2009)
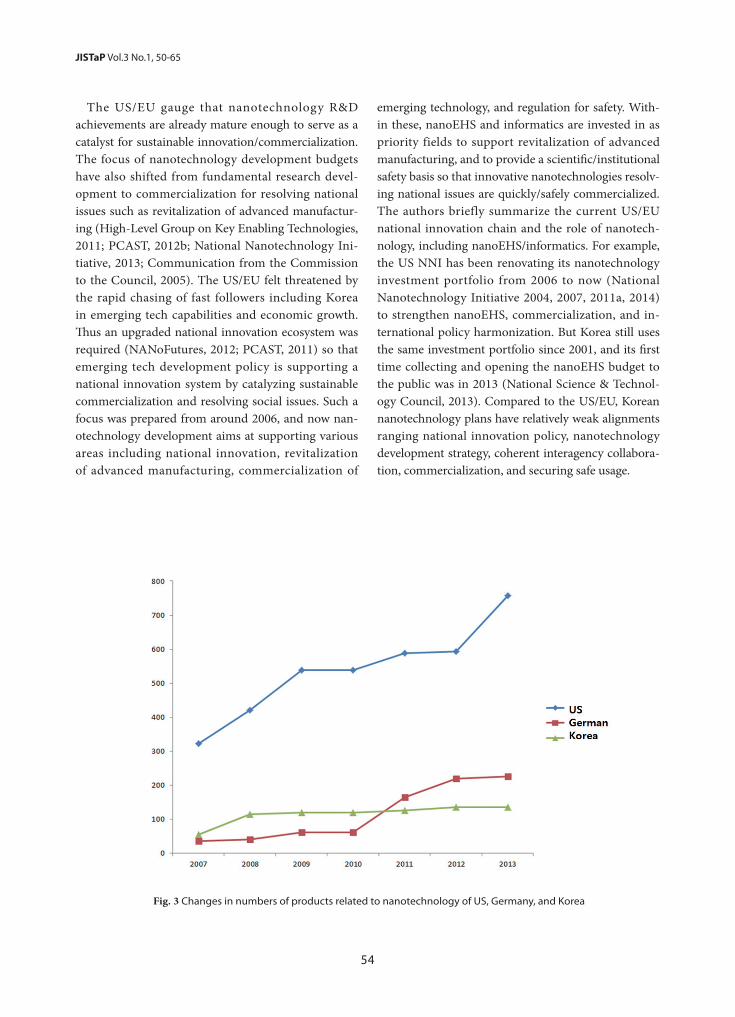
54
JISTaP Vol.3 No.1, 50-65
The US/EU gauge that nanotechnology R&D achievements are already mature enough to serve as a catalyst for sustainable innovation/commercialization. The focus of nanotechnology development budgets have also shifted from fundamental research devel-opment to commercialization for resolving national issues such as revitalization of advanced manufactur-ing (High-Level Group on Key Enabling Technologies, 2011; PCAST, 2012b; National Nanotechnology Ini-tiative, 2013; Communication from the Commission to the Council, 2005). The US/EU felt threatened by the rapid chasing of fast followers including Korea in emerging tech capabilities and economic growth. Thus an upgraded national innovation ecosystem was required (NANoFutures, 2012; PCAST, 2011) so that emerging tech development policy is supporting a national innovation system by catalyzing sustainable commercialization and resolving social issues. Such a focus was prepared from around 2006, and now nan-otechnology development aims at supporting various areas including national innovation, revitalization of advanced manufacturing, commercialization of
emerging technology, and regulation for safety. With-in these, nanoEHS and informatics are invested in as priority fields to support revitalization of advanced manufacturing, and to provide a scientific/institutional safety basis so that innovative nanotechnologies resolv-ing national issues are quickly/safely commercialized. The authors briefly summarize the current US/EU national innovation chain and the role of nanotech-nology, including nanoEHS/informatics. For example, the US NNI has been renovating its nanotechnology investment portfolio from 2006 to now (National Nanotechnology Initiative 2004, 2007, 2011a, 2014) to strengthen nanoEHS, commercialization, and in-ternational policy harmonization. But Korea still uses the same investment portfolio since 2001, and its first time collecting and opening the nanoEHS budget to the public was in 2013 (National Science & Technol-ogy Council, 2013). Compared to the US/EU, Korean nanotechnology plans have relatively weak alignments ranging national innovation policy, nanotechnology development strategy, coherent interagency collabora-tion, commercialization, and securing safe usage.
Fig. 3 Changes in numbers of products related to nanotechnology of US, Germany, and Korea
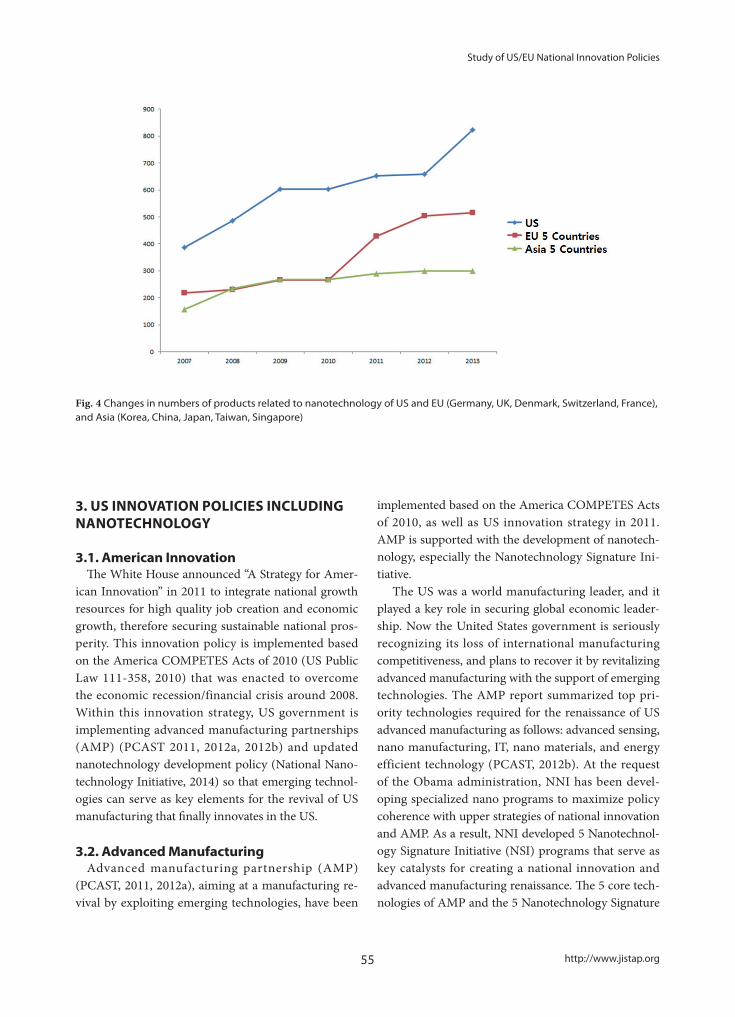
55 http://www.jistap.org
Study of US/EU National Innovation Policies
3. US INNOVATION POLICIES INCLUDING NANOTECHNOLOGY
3.1. American InnovationThe White House announced “A Strategy for Amer-
ican Innovation” in 2011 to integrate national growth resources for high quality job creation and economic growth, therefore securing sustainable national pros-perity. This innovation policy is implemented based on the America COMPETES Acts of 2010 (US Public Law 111-358, 2010) that was enacted to overcome the economic recession/financial crisis around 2008. Within this innovation strategy, US government is implementing advanced manufacturing partnerships (AMP) (PCAST 2011, 2012a, 2012b) and updated nanotechnology development policy (National Nano-technology Initiative, 2014) so that emerging technol-ogies can serve as key elements for the revival of US manufacturing that finally innovates in the US.
3.2. Advanced ManufacturingAdvanced manufacturing partnership (AMP)
(PCAST, 2011, 2012a), aiming at a manufacturing re-vival by exploiting emerging technologies, have been
implemented based on the America COMPETES Acts of 2010, as well as US innovation strategy in 2011. AMP is supported with the development of nanotech-nology, especially the Nanotechnology Signature Ini-tiative.
The US was a world manufacturing leader, and it played a key role in securing global economic leader-ship. Now the United States government is seriously recognizing its loss of international manufacturing competitiveness, and plans to recover it by revitalizing advanced manufacturing with the support of emerging technologies. The AMP report summarized top pri-ority technologies required for the renaissance of US advanced manufacturing as follows: advanced sensing, nano manufacturing, IT, nano materials, and energy efficient technology (PCAST, 2012b). At the request of the Obama administration, NNI has been devel-oping specialized nano programs to maximize policy coherence with upper strategies of national innovation and AMP. As a result, NNI developed 5 Nanotechnol-ogy Signature Initiative (NSI) programs that serve as key catalysts for creating a national innovation and advanced manufacturing renaissance. The 5 core tech-nologies of AMP and the 5 Nanotechnology Signature
Fig. 4 Changes in numbers of products related to nanotechnology of US and EU (Germany, UK, Denmark, Switzerland, France), and Asia (Korea, China, Japan, Taiwan, Singapore)
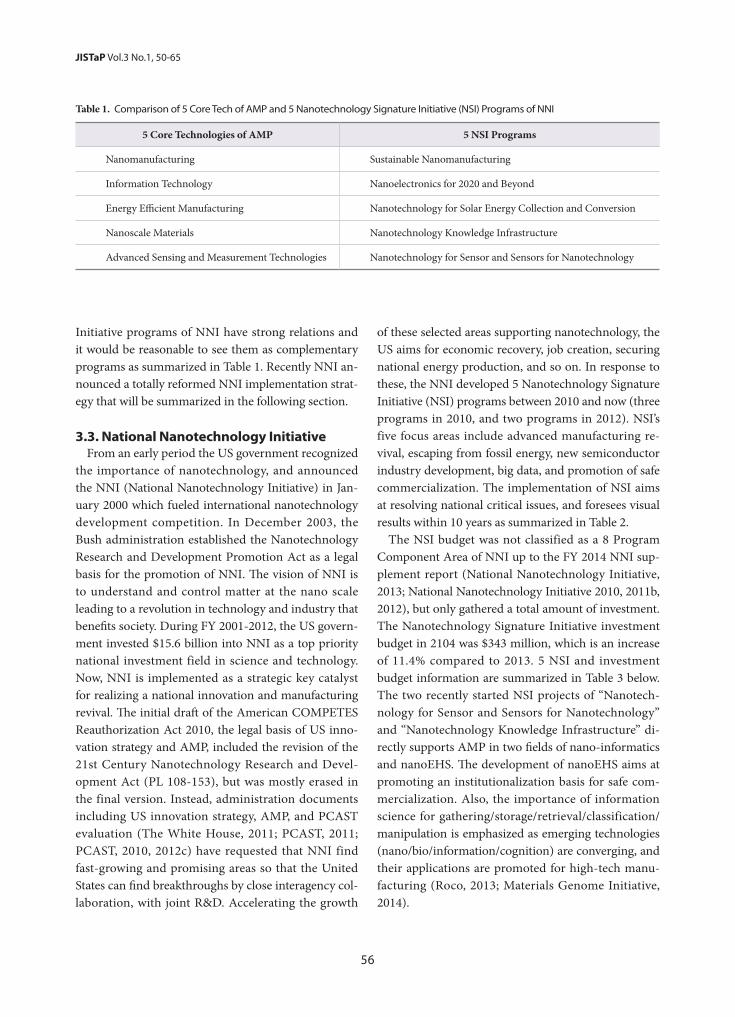
56
JISTaP Vol.3 No.1, 50-65
Initiative programs of NNI have strong relations and it would be reasonable to see them as complementary programs as summarized in Table 1. Recently NNI an-nounced a totally reformed NNI implementation strat-egy that will be summarized in the following section.
3.3. National Nanotechnology InitiativeFrom an early period the US government recognized
the importance of nanotechnology, and announced the NNI (National Nanotechnology Initiative) in Jan-uary 2000 which fueled international nanotechnology development competition. In December 2003, the Bush administration established the Nanotechnology Research and Development Promotion Act as a legal basis for the promotion of NNI. The vision of NNI is to understand and control matter at the nano scale leading to a revolution in technology and industry that benefits society. During FY 2001-2012, the US govern-ment invested $15.6 billion into NNI as a top priority national investment field in science and technology. Now, NNI is implemented as a strategic key catalyst for realizing a national innovation and manufacturing revival. The initial draft of the American COMPETES Reauthorization Act 2010, the legal basis of US inno-vation strategy and AMP, included the revision of the 21st Century Nanotechnology Research and Devel-opment Act (PL 108-153), but was mostly erased in the final version. Instead, administration documents including US innovation strategy, AMP, and PCAST evaluation (The White House, 2011; PCAST, 2011; PCAST, 2010, 2012c) have requested that NNI find fast-growing and promising areas so that the United States can find breakthroughs by close interagency col-laboration, with joint R&D. Accelerating the growth
of these selected areas supporting nanotechnology, the US aims for economic recovery, job creation, securing national energy production, and so on. In response to these, the NNI developed 5 Nanotechnology Signature Initiative (NSI) programs between 2010 and now (three programs in 2010, and two programs in 2012). NSI’s five focus areas include advanced manufacturing re-vival, escaping from fossil energy, new semiconductor industry development, big data, and promotion of safe commercialization. The implementation of NSI aims at resolving national critical issues, and foresees visual results within 10 years as summarized in Table 2.
The NSI budget was not classified as a 8 Program Component Area of NNI up to the FY 2014 NNI sup-plement report (National Nanotechnology Initiative, 2013; National Nanotechnology Initiative 2010, 2011b, 2012), but only gathered a total amount of investment. The Nanotechnology Signature Initiative investment budget in 2104 was $343 million, which is an increase of 11.4% compared to 2013. 5 NSI and investment budget information are summarized in Table 3 below. The two recently started NSI projects of “Nanotech-nology for Sensor and Sensors for Nanotechnology” and “Nanotechnology Knowledge Infrastructure” di-rectly supports AMP in two fields of nano-informatics and nanoEHS. The development of nanoEHS aims at promoting an institutionalization basis for safe com-mercialization. Also, the importance of information science for gathering/storage/retrieval/classification/manipulation is emphasized as emerging technologies (nano/bio/information/cognition) are converging, and their applications are promoted for high-tech manu-facturing (Roco, 2013; Materials Genome Initiative, 2014).
Table 1. Comparison of 5 Core Tech of AMP and 5 Nanotechnology Signature Initiative (NSI) Programs of NNI
5 Core Technologies of AMP 5 NSI Programs
Nanomanufacturing Sustainable Nanomanufacturing
Information Technology Nanoelectronics for 2020 and Beyond
Energy Efficient Manufacturing Nanotechnology for Solar Energy Collection and Conversion
Nanoscale Materials Nanotechnology Knowledge Infrastructure
Advanced Sensing and Measurement Technologies Nanotechnology for Sensor and Sensors for Nanotechnology
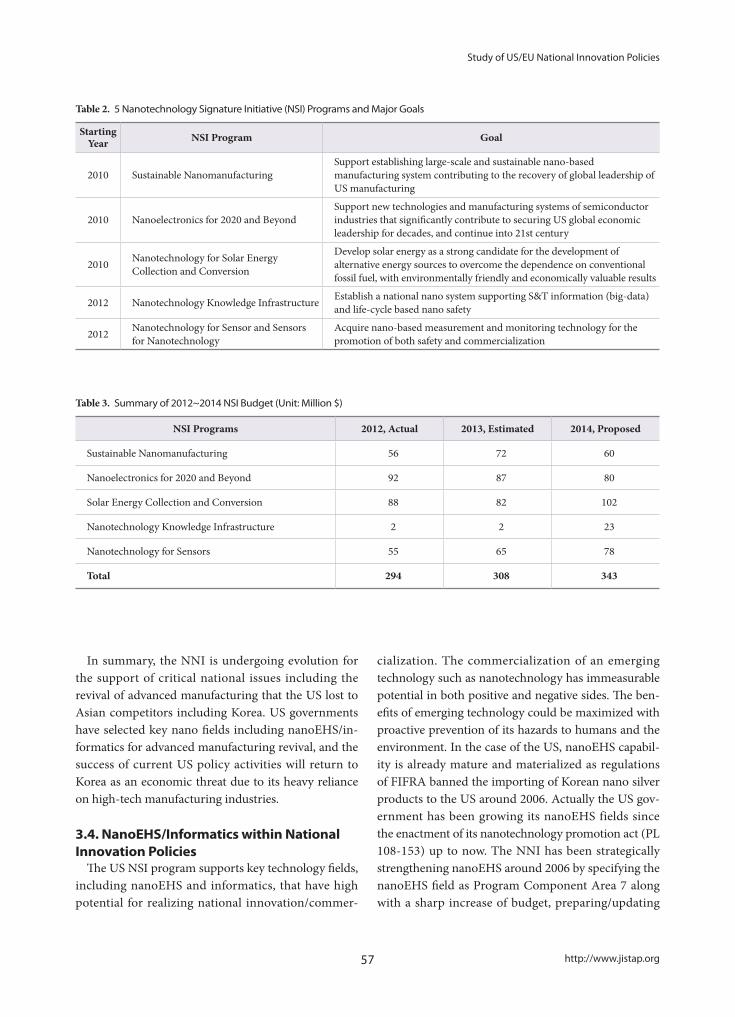
57 http://www.jistap.org
Study of US/EU National Innovation Policies
Table 2. 5 Nanotechnology Signature Initiative (NSI) Programs and Major Goals
Starting Year NSI Program Goal
2010 Sustainable NanomanufacturingSupport establishing large-scale and sustainable nano-based manufacturing system contributing to the recovery of global leadership of US manufacturing
2010 Nanoelectronics for 2020 and BeyondSupport new technologies and manufacturing systems of semiconductor industries that significantly contribute to securing US global economic leadership for decades, and continue into 21st century
2010 Nanotechnology for Solar Energy Collection and Conversion
Develop solar energy as a strong candidate for the development of alternative energy sources to overcome the dependence on conventional fossil fuel, with environmentally friendly and economically valuable results
2012 Nanotechnology Knowledge Infrastructure Establish a national nano system supporting S&T information (big-data) and life-cycle based nano safety
2012 Nanotechnology for Sensor and Sensors for Nanotechnology
Acquire nano-based measurement and monitoring technology for the promotion of both safety and commercialization
Table 3. Summary of 2012~2014 NSI Budget (Unit: Million $)
NSI Programs 2012, Actual 2013, Estimated 2014, Proposed
Sustainable Nanomanufacturing 56 72 60
Nanoelectronics for 2020 and Beyond 92 87 80
Solar Energy Collection and Conversion 88 82 102
Nanotechnology Knowledge Infrastructure 2 2 23
Nanotechnology for Sensors 55 65 78
Total 294 308 343
In summary, the NNI is undergoing evolution for the support of critical national issues including the revival of advanced manufacturing that the US lost to Asian competitors including Korea. US governments have selected key nano fields including nanoEHS/in-formatics for advanced manufacturing revival, and the success of current US policy activities will return to Korea as an economic threat due to its heavy reliance on high-tech manufacturing industries.
3.4. NanoEHS/Informatics within National Innovation Policies
The US NSI program supports key technology fields, including nanoEHS and informatics, that have high potential for realizing national innovation/commer-
cialization. The commercialization of an emerging technology such as nanotechnology has immeasurable potential in both positive and negative sides. The ben-efits of emerging technology could be maximized with proactive prevention of its hazards to humans and the environment. In the case of the US, nanoEHS capabil-ity is already mature and materialized as regulations of FIFRA banned the importing of Korean nano silver products to the US around 2006. Actually the US gov-ernment has been growing its nanoEHS fields since the enactment of its nanotechnology promotion act (PL 108-153) up to now. The NNI has been strategically strengthening nanoEHS around 2006 by specifying the nanoEHS field as Program Component Area 7 along with a sharp increase of budget, preparing/updating

58
JISTaP Vol.3 No.1, 50-65
nanoEHS federal strategic development plans from 2006 to 2011 (National Nanotechnology Initiative 2006, 2008, 2011c), and institutionalizing nano safety as a regulation of FIFRA/TSCA. Such regulation capa-bilities of nanotechnology are now supporting national innovations of manufacturing.
Informatics is an important element of supporting advanced manufacturing revival. Informatics has the potential of minimizing time periods required for new material development toward commercialization, in-tegrating intelligent manufacturing processes, and ex-ploiting existing information for various purposes. The NNI launched its NKI program under NSI as of 2012 for stimulating nano informatics, for multiple reasons.
4. EU INNOVATION POLICIES INCLUDING NANOTECHNOLOGY
Similar to the US, the European Commission (EC) also realized the value of nanotechnology from early on and incubated nanotechnology as a key catalyst for resolving national economic and social issues. The im-portance of nanotechnology in EU policy can be found from past European Commission reports (Commission of European Communities, 2004), and in the recent trend of utilizing nanotechnology for realizing Euro-pean innovation that is included in the European 2020 Strategy as Key Enabling Technology (KET) (High-Lev-el Group on Key Enabling Technologies, 2011).
The document “concerning nanotechnology opinion on the strategy of the European Union (12/05/2004)” (Commission of European Communities, 2004) pro-
posed safe, integrated, and responsible development of nanotechnology. This trend is one setting the pace of European innovation policy so that the EU dominates global nano science/technology and responds to future needs regarding environment, health, and possible so-cial issues.
The European Action Plan 2005-2009 (24/09/2004) (Communication from the Commission to the Coun-cil, 2005) regarding nano science/technology devel-opment states 8 core areas as listed below to promote safe and responsible development of nanotechnology. The European Commission monitors the progress of this investment portfolio and the collaboration/partic-ipation of member countries from the early stages of nanotechnology development.
• Research, Development and Innovation• Infrastructure• Interdisciplinary Human Resources • Industrial Innovation• Integrating the Societal Dimension• Public EHS and Consumer Protection• International Cooperation• Implementing a Coherent/Visible Strategy at Euro-
pean-Level
4.1. EC Framework Program (FP) 7The EU has been developing nanotechnology in its
Framework Program (FP) as Nanoscience, Nanotech-nology, Materials, and New Production Technologies (NMP). Horizon 202 (2014-2020) is under implemen-tation as post FP7. The FP7 Cooperation program, budget, and related configuration are summarized in Fig. 5.
Fig. 5 FP7 Cooperation program, part of the budget and related configuration
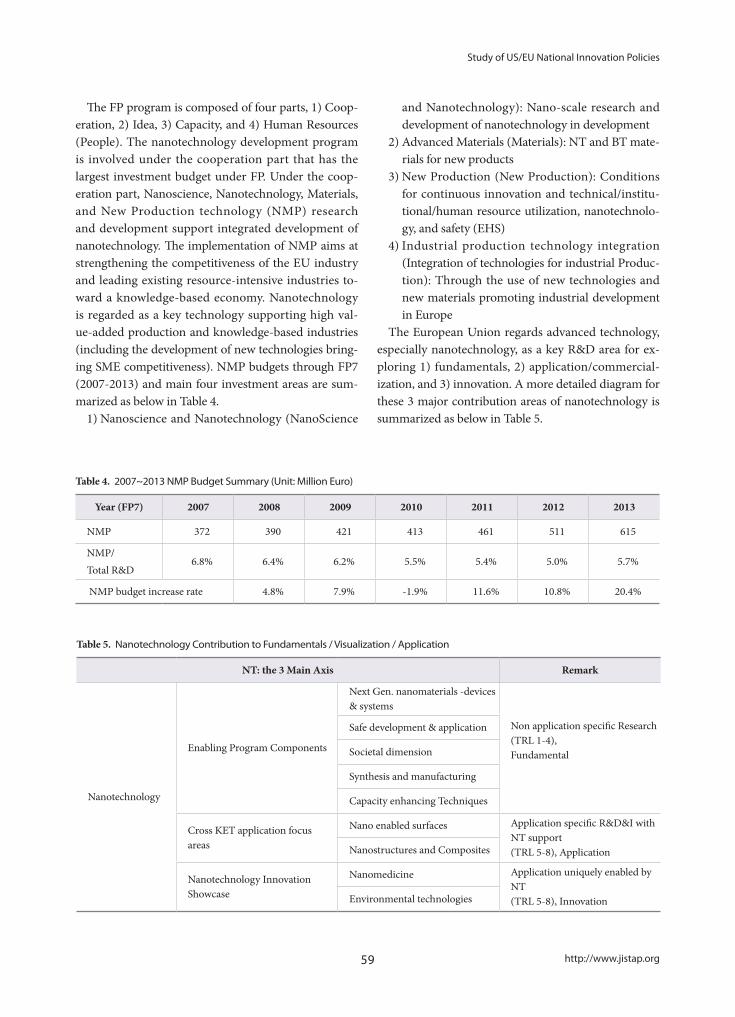
59 http://www.jistap.org
Study of US/EU National Innovation Policies
The FP program is composed of four parts, 1) Coop-eration, 2) Idea, 3) Capacity, and 4) Human Resources (People). The nanotechnology development program is involved under the cooperation part that has the largest investment budget under FP. Under the coop-eration part, Nanoscience, Nanotechnology, Materials, and New Production technology (NMP) research and development support integrated development of nanotechnology. The implementation of NMP aims at strengthening the competitiveness of the EU industry and leading existing resource-intensive industries to-ward a knowledge-based economy. Nanotechnology is regarded as a key technology supporting high val-ue-added production and knowledge-based industries (including the development of new technologies bring-ing SME competitiveness). NMP budgets through FP7 (2007-2013) and main four investment areas are sum-marized as below in Table 4.
1) Nanoscience and Nanotechnology (NanoScience
and Nanotechnology): Nano-scale research and development of nanotechnology in development
2) Advanced Materials (Materials): NT and BT mate-rials for new products
3) New Production (New Production): Conditions for continuous innovation and technical/institu-tional/human resource utilization, nanotechnolo-gy, and safety (EHS)
4) Industrial production technology integration (Integration of technologies for industrial Produc-tion): Through the use of new technologies and new materials promoting industrial development in Europe
The European Union regards advanced technology, especially nanotechnology, as a key R&D area for ex-ploring 1) fundamentals, 2) application/commercial-ization, and 3) innovation. A more detailed diagram for these 3 major contribution areas of nanotechnology is summarized as below in Table 5.
Table 4. 2007~2013 NMP Budget Summary (Unit: Million Euro)
Year (FP7) 2007 2008 2009 2010 2011 2012 2013
NMP 372 390 421 413 461 511 615
NMP/Total R&D
6.8% 6.4% 6.2% 5.5% 5.4% 5.0% 5.7%
NMP budget increase rate 4.8% 7.9% -1.9% 11.6% 10.8% 20.4%
Table 5. Nanotechnology Contribution to Fundamentals / Visualization / Application
NT: the 3 Main Axis Remark
Nanotechnology
Enabling Program Components
Next Gen. nanomaterials -devices & systems
Non application specific Research (TRL 1-4), Fundamental
Safe development & application
Societal dimension
Synthesis and manufacturing
Capacity enhancing Techniques
Cross KET application focus areas
Nano enabled surfaces Application specific R&D&I with NT support(TRL 5-8), ApplicationNanostructures and Composites
Nanotechnology Innovation Showcase
Nanomedicine Application uniquely enabled by NT(TRL 5-8), InnovationEnvironmental technologies
60
JISTaP Vol.3 No.1, 50-65
4.2. Horizon 2020Horizon 2020 is an integrated program of the exist-
ing Framework Program (FP), the Competitiveness & Innovation Programme (CIP), and the European Institute for Technology (EIT) to simplify the program operation and accessibility of participating institutes/researchers. The EU plans to invest approximately 40% of its entire R&D budgets through the Horizon 2020 program. Horizon 2020 is the new European growth and job creation program aiming for the recovery of Europe from economic crisis. Europe stresses that in-vesting in R&D is a solution to overcome the current economic crisis, and plans to allocate an R&D budget up to 3% of GDP by 2020. Horizon 2020 is investing in 3 main component areas of “Excellent Science,” “In-dustrial Leadership,” and “Societal Challenges.”
In particular, Horizon 2020 research and develop-ment was established by analyzing existing economic/social changes, therefore enables promoting innova-tion in broad areas including environment, climate change, aging society, and so on. These major goals are achieved by collaboration of industry-academia-public institutions and integrated/coherent policies covering R&D-education-innovation system. The Nanotechnol-ogy (NMP) in Horizon 2020 acts in the ‘leadership in Enabling and Industrial Technology (LEIT)’ section. Nanotechnology is a key enabling technology (KET) to recover the competitiveness of European indus-tries, and focuses on crossing the valley of death for societal challenges. Nanotechnology serves as a key catalyst technology supporting these major goals by developing five major components as follows: 1) the next generation nano-materials, nano-devices and nano-systems, 2) safe development and applications of Nanotechnologies, 3) the social dimension of Nan-otechnology, 4) Efficient synthesis and Manufacturing of Nanomaterials, Components, and Systems, and 5) Capacity enhancing techniques, measuring methods and Equipment.
In order to provide the solutions for societal chal-lenges, European Commission started European Eco-nomic Recovery Plan (Commission of European Com-munities, 2008) that includes 3 PPP(public-private partnership) programs of Factories of the Future(FoF), Energy efficient Building(EeB), and Green Car(GC).
4.3. NanoEHS/Informatics within National Innovation Policies
Similar to the US, the EC also regards nanotechnol-ogy as a national innovation catalyst. Therefore the nano enabled commercialization promotion policy is paired with the development of nanoEHS throughout the European Action Plan 2005-2009, FP 7, and Hori-zon 2020. For example, the FP7 program covers activ-ities from fundamental research to commercialization of technologies (innovation) of nanotechnologies in DG Research and development (RTD). NanoEHS was one of the key parts in 3) New production as well as The NanoSafety Cluster (NSC) initiative that was orga-nized in 2009 to maximize synergies between the FP6 and FP7 projects, addressing all aspects of Nanosafety. Horizon 2020 (Post-FP7) was started in 2014 and set to run until 2020, and Nanotechnology as NMP is lo-cated under ‘Industrial Leadership’ and ‘Leadership in Enabling and Industrial technologies (LEIT),’ and fo-cuses on the level of technological readiness (TRL) 3/4 - 8. Nanotechnolgy is one of the 6 key enabling tech-nologies (KETs) driving competitiveness and growth opportunities, contributing to solving societal chal-lenges with safe development/applications. Like the US regulation of FIFRA/TSCA, the EC also established REACH regulation that proactively monitors potential hazards of nanomaterials. In both the US/EU cases, their recent nanotechnology development direction is highly aligned with national innovation strategies of promoting nano enabled commercialization paired with nanoEHS. The EC has been collecting ongoing nanoEHS programs and budgets that are spread out over FP6-7 under the program of the nanosafety clus-ter since 2009. The EC supported 13 nanoEHS pro-grams with a budget of 31 million euro under FP6, and 34 programs with 106 million euro under FP7. Their annual reports summarizing nanoEHS programs each year are available from the project home page (http://www.nanosafetycluster.eu/).
Nano policy elements of EU are not clearly separate such as in the US NNI program, but are integrated in the national program of Horizon 2020. The impor-tance/interconnection of advanced manufacturing, nanotechnology, informatics for smart/fast production, and nanoEHS for safe commercialization are already fused in plans such as Factory of the Future (http://ec.europa.eu/research/participants/portal/desktop/en/
61 http://www.jistap.org
Study of US/EU National Innovation Policies
opportunities/fp7/calls/fp7-2013-nmp-ict-fof.html) in FP7 and Horizon 2020 (http://ec.europa.eu/research/participants/portal/desktop/en/opportunities/h2020/calls/h2020-fof-2014.html#tab2).
5. KOREAN INNOVATION POLICIES IN-CLUDING NANOTECHNOLOGY
The mainstream of US/EU nanotechnology develop-ment policies are focused on application/commercial-ization goals that finally support national innovation policy. But Korean nanotechnological achievements are still weighted on fundamental/basic areas (Bae et al., 2013), and application/commercialization capaci-ties show negative signs as described in Fig. 3. Below, the authors summarize limitations of Korean nano policies, and contrast the progress of US/EU policies to suggest possible future improvements for Korean nano policies.
5.1. Presidential Election PledgeAs a reminder, the main focus of global nanotech-
nology development trends is shifting from funda-mental exploration to innovation/commercialization. Also, US/EU nanotechnology development policies are horizontally and vertically interconnected with neighboring policies to catalyze national innovation and commercialization. The Korean government also understands the importance of nanotechnology, and President Park Geun-Hye highlighted nanotechnology as an important supporter for creative economic policy (Park, 2012).
5.2. National Comprehensive Development Plan for Nanotechnology (NCDPN)
Since 2001, the South Korea government has been implementing the National Comprehensive Develop-ment Plan for Nanotechnology (NCDPN), revising it every five years. The first NCDPN (2001-2005) was planned to complete constructing major infrastruc-tures within 5 years, and to achieve 10 world-top class technologies within 10 years. The second phase of NCDPN (2006-2010) was aimed at 3 major goals of becoming one of the top 3 nano competitive countries, preempting emerging markets by fusing with existing IT·BT·ET, and realizing the goal of a safe/prosperous
country by 2015. The 3rd phase of NCDPN (2010-2020) was established to realize 4 major goals of achieving 30 top world-level practical skills, building infrastructure for research/education, creating nano-technology based industries, and strengthening social/ethical responsibilities (National Nanotechnology Pol-icy Center, 2012).
Through phases 1-2 of NCDPN, South Korea achieved building bases for nano R&D and indus-trialization. The implementation of the 3rd NCDPN achieved a significant increase of nano R&D budgets responding to social/market demand, and challenged making 30 core technologies for promoting nano com-mercialization. In particular, interagency collaboration was emphasized to respond to nanotechnology pre-oc-cupation by the US/EC/Japan, support green growth, and create a new growth engine for society.
Up to now the Korean government has successively incubated the competitiveness of nanotechnology by implementing NCDPN. Recently the Korean gov-ernment is beginning to reconsider the importance of promoting nano/convergence technologies as a breakthrough for innovation and economic growth. Superficially, Korea has been following global nano-technology development trends well, but related data and indicators show negative signs of stagnation/decrease in Korean nanotechnology competitiveness and commercialization capabilities. Recently there have been discussions for the necessity of reforming the nanotechnology development policy framework to support nano/convergence based industries in a semi-nar held by the National Party (Kim, E.-D., 2013) and in research (Bae, 2013).
5.3. NanoEHS/Informatics within National Innovation Policies
The US/EU have been strengthening their national innovation chains of utilizing nanotechnology by ren-ovating nanotechnology development for the realiza-tion of national innovation strategies, executing them by manipulating R&D budgets, and preparing a legal basis for sustainable application. Compared to the US/EU, Korean nanotechnology development is argued to have weak points as described below.
Korean nanotechnology policy has maintained the same investment portfolio since 2001 by fixing it as 3 components (R&D, infra, and education), but has been
62
JISTaP Vol.3 No.1, 50-65
adopting international core issues of nanotechnology development including innovation and nanoEHS. However, investment budgets for key issues including nanoEHS were rarely monitored, and therefore it is difficult to evaluate progress (National Nanotechnol-ogy Policy Center, 2012). The US has been collecting nanoEHS budgets from 2006, and the EU has been managing nanoEHS budgets and programs under the name of the nanosafety cluster since 2009. In the case of Korea, the importance of nanoEHS has been em-phasized from the 3rd phase NCDPN by planning for raising nanoEHS budgets up to 7% over all. However, it is very recent that the nano EHS investment amount was officially monitored, only since the 2013 Korean Nanotechnology Annual Implementation Report (Na-tional Science & Technology Council, 2013). Even still, national nano related budget assessment had showed approximately 2x differences depending on the source (collection from agencies participating in NCDPN, and the National Science & Technology Information Service under National Science & Technology Coun-cil), and this issue is improved since the 2014 Korean Nanotechnology Annual Implementation Report (National Science & Technology Council, 2014). In the case of the ‘1st national comprehensive nano safety plan (2012-2016)’ (National Science & Technology Council (2011) led by the Ministry of Environment, this interagency collaboration plan is encountering dif-ficulties in finding clear connections with the Korean Nanotechnology Promotion Act or NCDPN, meaning a weak national level of policy alignment. Also, Korea still does not have a developed legal tool supporting sustainable usage of nano e-material/products such as FIFRA, TSCA, and REACH in the US/EU cases.
Compared to the US/EU situations, Korean de-velopment of nanoEHS in R&D and legal tools is not clearly aligned for contributing nano based commer-cialization that finally supports a national innovation chain. Now the Korean government is putting prime importance on creative economy policy, but the nan-otechnology policy design contributing to national innovation with economic growth is still questionable in various aspects such as controlling nano invest-ment portfolios, supporting targeted technology fields including nano commercialization/nanoEHS, and synchronizing them with national innovation through interagency collaboration. In the case of informatics,
it is too early to discuss whether national innovation policy clearly covers nano informatics for advanced manufacturing. Overall, Korean interpolicy connec-tions of utilizing nano for national innovation need further development when compared with the US/EU.
Recently the Korean national assembly held a sin-gle forum sharing the issues of Korean nano policies described above, and discussed the necessity of revis-ing its nanotechnology development promotion act (Kim, E.-D., 2013), including strengthening national nanosafety fields that support national innovation. The current nanotechnology promotion act and NCDPN require strengthening nanoEHS more systematically. On the continuation of this forum, a nanotechnology development promotion act revision bill was proposed (Kim E.-D. et al., 2014b) for first including nanoEHS elements.
6. CONCLUSION
Stimulated by the rapid chasing of Asian followers including Korea, the US/EU changed the focus of their nanotechnology development policies from funda-mental exploration to application/commercialization. US/EU nanotechnology policies and legislative/ad-ministrative activities have been aligned with national visions over the last decade to maximize national capa-bilities for national innovation and societal challenges. These US/EU trends are reflected in 2014 NNI strategy and EU KET policy goals that support advanced man-ufacturing revival.
Compared to the US/EU, Korean nano policies show limitations for supporting nanotechnology commer-cialization and national innovation. The authors have investigated these weaknesses throughout previous original research (Bae S.-H. et al., 2013) and the sup-port seminar held in the National Party (Kim E.-D., 2013) with the policy report of nanotechnology pro-motion act amendment direction (Kim, E.-D., 2014). These works discuss the necessity of promoting inter-agency collaboration with the required amendment direction of the Nanotechnology Development Pro-motion Act. Based on these activities, National Party member Kim Eul-Dong currently a proposed nano-technology promotion act amendment bill (Kim, E.-D., 2014b). The main purpose of the amendment bill

63 http://www.jistap.org
Study of US/EU National Innovation Policies
is strengthening nano commercialization and EHS/informatics to further support the Korean policy of creative economy. Initiated by this law revision, addi-tional national efforts should be continued to reinforce a national innovation ecosystem by promoting nano commercialization with EHS/informatics.
US/EU policies have been focusing on advanced manufacturing revival with the support of nanotech-nology commercialization capabilities as a counter-attack against fast-followers, and Korea currently shows negative signs of decreasing commercialization capabilities and social acceptance of nano applications. If Korea does not react to US/EU nano policies of strengthening advanced manufacturing, then its con-sequences might return to us as an economic threat due to the heavy reliance of high-tech manufacturing industries.
REFERENCES
Bae, S.-H., Lim, J.-S., Shin, K.-M., Kim, C.-W., Kang, S.-K., & Shin., M. (2013). The innovation policy of nanotechnology development and convergence for the new Korean government. Journal of Nanopar-ticles Research, 15, 2072.
Cientifica (2011). Global funding of Nanotechnologies and its impact. Wales: Cientifica.
Commission of European Communities (2004). Com-munication from the Commission - Towards a European strategy for nanotechnology. Brussels: European Commission.
Communication from the Commission to the Coun-cil (2005). The European Parliament and the Economic and Social Committee - Nanosciences and nanotechnologies: An action plan for Europe 2005-2009. Brussels: European Commission.
Commission of European Communities (2008). Com-munication from the Commission to the Europe-an Council: A European Economic Recovery Plan, Brussels: European Commission.
Foxon T., Makuch Z., Mata, M., & Pearson, P. (2004). Innovation systems and policy-making processes for the transition to sustainability. Proceedings of the 2003 Berlin Conference on the Human Dimen-sions of Global Environmental Change, Environ-mental Policy Research Centre, Berlin (pp. 96-112).
High-Level Group on Key Enabling Technologies (2011). Final report: High-level expert groups on KETs. Brussels: European Commission.
International Energy Agency (2009). Ensuring green growth in a time of economic crisis: The role of energy technology. IEA Publishing.
Kim, E.-D. (2013). Seminar on amendment of Nano-technology Development Promotion Act for the realization of creative economy. Seoul: National Assembly of Korea.
Kim, E.-D. (2014a). Amendment direction for Nano-technology Development Promotion Act. Seoul: National Assembly of Korea.
Kim, E.-D., & 22 National Party Members (2014b). Re-vision bill of Nanotechnology Development Pro-motion Act. Seoul: National Assembly of Korea.
LUX Research (2010). National competitiveness rank-ing by nanotechnology. Boston: LUX Research.
Materials Genome Initiative (2014). Materials Genome Initiative strategic plan. Washington DC: National Science and Technology Council.
McKinsey Global Institute (2012). Manufacturing the future: The next era of global growth and innova-tion. New York: McKinsey & Company.
Ministry of Trade Industry & Energy (2013). 2013 Technology level evaluation. Seoul: Ministry of Trade Industry & Energy
NANoFutures (2012). Integrated research and indus-trial roadmap for European NT. Brussels: Europe-an Commission.
National Nanotechnology Initiative (2000). National Nanotechnology Initiative: The initiative and its implementation plan. Washington, DC: National Science and Technology Council.
National Nanotechnology Initiative (2004). National Nanotechnology Initiative Strategic Report. Wash-ington, DC: National Science and Technology Council.
National Nanotechnology Initiative (2006). Environ-mental, health, and safety research needs for en-gineered nanoscale materials. (September, 2006). Washington, DC: National Science and Technolo-gy Council.
National Nanotechnology Initiative (2007). The Na-tional Nanotechnology Initiative strategic report. Washington, DC: National Science and Technolo-gy Council.

64
JISTaP Vol.3 No.1, 50-65
National Nanotechnology Initiative (2008). Strategy for nanotechnology-related environmental, health, and safety research. Washington, DC: National Science and Technology Council.
National Nanotechnology Initiative (2010). NNI sup-plement to the president’s 2011 budget. Washing-ton, DC: National Science and Technology Coun-cil.
National Nanotechnology Initiative (2011a). National Nanotechnology Initiative strategic report. Wash-ington, DC: National Science and Technology Council.
National Nanotechnology Initiative (2011b). NNI supplement to the president’s 2012 budget. Wash-ington, DC: National Science and Technology Council.
National Nanotechnology Initiative (2011c). Envi-ronmental, Health, and Safety (EHS) research strategy. Washington, DC: National Science and Technology Council.
National Nanotechnology Initiative (2012). NNI sup-plement to the president’s 2013 budget. Washing-ton, DC: National Science and Technology Coun-cil.
National Nanotechnology Initiative (2013). NNI sup-plement to the president’s 2014 budget. Washing-ton, DC: National Science and Technology Coun-cil.
National Nanotechnology Initiative (2014). National Nanotechnology Initiative strategic report. Wash-ington, DC: National Science and Technology Council.
National Nanotechnology Policy Center (2012). Na-tional nanotechnology policy direction for global competitiveness of Korea Economy. Seoul: Korea Institute of Science and Technology Information
National Science & Technology Council (2011). Nano safety management master plan (2012-2016). Seoul: National Science & Technology Council.
National Science & Technology Council (2013). 2013 annual implementation plan of nanotechnology. Seoul: National Science & Technology Council.
National Science & Technology Council (2014). 2014 annual implementation plan of nanotechnology. Seoul: National Science & Technology Council.
Organization for Economic Co-operation and Devel-opment (1997). National innovation systems. Par-
is: OECD Publications.Organization for Economic Co-operation and Devel-
opment (2005). The measurement of scientific and technological activities. Paris: OECD Publications.
Park G.-H. (2012). Presidential election pledge for 18th presidential election. Seoul: Saenuri National Party.
Pisano, G. P., & Willy, C. S. (2009). Restoring Amer-ican competitiveness. Harvard Business Review, Boston: Harvard Business Publishing.
President’s Council of Advisors on Science and Tech-nology (2010). Report to the president and con-gress on the third assessment of the National Nan-otechnology Initiative. Washington, DC: National Science and Technology Council.
President’s Council of Advisors on Science and Technology (2011). Report to the president on ensuring American leadership in advanced manu-facturing. Washington, DC: National Science and Technology Council.
President’s Council of Advisors on Science and Tech-nology (2012a). Report to the president capturing a domestic competitive advantage in advanced manufacturing. Washington, DC: National Sci-ence and Technology Council.
President’s Council of Advisors on Science and Tech-nology (2012b). Report of the advanced manu-facturing partnership steering committee, annex 1: Technology development workstream report. Washington, DC: National Science and Technolo-gy Council.
President’s Council of Advisors on Science and Tech-nology (2012c). Report to the president and con-gress on the fourth assessment of the National Nanotechnology Initiative. Washington, DC: Na-tional Science and Technology Council.
Roco, M. C., Bainbridge, W. S., Tonn B., & Whitesides G. (2013). Convergence of knowledge, technology, and society: Beyond convergence of nano-bio-in-fo-cognitive technologies. Lancaster, PA: World Technology Evaluation Center.
Song W.-J. (2009). Policy theory of national innovation system. Seoul: Science and Technology Policy In-stitute, STEPI Working Paper Series, WP 2009-01.
The White House (2013). The president’s plan to make America a magnet for jobs by investing in manu-facturing. Washington, DC: The White House.

65 http://www.jistap.org
Study of US/EU National Innovation Policies
The White House (2014). Remarks by the president on the National Network for Manufacturing Innova-tion. Washington, DC: The White House.
The White House (January, 2013). Blueprint for an America built to last. Washington, DC: The White House.
The White House. (February, 2011). A strategy for American innovation, securing our economic growth and prosperity. Washington, DC: The White House.
The White House. (September, 2009). A strategy for American innovation: Driving towards sustainable growth and quality jobs. Washington, DC: The White House.
US Public Law 111-358 (January, 2010). America COMPETES Reauthorization Act of 2010. Wash-ington, DC: US Congress.
Wiggins, R., & Ruefli T. W. (2012). Schumpeter’s ghost: Is hypercompetition making the best of times shorter? Strategic Management J, 26, 887–911.
Woodrow Wilson Center (2013). Nanotechnology consumer product inventory. 2013.10 update. Retrieved from http://www.nanotechproject.org/inventories/consumer/
66
JISTaPJournal of Information Science Theory and Practice
http://www.jistap.org
Contribution of Journals to Academic Disciplines
Hye-Young Lee * Department of Academic Management Korea Advanced Institute of Science and Technology Republic of KoreaE-mail: [email protected]
Open Access
Accepted date: March 19, 2015Received date: November 14, 2014
*Corresponding Author: Hye-Young Lee LibrarianDepartment of Academic Management Korea Advanced Institute of Science and Technology Republic of KoreaE-mail: [email protected]
All JISTaP content is Open Access, meaning it is accessible onlineto everyone, without fee and authors’ permission. All JISTaP content is published and distributed under the terms of the Creative Commons Attribution License (http:/ creativecommons.org/licenses/by/3.0/). Under this license, authors reserve the copyright for their content; however, they permit anyone to unrestrictedly use, distribute, and reproduce the content in any medium as far as the original authors and source are cited. For any reuse, redistribution, or reproduction of a work, users must clarify the license terms under which the work was produced.
ⓒ Hye-Young Lee, 2015
ABSTRACTThis research uses a new approach to analyze the extent of influence journal papers have on the progress of varied research fields by estimation of subject-based influence on research other than impact factor that relies on cita-tion index. It is initiated with the hypothesis that earlier established citation relations between journal and citing paper, which reveals the research field that contains the highest citation index and hence has received the great-est contribution from a particular journal, would have inconsistent contribution to the research field over the year of journal publication. The target research is primarily 128 journal papers and 4,123 citing papers from Information Systems Research published in the years 2001, 2004, 2007, and 2010. The characteristics of citation history and hall-marks of research field of citing papers were studied and analysis on significant distinction between citing fields based on the year of publication was performed. The analysis results show the order of citation rate to be highest from Computer Science (2,221 cases), Business & Economics (2,191 cases), and Information Science & Library Science (1,901 cases). The citation history of the jour-nal, nonetheless, indicates increase in citation during 2-3 years after the earliest publication till it achieves constant citation. The statistical analysis shows significant variation in citing fields in accordance with the publication year; especially in 2010, journal contribution has increased in the fields of Business & Economics, Operations Research & Management Science, and Health Care Sciences & Services but, however, is reduced in Education & Educational Research and Social Sciences - Other Topics.
Keywords: citation analysis, contribution to progress of research fields, subject-cluster, ANOVA
Research PaperJ. of infosci. theory and practice 3(1): 66-76, 2015http://dx.doi.org/10.1633/JISTaP.2015.3.1.5
67 http://www.jistap.org
Contribution of Journals
1. INTRODUCTION
Journal papers are a highly representative form of scholarly research source. Individual journal pa-pers comprise an assembly, a so called journal, and progressively generate an assembly that is known as research field. Bellis (2009) depicted learning as a mosaic or jigsaw puzzle comprising a certain number of individual units (documents) growing together into subject related repositories (journals) that, in turn, evolve into the documentary source of well-es-tablished, eventually institutionalized specialties and disciplines. For these reasons, academic journals have been widely utilized as experimental data in academic research areas, and citation relationships of the jour-nal papers are used as analysis methods.
Research studies on the relations among the papers and performance evaluation of the papers have been done with quantitative analysis of cited references, such as co-citation, and bibliographic coupling was then used to create a map of influence to comprehend the subjective themes of the paper (Bellis, 2009). Subject-based analysis is a promising interest for re-search as it has potential practicality in research and generates quantitative data to provide direction for scientific research in the future. In particular, in par-allel to the SciVal database, it further enables searches in leading-edge areas and frail research areas among the research clusters to improve research performance and seek research collaboration in those areas.
Subject-based analysis is generally based on bib-liographic subjects, journals, and research areas in which papers are published. This research is aimed at finding the extent of influence by a paper, by tracking the citing paper of a specific paper from the journal in the particular research areas. Citation Index study can be subdivided, based on the features of the citation, into Cited reference study and Citing Paper study. Cit-ed reference study is research on previously-published research papers that is based on evidence and source of paper, while Citing Paper study is based on the im-pact and distribution over the fields of study.
This research is concerned about citing papers, and papers in the selected journal having citations of target journal papers are tracked. The research aims to in-dicate the field of application of target journal papers and to determine whether significant variation in the
scientific fields of the citing paper occur over publica-tion years. While recent studies on accumulated out-come (scholar journals) is in progress as an upcoming research trend (Astrom, 2007; Huang & Chang, 2014), this study focuses on the subject-relation of the paper and its cited paper, apart from general citation studies that utilize paper-paper referencing.
By focusing on the relationship between the repre-sentative research field and the other research fields of the scholar journal, this study aims to determine: i) whether subject impact relations is over time; and ii) whether there is significant change in subject impact factor, even within a specific research field, that de-pends on time of research.
2. RESEARCH METHODOLOGY
Citation relationships between journal papers can be represented by Citing Reference and Citing Pa-per metrics. Citing Reference refers to the database of the formerly existing research resources that are used as either reference or co-citing papers, papers citing with the given paper. Citing Paper refers to the research material that utilizes the reference of pub-lished papers. In the citation relation of target journal papers, citing papers are the papers contributing to the development of the target journal papers, while citing papers are the ones that, along with many other papers, cite the target journal papers. Therefore, target journal papers can be considered to have contributed to the developmental process of the citing papers. This study takes a statistical approach to examine how internationally published papers of field-specialized target journals are utilized in other research fields and how target journal papers citing in other journals are analyzed to estimate the contribution to field of target journal papers.
The major analysis tools used were clustering and One-way analysis of variance (One Way ANOVA); through the cluster of target journal papers’ subject and the cluster of the citing paper’s field, the research fields of the papers and citing papers were realized. With the use of One-way analysis of variance, we aim to analyze if there is significant relative deviation in contribution to progress in the field of citing paper by publication year of journal paper.
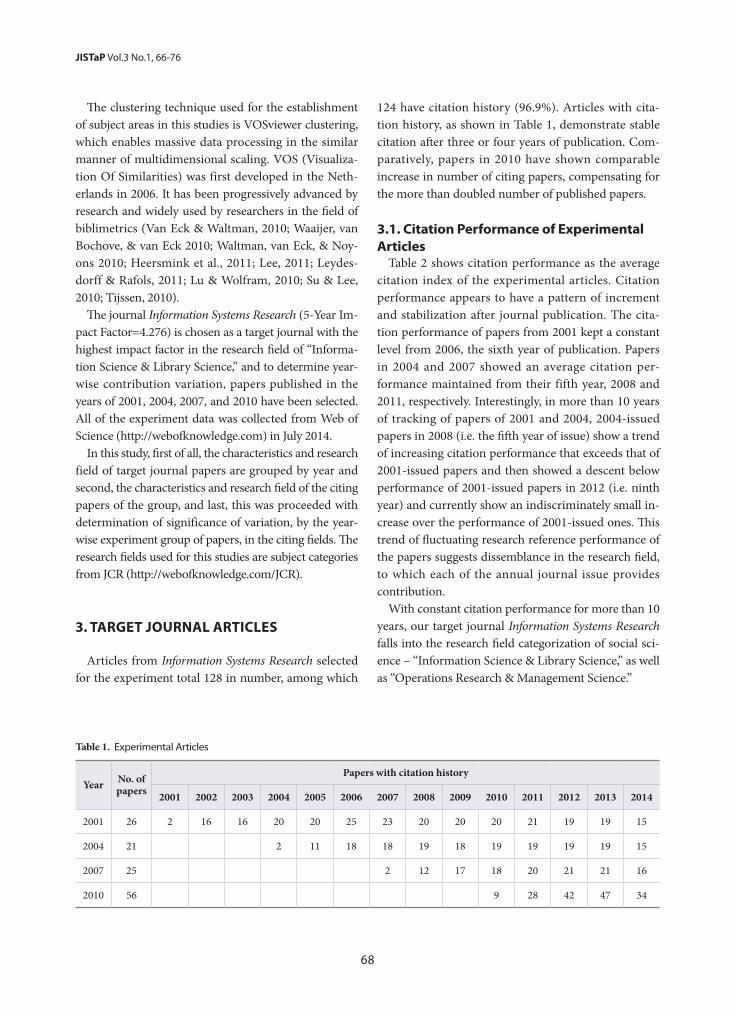
68
JISTaP Vol.3 No.1, 66-76
The clustering technique used for the establishment of subject areas in this studies is VOSviewer clustering, which enables massive data processing in the similar manner of multidimensional scaling. VOS (Visualiza-tion Of Similarities) was first developed in the Neth-erlands in 2006. It has been progressively advanced by research and widely used by researchers in the field of biblimetrics (Van Eck & Waltman, 2010; Waaijer, van Bochove, & van Eck 2010; Waltman, van Eck, & Noy-ons 2010; Heersmink et al., 2011; Lee, 2011; Leydes-dorff & Rafols, 2011; Lu & Wolfram, 2010; Su & Lee, 2010; Tijssen, 2010).
The journal Information Systems Research (5-Year Im-pact Factor=4.276) is chosen as a target journal with the highest impact factor in the research field of “Informa-tion Science & Library Science,” and to determine year-wise contribution variation, papers published in the years of 2001, 2004, 2007, and 2010 have been selected. All of the experiment data was collected from Web of Science (http://webofknowledge.com) in July 2014.
In this study, first of all, the characteristics and research field of target journal papers are grouped by year and second, the characteristics and research field of the citing papers of the group, and last, this was proceeded with determination of significance of variation, by the year-wise experiment group of papers, in the citing fields. The research fields used for this studies are subject categories from JCR (http://webofknowledge.com/JCR).
3. TARGET JOURNAL ARTICLES
Articles from Information Systems Research selected for the experiment total 128 in number, among which
124 have citation history (96.9%). Articles with cita-tion history, as shown in Table 1, demonstrate stable citation after three or four years of publication. Com-paratively, papers in 2010 have shown comparable increase in number of citing papers, compensating for the more than doubled number of published papers.
3.1. Citation Performance of Experimental Articles
Table 2 shows citation performance as the average citation index of the experimental articles. Citation performance appears to have a pattern of increment and stabilization after journal publication. The cita-tion performance of papers from 2001 kept a constant level from 2006, the sixth year of publication. Papers in 2004 and 2007 showed an average citation per-formance maintained from their fifth year, 2008 and 2011, respectively. Interestingly, in more than 10 years of tracking of papers of 2001 and 2004, 2004-issued papers in 2008 (i.e. the fifth year of issue) show a trend of increasing citation performance that exceeds that of 2001-issued papers and then showed a descent below performance of 2001-issued papers in 2012 (i.e. ninth year) and currently show an indiscriminately small in-crease over the performance of 2001-issued ones. This trend of fluctuating research reference performance of the papers suggests dissemblance in the research field, to which each of the annual journal issue provides contribution.
With constant citation performance for more than 10 years, our target journal Information Systems Research falls into the research field categorization of social sci-ence – “Information Science & Library Science,” as well as “Operations Research & Management Science.”
Table 1. Experimental Articles
Year No. of papers
Papers with citation history
2001 2002 2003 2004 2005 2006 2007 2008 2009 2010 2011 2012 2013 2014
2001 26 2 16 16 20 20 25 23 20 20 20 21 19 19 15
2004 21 2 11 18 18 19 18 19 19 19 19 15
2007 25 2 12 17 18 20 21 21 16
2010 56 9 28 42 47 34
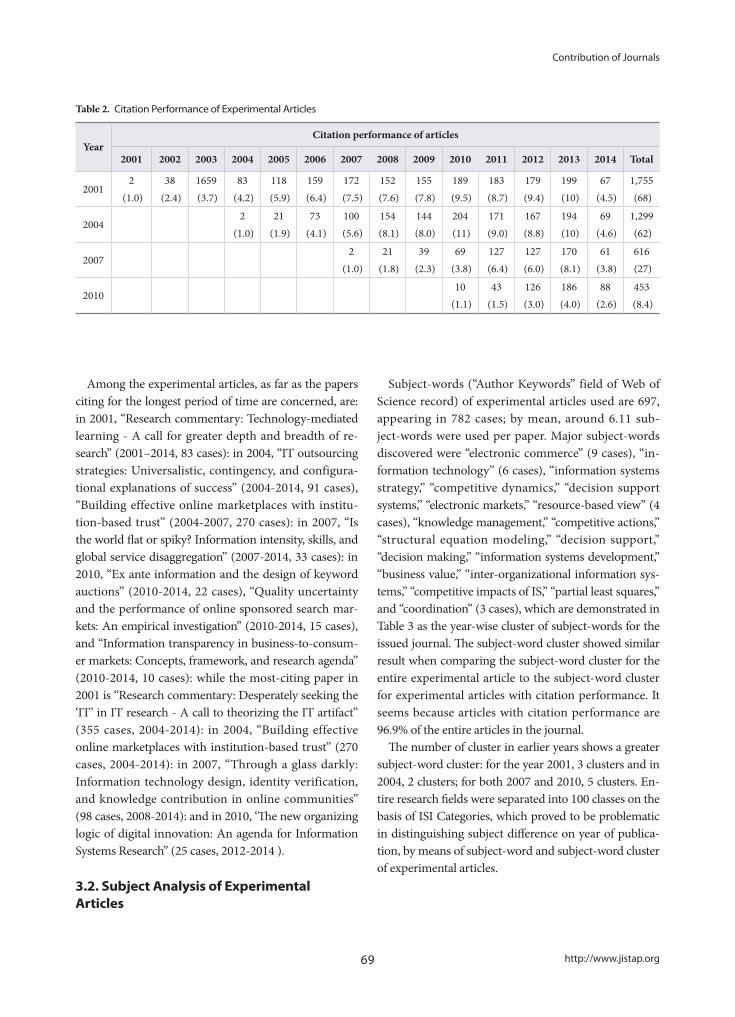
69 http://www.jistap.org
Contribution of Journals
Table 2. Citation Performance of Experimental Articles
YearCitation performance of articles
2001 2002 2003 2004 2005 2006 2007 2008 2009 2010 2011 2012 2013 2014 Total
20012
(1.0)38
(2.4)1659 (3.7)
83 (4.2)
118 (5.9)
159 (6.4)
172 (7.5)
152 (7.6)
155 (7.8)
189 (9.5)
183 (8.7)
179 (9.4)
199 (10)
67 (4.5)
1,755 (68)
20042
(1.0)21
(1.9)73
(4.1)100
(5.6)154
(8.1)144
(8.0)204 (11)
171 (9.0)
167 (8.8)
194 (10)
69 (4.6)
1,299 (62)
20072
(1.0)21
(1.8)39
(2.3)69
(3.8)127
(6.4)127
(6.0)170
(8.1)61
(3.8)616 (27)
201010
(1.1)43
(1.5)126
(3.0)186
(4.0)88
(2.6)453
(8.4)
Among the experimental articles, as far as the papers citing for the longest period of time are concerned, are: in 2001, “Research commentary: Technology-mediated learning - A call for greater depth and breadth of re-search” (2001–2014, 83 cases): in 2004, “IT outsourcing strategies: Universalistic, contingency, and configura-tional explanations of success” (2004-2014, 91 cases), “Building effective online marketplaces with institu-tion-based trust” (2004-2007, 270 cases): in 2007, “Is the world flat or spiky? Information intensity, skills, and global service disaggregation” (2007-2014, 33 cases): in 2010, “Ex ante information and the design of keyword auctions” (2010-2014, 22 cases), “Quality uncertainty and the performance of online sponsored search mar-kets: An empirical investigation” (2010-2014, 15 cases), and “Information transparency in business-to-consum-er markets: Concepts, framework, and research agenda” (2010-2014, 10 cases): while the most-citing paper in 2001 is “Research commentary: Desperately seeking the ‘IT’ in IT research - A call to theorizing the IT artifact” (355 cases, 2004-2014): in 2004, “Building effective online marketplaces with institution-based trust” (270 cases, 2004-2014): in 2007, “Through a glass darkly: Information technology design, identity verification, and knowledge contribution in online communities” (98 cases, 2008-2014): and in 2010, ‘The new organizing logic of digital innovation: An agenda for Information Systems Research” (25 cases, 2012-2014 ).
3.2. Subject Analysis of Experimental Articles
Subject-words (“Author Keywords” field of Web of Science record) of experimental articles used are 697, appearing in 782 cases; by mean, around 6.11 sub-ject-words were used per paper. Major subject-words discovered were “electronic commerce” (9 cases), “in-formation technology” (6 cases), “information systems strategy,” “competitive dynamics,” “decision support systems,” “electronic markets,” “resource-based view” (4 cases), “knowledge management,” “competitive actions,” “structural equation modeling,” “decision support,” “decision making,” “information systems development,” “business value,” “inter-organizational information sys-tems,” “competitive impacts of IS,” “partial least squares,” and “coordination” (3 cases), which are demonstrated in Table 3 as the year-wise cluster of subject-words for the issued journal. The subject-word cluster showed similar result when comparing the subject-word cluster for the entire experimental article to the subject-word cluster for experimental articles with citation performance. It seems because articles with citation performance are 96.9% of the entire articles in the journal.
The number of cluster in earlier years shows a greater subject-word cluster: for the year 2001, 3 clusters and in 2004, 2 clusters; for both 2007 and 2010, 5 clusters. En-tire research fields were separated into 100 classes on the basis of ISI Categories, which proved to be problematic in distinguishing subject difference on year of publica-tion, by means of subject-word and subject-word cluster of experimental articles.

70
JISTaP Vol.3 No.1, 66-76
Table 3. Major subject-word and subject-word Cluster in Publication Year of Experimental Articles
Year Major subject-word (Number of emergence) Subject-word cluster
2001
data models (2), decision support (2), electronic com-merce (2), electronic data interchange (2), event study (2), individual differences (2), information technology (2), inter-organizational systems (2), market value (2)
#1 (inter-organizational systems, electronic data inter-change), #2 (market value, event study), #3 (electronic commerce)
2004 IT investments (2)#1 (consumer welfare, economic modeling, economic value, IT value, productivity, quality), #2 (IT investments)
2007
computer-mediated communication and collaboration (2), decision making (2), digitally enabled extended enterprise (2), education (2), electronic commerce (2), information technology (2), network economics (2), offshoring (2)
#1 (business transformation, business value, corporate strategy, digital goods, disruptive technology, IT invest-ment, IT strategy, MBA core, platform, social networks), #2 (network economics), #3 (education), #4 (electronic commerce), #5 (decision making)
2010
electronic commerce (5), competitive dynamics (4), competitive actions (3), auctions (2), coevolution (2), competitive impacts of IS (2), decision support systems (2), dynamic capabilities (2), electronic markets (2), environ-mental turbulence (2), firm performance (2), governance (2), information systems strategy (2), inter-organization-al information systems (2), IT and new organizational forms (2), IT business value (2), IT impacts on industry and market structure (2), knowledge management (2), modularity (2), platforms (2), price competition (2), social network theory (2), software industry (2), software outsourcing (2), structural equation modeling (2)
#1 (platforms), #2 (competitive dynamics), #3 (electronic commerce), #4 (dynamic capabilities, environmental turbulence), #5 (competitive impacts of IS)
4. ANALYSIS OF CITING PAPER
Papers citing the experimental articles are found in a total of 5,836, citing 7,784 articles. This accounts for 1.3 experimental articles referenced per citing paper. There are 613 cases of citing more than two experimental articles, and the highest number of citation had 8 ex-perimental articles referenced. Citing papers are of 475 types: ranked from highest to lowest as MIS Quarterly (337), Information Systems Research (273), Journal of Management Information Systems (225), Decision Sup-port Systems (189), and European Journal of Information Systems (161). Research fields of citing paper are in the order of Computer Science (2221), Business & Eco-nomics (2191), Information Science & Library Science (1901), Operations Research & Management Science (489), and Engineering (402). Table 4 illustrates the citing field (1st-5rd) of experimental articles based on their publication year. The whole (2001, 2004, 2007, and 2010) of experimental articles showed great similarity in citing fields. Nevertheless, the number of citing papers
per research fields tends to decline with increase in year of experimental articles publication: 2001 (43), 2004 (33), 2007 (26), and 2010 (23). It indicates the change either in research field of experimental articles research fields or in impact of experimental articles in research field.
4.1. Research Field Cluster of Citing PaperTo analyze the research field of citing papers of exper-
imental articles, clustering and statistical methods are applied to four groups (2001, 2004, 2007, and 2010) of experimental articles to attain the extent of contribution to the field. Each cluster of research field was titled after the research field with the highest weight. There are 8 clusters in total of four experimental groups: #1 (Com-puter Science), #2 (Business & Economics), #3 (Opera-tions Research & Management Science), #4 (Psycholo-gy), #5 (Communication), #6 (Telecommunications), #7 (Oceanography), and #8 (Science & Technology - Other Topics). The aforementioned top 5 fields in research field analysis – “Information Science & Library Science”
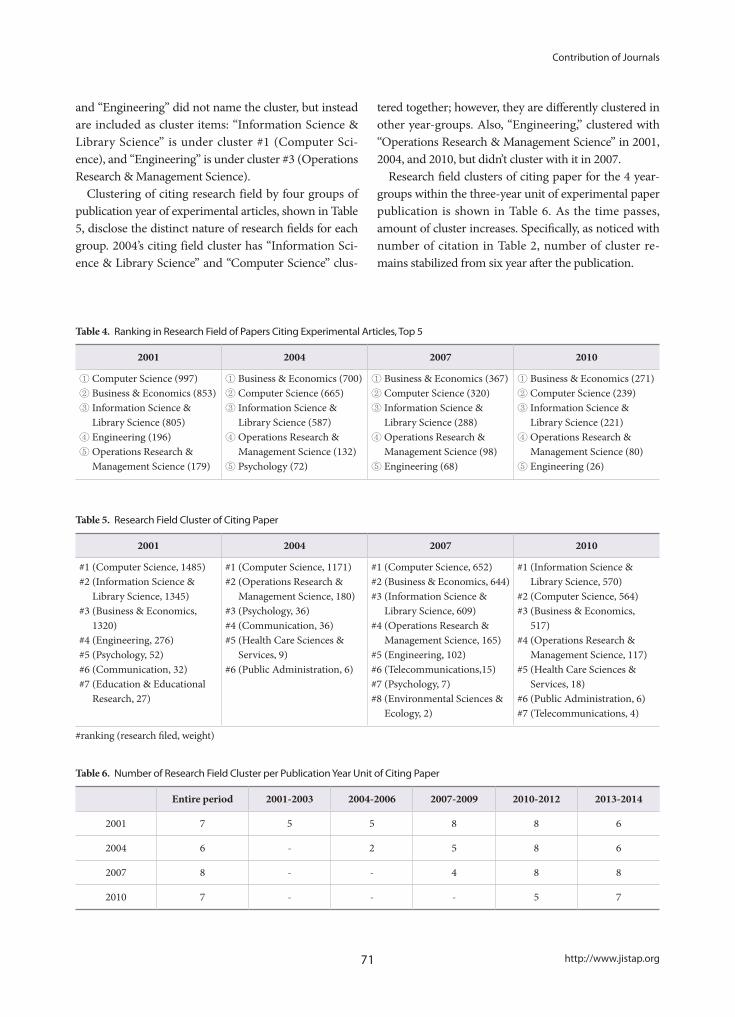
71 http://www.jistap.org
Contribution of Journals
and “Engineering” did not name the cluster, but instead are included as cluster items: “Information Science & Library Science” is under cluster #1 (Computer Sci-ence), and “Engineering” is under cluster #3 (Operations Research & Management Science).
Clustering of citing research field by four groups of publication year of experimental articles, shown in Table 5, disclose the distinct nature of research fields for each group. 2004’s citing field cluster has “Information Sci-ence & Library Science” and “Computer Science” clus-
tered together; however, they are differently clustered in other year-groups. Also, “Engineering,” clustered with “Operations Research & Management Science” in 2001, 2004, and 2010, but didn’t cluster with it in 2007.
Research field clusters of citing paper for the 4 year-groups within the three-year unit of experimental paper publication is shown in Table 6. As the time passes, amount of cluster increases. Specifically, as noticed with number of citation in Table 2, number of cluster re-mains stabilized from six year after the publication.
Table 4. Ranking in Research Field of Papers Citing Experimental Articles, Top 5
2001 2004 2007 2010
① Computer Science (997)② Business & Economics (853)③ Information Science &
Library Science (805)④ Engineering (196)⑤ Operations Research &
Management Science (179)
① Business & Economics (700)② Computer Science (665)③ Information Science &
Library Science (587)④ Operations Research &
Management Science (132)⑤ Psychology (72)
① Business & Economics (367)② Computer Science (320)③ Information Science &
Library Science (288)④ Operations Research &
Management Science (98)⑤ Engineering (68)
① Business & Economics (271)② Computer Science (239)③ Information Science &
Library Science (221)④ Operations Research &
Management Science (80)⑤ Engineering (26)
Table 5. Research Field Cluster of Citing Paper
2001 2004 2007 2010
#1 (Computer Science, 1485)#2 (Information Science &
Library Science, 1345)#3 (Business & Economics,
1320)#4 (Engineering, 276)#5 (Psychology, 52)#6 (Communication, 32)#7 (Education & Educational
Research, 27)
#1 (Computer Science, 1171)#2 (Operations Research &
Management Science, 180)#3 (Psychology, 36)#4 (Communication, 36)#5 (Health Care Sciences &
Services, 9)#6 (Public Administration, 6)
#1 (Computer Science, 652)#2 (Business & Economics, 644)#3 (Information Science &
Library Science, 609)#4 (Operations Research &
Management Science, 165)#5 (Engineering, 102)#6 (Telecommunications,15)#7 (Psychology, 7)#8 (Environmental Sciences &
Ecology, 2)
#1 (Information Science & Library Science, 570)
#2 (Computer Science, 564)#3 (Business & Economics,
517)#4 (Operations Research &
Management Science, 117)#5 (Health Care Sciences &
Services, 18)#6 (Public Administration, 6)#7 (Telecommunications, 4)
#ranking (research filed, weight)
Table 6. Number of Research Field Cluster per Publication Year Unit of Citing Paper
Entire period 2001-2003 2004-2006 2007-2009 2010-2012 2013-2014
2001 7 5 5 8 8 6
2004 6 - 2 5 8 6
2007 8 - - 4 8 8
2010 7 - - - 5 7
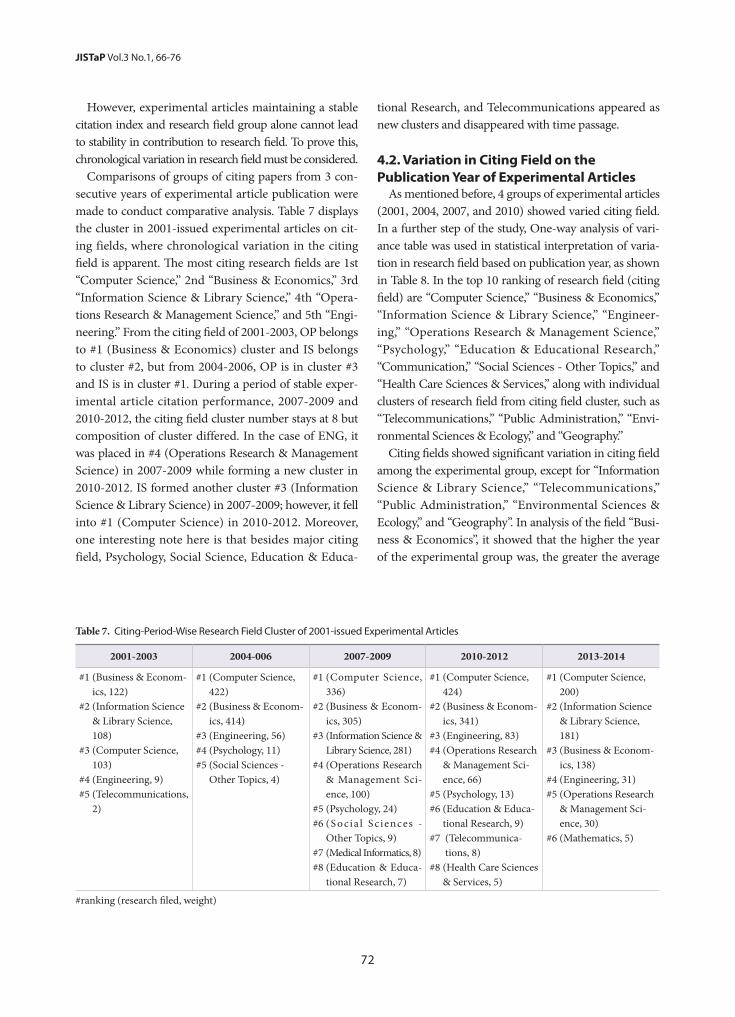
72
JISTaP Vol.3 No.1, 66-76
However, experimental articles maintaining a stable citation index and research field group alone cannot lead to stability in contribution to research field. To prove this, chronological variation in research field must be considered.
Comparisons of groups of citing papers from 3 con-secutive years of experimental article publication were made to conduct comparative analysis. Table 7 displays the cluster in 2001-issued experimental articles on cit-ing fields, where chronological variation in the citing field is apparent. The most citing research fields are 1st “Computer Science,” 2nd “Business & Economics,” 3rd “Information Science & Library Science,” 4th “Opera-tions Research & Management Science,” and 5th “Engi-neering.” From the citing field of 2001-2003, OP belongs to #1 (Business & Economics) cluster and IS belongs to cluster #2, but from 2004-2006, OP is in cluster #3 and IS is in cluster #1. During a period of stable exper-imental article citation performance, 2007-2009 and 2010-2012, the citing field cluster number stays at 8 but composition of cluster differed. In the case of ENG, it was placed in #4 (Operations Research & Management Science) in 2007-2009 while forming a new cluster in 2010-2012. IS formed another cluster #3 (Information Science & Library Science) in 2007-2009; however, it fell into #1 (Computer Science) in 2010-2012. Moreover, one interesting note here is that besides major citing field, Psychology, Social Science, Education & Educa-
tional Research, and Telecommunications appeared as new clusters and disappeared with time passage.
4.2. Variation in Citing Field on the Publication Year of Experimental Articles
As mentioned before, 4 groups of experimental articles (2001, 2004, 2007, and 2010) showed varied citing field. In a further step of the study, One-way analysis of vari-ance table was used in statistical interpretation of varia-tion in research field based on publication year, as shown in Table 8. In the top 10 ranking of research field (citing field) are “Computer Science,” “Business & Economics,” “Information Science & Library Science,” “Engineer-ing,” “Operations Research & Management Science,” “Psychology,” “Education & Educational Research,” “Communication,” “Social Sciences - Other Topics,” and “Health Care Sciences & Services,” along with individual clusters of research field from citing field cluster, such as “Telecommunications,” “Public Administration,” “Envi-ronmental Sciences & Ecology,” and “Geography.”
Citing fields showed significant variation in citing field among the experimental group, except for “Information Science & Library Science,” “Telecommunications,” “Public Administration,” “Environmental Sciences & Ecology,” and “Geography”. In analysis of the field “Busi-ness & Economics”, it showed that the higher the year of the experimental group was, the greater the average
Table 7. Citing-Period-Wise Research Field Cluster of 2001-issued Experimental Articles
2001-2003 2004-006 2007-2009 2010-2012 2013-2014
#1 (Business & Econom-ics, 122)
#2 (Information Science & Library Science, 108)
#3 (Computer Science, 103)
#4 (Engineering, 9)#5 (Telecommunications,
2)
#1 (Computer Science, 422)
#2 (Business & Econom-ics, 414)
#3 (Engineering, 56)#4 (Psychology, 11)#5 (Social Sciences -
Other Topics, 4)
#1 (Computer Science, 336)
#2 (Business & Econom-ics, 305)
#3 (Information Science & Library Science, 281)
#4 (Operations Research & Management Sci-ence, 100)
#5 (Psychology, 24)#6 (Social Sciences -
Other Topics, 9)#7 (Medical Informatics, 8)#8 (Education & Educa-
tional Research, 7)
#1 (Computer Science, 424)
#2 (Business & Econom-ics, 341)
#3 (Engineering, 83)#4 (Operations Research
& Management Sci-ence, 66)
#5 (Psychology, 13)#6 (Education & Educa-
tional Research, 9)#7 (Telecommunica-
tions, 8)#8 (Health Care Sciences
& Services, 5)
#1 (Computer Science, 200)
#2 (Information Science & Library Science, 181)
#3 (Business & Econom-ics, 138)
#4 (Engineering, 31)#5 (Operations Research
& Management Sci-ence, 30)
#6 (Mathematics, 5)
#ranking (research filed, weight)

73 http://www.jistap.org
Contribution of Journals
score was, and inter-group variation by Dunnett T3 ap-peared the significant difference between the group 2001 and the groups 2004, 2007 and 2010.
“Operations Research & Management Science” and “Health Care Sciences & Services” fields also show a sim-ilar pattern of correlation between year and average score. Confirmation testing for “Operations Research & Man-agement Science” proved the group of 2001 and 2004 had significant difference from the group of 2007 and 2010, whereas for “Health Care Sciences & Services” the group of 2001, 2004, and 2007 differed from the group of 2010.
On the contrary, “Education & Educational Research” and “Social Sciences - Other Topics” fields showed an opposite trend of decreasing average as the year of group grew later. The “Education & Educational Research” field group of 2001 showed significant different from the group of 2004, 2007, and 2010, whereas the “Social Sciences - Other Topics” group of 2001 and 2004 differed from the group of 2007 and 2010.
In summary, the target journal papers group in the past few years of time had a high contribution (average score) in the fields of “Business & Economics,” “Oper-ations Research & Management Science,” and “Health Care Sciences & Services,” and a low contribution (av-erage score) in the fields of “Education & Educational Research” and “Social Sciences - Other Topics.” It is known that the study-target journal Information Systems Research, which is classified in fields of “Information Science & Library Science” and “Operations Research & Management Science” in JCR (Journal Citation Report), has been contributing to a higher extent in recent years to the fields of “Business & Economics,” “Operations Research & Management Science” and “Health Care Sciences & Services,” while contribution in the fields of “Education & Educational Research” and “Social Scienc-es - Other Topics” are reduced in recent years.
5. CONCLUSION
An academic article, from its birth, necessitates the accumulation of numerous reference sources. Thereafter, articles are utilized by following research, to create other articles, and this process replicates. The objective of this study is to help understand the current status of article reference by chronological analysis and to determine along with Clustering and One-way analysis of variance,
so to determine significant change in the citing research field of the journal with the change of publication year.
The target journal of the study was Information Sys-tems Research, which has the research fields of “Infor-mation Science & Library Science” and “Operations Research & Management Science,” from which analysis of issued papers in 2001, 2004, 2007, and 2010 shows citation performance enhances from paper publication and from the time of 3-4 years after publication, the number of citing papers remains stabilized. This trend is also shown the similar result in the citing field cluster.
The research fields of citing papers are ranked as Computer Science (2221), Business & Economics (2191), Information Science & Library Science (1901), Operations Research & Management Science (489), and Engineering (402). However, the ranking differed as the publication year of experimental articles changed citing field; especially in the cluster study the difference can be explained in detail. Variation in group of citing field was also observed: the highest citing research fields are Com-puter Science (2221), Business & Economics (2191), In-formation Science & Library Science (1901), Operations Research & Management Science (489), and Engineering (402). In the case of the citing field “Information Science & Library Science,” seemingly in high correlation with “Computer Science” it formed separate individual clus-ters in 2004, suggesting a timely variation research field cluster that depends on time and similarities of cluster.
Analysis of research field of citing papers with 4 groups of experimental articles - 2001, 2004, 2007, and 2010 - showed a significantly distinct contribution made to citing field. The citing field “Business & Econom-ics” in 2001 revealed a significantly small contribution compared to all other year-groups, such that papers published after the year of 2001 showed a greater con-tribution to “Business & Economics” than in the past. The citing field “Operations Research & Management Science” showed 2001, 2004 <2007 and 2001, 2004 < 2010, and finally target journal papers in the citing field “Operations Research & Management Science” revealed higher contribution to recent citing papers (2007, 2010) than in the past (2001, 2004).
This study has the significance in the way that its sub-ject-field approach was taken to estimate influence of pa-per by study of citing paper as opposed to earlier studies of cited papers. Subjective influence has been studied to show statistical variance based on publication year.

74
JISTaP Vol.3 No.1, 66-76
Table 8. One-Way Analysis of Variance for Citing Field of Experimental Articles
Subordinate variable
(Citing field)
Experimental group N Mean SD
F value/ significance probability
Dunnett T3
Computer Science
2001 3325 .30 .458
3.163 /0.024* -2004 2429 .27 .446
2007 1225 .26 .439
2010 891 .27 .443
Business & Economics
2001 3325 .26 .437
4.922/0.002**2001 < 2004,2007,2010
2004 2429 .29 .453
2007 1225 .30 .458
2010 891 .30 .460
Engineering
2001 3325 .06 .236
4.939/0.002**2001 > 20102007 > 2010
2004 2429 .05 .210
2007 1225 .06 .229
2010 891 .03 .168
Operations Research & Management Science
2001 3325 .05 .226
8.309/0.000**
2001 < 2007,20102004 < 2007,2010
2004 2429 .05 .227
2007 1225 .08 .271
2010 891 .09 .286
Psychology
2001 3325 .02 .143
3.388/0.017* 2004 >20102004 2429 .03 .170
2007 1225 .02 .147
2010 891 .01 .110
Education & Educational Research
2001 3325 .01 .118
9.165/0.000**2001 > 2004,2007,2010
2004 2429 .01 .078
2007 1225 .00 .040
2010 891 .00 .034
Communication
2001 3325 .01 .101
4.359/0.004**2001,2004 > 2010
2004 2429 .02 .127
2007 1225 .01 .099
2010 891 .00 .047
Social Sciences - Other Topics
2001 3325 .01 .095
3.177/0.023*2001,2004 > 2010
2004 2429 .01 .109
2007 1225 .00 .070
2010 891 .00 .047
Health Care Sciences & Services
2001 3325 .00 .067
5.864/0.001*2001,2004,2007 < 2010
2004 2429 .00 .064
2007 1225 .00 .000
2010 891 .01 .110
Public Administration
2001 3325 .00 .046
2.628/0.049* -2004 2429 .00 .054
2007 1225 .01 .081
2010 891 .01 .082
* p<0.05, **p<0.01
75 http://www.jistap.org
Contribution of Journals
REFERENCES
Astrom, F. (2007). Changes in the LIS research front: Time-sliced cocitation analyses of LIS journal articles, 1990-2004. Journal of the American Soci-ety for Information Science and Technology, 58(7), 947-957
Barnett, G. A., et al. (2011). Citations among com-munication journals and other disciplines: A network analysis. Scientometrics, 88(2), 449-469.
Bellis, N. D. (2009). Bibliometrics and citation anal-ysis: From the science citation index to cybermet-rics. Lanham, MD, US: Scarecrow Press.
Bergstrom, C. (2007). Eigenfactor: measuring the value and prestige of scholarly journals. C&RL News, 68(5).
Centre for Science and Technology Studies, L. U. (2014). VOSviewer. Retrieved from http://www.vosviewer.com/
Education rankings. U.S. News & World Report. Re-trieved from http://www.usnews.com/rankings
Elsevier (2014). SCOPUS. Retrieved from http://www.scopus.com
Garfield, E. (2006). The history and meaning of the journal impact factor. Jama: Journal of the Amer-ican Medical Association, 295(1), 90-93.
Gonzalez-Pereira, B., et al. (2010). A new approach to the metric of journals’ scientific prestige: The SJR indicator. Journal of Informetrics, 4(3), 379-391.
Hammarfelt, B. (2011). Interdisciplinarity and the in-tellectual base of literature studies: Citation anal-ysis of highly cited monographs. Scientometrics, 86(3), 705-725.
Heersmink, R., et al. (2011). Bibliometric mapping of computer and information ethics. Ethics and Information Technology, 13(3), 241-249.
Hu, C.-P., et al. (2011). A journal co-citation analysis of library and information science in China. Sci-entometrics, 86(3), 657-670.
Huang, M. H., & Chang, C. P. (2014). Detecting re-search fronts in OLED field using bibliographic coupling with sliding window. Scientometrics 98(3), 1721-1744.
Lariviere, V., et al. (2009). The decline in the con-centration of citations, 1900-2007. Journal of the American Society for Information Science and Technology, 60(4), 858-862.
Lee, P.-C., and & Su, H.-N. (2011). Quantitative map-ping of scientific research - The case of electrical conducting polymer nanocomposite. Technolog-ical Forecasting and Social Change, 78(1), 132-151.
Leydesdorff, L., & Rafols, I. (2012). Interactive over-lays: A new method for generating global journal maps from Web-of-Science data. Journal of Infor-metrics 6(2), 318-332.
Lu, K., & Wolfram, D. (2010). Geographic charac-teristics of the growth of informetrics literature 1987-2008. Journal of Informetrics, 4(4), 591-601.
Persson (2011). Bibexcel: A tool-box developed by Olle Persson. Retrieved from http://www8.umu.se/inforsk/Bibexcel/
Pluzhenskaia, M. A. (2007). Publication and citation analysis of disciplinary connections of library and information science faculty in accredited schools. Ann Arbor: University of Illinois at Urba-na-Champaign. 3270003:180.
Shin, E.-J. (2009). The dispersion phenomenon of journal citations in a digital environment. Jour-nal of the Korean Society for Information Manage-ment, 26(2), 211-222.
Su, H.-N., & Lee, P.-C. (2010). Mapping knowledge structure by keyword co-occurrence: a first look at journal papers in Technology Foresight. Scien-tometrics, 85(1), 65-79.
Thomson, I. (2014). Journal citation reports: JCR so-cial sciences. Retrieved from http://webofknowl-edge.com/JCR
Thomson, I. (2014). Web of Science. Retrieved from http://apps.webofknowledge.com/
Tijssen, R. J. W. (2010). Discarding the ‘Basic Sci-ence/Applied Science’ dichotomy: A knowledge utilization triangle classification system of re-search journals. Journal of the American Society for Information Science and Technology, 61(9), 1842-1852.
University rankings. QS Top Universities. Retrieved from http://www.topuniversities.com/universi-ty-rankings
Van Eck, N. J., & Waltman, L. (2010). Software sur-vey: VOSviewer, a computer program for biblio-metric mapping. Scientometrics, 84(2), 523-538.
Waaijer, C. J. F., et al. (2011). On the map: Nature and Science editorials. Scientometrics, 86(1), 99-112.

76
JISTaP Vol.3 No.1, 66-76
Waltman, L., et al. (2010). A unified approach to mapping and clustering of bibliometric networks. Journal of Informetrics, 4(4), 629-635.
77
Mobile User Behavior Pattern Analysis
http://www.jistap.org
We would like to invite you to submit or recommend papers to Journal of Information Science Theory and
Practice (JISTaP, eISSN: 2287-4577, pISSN: 2287-9099), a fast track peer-reviewed and no-fee open access
academic journal published by Korea Institute of Science and Technology Information (KISTI), which is
a government-funded research institute providing STI services to support high-tech R&D for researchers in
Korea. JISTaP marks a transition from Journal of Information Management to an English-language international
journal in the area of library and information science.
JISTaP aims at publishing original studies, review papers and brief communications on information science
theory and practice. The journal provides an international forum for practical as well as theoretical research
in the interdisciplinary areas of information science, such as information processing and management,
knowledge organization, scholarly communication and bibliometrics.
We welcome materials that reflect a wide range of perspectives and approaches on diverse areas of
information science theory, application and practice. Topics covered by the journal include: information
processing and management; information policy; library management; knowledge organization; metadata
and classification; information seeking; information retrieval; information systems; scientific and technical
information service; human-computer interaction; social media design; analytics; scholarly communication
and bibliometrics. Above all, we encourage submissions of catalytic nature that explore the question of how
theory can be applied to solve real world problems in the broad discipline of information science.
Co-Editors in Chief : Gary Marchionini & Dong-Geun Oh
Please click the “e-Submission” link in the JISTaP website (http://www.jistap.org), which will take you to a login/
account creation page. Please consult the “Author’s Guide” page to prepare your manuscript according to the
JISTaP manuscript guidelines.
Any question? Hea Lim Rhee (managing editor): [email protected]
Call for PaperJournal of Information Science Theory and Practice (JISTaP)
77
JISTaP Vol.2 No.1, 06-21
7878

79
Mobile User Behavior Pattern Analysis
http://www.jistap.org79
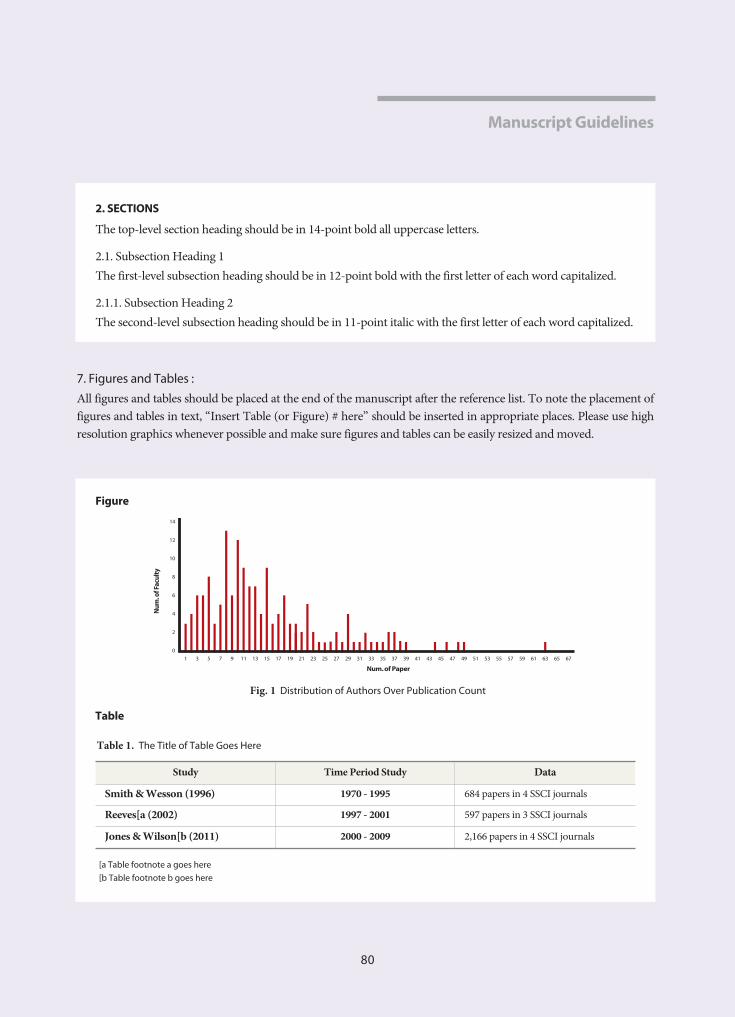
JISTaP Vol.2 No.1, 06-21
8080
81
Mobile User Behavior Pattern Analysis
http://www.jistap.org81

General Information
2015 Copyright © Korea Institute of Science and Technology Information
LI S A DOAJDIRECTORY OFOPEN ACCESSJOURNALS

eISSN : 2287-4577 pISSN : 2287-9099http://www.jistap.org
Vol. 3 No. 1 March 30, 2015
Indexed/Covered by LISA, DOAJ, PASCAL, KSCI, KoreaScience and CrossRef
Vol. 3 No. 1 M
arch 30, 2015
06Sentiment Analysis of User-Generated Content on Drug Review Websites
24Query Formulation for Heuristic Retrieval in Obfuscated and Translated Partially Derived Text
40Non-Governmental Organization (NGO) Libraries for The Visually Impaired in Nigeria: Alternative Format Use and Perception of Information Services
50Study of US/EU National Innovation Policies Based on Nanotechnology Development, and Implications for Korea
66Contribution of Journals to Academic Disciplines
Related Documents