University of Arkansas, Fayeeville ScholarWorks@UARK eses and Dissertations 12-2011 Visualizing the Spatial Localization of Active Matrix Metalloproteinases (MMPs) using MALDI Imaging MS Sasirekha Muruganantham University of Arkansas, Fayeeville Follow this and additional works at: hp://scholarworks.uark.edu/etd Part of the Analytical Chemistry Commons , and the Biochemistry Commons is esis is brought to you for free and open access by ScholarWorks@UARK. It has been accepted for inclusion in eses and Dissertations by an authorized administrator of ScholarWorks@UARK. For more information, please contact [email protected], [email protected]. Recommended Citation Muruganantham, Sasirekha, "Visualizing the Spatial Localization of Active Matrix Metalloproteinases (MMPs) using MALDI Imaging MS" (2011). eses and Dissertations. 137. hp://scholarworks.uark.edu/etd/137

Welcome message from author
This document is posted to help you gain knowledge. Please leave a comment to let me know what you think about it! Share it to your friends and learn new things together.
Transcript

University of Arkansas, FayettevilleScholarWorks@UARK
Theses and Dissertations
12-2011
Visualizing the Spatial Localization of Active MatrixMetalloproteinases (MMPs) using MALDIImaging MSSasirekha MurugananthamUniversity of Arkansas, Fayetteville
Follow this and additional works at: http://scholarworks.uark.edu/etd
Part of the Analytical Chemistry Commons, and the Biochemistry Commons
This Thesis is brought to you for free and open access by ScholarWorks@UARK. It has been accepted for inclusion in Theses and Dissertations by anauthorized administrator of ScholarWorks@UARK. For more information, please contact [email protected], [email protected].
Recommended CitationMuruganantham, Sasirekha, "Visualizing the Spatial Localization of Active Matrix Metalloproteinases (MMPs) using MALDI ImagingMS" (2011). Theses and Dissertations. 137.http://scholarworks.uark.edu/etd/137


VISUALIZING THE SPATIAL LOCALIZATION OF ACTIVE MATRIX
METALLOPROTEINASES (MMPs) USING MALDI IMAGING MS

VISUALIZING THE SPATIAL LOCALIZATION OF ACTIVE MATRIX
METALLOPROTEINASES (MMPs) USING MALDI IMAGING MS
A thesis submitted in partial fulfillment
of the requirements for the degree of
Master of Science in Chemistry
By
Sasirekha Muruganantham
Bharathiar University
Master of Science in Chemistry, 2004
December 2011
University of Arkansas

ABSTRACT
Biomaterial implantation induces the foreign body response (FBR). Development of
longer-term implants relies on the thorough understanding of the FBR. The progression of the
FBR is regulated by a number of biomolecules including cytokines, chemokines, and matrix
metalloproteinases (MMPs). The nature of the FBR requires the spatial and temporal regulation
of these mediators. MMPs are an extremely large and diverse group of enzymes that play key
roles in regulating the FBR. Precise spatiotemporal regulation of MMPs defines their proteolytic
activities. The aim of this project is to develop a new bioanalytical method to visualize the
localization of active MMPs at the implant site in ex vivo tissue samples.
The localization of active MMP-2 and MMP-9 surrounding the implanted biomaterial in
the ex vivo tissue sample was determined using MALDI imaging mass spectrometry. The
MALDI imaging scheme employed a synthetic FRET substrate specific for MMP-2 and MMP-9.
The intensity of the m/z value corresponding to the product of active MMP-2 and MMP-9
digestion in each spectrum was extracted to produce a two-dimensional image showing the
localization of active MMP-2 and MMP-9 in the ex vivo tissue sample. Fluorescence imaging
was used as a complementary technique.
This thesis is approved for recommendation
to the Graduate Council.
Thesis Director:
_____________________________
Dr. Julie A. Stenken
Thesis Committee:
_____________________________
Dr. Narayan C. Rath
____________________________
Dr. Suresh Kumar Thallapuranam
____________________________
Dr. Paul D. Adams

THESIS DUPLICATION RELEASE
I hereby authorize the University of Arkansas Libraries to duplicate this thesis when needed for
research and/or scholarship.
Agreed ________________________________
Sasirekha Muruganantham
Refused ________________________________
Sasirekha Muruganantham

ACKNOWLEDGEMENTS
I would like to express my warmest thanks to all those who helped me understand and
execute the goals of this project. No words can express my gratitude to my research advisor,
Dr. Julie Stenken, for her immense support and guidance. I would like to thank her for her
valuable insights that provoked my thought process. She has been very considerate throughout
my graduate program and has motivated me to be an independent researcher.
I am grateful to my committee members, Dr. Narayan Rath, Dr. T.K. Suresh Kumar, and
Dr. Paul Adams, for their valuable suggestions throughout my graduate program. I wish to
express my sincere thanks to Dr. Jack Lay for granting permission to use the MS facility and for
providing the much-needed advice. I appreciate the open door policy he has for students. My
heartfelt thanks go to Dr. Rohana Liyanage for providing training and guidance in the MS
facility. I would always remember him as my first and best mentor.
I would like to thank Dr. Wayne Kuenzel for allowing me to use the cryostat,
Dr. Paul Adams for training me to use the spectrofluorometer, and Dr. Daniel Fologea for
training and assisting me with the use of fluorescence microscope and spectrofluorometer. I’m
thankful to Dr. Narayan Rath for all the helpful discussions about MMPs and for allowing me to
use the humidity chamber.
My special thanks goes to my past postdoctoral group members Dr. Molly Darragh, and
Dr. Erika Von Grote for training me on zymography and cryostat, and on probe implantation
procedure. I would like to thank all my current and past group members for their helpful
suggestions. My sincere thanks go to my husband Arun for help with statistical results

interpretation. I wouldn’t have come this far without his love and care. I would like to extend my
thanks to the graduate school and Dr. Julie Stenken for providing funding to attend the 59th
ASMS conference. I would like to acknowledge NIH EB 001441 for funding the research.

DEDICATION
This thesis is dedicated to all the laboratory animals that sacrifice their lives for
SCIENCE

TABLE OF CONTENTS
1. RESEARCH SIGNIFICANCE AND BACKGROUND ........................................................1
1.1.1 Biomaterials and the foreign body response .....................................................1
1.1.2 Role of MMPs in the FBR ................................................................................2
1.1.3 Role of MMPs in inflammation ........................................................................3
1.1.4 MMPs ................................................................................................................4
1.2 Methods to study the spatial localization of MMPs ...................................................8
1.2.1 Immunohistochemical staining .........................................................................8
1.2.2 In situ zymography ...........................................................................................9
1.2.3 Fluorescence-based imaging .............................................................................9
1.2.4 Near Infrared (NIR) fluorescence imaging .......................................................9
1.3 Imaging mass spectrometry (IMS) ...........................................................................10
1.3.1 MALDI imaging MS (MALDI-IMS) .............................................................10
1.3.2 MALDI-TOF instrumentation ........................................................................11
1.3.3 MS/MS spectra using the LIFT technique ......................................................11
1.3.4 Working principle ...........................................................................................12
1.3.5 Tissue sample preparation ...............................................................................12
1.3.6 Tissue washing step ........................................................................................13
1.3.7 Matrix selection and deposition .......................................................................14
1.3.8 Visualizing the spatial localization of active MMP-2 and MMP-9 ..................14
2. IN SITU STUDIES TO IMAGE THE SPATIAL LOCALIZATION OF ACTIVE
MMP-9 .........................................................................................................................................16
2.1 Introduction ..............................................................................................................16
2.2 Experimental section ................................................................................................17

2.2.1 Chemicals ........................................................................................................17
2.2.2 (A) MALDI-TOF MS system .........................................................................18
2.2.2 (B) Matrix selection and deposition .................................................................19
2.2.3 MALDI-TOF imaging MS for monitoring the in situ localization of trypsin
enzymatic activity on ITO-coated glass slides ................................................20
2.2.4 (A) Activation of MMP-9 ................................................................................21
2.2.4 (B) Zymography...............................................................................................21
2.2.5 Spectrofluorometer .........................................................................................22
2.2.6 Fluorescence studies with QXLTM
520-Pro-Leu-Gly-Cys(Me)~His- Ala-
D-Arg-Lys(5-FAM)-NH2 ..................................................................................22
2.2.7 MALDI-TOF MS studies with QXLTM 520-Pro-Leu-Gly-Cys(Me)~His-Ala-
D-Arg-Lys(5-FAM)-NH2 .................................................................................23
2.2.8 (A) LC-MS for monitoring the in situ enzymatic activity of MMP-9 in
eppendorf vials ................................................................................................23
2.2.8 (B) MALDI-TOF MS for monitoring the in situ enzymatic activity of MMP-9
in eppendorf vials ............................................................................................24
2.2.9 MALDI-TOF imaging MS for monitoring the in situ localization of MMP-9
enzymatic activity on ITO-coated glass slides.................................................24
a. Predigested (substrate + active MMP-9) mixture on ITO-coated glass slide
....................................................................................................................25
b. Incubation on ITO-coated glass slide with active MMP-9 ..........................25
2.3 Results and Discussion ............................................................................................26
2.3.1 MALDI-TOF imaging MS for monitoring the in situ localization of trypsin
enzymatic activity on ITO-coated glass slides.................................................26
2.3.2 Zymography ...................................................................................................31
2.3.3 Fluorescence studies with QXLTM 520-Pro-Leu-Gly-Cys(Me)~His-Ala-
D-Arg-Lys(5-FAM)-NH2 .................................................................................32
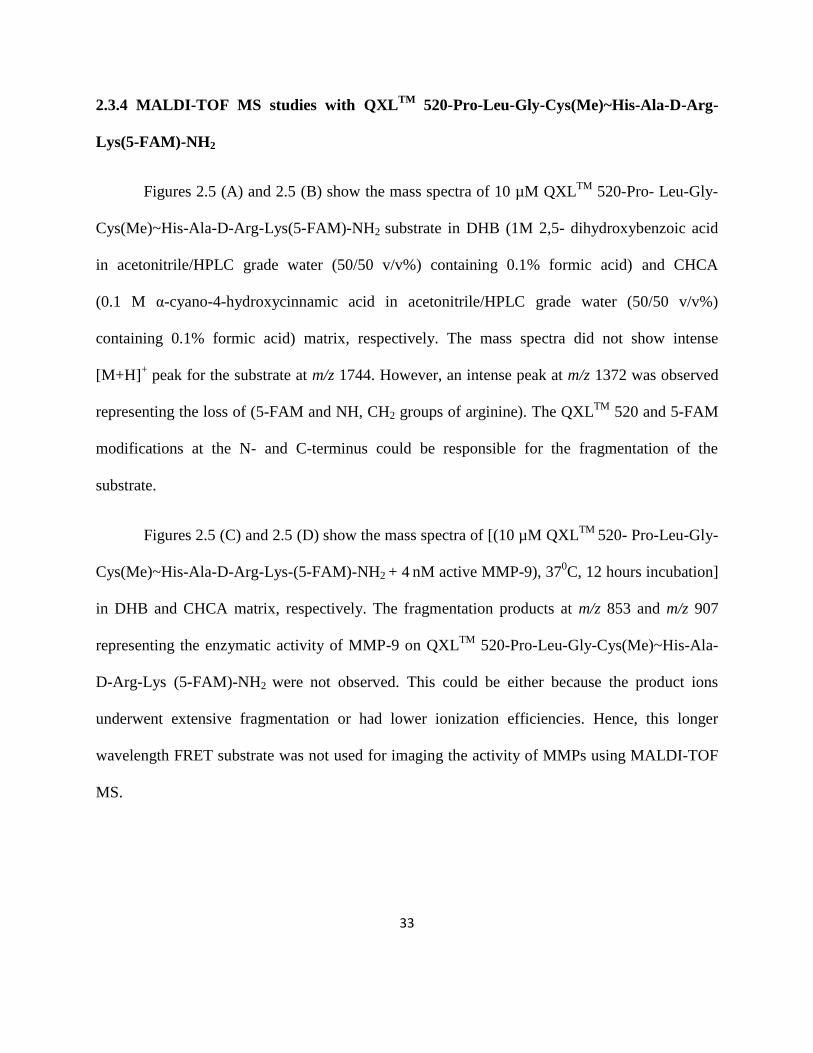
2.3.4 MALDI-TOF MS studies with QXLTM 520-Pro-Leu-Gly-Cys(Me)~His-Ala-
D-Arg-Lys(5-FAM)-NH2 .................................................................................33
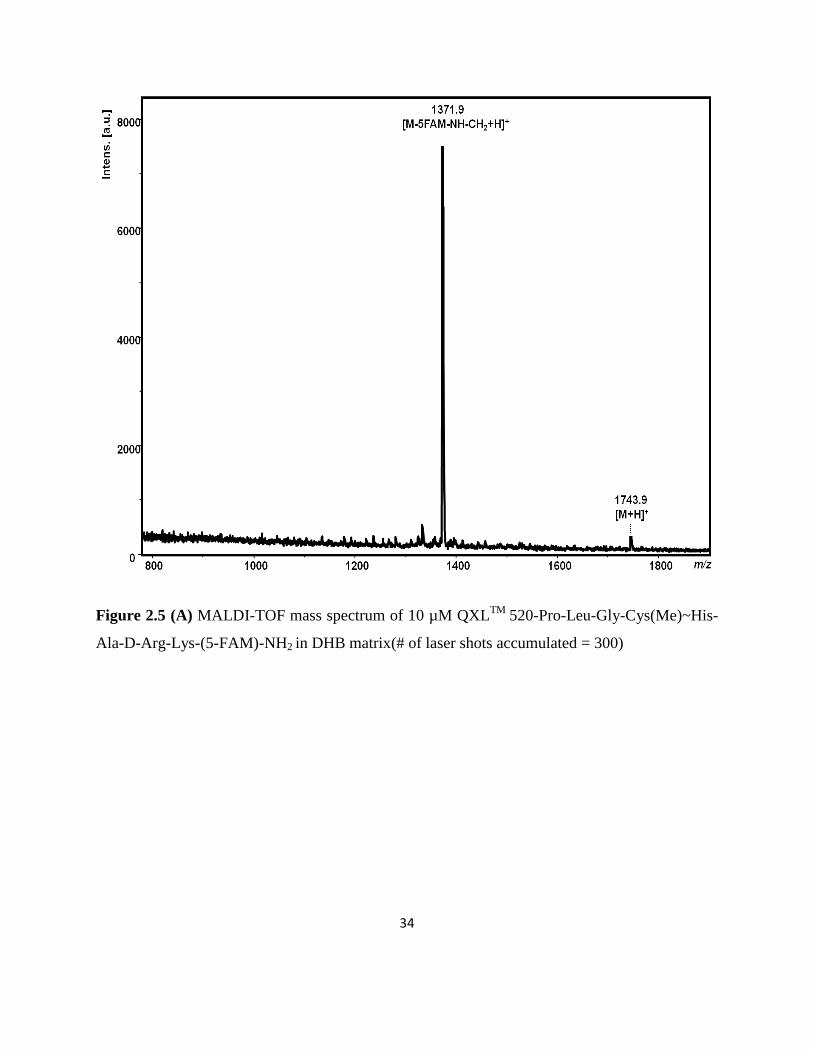
2.3.5 (A) LC-MS for monitoring the in situ enzymatic activity of MMP-9 in
eppendorf vials .................................................................................................38
2.3.5 (B)MALDI-TOF MS for monitoring the in situ enzymatic activity of MMP-9
in eppendorf vials .............................................................................................40
2.3.6 MALDI-TOF imaging MS for monitoring the in situ localization of MMP-9
enzymatic activity on ITO-coated glass slides.................................................46
a. Predigested (substrate + active MMP-9) mixture on ITO-coated glass slide
....................................................................................................................46
b. Incubation on ITO-coated glass slide with active MMP-9 ........................48
2.4 Conclusions ..............................................................................................................50
3. EX VIVO STUDIES TO IMAGE THE SPATIAL LOCALIZATION OF ACTIVE
MMP-2 AND MMP-9 ..................................................................................................................51
3.1 Introduction .............................................................................................................51
3.2 Experimental Section ...............................................................................................51
3.2.1 Chemicals ........................................................................................................51
3.2.2 Animals ...........................................................................................................52
3.2.3 Biomaterial implantation procedure ...............................................................53
3.2.4 Tissue sample preparation ...............................................................................53
3.2.5 MALDI-TOF MS system ................................................................................54
3.2.6 Alcohol-based tissue washing .........................................................................55
3.2.7 Matrix selection and deposition .......................................................................55
3.2.8 Fluorescence imaging system .........................................................................56
3.2.9 Imaging active MMP-2 and MMP-9 localization ex vivo using FRET substrate
..........................................................................................................................56
A. MALDI-TOF imaging MS ..........................................................................56

a. Matrix selection ......................................................................................56
b. Unwashed control tissue ........................................................................56
c. Ethanol washed control tissue ................................................................57
d. Control tissue spiked with predigested (substrate + active MMP-9) ......57
e. Control tissue incubated with (substrate + active MMP-9) ....................58
f. Microdialysis probe implanted tissues incubated with substrate .............58
B. Fluorescence imaging .................................................................................59
3.3 Results & Discussion ...............................................................................................59
A. MALDI-TOF imaging MS ..........................................................................59
a. Unwashed control tissue ........................................................................59
b. Ethanol washed control tissue ................................................................60
c. Control tissue spiked with predigested (substrate + active MMP-9) ......60
d. Control tissue incubated with (substrate + active MMP-9) ....................60
e. Microdialysis probe implanted tissues incubated with substrate ............61
B. Fluorescence imaging .................................................................................74
3.4 Conclusions .............................................................................................................78
4. SUMMARY AND FUTURE DIRECTIONS ........................................................................79
References ....................................................................................................................................82
LIST OF FIGURES
Figure 1.1 Domain structures of 24 vertebrate MMPs ...................................................................6
Figure 2.1 MMP-9 activity assay scheme .....................................................................................17
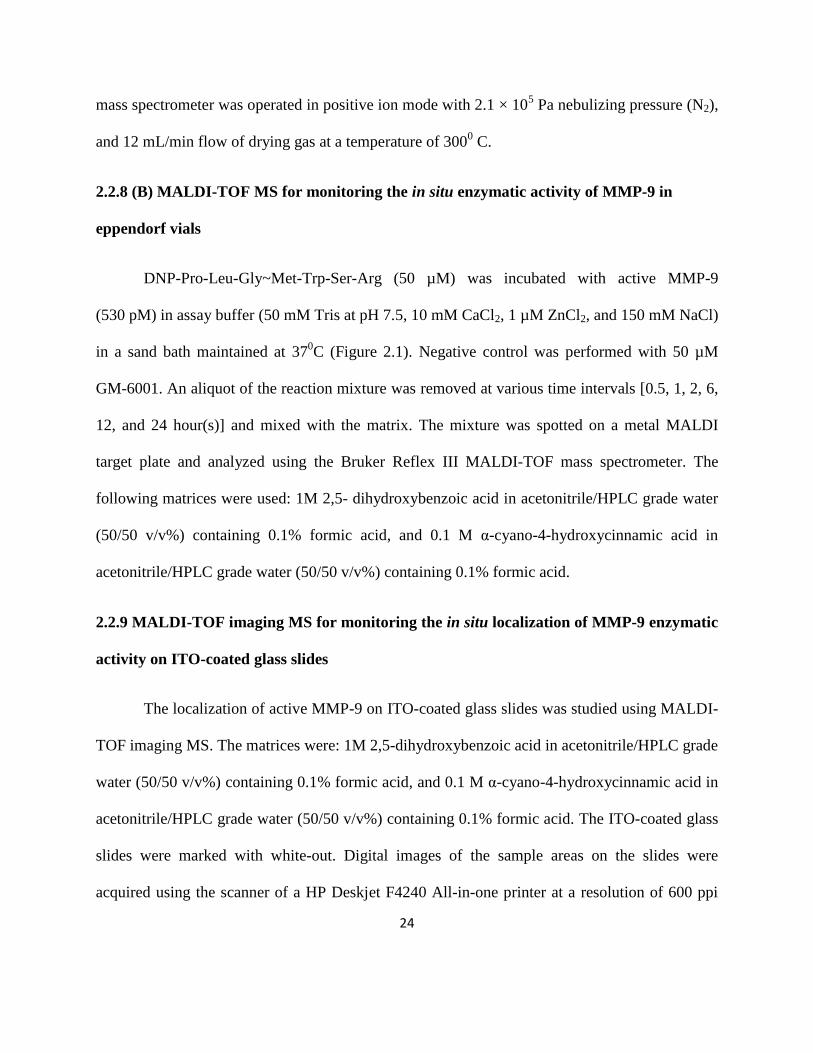
Figure 2.2 (A) MALDI-TOF MS image of in situ digestion on ITO-coated glass slide showing
localized trypsin activity at the triangular region (370
C, 30 minutes) ..........................................28
Figure 2.2 (B) MALDI-TOF mass spectrum of cytochrome c .....................................................29
Figure 2.2 (C) MALDI-TOF mass spectrum of cytochrome c digestion products by trypsin ......30
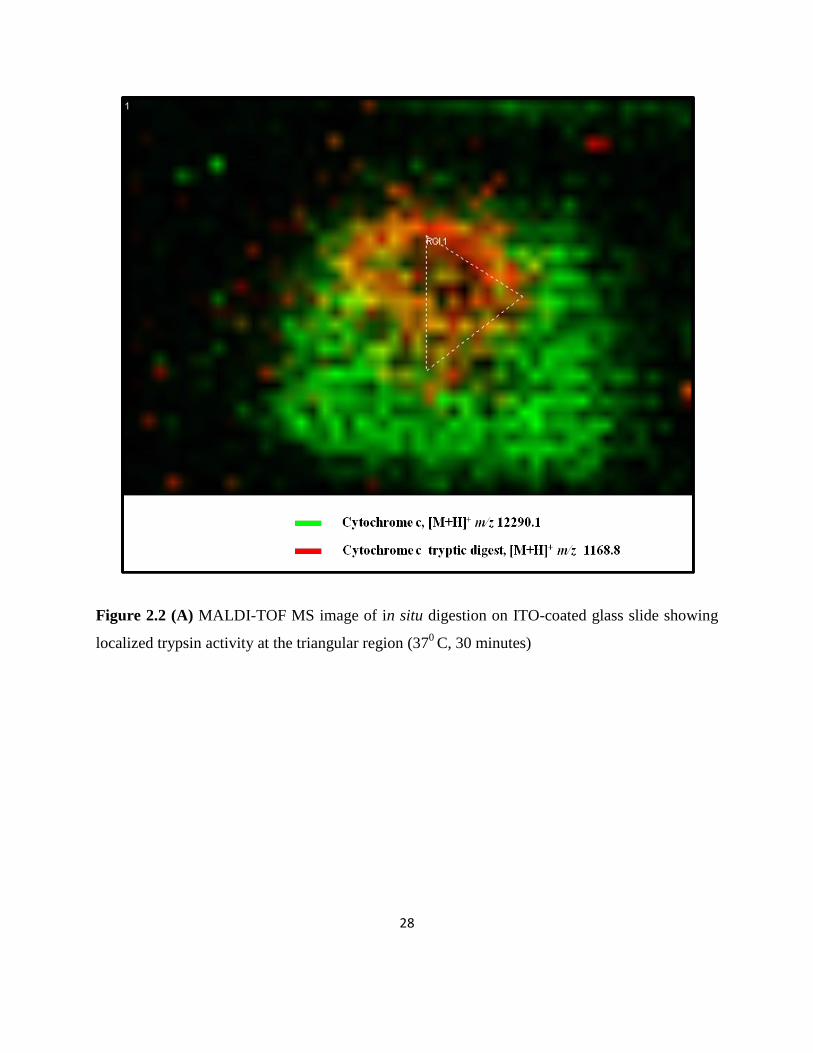
Figure 2.3 Activation of pro MMP-9 by APMA ..........................................................................31
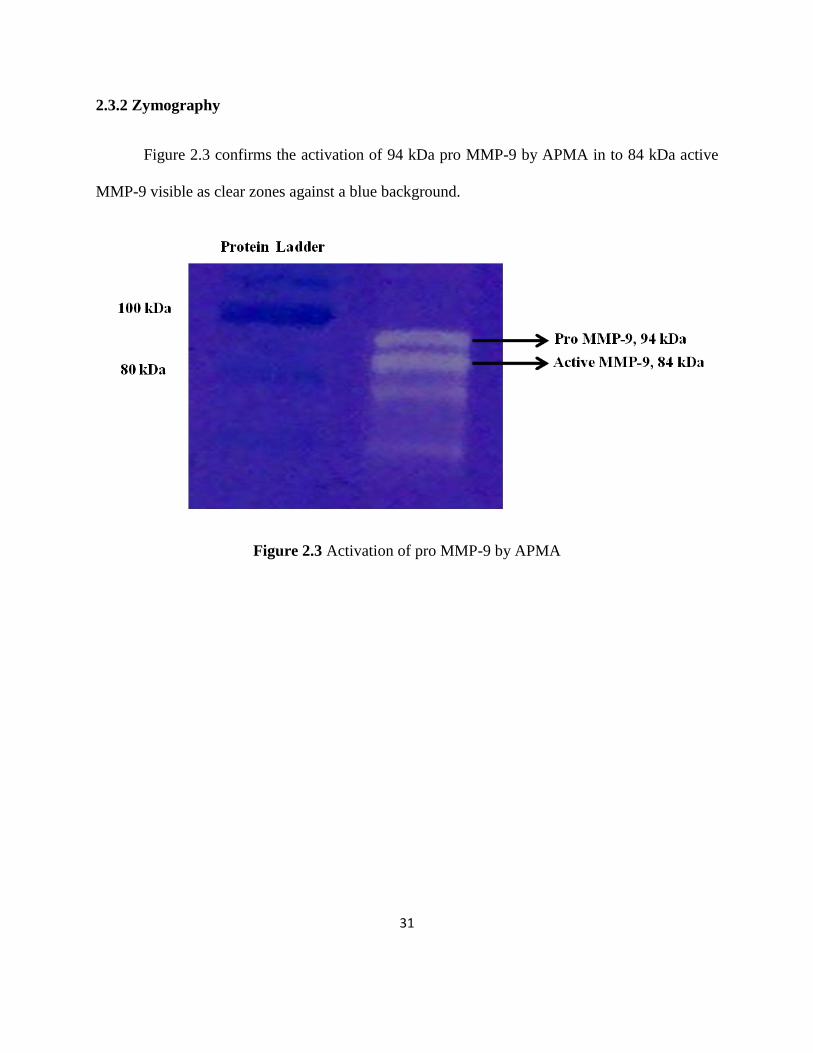
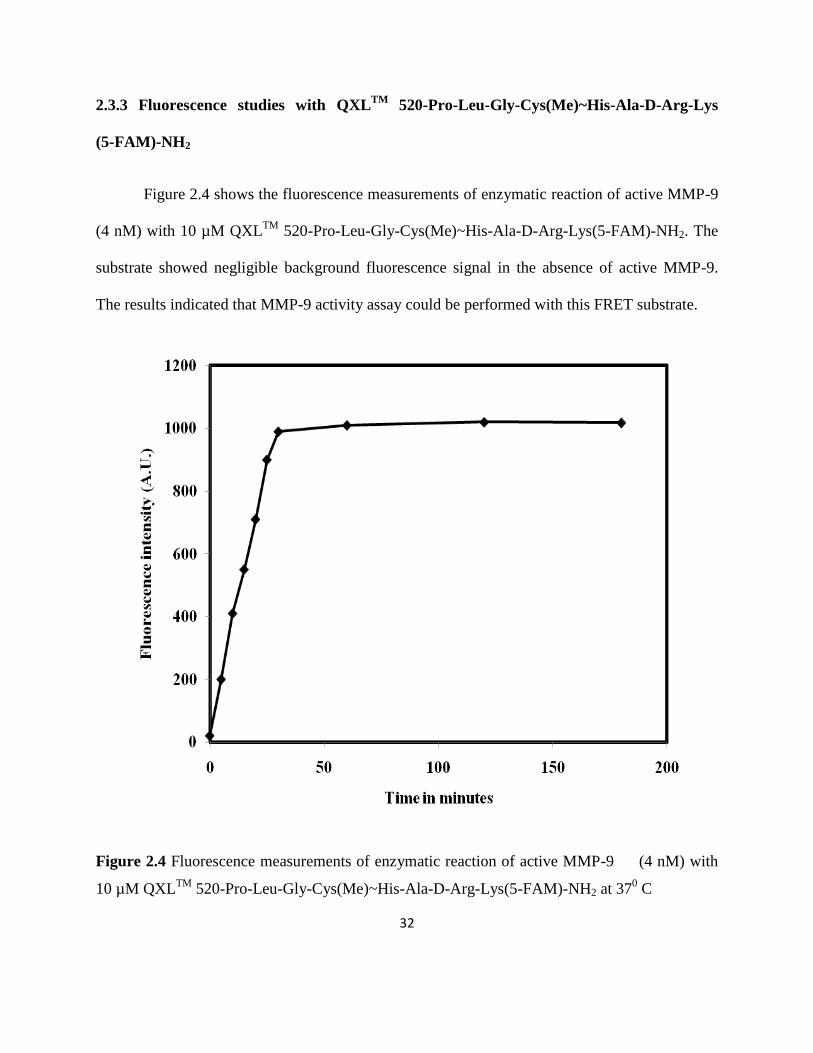
Figure 2.4 Fluorescence measurements of enzymatic reaction of active MMP-9 (4 nM) with
10 µM QXLTM
520-Pro-Leu-Gly-Cys(Me)~His-Ala-D-Arg-Lys(5-FAM)-NH2 at 370 C ............32
Figure 2.5 (A) MALDI-TOF mass spectrum of 10 µM QXLTM
520-Pro-Leu-Gly-Cys(Me)~His-
Ala-D-Arg-Lys-(5-FAM)-NH2 in DHB matrix .............................................................................34
Figure 2.5 (B) MALDI-TOF mass spectrum of 10 µM QXLTM
520-Pro-Leu-Gly-Cys(Me)~His-
Ala-D-Arg-Lys-(5-FAM)-NH2 in CHCA matrix ..........................................................................35
Figure 2.5 (C) MALDI-TOF mass spectrum of [(10 µM QXLTM
520-Pro-Leu-Gly-Cys
(Me)~His-Ala-D-Arg-Lys-(5-FAM)-NH2 + 4 nM active MMP-9), 370C, 12 hours incubation] in
DHB matrix ...................................................................................................................................36
Figure 2.5 (D) MALDI-TOF mass spectrum of [(10 µM QXLTM
520-Pro-Leu-Gly-
Cys(Me)~His-Ala-D-Arg-Lys-(5-FAM)-NH2 + 4 nM active MMP-9), 370C, 12 hours incubation]
in CHCA matrix ............................................................................................................................37
Figure 2.6 (A) LC chromatogram of the (substrate + active MMP-9) digest (370C, 24 hours of
incubation ......................................................................................................................................38

Figure 2.6 (B) ESI-MS spectrum of MMP-9 substrate, DNP-Pro-Leu-Gly~Met-Trp-Ser-Arg ...39
Figure 2.6 (C) ESI-MS spectrum of MMP-9 digestion product, DNP-Pro-Leu-Gly ....................39
Figure 2.6 (D) ESI-MS spectrum of MMP-9 digestion product, Met-Trp-Ser-Arg .....................39
Figure 2.7 (A) MALDI-TOF mass spectrum of 50 µM DNP-Pro-Leu-Gly~Met-Trp-Ser-Arg in
CHCA matrix ................................................................................................................................41
Figure 2.7 (B) MALDI-TOF mass spectrum of 50 µM DNP-Pro-Leu-Gly~Met-Trp-Ser-Arg in
DHB matrix ...................................................................................................................................42
Figure 2.7 (C) MALDI-TOF mass spectrum of product (Met-Trp-Ser-Arg), m/z 579 in CHCA
matrix ............................................................................................................................................43
Figure 2.7 (D) MALDI-TOF mass spectrum of product (Met-Trp-Ser-Arg), m/z 579 in DHB
matrix ............................................................................................................................................44
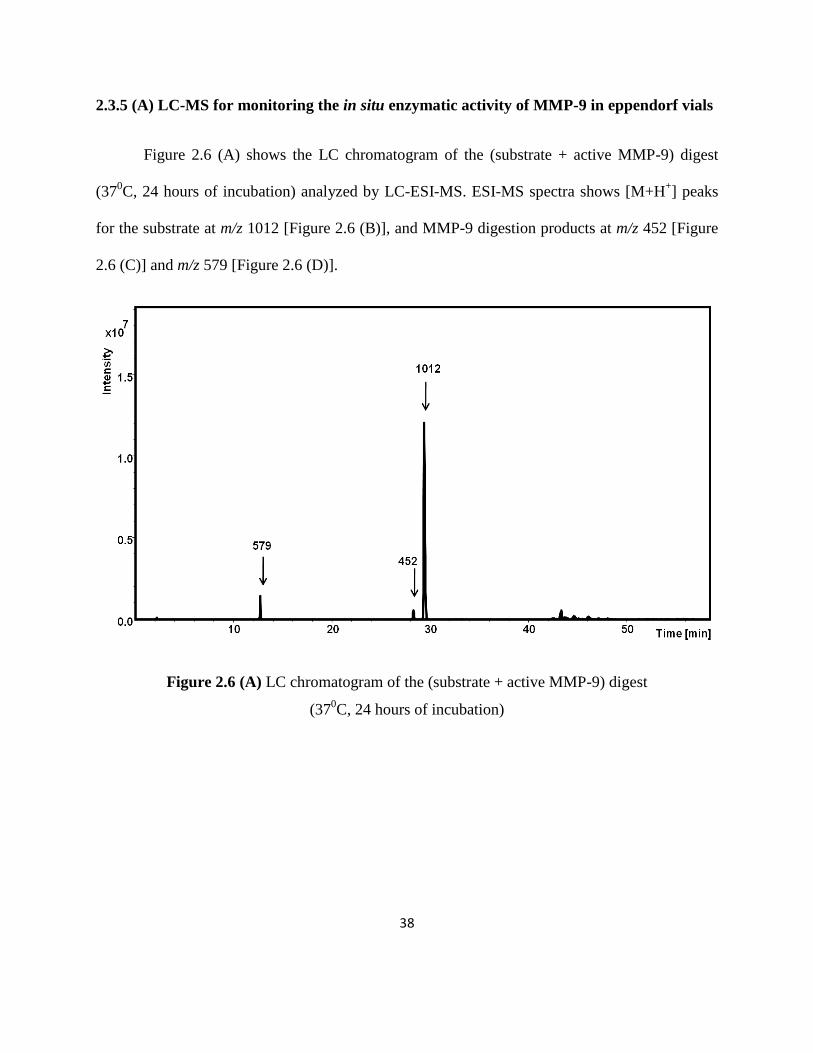
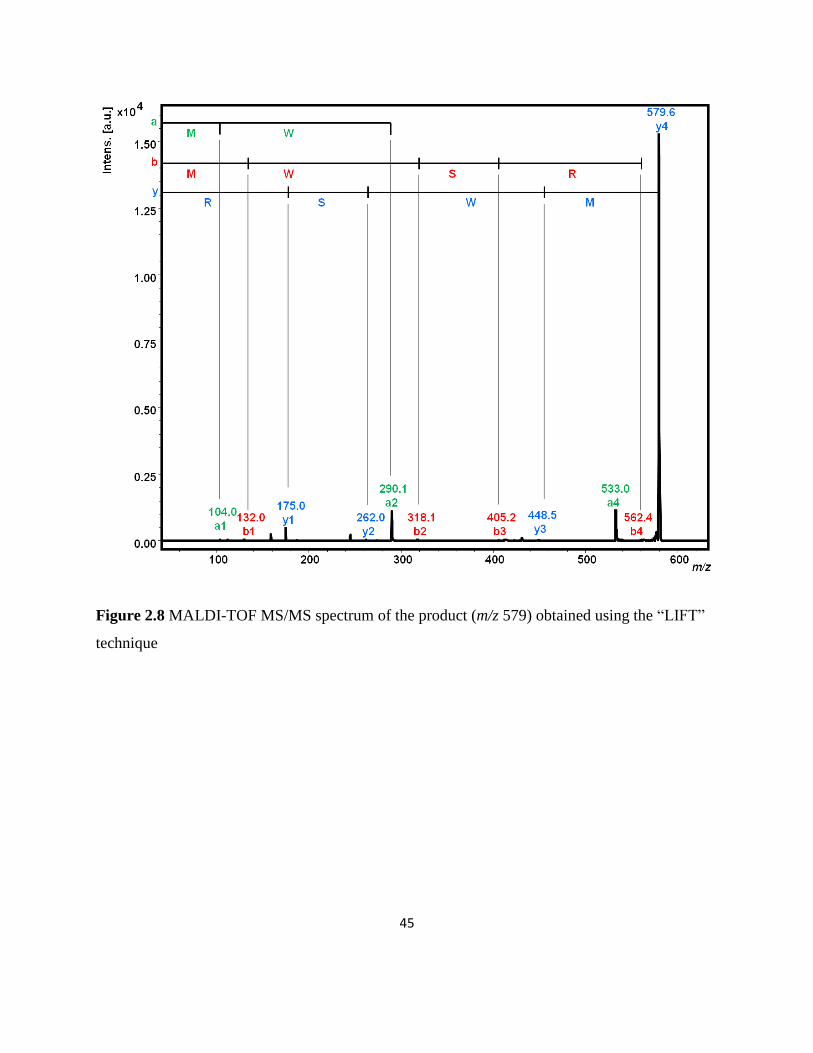
Figure 2.8 MALDI-TOF MS/MS spectrum of the product (m/z 579) obtained using the “LIFT”
technique .......................................................................................................................................45
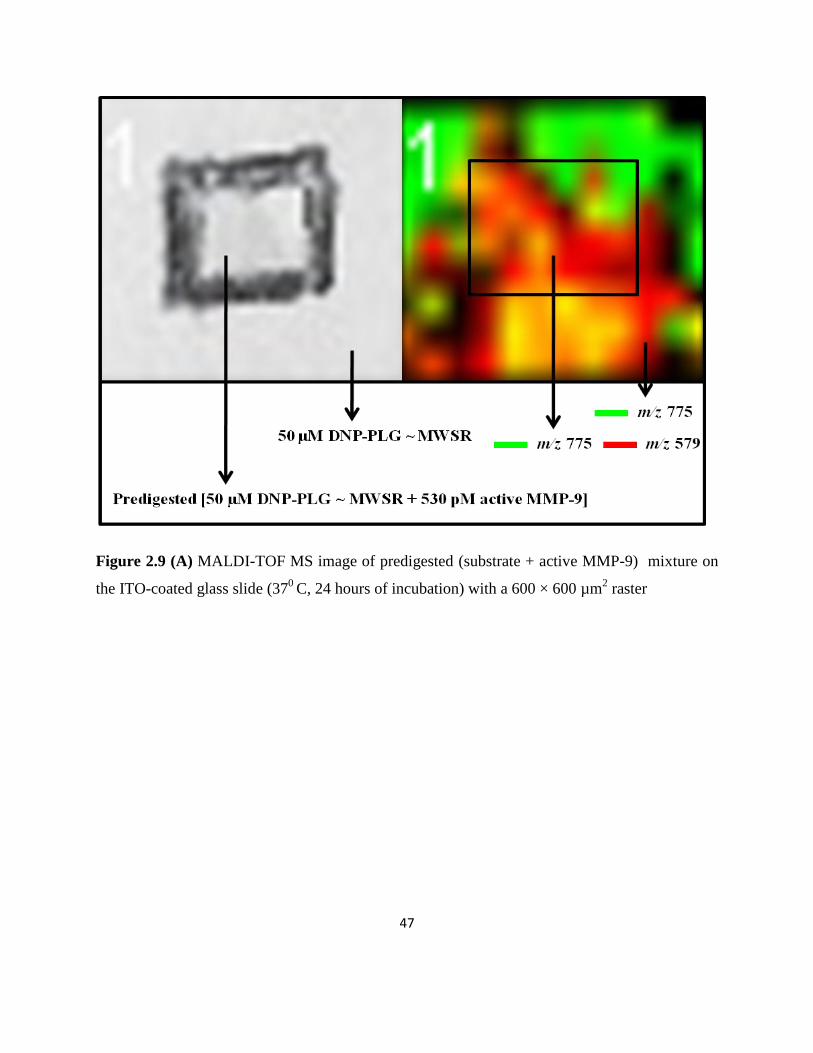
Figure 2.9 (A) MALDI-TOF MS image of predigested (substrate + active MMP-9) mixture on
the ITO-coated glass slide (370
C, 24 hours of incubation) with a 600 × 600 µm2 raster ............47
Figure 2.9 (B) MALDI-TOF MS image of in situ digestion on the ITO-coated glass slide with
active MMP-9 (370
C, 24 hours incubation) with a 600 × 600 µm2 raster ...................................49
Figure 3.1 (A) Digital (L) and MALDI-TOF MS image of unwashed control tissue spiked with
predigested [(50 µM DNP-PLG~MWSR-OH + 530 pM active MMP-9), 370
C, 24 hours
incubation] with a 600 × 600 µm2 raster .......................................................................................63
Figure 3.1 (B) MALDI-TOF mass spectrum of unwashed control tissue spiked with predigested
[(50 µM DNP-PLG~MWSR-OH + 530 pM active MMP-9), 370
C, 24 hours incubation] showing
the distribution of lipids from m/z 575 – m/z 579 .........................................................................64

Figure 3.2 Digital (L) and MALDI-TOF MS image of localized MMP-9 activity at a specific
region (red circle) on 70/30 v/v% ethanol/water washed control tissue with a 600 × 600 µm2
raster ..............................................................................................................................................65
Figure 3.3 Digital (L) and MALDI-TOF MS image (R) of control tissue spiked with predigested
[(50 µM DNP-PLG~MWSR + 530 pM active MMP-9), 370
C, 24 hours incubation] with a
600 × 600 µm2 raster .....................................................................................................................66
Figure 3.4 Digital (L) and MALDI-TOF MS image (R) of 70/30 v/v% ethanol/water washed
control tissue incubated with [50 µM DNP-PLG~MWSR + 530 pM active MMP-9] at 370C for
12 hours with a 600 × 600 µm2 raster ...........................................................................................67
Figure 3.5 Digital (Top) and MALDI-TOF MS (Bottom) image of 70/30 v/v% ethanol/water
washed microdialysis probe implanted tissue: (i) without treatment, (ii) incubated with (50 µM
DNP-PLG~MWSR + 1X protease inhibitor cocktail), and (iii) incubated with (50 µM DNP-
PLG~MWSR + 1X protease inhibitor cocktail + 50 µM GM-6001) [370
C, 24 hours incubation]
with a 600 × 600 µm2 raster ..........................................................................................................68
Figure 3.6 (A) Digital (Top) and MALDI-TOF MS/MS (Bottom) image of 70/30 v/v%
ethanol/water washed microdialysis probe implanted tissue: (i) without treatment, (ii) incubated
with (50 µM DNP-PLG~MWSR + 1X protease inhibitor cocktail), and (iii) incubated with
(50 µM DNP-PLG~MWSR + 1X protease inhibitor cocktail + 50 µM GM-6001) [370
C, 24
hours incubation] with a 600 × 600 µm2 raster .............................................................................69
Figure 3.6 (B) MALDI-TOF MS/MS spectrum of the product m/z 579 using the “LIFT”
technique .......................................................................................................................................70
Figure 3.7 (A) Comparison of all single spectral peak intensities of m/z 579.0 peak showing
significant difference between no treatment (green), treatment (red), and negative treatment
(blue) .............................................................................................................................................71
Figure 3.7 (B) Comparison of average spectral intensities of m/z 579.0 peak showing significant
difference between no treatment (green), treatment (red), and negative treatment (blue) ...........72

Figure 3.8 (A) Microdialysis probe implanted tissues incubated with 10 µM QXLTM
520- Pro-
Leu-Gly-Cys(Me)~His-Ala-D-Arg-Lys(5-FAM)-NH2 exhibited fluorescence around the
microdialysis probe indicating the localization of proteolytic activities around the probe ..........75
Figure 3.8 (B) Alcohol washed microdialysis probe implanted tissues incubated with (10 µM
QXLTM
520-Pro-Leu-Gly-Cys(Me)~His-Ala-D-Arg-Lys(5-FAM)-NH2 + 50 µM GM-6001) did
not block the fluorescence around the probe indicating the localization of proteolytic activities
not specific for MMPs around the probe ......................................................................................76
Figure 3.8 (C) 70/30 v/v% ethanol/water washed microdialysis probe implanted tissues:
(i) without treatment, (ii) incubated with (10 µM QXLTM
520-Pro-Leu-Gly-GM-6001)
Cys(Me)~His-Ala-D-Arg-Lys(5-FAM)-NH2 + 1X EDTA-free protease inhibitor cocktail), and
(iii) incubated with (10 µM QXLTM
520-Pro-Leu-Gly-Cys(Me)~His-Ala-D-Arg- Lys(5-FAM)-
NH2 + 1X EDTA-free protease inhibitor cocktail + 50 µM GM-6001) .......................................77

LIST OF TABLES
Table 1.1 Classifications of MMPs .................................................................................................5
Table 2.1 Theoretical molecular masses of bovine cytochrome c digestion by trypsin
(m/z 500 - m/z 1600) .....................................................................................................................69
Table 3.1 Peak statistic report using ClinProTools software ........................................................73

GLOSSARY
ABBREVIATIONS
AEBSF 4-(2-Aminoethyl) benzenesulfonyl fluoride hydrochloride
APMA p-aminophenylmercuricacetate
CHCA α-cyano-4-hydroxycinnamic acid
DNP 2,4-dinitrophenyl
ECM Extracellular matrix
EDTA Ethylenediaminetetraacetic acid
FAM Carboxyfluorescein
FBR Foreign body response
FRET Förster resonance energy transfer
GPI Glycosylphosphatidylinositol
IL-8 Interleukin-8
ITO Indium tin oxide
MALDI-TOF MS Matrix-assisted laser desorption ionization-time-of-flight
mass spectrometry
MCP-1 Monocyte chemoattractant protein-1
MMPs Matrix metalloproteinases
MNGCs Multinucleated giant cells
O.C.T. Optimum cutting temperature
PES Polyethersulfone
RECK Reversion-inducing cysteine-rich protein with kazal motifs
TGF-β Transforming growth factor-β
TIMPs Tissue inhibitors of metalloproteinases
TNF-α Tumor necrosis factor- α
1
1. RESEARCH SIGNIFICANCE AND BACKGROUND
1.1.1 Biomaterials and the foreign body response
Materials used in constructing medical devices such as biosensors, drug-eluting stents,
artificial heart valves, and hip prosthesis with a functional life ranging from temporary use to
permanent implantation are defined as biomaterials.1,2
The primary response of the nonspecific
immune system evoked by implanted biomaterials is the foreign body response (FBR) or the
foreign body reaction.3
The FBR is present at the tissue/material interface throughout the in vivo lifetime of a
medical device and is characterized by a sequence of events including nonspecific adsorption of
blood and tissue fluid proteins to the biomaterial surface, formation of blood-based provisional
matrix, adhesion of monocytes/macrophages, fusion of macrophages to form multinucleated
giant cells (MNGCs), formation of granulation tissue, and eventually formation of fibrous
capsule.2,4
The fibrous capsule confines the implanted biomaterial and prevents it from
interaction with the implant site healthy tissue.2 In some cases, the events in the FBR can render
the biomaterial unfit for long-term use.1
Several major efforts to engineer biocompatible devices that can avoid the FBR have
been unsuccessful due to lack of knowledge of the complex biological effectors of the FBR.5 It is
therefore important to understand the biological nature of the FBR in order to improve the
lifetime of the longer-term implanted biomaterial.6 The progression of the FBR is regulated by a
number of mediators including cytokines, chemokines, and matrix metalloproteinases (MMPs)
produced by inflammatory cells in the local environment. The outcome of the FBR requires the
2
spatial and temporal regulation of these mediators. The intricate relationship between the FBR
and the expression of these mediators remains to be explored as it is poorly understood.3
Information about these mediators would eventually aid in understanding the cascade of
processes during the FBR and in developing improved long-term biomaterials.
MMPs are a large and diverse group of enzymes (23 human MMPs) that play key roles in
regulating the FBR.7 Several MMPs including MMPs -1,-2,-3,-7,-8,-9,-10, and -12 are
involved in different stages of the wound healing process.8,9
Differences in spatial, temporal, and
inducible expression of MMPs indicate their unique roles.10
Precise spatiotemporal regulation of
MMPs confines their diverse proteolytic activities to the necessary conditions and locations.11
Few methods are available to determine the localization of active MMPs in biological
samples. However, there is no multiplexed assay to visualize the localization of several active
MMPs. The aim of this project is to develop a new bioanalytical method to visualize the
localization of active MMP-2 and MMP -9 at the implant site in ex vivo tissue samples. In the
future, this approach can be extended to visualize the localization of several active MMPs at the
implant site in ex vivo tissue samples.
1.1.2 Role of MMPs in the FBR
During the onset of the FBR, coagulation causes the formation of a blood-based
provisional matrix around the implanted biomaterial.3 In response to the cascade of molecular
signals during the inflammatory response, leukocytes migrate through this extracellular matrix
(ECM) to reach the inflammation site. Remodeling of the ECM is accomplished by the MMP
family to facilitate the migration of leukocytes.3,12

3
Proteolytic MMPs play a role in modulating the adhesion and subsequent fusion of
macrophages on the biomaterial surface. The macrophages and the foreign body giant cells
adhered to the surface of the biomaterial can secrete active MMPs to modulate the FBR and
wound healing.13
Moreover, MMPs modulate signaling during the FBR. The ECM serves as a reservoir for
various growth factors, and signaling molecules including cytokines, and chemokines. ECM
remodeling releases these molecules resulting in the activation of phagocytes.3
1.1.3 Role of MMPs in inflammation
MMPs expression has been observed to increase in almost every human disease marked
by the presence of inflammation.14
MMPs are modulators of inflammatory responses.15
MMPs
can either enhance or dampen inflammatory response. MMPs can stimulate inflammation by
cleaving the precursors of the pro-inflammatory cytokines TNF-α, IL-1β, and TGF-β.12,16
On the
other hand, MMPs may downregulate inflammation by cleaving chemokines such as
MCP-1/CCL2 into their receptor antagonizing mediators.15,17
Chemokines are a family of
chemotactic proteins that facilitate leukocyte chemotaxis by creating a gradient that acts as a
guidance signal for the migration of leukocytes.12
MMP mediated cleavage of chemokines might
result in enhancement, inactivation, or antagonism of chemokine activities.9 Additionally, MMPs
might also have an indirect effect on other proteinases that bind, retain, or concentrate
chemokines in certain locations.9,16

4
1.1.4 MMPs
MMPs (also called as matrixins) are a family of structurally and functionally related zinc-
dependent endoproteinases that are collectively responsible for the degradation of extracellular
matrix and non-matrix components during cellular migration and tissue remodeling.11,18-20
MMPs
fall under the metzincin superfamily of metalloproteinases characterized by a catalytic zinc atom
in the active site followed by a methionine containing Met-turn.11,21
Gross and Lapiere were the
first to report about MMP-1 in an attempt to establish how a tadpole loses its tail during
metamorphosis.22
To date, there are 24 vertebrate MMPs, and 24 human homologues with two
duplicated genes encoding MMP-23.11,23
MMPs are synthesized in an inactive pro-form (zymogens).11
Except MMP-23, all MMPs
contain a signal peptide at the N-terminal that leads them to the secretory pathway.11,24
Then,
MMPs can be secreted from the cell or anchored to plasma membrane, thereby confining their
catalytic activity to membrane proteins and proteins in the secretory pathway or extracellular
space.11,16
Several MMP family members such as MMP-1, MMP-2, MMP-11, and MMP-13
were found as intracellular proteins, with unclear functions.22-24
A large number of MMPs are
classified into four secreted classes namely collagenase, gelatinase, stromelysin, and matrilysin.13
Seven MMPs are classified into one of the three membrane-bound classes: type I and type II
transmembrane bound, and glycosylphosphatidylinositol (GPI) anchored.13
Seven MMPs are not
classified in to any of the above categories. MMPs are known to perform multiple and
overlapping functions.13
Table 1.1 shows the classifications of MMPs.11,13

5
Main Group Sub - Group MMPs
Secreted
MMPs
Collagenases MMP-1, MMP-8, MMP-13, and MMP-18
Gelatinases MMP-2, and MMP-9
Stromelysins MMP-3, and MMP-10
Matrilysins MMP-7, and MMP-26
Other
secreted
MMPs
__________ MMP-11, MMP-12, MMP-19, MMP-20,
MMP-21, MMP-27, and MMP-28
Membrane-
type MMPs
Type I
transmembrane
MMP-14, MMP-15, MMP-16, and MMP-24
Type II
transmembrane
MMP-23A, and MMP-23B
GPI anchored MMP-17, and MMP-25
Table 1.1 Classifications of MMPs11,13
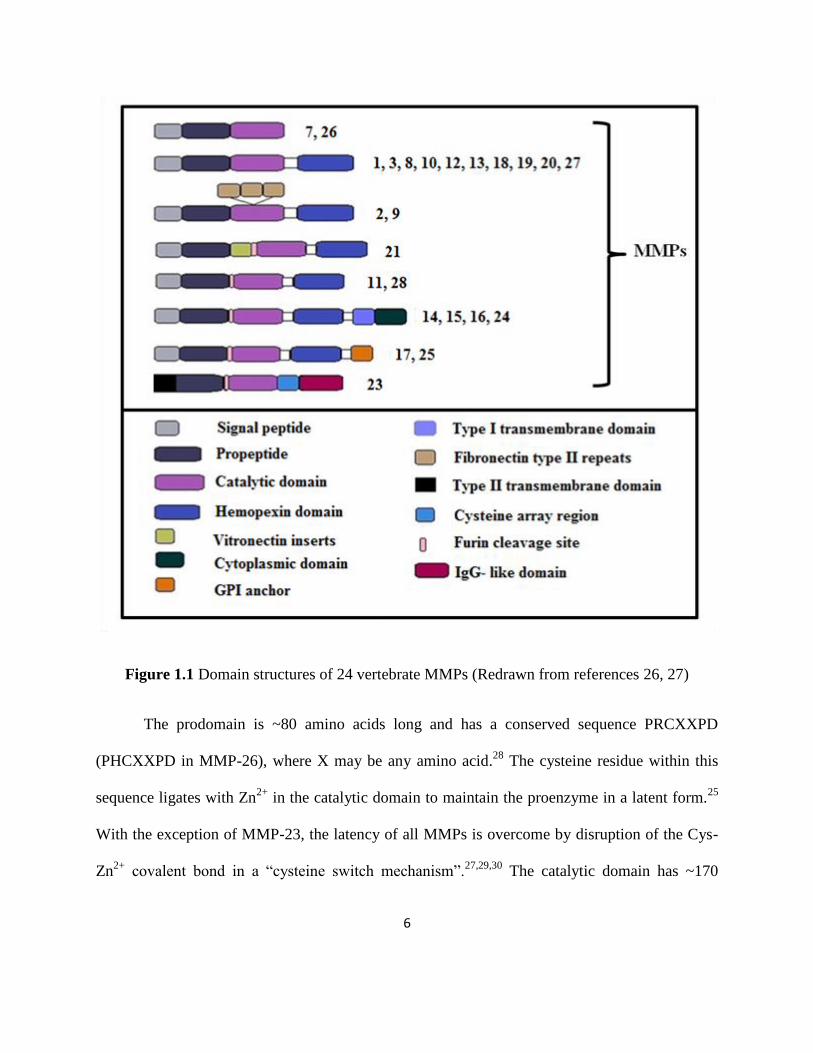
The structure of MMPs is composed of several conserved functional domains.25
Figure 1.1 shows the domain structures of all MMPs.26,27
All MMPs have 3 domains in common:
signal peptide for protein secretion, prodomain for functional regulation, and catalytic domain
for substrate processing.12
6
Figure 1.1 Domain structures of 24 vertebrate MMPs (Redrawn from references 26, 27)
The prodomain is ~80 amino acids long and has a conserved sequence PRCXXPD
(PHCXXPD in MMP-26), where X may be any amino acid.28
The cysteine residue within this
sequence ligates with Zn2+
in the catalytic domain to maintain the proenzyme in a latent form.25
With the exception of MMP-23, the latency of all MMPs is overcome by disruption of the Cys-
Zn2+
covalent bond in a “cysteine switch mechanism”.27,29,30
The catalytic domain has ~170

7
amino acids and a Zn2+
binding site HEXXHXXGXXH (where X may be any amino acid), in
which the three histidine residues coordinate with the catalytic zinc ion.31
The catalytic domain
also has a structural zinc ion and one or more calcium ions.32
With the exception of MMP-7, MMP-23, and MMP-26, all MMPs contain a hemopexin-
like domain (~210 amino acids) that is connected to the catalytic domain by a proline-rich hinge
region.16,25,33
The hemopexin domain contributes to substrate recognition, enzyme activation,
protease localization, internalization, and degradation.27,34
Fibroblasts, endothelial cells, and inflammatory cells including granulocytes,
lymphocytes, mast cells, dendritic cells, and monocytes-macrophages are the major source of
MMPs.35
MMPs are synthesized in an inactive pro-form (zymogens) and are activated by other
MMP family members or by activators such as serine proteases.36,37
The activities of MMPs are
tightly regulated at different levels namely gene activation and transcription, translation, latent
enzyme secretion, proenzyme activation, cell surface localization, and inhibition by endogenous
inhibitors like tissue inhibitors of metalloproteinases (TIMPs), reversion- inducing cysteine-rich
protein with kazal motifs (RECK), thrombospondin, and α2-macroglobulin.10,12,25,35,37-40
The
effect of posttranslational modification on MMPs activity is not fully understood.35
The proteolytic activities of MMPs influence cellular processes including cell
proliferation, migration, and adhesion.11
Maintaining the equilibrium between extracellular
matrix deposition and degradation is important for normal tissue development.19
The
fundamental physiological processes that involve tissue remodeling, such as wound healing,
angiogenesis, and fetal development depend on the controlled and concerted activity of
8
MMPs.11,20
Aberrant regulation of MMPs is implicated in a wide variety of disease states
including tumor invasion and metastasis, arthritis, tissue ulceration, periodontitis, and
atherosclerosis.18,20
1.2 Methods to study the spatial localization of MMPs
1.2.1 Immunohistochemical staining
Two methods are available for performing immunohistochemical staining to identify
MMPs in ex vivo tissue samples. The direct method is based on the direct application of a
primary antibody to the processed tissue whereas the indirect method is based on the
identification of an unlabeled primary antibody by a labeled secondary antibody. The latter
method is more sensitive and is therefore preferred for the identification of MMPs in local tissue
samples. A primary antibody that can specifically recognize the MMP species without cross-
reaction with other molecules is desired and therefore monoclonal antibodies are suitable for this
purpose. Immunohistochemical staining is limited to a few MMPs because of the non-
availability of commercial antibodies specific for all rat MMPs. Nonspecific immunostaining is
sometimes obtained in this method. Immunoassays and immunoblotting using tissue
homogenates or tissue culture media are some of the other beneficial methods to validate the data
and to avoid misinterpretation of false positive and false negative staining.41
However, these
techniques provide quantitative information of total MMPs concentration, but cannot distinguish
between pro, active, and TIMP-complexed (inactivated) forms of MMPs.
9
1.2.2 In situ zymography
In situ zymography enables visualization of localized MMPs activities in tissue samples
by contacting the tissue section with either a photographic emulsion containing gelatin or a
fluorescence-labeled substrate.42,43
After the incubation period, the activity of MMPs can be seen
as white spots in a dark background or as black spots in a fluorescent background.43
The
technique is limited to MMPs-2, -7, and -9.43
1.2.3 Fluorescence-based imaging
Förster resonance energy transfer (FRET) MMPs substrates contain two fluorophores
situated at a distance of less than 100 Å. The emission wavelength of the donor overlaps with the
excitation wavelength of the acceptor and the donor can transfer energy to the acceptor in a non-
radiative fashion. Cleavage of the substrate by MMPs relieves the quenching and results in an
increase in fluorescence intensity. The change in fluorescence intensity correlates with the
activity of MMPs.44
The technique is limited by the number of fluorophores that can provide
non-overlapping emission bands for the products of MMPs activity.
1.2.4 Near Infrared (NIR) fluorescence imaging
Quenched NIR fluorogenic MMPs substrates permit the noninvasive visualization of
MMPs activity in whole animals. NIRF substrates were developed based on the FRET
mechanism. Cleavage of the substrate by MMPs rescues the quenching and results in an increase
in NIR fluorescence intensity.44,45
Higher penetration of photons emitted by the NIR
10
fluorophores, and low autofluorescence of the tissues in the NIR spectral region make this
technique ideal for tissue imaging.45
1.3 Imaging mass spectrometry (IMS)
Immunohistochemistry and fluorescence microscopy are usually employed to image the
localization of MMPs within a specific tissue section. Unlike the above-mentioned techniques,
IMS uses molecular mass as the endogenous label thereby eliminating the need for special
labeling agents.46
The localized distribution of active MMPs in ex vivo tissue samples can be
visualized in an indirect manner by monitoring the products formed as a result of activity of
MMPs on specific substrates using IMS.
Imaging MS techniques provide information on the identity and spatial distribution of
molecules of interest in tissue sections, and single cells.47,48
Low resolution MALDI-TOF MS
images (50–500 µm) indicate the localization of the molecule in a tissue or organ whereas high
resolution SIMS-TOF MS images (5–20 µm) provide information about sub-cellular localization
of the molecule.47
1.3.1 MALDI imaging MS (MALDI-IMS)
Imaging mass spectrometry experiments can be performed on a MALDI-TOF mass
spectrometer. Image reconstruction is achieved with custom-made software that also controls the
movement of the sample stage over the specified area on the target plate. Sample preparation,
sensitivity of the ionization step, spatial resolution, and the speed of the technique (laser
repetition rate) influence the analyte localization information obtained using MALDI-IMS.49

11
1.3.2 MALDI-TOF instrumentation
Matrix-assisted laser desorption ionization (MALDI) is a soft ionization technique in
which the sample is co-crystallized with a solid matrix that absorbs at the wavelength of the
laser. The gas-phase ions produced by irradiating the sample with a pulsed-laser are directed to
the mass analyzer.50
A time-of-flight (TOF) mass analyzer separates ions based on the differences in their
velocities.50
Ions are accelerated from the ion source into the “field-free” drift region towards the
detector. The TOF mass spectrometer measures the time required for an ion to travel from the
ion source to the detector. During the instantaneous acceleration process, all the ions receive the
same kinetic energy but have different velocities because of the difference in m/z values. The
ions separate in to groups according to their velocity during their flight through the “field-free”
region between the ion source and the detector. In the reflectron mode, an electrostatic mirror is
used to reflect ions of the same m/z values but with small differences in kinetic energies to
improve resolution.51
1.3.3 MS/MS spectra using the LIFT technique
MS/MS spectra were obtained using the “LIFT” technique in the MALDI- TOF/TOF
mass spectrometer that produces fragment ions by unimolecular decay of the precursor ions
without the use of collision gas. Ions coming out of the ion source are subjected to 8 kV
accelerating voltage. Fragmentation occurs during the long flight time of the ions. The selected
precursor and fragment ions are isolated using a timed ion selector. The ions are then subjected
to a potential lift of 19 kV in the “LIFT” device and mass analyzed in a single spectrum.52

12
1.3.4 Working principle
The tissue sample preparation step involves obtaining a thin tissue section of 5-20 µm
thickness followed by thaw-mounting the section on to a precooled (-210 C) MALDI target plate.
Matrix is applied directly to the tissue and allowed to air-dry.53
A focused pulsed laser beam is
rastered across the tissue section.54
A complete mass spectrum is acquired at specific (x, y)
coordinates from the tissue using a TOF mass analyzer. Both the sampling location and the ions
detected are recorded. The process is repeated in an ordered array across the tissue surface. The
pixels representing the sampling positions are compiled to generate a picture image for each of
the detected molecule. Any m/z signal is displayed with its relative intensity over the entire array,
producing a density map of the molecule in the array area.53
1.3.5 Tissue sample preparation
Tissue sample preparation is an important step in tissue analysis by MALDI imaging MS.
The objective of the sample preparation step is to get MS-compatible tissue samples.48
Samples
should be handled properly from the time of tissue harvest up to mass spectral analysis.
Immediate snap-freezing of the dissected tissue prevents proteolytic degradation. Tissue sections
of 10-20 µm thickness is normally used for imaging MS work. Ultra thin tissue sections can be
very fragile and susceptible to tearing. Thicker tissue sections require longer drying times and
affect the performance of the mass analyzer by their insulating properties.47
Limiting the
thickness of tissue sections and avoiding the use of polymer embedding material during the
cryomicrotome cutting of the tissue sections is desired. It is beneficial to deposit the tissue
section on to a cold slide followed by rapidly warming the tissue and the slide (thaw mounting).
13
Sections should be completely thawed when mounted on to an ITO-coated glass slide to avoid
freezer burn caused by the residual moisture. Tissue sections should be stored at -800 C until
analysis. 48,55,56
In this research, placement of tissues on the sample holder without polymer embedding
material was not possible because of the small size of the tissues. Tissues were maintained at the
desired orientation on the sample holder by using optimum cutting temperature polymer. Great
care was taken to keep the tissue surface polymer-free. In case of accidental contamination of the
tissue surface with the polymer embedding material, the 70/30 v/v% ethanol/water wash would
dissolve the polymer and keep the tissue surface polymer-free.
1.3.6 Tissue washing step
The objective of the tissue washing step is to wash away contaminants such as optimum
cutting temperature (O.C.T.) polymer as well as endogenous molecular species such as lipids and
biological salts that might affect the ionization efficiency of the analytes of interest.48,55
Segregation of salts from the matrix crystals will result in an inhomogeneous sample surface and
these local variations can influence the ionization process.48
The MS signal quality and intensity
are improved by the removal of lipids that negatively affect the signal.57
It is presumed that the
solvent washing step will precipitate most proteins in situ and localize them within their cellular
compartments.55
A typical washing step involves the use of ice-cold 70-80% ethanol for the removal of
salts. Organic solvents such as chloroform, acetone, hexane, toluene, xylene, and
dichloromethane are known to remove lipids.48
But, there is lack of knowledge of the effect of

14
these solvents on enzyme activity. The different solvents that were tried in this study (70%
ethanol, 80% methanol, and isopropanol) are known to preserve enzyme activity.
1.3.7 Matrix selection and deposition
Selection of an appropriate matrix can enhance the sensitivity of the MS technique
towards specific molecules.48
Matrix deposition should result in homogeneous matrix crystals on
the tissue surface without delocalizing the analytes. High resolution tissue imaging requires the
formation of matrix crystals on the tissue surface with dimensions smaller than or equal to the
diameter of the ionization laser beam. The matrix deposition method should be robust and
reproducible.48,49
1.3.8 Visualizing the spatial localization of active MMP-2 and MMP-9
The conventional imaging techniques using fluorescence labels cannot be used to monitor
the localization of several active MMPs due to the non-availability of longer wavelength
fluorophores that provide non-overlapping emission bands for multiplexed MMPs activity. Most
of the commercially available shorter wavelength FRET substrates cannot be used for ex vivo
tissue imaging studies because of the higher autofluorescence of tissues at the wavelengths used.
IMS is an emerging technique that eliminates the need for special labeled substrates since it uses
molecular mass for identification.
In this research, an indirect MALDI-IMS scheme that employed substrates specific for
MMP-2 and MMP-9 was tested to visualize the spatial localization of active MMP-2 and MMP-9
at the implant site in ex vivo tissue samples. This novel MALDI-IMS approach for monitoring
the localization of active MMP-2 and MMP-9 can be extended to other MMPs by selecting

15
specific synthetic substrates, thus making this a multiplexed technique to visualize the
localization of all active MMPs in ex vivo tissue samples. This opens up new possibilities for
using IMS as a multiplexed imaging technique for several biological applications.

16
2. IN SITU STUDIES TO IMAGE THE SPATIAL LOCALIZATION OF
ACTIVE MMP-9
2.1 Introduction
Enzyme activity, which results in a mass difference between the substrate and its
products, can be monitored by mass spectrometry.58
Initial studies were performed to image the
in situ enzymatic activity of trypsin on cytochrome c using MALDI-TOF MS.
MMPs have broad and overlapping substrate specificities towards their natural substrates.
Synthetic MMPs substrates are advantageous in that they are more specific than the natural
MMPs substrates.59
In this chapter, 2,4-dinitrophenyl(DNP)-Pro-Leu-Gly~Met-Trp-Ser-Arg, a
self-quenched FRET peptide substrate specific for the gelatinases MMP-2 and MMP-9, was used
for the in situ detection of MMP-9 activity using MALDI-TOF MS. The MMP-9 activity assay
scheme is shown in Figure 2.1.
GM-6001, a broad spectrum MMPs inhibitor was employed to achieve efficient
inhibition of MMP-9 activity in situ.60,61
The inhibition of MMP-9 activity by GM-6001 is
crucial to validate the assay scheme for in vivo detection of MMPs activity to rule-out proteolytic
activities not related to MMPs.

17
Figure 2.1 MMP-9 activity assay scheme
2.2 Experimental section
2.2.1 Chemicals
Trypsin (Trypsin gold, Mass spectrometry grade) was purchased from Promega (Promega
US, Madison, WI, USA). Cytochrome c from bovine heart was purchased from Sigma-Aldrich
(St. Louis, MO, USA). MMP-9 (recombinant rat proenzyme, 94 kDa monomer, specific activity
> 710 picomoles/min/µg) was purchased from R & D Systems Inc. (Minneapolis, MN, USA).
DNP-Pro-Leu-Gly~Met-Trp-Ser-Arg, p-aminophenylmercuricacetate, GM-6001 (Galardin or N-
[(2R)-2-(Hydroxamidocarbonylmethyl)-4-methylpentanoyl]-L-tryptophan methylamide, a broad-
spectrum MMPs inhibitor), and acetonitrile were purchased from EMD chemicals (Gibbstown,
NJ, USA). QXLTM
520-Pro-Leu-Gly-Cys(Me)~His-Ala-D-Arg-Lys(5-carboxyfluorescein or
18
5-FAM)-NH2, a longer wavelength FRET substrate specific for MMPs-1, -2, -8, - 9, -12, -13 and
-14 was purchased from Anaspec (Fremont, CA, USA). Formic acid and HPLC grade water were
purchased from Alfa Aesar (Ward Hill, MA, USA). Matrix chemicals, 2,5–dihydroxybenzoic
acid (DHB), and α-cyano-4-hydroxycinnamic acid(CHCA) were purchased from Sigma-Aldrich
(St. Louis, MO,USA). Indium tin oxide (ITO)-coated glass slides were purchased from Bruker
Daltonics Inc. (Billerica, MA, USA). Stock solutions of DNP-Pro-Leu-Gly~Met-Trp-Ser-Arg
and QXLTM
520-Pro-Leu-Gly-Cys (Me)~His-Ala-D-Arg-Lys (5-FAM)-NH2 were prepared in
DMSO. Further dilutions were carried out with the assay buffer (50 mM Tris at pH 7.5, 10 mM
CaCl2, 1 µM ZnCl2, and 50 mM NaCl).
Novex 10% zymogram (gelatin) gel (1.0 mm, 12 well), LDS sample buffer (4X), MES
SDS running buffer (20X), simplyblue safestain (Coomassie G-250 stain), and XCell surelock
mini cell system were purchased from Invitrogen (Carlsbad, CA, USA). Prestained protein
ladder was purchased from New England Biolabs Inc. (Ipswich, MA, USA). All dilutions were
made with HPLC-grade water. Zymography was performed according to the manufacturer’s
instructions.
2.2.2 (A) MALDI-TOF MS system
Mass spectrometric analyses were performed in the reflectron, positive mode at 25 kV
accelerating potential on a Reflex III MALDI-TOF mass spectrometer equipped with a pulsed
nitrogen laser working at 337 nm at a laser repetition rate of 8.1 Hz (Bruker Daltonik, Bremen,
Germany). The external calibration of the instrument was performed using a solution of peptide
calibration standard II (Bruker Daltonics Inc., Billerica, MA,USA) containing angiotensin II,
angiotensin I, bradykinin fragment 1-7, substance P, bombesin, ACTH clip 1-17, ACTH clip

19
18-39, and somatostatin 28, and DHB matrix solution {[M+H]+: 1046.5, 1296.7, 757.4, 1347.7,
1619.8, 2093.1, 2465.2, 3147.5, and 137.0}. The matrix solution was sprayed using an in house-
built nebulizer.62
MS/MS spectra were obtained using the “LIFT” technique with a Bruker
Ultraflex II MALDI-TOF/TOF mass spectrometer (Bruker Daltonik, Bremen, Germany).
The analysis was performed using Bruker Flexanalysis 2.4 software. Mass spectral data
sets were acquired using the Fleximaging software (Bruker Daltonik, Bremen, Germany) with a
raster width of 600 µm. Each pixel composed of 300 individual laser shots collected in 50-shot
increments from four positions within a single spot. Molecular images were visualized using the
Fleximaging software.
2.2.2 (B) Matrix selection and deposition
Sinapinic acid (SA), 2,5-dihydroxybenzoic acid (DHB), and α-cyano-4-hydroxycinnamic
acid (CHCA) are the conventional matrices for imaging MS.46
Sinapinic acid was not considered
for this research as it is the matrix of choice for protein analysis in tissue sections.49
The
matrices, α-cyano-4-hydroxycinnamic acid and 2,5-dihydroxybenzoic acid, were selected as they
are well known for highest sensitivity in peptide analysis and for good signal intensity,
respectively.48
The matrices were dissolved in acetonitrile/HPLC grade water (50/50 v/v%)
containing 0.1% formic acid.
High resolution tissue imaging requires homogeneous matrix deposition without inducing
lateral migration of analytes.49
The matrix solution was sprayed over the tissue sections using a
home-built nebulizer. The spray distance was optimized to avoid excessive wetting of tissue
sections marked by dripping of matrix solution from the tissue sections, resulting in
20
delocalization of analytes. Multiple spray cycles of 150-200 µL were performed up to 8 times on
a single tissue section from a distance of approximately 25 cm measured with a ruler. The total
volume of the matrix solution per tissue section was 1.5 mL. Tissue sections on the glass slide
were air-dried at room temperature for 5 minutes in between the spraying cycles. The time scale
of the matrix spraying and drying process was 30 minutes.
2.2.3 MALDI-TOF imaging MS for monitoring the in situ localization of trypsin enzymatic
activity on ITO-coated glass slides
The localization of trypsin on ITO-coated glass slides was studied using MALDI-TOF
imaging MS. The matrix used was 1M 2,5-dihydroxybenzoic acid in acetonitrile/HPLC grade
water (50/50 v/v%) containing 0.1% formic acid. The ITO-coated glass slides were marked with
a white BIC wite-out shake-N squeeze correction pen (BIC USA Inc., Shelton, CT, USA).
Digital images of the sample areas on the slides were acquired using the scanner of a HP Deskjet
F4240 All-in-one printer at a resolution of 600 ppi (Hewlett-Packard Company, Palo Alto, CA,
USA). 63
A uniform layer of cytochrome c (2 mg/mL) was applied to ~1 cm2 square area on the
glass slide. Trypsin solution (0.2 mg/mL) was applied to the triangular region on the 1 cm2
square area. The glass slide was incubated in a humidity chamber at 370C for 30 minutes. Peptide
calibration standard II (2 µL) from Bruker Daltonics Inc. (Billerica, MA, USA) was spotted
beside the 1 cm2
square area. The matrix solution was sprayed over the dried sample area using
an in house-built nebulizer. Multiple spray cycles of approximately 300 µL were performed on
the sample area. The total volume of the matrix solution per sample area was 3.0 mL. The

21
sample areas on the glass slide were air-dried at room temperature for 5 minutes in between the
spraying cycles. The time scale of the matrix spraying and drying process was 30 minutes.
Sample areas were analyzed using the MALDI-TOF mass spectrometer. The white-out dots were
used to teach the software for selecting the imaging area by providing positional information.63,64
2.2.4 (A) Activation of MMP-9
MMP-9 was obtained in its proenzyme form and required activation using p-aminophenyl
mercuric acetate (APMA). Recombinant rat MMP-9 is converted from a 94 kDa proenzyme to
an 84 kDa active enzyme.65
Pro MMP-9 (530 pM) was incubated with 2.5 mM APMA in
assay buffer (50 mM Tris at pH 7.5, 10 mM CaCl2, 1 µM ZnCl2, and 50 mM NaCl) for 2 hours at
370C in a sand bath.
2.2.4 (B) Zymography
The activation state of MMP-9 was tested using zymography. An advantage of
zymography is that both pro- and active- forms of MMP-9 can be distinguished on the basis of
their molecular weight.66
APMA-activated MMP-9 samples (25 nM) were mixed with SDS sample buffer and
applied to 10% tris-glycine gels with 0.1% gelatin as the substrate. Electrophoresis was
performed according to the manufacturer’s instructions (Invitrogen, Carlsbad, CA, USA) using
XCell surelock mini-cell system at 100 V constant voltage for 130 minutes. After
electrophoresis, gels were soaked for 1 hour in 2.5% Triton X-100 to remove SDS. Gels were
incubated in zymogram developing buffer (50 mM Tris-HCl with 200 mM NaCl, 5 mM CaCl2,

22
and 0.02% Brij-35, pH 7.5) for 12 hours at 370 C. After incubation, gels were stained with
Coomassie G-250 stain for 1 hour and destained in 40/60 v/v% methanol/water with 10/90 v/v%
acetic acid/water. Activities of MMP-9 were detected as clear zones against a blue background.
In control experiments, GM-6001 (50 μM) was added to the incubation buffer to confirm that the
gelatinolytic activity was because of MMP-9. The gels were scanned in a HP scanjet 8300
professional image scanner (Hewlett-Packard Company, Palo Alto, CA, USA) after rinsing with
water.
2.2.5 Spectrofluorometer
Fluorescence, resulting from enzymatic activity of MMP-9 on QXLTM
520-Pro-Leu-Gly-
Cys(Me)~His-Ala-D-Arg-Lys(5-FAM)-NH2, was monitored in a Fluoromax-4
spectrofluorometer (Horiba Jobin Yvon Inc., New Jersey, USA) at an excitation wavelength of
490 nm and an emission wavelength of 520 nm.
2.2.6 Fluorescence studies with QXLTM
520-Pro-Leu-Gly-Cys(Me)~His-Ala-D-Arg-Lys
(5-FAM)-NH2
The fluorescence intensity of 10 µM QXLTM
520-Pro-Leu-Gly-Cys(Me)~His-Ala-D-Arg-
Lys(5-FAM)-NH2 was monitored in a spectrofluorometer at an excitation wavelength of 490 nm
and an emission wavelength of 520 nm for 5 minutes.67
Active MMP-9 (4 nM) was added to
10 µM QXLTM
520-Pro-Leu-Gly-Cys(Me)~His-Ala-D-Arg-Lys(5-FAM)-NH2 and the increase
in fluorescence intensity was monitored for 30 minutes (Figure 2.8).

23
2.2.7 MALDI-TOF MS studies with QXLTM
520-Pro-Leu-Gly-Cys(Me)~His-Ala-D-Arg-
Lys(5-FAM)-NH2
QXLTM
520-Pro-Leu-Gly-Cys(Me)~His-Ala-D-Arg-Lys(5-FAM)-NH2, a longer
wavelength FRET substrate suitable for fluorescence imaging studies, was tested for
compatibility with MS. QXLTM
520-Pro-Leu-Gly-Cys(Me)~His-Ala-D-Arg-Lys-(5-FAM)-NH2
(10 µM) was incubated with active MMP-9 (4 nM) in assay buffer (50 mM Tris at pH 7.5,
10 mM CaCl2, 1 µM ZnCl2, and 150 mM NaCl) in a sand bath maintained at 370C. An aliquot of
the reaction mixture was removed at various time intervals [0.5, 1, 2, 6, and 12 hour(s)] and
mixed with an equal volume of the matrix. The mixture was spotted on a metal MALDI target
plate and analyzed using the Bruker Reflex III MALDI-TOF mass spectrometer. The following
matrices were used: 1M 2,5-dihydroxybenzoic acid in acetonitrile/HPLC grade water (50/50
v/v%) containing 0.1% formic acid, and 0.1 M α-cyano-4-hydroxycinnamic acid in
acetonitrile/HPLC grade water (50/50 v/v%) containing 0.1% formic acid.
2.2.8 (A) LC-MS for monitoring the in situ enzymatic activity of MMP-9 in eppendorf vials
A Hewlett Packard 1100 series HPLC (Palo Alto, CA, USA) with a Bruker Esquire 2000
quadrupole ion trap electrospray ionization mass spectrometer (Billerica, MA, USA) was used in
the positive ion mode. A bio wide pore C18 reverse phase column (15 cm × 4.6 mm) (Supelco,
St. Louis, MO, USA) was used for the separation of analytes. Solvent A contained 0.1% formic
acid in water and solvent B contained 0.1% formic acid in acetonitrile. The mobile phase flow
rate was 0.8 mL/min with a 5-100% gradient of 0.1% formic acid in acetonitrile over 60 minutes.
Samples were injected using an autoinjector with an injection volume of 10 µL. The
24
mass spectrometer was operated in positive ion mode with 2.1 × 10⁵ Pa nebulizing pressure (N2),
and 12 mL/min flow of drying gas at a temperature of 3000 C.
2.2.8 (B) MALDI-TOF MS for monitoring the in situ enzymatic activity of MMP-9 in
eppendorf vials
DNP-Pro-Leu-Gly~Met-Trp-Ser-Arg (50 µM) was incubated with active MMP-9
(530 pM) in assay buffer (50 mM Tris at pH 7.5, 10 mM CaCl2, 1 µM ZnCl2, and 150 mM NaCl)
in a sand bath maintained at 370C (Figure 2.1). Negative control was performed with 50 µM
GM-6001. An aliquot of the reaction mixture was removed at various time intervals [0.5, 1, 2, 6,
12, and 24 hour(s)] and mixed with the matrix. The mixture was spotted on a metal MALDI
target plate and analyzed using the Bruker Reflex III MALDI-TOF mass spectrometer. The
following matrices were used: 1M 2,5- dihydroxybenzoic acid in acetonitrile/HPLC grade water
(50/50 v/v%) containing 0.1% formic acid, and 0.1 M α-cyano-4-hydroxycinnamic acid in
acetonitrile/HPLC grade water (50/50 v/v%) containing 0.1% formic acid.
2.2.9 MALDI-TOF imaging MS for monitoring the in situ localization of MMP-9 enzymatic
activity on ITO-coated glass slides
The localization of active MMP-9 on ITO-coated glass slides was studied using MALDI-
TOF imaging MS. The matrices were: 1M 2,5-dihydroxybenzoic acid in acetonitrile/HPLC grade
water (50/50 v/v%) containing 0.1% formic acid, and 0.1 M α-cyano-4-hydroxycinnamic acid in
acetonitrile/HPLC grade water (50/50 v/v%) containing 0.1% formic acid. The ITO-coated glass
slides were marked with white-out. Digital images of the sample areas on the slides were
acquired using the scanner of a HP Deskjet F4240 All-in-one printer at a resolution of 600 ppi

25
(Hewlett-Packard Company, Palo Alto, CA, USA). The matrix solution was sprayed over the
dried sample area using an in house-built nebulizer. The spray distance (marked with a ruler) was
optimized to avoid excessive wetting of tissue sections, resulting in delocalization of analytes.
Multiple spray cycles of 150-200 µL were performed on a sample area from a distance of 25 cm.
The total volume of the matrix solution per sample area was 1.5 mL. The sample areas on the
glass slide were air-dried at room temperature for 5 minutes in between the spraying cycles. The
time scale of the matrix spraying and drying process was 30 minutes. The white-out dots were
used to teach the software for selecting the imaging area by providing positional information.
a. Predigested (substrate + active MMP-9) mixture on ITO-coated glass slide
A uniform layer of 50 µM DNP-Pro-Leu-Gly~Met-Trp-Ser-Arg was applied to ~1 cm2
square area on the glass slide and dried at 370C in an oven for 30 minutes. A predigested mixture
of [(50 µM DNP-Pro-Leu-Gly~Met-Trp-Ser-Arg + 530 pM active MMP-9), 370 C, 24 hours
incubation] was applied at the center of the 1 cm2
square area and dried at 370C in an oven for 30
minutes. Peptide calibration standard II (2 µL) from Bruker Daltonics Inc. (Billerica, MA, USA)
was spotted beside the 1 cm2
square area and allowed to dry at room temperature for 5 minutes.
After matrix spraying and drying, sample areas were analyzed using the MALDI-TOF mass
spectrometer.
b. Incubation on ITO-coated glass slide with active MMP-9
A uniform layer of 50 µM DNP-Pro-Leu-Gly~Met-Trp-Ser-Arg was applied to ~1 cm2
square area on the glass slide. Active MMP-9 (530 pM) was applied at the center of the 1 cm2
square area. The glass slide was incubated in a humidity chamber at 370C for 24 hours. Peptide

26
calibration standard II (2 µL) from Bruker Daltonics was spotted beside the 1 cm2
square area.
The matrix solution was sprayed over the sample area of interest. Sample areas were analyzed
using the MALDI-TOF mass spectrometer.
2.3 Results and Discussion
2.3.1 MALDI-TOF imaging MS for monitoring the in situ localization of trypsin enzymatic
activity on ITO-coated glass slides
Trypsin digested 20 µM cytochrome c at the triangular region on the 1 cm2
square area.
Figure 2.2 (A) shows the undigested cytochrome c around the 1 cm2
square area. The matrix
spraying process resulted in delocalization of analytes in the sample area. The MALDI-TOF
mass spectrum of cytochrome c is shown in Figure 2.2 (B). The MALDI-TOF mass spectrum of
cytochrome c digestion products by trypsin is shown in Figure 2.2 (C).
The sequence of bovine cytochrome c was obtained from www.expasy.org:
GDVEK GKKIF VQKCA QCHTV EKGGK HKTGP NLHGL FGRKT GQAPG FSYTD
ANKNK GITWG EETLM EYLEN PKKYI PGTKM IFAGI KKKGE REDLI AYLKK ATNE
The sequence of bovine cytochrome c was used in SequenceEditor software
(Bruker Daltonik, Bremen, Germany) to generate the theoretical molecular masses of trypsin
digestion fragments (Table 2.1). All the fragments except CAQCHTVEK (m/z 1018.4) were
observed in the mass spectrum. The protonated peak at m/z 1168.8 (TGPNLHGLFGR) was
considered to represent the tryptic digestion fragment for generating the MALDI-TOF MS

27
image. The results of this experiment indicated the possibility of imaging localized MMPs
activity on ITO-coated glass slides using MALDI-TOF imaging MS.
Range [MH]+ Sequence
[1-5] 547.3 GDVEK
[9-13] 634.4 IFVQK
[14-22] 1018.4 CAQCHTVEK
[28-38] 1168.6 TGPNLHGLFGR
[40-53] 1456.7 TGQAPGFSYTDANK
[74-79] 678.4 YIPGTK
[80-86] 779.4 MIFAGIK
[92-99] 964.5 EDLIAYLK
Table 2.1 Theoretical molecular masses of bovine cytochrome c digestion by trypsin
(m/z 500 - m/z 1600)
28
Figure 2.2 (A) MALDI-TOF MS image of in situ digestion on ITO-coated glass slide showing
localized trypsin activity at the triangular region (370
C, 30 minutes)

29
Figure 2.2 (B) MALDI-TOF mass spectrum of cytochrome c (# of laser shots accumulated =
300)

30
Figure 2.2 (C) MALDI-TOF mass spectrum of cytochrome c digestion products by trypsin
(# of laser shots accumulated = 300)
31
2.3.2 Zymography
Figure 2.3 confirms the activation of 94 kDa pro MMP-9 by APMA in to 84 kDa active
MMP-9 visible as clear zones against a blue background.
Figure 2.3 Activation of pro MMP-9 by APMA
32
2.3.3 Fluorescence studies with QXLTM
520-Pro-Leu-Gly-Cys(Me)~His-Ala-D-Arg-Lys
(5-FAM)-NH2
Figure 2.4 shows the fluorescence measurements of enzymatic reaction of active MMP-9
(4 nM) with 10 µM QXLTM
520-Pro-Leu-Gly-Cys(Me)~His-Ala-D-Arg-Lys(5-FAM)-NH2. The
substrate showed negligible background fluorescence signal in the absence of active MMP-9.
The results indicated that MMP-9 activity assay could be performed with this FRET substrate.
Figure 2.4 Fluorescence measurements of enzymatic reaction of active MMP-9 (4 nM) with
10 µM QXLTM
520-Pro-Leu-Gly-Cys(Me)~His-Ala-D-Arg-Lys(5-FAM)-NH2 at 370 C
33
2.3.4 MALDI-TOF MS studies with QXLTM
520-Pro-Leu-Gly-Cys(Me)~His-Ala-D-Arg-
Lys(5-FAM)-NH2
Figures 2.5 (A) and 2.5 (B) show the mass spectra of 10 µM QXLTM
520-Pro- Leu-Gly-
Cys(Me)~His-Ala-D-Arg-Lys(5-FAM)-NH2 substrate in DHB (1M 2,5- dihydroxybenzoic acid
in acetonitrile/HPLC grade water (50/50 v/v%) containing 0.1% formic acid) and CHCA
(0.1 M α-cyano-4-hydroxycinnamic acid in acetonitrile/HPLC grade water (50/50 v/v%)
containing 0.1% formic acid) matrix, respectively. The mass spectra did not show intense
[M+H]+ peak for the substrate at m/z 1744. However, an intense peak at m/z 1372 was observed
representing the loss of (5-FAM and NH, CH2 groups of arginine). The QXLTM
520 and 5-FAM
modifications at the N- and C-terminus could be responsible for the fragmentation of the
substrate.
Figures 2.5 (C) and 2.5 (D) show the mass spectra of [(10 µM QXLTM
520- Pro-Leu-Gly-
Cys(Me)~His-Ala-D-Arg-Lys-(5-FAM)-NH2 + 4 nM active MMP-9), 370C, 12 hours incubation]
in DHB and CHCA matrix, respectively. The fragmentation products at m/z 853 and m/z 907
representing the enzymatic activity of MMP-9 on QXLTM
520-Pro-Leu-Gly-Cys(Me)~His-Ala-
D-Arg-Lys (5-FAM)-NH2 were not observed. This could be either because the product ions
underwent extensive fragmentation or had lower ionization efficiencies. Hence, this longer
wavelength FRET substrate was not used for imaging the activity of MMPs using MALDI-TOF
MS.
34
Figure 2.5 (A) MALDI-TOF mass spectrum of 10 µM QXLTM
520-Pro-Leu-Gly-Cys(Me)~His-
Ala-D-Arg-Lys-(5-FAM)-NH2 in DHB matrix(# of laser shots accumulated = 300)

35
Figure 2.5 (B) MALDI-TOF mass spectrum of 10 µM QXLTM
520-Pro-Leu-Gly-
Cys(Me)~His-Ala-D-Arg-Lys-(5-FAM)-NH2 in CHCA matrix (# of laser shots
accumulated = 300)

36
Figure 2.5 (C) MALDI-TOF mass spectrum of [(10 µM QXLTM
520-Pro-Leu-Gly-Cys
(Me)~His-Ala-D-Arg-Lys-(5-FAM)-NH2 + 4 nM active MMP-9), 370C, 12 hours incubation] in
DHB matrix (# of laser shots accumulated = 1000)

37
Figure 2.5 (D) MALDI-TOF mass spectrum of [(10 µM QXLTM
520-Pro-Leu-Gly-
Cys(Me)~His-Ala-D-Arg-Lys-(5-FAM)-NH2 + 4 nM active MMP-9), 370C, 12 hours incubation]
in CHCA matrix (# of laser shots accumulated = 1000)
38
2.3.5 (A) LC-MS for monitoring the in situ enzymatic activity of MMP-9 in eppendorf vials
Figure 2.6 (A) shows the LC chromatogram of the (substrate + active MMP-9) digest
(370C, 24 hours of incubation) analyzed by LC-ESI-MS. ESI-MS spectra shows [M+H
+] peaks
for the substrate at m/z 1012 [Figure 2.6 (B)], and MMP-9 digestion products at m/z 452 [Figure
2.6 (C)] and m/z 579 [Figure 2.6 (D)].
Figure 2.6 (A) LC chromatogram of the (substrate + active MMP-9) digest
(370C, 24 hours of incubation)

39
Figure 2.6 (B) ESI-MS spectrum of MMP-9 substrate, DNP-Pro-Leu-Gly~Met-Trp-Ser-Arg
Figure 2.6 (C) ESI-MS spectrum of MMP-9 digestion product, DNP-Pro-Leu-Gly
Figure 2.6 (D) ESI-MS spectrum of MMP-9 digestion product, Met-Trp-Ser-Arg

40
2.3.5 (B) MALDI-TOF MS for monitoring the in situ enzymatic activity of MMP-9 in
eppendorf vials
QXLTM
520-Pro-Leu-Gly-Cys(Me)~His-Ala-D-Arg-Lys-(5-FAM)-NH2 was not MS-
compatible and therefore MMP-9 activity assay was performed with DNP-Pro-Leu-Gly~Met-
Trp-Ser-Arg. Figures 2.7 (A) and 2.7 (B) show the mass spectra of 50 µM DNP-Pro-Leu-
Gly~Met-Trp-Ser-Arg substrate in CHCA and DHB matrix, respectively. The DNP modification
in the N-terminus of the substrate could have caused the substrate to undergo fragmentation. The
mass spectrum of the substrate in CHCA matrix had an intense [M+H]+ peak at m/z 1012. The
mass spectrum of the substrate in DHB matrix had an intense peak at m/z 775 representing the
ion formed by the loss of the DNP group and the pyrrolidine ring of proline in the N-terminus of
the substrate.
It was possible to monitor one of the hydrolysis products (m/z 579) of MMP-9 enzymatic
activity on the FRET substrate after 12 hours of incubation at 370C [Figures 2.7 (C) and 2.7 (D)].
“LIFT” technique was used to obtain MS/MS data from the m/z 579 fragment for confirmation
(Figure 2.8). The product peak at m/z 579 was not observed in the negative control sample
indicating that GM-6001 blocked the activity of MMP-9.

41
Figure 2.7 (A) MALDI-TOF mass spectrum of 50 µM DNP-Pro-Leu-Gly~Met-Trp-Ser-Arg in
CHCA matrix (# of laser shots accumulated = 300)

42
Figure 2.7 (B) MALDI-TOF mass spectrum of 50 µM DNP-Pro-Leu-Gly~Met-Trp-Ser-Arg in
DHB matrix (# of laser shots accumulated = 1000)

43
Figure 2.7 (C) MALDI-TOF mass spectrum of product (Met-Trp-Ser-Arg), m/z 579 in CHCA
matrix (# of laser shots accumulated = 1000)

44
Figure 2.7 (D) MALDI-TOF mass spectrum of product (Met-Trp-Ser-Arg), m/z 579 in DHB
matrix (# of laser shots accumulated = 1000)
45
Figure 2.8 MALDI-TOF MS/MS spectrum of the product (m/z 579) obtained using the “LIFT”
technique

46
2.3.6 MALDI-TOF imaging MS for monitoring the in situ localization of MMP-9 enzymatic
activity on ITO-coated glass slides
The substrate fragment at m/z 775 (substrate-DNP group-pyrrolidine ring of proline) was
considered to represent the undigested substrate in all the in situ imaging experiments. It was
found that α-cyano-4-hydroxycinnamic acid (0.1 M in acetonitrile/HPLC grade water (50/50
v/v%) containing 0.1% formic acid was not a suitable matrix for the spraying method. The
substrate fragment peak at m/z 775, and one of the product peaks at m/z 579 were not uniformly
observed throughout the sample area. The other matrix, 1M 2,5-dihydroxybenzoic acid in
acetonitrile/HPLC grade water (50/50 v/v%) containing 0.1% formic acid, produced a
homogeneous layer with the sample as evidenced by the uniformity in the distribution of the
substrate fragment peak at m/z 775, and one of the product peaks at m/z 579 throughout the
sample area.
a. Predigested (substrate + active MMP-9) mixture on ITO-coated glass slide
When DHB matrix was sprayed from the nebulizer at a distance of 20 cm from the glass
slide and with 250-300 µL multiple spray cycles per sample area, the spraying process resulted
in delocalization of analytes in the sample area [Figure 2.9 (A)].
47
Figure 2.9 (A) MALDI-TOF MS image of predigested (substrate + active MMP-9) mixture on
the ITO-coated glass slide (370
C, 24 hours of incubation) with a 600 × 600 µm2 raster

48
b. Incubation on ITO-coated glass slide with active MMP-9
Active MMP-9 (530 pM) digested 50 µM DNP-Pro-Leu-Gly~Met-Trp-Ser-Arg at the
center of the 1 cm2
square area. Undigested DNP-Pro-Leu-Gly~Met-Trp-Ser-Arg represented by
m/z 775 is visible around the 1 cm2
square area [Figure 2.9 (B)].
Optimizing the spraying distance to 25 cm and the volume range of multiple spray cycles
to 150–200 µL resulted in homogeneous distribution of the DHB matrix.

49
Figure 2.9 (B) MALDI-TOF MS image of in situ digestion on the ITO-coated glass slide with
active MMP-9 (370
C, 24 hours incubation) with a 600 × 600 µm2 raster
50
2.4 Conclusions
LC-ESI MS clearly showed the MMP-9 hydrolysis products at m/z 452 and m/z 579.
However, MALDI-TOF MS did not show the hydrolysis product at m/z 452. It was possible to
get an image of localized MMP-9 activity on DNP-Pro-Leu-Gly~Met-Trp-Ser-Arg in situ by
monitoring the hydrolysis product at m/z 579 using MALDI imaging MS. The results also
indicated that DHB might be a better matrix for ex vivo tissue imaging studies. The initial
spraying trials resulted in delocalization of analytes in the sample area. In order to avoid this, the
spraying distance and the volume required for multiple spray cycles for the matrix solution were
optimized for the in situ imaging studies. Matrix selection and deposition determined the quality
of the MS image. This knowledge was applied when dealing with tissue samples for ex vivo
imaging studies described in Chapter III.
Higher sensitivity was obtained with a metal MALDI target when compared to the ITO-
coated glass slide. However, ITO-coated glass slides are convenient for transferring thin tissue
sections from the cryostat during sample preparation for the ex vivo tissue imaging studies.
Hence, in situ imaging studies to monitor localized MMP-9 activity was performed with DNP-
Pro-Leu-Gly~Met-Trp-Ser-Arg on ITO-coated glass slides.

51
3. EX VIVO STUDIES TO IMAGE THE SPATIAL LOCALIZATION OF ACTIVE
MMP-2 AND MMP-9
3.1 Introduction
In this chapter, DNP-Pro-Leu-Gly~Met-Trp-Ser-Arg was used for the ex vivo detection of
active MMP-2 and MMP-9 in the FBR-induced tissue samples using MALDI-TOF MS. DNP-
Pro-Leu-Gly~Met-Trp-Ser-Arg could not be used for fluorescence imaging because of the high
background resulting from the illumination of cells with the UV light. QXLTM
520-Pro-Leu-Gly-
Cys(Me)~His-Ala-D-Arg-Lys(5-carboxyfluorescein or 5-FAM)-NH2, a longer wavelength FRET
substrate was used for fluorescence imaging studies.67
When the peptide is intact, the
fluorescence of 5-FAM (donor) is quenched by QXLTM
520 (acceptor) through FRET. Upon
cleavage by MMPs in to two separate fragments, the fluorescence of 5-FAM is recovered and
can be detected at an excitation wavelength of 490 nm and an emission wavelength of 520 nm.
3.2 Experimental section
3.2.1 Chemicals
MMP-9 (recombinant rat proenzyme, 94 kDa monomer, specific activity > 710
picomoles/min/µg) was purchased from R & D Systems Inc. (Minneapolis, MN, USA). DNP-
Pro-Leu-Gly~Met-Trp-Ser-Arg, p-aminophenylmercuricacetate, GM-6001 (Galardin or N-[(2R)-
2-(Hydroxamidocarbonylmethyl)-4-methylpentanoyl]-L-tryptophan methylamide, a broad-
spectrum MMPs inhibitor), ethanol, methanol, isopropanol, acetonitrile, and DMSO were
purchased from EMD chemicals (Gibbstown, NJ, USA). Formic acid and HPLC grade water
were purchased from Alfa Aesar (Ward Hill, MA, USA). Matrix chemicals,

52
2,5–dihydroxybenzoic acid, and α-cyano-4-hydroxycinnamic acid were purchased from Sigma-
Aldrich (St. Louis, MO,USA). QXLTM
520-Pro-Leu-Gly-Cys(Me)~His-Ala-D-Arg-Lys
(5-carboxyfluorescein or 5-FAM)-NH2 specific for MMPs-1, -2, -8, - 9, -12, -13 and -14 was
purchased from Anaspec (Fremont, CA, USA). Stock solutions of DNP-Pro-Leu-Gly~Met-Trp-
Ser-Arg and QXLTM
520-Pro-Leu-Gly-Cys(Me)~His-Ala-D-Arg-Lys(5-FAM)-NH2 were
prepared in dimethyl sulfoxide (DMSO). Further dilutions were carried out with the assay buffer
(50 mM Tris at pH 7.5, 10 mM CaCl2, 1 µM ZnCl2, and 50 mM NaCl).
Ethylenediaminetetraacetic acid (EDTA)-free protease inhibitor cocktail (100X) was
purchased from Calbiochem (San Diego, CA, USA). 1X solution contains 500 µM 4-(2-
Aminoethyl) benzenesulfonyl fluoride hydrochloride (AEBSF), 150 nM aprotinin, 1 µM N-
(trans-Epoxysuccinyl)-L-leucine 4-guanidinobutylamide (E-64), protease inhibitor, and 1 µM
leupeptin, hemisulfate. This protease inhibitor cocktail inhibits serine and cysteine proteases, but
not metalloproteases.68
The 100X EDTA-free protease inhibitor cocktail was diluted to 1X
concentration with HPLC-grade water.
Indium tin oxide (ITO)-coated glass slides were purchased from Bruker Daltonics Inc.
(Billerica, MA, USA). Glass coplin staining jars with polypropylene screw cap were purchased
from Wheaton science products (Millville, NJ, USA). Tissue-Tek O.C.T. compound was
purchased from Sakura Finetek USA, Inc. (Torrance, CA, USA).
3.2.2 Animals
Male Sprague-Dawley rats (260 g to 290 g) were purchased from Harlan laboratories Inc.
(Madison, WI, USA) and used in this study.

53
3.2.3 Biomaterial implantation procedure
Rats were housed in a facility with a 12-hour on/off light cycle and had access to food
and water ad libitum. All animal experiments were approved by the University of Arkansas
animal care committee. Animals were anesthetized with 5% isoflurane (induction) followed by
2% isoflurane (maintenance) inhalation in combination with O2. Under aseptic conditions, an
incision ~1 cm in length was made on each side of the midline along the back of the rat. A
subcutaneous pocket was created from each incision by blunt dissection. A microdialysis probe
(CMA Microdialysis, North Chelmsford, MA, USA) with a polyethersulfone (PES) membrane
was implanted into each pocket. Incisions at the implant site were sealed with Vetbond tissue
adhesive (3M Animal Care Products, St. Paul, MN, USA). Following implantation, rats were
returned to housing for 24 hours. After 24 hours, the rats were euthanized by CO2 asphyxiation.
Control tissues at a distance of 2 cm from the implants, and the tissues with the implants were
cut into 2 cm by 2 cm blocks using sterile scalpel blades.69
3.2.4 Tissue sample preparation
After dissection, tissue samples were loosely wrapped in aluminum foil, followed by
immediate snap-freezing in liquid nitrogen. Samples were stored at -800 C until needed for up to
5 months. The tissue sample was maintained at the desired orientation on the cutting block by
using optimum cutting temperature (O.C.T.) polymer. However, the tissue surface was free of
the polymer. A thin frozen section of the tissue (20 µm) was cut at -210 C using a Leica CM
3050 S cryostat (Leica Microsystems GmbH, Wetzlar, Germany). Sections were thaw-mounted
onto precooled (-200 C) normal and ITO - coated glass slides and were stored at -80
0 C until
analysis. Tissue sections were dehydrated in a vacuum desiccator for 30 minutes. The ITO-
54
coated glass slides were marked with white BIC wite-out shake-N squeeze correction pen (BIC
USA Inc., Shelton, CT, USA). Digital images of the tissue sections on the target plate were
acquired using the scanner of a HP Deskjet F4240 All-in-one printer at a resolution of 600 ppi
(Hewlett-Packard Company, Palo Alto, CA, USA). The white-out dots were used to teach the
software for selecting the imaging area by providing positional information.
3.2.5 MALDI-TOF MS system
Mass spectrometric analyses were performed in the reflectron, positive mode at 25 kV
accelerating potential on a Reflex III MALDI-TOF mass spectrometer equipped with a pulsed
nitrogen laser working at 337 nm at a laser repetition rate of 8.1 Hz (Bruker Daltonik, Bremen,
Germany). External calibration was performed using a solution of peptide calibration standard II
(Bruker Daltonics Inc., Billerica, MA, USA) containing angiotensin II, angiotensin I, substance
P, bombesin, ACTH clip 1-17, ACTH clip 18-39, and somatostatin 28, and DHB matrix solution
{[M+H]+: 1046.5, 1296.7, 757.4, 1347.7, 1619.8, 2093.1, 2465.2, 3147.5, and 137.0}. MS/MS
spectra were obtained using the “LIFT” technique in a Bruker Ultraflex II MALDI-TOF/TOF
mass spectrometer (Bruker Daltonik, Bremen, Germany).
Spectral acquisition from each spot was achieved using Bruker Flexanalysis 2.4 software.
The substrate fragment at m/z 775 was considered to represent the undigested substrate. Mass
spectral data sets were acquired using the Fleximaging software (Bruker Daltonik, Bremen,
Germany) with a raster width of 600 µm. Each pixel composed of 300 individual laser shots
collected in 50-shot increments form four positions within a single spot. Molecular images were
visualized using the Fleximaging software.

55
3.2.6 Alcohol-based tissue washing
The solvents used in this study were selected based on their efficacy for lipid
solubilization and enzyme activity preservation.55,70
The following solvents: 70/30 v/v%
ethanol/water, 80/20 v/v% methanol/water, and isopropanol were used for tissue washing.
Tissue sections were washed by gentle immersing in 70 mL of solvent placed in a glass coplin
jar (Wheaton Science Products, Millville, NJ, USA) at 40 C for 12 hours. Care was taken to
ensure that the coplin jars were undisturbed to prevent diffusion of the endogenous molecules on
the tissue surface.71
3.2.7 Matrix selection and deposition
The three commonly used matrices for imaging MS studies are sinapinic acid, 2,5-
dihydroxybenzoic acid, and α-cyano-4-hydroxycinnamic acid. Sinapinic acid was not considered
for this research as it is the matrix of choice for protein analysis in tissue sections. The matrices,
α-cyano-4-hydroxycinnamic acid and 2,5-dihydroxybenzoic acid, were selected since they are
well known for highest sensitivity in peptide analysis and for good signal intensity
respectively.48
The matrices were dissolved in acetonitrile/HPLC grade water (50/50 v/v%)
containing 0.1% formic acid.
High resolution tissue imaging requires homogeneous matrix deposition without inducing
lateral migration of analytes.49
The matrix solution was sprayed over the tissue sections using a
home-built nebulizer. The spray distance was optimized to avoid excessive wetting of tissue
sections marked by dripping of matrix solution from the tissue sections, resulting in
delocalization of analytes. Multiple spray cycles of 150-200 µL were performed on a single

56
tissue section from a distance of about 25 cm. The total volume of the matrix solution per tissue
section was 1.5 mL. Tissue sections on the glass slide were air-dried at room temperature for 5
minutes in between the spraying cycles. The time scale of the matrix spraying and drying process
was 30 minutes.
3.2.8 Fluorescence imaging system
Fluorescence imaging studies were performed using an Olympus BH2-RFCA (reflected
light fluorescence attachment) microscope.
3.2.9 Imaging active MMP-2 and MMP-9 localization ex vivo using FRET substrate
A. MALDI-TOF imaging MS
a. Matrix selection
The product peak at m/z 579 was observed in fewer places in α-cyano-4-
hydroxycinnamic acid matrix when compared to 2,5-dihydroxybenzoic acid matrix. Hence, DHB
was selected as the matrix for all MALDI-TOF imaging MS experiments.
b. Unwashed control tissue
Predigested mixture of [(50 µM DNP-Pro-Leu-Gly~Met-Trp-Ser-Arg + 530 pM active
MMP-9), 370 C, 24 hours incubation] was applied to the unwashed control tissue on ITO-coated
glass slide. Peptide calibration standard II (2 µL) from Bruker Daltonics was spotted beside the
tissue section. After acquiring the digital image in a scanner and spraying with DHB matrix, the
tissue section was analyzed using the MALDI-TOF mass spectrometer.

57
c. Ethanol washed control tissue
Ethanol wash is recommended to remove phospholipids, physiological salts, and to fix
proteins to increase ion yield in tissue samples.72
The effect of 70/30 v/v% ethanol/water wash
on the activity of MMPs was studied using fluorescence imaging studies. The results from these
studies confirmed that the ethanol wash did not affect the activity of MMPs [Figure 3.8 (C)].
Hence, the same solvent system was selected and tested for its effect on MMPs activity and
delipidation using MALDI-TOF imaging MS studies.
A specific region of the control tissue on the ITO-coated glass slide was selected and the
region was marked underneath the slide using liquid white-out. Active MMP-9 (530 pM) was
added to the specific region (red circle). The slide was incubated in an oven at 370 C for 15
minutes and was subjected to 70/30 v/v% ethanol/water wash at 40C for 12 hours followed by
drying at room temperature for 15 minutes. The tissue was covered with assay buffer (50 mM
Tris at pH 7.5, 10 mM CaCl2, 1 µM ZnCl2, and 50 mM NaCl) and was allowed to dry in an oven
at 370 C for 15 minutes. DNP-Pro-Leu-Gly~Met-Trp-Ser-Arg (50 µM) was added to the red
circular area and incubated in a humidity chamber at 370C for 12 hours (Figure 3.2). After
acquiring the digital image in a scanner and spraying with DHB matrix, the tissue section was
analyzed using the MALDI-TOF mass spectrometer.
d. Control tissue spiked with predigested (substrate + active MMP-9)
The ITO-coated glass slide with the control tissue was immersed in 70/30 v/v%
ethanol/water at 40 C for 12 hours followed by drying at room temperature for 15 minutes. The
tissue was covered with assay buffer (50 mM Tris at pH 7.5, 10 mM CaCl2, 1 µM ZnCl2, and

58
50 mM NaCl) and was allowed to dry to dry in an oven at 370 C for 15 minutes. The tissue was
spiked with predigested [(50 µM DNP-PLG~MWSR + 530 pM active MMP-9), 370
C, 24 hours
incubation]. After acquiring the digital image in a scanner and spraying with DHB matrix, the
tissue section was analyzed using the MALDI-TOF mass spectrometer.
e. Control tissue incubated with (substrate + active MMP-9)
The ITO-coated glass slide with the control tissue was immersed in 70/30 v/v%
ethanol/water at 40 C for 12 hours followed by drying at room temperature for 15 minutes. The
tissue was covered with assay buffer (50 mM Tris at pH 7.5, 10 mM CaCl2, 1 µM ZnCl2, and
50 mM NaCl) and was allowed to dry in an oven at 370 C for 15 minutes. The tissue was
incubated with [(50 µM DNP-PLG~MWSR + 530 pM active MMP-9)] in a humidity chamber at
370
C for 12 hours. After acquiring the digital image in a scanner and spraying with DHB matrix,
the tissue section was analyzed using the MALDI-TOF mass spectrometer.
f. Microdialysis probe implanted tissues incubated with substrate
The ITO-coated glass slide with three microdialysis probe implanted tissues was
immersed in 70/30 v/v% ethanol/water at 40 C for 12 hours followed by drying at room
temperature for 15 minutes. Tissues were covered with assay buffer (50 mM Tris at pH 7.5,
10 mM CaCl2, 1 µM ZnCl2, and 50 mM NaCl) and were allowed to dry in an oven at 370 C for
15 minutes. The II tissue was incubated with (50 µM DNP-PLG~MWSR+ 1X protease inhibitor
cocktail). No treatment (I tissue) and negative control treatment with [(50 µM DNP-
PLG~MWSR+ 1X protease inhibitor cocktail + 50 µM GM-6001), III tissue] were also
performed. The slide was incubated in a humidity chamber at 370
C for 24 hours. After acquiring
59
digital images in a scanner and spraying with DHB matrix, tissue sections were analyzed using
the MALDI-TOF mass spectrometer. “LIFT” technique was used to obtain MS/MS data from the
m/z 579 fragment for confirmation.
ClinPro Tools software (Version 2.2, Bruker Daltonik GmbH, Bremen, Germany) was
used for mass spectral data interpretation. The quick classifier algorithm for automatic peak
detection only considered peaks with a signal to noise threshold of 5 with respect to the base
peak. Individual peaks in the spectrum from three groups (no treatment, treatment, and negative
control treatment) were aligned and peak intensities were analyzed for the m/z 579.0 peak.
B. Fluorescence imaging
Fluorescence imaging was initially used to check the effect of alcohol washing on the
activity of MMPs. 10 µM QXLTM
520-Pro-Leu-Gly-Cys(Me)~His-Ala-D-Arg-Lys(5-FAM)-NH2
was applied to the control tissue, and to the probe implanted tissue followed by incubation at
370 C in a humidity chamber for 12 hours. Negative control with GM-6001 was included. An
EDTA-free protease inhibitor cocktail that prevents the hydrolysis of the substrate by proteinases
other than MMPs was employed to validate the activity of MMPs.73
The tissues were examined
under a fluorescence microscope.
3.3 Results & Discussion
A. MALDI-TOF imaging MS
a. Unwashed control tissue
Salts, lipids, and endogenous compounds on the tissue surface can result in “ion
suppression” by preferentially capturing protons during the ionization process and appearing at
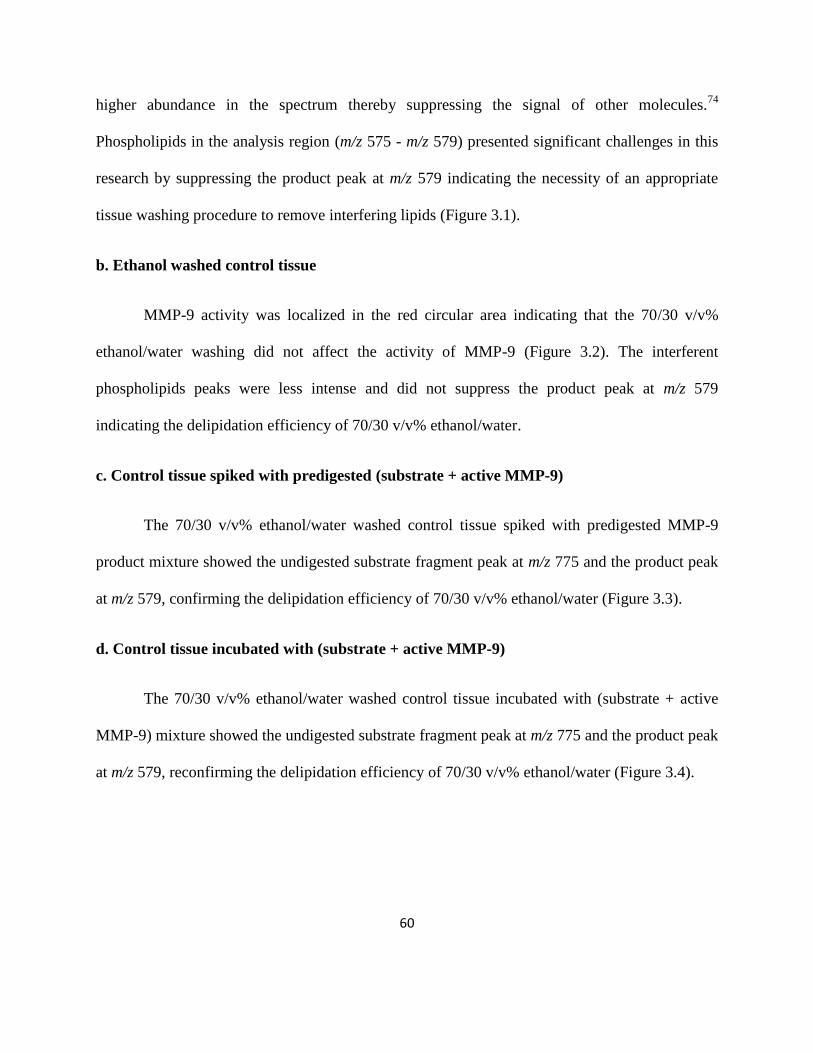
60
higher abundance in the spectrum thereby suppressing the signal of other molecules.74
Phospholipids in the analysis region (m/z 575 - m/z 579) presented significant challenges in this
research by suppressing the product peak at m/z 579 indicating the necessity of an appropriate
tissue washing procedure to remove interfering lipids (Figure 3.1).
b. Ethanol washed control tissue
MMP-9 activity was localized in the red circular area indicating that the 70/30 v/v%
ethanol/water washing did not affect the activity of MMP-9 (Figure 3.2). The interferent
phospholipids peaks were less intense and did not suppress the product peak at m/z 579
indicating the delipidation efficiency of 70/30 v/v% ethanol/water.
c. Control tissue spiked with predigested (substrate + active MMP-9)
The 70/30 v/v% ethanol/water washed control tissue spiked with predigested MMP-9
product mixture showed the undigested substrate fragment peak at m/z 775 and the product peak
at m/z 579, confirming the delipidation efficiency of 70/30 v/v% ethanol/water (Figure 3.3).
d. Control tissue incubated with (substrate + active MMP-9)
The 70/30 v/v% ethanol/water washed control tissue incubated with (substrate + active
MMP-9) mixture showed the undigested substrate fragment peak at m/z 775 and the product peak
at m/z 579, reconfirming the delipidation efficiency of 70/30 v/v% ethanol/water (Figure 3.4).

61
e. Microdialysis probe implanted tissues incubated with substrate
The substrate fragments at m/z 690 and m/z 775 were considered to represent the
undigested substrate. The 70/30 v/v% ethanol/water washed microdialysis probe implanted tissue
without any treatment had background peaks at m/z 690 and at m/z 775 in certain regions [Figure
3.5 (A) (i)].
The 70/30 v/v% ethanol/water washed microdialysis probe implanted tissue incubated
with (50 µM DNP-PLG~MWSR + 1X protease inhibitor cocktail) showed the undigested
substrate fragment peaks at m/z 690 and m/z 775 distributed all over the tissue. The product peak
at m/z 579 was observed around the microdialysis probe indicating the localization of active
MMP-2 and MMP-9 around the microdialysis probe [Figure 3.5 (A) (ii)].
The 70/30 v/v% ethanol/water washed microdialysis probe implanted tissue incubated
with (50 µM DNP-PLG~MWSR+ 1X protease inhibitor cocktail + 50 µM GM-6001) showed the
undigested substrate fragment peaks at m/z 690 and at m/z 775 distributed all over the tissue. The
product peak at m/z 579 was not observed around the microdialysis probe, thus validating the
activity assay scheme [Figure 3.5 (A) (iii)].
The MALDI-TOF MS/MS image of 70/30 v/v% ethanol/water washed microdialysis
probe implanted tissue incubated with (50 µM DNP-PLG~MWSR + 1X protease inhibitor
cocktail) showed the localization of fragments from the unimolecular decomposition of the m/z
579 peak around the microdialysis probe [Figure 3.6(A)]. Figure 3.6 (B) shows the MALDI-TOF
MS/MS spectrum of the product (m/z 579) using the “LIFT” technique.
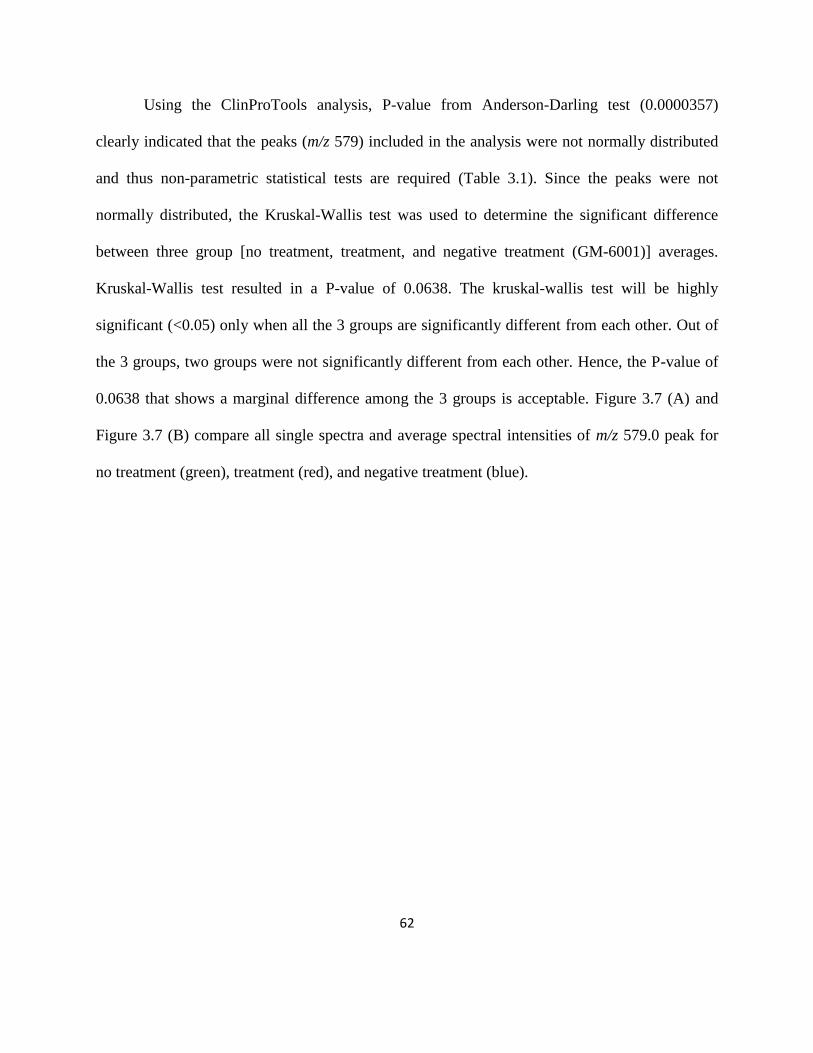
62
Using the ClinProTools analysis, P-value from Anderson-Darling test (0.0000357)
clearly indicated that the peaks (m/z 579) included in the analysis were not normally distributed
and thus non-parametric statistical tests are required (Table 3.1). Since the peaks were not
normally distributed, the Kruskal-Wallis test was used to determine the significant difference
between three group [no treatment, treatment, and negative treatment (GM-6001)] averages.
Kruskal-Wallis test resulted in a P-value of 0.0638. The kruskal-wallis test will be highly
significant (<0.05) only when all the 3 groups are significantly different from each other. Out of
the 3 groups, two groups were not significantly different from each other. Hence, the P-value of
0.0638 that shows a marginal difference among the 3 groups is acceptable. Figure 3.7 (A) and
Figure 3.7 (B) compare all single spectra and average spectral intensities of m/z 579.0 peak for
no treatment (green), treatment (red), and negative treatment (blue).
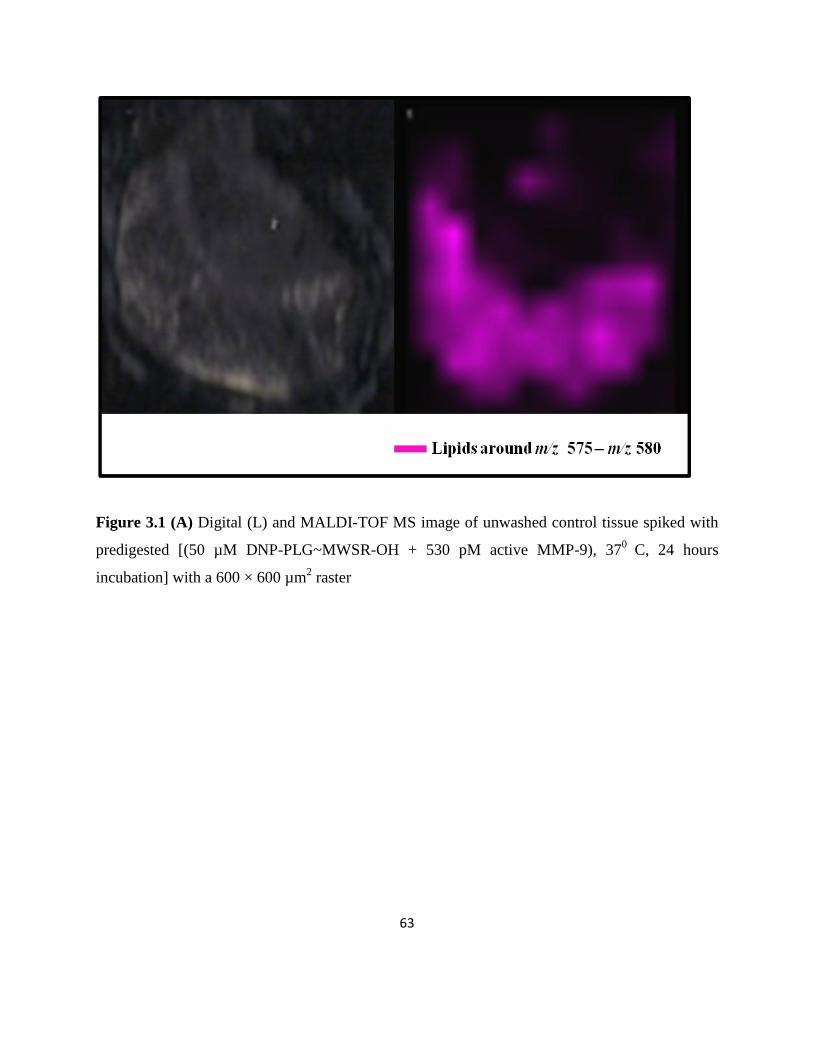
63
Figure 3.1 (A) Digital (L) and MALDI-TOF MS image of unwashed control tissue spiked with
predigested [(50 µM DNP-PLG~MWSR-OH + 530 pM active MMP-9), 370
C, 24 hours
incubation] with a 600 × 600 µm2 raster

64
Figure 3.1 (B) MALDI-TOF mass spectrum of unwashed control tissue spiked with predigested
[(50 µM DNP-PLG~MWSR-OH + 530 pM active MMP-9), 370
C, 24 hours incubation] showing
the distribution of lipids from m/z 575 – m/z 579
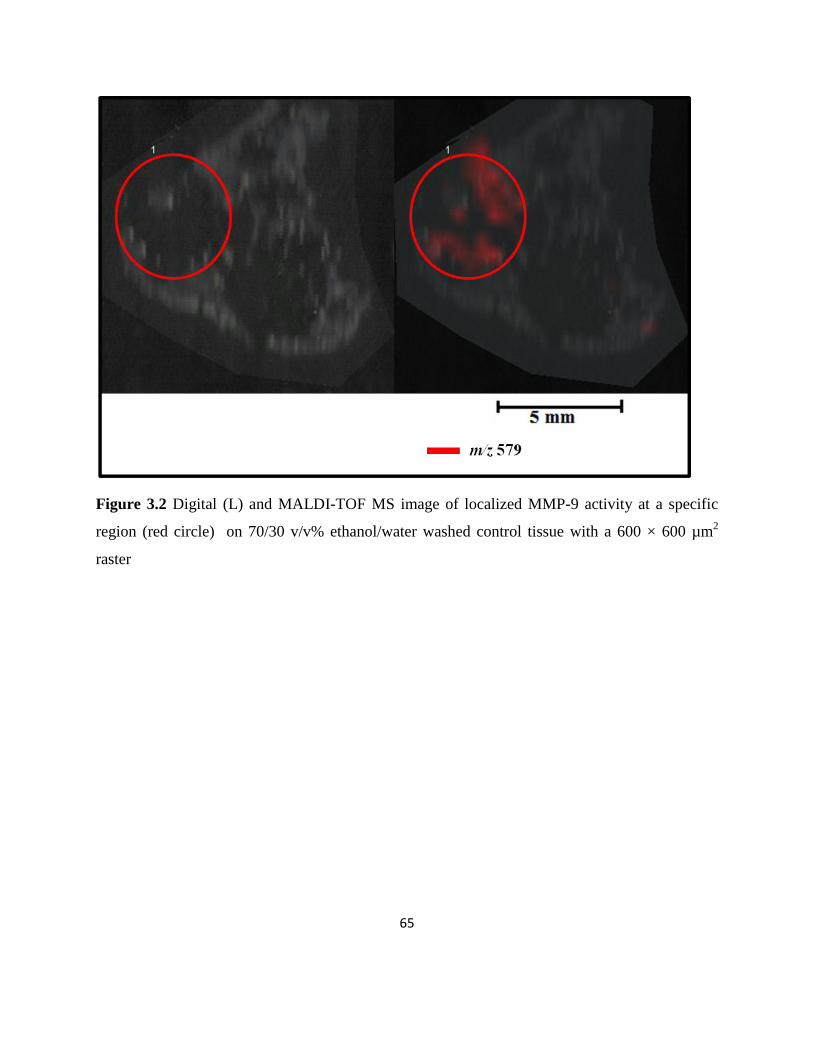
65
Figure 3.2 Digital (L) and MALDI-TOF MS image of localized MMP-9 activity at a specific
region (red circle) on 70/30 v/v% ethanol/water washed control tissue with a 600 × 600 µm2
raster

66
Figure 3.3 Digital (L) and MALDI-TOF MS image (R) of 70/30 v/v% ethanol/water washed
control tissue spiked with predigested [(50 µM DNP-PLG~MWSR + 530 pM active MMP-9),
370
C, 24 hours incubation] with a 600 × 600 µm2 raster
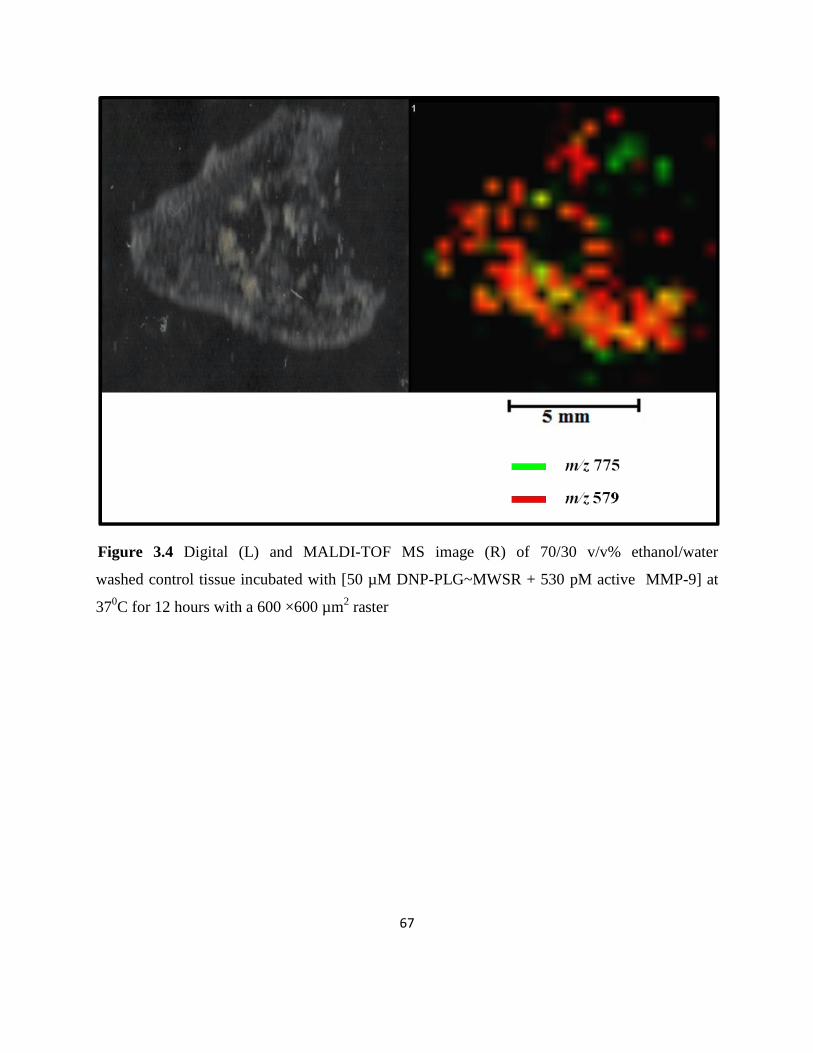
67
Figure 3.4 Digital (L) and MALDI-TOF MS image (R) of 70/30 v/v% ethanol/water
washed control tissue incubated with [50 µM DNP-PLG~MWSR + 530 pM active MMP-9] at
370C for 12 hours with a 600 ×600 µm
2 raster
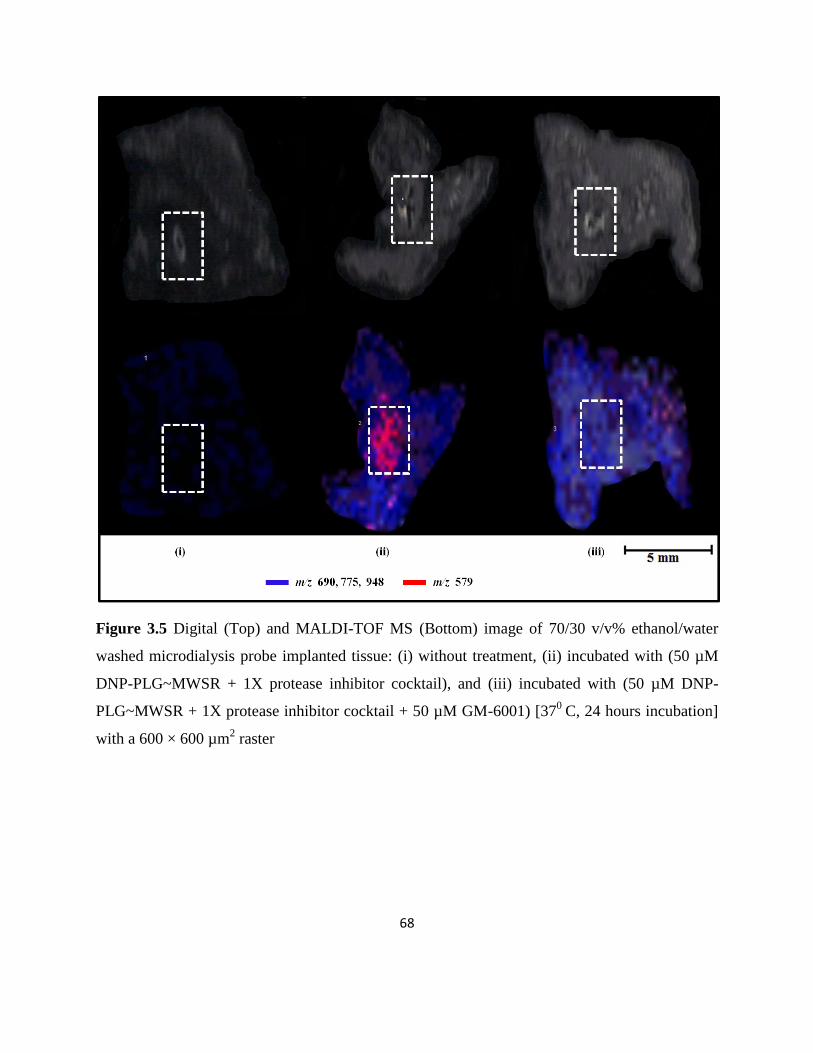
68
Figure 3.5 Digital (Top) and MALDI-TOF MS (Bottom) image of 70/30 v/v% ethanol/water
washed microdialysis probe implanted tissue: (i) without treatment, (ii) incubated with (50 µM
DNP-PLG~MWSR + 1X protease inhibitor cocktail), and (iii) incubated with (50 µM DNP-
PLG~MWSR + 1X protease inhibitor cocktail + 50 µM GM-6001) [370
C, 24 hours incubation]
with a 600 × 600 µm2 raster

69
Figure 3.6 (A) Digital (Top) and MALDI-TOF MS/MS (Bottom) image of 70/30 v/v%
ethanol/water washed microdialysis probe implanted tissue: (i) without treatment, (ii) incubated
with (50 µM DNP-PLG~MWSR + 1X protease inhibitor cocktail), and (iii) incubated with
(50 µM DNP-PLG~MWSR + 1X protease inhibitor cocktail + 50 µM GM-6001) [370
C, 24
hours incubation] with a 600 × 600 µm2 raster

70
Figure 3.6 (B) MALDI-TOF MS/MS spectrum of the product (m/z 579) using the “LIFT”
technique

71
Figure 3.7 (A) Comparison of all single spectral peak intensities of m/z 579.0 peak showing
significant difference between no treatment (green), treatment (red), and negative treatment
(blue) [X-axis: m/z, Y-axis: Intensity (A.U.)]

72
Figure 3.7 (B) Comparison of average spectral intensities of m/z 579.0 peak showing significant
difference between no treatment (green), treatment (red), and negative treatment (blue) [X-axis:
m/z, Y-axis: Intensity (A.U.)]

73
Mass (m/z value) 579.0
Difference between the maximal and minimal average peak area of
all classes
675.04
P-value of Kruskal-Wallis test 0.0638
P-value of Anderson-Darling test 0.0000357
Peak area intensity of no treatment 3.47
Peak area intensity of treatment 675.9
Peak area intensity of negative control treatment 0.86
Standard deviation of peak area average of no treatment 1.48
Standard deviation of peak area average of treatment 88.93
Standard deviation of peak area average of negative treatment) 0.21
Coefficient of variation in % of no treatment 42.65
Coefficient of variation in % of treatment 13.16
Coefficient of variation in % of negative treatment 24.4
Table 3.1 Peak statistic report using ClinProTools software

74
B. Fluorescence imaging
The control tissue did not exhibit fluorescence when incubated with the FRET substrate.
Alcohol washed microdialysis probe implanted tissues incubated with 10 µM QXLTM
520-Pro-
Leu-Gly-Cys(Me)~His-Ala-D-Arg-Lys(5-FAM)-NH2 exhibited fluorescence around the
microdialysis probe indicating the localization of proteolytic activities around the microdialysis
probe [Figure 3.8(A)]. Alcohol washed microdialysis probe implanted tissues incubated with
(10 µM QXLTM
520-Pro-Leu-Gly-Cys(Me)~His-Ala-D-Arg-Lys(5-FAM)-NH2 + 50 µM
GM-6001) did not block the fluorescence around the microdialysis probe indicating the
localization of proteolytic activities not specific for MMPs around the probe [Figure 3.8 (B)].
In order to validate the activity of MMPs, an EDTA-free protease inhibitor cocktail was
employed to block the hydrolysis of the substrate by proteases other than MMPs for 70/30 v/v%
ethanol/water washed tissue samples [Figure 3.8 (C)]. About 70% of the time, the tissue sample
that did not receive any treatment did not show autofluorescence. GM-6001 did not completely
block the activity of MMPs.

75
Figure 3.8 (A) Microdialysis probe implanted tissues incubated with 10 µM QXLTM
520-Pro-
Leu-Gly-Cys(Me)~His-Ala-D-Arg-Lys(5-FAM)-NH2 exhibited fluorescence around the
microdialysis probe indicating the localization of proteolytic activities around the probe
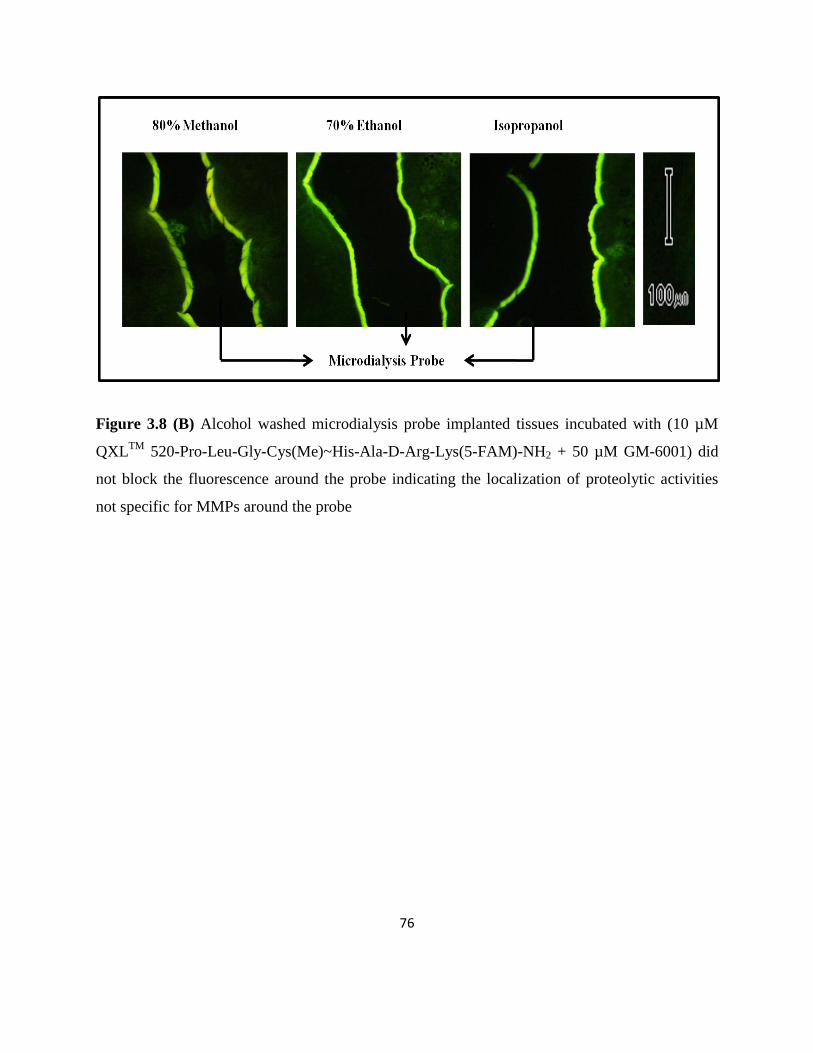
76
Figure 3.8 (B) Alcohol washed microdialysis probe implanted tissues incubated with (10 µM
QXLTM
520-Pro-Leu-Gly-Cys(Me)~His-Ala-D-Arg-Lys(5-FAM)-NH2 + 50 µM GM-6001) did
not block the fluorescence around the probe indicating the localization of proteolytic activities
not specific for MMPs around the probe
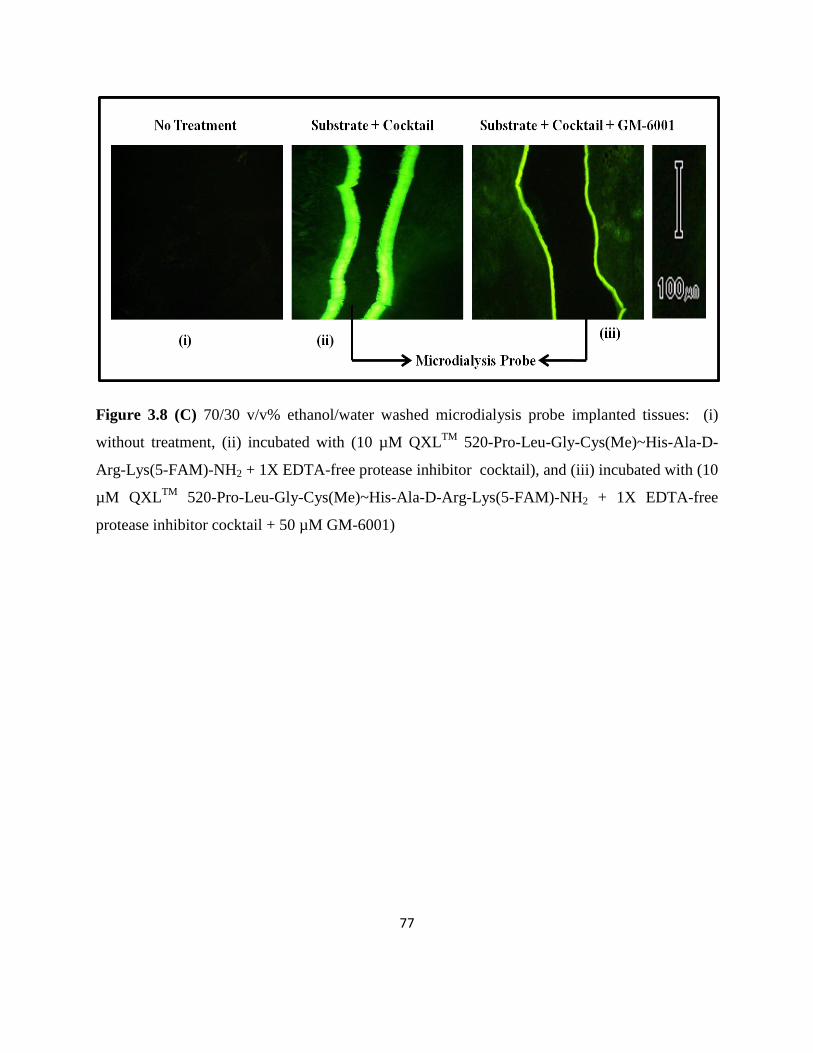
77
Figure 3.8 (C) 70/30 v/v% ethanol/water washed microdialysis probe implanted tissues: (i)
without treatment, (ii) incubated with (10 µM QXLTM
520-Pro-Leu-Gly-Cys(Me)~His-Ala-D-
Arg-Lys(5-FAM)-NH2 + 1X EDTA-free protease inhibitor cocktail), and (iii) incubated with (10
µM QXLTM
520-Pro-Leu-Gly-Cys(Me)~His-Ala-D-Arg-Lys(5-FAM)-NH2 + 1X EDTA-free
protease inhibitor cocktail + 50 µM GM-6001)

78
3.4 Conclusions
It was not possible to image the localized activity of MMP-2 and MMP-9 in unwashed
tissue samples because of signal suppression by lipids. Fluorescence imaging studies indicated
that alcohol washing did not completely remove the activity of MMPs. The use of ethanol as
washing solvent for MALDI-IMS experiments did not completely remove the lipids. However,
the signal suppression effects from interfering lipids were eliminated from the tissue sections to
allow the imaging of MMPs activity.
79
4. SUMMARY AND FUTURE DIRECTIONS
Most of the standard methods to study the localization of active enzymes in tissue
samples rely on microscopy and staining/labeling techniques.75
Visualizing the spatial
localization of enzymatic activity using imaging mass spectrometry (IMS) by monitoring the
mass difference between the substrate and its product(s) is a novel technique that does not
require labeling agents.
However, the use of a labeled substrate might permit simultaneous fluorescence and mass
spectrometry imaging on a tissue sample. The longer wavelength FRET substrate (λEx/λEm = 490
nm/520 nm), QXLTM
520-Pro-Leu-Gly-Cys(Me)~His-Ala-D-Arg-Lys(5-FAM)-NH2, used in this
research was selected solely for this purpose to image the localization of active MMPs in the
FBR-induced tissue samples.
QXLTM
520-Pro-Leu-Gly-Cys(Me)~His-Ala-D-Arg-Lys(5-FAM)-NH2 was found to be
an excellent candidate for fluorescence imaging. But, the MMP-9 activity assay performed with
this substrate did not prove to be MS-compatible.
On the other hand, the MMP-9 activity assay performed with a shorter wavelength FRET
substrate (λEx/λEm = 280 nm/360 nm), DNP-Pro-Leu-Gly~Met-Trp-Ser-Arg, was compatible with
MS. This substrate could not be used for fluorescence imaging studies because of the strong
interference from tissue autofluorescence. Hence two different FRET substrates, DNP-Pro-Leu-
Gly~Met-Trp-Ser-Arg and QXLTM
520-Pro-Leu-Gly-Cys(Me)~His-Ala-D-Arg-Lys(5-FAM)-
NH2, were used in this research for IMS and fluorescence imaging respectively.

80
The control tissue sample spiked with predigested (active MMP-9 + DNP-Pro-Leu-
Gly~Met-Trp-Ser-Arg) showed ion suppression from lipids indicating the need for an
appropriate tissue washing procedure. Alcohols are well known for their delipidation efficiency.
Gawlak et al. reported that a combined ethanol and methanol fixation of rat brain tissues at 40 C
for 6 hours did not negatively affect the activity of MMP-2 and MMP-9.70
A longer alcohol
washing time of 12 hours was selected for this research to achieve efficient removal of lipids.
Fluorescence imaging studies with alcohol washed tissue samples were performed to make sure
that alcohol washing did not have a negative effect on enzymatic activity. The use of GM-6001
as a negative control in fluorescence imaging studies showed the presence of proteolytic
activities not specific for MMPs around the implanted microdialysis probe. Hence, an EDTA-
free protease inhibitor cocktail was used to block the activity of proteinases other than MMPs.
Ex vivo tissue studies with DNP-Pro-Leu-Gly~Met-Trp-Ser-Arg and EDTA-free protease
inhibitor cocktail revealed the possibility of visualizing the spatial localization of active MMP-2
and MMP-9 in the microdialysis probe implanted tissue by monitoring the product formed at m/z
579 using MALDI-TOF imaging MS. The imaging data was validated by using GM-6001, a
broad spectrum MMPs inhibitor.
The pixel size of an image is referred to as spatial resolution in IMS.47
The diameter of
the laser beam is the limiting factor in achieving high spatial resolution in MALDI IMS. There is
a trade-off between signal intensity and spatial resolution. MALDI IMS data are mostly reported
with a pixel size of 50-500 µm. The spatial resolution used for data acquisition in MALDI IMS
experiments determines the detail level of the images.76
In this research, the MALDI MS image
was obtained at a spatial resolution of 600 µm without compromising the signal intensity.

81
Reduced data file size and data acquisition time were the advantages of low spatial resolution.
The localization of active MMP-2 and MMP-9 in the microdialysis probe implanted area was
clearly visible in the MALDI MS image.
Fluorescence imaging gives a qualitative picture of MMPs activity. MALDI IMS can be
made quantitative by considering the fact that the IMS signal is a direct measure of the relative
abundance of the analyte.77
Quantitative information can be obtained by comparing the MALDI
MS image of MMPs localization with that of control tissue spiked with known concentrations of
the product (m/z 579). However, the challenge would be to achieve a homogeneous deposition of
the product on the tissue surface that matches with the deposition of the substrate.
The bioanalytical method developed in this research enabled the visualization of
localized gelatinases (MMP-2 and MMP-9) activity at the implant site in ex vivo tissue samples.
In the future, this approach can be extended to visualize the localization of several active MMPs
at the implant site in ex vivo tissue samples. FRET substrates were used in this research only for
the purpose of using fluorescence imaging as a complementary technique. However, a
multiplexed assay to visualize the localization of several active MMPs is difficult to achieve in
fluorescence imaging because of the limited number of fluorophores that can provide non-
overlapping emission bands for the products of MMPs activity. On the other hand, several non-
FRET synthetic substrates specific for MMPs of interest can be employed for imaging the
localized MMPs activity during the foreign body response in ex vivo tissue samples.

82
References:
1. Helmus, M. N.; Gibbons, D. F.; Cebon, D., Biocompatibility: Meeting a Key Functional
Requirement of Next- Generation Medical Devices. Toxicologic Pathology 2008, 36 (1), 70-80.
2. Onuki, Y.; Bhardwaj, U.; Papadimitrakopoulos, F.; Burgess, D. J., A review of the
biocompatibility of implantable devices: current challenges to overcome foreign body response.
J Diabetes Sci Technol 2008, 2 (6), 1003-15.
3. Luttikhuizen, D. T.; Harmsen, M. C.; Van Luyn, M. J. A., Cellular and molecular
dynamics in the foreign body reaction. Tissue Engineering 2006, 12 (7), 1955-1970.
4. Anderson, J. M.; Rodriguez, A.; Chang, D. T., Foreign body reaction to biomaterials.
Seminars in Immunology 2008, 20 (2), 86-100.
5. MacLauchlan, S.; Skokos, E. A.; Meznarich, N.; Zhu, D. H.; Raoof, S.; Shipley, J. M.;
Senior, R. M.; Bornstein, P.; Kyriakides, T. R., Macrophage fusion, giant cell formation, and the
foreign body response require matrix metalloproteinase 9. Journal of Leukocyte Biology 2009, 85
(4), 617-626.
6. Kenneth Ward, W., A review of the foreign-body response to subcutaneously-implanted
devices: the role of macrophages and cytokines in biofouling and fibrosis. J Diabetes Sci
Technol 2008, 2 (5), 768-77.
7. Saghatelian, A.; Jessani, N.; Joseph, A.; Humphrey, M.; Cravatt, B. F., Activity-based
probes for the proteomic profiling of metalloproteases. Proceedings of the National Academy of
Sciences of the United States of America 2004, 101 (27), 10000-10005.
8. Moali, C.; Hulmes, D. J. S., Extracellular and cell surface proteases in wound healing:
new players are still emerging. European Journal of Dermatology 2009, 19 (6), 552-564.
9. Van Lint, P.; Libert, C., Chemokine and cytokine processing by matrix
metalloproteinases and its effect on leukocyte migration and inflammation. Journal of Leukocyte
Biology 2007, 82 (6), 1375-1381.
10. Sternlicht, M. D.; Werb, Z., How matrix metalloproteinases regulate cell behavior.
Annual Review of Cell and Developmental Biology 2001, 17, 463-516.
11. Fanjul-Fernandez, M.; Folgueras, A. R.; Cabrera, S.; Lopez-Otin, C., Matrix
metalloproteinases: Evolution, gene regulation and functional analysis in mouse models.
Biochimica Et Biophysica Acta-Molecular Cell Research 2010, 1803 (1), 3-19.
12. Le, N. T. V.; Xue, M. L.; Castelnoble, L. A.; Jackson, C. J., The dual personalities of
matrix metalloproteinases in inflammation. Frontiers in Bioscience 2007, 12, 1475-1487.

83
13. Jones, J. A.; McNally, A. K.; Chang, D. T.; Qin, L. A.; Meyerson, H.; Colton, E.; Kwon,
I. L. K.; Matsuda, T.; Anderson, J. M., Matrix metalloproteinases and their inhibitors in the
foreign body reaction on biomaterials. Journal of Biomedical Materials Research Part A 2008,
84A (1), 158-166.
14. Manicone, A. M.; McGuire, J. K., Matrix metalloproteinases as modulators of
inflammation. Seminars in Cell & Developmental Biology 2008, 19 (1), 34-41.
15. Luttikhuizen, D. T.; van Amerongen, M. J.; de Feijter, P. C.; Petersen, A. H.; Harmsen,
M. C.; van Luyn, M. J. A., The correlation between difference in foreign body reaction between
implant locations and cytokine and MMP expression. Biomaterials 2006, 27 (34), 5763-5770.
16. Parks, W. C.; Wilson, C. L.; Lopez-Boado, Y. S., Matrix metalloproteinases as
modulators of inflammation and innate immunity. Nature Reviews Immunology 2004, 4 (8), 617-
629.
17. McQuibban, G. A.; Gong, J. H.; Wong, J. R.; Wallace, J. L.; Clark-Lewis, I.; Overall, C.
M., Matrix metalloproteinase processing of monocyte chemoattractant proteins generates CC
chemokine receptor antagonists with anti-inflammatory properties in vivo. Blood 2002, 100 (4),
1160-1167.
18. Fingleton, B.; Lynch, C. C., A New Dress Code for MMPs: Cleavage Optional.
Developmental Cell 2010, 18 (1), 3-4.
19. Reuben, P. M.; Cheung, H. S., Regulation of matrix metalloproteinase (MMP) gene
expression by protein kinases. Frontiers in Bioscience 2006, 11, 1199-1215.
20. Johnson, L. L.; Dyer, R.; Hupe, D. J., Matrix metalloproteinases. Current Opinion in
Chemical Biology 1998, 2 (4), 466-471.
21. Gomis-Ruth, F. X., Catalytic Domain Architecture of Metzincin Metalloproteases.
Journal of Biological Chemistry 2009, 284 (23), 15353-15357.
22. Gross, J.; Lapiere, C. M., Collagenolytic activity in amphibian tissues- a tissue culture
assay. Proceedings of the National Academy of Sciences of the United States of America 1962,
48 (6), 1014-&.
23. Puente, X. S.; Sanchez, L. M.; Overall, C. M.; Lopez-Otin, C., Human and mouse
proteases: A comparative genomic approach. Nature Reviews Genetics 2003, 4 (7), 544-558.
24. Bertini, I.; Fragai, M.; Luchinat, C., Intra- and Interdomain Flexibility in Matrix
Metalloproteinases: Functional Aspects and Drug Design. Current Pharmaceutical Design 2009,
15 (31), 3592-3605.

84
25. Ravanti, L.; Kahari, V. M., Matrix metalloproteinases in wound repair (Review).
International Journal of Molecular Medicine 2000, 6 (4), 391-407.
26. Visse, R.; Nagase, H., Matrix metalloproteinases and tissue inhibitors of
metalloproteinases - Structure, function, and biochemistry. Circulation Research 2003, 92 (8),
827-839.
27. Page-McCaw, A.; Ewald, A. J.; Werb, Z., Matrix metalloproteinases and the regulation of
tissue remodelling. Nature Reviews Molecular Cell Biology 2007, 8 (3), 221-233.
28. Park, H. I.; Ni, J.; Gerkema, F. E.; Liu, D.; Belozerov, V. E.; Sang, Q. X. A.,
Identification and characterization of human endometase (matrix metalloproteinase-26) from
endometrial tumor. Journal of Biological Chemistry 2000, 275 (27), 20540-20544.
29. Van Wart, H. E.; Birkedal-Hansen, H., The cysteine switch a principle of regulation of
metalloproteinase activity with potential applicability to the entire matrix metalloproteinase gene
family. Proceedings of the National Academy of Sciences of the United States of America 1990,
87 (14), 5578-5582.
30. Pei, D. Q.; Kang, T. B.; Qi, H. X., Cysteine array matrix metalloproteinase (CA-
MMP)/MMP-23 is a type II transmembrane matrix metalloproteinase regulated by a single
cleavage for both secretion and activation. Journal of Biological Chemistry 2000, 275 (43),
33988-33997.
31. Nagase, H.; Visse, R.; Murphy, G., Structure and function of matrix metalloproteinases
and TIMPs. Cardiovascular Research 2006, 69 (3), 562-573.
32. Bode, W.; Fernandez-Catalan, C.; Tschesche, H.; Grams, F.; Nagase, H.; Maskos, K.,
Structural properties of matrix metalloproteinases. Cellular and Molecular Life Sciences 1999,
55 (4), 639-652.
33. Nagase, H.; Woessner, J. F., Matrix metalloproteinases. Journal of Biological Chemistry
1999, 274 (31), 21491-21494.
34. Overall, C. M., Molecular determinants of metalloproteinase substrate specificity -
Matrix metalloproteinase substrate binding domains, modules, and exosites. Molecular
Biotechnology 2002, 22 (1), 51-86.
35. Sardy, M., Role of Matrix Metalloproteinases in Skin Ageing. Connective Tissue
Research 2009, 50 (2), 132-138.
36. Somerville, R. P. T.; Oblander, S. A.; Apte, S. S., Matrix metalloproteinases: old dogs
with new tricks. Genome Biology 2003, 4 (6), 11.
85
37. Stamenkovic, I., Extracellular matrix remodelling: the role of matrix metalloproteinases.
Journal of Pathology 2003, 200 (4), 448-464.
38. Cawston, T. E.; Mercer, E., Preferential binding of collagenase to alpha-2-macroglobulin
in the presence of the tissue inhibitor of metalloproteinases. Febs Letters 1986, 209 (1), 9-12.
39. Oh, J.; Takahashi, R.; Kondo, S.; Mizoguchi, A.; Adachi, E.; Sasahara, R. M.; Nishimura,
S.; Imamura, Y.; Kitayama, H.; Alexander, D. B.; Ide, C.; Horan, T. P.; Arakawa, T.; Yoshida,
H.; Nishikawa, S. I.; Itoh, Y.; Seiki, M.; Itohara, S.; Takahashi, C.; Noda, M., The membrane-
anchored MMP inhibitor RECK is a key regulator of extracellular matrix integrity and
angiogenesis. Cell 2001, 107 (6), 789-800.
40. Catterall, J. B.; Cawston, T. E., Assays of Matrix Metalloproteinases (MMPs) and MMP
Inhibitors: Bioassays and Immunoassays Applicable to Cell Culture Medium, Serum, and
Synovial Fluid. METHODS IN MOLECULAR BIOLOGY -CLIFTON THEN TOTOWA- 2003,
225, 353-364.
41. Clark, I. M., Matrix metalloproteinase protocols. Humana Press: Totowa, NJ, 2001;
Clark, I. M., Matrix metalloproteinase protocols. Humana Press: Totowa, N.J., 2001.
42. Mungall, B. A.; Pollitt, C. C., In situ zymography: topographical considerations. Journal
of Biochemical and Biophysical Methods 2001, 47 (3), 169-176.
43. Cheng, X. C.; Fang, H.; Xu, W. F., Advances in assays of matrix metalloproteinases
(MMPs) and their inhibitors. Journal of Enzyme Inhibition and Medicinal Chemistry 2008, 23
(2), 154-167.
44. Baruch, A.; Jeffery, D. A.; Bogyo, M., Enzyme activity - it's all about image. Trends in
Cell Biology 2004, 14 (1), 29-35.
45. Weissleder, R.; Tung, C. H.; Mahmood, U.; Bogdanov, A., In vivo imaging of tumors
with protease-activated near-infrared fluorescent probes. Nature Biotechnology 1999, 17 (4),
375-378.
46. Heeren, R. M. A.; Smith, D. F.; Stauber, J.; Kukrer-Kaletas, B.; MacAleese, L., Imaging
Mass Spectrometry: Hype or Hope? Journal of the American Society for Mass Spectrometry
2009, 20 (6), 1006-1014.
47. McDonnell, L. A.; Heeren, R. M. A., Imaging mass spectrometry. Mass Spectrometry
Reviews 2007, 26 (4), 606-643.
48. Altelaar, A. F. M.; Luxembourg, S. L.; McDonnell, L. A.; Piersma, S. R.; Heeren, R. M.
A., Imaging mass spectrometry at cellular length scales. Nature Protocols 2007, 2 (5), 1185-
1196.

86
49. Chaurand, P.; Schwartz, S. A.; Caprioli, R. M., Assessing protein patterns in disease
using imaging mass spectrometry. Journal of Proteome Research 2004, 3 (2), 245-252.
50. Glish, G. L.; Vachet, R. W., The basics of mass spectrometry in the twenty-first century.
Nature Reviews Drug Discovery 2003, 2 (2), 140-150.
51. Watson, J. T.; Sparkman, O. D., Introduction to mass spectrometry : instrumentation,
applications and strategies for data interpretation. John Wiley & Sons: Chichester, England;
Hoboken, NJ, 2007.
52. Suckau, D.; Resemann, A.; Schuerenberg, M.; Hufnagel, P.; Franzen, J.; Holle, A., A
novel MALDI LIFT-TOF/TOF mass spectrometer for proteomics. Analytical and Bioanalytical
Chemistry 2003, 376 (7), 952-965.
53. Hardesty, W. M.; Caprioli, R. M., In situ molecular imaging of proteins in tissues using
mass spectrometry. Analytical and Bioanalytical Chemistry 2008, 391 (3), 899-903.
54. Kruse, R.; Sweedler, J. V., Spatial profiling invertebrate ganglia using MALDI MS.
Journal of the American Society for Mass Spectrometry 2003, 14 (7), 752-759.
55. Seeley, E. H.; Oppenheimer, S. R.; Mi, D.; Chaurand, P.; Caprioli, R. M. In Enhancement
of protein sensitivity for MALDI imaging mass spectrometry after chemical treatment of tissue
sections, Elsevier Science Inc: 2008; pp 1069-1077.
56. Schwartz, S. A.; Reyzer, M. L.; Caprioli, R. M., Direct tissue analysis using matrix-
assisted laser desorption/ionization mass spectrometry: practical aspects of sample preparation.
Journal of Mass Spectrometry 2003, 38 (7), 699-708.
57. Eijkel, G. B.; Kaletas, B. K.; van der Wiel, I. M.; Kros, J. M.; Luider, T. M.; Heeren, R.
M. A., Correlating MALDI and SIMS imaging mass spectrometric datasets of biological tissue
surfaces. Surface and Interface Analysis 2009, 41 (8), 675-685.
58. Greis, K. D., Mass spectrometry for enzyme assays and inhibitor screening: An emerging
application in pharmaceutical research. Mass Spectrometry Reviews 2007, 26 (3), 324-339.
59. Mandal, M.; Mandal, A.; Das, S.; Chakraborti, T.; Chakraborti, S., Clinical implications
of matrix metalloproteinases. Molecular and Cellular Biochemistry 2003, 252 (1-2), 305-329.
60. Witte, M. B.; Thornton, F. J.; Kiyama, T.; Efron, D. T.; Schulz, G. S.; Moldawer, L. L.;
Barbul, A. In Metalloproteinase inhibitors and wound healing: A novel enhancer of wound
strength, Mosby-Year Book Inc: 1998; pp 464-470.

87
61. Leib, S. L.; Leppert, D.; Clements, J.; Tauber, M. G., Matrix metalloproteinases
contribute to brain damage in experimental pneumococcal meningitis. Infection and Immunity
2000, 68 (2), 615-620.
62. Stepicheva; nbsp; N. Altered lipid composition of melanosomal membranes in Smyth line
chickens with autoimmune vitiligo. M.S., University of Arkansas, United States -- Arkansas,
2011.
63. Schwamborn, K.; Krieg, R. C.; Reska, M.; Jakse, G.; Knuechel, R.; Wellmann, A.,
Identifying prostate carcinoma by MALDI-Imaging. International Journal of Molecular
Medicine 2007, 20 (2), 155-159.
64. Zaima, N.; Hayasaka, T.; Goto-Inoue, N.; Setou, M., Imaging of Metabolites by MALDI
Mass Spectrometry. Journal of Oleo Science 2009, 58 (8), 415-419.
65. Okada, Y.; Gonoji, Y.; Naka, K.; Tomita, K.; Nakanishi, I.; Iwata, K.; Yamashita, K.;
Hayakawa, T., Matrix metalloproteinase -9(92-KDa gelatinase type-IV collagenase) from HT-
1080 human fibrosarcoma cells - Purification and activation of the precursor and enzymatic-
properties. Journal of Biological Chemistry 1992, 267 (30), 21712-21719.
66. Snoek-van Beurden, P. A. M.; Von den Hoff, J. W., Zymographic techniques for the
analysis of matrix metalloproteinases and their inhibitors. Biotechniques 2005, 38 (1), 73-83.
67. Jambovane, S.; Kim, D. J.; Duin, E. C.; Kim, S.-K.; Hong, J. W., Creation of Stepwise
Concentration Gradient in Picoliter Droplets for Parallel Reactions of Matrix Metalloproteinase
II and IX. Analytical Chemistry 2011, null-null.
68. Fiore, E.; Fusco, C.; Romero, P.; Stamenkovic, I., Matrix metalloproteinase 9 (MMP-
9/gelatinase B) proteolytically cleaves ICAM-1 and participates in tumor cell resistance to
natural killer cell-mediated cytotoxicity. Oncogene 2002, 21 (34), 5213-5223.
69. von Grote, E. C.; Venkatakrishnan, V.; Duo, J.; Stenken, J. A., Long-term subcutaneous
microdialysis sampling and qRT-PCR of MCP-1, IL-6 and IL-10 in freely-moving rats.
Molecular Biosystems 2011, 7 (1), 150-161.
70. Gawlak, M.; Gorkiewicz, T.; Gorlewicz, A.; Konopacki, F. A.; Kaczmarek, L.;
Wilczynski, G. M., High resolution in situ zymography reveals matrix metalloproteinase activity
at glutamatergic synapses. Neuroscience 2009, 158 (1), 167-176.
71. Altelaar, A. F. M.; Taban, I. M.; McDonnell, L. A.; Verhaert, P.; de Lange, R. P. J.;
Adan, R. A. H.; Mooi, W. J.; Heeren, R. M. A.; Piersma, S. R., High-resolution MALDI imaging
mass spectrometry allows localization of peptide distributions at cellular length scales in
pituitary tissue sections. International Journal of Mass Spectrometry 2007, 260 (2-3), 203-211.

88
72. Grey, A. C.; Chaurand, P.; Caprioli, R. M.; Schey, K. L., MALDI Imaging Mass
Spectrometry of Integral Membrane Proteins from Ocular Lens and Retinal Tissue. Journal of
Proteome Research 2009, 8 (7), 3278-3283.
73. Beekman, B.; vanEl, B.; Drijfhout, J. W.; Ronday, H. K.; TeKoppele, J. M., Highly
increased levels of active stromelysin in rheumatoid synovial fluid determined by a selective
fluorogenic assay. Febs Letters 1997, 418 (3), 305-309.
74. Seeley, E. H.; Caprioli, R. M., Molecular imaging of proteins in tissues by mass
spectrometry. Proceedings of the National Academy of Sciences of the United States of America
2008, 105 (47), 18126-18131.
75. Svatos, A., Mass spectrometric imaging of small molecules. Trends in Biotechnology
2010, 28 (8), 425-434.
76. Snel, M. F.; Fuller, M., High-Spatial Resolution Matrix-Assisted Laser Desorption
Ionization Imaging Analysis of Glucosylceramide in Spleen Sections from a Mouse Model of
Gaucher Disease. Analytical Chemistry 2010, 82 (9), 3664-3670.
77. Koeniger, S. L.; Talaty, N.; Luo, Y. P.; Ready, D.; Voorbach, M.; Seifert, T.; Cepa, S.;
Fagerland, J. A.; Bouska, J.; Buck, W.; Johnson, R. W.; Spanton, S., A quantitation method for
mass spectrometry imaging. Rapid Communications in Mass Spectrometry 2011, 25 (4), 503-
510.
Related Documents