64 Indoor Localization Improved by Spatial Context—A Survey FUQIANG GU, University of Melbourne, Australia XUKE HU, Heidelberg University, Germany MILAD RAMEZANI, DEBADITYA ACHARYA, and KOUROSH KHOSHELHAM, University of Melbourne, Australia SHAHROKH VALAEE, University of Toronto, Canada JIANGA SHANG, China University of Geosciences, China Indoor localization is essential for healthcare, security, augmented reality gaming, and many other location- based services. There is currently a wealth of relevant literature on indoor localization. This article focuses on recent advances in indoor localization methods that use spatial context to improve the location estima- tion. Spatial context in the form of maps and spatial models have been used to improve the localization by constraining location estimates in the navigable parts of indoor environments. Landmarks such as doors and corners, which are also one form of spatial context, have proved useful in assisting indoor localization by cor- recting the localization error. This survey gives a comprehensive review of state-of-the-art indoor localization methods and localization improvement methods using maps, spatial models, and landmarks. CCS Concepts: • Human-centered computing → Ubiquitous and mobile computing; Additional Key Words and Phrases: Indoor positioning, spatial information, sensory landmarks, landmark detection, wireless localization, hybrid localization, smartphones ACM Reference format: Fuqiang Gu, Xuke Hu, Milad Ramezani, Debaditya Acharya, Kourosh Khoshelham, Shahrokh Valaee, and Jianga Shang. 2019. Indoor Localization Improved by Spatial Context—A Survey. ACM Comput. Surv. 52, 3, Article 64 (July 2019), 35 pages. https://doi.org/10.1145/3322241 1 INTRODUCTION Indoor localization has been studied for decades and a number of indoor localization solutions have been proposed [72, 124, 149, 173, 174] that use different localization signals such as WiFi, This work is jointly supported by the National Key Research and Development Program of China (Grant No. 2016YFB0502200) and the China Scholarship Council-University of Melbourne Research Scholarship (Grant No. CSC 201408420117). Authors’ addresses: F. Gu, University of Melbourne, Parkville, Melbourne, VIC, 3010, Australia; email: [email protected]; X. Hu (corresponding author), Grabengasse 1, Heidelberg University, Heidel- berg, 69117, Germany; email: [email protected]; M. Ramezani, D. Acharya, and K. Khoshelham, University of Melbourne, Parkville, Melbourne, VIC, 3010, Australia; emails: {mramezani, acharyad}@student.unimelb.edu.au, [email protected]; S. Valaee, University of Toronto, 10 King’s College Rd, Toronto, ON, Canada; email: [email protected]; J. Shang, 388 Lumo Rd, China University of Geosciences, Wuhan, Hubei, China; email: [email protected]. Permission to make digital or hard copies of all or part of this work for personal or classroom use is granted without fee provided that copies are not made or distributed for profit or commercial advantage and that copies bear this notice and the full citation on the first page. Copyrights for components of this work owned by others than ACM must be honored. Abstracting with credit is permitted. To copy otherwise, or republish, to post on servers or to redistribute to lists, requires prior specific permission and/or a fee. Request permissions from [email protected]. © 2019 Association for Computing Machinery. 0360-0300/2019/07-ART64 $15.00 https://doi.org/10.1145/3322241 ACM Computing Surveys, Vol. 52, No. 3, Article 64. Publication date: July 2019.

Welcome message from author
This document is posted to help you gain knowledge. Please leave a comment to let me know what you think about it! Share it to your friends and learn new things together.
Transcript
64
Indoor Localization Improved by Spatial Context—A Survey
FUQIANG GU, University of Melbourne, Australia
XUKE HU, Heidelberg University, Germany
MILAD RAMEZANI, DEBADITYA ACHARYA, and KOUROSH KHOSHELHAM,
University of Melbourne, Australia
SHAHROKH VALAEE, University of Toronto, Canada
JIANGA SHANG, China University of Geosciences, China
Indoor localization is essential for healthcare, security, augmented reality gaming, and many other location-
based services. There is currently a wealth of relevant literature on indoor localization. This article focuses
on recent advances in indoor localization methods that use spatial context to improve the location estima-
tion. Spatial context in the form of maps and spatial models have been used to improve the localization by
constraining location estimates in the navigable parts of indoor environments. Landmarks such as doors and
corners, which are also one form of spatial context, have proved useful in assisting indoor localization by cor-
recting the localization error. This survey gives a comprehensive review of state-of-the-art indoor localization
methods and localization improvement methods using maps, spatial models, and landmarks.
CCS Concepts: • Human-centered computing → Ubiquitous and mobile computing;
Additional Key Words and Phrases: Indoor positioning, spatial information, sensory landmarks, landmark
detection, wireless localization, hybrid localization, smartphones
ACM Reference format:
Fuqiang Gu, Xuke Hu, Milad Ramezani, Debaditya Acharya, Kourosh Khoshelham, Shahrokh Valaee, and
Jianga Shang. 2019. Indoor Localization Improved by Spatial Context—A Survey. ACM Comput. Surv. 52, 3,
Article 64 (July 2019), 35 pages.
https://doi.org/10.1145/3322241
1 INTRODUCTION
Indoor localization has been studied for decades and a number of indoor localization solutionshave been proposed [72, 124, 149, 173, 174] that use different localization signals such as WiFi,
This work is jointly supported by the National Key Research and Development Program of China (Grant No.
2016YFB0502200) and the China Scholarship Council-University of Melbourne Research Scholarship (Grant No. CSC
201408420117).
Authors’ addresses: F. Gu, University of Melbourne, Parkville, Melbourne, VIC, 3010, Australia; email:
[email protected]; X. Hu (corresponding author), Grabengasse 1, Heidelberg University, Heidel-
berg, 69117, Germany; email: [email protected]; M. Ramezani, D. Acharya, and K. Khoshelham, University
of Melbourne, Parkville, Melbourne, VIC, 3010, Australia; emails: {mramezani, acharyad}@student.unimelb.edu.au,
[email protected]; S. Valaee, University of Toronto, 10 King’s College Rd, Toronto, ON, Canada; email:
[email protected]; J. Shang, 388 Lumo Rd, China University of Geosciences, Wuhan, Hubei, China; email:
Permission to make digital or hard copies of all or part of this work for personal or classroom use is granted without fee
provided that copies are not made or distributed for profit or commercial advantage and that copies bear this notice and
the full citation on the first page. Copyrights for components of this work owned by others than ACM must be honored.
Abstracting with credit is permitted. To copy otherwise, or republish, to post on servers or to redistribute to lists, requires
prior specific permission and/or a fee. Request permissions from [email protected].
© 2019 Association for Computing Machinery.
0360-0300/2019/07-ART64 $15.00
https://doi.org/10.1145/3322241
ACM Computing Surveys, Vol. 52, No. 3, Article 64. Publication date: July 2019.
64:2 F. Gu et al.
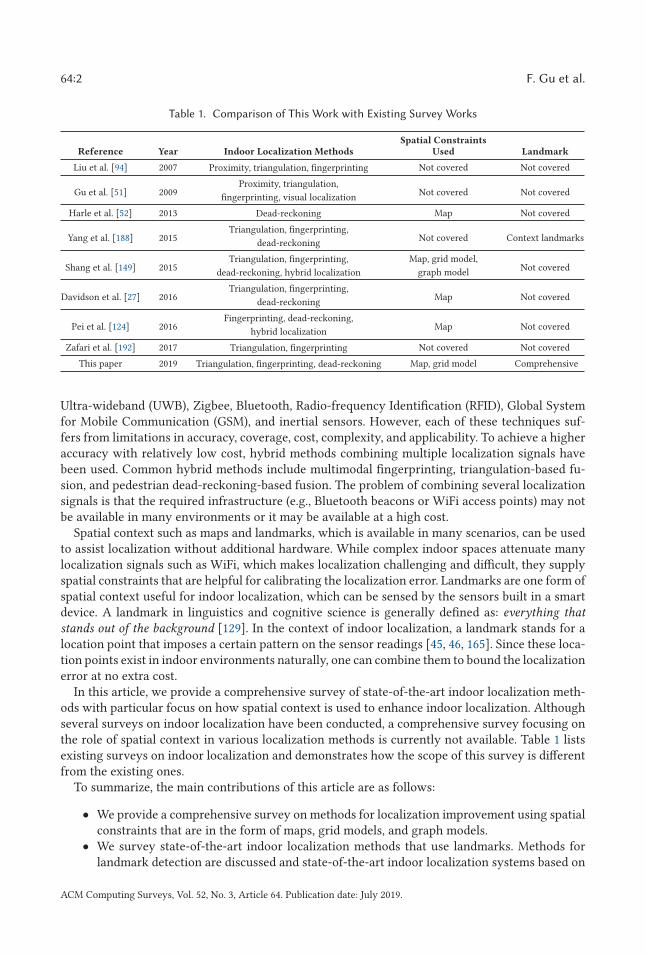
Table 1. Comparison of This Work with Existing Survey Works
Reference Year Indoor Localization MethodsSpatial Constraints
Used Landmark
Liu et al. [94] 2007 Proximity, triangulation, fingerprinting Not covered Not covered
Gu et al. [51] 2009Proximity, triangulation,
Not covered Not coveredfingerprinting, visual localization
Harle et al. [52] 2013 Dead-reckoning Map Not covered
Yang et al. [188] 2015Triangulation, fingerprinting,
Not covered Context landmarksdead-reckoning
Shang et al. [149] 2015Triangulation, fingerprinting, Map, grid model,
Not covereddead-reckoning, hybrid localization graph model
Davidson et al. [27] 2016Triangulation, fingerprinting,
Map Not covereddead-reckoning
Pei et al. [124] 2016Fingerprinting, dead-reckoning,
Map Not coveredhybrid localization
Zafari et al. [192] 2017 Triangulation, fingerprinting Not covered Not covered
This paper 2019 Triangulation, fingerprinting, dead-reckoning Map, grid model Comprehensive
Ultra-wideband (UWB), Zigbee, Bluetooth, Radio-frequency Identification (RFID), Global Systemfor Mobile Communication (GSM), and inertial sensors. However, each of these techniques suf-fers from limitations in accuracy, coverage, cost, complexity, and applicability. To achieve a higheraccuracy with relatively low cost, hybrid methods combining multiple localization signals havebeen used. Common hybrid methods include multimodal fingerprinting, triangulation-based fu-sion, and pedestrian dead-reckoning-based fusion. The problem of combining several localizationsignals is that the required infrastructure (e.g., Bluetooth beacons or WiFi access points) may notbe available in many environments or it may be available at a high cost.
Spatial context such as maps and landmarks, which is available in many scenarios, can be usedto assist localization without additional hardware. While complex indoor spaces attenuate manylocalization signals such as WiFi, which makes localization challenging and difficult, they supplyspatial constraints that are helpful for calibrating the localization error. Landmarks are one form ofspatial context useful for indoor localization, which can be sensed by the sensors built in a smartdevice. A landmark in linguistics and cognitive science is generally defined as: everything that
stands out of the background [129]. In the context of indoor localization, a landmark stands for alocation point that imposes a certain pattern on the sensor readings [45, 46, 165]. Since these loca-tion points exist in indoor environments naturally, one can combine them to bound the localizationerror at no extra cost.
In this article, we provide a comprehensive survey of state-of-the-art indoor localization meth-ods with particular focus on how spatial context is used to enhance indoor localization. Althoughseveral surveys on indoor localization have been conducted, a comprehensive survey focusing onthe role of spatial context in various localization methods is currently not available. Table 1 listsexisting surveys on indoor localization and demonstrates how the scope of this survey is differentfrom the existing ones.
To summarize, the main contributions of this article are as follows:
• We provide a comprehensive survey on methods for localization improvement using spatialconstraints that are in the form of maps, grid models, and graph models.
• We survey state-of-the-art indoor localization methods that use landmarks. Methods forlandmark detection are discussed and state-of-the-art indoor localization systems based on
ACM Computing Surveys, Vol. 52, No. 3, Article 64. Publication date: July 2019.
Indoor Localization Improved by Spatial Context—A Survey 64:3
landmarks are introduced. To the best of our information, this survey is the first work onreviewing landmark-based indoor localization systematically.
This survey is structured as follows: Section 2 introduces the taxonomy of indoor localizationand gives a systematic review on the state-of-the-art indoor localization methods. Section 3 sur-veys indoor localization improvement methods, including map -matching-based and spatial -model-
based. Section 4 first gives the definition of landmark in the context of indoor localization, followedby the introduction of different types of landmarks, and then presents the landmark detection aswell as the state-of-the-art systems using landmarks. Section 5 concludes this article and givesopen research challenges.
2 INDOOR LOCALIZATION METHODS
Indoor localization methods estimate the location of an entity (e.g., a person or object) by usinglocalization signals such as WiFi, UWB, Zigbee, Bluetooth, RFID, Cellular, Infrared (IR), FrequencyModulation (FM), inertial sensors, and camera [27, 43, 51, 94, 100, 123, 157]. According to thelocalization principles, we categorize indoor localization methods into five types: Proximity, Trian-
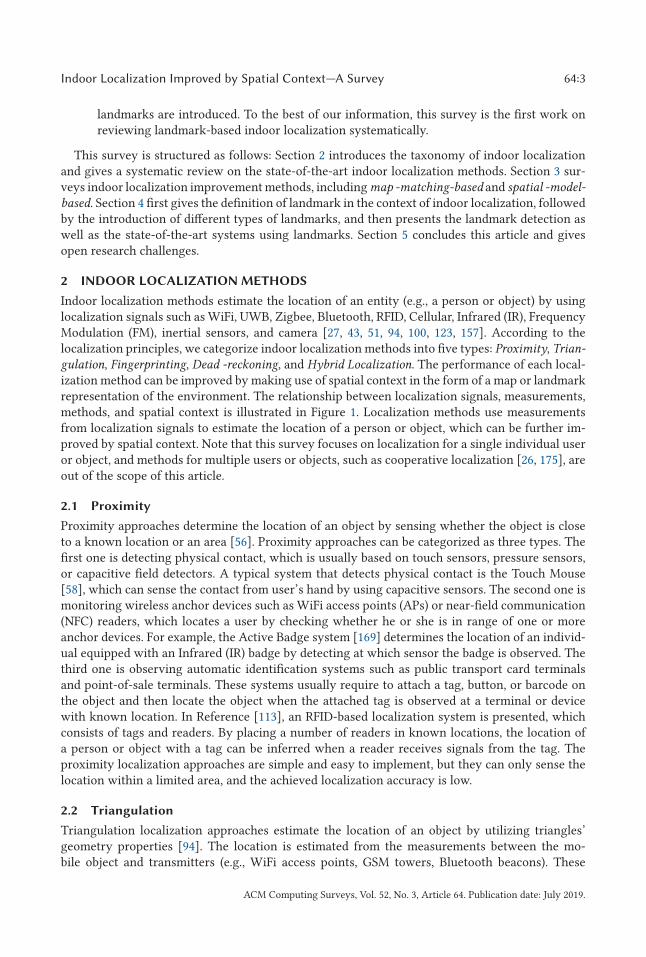
gulation, Fingerprinting, Dead -reckoning, and Hybrid Localization. The performance of each local-ization method can be improved by making use of spatial context in the form of a map or landmarkrepresentation of the environment. The relationship between localization signals, measurements,methods, and spatial context is illustrated in Figure 1. Localization methods use measurementsfrom localization signals to estimate the location of a person or object, which can be further im-proved by spatial context. Note that this survey focuses on localization for a single individual useror object, and methods for multiple users or objects, such as cooperative localization [26, 175], areout of the scope of this article.
2.1 Proximity
Proximity approaches determine the location of an object by sensing whether the object is closeto a known location or an area [56]. Proximity approaches can be categorized as three types. Thefirst one is detecting physical contact, which is usually based on touch sensors, pressure sensors,or capacitive field detectors. A typical system that detects physical contact is the Touch Mouse[58], which can sense the contact from user’s hand by using capacitive sensors. The second one ismonitoring wireless anchor devices such as WiFi access points (APs) or near-field communication(NFC) readers, which locates a user by checking whether he or she is in range of one or moreanchor devices. For example, the Active Badge system [169] determines the location of an individ-ual equipped with an Infrared (IR) badge by detecting at which sensor the badge is observed. Thethird one is observing automatic identification systems such as public transport card terminalsand point-of-sale terminals. These systems usually require to attach a tag, button, or barcode onthe object and then locate the object when the attached tag is observed at a terminal or devicewith known location. In Reference [113], an RFID-based localization system is presented, whichconsists of tags and readers. By placing a number of readers in known locations, the location ofa person or object with a tag can be inferred when a reader receives signals from the tag. Theproximity localization approaches are simple and easy to implement, but they can only sense thelocation within a limited area, and the achieved localization accuracy is low.
2.2 Triangulation
Triangulation localization approaches estimate the location of an object by utilizing triangles’geometry properties [94]. The location is estimated from the measurements between the mo-bile object and transmitters (e.g., WiFi access points, GSM towers, Bluetooth beacons). These
ACM Computing Surveys, Vol. 52, No. 3, Article 64. Publication date: July 2019.
64:4 F. Gu et al.
Fig. 1. The relationship between localization signals, measurements, methods, and spatial information.
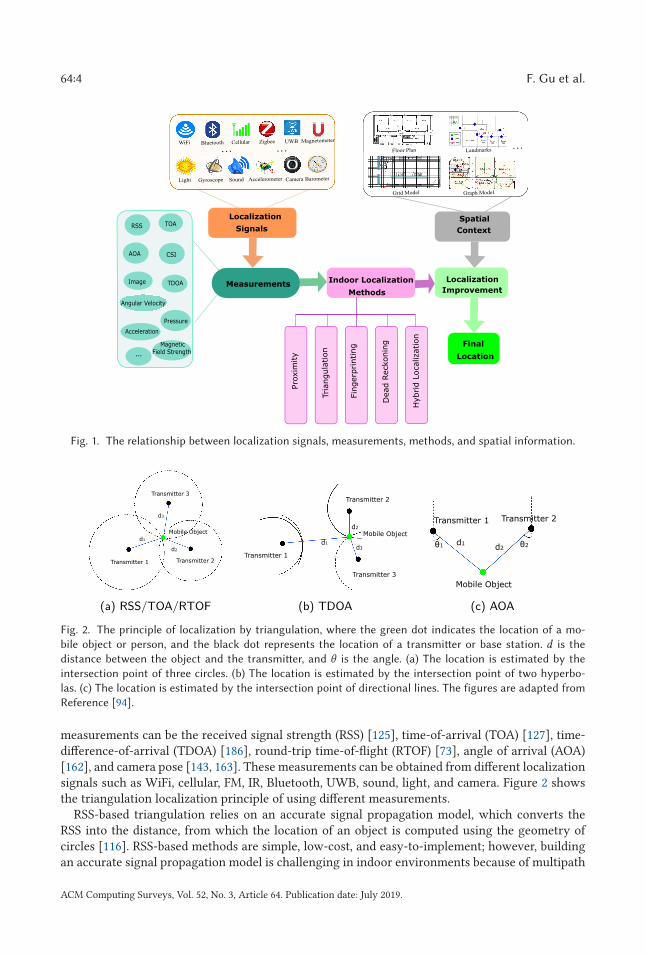
Fig. 2. The principle of localization by triangulation, where the green dot indicates the location of a mo-
bile object or person, and the black dot represents the location of a transmitter or base station. d is the
distance between the object and the transmitter, and θ is the angle. (a) The location is estimated by the
intersection point of three circles. (b) The location is estimated by the intersection point of two hyperbo-
las. (c) The location is estimated by the intersection point of directional lines. The figures are adapted from
Reference [94].
measurements can be the received signal strength (RSS) [125], time-of-arrival (TOA) [127], time-difference-of-arrival (TDOA) [186], round-trip time-of-flight (RTOF) [73], angle of arrival (AOA)[162], and camera pose [143, 163]. These measurements can be obtained from different localizationsignals such as WiFi, cellular, FM, IR, Bluetooth, UWB, sound, light, and camera. Figure 2 showsthe triangulation localization principle of using different measurements.
RSS-based triangulation relies on an accurate signal propagation model, which converts theRSS into the distance, from which the location of an object is computed using the geometry ofcircles [116]. RSS-based methods are simple, low-cost, and easy-to-implement; however, buildingan accurate signal propagation model is challenging in indoor environments because of multipath
ACM Computing Surveys, Vol. 52, No. 3, Article 64. Publication date: July 2019.
Indoor Localization Improved by Spatial Context—A Survey 64:5
interference and shadowing [27]. Besides, RSS is vulnerable to mobility of the phone or reflec-tors (e.g., people walking in the environment), device orientation, device type and model, and soon. The accuracy of RSS-based methods is usually low due to the inaccuracy of converting RSSmeasurements to corresponding distances.
TOA-based triangulation estimates the locations of an object by measuring the time-of-arrivalbetween the object (equipped with a receiver) and transmitters [42]. To achieve 2D localization, atleast three TOA measurements from different transmitters are required. Since the speed of wirelesssignal is constant, the distance to different transmitters can be calculated once the TOA measure-ment is obtained. Then the object’s location can be computed by using least-squares algorithm,closest neighbor, or residual weighting [67]. Compared to the RSS-based methods, the TOA-basedmethods can achieve a high localization accuracy. The main problem of TOA-based methods isthe requirement of precise synchronization between all transmitters and receivers, resulting in arelatively high cost.
Similar to TOA-based triangulation, RTOF-based triangulation locates an object by measuringthe round-trip time of flight (RTOF) of the signal propagating from the mobile receiver to the trans-mitters and back [140]. However, the RTOF-based approach has no need for clock synchronizationbetween the mobile receiver and transmitters [105]. A challenge of the RTOF-based approach isto obtain the exact delay/processing time caused by the mobile receiver, which cannot be ignoredwhen the distance between the receiver and transmitters is short.
TDOA-based triangulation has been proposed to relieve the need of TOA-based methods forprecise synchronization, which measures the time difference of receiving the signal at multipletransmitters. A 2D object’s location can be calculated with two or more TDOA measurements vianonlinear regression methods such as a linear iterative algorithm [160]. TDOA-based methods canachieve a relatively high accuracy and have no requirement for strict clock synchronization be-tween transmitters and mobile object. However, it is still required to synchronize the clock betweentransmitters.
AOA-based triangulation determines the location of an object by measuring the AOA from mul-tiple transmitters [162], which can be done with an array of antennas or directional antennas. Theadvantages of AOA-based approaches are that the 2D location estimation can be made only withtwo transmitters and that it has no requirement for clock synchronization. Its drawbacks includethe need for special and expensive hardware (e.g., directional antennas) and the degradation oflocation estimates as the distance between the mobile object and the transmitters increases [94,123]. ArrayTrack [184] and SpotFi [75] use the channel status information (CSI) from existing WiFiAPs to derive AOA and/or TOF information, which achieve a decimeter-level accuracy.
The triangulation principle for localization has been widely used in visual localization by oneor more cameras, which is usually called camera-pose-estimation-based method. It estimates thelocation by calculating the pose of the camera carried by a user. Visual features in the imagessuch as point descriptors and image edges have been used for estimating the camera pose [143,163] by modeling the transformation between the image coordinate system and the world coordi-nate system (e.g., perspective n-point problem) [144]. Visual odometry [114], visual simultaneouslocalization and mapping (SLAM) [28], and model-based visual tracking [83] fall under this cate-gory. Pose-estimation-based methods are able to achieve a centimeter-level accuracy when thereare sufficient distinctive visual landmarks or features in the environment. However, these meth-ods are likely to fail in environments with poorly textured surfaces. Also, visual odometry andvisual SLAM methods suffer from the drift of the estimated trajectory due to the accumulationof local motion estimation errors, whereas model-based visual tracking does not have this prob-lem, because the errors are continuously corrected by using the known world coordinates of thelandmarks.
ACM Computing Surveys, Vol. 52, No. 3, Article 64. Publication date: July 2019.
64:6 F. Gu et al.
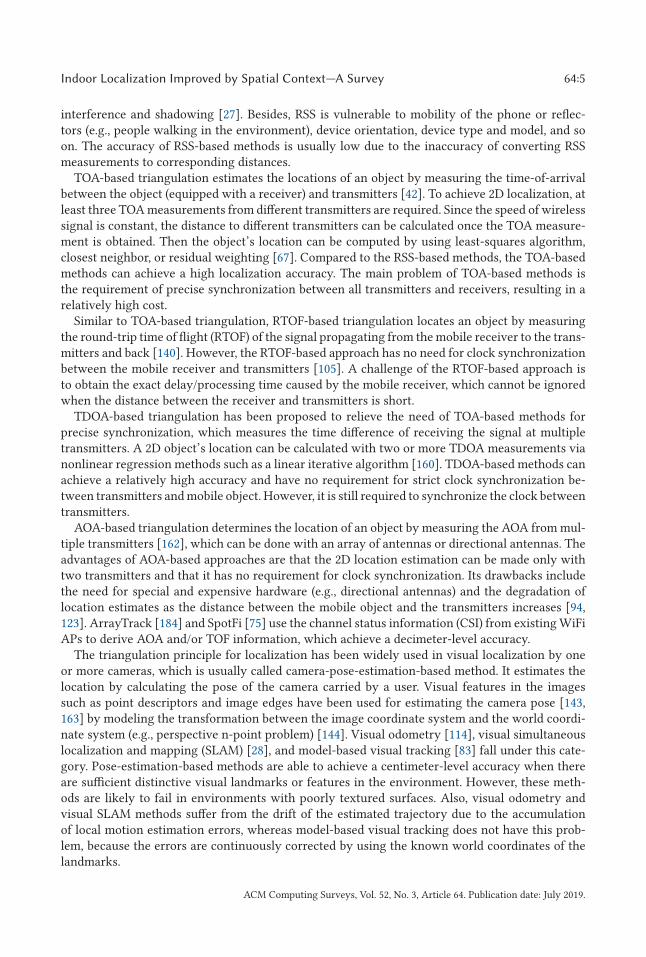
Fig. 3. The principle of WiFi fingerprinting.
2.3 Fingerprinting
Fingerprinting is a popular method for estimating an object’s location, the key idea behind whichis computing the location of the object by matching a set of measurements called a fingerprint witha set of fingerprints that are collected and stored in a pre-built database [27, 60, 153]. A fingerprintis the measurements from a localization signal at a certain location. For example, WiFi fingerprintsare the RSS measurements from visible APs. Fingerprinting consists of two phases: training andlocalization. In the training phase, a fingerprint database within the area of interest is establishedat a certain level of granularity. Finer granularity usually means better accuracy, but requires moreeffort in terms of time and labor for the collection of fingerprints. In the localization phase, thelocation of the object is computed by matching the collected fingerprint with the fingerprints inthe database using deterministic algorithms or probabilistic algorithms [29]. Depending on theused localization signals, fingerprinting can be categorized as wireless fingerprinting, magnetic fin-
gerprinting, and visual fingerprinting.Wireless fingerprinting uses wireless signals including WiFi, cellular, FM, Zigbee, RFID, Blue-
tooth, and so on to locate an object. Among them, WiFi fingerprinting is the most popular onebecause of its ubiquity in public areas. Figure 3 shows the rationale of WiFi fingerprinting us-ing RSS measurements. Apart from RSS measurements, CSI measurements can also be used forlocalization. The difference is that RSS-based fingerprinting uses the total received power [53],while CSI-based fingerprinting utilizes the amplitude and/or phase of each subcarrier of the chan-nel [167, 189]. Compared with RSS-based fingerprinting, CSI-based fingerprinting is more robustand has higher accuracy [145]. However, the WiFi cards on modern smartphones and other smartdevices (except some laptops) do not support the extraction of CSI, which constrains the applica-bility of CSI fingerprinting. The main challenge of wireless fingerprinting is that the constructionof a fingerprint database is troublesome and time-consuming. Many efforts have been made torelieve the site survey task, mainly including WiFi SLAM [36, 38] and crowdsourcing [101, 121,187]. However, the heavy computational load of these WiFi SLAM systems prevents them frombeing implemented on the resource-limited mobile devices. Compared with WiFi SLAM methods,crowdsourcing methods consume less computational cost, but they suffer from the requirementfor active user participation, low accuracy, and limited applicability.
Magnetic fingerprinting is similar to wireless fingeprinting. A magnetic field map, composed oftuples of magnetic readings and location coordinates, is constructed in the training phase. Eachtuple is called a fingerprint. Unlike WiFi fingerprints, which can be collected by the user standingat known points, magnetic fingerprints are usually extracted from temporal traces, since a sin-gle magnetic fingerprint is not useful for localization. There are usually three forms of magneticmeasurements: raw 3D magnetometer readings [24], magnitude [155], and horizontal and vertical
ACM Computing Surveys, Vol. 52, No. 3, Article 64. Publication date: July 2019.
Indoor Localization Improved by Spatial Context—A Survey 64:7
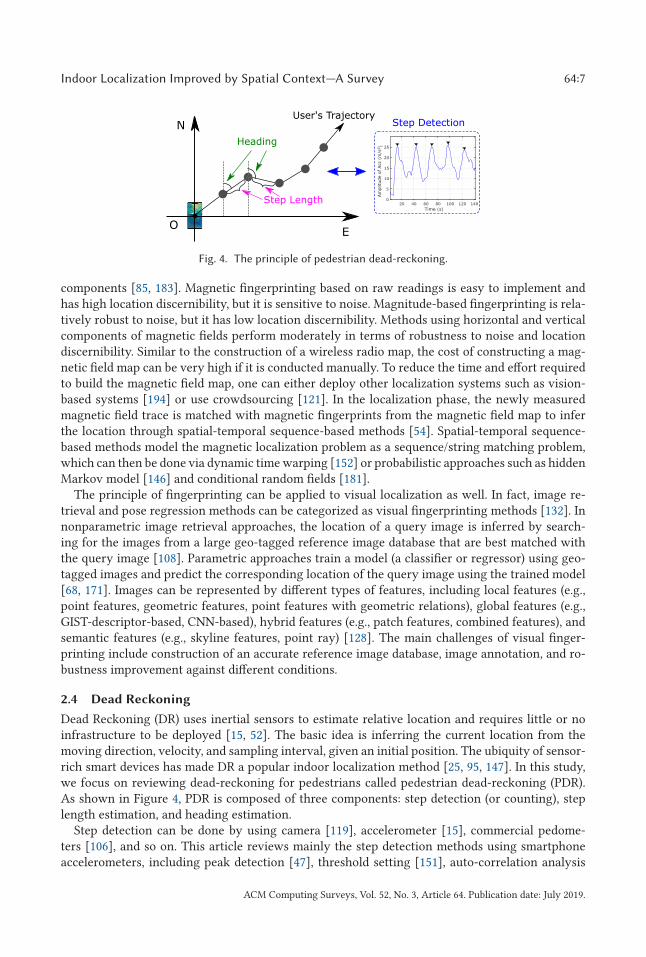
Fig. 4. The principle of pedestrian dead-reckoning.
components [85, 183]. Magnetic fingerprinting based on raw readings is easy to implement andhas high location discernibility, but it is sensitive to noise. Magnitude-based fingerprinting is rela-tively robust to noise, but it has low location discernibility. Methods using horizontal and verticalcomponents of magnetic fields perform moderately in terms of robustness to noise and locationdiscernibility. Similar to the construction of a wireless radio map, the cost of constructing a mag-netic field map can be very high if it is conducted manually. To reduce the time and effort requiredto build the magnetic field map, one can either deploy other localization systems such as vision-based systems [194] or use crowdsourcing [121]. In the localization phase, the newly measuredmagnetic field trace is matched with magnetic fingerprints from the magnetic field map to inferthe location through spatial-temporal sequence-based methods [54]. Spatial-temporal sequence-based methods model the magnetic localization problem as a sequence/string matching problem,which can then be done via dynamic time warping [152] or probabilistic approaches such as hiddenMarkov model [146] and conditional random fields [181].
The principle of fingerprinting can be applied to visual localization as well. In fact, image re-trieval and pose regression methods can be categorized as visual fingerprinting methods [132]. Innonparametric image retrieval approaches, the location of a query image is inferred by search-ing for the images from a large geo-tagged reference image database that are best matched withthe query image [108]. Parametric approaches train a model (a classifier or regressor) using geo-tagged images and predict the corresponding location of the query image using the trained model[68, 171]. Images can be represented by different types of features, including local features (e.g.,point features, geometric features, point features with geometric relations), global features (e.g.,GIST-descriptor-based, CNN-based), hybrid features (e.g., patch features, combined features), andsemantic features (e.g., skyline features, point ray) [128]. The main challenges of visual finger-printing include construction of an accurate reference image database, image annotation, and ro-bustness improvement against different conditions.
2.4 Dead Reckoning
Dead Reckoning (DR) uses inertial sensors to estimate relative location and requires little or noinfrastructure to be deployed [15, 52]. The basic idea is inferring the current location from themoving direction, velocity, and sampling interval, given an initial position. The ubiquity of sensor-rich smart devices has made DR a popular indoor localization method [25, 95, 147]. In this study,we focus on reviewing dead-reckoning for pedestrians called pedestrian dead-reckoning (PDR).As shown in Figure 4, PDR is composed of three components: step detection (or counting), steplength estimation, and heading estimation.
Step detection can be done by using camera [119], accelerometer [15], commercial pedome-ters [106], and so on. This article reviews mainly the step detection methods using smartphoneaccelerometers, including peak detection [47], threshold setting [151], auto-correlation analysis
ACM Computing Surveys, Vol. 52, No. 3, Article 64. Publication date: July 2019.
64:8 F. Gu et al.
[133], and spectral analysis [52]. Peak-detection-based methods are based on the observation thatthe number of steps corresponds to the number of acceleration peaks [193]. Therefore, by detectingthese peaks, one can count how many steps a user takes. The threshold-based methods detect stepsby comparing the accelerometer readings with a certain threshold [93, 117]. The auto-correlationanalysis methods utilize the auto-correlation of the acceleration signal to detect steps. The spec-tral analysis methods work by first transforming accelerometer data into frequency domain andthen identifying the dominant frequency corresponding to a step [52]. The main challenges of stepdetection are variations in phone poses and walking modes, which may lead to a large detectionerror if not properly considered.
After detecting steps, different models can be used to compute the step length. Because of theinherent smartphone sensor noise, double integration of the acceleration measurements results ininaccurate estimates of step length. Weinberg [170] proposed a step length estimation approachbased on the maximum vertical displacement of the hip. Kim et al. [74] also introduced a similarmodel that uses the acceleration samples to estimate the step length. The disadvantage of theseacceleration-based models is that they do not consider different phone poses and varying walk-ing speeds, which have an important effect on the accuracy of step length estimation. A linearmodel that considers walking speeds was used in Reference [139], but it requires users’ heightinformation, which may limit its applicability, since some users may not be comfortable provid-ing their individual information. An adaptive step model is proposed in Reference [86], whichuses a personalization algorithm to learn a personal model from a generic step model. However,this personalization process is based on spatial constraints from a floor plan, which may not al-ways be available. In Reference [23], a neural-network-based method is introduced, which consid-ers walking frequency, variance of the accelerometer signals, and the ground inclination. However,it is based on the shoe-mounted accelerometer and hence is unsuitable for smartphone-based ap-plications. In addition, the step length can be estimated by combining step counting with spatialinformation such as landmarks or floor plans [147, 165]. Although these methods eliminate the re-quirement of users’ height information and are independent of phone poses, they assume that theuser walks at a consistent speed, which may not always be a valid assumption. A deep-learning-based step length estimation method is presented in Reference [50], which considers differentphone poses, varying walking speeds, and different users.
Another important component of PDR is heading estimation, which is usually based on thecompass [95] or the gyroscope [165]. The compass measures the angle with respect to the Earth’smagnetic north, while the gyroscope reports the angular velocity. However, the compass is vulner-able to ferromagnetic materials (e.g., metals) and the gyroscope readings drift over time. To tacklethese problems, some researchers have suggested combining with different sensors or spatial in-formation. A combination of the compass readings and gyroscope readings by using the Kalmanfilter is presented in Reference [147]. WalkCompass fuses the gyroscope readings with the com-pass readings and the accelerometer readings [141]. WiDir uses WiFi signals to estimate a human’swalking direction [177]. Zee infers the heading by using a particle filter to fuse the compass read-ings with a floor plan [133]. In UnLoc [165], the drift problem of gyroscope readings is addressedwith landmarks. A landmark graph is used to assist in achieving accurate heading estimation inReference [45].
Overall, PDR is a self-localization technique that has become one of the mainstream indoorlocalization methods. The advantages of PDR are that it needs no extra infrastructure and hasno coverage limitation. This makes it especially applicable to locate and navigate in the WiFi-deprived areas. However, it suffers from the accumulated error problem, leading to the degradationof accuracy over time. Thus, it needs to be corrected periodically, which can be done by using otherlocalization methods or using spatial information such as maps and landmarks.
ACM Computing Surveys, Vol. 52, No. 3, Article 64. Publication date: July 2019.
Indoor Localization Improved by Spatial Context—A Survey 64:9
2.5 Hybrid Localization
Different localization techniques have various advantages and limitations in terms of accuracy,coverage, requirement for infrastructure, and cost of deployment, and no single localizationmethod can meet the demands of all applications. The key to implementing a practical localizationsystem is fusing different localization signals such that they can complement each other [149]. Themethod integrating multiple localization signals is called hybrid localization. The most commonhybrid localization methods include multimodal fingerprinting [152], triangulation-based fusion
[17], and PDR-based fusion [18].Multimodal fingerprinting is similar to WiFi fingerprinting, but it uses signals from multiple
sources. The commonly used multimodal fingerprinting combines WiFi fingerprints and magneticfingerprints [7]. Generally, WiFi fingerprinting is able to provide a global location accuracy, butits accuracy is relatively low. On the contrary, magnetic fingerprinting can achieve a higher ac-curacy, yet it works only locally. The combination of WiFi fingerprints and magnetic fingerprintscan compensate the drawbacks of the two methods, achieving a high accuracy. Another popularimplementation of multimodal fingerprinting is integrating WiFi with other opportunistic signalssuch as FM, GSM, and DTV, which exist in the environment but are not specially created for local-ization purposes [124]. Apart from the above combinations, ambient features such as color, light,and sound can also be regarded as fingerprints. The advantage of multimodal fingerprinting is thatit can achieve a higher localization accuracy than using single fingerprinting without needing ex-tra infrastructure. Nevertheless, the construction of the fingerprint database is labor-intensive andtime-consuming. Although many efforts have been made to accelerate the site survey process offingerprinting, most of them rely heavily on fine-grained maps or active user participation.
Triangulation-based fusion improves the localization accuracy by integrating multiple typesof measurements, such as RSS, TOA, TDOA, and AOA. In complex indoor environments, usingone single type of measurement is insufficient to obtain a satisfactory accuracy due to the non-line-of-sight propagation of signals, but fusing multiple kinds of measurements can overcome thisissue to some extent. Typical fusion methods are least squares (LS) [164], Bayes filters [168], max-imum likelihood [17], and Taylor series [79]. The main drawback of triangulation-based fusion isits requirement for two or more types of hardware, which increases the cost of deployment andmaintenance.
PDR-based fusion combines PDR with wireless localization methods, which is widely used inthe literature. PDR is a self-localization technique that provides continuous relative location esti-mation, but it suffers from the drift problem, resulting in unsuitability for long-term localization.By contrast, wireless localization gives absolute location but fails to achieve continuous locationestimation when there are not enough access points or beacons in the environment. Fusing PDRwith wireless localization addresses both the drift problem of PDR and the failure of wireless local-ization methods for continuous localization (tracking). This fusion is usually implemented usingBayes techniques such as Kalman filter [21] or extended Kalman filter [30], particle filter [64], andhidden Markov model [95]. The main challenge of PDR-based fusion is the accurate heading esti-mation of the user, which is especially difficult when the user carries their device in an arbitrarypose.
Fusion of visual observations taken from a single or multiple cameras with inertial measure-ments can also be categorized as PDR-based localization [69, 135]. Since localization only by vi-sual observations can be compromised in low-textured environments due to insufficient geometricfeatures, inertial measurements such as the outputs of accelerometers and gyroscopes can comple-ment visual observations, resulting in a seamless localization. The integration of visual observa-tions with inertial measurements is known as visual-inertial odometry (VIO) [89]. State-of-the-art
ACM Computing Surveys, Vol. 52, No. 3, Article 64. Publication date: July 2019.
64:10 F. Gu et al.
VIOs exploit different types of cameras such as perspective, which have a limited field-of-view(FoV) and follow the standard perspective projection model in mono mode [84, 89, 136] or stereomode [136, 158]; rolling-shutter [88, 90], in which images are stored row by row, typically with aconstant delay; and omnidirectional cameras [137, 138], which have a FoV wider than 180◦ utiliz-ing the maximum potential of surrounding visual observations. From an estimation point of view,VIO techniques mostly use either non-linear optimization [84], which minimizes a least-squareserror function iteratively [76], or a recursive algorithm, which estimates motion parameters re-cursively in a filter as visual and inertial measurements become available. Although localizationby using visual observations decreases the drift over time to a considerable extent and providesfully seamless localization, the VIO approach still suffers from drift over long trajectories.
2.6 Summary and Discussion
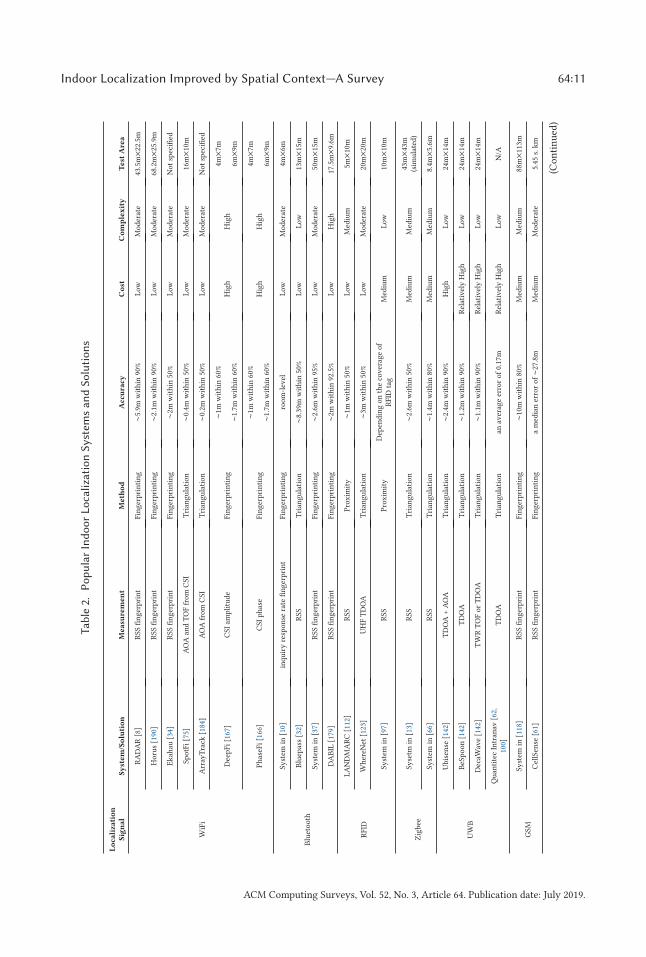
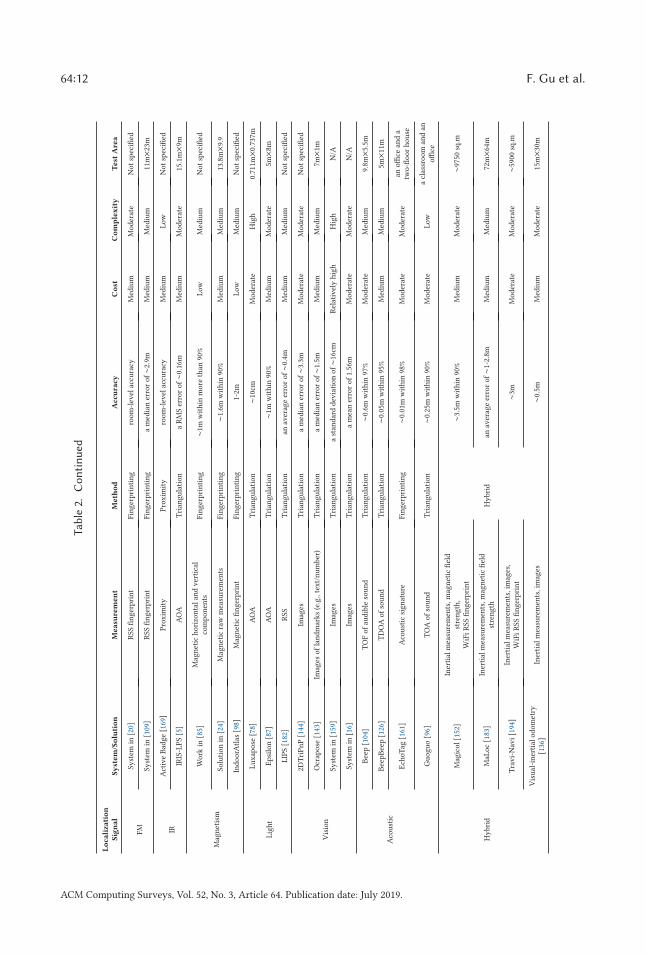
Table 2 gives a summary of popular indoor localization systems and solutions. It presents the usedlocalization signal, reference, measurement, method, accuracy, cost, complexity, and test area. Notethat the test area is provided to avoid prejudice on the performance of different technologies thatare affected by the test environments.
Overall, proximity methods are very simple and easy to deploy, but their localization accuracyof proximity methods depends on the number of anchor devices (e.g., POS terminals, RFID readers)that sense the tags. The coverage and applicability of proximity approaches are poor, since theseanchor devices are usually installed at certain areas, making it difficult to scale up proximity-basedsystems.
Triangulation methods have a much larger coverage and usually achieve a higher localizationaccuracy than proximity methods. For example, triangulation using UWB or light signals can gen-erally achieve centimeter-level accuracy. However, triangulation methods using wireless signalsalso suffer from varying limitations, such as multipath interference and shadowing, time synchro-nization, and requirement for specific hardware. Triangulation using vision does not have theabove limitations and can achieve a high accuracy by making use of visual features from the envi-ronment. However, it is affected by light conditions, resolution of camera, and richness of texturein the environment. Also, camera-based methods are intrusive towards people’s privacy, whichmay prohibit their application in some scenarios.
Fingerprinting is one of the commonly used indoor localization methods because of its abilityto make use of existing infrastructure (e.g., WiFi APs) or indoor signatures (e.g., magnetism, visualfeatures of objects). The main challenge is the construction of a fingerprint database, which can becost-prohibitive for large-scale environments if it is done manually. Many efforts have been madeto reduce the time and effort of constructing the fingerprint database, such as SLAM methods andcrowdsourcing methods. Nevertheless, these methods of fast fingerprint database construction areusually computationally expensive or cannot obtain accurate results.
DR is a self-localization method that can provide continuous location estimates given an initiallocalization. However, it cannot be used for long-term localization and tracking tasks because ofits accumulated error problem. Specifically, DR is affected by different user motion states, deviceposes, device heterogeneity, and ferromagnetic disturbance (affecting the heading estimation usingthe compass). To overcome these challenges, DR is often combined with other localization methodsor spatial information.
Hybrid localization combines multiple localization signals to improve localization accuracy orexpand localization coverage. It can somehow overcome the limitations of single individual local-ization signal. However, multiple localization signals may not exit in the environment of interest.Also, it is challenging to decide which localization signal should be used in different areas or tofuse these localization signals in an efficient way.
ACM Computing Surveys, Vol. 52, No. 3, Article 64. Publication date: July 2019.
Indoor Localization Improved by Spatial Context—A Survey 64:11Tab
le2.
Pop
ula
rIn
do
or
Lo
cali
zati
on
Sy
stem
san
dS
olu
tion
s
Lo
cali
zati
on
Sig
na
lS
yst
em
/So
luti
on
Mea
sure
men
tM
eth
od
Acc
ura
cyC
ost
Co
mp
lex
ity
Test
Are
a
WiF
i
RA
DA
R[8
]R
SSfi
nger
pri
nt
Fin
ger
pri
nti
ng
∼5.9
mw
ith
in90
%L
ow
Mo
der
ate
43.5
m×2
2.5m
Ho
rus
[190
]R
SSfi
nger
pri
nt
Fin
ger
pri
nti
ng
∼2.1
mw
ith
in90
%L
ow
Mo
der
ate
68.2
m×2
5.9m
Ek
ahau
[34]
RSS
fin
ger
pri
nt
Fin
ger
pri
nti
ng
∼2m
wit
hin
50%
Low
Mo
der
ate
No
tsp
ecifi
ed
Spo
tFi
[75]
AO
Aan
dT
OF
fro
mC
SIT
rian
gu
lati
on
∼0.4
mw
ith
in50
%L
ow
Mo
der
ate
16m×1
0m
Arr
ayT
rack
[184
]A
OA
fro
mC
SIT
rian
gu
lati
on
∼0.2
mw
ith
in50
%L
ow
Mo
der
ate
No
tsp
ecifi
ed
Dee
pFi
[167
]C
SIam
pli
tud
eFi
ng
erp
rin
tin
g∼1
mw
ith
in60
%H
igh
Hig
h4m×7
m
∼1.7
mw
ith
in60
%6m×9
m
Ph
aseF
i[1
66]
CSI
ph
ase
Fin
ger
pri
nti
ng
∼1m
wit
hin
60%
Hig
hH
igh
4m×7
m
∼1.7
mw
ith
in60
%6m×9
m
Blu
eto
oth
Syst
emin
[10]
inq
uir
yre
spo
nse
rate
fin
ger
pri
nt
Fin
ger
pri
nti
ng
roo
m-l
evel
Low
Mo
der
ate
4m×6
m
Blu
epas
s[3
2]R
SST
rian
gu
lati
on
∼8.3
9mw
ith
in50
%L
ow
Low
13m×1
5m
Syst
emin
[37]
RSS
fin
ger
pri
nt
Fin
ger
pri
nti
ng
∼2.6
mw
ith
in95
%L
ow
Mo
der
ate
50m×1
5m
DA
BIL
[179
]R
SSfi
nger
pri
nt
Fin
ger
pri
nti
ng
∼2m
wit
hin
92.5
%L
ow
Hig
h17
.5m×9
.6m
RFI
D
LA
ND
MA
RC
[112
]R
SSP
roxim
ity
∼1m
wit
hin
50%
Low
Med
ium
5m×1
0m
Wh
ereN
et[1
23]
UH
FT
DO
AT
rian
gu
lati
on
∼3m
wit
hin
50%
Low
Mo
der
ate
20m×2
0m
Syst
emin
[97]
RSS
Pro
xim
ity
Dep
end
ing
on
the
cover
age
of
RFI
Dta
gM
ediu
mL
ow
10m×1
0m
Zig
bee
Syse
tmin
[13]
RSS
Tri
ang
ula
tio
n∼2
.6m
wit
hin
50%
Med
ium
Med
ium
43m×4
3m(s
imu
late
d)
Syst
emin
[66]
RSS
Tri
ang
ula
tio
n∼1
.4m
wit
hin
80%
Med
ium
Med
ium
8.4m×5
.6m
UW
B
Ubis
ense
[142
]T
DO
A+
AO
AT
rian
gu
lati
on
∼2.4
mw
ith
in90
%H
igh
Low
24m×1
4m
BeS
po
on
[142
]T
DO
AT
rian
gu
lati
on
∼1.2
mw
ith
in90
%R
elat
ivel
yH
igh
Low
24m×1
4m
Dec
aWav
e[1
42]
TW
RT
OF
or
TD
OA
Tri
angu
lati
on
∼1.1
mw
ith
in90
%R
elat
ivel
yH
igh
Low
24m×1
4m
Qu
anti
tec
Intr
anav
[62,
100]
TD
OA
Tri
ang
ula
tio
nan
aver
age
erro
ro
f0.
17m
Rel
ativ
ely
Hig
hL
ow
N/A
GSM
Syst
emin
[118
]R
SSfi
nger
pri
nt
Fin
ger
pri
nti
ng
∼10m
wit
hin
80%
Med
ium
Med
ium
88m×1
13m
Cel
lSen
se[6
1]R
SSfi
ng
erp
rin
tFi
ng
erp
rin
tin
ga
med
ian
erro
ro
f∼2
7.8m
Med
ium
Mo
der
ate
5.45
s.k
m
(Co
nti
nu
ed)
ACM Computing Surveys, Vol. 52, No. 3, Article 64. Publication date: July 2019.
64:12 F. Gu et al.Tab
le2.
Con
tin
ued
Lo
cali
zati
on
Sig
na
lS
yst
em
/So
luti
on
Mea
sure
men
tM
eth
od
Acc
ura
cyC
ost
Co
mp
lex
ity
Test
Are
a
FMSy
stem
in[2
0]R
SSfi
nger
pri
nt
Fin
ger
pri
nti
ng
roo
m-l
evel
accu
racy
Med
ium
Mo
der
ate
No
tsp
ecifi
ed
Syst
emin
[109
]R
SSfi
ng
erp
rin
tFi
ng
erp
rin
tin
ga
med
ian
erro
ro
f∼2
.9m
Med
ium
Med
ium
11m×2
3m
IRA
ctiv
eB
adg
e[1
69]
Pro
xim
ity
Pro
xim
ity
roo
m-l
evel
accu
racy
Med
ium
Low
No
tsp
ecifi
ed
IRIS
-LP
S[5
]A
OA
Tri
ang
ula
tio
na
RM
Ser
ror
of∼0
.16m
Med
ium
Mo
der
ate
15.1
m×9
m
Mag
net
ism
Wo
rkin
[85]
Mag
net
ich
ori
zon
tal
and
ver
tica
lco
mp
on
ents
Fin
ger
pri
nti
ng
∼1m
wit
hin
mo
reth
an90
%L
ow
Med
ium
No
tsp
ecifi
ed
Solu
tio
nin
[24]
Mag
net
icra
wm
easu
rem
ents
Fin
ger
pri
nti
ng
∼1.6
mw
ith
in90
%M
ediu
mM
ediu
m13
.8m×9
.9
Ind
oo
rAtl
as[9
8]M
agn
etic
fin
ger
pri
nt
Fin
ger
pri
nti
ng
1-2m
Low
Med
ium
No
tsp
ecifi
ed
Lig
ht
Lu
xap
ose
[78]
AO
AT
rian
gu
lati
on
∼10c
mM
od
erat
eH
igh
0.71
1m×0
.737
m
Ep
silo
n[8
7]A
OA
Tri
ang
ula
tio
n∼1
mw
ith
in90
%M
ediu
mM
od
erat
e5m×8
m
LIP
S[1
82]
RSS
Tri
ang
ula
tio
nan
aver
age
erro
ro
f∼0
.4m
Med
ium
Med
ium
No
tsp
ecifi
ed
Vis
ion
2DT
riP
nP
[144
]Im
ages
Tri
ang
ula
tio
na
med
ian
erro
ro
f∼3
.3m
Mo
der
ate
Mo
der
ate
No
tsp
ecifi
ed
Ocr
apo
se[1
43]
Imag
eso
fla
nd
mar
ks
(e.g
.,te
xt/
nu
mb
er)
Tri
ang
ula
tio
na
med
ian
erro
ro
f∼1
.5m
Med
ium
Med
ium
7m×1
m
Syst
emin
[159
]Im
ages
Tri
ang
ula
tio
na
stan
dar
dd
evia
tio
no
f∼1
6cm
Rel
ativ
ely
hig
hH
igh
N/A
Syst
emin
[16]
Imag
esT
rian
gu
lati
on
am
ean
erro
ro
f1.
56m
Mo
der
ate
Mo
der
ate
N/A
Aco
ust
ic
Bee
p[1
04]
TO
Fo
fau
dib
leso
un
dT
rian
gu
lati
on
∼0.6
mw
ith
in97
%M
od
erat
eM
ediu
m9.
8m×5
.5m
Bee
pB
eep
[126
]T
DO
Ao
fso
un
dT
rian
gu
lati
on
∼0.0
5mw
ith
in95
%M
ediu
mM
ediu
m5m×1
1m
Ech
oTag
[161
]A
cou
stic
sig
nat
ure
Fin
ger
pri
nti
ng
∼0.0
1mw
ith
in98
%M
od
erat
eM
od
erat
ean
offi
cean
da
two
-flo
or
ho
use
Gu
og
uo
[96]
TO
Ao
fso
un
dT
rian
gu
lati
on
∼0.2
5mw
ith
in90
%M
od
erat
eL
ow
acl
assr
oo
man
dan
offi
ce
Hy
bri
d
Mag
ico
l[1
52]
Iner
tial
mea
sure
men
ts,m
agn
etic
fiel
dst
ren
gth
,W
iFi
RSS
fin
ger
pri
nt
Hy
bri
d
∼3.5
mw
ith
in90
%M
ediu
mM
od
erat
e∼9
750
sq.m
MaL
oc
[183
]In
erti
alm
easu
rem
ents
,mag
net
icfi
eld
stre
ng
than
aver
age
erro
ro
f∼1
-2.8
mM
ediu
mM
ediu
m72
m×6
4m
Tra
vi-
Nav
i[1
94]
Iner
tial
mea
sure
men
ts,i
mag
es,
WiF
iR
SSfi
nger
pri
nt
∼3m
Mo
der
ate
Mo
der
ate
∼590
0sq
.m
Vis
ual
-in
erti
alo
do
met
ry[1
36]
Iner
tial
mea
sure
men
ts,i
mag
es∼0
.5m
Med
ium
Mo
der
ate
15m×3
0m
ACM Computing Surveys, Vol. 52, No. 3, Article 64. Publication date: July 2019.
Indoor Localization Improved by Spatial Context—A Survey 64:13
3 LOCALIZATION IMPROVEMENT BY SPATIAL CONSTRAINTS
While hybrid localization methods are successful in improving localization accuracy, they usuallyrequire additional hardware or infrastructure such as WiFi APs and Bluetooth beacons. However,spatial context, which is available or easy to obtain in many situations, can be used to improve thelocalization accuracy to alleviate the need for extra hardware or infrastructure. Dey [31] definedcontext as any information that can be used to characterize the situation of an entity (e.g., a person
or object). In this study, we consider spatial context as spatial information that imposes constraintson the entity’s location or characterizes a certain area. Three types of context are taken into ac-count in this article, namely maps, spatial models, and landmarks. Maps and spatial models imposespatial constraints on the entity’s reachability, which can be utilized to refine coarse location es-timates. Landmarks represent a unique area in spatial space, which can be used to correct thelocalization error. In this section, we introduce the localization improvement methods providedby spatial constraints, including map matching and spatial-model-based methods.
3.1 Map Matching
In the context of indoor localization, map matching can be categorized into three types: point-to-
point matching, trajectory matching, and probabilistic graphical model. A map describes the layoutand elements of an indoor environment. It is often in the form of a floor plan. Point-to-pointmethod matches location points with the places of indoor spaces according to floor plans. Point-to-point matching is advantageous for its simplicity and high computational efficiency, but it issensitive to the way in which the path network is digitized [172].
Trajectory matching utilizes the geometry and topology information of indoor structures (e.g.,corners, corridors, and rooms) to match the obtained trajectory. A geometric-similarity-based tra-jectory matching method is applied to correct the drift error of the gyroscope in Reference [81],which is implemented by comparing the user’s trajectory and the floor plan. Park et al. [122] pro-posed a method to compare the sequence of user motion states (standing still, walking straight,turning right, etc.) with a prior map, which can calculate the location of the user at an averageaccuracy of 5m. Ma et al. [102] developed a trajectory matching algorithm to automatically de-termine the absolute locations of a trajectory estimated by PDR methods. Specifically, they matchthe PDR trajectory with most-possible trajectories derived from a floor plan by using image pro-cessing methods. These most-possible trajectories are derived based on the movement patternsof pedestrians in the environment. Instead of matching users’ trajectories with trajectories de-rived from floor plans, Abdelbar et al. [1] presented a method to improve the cellular positioningtechniques by matching the low-accuracy motion trajectory computed from them to one of high-accuracy anonymous building-tracked trajectories. Compared to point-to-point matching, trajec-tory matching is more robust and has smaller matching error, but it is more complex and has poorreal-time capability.
Localization methods based on probabilistic graphical models determine the location by associ-ating each location with a probability and then updating the probability using spatial constraints.The most widely used probabilistic graphical models in localization are conditional random fields(CRF) [11, 180] and Bayesian techniques, such as particle filters [176, 191] and hidden Markovmodels (HMMs) [103, 178]. Bayesian techniques represent the conditional dependence structurebetween observation and state variables using directed graphical models, while CRF models theproblem using undirected graphical models. Take the particle filter as an example to illustrate therationale behind Bayesian approaches. Particle filters use a set of particles to approximate the dis-tribution. In each round, particles propagate according to the transition model (e.g., PDR), andtheir weight would be updated based on observations and spatial constraints. For instance, if a
ACM Computing Surveys, Vol. 52, No. 3, Article 64. Publication date: July 2019.
64:14 F. Gu et al.
Fig. 5. The grid model of an indoor environment [3].
particle crosses a wall or lies in non-navigable areas, then the weight of this particle would beset to 0. The final step is to resample these particles according to their weight and those whoseweight value is below a threshold are removed. Over time, the particles typically converge to themost likely position of the user. Bayesian approaches can achieve higher accuracy than point-to-point matching and trajectory matching, but the computational burden is also heavy. To overcomethis issue, Xiao et al. [180] proposed a lightweight algorithm based on CRFs, fusing multiple obser-vations (e.g., dead-reckoning and radio frequency) and constraints (e.g., floor plans, fingerprints,and landmarks). Experiments by Xiao et al. have showed that CRFs have higher computationalefficiency than the Bayesian techniques.
3.2 Spatial Model-based Methods
Spatial models are another type of spatial information that can be used to improve localization ac-curacy. Compared with floor plans, which usually include information about basic structures (e.g.,rooms, doors, and furniture), spatial models contain richer information (e.g., sensors, people). Thisextra information that is not described in the floor plans is also useful in improving localization ac-curacy [4]. In this section, we introduce spatial-model-based used in indoor localization, includinggrid models [91, 148] and graph models [80].
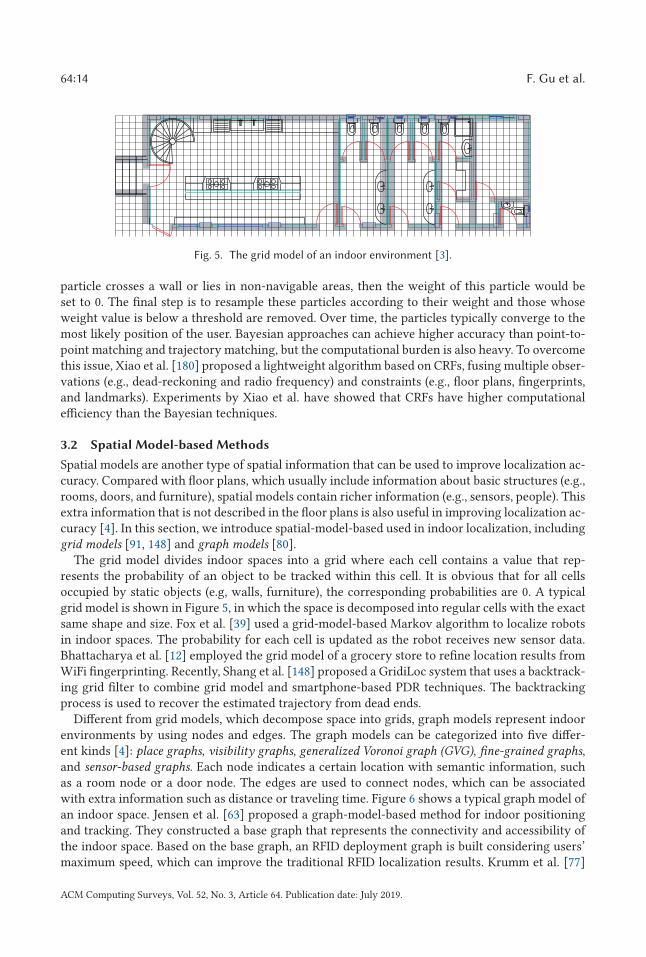
The grid model divides indoor spaces into a grid where each cell contains a value that rep-resents the probability of an object to be tracked within this cell. It is obvious that for all cellsoccupied by static objects (e.g, walls, furniture), the corresponding probabilities are 0. A typicalgrid model is shown in Figure 5, in which the space is decomposed into regular cells with the exactsame shape and size. Fox et al. [39] used a grid-model-based Markov algorithm to localize robotsin indoor spaces. The probability for each cell is updated as the robot receives new sensor data.Bhattacharya et al. [12] employed the grid model of a grocery store to refine location results fromWiFi fingerprinting. Recently, Shang et al. [148] proposed a GridiLoc system that uses a backtrack-ing grid filter to combine grid model and smartphone-based PDR techniques. The backtrackingprocess is used to recover the estimated trajectory from dead ends.
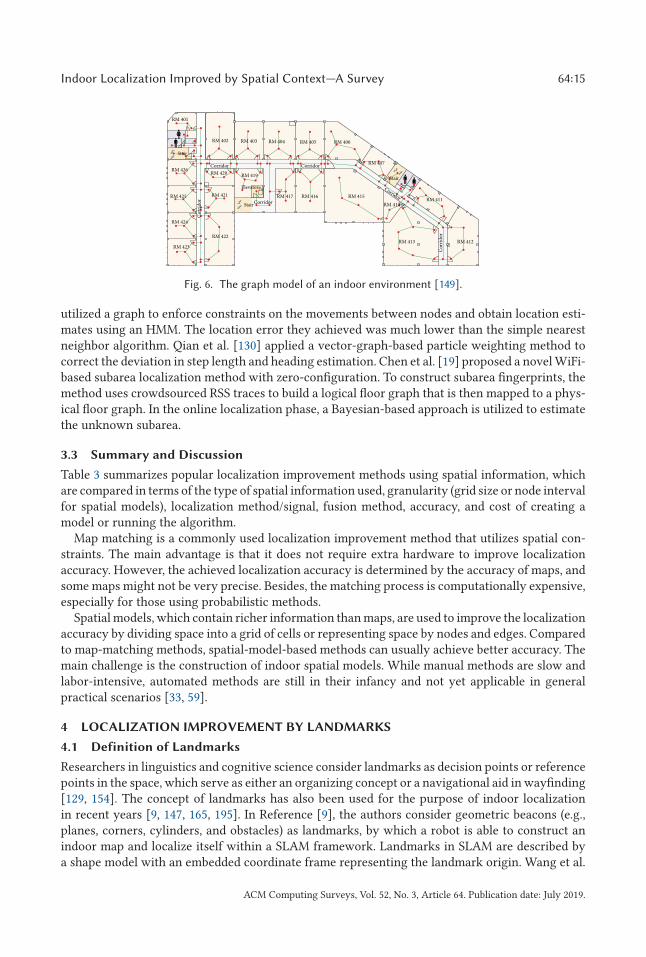
Different from grid models, which decompose space into grids, graph models represent indoorenvironments by using nodes and edges. The graph models can be categorized into five differ-ent kinds [4]: place graphs, visibility graphs, generalized Voronoi graph (GVG), fine-grained graphs,and sensor-based graphs. Each node indicates a certain location with semantic information, suchas a room node or a door node. The edges are used to connect nodes, which can be associatedwith extra information such as distance or traveling time. Figure 6 shows a typical graph model ofan indoor space. Jensen et al. [63] proposed a graph-model-based method for indoor positioningand tracking. They constructed a base graph that represents the connectivity and accessibility ofthe indoor space. Based on the base graph, an RFID deployment graph is built considering users’maximum speed, which can improve the traditional RFID localization results. Krumm et al. [77]
ACM Computing Surveys, Vol. 52, No. 3, Article 64. Publication date: July 2019.
Indoor Localization Improved by Spatial Context—A Survey 64:15
Fig. 6. The graph model of an indoor environment [149].
utilized a graph to enforce constraints on the movements between nodes and obtain location esti-mates using an HMM. The location error they achieved was much lower than the simple nearestneighbor algorithm. Qian et al. [130] applied a vector-graph-based particle weighting method tocorrect the deviation in step length and heading estimation. Chen et al. [19] proposed a novel WiFi-based subarea localization method with zero-configuration. To construct subarea fingerprints, themethod uses crowdsourced RSS traces to build a logical floor graph that is then mapped to a phys-ical floor graph. In the online localization phase, a Bayesian-based approach is utilized to estimatethe unknown subarea.
3.3 Summary and Discussion
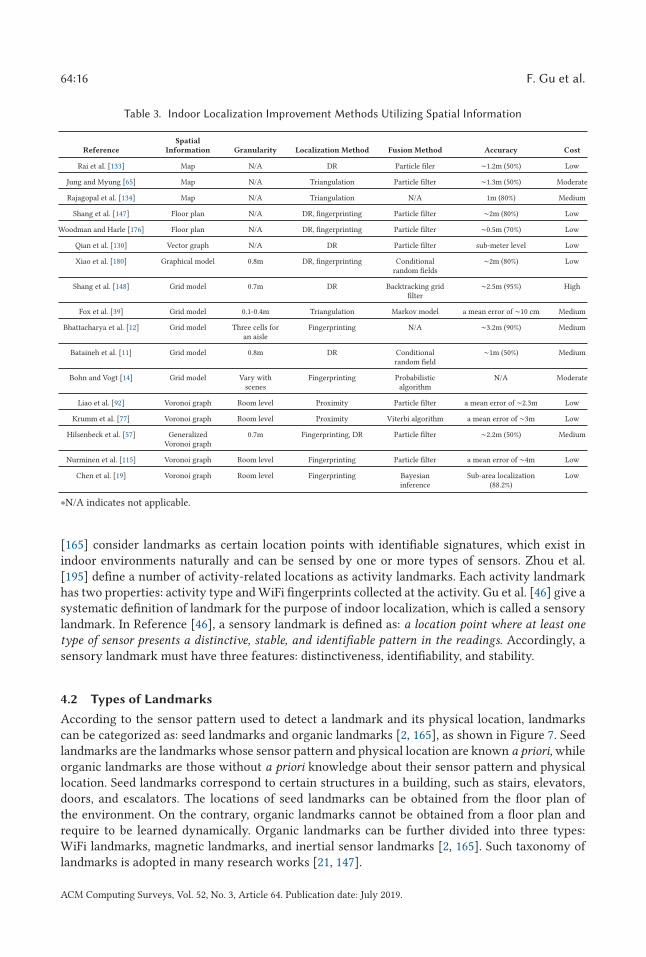
Table 3 summarizes popular localization improvement methods using spatial information, whichare compared in terms of the type of spatial information used, granularity (grid size or node intervalfor spatial models), localization method/signal, fusion method, accuracy, and cost of creating amodel or running the algorithm.
Map matching is a commonly used localization improvement method that utilizes spatial con-straints. The main advantage is that it does not require extra hardware to improve localizationaccuracy. However, the achieved localization accuracy is determined by the accuracy of maps, andsome maps might not be very precise. Besides, the matching process is computationally expensive,especially for those using probabilistic methods.
Spatial models, which contain richer information than maps, are used to improve the localizationaccuracy by dividing space into a grid of cells or representing space by nodes and edges. Comparedto map-matching methods, spatial-model-based methods can usually achieve better accuracy. Themain challenge is the construction of indoor spatial models. While manual methods are slow andlabor-intensive, automated methods are still in their infancy and not yet applicable in generalpractical scenarios [33, 59].
4 LOCALIZATION IMPROVEMENT BY LANDMARKS
4.1 Definition of Landmarks
Researchers in linguistics and cognitive science consider landmarks as decision points or referencepoints in the space, which serve as either an organizing concept or a navigational aid in wayfinding[129, 154]. The concept of landmarks has also been used for the purpose of indoor localizationin recent years [9, 147, 165, 195]. In Reference [9], the authors consider geometric beacons (e.g.,planes, corners, cylinders, and obstacles) as landmarks, by which a robot is able to construct anindoor map and localize itself within a SLAM framework. Landmarks in SLAM are described bya shape model with an embedded coordinate frame representing the landmark origin. Wang et al.
ACM Computing Surveys, Vol. 52, No. 3, Article 64. Publication date: July 2019.
64:16 F. Gu et al.
Table 3. Indoor Localization Improvement Methods Utilizing Spatial Information
ReferenceSpatial
Information Granularity Localization Method Fusion Method Accuracy Cost
Rai et al. [133] Map N/A DR Particle filer ∼1.2m (50%) Low
Jung and Myung [65] Map N/A Triangulation Particle filter ∼1.3m (50%) Moderate
Rajagopal et al. [134] Map N/A Triangulation N/A 1m (80%) Medium
Shang et al. [147] Floor plan N/A DR, fingerprinting Particle filter ∼2m (80%) Low
Woodman and Harle [176] Floor plan N/A DR, fingerprinting Particle filter ∼0.5m (70%) Low
Qian et al. [130] Vector graph N/A DR Particle filter sub-meter level Low
Xiao et al. [180] Graphical model 0.8m DR, fingerprinting Conditionalrandom fields
∼2m (80%) Low
Shang et al. [148] Grid model 0.7m DR Backtracking gridfilter
∼2.5m (95%) High
Fox et al. [39] Grid model 0.1-0.4m Triangulation Markov model a mean error of ∼10 cm Medium
Bhattacharya et al. [12] Grid model Three cells foran aisle
Fingerprinting N/A ∼3.2m (90%) Medium
Bataineh et al. [11] Grid model 0.8m DR Conditionalrandom field
∼1m (50%) Medium
Bohn and Vogt [14] Grid model Vary withscenes
Fingerprinting Probabilisticalgorithm
N/A Moderate
Liao et al. [92] Voronoi graph Room level Proximity Particle filter a mean error of ∼2.3m Low
Krumm et al. [77] Voronoi graph Room level Proximity Viterbi algorithm a mean error of ∼3m Low
Hilsenbeck et al. [57] GeneralizedVoronoi graph
0.7m Fingerprinting, DR Particle filter ∼2.2m (50%) Medium
Nurminen et al. [115] Voronoi graph Room level Fingerprinting Particle filter a mean error of ∼4m Low
Chen et al. [19] Voronoi graph Room level Fingerprinting Bayesianinference
Sub-area localization(88.2%)
Low
∗N/A indicates not applicable.
[165] consider landmarks as certain location points with identifiable signatures, which exist inindoor environments naturally and can be sensed by one or more types of sensors. Zhou et al.[195] define a number of activity-related locations as activity landmarks. Each activity landmarkhas two properties: activity type and WiFi fingerprints collected at the activity. Gu et al. [46] give asystematic definition of landmark for the purpose of indoor localization, which is called a sensorylandmark. In Reference [46], a sensory landmark is defined as: a location point where at least one
type of sensor presents a distinctive, stable, and identifiable pattern in the readings. Accordingly, asensory landmark must have three features: distinctiveness, identifiability, and stability.
4.2 Types of Landmarks
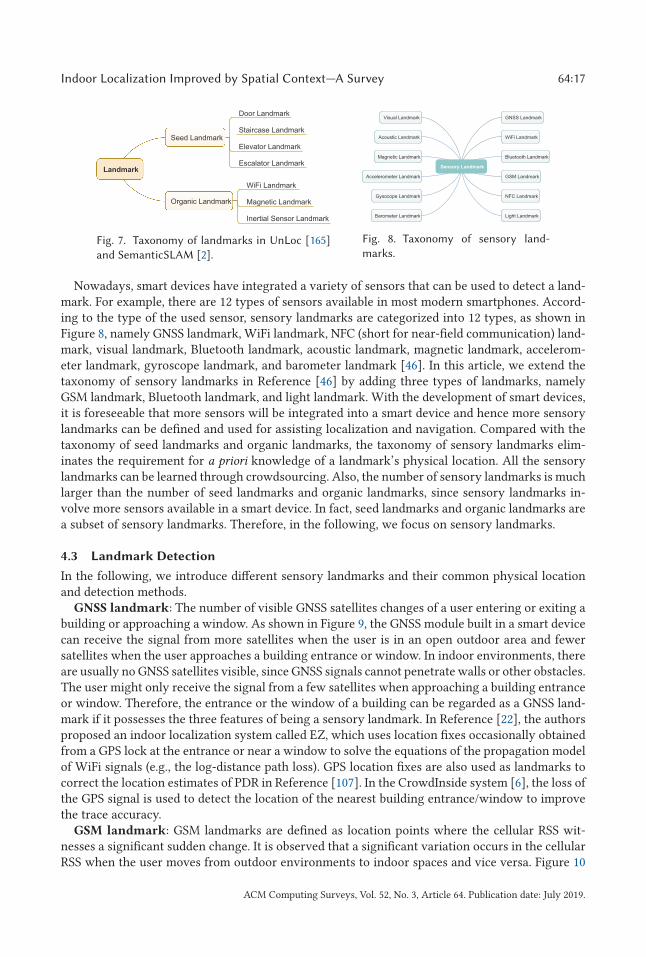
According to the sensor pattern used to detect a landmark and its physical location, landmarkscan be categorized as: seed landmarks and organic landmarks [2, 165], as shown in Figure 7. Seedlandmarks are the landmarks whose sensor pattern and physical location are known a priori, whileorganic landmarks are those without a priori knowledge about their sensor pattern and physicallocation. Seed landmarks correspond to certain structures in a building, such as stairs, elevators,doors, and escalators. The locations of seed landmarks can be obtained from the floor plan ofthe environment. On the contrary, organic landmarks cannot be obtained from a floor plan andrequire to be learned dynamically. Organic landmarks can be further divided into three types:WiFi landmarks, magnetic landmarks, and inertial sensor landmarks [2, 165]. Such taxonomy oflandmarks is adopted in many research works [21, 147].
ACM Computing Surveys, Vol. 52, No. 3, Article 64. Publication date: July 2019.
Indoor Localization Improved by Spatial Context—A Survey 64:17
Fig. 7. Taxonomy of landmarks in UnLoc [165]
and SemanticSLAM [2].
Fig. 8. Taxonomy of sensory land-
marks.
Nowadays, smart devices have integrated a variety of sensors that can be used to detect a land-mark. For example, there are 12 types of sensors available in most modern smartphones. Accord-ing to the type of the used sensor, sensory landmarks are categorized into 12 types, as shown inFigure 8, namely GNSS landmark, WiFi landmark, NFC (short for near-field communication) land-mark, visual landmark, Bluetooth landmark, acoustic landmark, magnetic landmark, accelerom-eter landmark, gyroscope landmark, and barometer landmark [46]. In this article, we extend thetaxonomy of sensory landmarks in Reference [46] by adding three types of landmarks, namelyGSM landmark, Bluetooth landmark, and light landmark. With the development of smart devices,it is foreseeable that more sensors will be integrated into a smart device and hence more sensorylandmarks can be defined and used for assisting localization and navigation. Compared with thetaxonomy of seed landmarks and organic landmarks, the taxonomy of sensory landmarks elim-inates the requirement for a priori knowledge of a landmark’s physical location. All the sensorylandmarks can be learned through crowdsourcing. Also, the number of sensory landmarks is muchlarger than the number of seed landmarks and organic landmarks, since sensory landmarks in-volve more sensors available in a smart device. In fact, seed landmarks and organic landmarks area subset of sensory landmarks. Therefore, in the following, we focus on sensory landmarks.
4.3 Landmark Detection
In the following, we introduce different sensory landmarks and their common physical locationand detection methods.
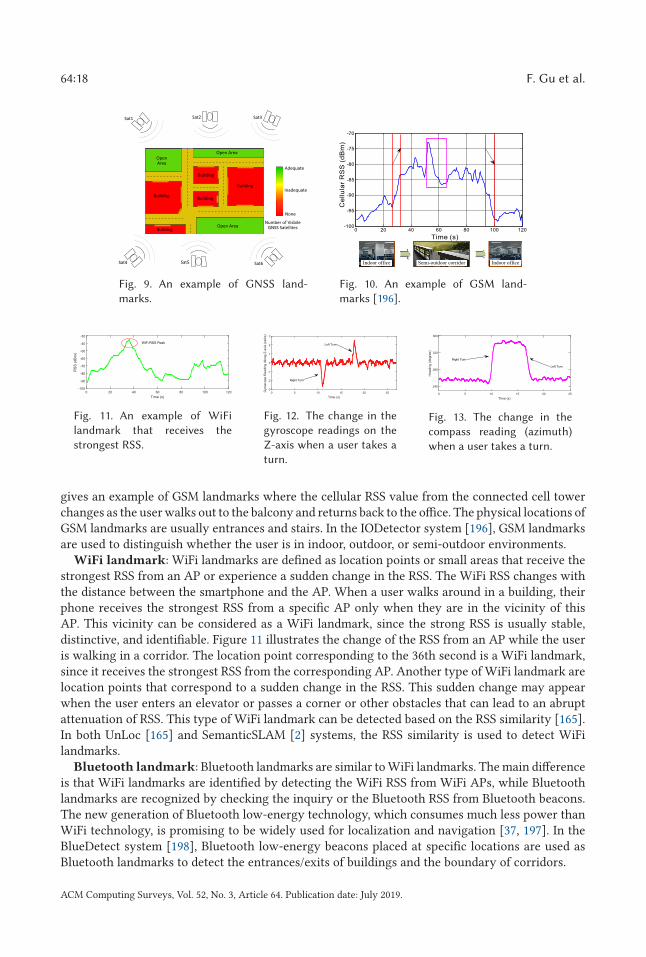
GNSS landmark: The number of visible GNSS satellites changes of a user entering or exiting abuilding or approaching a window. As shown in Figure 9, the GNSS module built in a smart devicecan receive the signal from more satellites when the user is in an open outdoor area and fewersatellites when the user approaches a building entrance or window. In indoor environments, thereare usually no GNSS satellites visible, since GNSS signals cannot penetrate walls or other obstacles.The user might only receive the signal from a few satellites when approaching a building entranceor window. Therefore, the entrance or the window of a building can be regarded as a GNSS land-mark if it possesses the three features of being a sensory landmark. In Reference [22], the authorsproposed an indoor localization system called EZ, which uses location fixes occasionally obtainedfrom a GPS lock at the entrance or near a window to solve the equations of the propagation modelof WiFi signals (e.g., the log-distance path loss). GPS location fixes are also used as landmarks tocorrect the location estimates of PDR in Reference [107]. In the CrowdInside system [6], the loss ofthe GPS signal is used to detect the location of the nearest building entrance/window to improvethe trace accuracy.
GSM landmark: GSM landmarks are defined as location points where the cellular RSS wit-nesses a significant sudden change. It is observed that a significant variation occurs in the cellularRSS when the user moves from outdoor environments to indoor spaces and vice versa. Figure 10
ACM Computing Surveys, Vol. 52, No. 3, Article 64. Publication date: July 2019.
64:18 F. Gu et al.
Fig. 9. An example of GNSS land-
marks.
Fig. 10. An example of GSM land-
marks [196].
Fig. 11. An example of WiFi
landmark that receives the
strongest RSS.
Fig. 12. The change in the
gyroscope readings on the
Z-axis when a user takes a
turn.
Fig. 13. The change in the
compass reading (azimuth)
when a user takes a turn.
gives an example of GSM landmarks where the cellular RSS value from the connected cell towerchanges as the user walks out to the balcony and returns back to the office. The physical locations ofGSM landmarks are usually entrances and stairs. In the IODetector system [196], GSM landmarksare used to distinguish whether the user is in indoor, outdoor, or semi-outdoor environments.
WiFi landmark: WiFi landmarks are defined as location points or small areas that receive thestrongest RSS from an AP or experience a sudden change in the RSS. The WiFi RSS changes withthe distance between the smartphone and the AP. When a user walks around in a building, theirphone receives the strongest RSS from a specific AP only when they are in the vicinity of thisAP. This vicinity can be considered as a WiFi landmark, since the strong RSS is usually stable,distinctive, and identifiable. Figure 11 illustrates the change of the RSS from an AP while the useris walking in a corridor. The location point corresponding to the 36th second is a WiFi landmark,since it receives the strongest RSS from the corresponding AP. Another type of WiFi landmark arelocation points that correspond to a sudden change in the RSS. This sudden change may appearwhen the user enters an elevator or passes a corner or other obstacles that can lead to an abruptattenuation of RSS. This type of WiFi landmark can be detected based on the RSS similarity [165].In both UnLoc [165] and SemanticSLAM [2] systems, the RSS similarity is used to detect WiFilandmarks.
Bluetooth landmark: Bluetooth landmarks are similar to WiFi landmarks. The main differenceis that WiFi landmarks are identified by detecting the WiFi RSS from WiFi APs, while Bluetoothlandmarks are recognized by checking the inquiry or the Bluetooth RSS from Bluetooth beacons.The new generation of Bluetooth low-energy technology, which consumes much less power thanWiFi technology, is promising to be widely used for localization and navigation [37, 197]. In theBlueDetect system [198], Bluetooth low-energy beacons placed at specific locations are used asBluetooth landmarks to detect the entrances/exits of buildings and the boundary of corridors.
ACM Computing Surveys, Vol. 52, No. 3, Article 64. Publication date: July 2019.
Indoor Localization Improved by Spatial Context—A Survey 64:19
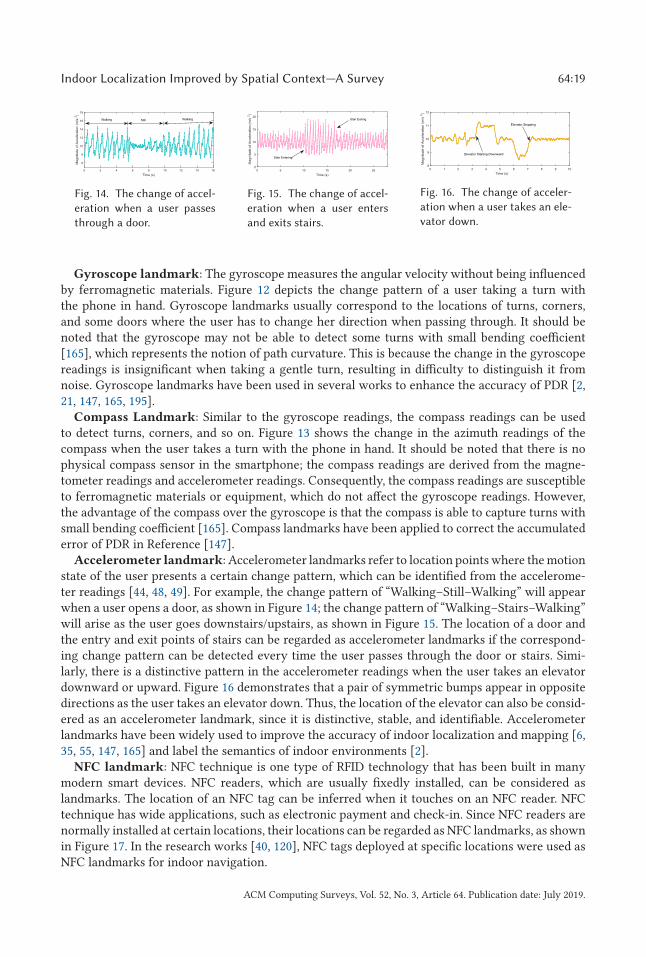
Fig. 14. The change of accel-
eration when a user passes
through a door.
Fig. 15. The change of accel-
eration when a user enters
and exits stairs.
Fig. 16. The change of acceler-
ation when a user takes an ele-
vator down.
Gyroscope landmark: The gyroscope measures the angular velocity without being influencedby ferromagnetic materials. Figure 12 depicts the change pattern of a user taking a turn withthe phone in hand. Gyroscope landmarks usually correspond to the locations of turns, corners,and some doors where the user has to change her direction when passing through. It should benoted that the gyroscope may not be able to detect some turns with small bending coefficient[165], which represents the notion of path curvature. This is because the change in the gyroscopereadings is insignificant when taking a gentle turn, resulting in difficulty to distinguish it fromnoise. Gyroscope landmarks have been used in several works to enhance the accuracy of PDR [2,21, 147, 165, 195].
Compass Landmark: Similar to the gyroscope readings, the compass readings can be usedto detect turns, corners, and so on. Figure 13 shows the change in the azimuth readings of thecompass when the user takes a turn with the phone in hand. It should be noted that there is nophysical compass sensor in the smartphone; the compass readings are derived from the magne-tometer readings and accelerometer readings. Consequently, the compass readings are susceptibleto ferromagnetic materials or equipment, which do not affect the gyroscope readings. However,the advantage of the compass over the gyroscope is that the compass is able to capture turns withsmall bending coefficient [165]. Compass landmarks have been applied to correct the accumulatederror of PDR in Reference [147].
Accelerometer landmark: Accelerometer landmarks refer to location points where the motionstate of the user presents a certain change pattern, which can be identified from the accelerome-ter readings [44, 48, 49]. For example, the change pattern of “Walking–Still–Walking” will appearwhen a user opens a door, as shown in Figure 14; the change pattern of “Walking–Stairs–Walking”will arise as the user goes downstairs/upstairs, as shown in Figure 15. The location of a door andthe entry and exit points of stairs can be regarded as accelerometer landmarks if the correspond-ing change pattern can be detected every time the user passes through the door or stairs. Simi-larly, there is a distinctive pattern in the accelerometer readings when the user takes an elevatordownward or upward. Figure 16 demonstrates that a pair of symmetric bumps appear in oppositedirections as the user takes an elevator down. Thus, the location of the elevator can also be consid-ered as an accelerometer landmark, since it is distinctive, stable, and identifiable. Accelerometerlandmarks have been widely used to improve the accuracy of indoor localization and mapping [6,35, 55, 147, 165] and label the semantics of indoor environments [2].
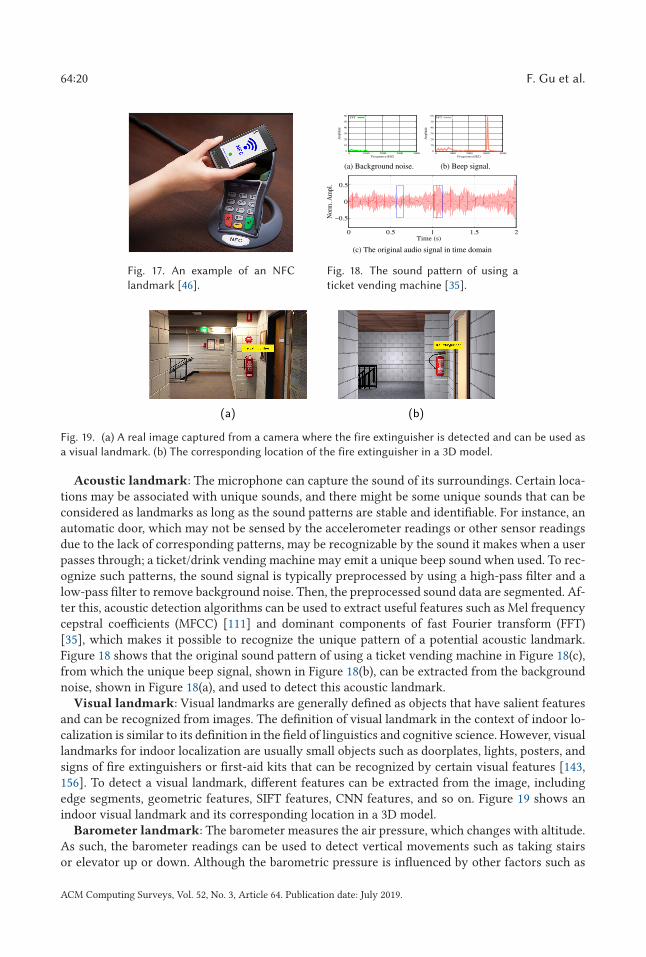
NFC landmark: NFC technique is one type of RFID technology that has been built in manymodern smart devices. NFC readers, which are usually fixedly installed, can be considered aslandmarks. The location of an NFC tag can be inferred when it touches on an NFC reader. NFCtechnique has wide applications, such as electronic payment and check-in. Since NFC readers arenormally installed at certain locations, their locations can be regarded as NFC landmarks, as shownin Figure 17. In the research works [40, 120], NFC tags deployed at specific locations were used asNFC landmarks for indoor navigation.
ACM Computing Surveys, Vol. 52, No. 3, Article 64. Publication date: July 2019.
64:20 F. Gu et al.
Fig. 17. An example of an NFC
landmark [46].
Fig. 18. The sound pattern of using a
ticket vending machine [35].
Fig. 19. (a) A real image captured from a camera where the fire extinguisher is detected and can be used as
a visual landmark. (b) The corresponding location of the fire extinguisher in a 3D model.
Acoustic landmark: The microphone can capture the sound of its surroundings. Certain loca-tions may be associated with unique sounds, and there might be some unique sounds that can beconsidered as landmarks as long as the sound patterns are stable and identifiable. For instance, anautomatic door, which may not be sensed by the accelerometer readings or other sensor readingsdue to the lack of corresponding patterns, may be recognizable by the sound it makes when a userpasses through; a ticket/drink vending machine may emit a unique beep sound when used. To rec-ognize such patterns, the sound signal is typically preprocessed by using a high-pass filter and alow-pass filter to remove background noise. Then, the preprocessed sound data are segmented. Af-ter this, acoustic detection algorithms can be used to extract useful features such as Mel frequencycepstral coefficients (MFCC) [111] and dominant components of fast Fourier transform (FFT)[35], which makes it possible to recognize the unique pattern of a potential acoustic landmark.Figure 18 shows that the original sound pattern of using a ticket vending machine in Figure 18(c),from which the unique beep signal, shown in Figure 18(b), can be extracted from the backgroundnoise, shown in Figure 18(a), and used to detect this acoustic landmark.
Visual landmark: Visual landmarks are generally defined as objects that have salient featuresand can be recognized from images. The definition of visual landmark in the context of indoor lo-calization is similar to its definition in the field of linguistics and cognitive science. However, visuallandmarks for indoor localization are usually small objects such as doorplates, lights, posters, andsigns of fire extinguishers or first-aid kits that can be recognized by certain visual features [143,156]. To detect a visual landmark, different features can be extracted from the image, includingedge segments, geometric features, SIFT features, CNN features, and so on. Figure 19 shows anindoor visual landmark and its corresponding location in a 3D model.
Barometer landmark: The barometer measures the air pressure, which changes with altitude.As such, the barometer readings can be used to detect vertical movements such as taking stairsor elevator up or down. Although the barometric pressure is influenced by other factors such as
ACM Computing Surveys, Vol. 52, No. 3, Article 64. Publication date: July 2019.
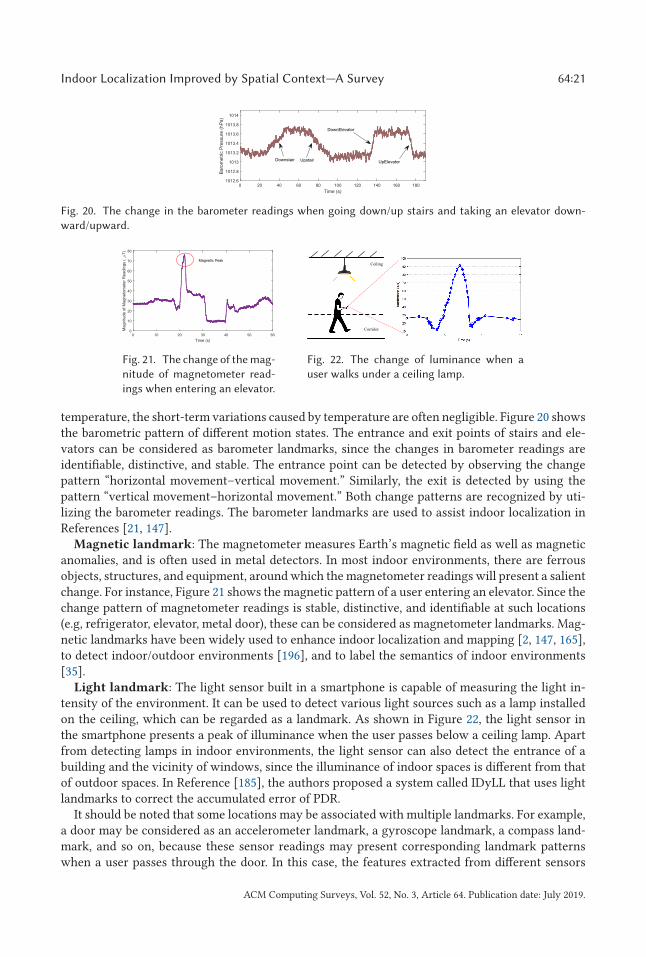
Indoor Localization Improved by Spatial Context—A Survey 64:21
Fig. 20. The change in the barometer readings when going down/up stairs and taking an elevator down-
ward/upward.
Fig. 21. The change of the mag-
nitude of magnetometer read-
ings when entering an elevator.
Fig. 22. The change of luminance when a
user walks under a ceiling lamp.
temperature, the short-term variations caused by temperature are often negligible. Figure 20 showsthe barometric pattern of different motion states. The entrance and exit points of stairs and ele-vators can be considered as barometer landmarks, since the changes in barometer readings areidentifiable, distinctive, and stable. The entrance point can be detected by observing the changepattern “horizontal movement–vertical movement.” Similarly, the exit is detected by using thepattern “vertical movement–horizontal movement.” Both change patterns are recognized by uti-lizing the barometer readings. The barometer landmarks are used to assist indoor localization inReferences [21, 147].
Magnetic landmark: The magnetometer measures Earth’s magnetic field as well as magneticanomalies, and is often used in metal detectors. In most indoor environments, there are ferrousobjects, structures, and equipment, around which the magnetometer readings will present a salientchange. For instance, Figure 21 shows the magnetic pattern of a user entering an elevator. Since thechange pattern of magnetometer readings is stable, distinctive, and identifiable at such locations(e.g, refrigerator, elevator, metal door), these can be considered as magnetometer landmarks. Mag-netic landmarks have been widely used to enhance indoor localization and mapping [2, 147, 165],to detect indoor/outdoor environments [196], and to label the semantics of indoor environments[35].
Light landmark: The light sensor built in a smartphone is capable of measuring the light in-tensity of the environment. It can be used to detect various light sources such as a lamp installedon the ceiling, which can be regarded as a landmark. As shown in Figure 22, the light sensor inthe smartphone presents a peak of illuminance when the user passes below a ceiling lamp. Apartfrom detecting lamps in indoor environments, the light sensor can also detect the entrance of abuilding and the vicinity of windows, since the illuminance of indoor spaces is different from thatof outdoor spaces. In Reference [185], the authors proposed a system called IDyLL that uses lightlandmarks to correct the accumulated error of PDR.
It should be noted that some locations may be associated with multiple landmarks. For example,a door may be considered as an accelerometer landmark, a gyroscope landmark, a compass land-mark, and so on, because these sensor readings may present corresponding landmark patternswhen a user passes through the door. In this case, the features extracted from different sensors
ACM Computing Surveys, Vol. 52, No. 3, Article 64. Publication date: July 2019.
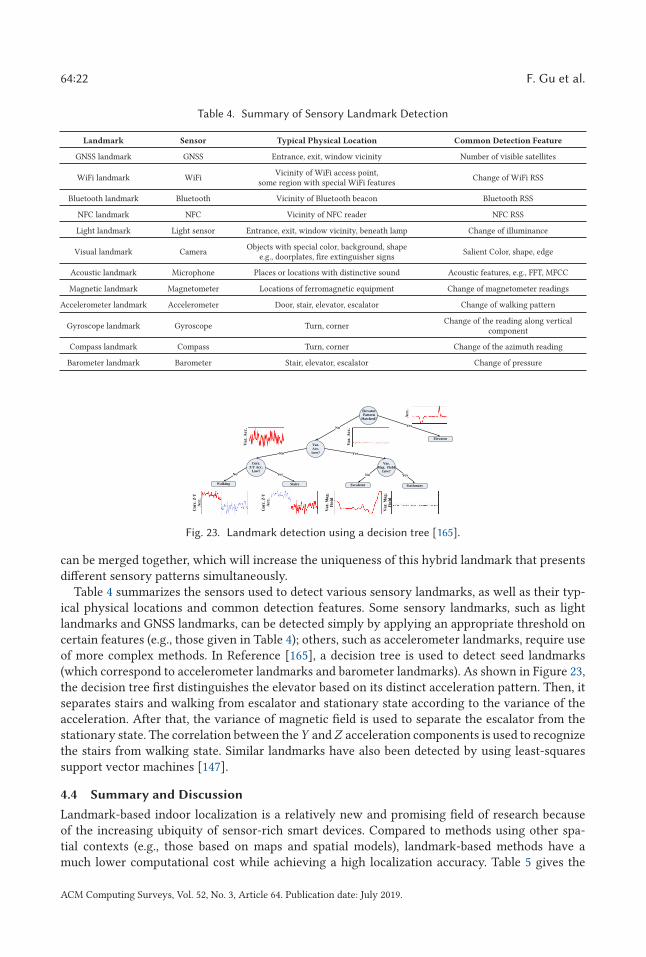
64:22 F. Gu et al.
Table 4. Summary of Sensory Landmark Detection
Landmark Sensor Typical Physical Location Common Detection Feature
GNSS landmark GNSS Entrance, exit, window vicinity Number of visible satellites
WiFi landmark WiFiVicinity of WiFi access point,
some region with special WiFi featuresChange of WiFi RSS
Bluetooth landmark Bluetooth Vicinity of Bluetooth beacon Bluetooth RSS
NFC landmark NFC Vicinity of NFC reader NFC RSS
Light landmark Light sensor Entrance, exit, window vicinity, beneath lamp Change of illuminance
Visual landmark CameraObjects with special color, background, shape
e.g., doorplates, fire extinguisher signsSalient Color, shape, edge
Acoustic landmark Microphone Places or locations with distinctive sound Acoustic features, e.g., FFT, MFCC
Magnetic landmark Magnetometer Locations of ferromagnetic equipment Change of magnetometer readings
Accelerometer landmark Accelerometer Door, stair, elevator, escalator Change of walking pattern
Gyroscope landmark Gyroscope Turn, cornerChange of the reading along vertical
component
Compass landmark Compass Turn, corner Change of the azimuth reading
Barometer landmark Barometer Stair, elevator, escalator Change of pressure
Fig. 23. Landmark detection using a decision tree [165].
can be merged together, which will increase the uniqueness of this hybrid landmark that presentsdifferent sensory patterns simultaneously.
Table 4 summarizes the sensors used to detect various sensory landmarks, as well as their typ-ical physical locations and common detection features. Some sensory landmarks, such as lightlandmarks and GNSS landmarks, can be detected simply by applying an appropriate threshold oncertain features (e.g., those given in Table 4); others, such as accelerometer landmarks, require useof more complex methods. In Reference [165], a decision tree is used to detect seed landmarks(which correspond to accelerometer landmarks and barometer landmarks). As shown in Figure 23,the decision tree first distinguishes the elevator based on its distinct acceleration pattern. Then, itseparates stairs and walking from escalator and stationary state according to the variance of theacceleration. After that, the variance of magnetic field is used to separate the escalator from thestationary state. The correlation between theY andZ acceleration components is used to recognizethe stairs from walking state. Similar landmarks have also been detected by using least-squaressupport vector machines [147].
4.4 Summary and Discussion
Landmark-based indoor localization is a relatively new and promising field of research becauseof the increasing ubiquity of sensor-rich smart devices. Compared to methods using other spa-tial contexts (e.g., those based on maps and spatial models), landmark-based methods have amuch lower computational cost while achieving a high localization accuracy. Table 5 gives the
ACM Computing Surveys, Vol. 52, No. 3, Article 64. Publication date: July 2019.
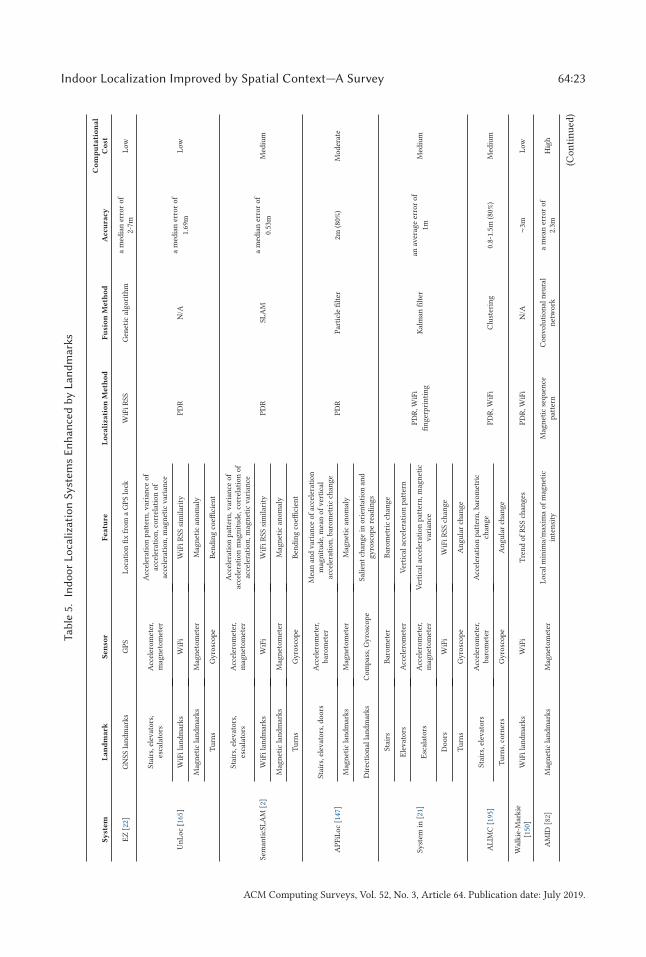
Indoor Localization Improved by Spatial Context—A Survey 64:23Tab
le5.
Ind
oor
Lo
cali
zati
on
Sy
stem
sE
nh
an
ced
by
Lan
dm
ark
s
Sy
stem
La
nd
ma
rkS
en
sor
Fea
ture
Lo
cali
zati
on
Meth
od
Fu
sio
nM
eth
od
Acc
ura
cyC
om
pu
tati
on
al
Co
st
EZ
[22]
GN
SSla
nd
mar
ks
GP
SL
oca
tio
nfi
xfr
om
aG
PS
lock
WiF
iR
SSG
enet
ical
go
rith
ma
med
ian
erro
ro
f2-
7mL
ow
Un
Lo
c[1
65]
Stai
rs,e
levat
ors
,es
cala
tors
Acc
eler
om
eter
,m
agn
eto
met
er
Acc
eler
atio
np
atte
rn,v
aria
nce
of
acce
lera
tio
n,c
orr
elat
ion
of
acce
lera
tio
n,m
agn
etic
var
ian
ce
PD
RN
/Aa
med
ian
erro
ro
f
1.69
mL
ow
WiF
ila
nd
mar
ks
WiF
iW
iFi
RSS
sim
ilar
ity
Mag
net
icla
nd
mar
ks
Mag
net
om
eter
Mag
net
ican
om
aly
Tu
rns
Gy
rosc
op
eB
end
ing
coeffi
cien
t
Sem
anti
cSL
AM
[2]
Stai
rs,e
levat
ors
,es
cala
tors
Acc
eler
om
eter
,m
agn
eto
met
er
Acc
eler
atio
np
atte
rn,v
aria
nce
of
acce
lera
tio
nm
agn
itu
de,
corr
elat
ion
of
acce
lera
tio
n,m
agn
etic
var
ian
ce
PD
RSL
AM
am
edia
ner
ror
of
0.53
mM
ediu
mW
iFi
lan
dm
ark
sW
iFi
WiF
iR
SSsi
mil
arit
y
Mag
net
icla
nd
mar
ks
Mag
net
om
eter
Mag
net
ican
om
aly
Tu
rns
Gy
rosc
op
eB
end
ing
coeffi
cien
t
AP
FiL
oc
[147
]
Stai
rs,e
levat
ors
,do
ors
Acc
eler
om
eter
,bar
om
eter
Mea
nan
dvar
ian
ceo
fac
cele
rati
on
mag
nit
ud
e,m
ean
of
ver
tica
lac
cele
rati
on
,bar
om
etri
cch
ang
eP
DR
Par
ticl
efi
lter
2m(8
0%)
Mo
der
ate
Mag
net
icla
nd
mar
ks
Mag
net
om
eter
Mag
net
ican
om
aly
Dir
ecti
on
alla
nd
mar
ks
Co
mp
ass,
Gy
rosc
op
eSa
lien
tch
ang
ein
ori
enta
tio
nan
dg
yro
sco
pe
read
ing
s
Syst
emin
[21]
Stai
rsB
aro
met
erB
aro
met
ric
chan
ge
PD
R,W
iFi
fin
ger
pri
nti
ng
Kal
man
filt
eran
aver
age
erro
ro
f
1mM
ediu
m
Ele
vat
ors
Acc
eler
om
eter
Ver
tica
lac
cele
rati
on
pat
tern
Esc
alat
ors
Acc
eler
om
eter
,m
agn
eto
met
erV
erti
cal
acce
lera
tio
np
atte
rn,m
agn
etic
var
ian
ce
Do
ors
WiF
iW
iFi
RSS
chan
ge
Tu
rns
Gy
rosc
op
eA
ng
ula
rch
ang
e
AL
IMC
[195
]St
airs
,ele
vat
ors
Acc
eler
om
eter
,bar
om
eter
Acc
eler
atio
np
atte
rn,b
aro
met
ric
chan
ge
PD
R,W
iFi
Clu
ster
ing
0.8-
1.5m
(80%
)M
ediu
m
Tu
rns,
corn
ers
Gy
rosc
op
eA
ngu
lar
chan
ge
Wal
kie
-Mar
kie
[150
]W
iFi
lan
dm
ark
sW
iFi
Tre
nd
of
RSS
chan
ges
PD
R,W
iFi
N/A
∼3m
Low
AM
ID[8
2]M
agn
etic
lan
dm
ark
sM
agn
eto
met
erL
oca
lm
inim
a/m
axim
ao
fm
agn
etic
inte
nsi
tyM
agn
etic
seq
uen
cep
atte
rnC
on
vo
luti
on
aln
eura
ln
etw
ork
am
ean
erro
ro
f2.
3mH
igh
(Co
nti
nu
ed)
ACM Computing Surveys, Vol. 52, No. 3, Article 64. Publication date: July 2019.
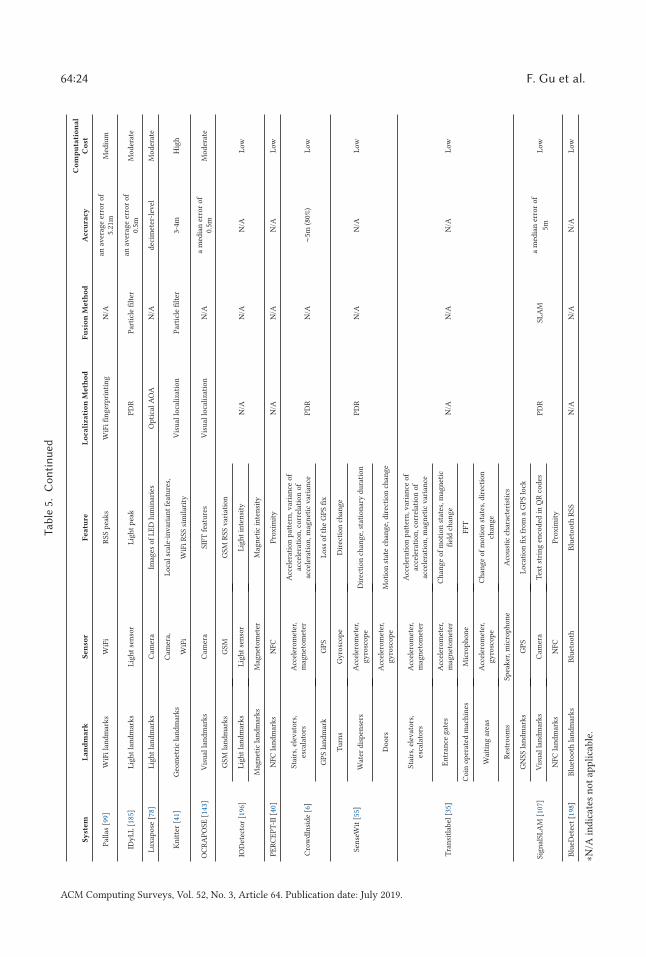
64:24 F. Gu et al.
Tab
le5.
Con
tin
ued
Sy
stem
La
nd
ma
rkS
en
sor
Fea
ture
Lo
cali
zati
on
Meth
od
Fu
sio
nM
eth
od
Acc
ura
cyC
om
pu
tati
on
al
Co
st
Pal
las
[99]
WiF
ila
nd
mar
ks
WiF
iR
SSp
eak
sW
iFi
fin
ger
pri
nti
ng
N/A
anav
erag
eer
ror
of
5.21
mM
ediu
m
IDy
LL
[185
]L
igh
tla
nd
mar
ks
Lig
ht
sen
sor
Lig
ht
pea
kP
DR
Par
ticl
efi
lter
anav
erag
eer
ror
of
0.5m
Mo
der
ate
Lu
xap
ose
[78]
Lig
ht
lan
dm
ark
sC
amer
aIm
ages
of
LE
Dlu
min
arie
sO
pti
cal
AO
AN
/Ad
ecim
eter
-lev
elM
od
erat
e
Kn
itte
r[4
1]G
eom
etri
cla
nd
mar
ks
Cam
era,
Lo
cal
scal
e-in
var
ian
tfe
atu
res,
Vis
ual
loca
liza
tio
nP
arti
cle
filt
er3-
4mH
igh
WiF
iW
iFi
RSS
sim
ilar
ity
OC
RA
PO
SE[1
43]
Vis
ual
lan
dm
ark
sC
amer
aSI
FTfe
atu
res
Vis
ual
loca
liza
tio
nN
/Aa
med
ian
erro
ro
f0.
5mM
od
erat
e
IOD
etec
tor
[196
]
GSM
lan
dm
ark
sG
SMG
SMR
SSvar
iati
on
N/A
N/A
N/A
Low
Lig
ht
lan
dm
ark
sL
igh
tse
nso
rL
igh
tin
ten
sity
Mag
net
icla
nd
mar
ks
Mag
net
om
eter
Mag
net
icin
ten
sity
PE
RC
EP
T-I
I[4
0]N
FCla
nd
mar
ks
NFC
Pro
xim
ity
N/A
N/A
N/A
Low
Cro
wd
Insi
de
[6]
Stai
rs,e
levat
ors
,es
cala
tors
Acc
eler
om
eter
,m
agn
eto
met
er
Acc
eler
atio
np
atte
rn,v
aria
nce
of
acce
lera
tio
n,c
orr
elat
ion
of
acce
lera
tio
n,m
agn
etic
var
ian
ceP
DR
N/A
∼5m
(80%
)L
ow
GP
Sla
nd
mar
kG
PS
Lo
sso
fth
eG
PS
fix
Sen
seW
it[5
5]
Tu
rns
Gy
rosc
op
eD
irec
tio
nch
ang
e
PD
RN
/AN
/AL
ow
Wat
erd
isp
ense
rsA
ccel
ero
met
er,
gy
rosc
op
eD
irec
tio
nch
ang
e,st
atio
nar
yd
ura
tio
n
Do
ors
Acc
eler
om
eter
,gy
rosc
op
eM
oti
on
stat
ech
ang
e,d
irec
tio
nch
ang
e
Tra
nsi
tlab
el[3
5]
Stai
rs,e
levat
ors
,es
cala
tors
Acc
eler
om
eter
,m
agn
eto
met
er
Acc
eler
atio
np
atte
rn,v
aria
nce
of
acce
lera
tio
n,c
orr
elat
ion
of
acce
lera
tio
n,m
agn
etic
var
ian
ce
N/A
N/A
N/A
Low
En
tran
ceg
ates
Acc
eler
om
eter
,m
agn
eto
met
erC
han
ge
of
mo
tio
nst
ates
,mag
net
icfi
eld
chan
ge
Co
ino
per
ated
mac
hin
esM
icro
ph
on
eFF
T
Wai
tin
gar
eas
Acc
eler
om
eter
,gy
rosc
op
eC
han
ge
of
mo
tio
nst
ates
,dir
ecti
on
chan
ge
Res
tro
om
sSp
eak
er,m
icro
ph
on
eA
cou
stic
char
acte
rist
ics
Sig
nal
SLA
M[1
07]
GN
SSla
nd
mar
ks
GP
SL
oca
tio
nfi
xfr
om
aG
PS
lock
PD
RSL
AM
am
edia
ner
ror
of
5mL
ow
Vis
ual
lan
dm
ark
sC
amer
aT
ext
stri
ng
enco
ded
inQ
Rco
des
NFC
lan
dm
ark
sN
FCP
roxim
ity
Blu
eDet
ect
[198
]B
luet
oo
thla
nd
mar
ks
Blu
eto
oth
Blu
eto
oth
RSS
N/A
N/A
N/A
Low
∗N/A
ind
icat
esn
ot
app
lica
ble
.
ACM Computing Surveys, Vol. 52, No. 3, Article 64. Publication date: July 2019.
Indoor Localization Improved by Spatial Context—A Survey 64:25
state-of-the-art indoor localization systems that utilize landmarks. It can be seen that the mostcommonly used landmarks are those corresponding to stationary building structures (e.g., stairs,elevators, escalators, doors). Magnetic landmarks and WiFi landmarks are also popular becauseof the pervasiveness of geomagnetism and the prevalence of WiFi infrastructure. Light landmarksare becoming increasingly popular, since modern smart devices have integrated the light sensorthat can capture the light intensity. Although different types of landmarks have been applied inindoor localization, there is still room to investigate the feasibility of other types of landmarksmentioned above.
Landmark-based methods improve the localization accuracy by recognizing the encounteredlandmark and matching it with those that are collected and stored in a database. A major challengein using landmarks for assisting localization is the matching, also known as the data associationissue [110]. In other words, when there are multiple landmarks nearby, it is difficult to determinewhich one matches with the encountered landmark. This problem is caused by the fact that sensorylandmarks do not have to be unique in the whole environment. Instead, often landmarks are uniquein a local area (e.g., a room). The reason for this is to obtain a sufficient number of landmarks inthe environment.
A simple solution to this problem is to increase the uniqueness of a landmark by adding othersensor data. WiFi fingerprints are often integrated into the property of accelerometer and gyro-scope landmarks [2, 165]. When the sensor pattern of a potential landmark is detected, its cor-responding WiFi fingerprint is first matched with the WiFi fingerprints of the landmarks in thedatabase, and the landmarks with similar WiFi fingerprints are chosen. Out of these candidates, onelandmark is finally selected by matching the detected sensor pattern with those of the candidates.The main limitation of this solution is its reliance on WiFi fingerprints, which means that it willnot work when the user is out of WiFi coverage range. In addition to WiFi fingerprints, walkingorientation is useful in solving the data association problem. For example, when the user’s locationis near two doors on two sides of a corridor, the two doors can be distinguished by observing thewalking orientation of the user as they pass through one of the doors.
Another solution to data association is to use the history of detected landmarks. One singlelandmark may not be distinguished from other landmarks in the environment, but a trajectory ofseveral encountered landmarks will make a unique path in the environment. Different methodssuch as the Hidden Markov model [131], conditional random field [180], and dynamic time warping[152], have been used to match the encountered landmark patterns with those in the database,thereby determining the correct landmark.
An additional challenge of using landmarks is dealing with the case that one or more land-marks are missed. In some cases, a landmark may be missed for various reasons. For example, anaccelerometer landmark corresponding to a door will be missed if the door is left open, since theuser does not stop to open the door (no “Walking–Still–Walking” pattern); also, lamps might be onor off at different times of the day, which will lead to failure in the detection of the correspondinglight landmark. In these cases, one can simply ignore the missed landmarks and not correct theuser’s location until the next landmark is detected. However, this simple strategy may lead to alarge error in the location estimation and even result in failure to locate the user. Handling missedlandmarks is an open problem for which no appropriate solution currently exists.
5 CONCLUSION AND OPEN CHALLENGES
In this article, we have surveyed the state-of-the-art indoor localization methods and systems.Wireless localization and inertial localization are the most popular methods, which have beenapplied in many domains. With the advent of smart devices, more sensors have become availablein daily-used devices such as smartphones, enabling more localization methods to be explored,
ACM Computing Surveys, Vol. 52, No. 3, Article 64. Publication date: July 2019.
64:26 F. Gu et al.
such as magnetic localization and light-based localization. Each localization method has its ownadvantages and limitations. Hybrid localization methods can overcome the limitations of singlesensors but will increase the cost of deployment.
Fusing spatial context with indoor localization methods is an effective way to achieve a satis-factory accuracy at no extra cost. The commonly used form of spatial context is map, whereby thelocalization accuracy can be improved by map matching. Spatial models contain richer informa-tion than maps and can better improve the localization performance. However, the construction ofspatial models requires significant efforts, and automatic model reconstruction methods are stillin their infancy. Also, spatial-model-based indoor localization methods, especially those based on3D spatial models, are usually computationally expensive and consume battery power quickly.
Landmarks, which can be considered as one type of spatial context, are quite useful in indoorlocalization. Compared to map-based and spatial-model-based methods, landmark-based methodshave lower computational requirement but can achieve similar localization accuracy.
Overall, indoor localization has been studied for decades, and spatial context can improve thelocalization accuracy without increasing the cost of deployment.
The main challenges in indoor localization that remain open for further research are as follows:
• Automatic construction of spatial models. Currently it is feasible to construct a mapefficiently using crowdsourcing or SLAM. Spatial models contain richer information thanmaps and are better suited to enhance indoor localization. However, manual constructionof spatial models is labor-intensive and slow, and automatic construction methods are stillin their infancy. More work on automated generation, evaluation, and benchmarking ofindoor models for localization and navigation purposes is needed [70, 71].
• Feature learning for sensory landmark detection. Existing landmark-detection meth-ods require the manual design of features for detecting a landmark. Further research on au-tomatic feature learning methods, e.g., deep learning, will improve the landmark-detectionaccuracy and lead to more accurate localization methods.
• Hybrid feature database construction and update for indoor localization. Despitetheir promise, hybrid methods typically consider only the integration of a few techniquessuch as a combination of WiFi fingerprinting and magnetic fingerprinting, a combinationof WiFi fingerprinting and maps, or a combination of PDR and landmarks. It is possible toachieve better localization accuracy and robustness by building a hybrid feature database,containing not only WiFi fingerprints, magnetic fingerprints, and sensory landmarks, butalso semantic features and other salient parameters. How to efficiently construct and updatesuch a hybrid feature database is a topic deserving further research.
• Cross-platform generalization of indoor localization. Most indoor localization sys-tems are implemented on smartphones, which have relatively better computational capa-bility and larger memory than other smart devices such as smart bands, smart watches, andsmart glasses. However, existing works usually focus on analyzing the generalization abil-ity of indoor localization approaches on different users. There is a lack of research on how amethod, developed for smartphones, works on other platforms such as smart watches. De-veloping cross-platform indoor localization methods is another possible direction for futureresearch.
• Battery-friendly lightweight indoor localization methods. While many researchersseek to improve localization accuracy by integrating a variety of sensors and/or spatialinformation, the battery power consumption problems are often ignored. Recording datafrom multiple sensors simultaneously (e.g., WiFi, accelerometer, magnetometer, gyroscope,barometer) can consume the device battery quickly, which may prohibit the developed
ACM Computing Surveys, Vol. 52, No. 3, Article 64. Publication date: July 2019.
Indoor Localization Improved by Spatial Context—A Survey 64:27
systems from being widely used. Also, the fusion of spatial information, especially spatialmodels, imposes a high computational cost. Developing battery-friendly lightweight indoorlocalization methods will be crucial to launching a system on a global scale.
REFERENCES
[1] Mahi Abdelbar and R. Michael Buehrer. 2016. Improving cellular positioning indoors through trajectory matching.
In Proceedings of the Position, Location and Navigation Symposium (PLANS’16). IEEE, 219–224.
[2] Heba Abdelnasser, Reham Mohamed, Ahmed Elgohary, Moustafa Farid Alzantot, He Wang, Souvik Sen, Romit Roy
Choudhury, and Moustafa Youssef. 2016. SemanticSLAM: Using environment landmarks for unsupervised indoor
localization. IEEE Trans. Mobile Comput. 15, 7 (2016), 1770–1782.
[3] Imad Afyouni. 2013. Knowledge Representation and Management in Indoor Mobile Environments. Ph.D. Dissertation.
Université de Bretagne occidentale-Brest.
[4] Imad Afyouni, Ray Cyril, and Claramunt Christophe. 2012. Spatial models for context-aware indoor navigation
systems: A survey. J. Spatial Inform. Sci. 1, 4 (2012), 85–123.
[5] Erwin Aitenbichler and Max Muhlhauser. 2003. An IR local positioning system for smart items and devices. In
Proceedings of the 23rd International Conference on Distributed Computing Systems Workshops. IEEE, 334–339.
[6] Moustafa Alzantot and Moustafa Youssef. 2012. Crowdinside: Automatic construction of indoor floorplans. In Pro-
ceedings of the 20th International Conference on Advances in Geographic Information Systems. ACM, 99–108.
[7] Michael Angermann, Martin Frassl, Marek Doniec, Brian J. Julian, and Patrick Robertson. 2012. Characterization of
the indoor magnetic field for applications in localization and mapping. In Proceedings of the International Conference
on Indoor Positioning and Indoor Navigation (IPIN’12). IEEE, 1–9.
[8] Paramvir Bahl and Venkata N. Padmanabhan. 2000. RADAR: An in-building RF-based user location and tracking
system. In Proceedings of the 19th Joint Conference of the IEEE Computer and Communications Societies (INFOCOM’00),
Vol. 2. IEEE, 775–784.
[9] Tim Bailey and Hugh Durrant-Whyte. 2006. Simultaneous localization and mapping (SLAM): Part II. IEEE Robot.
Automat. Mag. 13, 3 (2006), 108–117.
[10] Mortaza S. Bargh and Robert de Groote. 2008. Indoor localization based on response rate of bluetooth inquiries. In
Proceedings of the 1st ACM International Workshop on Mobile Entity Localization and Tracking in GPS-less Environ-
ments. ACM, 49–54.
[11] Safaa Bataineh, Alfonso Bahillo, Luis Enrique Díez, Enrique Onieva, and Ikram Bataineh. 2016. Conditional random
field-based offline map matching for indoor environments. Sensors 16, 8 (2016), 1302.
[12] Sourav Bhattacharya, Patrik Floréen, Andreas Forsblom, Samuli Hemminki, Petri Myllymäki, Petteri Nurmi, Teemu
Pulkkinen, and Antti Salovaara. 2012. Ma$$iv€—An intelligent mobile grocery assistant. In Proceedings of the 8th
International Conference on Intelligent Environments (IE’12). IEEE, 165–172.
[13] Jan Blumenthal, Ralf Grossmann, Frank Golatowski, and Dirk Timmermann. 2007. Weighted centroid localization
in Zigbee-based sensor networks. In Proceedings of the IEEE International Symposium on Intelligent Signal Processing
(WISP’07). IEEE, 1–6.
[14] Jürgen Bohn and Harald Vogt. 2003. Robust probabilistic positioning based on high-level sensor-fusion and map
knowledge. Technical Report, Vol. 421. ETH, Department of Computer Science.
[15] Agata Brajdic and Robert Harle. 2013. Walk detection and step counting on unconstrained smartphones. In Proceed-
ings of the ACM International Joint Conference on Pervasive and Ubiquitous Computing. ACM, 225–234.
[16] Guillaume Caron, Amaury Dame, and Eric Marchand. 2014. Direct model based visual tracking and pose estimation
using mutual information. Image Vision Comput. 32, 1 (2014), 54–63.
[17] Amer Catovic and Zafer Sahinoglu. 2004. The Cramer-Rao bounds of hybrid TOA/RSS and TDOA/RSS location
estimation schemes. IEEE Commun. Lett. 8, 10 (2004), 626–628.
[18] Lyu-Han Chen, Eric Hsiao-Kuang Wu, Ming-Hui Jin, and Gen-Huey Chen. 2014. Intelligent fusion of Wi-Fi and
inertial sensor-based positioning systems for indoor pedestrian navigation. IEEE Sens. J. 14, 11 (2014), 4034–4042.
[19] Yuanyi Chen, Minyi Guo, Jiaxing Shen, and Jiannong Cao. 2017. GraphLoc: A graph-based method for indoor subarea
localization with zero-configuration. Person. Ubiq. Comput. 21, 3 (2017), 489–505.
[20] Yin Chen, Dimitrios Lymberopoulos, Jie Liu, and Bodhi Priyantha. 2012. FM-based indoor localization. In Proceedings
of the 10th International Conference on Mobile Systems, Applications, and Services. ACM, 169–182.
[21] Zhenghua Chen, Han Zou, Hao Jiang, Qingchang Zhu, Yeng Chai Soh, and Lihua Xie. 2015. Fusion of Wi-Fi, smart-
phone sensors and landmarks using the Kalman filter for indoor localization. Sensors 15, 1 (2015), 715–732.
[22] Krishna Chintalapudi, Anand Padmanabha Iyer, and Venkata N. Padmanabhan. 2010. Indoor localization without
the pain. In Proceedings of the 16th International Conference on Mobile Computing and Networking. ACM, 173–184.
ACM Computing Surveys, Vol. 52, No. 3, Article 64. Publication date: July 2019.
64:28 F. Gu et al.
[23] Seong Yun Cho and Chan Gook Park. 2006. MEMS based pedestrian navigation system. J. Navig. 59, 1 (2006), 135–
153.
[24] Jaewoo Chung, Matt Donahoe, Chris Schmandt, Ig-Jae Kim, Pedram Razavai, and Micaela Wiseman. 2011. Indoor
location sensing using geo-magnetism. In Proceedings of the 9th International Conference on Mobile Systems, Appli-
cations, and Services. ACM, 141–154.
[25] Ionut Constandache, Romit Roy Choudhury, and Injong Rhee. 2010. Towards mobile phone localization without
war-driving. In Proceedings of the IEEE INFOCOM. IEEE, 1–9.
[26] Andrea Conti, Matteo Guerra, Davide Dardari, Nicolo Decarli, and Moe Z. Win. 2012. Network experimentation for
cooperative localization. IEEE J. Select. Areas Commun. 30, 2 (2012), 467–475.
[27] Pavel Davidson and Robert Piche. 2016. A survey of selected indoor positioning methods for smartphones. IEEE
Commun. Surv. Tutor. 19, 2 (2016), 1347–1370.
[28] A. J. Davison. 2003. Real-time simultaneous localisation and mapping with a single camera. In Proceedings of the
IEEE International Conference on Computer Vision (ICCV’03), Vol. 2. 1403–1410.
[29] Brett Dawes and Kwan-Wu Chin. 2011. A comparison of deterministic and probabilistic methods for indoor local-
ization. J. Syst. Softw. 84, 3 (2011), 442–451.
[30] Zhi-An Deng, Ying Hu, Jianguo Yu, and Zhenyu Na. 2015. Extended Kalman filter for real time indoor localization
by fusing Wi-Fi and smartphone inertial sensors. Micromachines 6, 4 (2015), 523–543.
[31] Anind K. Dey. 2001. Understanding and using context. Person. Ubiq. Comput. 5, 1 (2001), 4–7.
[32] Javier J. M. Diaz, Rodrigo de A. Maues, Rodrigo B. Soares, Eduardo F. Nakamura, and Carlos M. S. Figueiredo.
2010. Bluepass: An indoor Bluetooth-based localization system for mobile applications. In Proceedings of the IEEE
Symposium on Computers and Communications (ISCC’10). IEEE, 778–783.
[33] Lucía Díaz-Vilariño, Kourosh Khoshelham, Joaquín Martínez-Sánchez, and Pedro Arias. 2015. 3D modeling of build-
ing indoor spaces and closed doors from imagery and point clouds. Sensors 15, 2 (2015), 3491–3512.
[34] Ekahau. 2018. Tracking and Site Survey Solutions. Retrieved from: https://www.ekahau.com/.
[35] Moustafa Elhamshary, Moustafa Youssef, Akira Uchiyama, Hirozumi Yamaguchi, and Teruo Higashino. 2016. Tran-
sitLabel: A crowd-sensing system for automatic labeling of transit stations semantics. In Proceedings of the 14th
International Conference on Mobile Systems, Applications, and Services. ACM, 193–206.
[36] R. Faragher and R. Harle. 2013. SmartSLAM-an efficient smartphone indoor positioning system exploiting machine
learning and opportunistic sensing. In Proceedings of the 26th International Technical Meeting of the Satellite Division
of the Institute of Navigation (ION GNSS’13), Vol. 13. 1–14.
[37] Ramsey Faragher and Robert Harle. 2015. Location fingerprinting with Bluetooth low-energy beacons. IEEE J. Select.
Areas Commun. 33, 11 (2015), 2418–2428.
[38] Brian D. Ferris, Dieter Fox, and Neil Lawrence. 2007. Wi-Fi-SLAM using Gaussian process latent variable models. 7,
1 (2007), 2480–2485.
[39] Dieter Fox, Wolfram Burgard, and Sebastian Thrun. 1999. Markov localization for mobile robots in dynamic envi-
ronments. J. Artific. Intell. Res. 11 (1999), 391–427.
[40] Aura Ganz, James M. Schafer, Yang Tao, Carole Wilson, and Meg Robertson. 2014. PERCEPT-II: Smartphone based
indoor navigation system for the blind. In Proceedings of the 36th IEEE International Conference on Engineering in
Medicine and Biology Society (EMBC’14). IEEE, 3662–3665.
[41] Ruipeng Gao, Bing Zhou, Fan Ye, and Yizhou Wang. 2017. Knitter: Fast, resilient single-user indoor floor plan con-
struction. In Proceedings of the IEEE Conference on Computer Communications (INFOCOM’17). IEEE, 1–9.
[42] Sinan Gezici, Zhi Tian, Georgios B. Giannakis, Hisashi Kobayashi, Andreas F. Molisch, H. Vincent Poor, and Zafer
Sahinoglu. 2005. Localization via ultra-wideband radios: A look at positioning aspects for future sensor networks.
IEEE Sig. Proc. Mag. 22, 4 (2005), 70–84.
[43] Andrea Giorgetti and Marco Chiani. 2013. Time-of-arrival estimation based on information theoretic criteria. IEEE
Trans. Sig. Proc. 61, 8 (2013), 1869–1879.
[44] Fuqiang Gu, Allison Kealy, Kourosh Khoshelham, and Jianga Shang. 2015. User-independent motion state recogni-
tion using smartphone sensors. Sensors 15, 12 (2015), 30636–30652.
[45] Fuqiang Gu, Allison Kealy, Kourosh Khoshelham, and Jianga Shang. 2016. Efficient and accurate indoor localization
using landmark graphs. Int. Arch. Photogram., Remote Sens. Spatial Inform. Sci. 41 (2016).
[46] Fuqiang Gu, Kourosh Khoshelham, Jianga Shang, and Fangwen Yu. 2016. Sensory landmarks for indoor localization.
In Proceedings of the 4th International Conference on Ubiquitous Positioning, Indoor Navigation and Location Based
Services (UPINLBS’16). IEEE, 201–206.
[47] Fuqiang Gu, Kourosh Khoshelham, Jianga Shang, Fangwen Yu, and Zhuo Wei. 2017. Robust and accurate
smartphone-based step counting for indoor localization. IEEE Sens. J. 17, 11 (2017), 3453–3460.
[48] Fuqiang Gu, Kourosh Khoshelham, and Shahrokh Valaee. 2017. Locomotion activity recognition: A deep learning
approach. In Proceedings of the 28th IEEE International Symposium on Personal, Indoor, and Mobile Radio Communi-
cations (PIMRC’17). IEEE, 1–5.
ACM Computing Surveys, Vol. 52, No. 3, Article 64. Publication date: July 2019.
Indoor Localization Improved by Spatial Context—A Survey 64:29
[49] Fuqiang Gu, Kourosh Khoshelham, Shahrokh Valaee, Jianga Shang, and Rui Zhang. 2018. Locomotion activity recog-
nition using stacked denoising autoencoders. IEEE Int. Things J. 5, 3 (2018), 2085–2093.
[50] Fuqiang Gu, Kourosh Khoshelham, Chunyang Yu, and Jianga Shang. 2018. Accurate step length estimation for
pedestrian dead-reckoning localization using stacked autoencoders. IEEE Trans. Instrument. Measur. (2018), 1–9.
DOI:https://doi.org/10.1109/TIM.2018.2871808
[51] Yanying Gu, Anthony Lo, and Ignas Niemegeers. 2009. A survey of indoor positioning systems for wireless personal
networks. IEEE Commun. Surv. Tutor. 11, 1 (2009), 13–32.
[52] Robert Harle. 2013. A survey of indoor inertial positioning systems for pedestrians. IEEE Commun. Surv. Tutor. 15,
3 (2013), 1281–1293.
[53] Suining He and S.-H. Gary Chan. 2016. Wi-Fi fingerprint-based indoor positioning: Recent advances and compar-
isons. IEEE Commun. Surv. Tutor. 18, 1 (2016), 466–490.
[54] Suining He and Kang G. Shin. 2017. Geomagnetism for smartphone-based indoor localization: Challenges, advances,
and comparisons. ACM Comput. Surv. 50, 6 (2017), 97.
[55] Yuan He, Jiaqi Liang, and Yunhao Liu. 2017. Pervasive floorplan generation based on only inertial sensing: Feasibility,
design, and implementation. IEEE J. Select. Areas Commun. 35, 5 (2017), 1132–1140.
[56] Jeffrey Hightower. 2004. The Location Stack. University of Washington.
[57] Sebastian Hilsenbeck, Dmytro Bobkov, Georg Schroth, Robert Huitl, and Eckehard Steinbach. 2014. Graph-based
data fusion of pedometer and Wi-Fi measurements for mobile indoor positioning. In Proceedings of the ACM Inter-
national Joint Conference on Pervasive and Ubiquitous Computing. ACM, 147–158.
[58] Ken Hinckley and Mike Sinclair. 1999. Touch-sensing input devices. In Proceedings of the SIGCHI Conference on
Human Factors in Computing Systems. ACM, 223–230.
[59] Xuke Hu, Hongchao Fan, Alexander Zipf, Jianga Shang, and Fuqiang Gu. 2017. A conceptual framework for indoor
mapping by using grammars. ISPRS Ann. Photogram., Remote Sens. Spatial Inform. Sci. 4 (2017), 335.
[60] Xuke Hu, Jianga Shang, Fuqiang Gu, and Qi Han. 2015. Improving Wi-Fi indoor positioning via AP sets similarity
and semi-supervised affinity propagation clustering. Int. J. Distrib. Sens. Netw. 11, 1 (2015), 109642.
[61] Mohamed Ibrahim and Moustafa Youssef. 2012. CellSense: An accurate energy-efficient GSM positioning system.
IEEE Trans. Vehic. Technol. 61, 1 (2012), 286–296.
[62] Quantitec Intranav. 2018. Tracking Industrial Assets in Motion. Retrieved from: https://intranav.com/.
[63] Christian S. Jensen, Hua Lu, and Bin Yang. 2009. Graph model based indoor tracking. In Proceedings of the 10th
International Conference on Mobile Data Management: Systems, Services and Middleware (MDM’09). IEEE, 122–131.
[64] Yunye Jin, Wee-Seng Soh, Mehul Motani, and Wai-Choong Wong. 2013. A robust indoor pedestrian tracking system
with sparse infrastructure support. IEEE Trans. Mobile Comput. 12, 7 (2013), 1392–1403.
[65] Jongdae Jung and Hyun Myung. 2011. Indoor localization using particle filter and map-based NLOS ranging model.
In Proceedings of the IEEE International Conference on Robotics and Automation (ICRA’11). IEEE, 5185–5190.
[66] Kamol Kaemarungsi, Rachasak Ranron, and Prasit Pongsoon. 2013. Study of received signal strength indication
in ZigBee location cluster for indoor localization. In Proceedings of the 10th International Conference on Electrical
Engineering/Electronics, Computer, Telecommunications and Information Technology (ECTI-CON’13). IEEE, 1–6.
[67] Muzaffer Kanaan and Kaveh Pahlavan. 2004. A comparison of wireless geolocation algorithms in the indoor envi-
ronment. In Proceedings of the IEEE Wireless Communications and Networking Conference (WCNC’04), Vol. 1. IEEE,
177–182.
[68] Alex Kendall and Roberto Cipolla. 2016. Modelling uncertainty in deep learning for camera relocalization. In Pro-
ceedings of the IEEE International Conference on Robotics and Automation (ICRA’16). IEEE, 4762–4769.
[69] Kourosh Khoshelham and Milad Ramezani. 2017. Vehicle positioning in the absence of GNSS signals: Potential of
visual-inertial odometry. In Proceedings of the Joint Urban Remote Sensing Event (JURSE’17). IEEE, 1–4.
[70] K. Khoshelham, H. Tran, L. Díaz-Vilariño, M. Peter, Z Kang, and D. Acharya. 2018. An evaluation framework for
benchmarking indoor modelling methods. ISPRS-Int. Arch. Photogram., Remote Sens. Spatial Inform. Sci. 624 (2018),
297–302.
[71] K. Khoshelham, L. Díaz Vilariño, M. Peter, Z Kang, and D. Acharya. 2017. The ISPRS benchmark on indoor modelling.
Int. Arch. Photogram 42 (2017).
[72] Kourosh Khoshelham and Sisi Zlatanova. 2016. Sensors for indoor mapping and navigation. Sensors 16, 5 (2016).
[73] Hakyong Kim. 2009. Double-sided two-way ranging algorithm to reduce ranging time. IEEE Commun. Lett. 13, 7
(2009).
[74] Jeong Won Kim, Han Jin Jang, Dong-Hwan Hwang, and Chansik Park. 2004. A step, stride and heading determination
for the pedestrian navigation system. Positioning 1, 08 (2004), 0.
[75] Manikanta Kotaru, Kiran Joshi, Dinesh Bharadia, and Sachin Katti. 2015. Spotfi: Decimeter level localization using
Wi-Fi. In ACM SIGCOMM Comput. Commun. Rev., Vol. 45. ACM, 269–282.
ACM Computing Surveys, Vol. 52, No. 3, Article 64. Publication date: July 2019.
64:30 F. Gu et al.
[76] Dimitrios G. Kottas and Stergios I. Roumeliotis. 2013. Exploiting urban scenes for vision-aided inertial navigation.
Robotics: Science and Systems. DOI:10.15607/RSS.2013.IX.021
[77] John Krumm, Lyndsay Williams, and Greg Smith. 2002. SmartMoveX on a graph-an inexpensive active badge tracker.
In Proceedings of the International Conference on Ubiquitous Computing (UbiComp’02). 343–350.
[78] Ye-Sheng Kuo, Pat Pannuto, Ko-Jen Hsiao, and Prabal Dutta. 2014. Luxapose: Indoor positioning with mobile phones
and visible light. In Proceedings of the 20th International Conference on Mobile Computing and Networking. ACM, 447–
458.
[79] Mohamed Laaraiedh, Lei Yu, Stephane Avrillon, and Bernard Uguen. 2011. Comparison of hybrid localization
schemes using RSSI, TOA, and TDOA. In Proceedings of the 11th European Wireless Conference—Sustainable Wireless
Technologies. VDE, 1–5.
[80] Fabrice Lamarche and Stéphane Donikian. 2004. Crowd of virtual humans: A new approach for real time navigation
in complex and structured environments. In Comput. Graph. Forum, Vol. 23. Wiley Online Library, 509–518.
[81] Kun-Chan Lan and Wen-Yuah Shih. 2013. On calibrating the sensor errors of a PDR-based indoor localization system.
Sensors 13, 4 (2013), 4781–4810.
[82] Namkyoung Lee, Sumin Ahn, and Dongsoo Han. 2018. AMID: Accurate magnetic indoor localization using deep
learning. Sensors 18, 5 (2018), 1598.
[83] Vincent Lepetit, Pascal Fua et al. 2005. Monocular model-based 3D tracking of rigid objects: A survey. Found. Trends®
Comput. Graph. Vis. 1, 1 (2005), 1–89.
[84] Stefan Leutenegger, Simon Lynen, Michael Bosse, Roland Siegwart, and Paul Furgale. 2015. Keyframe-based visual–
inertial odometry using nonlinear optimization. Int. J. Robot. Res. 34, 3 (2015), 314–334.
[85] Binghao Li, Thomas Gallagher, Andrew G. Dempster, and Chris Rizos. 2012. How feasible is the use of magnetic
field alone for indoor positioning? In Proceedings of the International Conference on Indoor Positioning and Indoor
Navigation (IPIN’12). IEEE, 1–9.
[86] Fan Li, Chunshui Zhao, Guanzhong Ding, Jian Gong, Chenxing Liu, and Feng Zhao. 2012. A reliable and accurate
indoor localization method using phone inertial sensors. In Proceedings of the ACM Conference on Ubiquitous Com-
puting. ACM, 421–430.
[87] Liqun Li, Pan Hu, Chunyi Peng, Guobin Shen, and Feng Zhao. 2014. Epsilon: A visible light based position-
ing system. In Proceedings of the Symposium on Networked Systems Design and Implementation (NSDI’14). 331–
343.
[88] Mingyang Li, Byung Hyung Kim, and Anastasios I. Mourikis. 2013. Real-time motion tracking on a cellphone using
inertial sensing and a rolling-shutter camera. In Proceedings of the IEEE International Conference on Robotics and
Automation (ICRA’13). IEEE, 4712–4719.
[89] Mingyang Li and Anastasios I. Mourikis. 2013. High-precision, consistent EKF-based visual-inertial odometry. Int.
J. Robot. Res. 32, 6 (2013), 690–711.
[90] Mingyang Li and Anastasios I. Mourikis. 2014. Vision-aided inertial navigation with rolling-shutter cameras. Int. J.
Robot. Res. 33, 11 (2014), 1490–1507.
[91] Xiang Li, Christophe Claramunt, and Cyril Ray. 2010. A grid graph-based model for the analysis of 2D indoor spaces.
Comput., Environ. Urban Syst. 34, 6 (2010), 532–540.
[92] Lin Liao, Dieter Fox, Jeffrey Hightower, Henry Kautz, and Dirk Schulz. 2003. Voronoi tracking: Location estimation
using sparse and noisy sensor data. In Proceedings of the IEEE/RSJ International Conference on Intelligent Robots and
Systems (IROS’03), Vol. 1. IEEE, 723–728.
[93] Jó Agila Bitsch Link, Paul Smith, Nicolai Viol, and Klaus Wehrle. 2011. Footpath: Accurate map-based indoor navi-
gation using smartphones. In Proceedings of the International Conference on Indoor Positioning and Indoor Navigation
(IPIN’11). IEEE, 1–8.
[94] Hui Liu, Houshang Darabi, Pat Banerjee, and Jing Liu. 2007. Survey of wireless indoor positioning techniques and
systems. IEEE Trans. Syst., Man, Cyber., Part C (Applic. Rev.) 37, 6 (2007), 1067–1080.
[95] Jingbin Liu, Ruizhi Chen, Ling Pei, Robert Guinness, and Heidi Kuusniemi. 2012. A hybrid smartphone indoor po-
sitioning solution for mobile LBS. Sensors 12, 12 (2012), 17208–17233.
[96] Kaikai Liu, Xinxin Liu, and Xiaolin Li. 2013. Guoguo: Enabling fine-grained indoor localization via smartphone.
In Proceedings of the 11th International Conference on Mobile Systems, Applications, and Services. ACM, 235–
248.
[97] Yunhao Liu, Yiyang Zhao, Lei Chen, Jian Pei, and Jinsong Han. 2012. Mining frequent trajectory patterns for activity
monitoring using radio frequency tag arrays. IEEE Trans. Parallel Distrib. Syst. 23, 11 (2012), 2138–2149.
[98] IndoorAtlas Ltd. 2018. IndoorAtlas. Retrieved from: http://www.indooratlas.com/.
[99] Chengwen Luo, Long Cheng, Mun Choon Chan, Yu Gu, Jianqiang Li, and Zhong Ming. 2017. Pallas: Self-
bootstrapping fine-grained passive indoor localization using Wi-Fi monitors. IEEE Trans. Mobile Comput. 16, 2 (2017),
466–481.
ACM Computing Surveys, Vol. 52, No. 3, Article 64. Publication date: July 2019.
Indoor Localization Improved by Spatial Context—A Survey 64:31
[100] Dimitrios Lymberopoulos, Jie Liu, Maurizio Bocca, Vitor Sequeira, Niki Trigoni, Xue Yang, Ying Zhang, and Anthony
Rowe. 2018. Microsoft indoor localization competition. In Proceedings of the International Symposium on Information
Processing in Sensor Networks (IPSN’17).
[101] Huadong Ma, Dong Zhao, and Peiyan Yuan. 2014. Opportunities in mobile crowd sensing. IEEE Commun. Mag. 52,
8 (2014), 29–35.
[102] Lin Ma, Yanyun Fan, Yubin Xu, and Yang Cui. 2017. Pedestrian dead-reckoning trajectory matching method for radio
map crowdsourcing building in Wi-Fi indoor positioning system. In Proceedings of the IEEE International Conference
on Communications (ICC’17). IEEE, 1–6.
[103] Yongtao Ma, Zhi Dou, Qideng Jiang, and Zhenhuan Hou. 2016. Basmag: An optimized HMM-based localization
system using backward sequences matching algorithm exploiting geomagnetic information. IEEE Sens. J. 16, 20
(2016), 7472–7482.
[104] Atri Mandal, Cristina V. Lopes, Tony Givargis, Amir Haghighat, Raja Jurdak, and Pierre Baldi. 2005. Beep: 3D indoor
positioning using audible sound. In Proceedings of the 2nd Consumer Communications and Networking Conference
(CCNC’05). IEEE, 348–353.
[105] Dennis McCrady, Lawrence Doyle, and Howard Forstrom. 1999. Mobile ranging with low accuracy clocks. In Pro-
ceedings of the Radio and Wireless Conference (RAWCON’99). IEEE, 85–88.
[106] Edward L. Melanson, Joan R. Knoll, Melanie L. Bell, William T. Donahoo, J. O. Hill, Lana J. Nysse, Lorraine
Lanningham-Foster, John C. Peters, and James A. Levine. 2004. Commercially available pedometers: Considerations
for accurate step counting. Prevent. Med. 39, 2 (2004), 361–368.
[107] Piotr Mirowski, Tin Kam Ho, Saehoon Yi, and Michael MacDonald. 2013. SignalSLAM: Simultaneous localization
and mapping with mixed Wi-Fi, Bluetooth, LTE and magnetic signals. In Proceedings of the International Conference
on Indoor Positioning and Indoor Navigation (IPIN’13). IEEE, 1–10.
[108] Dmytro Mishkin, Michal Perdoch, and Jiri Matas. 2015. Place recognition with WxBS retrieval. In Proceedings of the
CVPR Workshop on Visual Place Recognition in Changing Environments, Vol. 30.
[109] Vahideh Moghtadaiee, Andrew G. Dempster, and Samsung Lim. 2011. Indoor localization using FM radio signals: A
fingerprinting approach. In Proceedings of the International Conference on Indoor Positioning and Indoor Navigation
(IPIN’11). IEEE, 1–7.
[110] Michael Montemerlo, Sebastian Thrun, Daphne Koller, Ben Wegbreit et al. 2002. FastSLAM: A factored solution
to the simultaneous localization and mapping problem. In Proceedings of the 18th National Conference on Artificial
Intelligence and 14th Conference on Innovative Applications of Artificial Intelligence.
[111] Lindasalwa Muda, Mumtaj Begam, and Irraivan Elamvazuthi. 2010. Voice recognition algorithms using mel fre-
quency cepstral coefficient (MFCC) and dynamic time warping (DTW) techniques. Retrieved from: arXiv preprint
arXiv:1003.4083.
[112] Lionel M. Ni, Yunhao Liu, Yiu Cho Lau, and Abhishek P. Patil. 2004. LANDMARC: Indoor location sensing using
active RFID. Wireless Netw. 10, 6 (2004), 701–710.
[113] Lionel M. Ni, Dian Zhang, and Michael R. Souryal. 2011. RFID-based localization and tracking technologies. IEEE
Wireless Commun. 18, 2 (2011).
[114] D. Nister, O. Naroditsky, and J. Bergen. 2004. Visual odometry. In Proceedings of the IEEE Conference on Computer
Vision and Pattern Recognition (CVPR’04), Vol. 1. 652–659.
[115] Henri Nurminen, Mike Koivisto, Simo Ali-Löytty, and Robert Piché. 2014. Motion model for positioning with graph-
based indoor map. In Proceedings of the International Conference on Indoor Positioning and Indoor Navigation (IPIN’14).
IEEE, 646–655.
[116] Henri Nurminen, Jukka Talvitie, Simo Ali-Löytty, Philipp Müller, Elena-Simona Lohan, Robert Piché, and Markku
Renfors. 2013. Statistical path loss parameter estimation and positioning using RSS measurements. J. Global Position.
Syst. 12, 1 (2013), 13–27.
[117] Lauro Ojeda and Johann Borenstein. 2007. Personal dead-reckoning system for GPS-denied environments. In Pro-
ceedings of the IEEE International Workshop on Safety, Security and Rescue Robotics (SSRR’07). IEEE, 1–6.
[118] Veljo Otsason, Alex Varshavsky, Anthony LaMarca, and Eyal De Lara. 2005. Accurate GSM indoor localization. In
Proceedings of the IEEE International Workshop on Ubiquitous Computing (UbiComp’05), 903–903.
[119] Koray Ozcan and Senem Velipasalar. 2015. Robust and reliable step counting by mobile phone cameras. In Proceedings
of the 9th International Conference on Distributed Smart Cameras. ACM, 164–169.
[120] Busra Ozdenizci, Vedat Coskun, and Kerem Ok. 2015. NFC internal: An indoor navigation system. Sensors 15, 4
(2015), 7571–7595.
[121] Jun-geun Park, Ben Charrow, Dorothy Curtis, Jonathan Battat, Einat Minkov, Jamey Hicks, Seth Teller, and Jonathan
Ledlie. 2010. Growing an organic indoor location system. In Proceedings of the 8th International Conference on Mobile
Systems, Applications, and Services. ACM, 271–284.
[122] Jun-geun Park and Seth Teller. 2014. Motion Compatibility for Indoor Localization. Technical Report MIT-CSAIL-TR-
2014-017. Massachusetts Institute of Technology.
ACM Computing Surveys, Vol. 52, No. 3, Article 64. Publication date: July 2019.
64:32 F. Gu et al.
[123] Neal Patwari, Joshua N. Ash, Spyros Kyperountas, Alfred O. Hero, Randolph L. Moses, and Neiyer S. Correal. 2005.
Locating the nodes: Cooperative localization in wireless sensor networks. IEEE Sig. Proc. Mag. 22, 4 (2005), 54–69.
[124] Ling Pei, Min Zhang, Danping Zou, Ruizhi Chen, and Yuwei Chen. 2016. A survey of crowd sensing opportunistic
signals for indoor localization. 2016, Article 4041291 (2016). http://dx.doi.org/10.1155/2016/4041291
[125] Luis Peneda, Abílio Azenha, and Adriano Carvalho. 2009. Trilateration for indoors positioning within the framework
of wireless communications. In Proceedings of the 35th IEEE Conference on Industrial Electronics (IECON’09). IEEE,
2732–2737.
[126] Chunyi Peng, Guobin Shen, Yongguang Zhang, Yanlin Li, and Kun Tan. 2007. Beepbeep: A high accuracy acoustic
ranging system using COTS mobile devices. In Proceedings of the 5th International Conference on Embedded Net-
worked Sensor Systems. ACM, 1–14.
[127] Benjamin B. Peterson, Chris Kmiecik, Richard Hartnett, Patrick M. Thompson, Jose Mendoza, and Hung Nguyen.
1998. Spread spectrum indoor geolocation. Navigation 45, 2 (1998), 97–102.
[128] Nathan Piasco, Désiré Sidibé, Cédric Demonceaux, and Valérie Gouet-Brunet. 2018. A survey on visual-based local-
ization: On the benefit of heterogeneous data. Pattern Recog. 74 (2018), 90–109.
[129] Clark C. Presson and Daniel R. Montello. 1988. Points of reference in spatial cognition: Stalking the elusive landmark.
Brit. J. Dev. Psych. 6, 4 (1988), 378–381.
[130] Jiuchao Qian, Ling Pei, Jiabin Ma, Rendong Ying, and Peilin Liu. 2015. Vector graph assisted pedestrian dead-
reckoning using an unconstrained smartphone. Sensors 15, 3 (2015), 5032–5057.
[131] Lawrence R. Rabiner. 1989. A tutorial on hidden Markov models and selected applications in speech recognition.
Proc. IEEE 77, 2 (1989), 257–286.
[132] Filip Radenović, Giorgos Tolias, and Ondřej Chum. 2016. CNN image retrieval learns from BoW: Unsupervised fine-
tuning with hard examples. In Proceedings of the European Conference on Computer Vision. Springer, 3–20.
[133] Anshul Rai, Krishna Kant Chintalapudi, Venkata N. Padmanabhan, and Rijurekha Sen. 2012. Zee: Zero-effort crowd-
sourcing for indoor localization. In Proceedings of the 18th International Conference on Mobile Computing and Net-
working. ACM, 293–304.
[134] Niranjini Rajagopal, Patrick Lazik, Nuno Pereira, Sindhura Chayapathy, Bruno Sinopoli, and Anthony Rowe. 2018.
Enhancing indoor smartphone location acquisition using floor plans. In Proceedings of the 17th ACM/IEEE Interna-
tional Conference on Information Processing in Sensor Networks. IEEE Press, 278–289.
[135] M. Ramezani, D. Acharya, F. Gu, and K. Khoshelham. 2017. Indoor positioning by visual-inertial odometry. ISPRS
Ann. Photogram., Remote Sens. Spatial Inform. Sci. 4 (2017), 371.
[136] Milad Ramezani and Kourosh Khoshelham. 2018. Vehicle positioning in GNSS-deprived urban areas by stereo visual-
inertial odometry. IEEE Trans. Intell. Vehic. 3, 2 (2018), 208–217.
[137] Milad Ramezani, Kourosh Khoshelham, and Clive Fraser. 2018. Pose estimation by omnidirectional visual-inertial
odometry. Robotics and Autonomous Systems. DOI:https://doi.org/10.1016/j.robot.2018.03.007
[138] Milad Ramezani, Kourosh Khoshelham, and Laurent Kneip. 2017. Omnidirectional visual-inertial odometry using
multi-state constraint Kalman filter. In Proceedings of the IEEE/RSJ International Conference on Intelligent Robots and
Systems (IROS’17). IEEE, 1317–1323.
[139] Valérie Renaudin, Melania Susi, and Gérard Lachapelle. 2012. Step length estimation using handheld inertial sensors.
Sensors 12, 7 (2012), 8507–8525.
[140] Christof Röhrig and Marcel Müller. 2009. Indoor location tracking in non-line-of-sight environments using an IEEE
802.15. 4a wireless network. In Proceedings of the IEEE/RSJ International Conference on Intelligent Robots and Systems
(IROS’09). IEEE, 552–557.
[141] Nirupam Roy, He Wang, and Romit Roy Choudhury. 2014. I am a smartphone and I can tell my user’s walking
direction. In Proceedings of the 12th International Conference on Mobile Systems, Applications, and Services. ACM,
329–342.
[142] Antonio Ramón Jiménez Ruiz and Fernando Seco Granja. 2017. Comparing Ubisense, BeSpoon, and DecaWave UWB
location systems: indoor performance analysis. IEEE Trans. Instrument. Measur. 66, 8 (2017), 2106–2117.
[143] Hamed Sadeghi, Shahrokh Valaee, and Shahram Shirani. 2015. Ocrapose: An indoor positioning system using smart-
phone/tablet cameras and OCR-aided stereo feature matching. In Proceedings of the IEEE International Conference on
Acoustics, Speech and Signal Processing (ICASSP’15). IEEE, 1473–1477.
[144] Hamed Sadeghi, Shahrokh Valaee, and Shahram Shirani. 2017. 2DTriPnP: A robust two-dimensional method for fine
visual localization using Google streetview database. IEEE Trans. Vehic. Technol. 66, 6 (2017), 4678–4690.
[145] Souvik Sen, Jeongkeun Lee, Kyu-Han Kim, and Paul Congdon. 2013. Avoiding multipath to revive inbuilding Wi-Fi
localization. In Proceedings of the 11th International Conference on Mobile Systems, Applications, and Services. ACM,
249–262.
[146] Shervin Shahidi and Shahrokh Valaee. 2015. Hidden Markov model based graph matching for calibration of local-
ization maps. In Proceedings of the IEEE International Conference on Communications (ICC’15). IEEE, 4606–4611.
ACM Computing Surveys, Vol. 52, No. 3, Article 64. Publication date: July 2019.
Indoor Localization Improved by Spatial Context—A Survey 64:33
[147] Jianga Shang, Fuqiang Gu, Xuke Hu, and Allison Kealy. 2015. APFiLoc: An infrastructure-free indoor localization
method fusing smartphone inertial sensors, landmarks and map information. Sensors 15, 10 (2015), 27251–27272.
[148] Jianga Shang, Xuke Hu, Wen Cheng, and Hongchao Fan. 2016. GridiLoc: A backtracking grid filter for fusing the
grid model with PDR using smartphone sensors. Sensors 16, 12 (2016), 2137.
[149] Jianga Shang, Xuke Hu, Fuqiang Gu, Di Wang, and Shengsheng Yu. 2015. Improvement schemes for indoor mobile
location estimation: A survey. Math. Prob. Eng. 2015, Article 397298 (2015). http://dx.doi.org/10.1155/2015/397298
[150] Guobin Shen, Zhuo Chen, Peichao Zhang, Thomas Moscibroda, and Yongguang Zhang. 2013. Walkie-Markie: In-
door pathway mapping made easy. In Proceedings of the 10th USENIX Conference on Networked Systems Design and
Implementation. USENIX Association, 85–98.
[151] Jia Shing Sheu, Guo Shing Huang, Wei Cian Jheng, and Chih Hung Hsiao. 2014. Design and implementation of a
three-dimensional pedometer accumulating walking or jogging motions. In Proceedings of the International Sympo-
sium on Computer, Consumer and Control (IS3C’14). IEEE, 828–831.
[152] Yuanchao Shu, Cheng Bo, Guobin Shen, Chunshui Zhao, Liqun Li, and Feng Zhao. 2015. Magicol: Indoor localization
using pervasive magnetic field and opportunistic Wi-Fi sensing. IEEE J. Select. Areas Commun. 33, 7 (2015), 1443–
1457.
[153] Sameh Sorour, Yves Lostanlen, Shahrokh Valaee, and Khaqan Majeed. 2015. Joint indoor localization and radio map
construction with limited deployment load. IEEE Trans. Mobile Comput. 14, 5 (2015), 1031–1043.
[154] Molly E. Sorrows and Stephen C. Hirtle. 1999. The nature of landmarks for real and electronic spaces. In Proceedings
of the International Conference on Spatial Information Theory. Springer, 37–50.
[155] Kalyan Pathapati Subbu, Brandon Gozick, and Ram Dantu. 2013. Locateme: Magnetic-fields-based indoor localiza-
tion using smartphones. ACM Trans. Intell. Syst. Technol. 4, 4 (2013), 73.
[156] Niko Sünderhauf, Sareh Shirazi, Adam Jacobson, Feras Dayoub, Edward Pepperell, Ben Upcroft, and Michael Milford.
2015. Place recognition with ConvNet landmarks: Viewpoint-robust, condition-robust, training-free. In Proceedings
of the 12th Conference on Robotics: Science and Systems.
[157] Ashraf Tahat, Georges Kaddoum, Siamak Yousefi, Shahrokh Valaee, and Francois Gagnon. 2016. A look at the recent
wireless positioning techniques with a focus on algorithms for moving receivers. IEEE Access 4 (2016), 6652–6680.
[158] Jean-Philippe Tardif, Michael George, Michel Laverne, Alonzo Kelly, and Anthony Stentz. 2010. A new approach
to vision-aided inertial navigation. In Proceedings of the IEEE/RSJ International Conference on Intelligent Robots and
Systems (IROS’10). IEEE, 4161–4168.
[159] Céline Teuliere, Eric Marchand, and Laurent Eck. 2015. 3-D model-based tracking for UAV indoor localization. IEEE
Trans. Cyber. 45, 5 (2015), 869–879.
[160] Don J. Torrieri. 1984. Statistical theory of passive location systems. IEEE Trans. Aero. Electron. Syst. 2 (1984), 183–198.
[161] Yu-Chih Tung and Kang G. Shin. 2015. EchoTag: Accurate infrastructure-free indoor location tagging with smart-
phones. In Proceedings of the 21st International Conference on Mobile Computing and Networking. ACM, 525–536.
[162] Barry D. Van Veen and Kevin M. Buckley. 1988. Beamforming: A versatile approach to spatial filtering. IEEE ASSP
Mag. 5, 2 (1988), 4–24.
[163] Farhang Vedadi and Shahrokh Valaee. 2017. Automatic visual fingerprinting for indoor image-based localization
applications. IEEE Trans. Syst., Man, Cyber.: Syst. 99 (2017), 1–13.
[164] Saipradeep Venkatraman and James Caffery. 2004. Hybrid TOA/AOA techniques for mobile location in non-line-
of-sight environments. In Proceedings of the IEEE Wireless Communications and Networking Conference (WCNC’04),
Vol. 1. IEEE, 274–278.
[165] He Wang, Souvik Sen, Ahmed Elgohary, Moustafa Farid, Moustafa Youssef, and Romit Roy Choudhury. 2012. No
need to war-drive: Unsupervised indoor localization. In Proceedings of the 10th International Conference on Mobile
Systems, Applications, and Services. ACM, 197–210.
[166] Xuyu Wang, Lingjun Gao, and Shiwen Mao. 2016. CSI phase fingerprinting for indoor localization with a deep
learning approach. IEEE Internet Things J. 3, 6 (2016), 1113–1123.
[167] Xuyu Wang, Lingjun Gao, Shiwen Mao, and Santosh Pandey. 2017. CSI-based fingerprinting for indoor localization:
A deep learning approach. IEEE Trans. Vehic. Technol. 66, 1 (2017), 763–776.
[168] Chin-Der Wann, Yi-Jing Yeh, and Chih-Sheng Hsueh. 2006. Hybrid TDOA/AOA indoor positioning and tracking
using extended Kalman filters. In Proceedings of the 63rd Vehicular Technology Conference (VTC’06-Spring), Vol. 3.
IEEE, 1058–1062.
[169] Roy Want, Andy Hopper, Veronica Falcao, and Jonathan Gibbons. 1992. The active badge location system. ACM
Trans. Inform. Syst. 10, 1 (1992), 91–102.
[170] Harvey Weinberg. 2002. Using the ADXL202 in pedometer and personal navigation applications. Analog Dev. AN-602
Applic. Note 2, 2 (2002), 1–6.
[171] Tobias Weyand, Ilya Kostrikov, and James Philbin. 2016. Planet-photo geolocation with convolutional neural net-
works. In Proceedings of the European Conference on Computer Vision. Springer, 37–55.
ACM Computing Surveys, Vol. 52, No. 3, Article 64. Publication date: July 2019.
64:34 F. Gu et al.
[172] Christopher E. White, David Bernstein, and Alain L. Kornhauser. 2000. Some map matching algorithms for personal
navigation assistants. Transport. Res. Part C: Emerg. Technol. 8, 1 (2000), 91–108.
[173] Moe Z. Win, R. Michael Buehrer, George Chrisikos, Andrea Conti, and H. Vincent Poor. 2018. Foundations and
trends in localization technologies—Part I. Proc. IEEE 106, 6 (2018), 1019–1021.
[174] Moe Z. Win, R. Michael Buehrer, George Chrisikos, Andrea Conti, and H. Vincent Poor. 2018. Foundations and
trends in localization technologies—Part II. Proc. IEEE 106, 7 (2018), 1132–1135.
[175] Moe Z. Win, Andrea Conti, Santiago Mazuelas, Yuan Shen, Wesley M. Gifford, Davide Dardari, and Marco Chiani.
2011. Network localization and navigation via cooperation. IEEE Commun. Mag. 49, 5 (2011).
[176] Oliver Woodman and Robert Harle. 2008. Pedestrian localisation for indoor environments. In Proceedings of the 10th
International Conference on Ubiquitous Computing. ACM, 114–123.
[177] Dan Wu, Daqing Zhang, Chenren Xu, Yasha Wang, and Hao Wang. 2016. WiDir: Walking direction estimation using
wireless signals. In Proceedings of the ACM International Joint Conference on Pervasive and Ubiquitous Computing.
ACM, 351–362.
[178] Yongfeng Wu, Pan Chen, Fuqiang Gu, Xiaoping Zheng, and Jianga Shang. 2019. HTrack: An efficient heading-
aided map matching for indoor localization and tracking. IEEE Sens. J. 19, 8 (April 2019), 3100–3110. DOI:https://doi.org/10.1109/JSEN.2019.2891313
[179] Chao Xiao, Daiqin Yang, Zhenzhong Chen, and Guang Tan. 2017. 3-D BLE indoor localization based on denoising
autoencoder. IEEE Access 5 (2017), 12751–12760.
[180] Zhuoling Xiao, Hongkai Wen, Andrew Markham, and Niki Trigoni. 2014. Lightweight map matching for indoor
localisation using conditional random fields. In Proceedings of the 13th International Symposium on Information Pro-
cessing in Sensor Networks (IPSN’14). IEEE, 131–142.
[181] Zhuoling Xiao, Hongkai Wen, Andrew Markham, and Niki Trigoni. 2015. Indoor tracking using undirected graphical
models. IEEE Trans. Mobile Comput. 14, 11 (2015), 2286–2301.
[182] Bo Xie, Kongyang Chen, Guang Tan, Mingming Lu, Yunhuai Liu, Jie Wu, and Tian He. 2016. LIPS: A light intensity–
based positioning system for indoor environments. ACM Trans. Sens. Netw. 12, 4 (2016), 28.
[183] Hongwei Xie, Tao Gu, Xianping Tao, Haibo Ye, and Jian Lv. 2014. MaLoc: A practical magnetic fingerprinting ap-
proach to indoor localization using smartphones. In Proceedings of the ACM International Joint Conference on Perva-
sive and Ubiquitous Computing. ACM, 243–253.
[184] Jie Xiong and Kyle Jamieson. 2013. ArrayTrack: A fine-grained indoor location system. In Proceedings of the 10th
USENIX Symposium on Networked Systems Design and Implementation (NSDI’13). USENIX, 71–84.
[185] Qiang Xu, Rong Zheng, and Steve Hranilovic. 2015. IDyLL: Indoor localization using inertial and light sensors on
smartphones. In Proceedings of the ACM International Joint Conference on Pervasive and Ubiquitous Computing. ACM,
307–318.
[186] Ryota Yamasaki, Atsushi Ogino, Tsuyoshi Tamaki, Takaki Uta, Naoto Matsuzawa, and Takeshi Kato. 2005. TDOA
location system for IEEE 802.11 b WLAN. In Proceedings of the Wireless Communications and Networking Conference,
Vol. 4. IEEE, 2338–2343.
[187] Zheng Yang, Chenshu Wu, and Yunhao Liu. 2012. Locating in fingerprint space: Wireless indoor localization with
little human intervention. In Proceedings of the 18th International Conference on Mobile Computing and Networking.
ACM, 269–280.
[188] Zheng Yang, Chenshu Wu, Zimu Zhou, Xinglin Zhang, Xu Wang, and Yunhao Liu. 2015. Mobility increases localiz-
ability: A survey on wireless indoor localization using inertial sensors. ACM Comput. Surv. 47, 3 (2015), 54.
[189] Zheng Yang, Zimu Zhou, and Yunhao Liu. 2013. From RSSI to CSI: Indoor localization via channel response. ACM
Comput. Surv. 46, 2 (2013), 25.
[190] Moustafa Youssef and Ashok Agrawala. 2005. The Horus WLAN location determination system. In Proceedings of
the 3rd International Conference on Mobile Systems, Applications, and Services. ACM, 205–218.
[191] Chunyang Yu, Haiyu Lan, Fuqiang Gu, Fei Yu, and Naser El-Sheimy. 2017. A map/INS/Wi-Fi integrated system for
indoor location-based service applications. Sensors 17, 6 (2017), 1272.
[192] Faheem Zafari, Athanasios Gkelias, and Kin Leung. 2017. A survey of indoor localization systems and technologies.
Retrieved from: arXiv preprint arXiv:1709.01015.
[193] Hemin Zhang, Weizheng Yuan, Qiang Shen, Tai Li, and Honglong Chang. 2015. A handheld inertial pedestrian
navigation system with accurate step modes and device poses recognition. IEEE Sens. J. 15, 3 (2015), 1421–1429.
[194] Yuanqing Zheng, Guobin Shen, Liqun Li, Chunshui Zhao, Mo Li, and Feng Zhao. 2017. Travi-navi: Self-deployable
indoor navigation system. IEEE/ACM Trans. Netw. 25, 5 (2017), 2655–2669.
[195] Baoding Zhou, Qingquan Li, Qingzhou Mao, Wei Tu, Xing Zhang, and Long Chen. 2015. ALIMC: Activity landmark-
based indoor mapping via crowdsourcing. IEEE Trans. Intell. Transport. Syst. 16, 5 (2015), 2774–2785.
[196] Pengfei Zhou, Yuanqing Zheng, Zhenjiang Li, Mo Li, and Guobin Shen. 2012. Iodetector: A generic service for indoor
outdoor detection. In Proceedings of the 10th ACM Conference on Embedded Network Sensor Systems. ACM, 113–126.
ACM Computing Surveys, Vol. 52, No. 3, Article 64. Publication date: July 2019.
Indoor Localization Improved by Spatial Context—A Survey 64:35
[197] Yuan Zhuang, Jun Yang, You Li, Longning Qi, and Naser El-Sheimy. 2016. Smartphone-based indoor localization
with Bluetooth low energy beacons. Sensors 16, 5 (2016), 596.
[198] Han Zou, Hao Jiang, Yiwen Luo, Jianjie Zhu, Xiaoxuan Lu, and Lihua Xie. 2016. Bluedetect: An iBeacon-enabled
scheme for accurate and energy-efficient indoor-outdoor detection and seamless location-based service. Sensors 16,
2 (2016), 268.
Received September 2018; revised January 2019; accepted March 2019
ACM Computing Surveys, Vol. 52, No. 3, Article 64. Publication date: July 2019.
Related Documents