Saimaa University of Applied Sciences Business Administration, Lappeenranta Degree Programme in International Business Management Riikka Eerola Visual Marketing Case: Karhulanlehto Ltd. Master’s Thesis 2015

Welcome message from author
This document is posted to help you gain knowledge. Please leave a comment to let me know what you think about it! Share it to your friends and learn new things together.
Transcript

Saimaa University of Applied Sciences Business Administration, Lappeenranta Degree Programme in International Business Management Riikka Eerola
Visual Marketing Case: Karhulanlehto Ltd. Master’s Thesis 2015
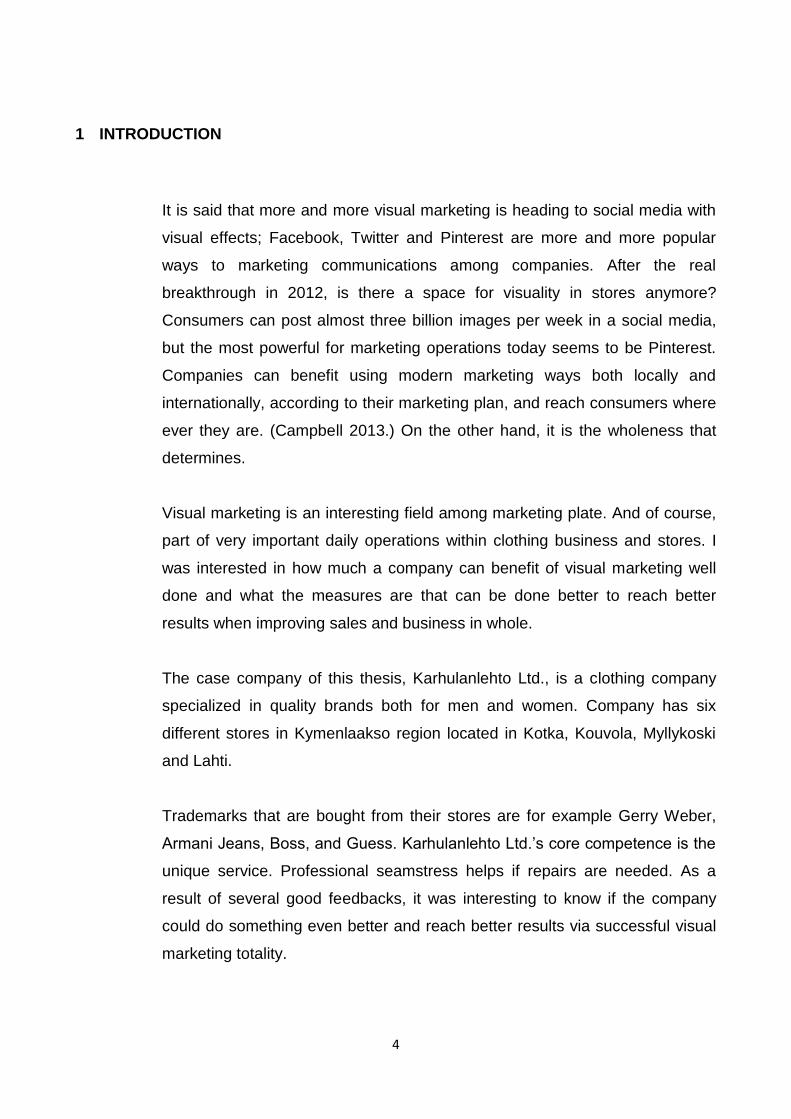
Abstract
Riikka Eerola
Visual marketing: Case Karhulanlehto Ltd.
59 pages, 4 appendices
Saimaa University of Applied Sciences
Business Administration, Lappeenranta
Degree Programme in International Business Management
Master’s Thesis 2015
Instructor: Senior Lecturer Mr Sami Lanu, Saimaa University of Applied Sciences
The retail environment can be regard the most important marketing communication tool for fashion business, especially because consumer experiences this environment with all his or her senses. Visual merchandising as a part of the visual marketing and communications is possible to define what customer sees and experiences when reaching, entering and passing by in the store. Marketing elements in retail environment must be very important; it is said that even 70 per cent of the purchase decision is made in the fashion store; although it is impossible to say if there has been pushing elements like advertising, PR, friends, or just habits to purchase.
The aim of this thesis was to find out the case company’s statement of visual marketing today and clarify development needs for the future. Two stores of the whole chain were under investigation and the results can be exploited in those stores in the near future.
This thesis has been carried out as a functional thesis, and as a case study, due to commissioner’s needs. The theoretical framework consists of consumer behavior and customer relationship; things that affect consumer behavior, description of consumer’s buying process and customer relationship. Specialties on marketing fashion in retail store environment and visual marketing; description of what is visual marketing, meaning of visual marketing in a retail fashion store environment and definition of the AIDA –model used in successful marketing operations. Empirical part consists of theme interviews of the Karhulanlehto Ltd.’s personnel and a questionnaire for company’s customers. The final conclusions and recommendations for the future are gathered from the study results. Overall, we can say that despite the unit, personnel is considered as professional and the service as high quality. Consumers want to shop in a store where cleanliness and clarity are the main functions. Colors and brands well-presented are those things that attract to consume in the future, too. Keywords: consumer behavior, visual marketing, retail fashion business

Table of Contents
1 INTRODUCTION ............................................................................................................... 4
2 RESEARCH OBJECTIVES AND METHODOLOGY ......................................................... 5
2.1 Objective, research questions and delimitations .................................................. 5
2.2 Theoretical framework ......................................................................................... 5
2.3 Research method ................................................................................................ 6
2.4 Structure of the study .......................................................................................... 7
3 CONSUMER BEHAVIOUR AND CUSTOMER RELATIONSHIP ...................................... 8
3.1 Things that affect consumer behavior .................................................................. 8
3.2 Consumer buying process ................................................................................. 11
3.3 Customer relationship ........................................................................................ 13
4 MARKETING FASHION IN RETAIL STORE ENVIRONMENT ....................................... 15
5 VISUAL MARKETING ..................................................................................................... 18
5.1 What is visual marketing? .................................................................................. 18
5.2 Meaning of a visual marketing in a fashion store ............................................... 19
5.3 AIDA –model ..................................................................................................... 21
6 VISUAL MARKETING IN KARHULANLEHTO LTD. ....................................................... 23
6.1 Presentation of the case company .................................................................... 23
6.2 Visual marketing research via AIDA- model ...................................................... 24
6.2.1 Description of the process ........................................................................ 25
6.2.2 Visual marketing in Karhula store, results and conclusions ...................... 27
6.2.3 Visual marketing in Pasaati store, results and conclusions ...................... 42
6.3 Recommendations for the future ....................................................................... 56
REFERENCES .................................................................................................................. 58
APPENDICES
Appendix 1 Interview of the visualist in Finnish
Appendix 2 Interview of the personnel in Finnish
Appendix 3 Questionnaire for Karhula store customers in Finnish
Appendix 4 Questionnaire for Pasaati store customers in Finnish
4
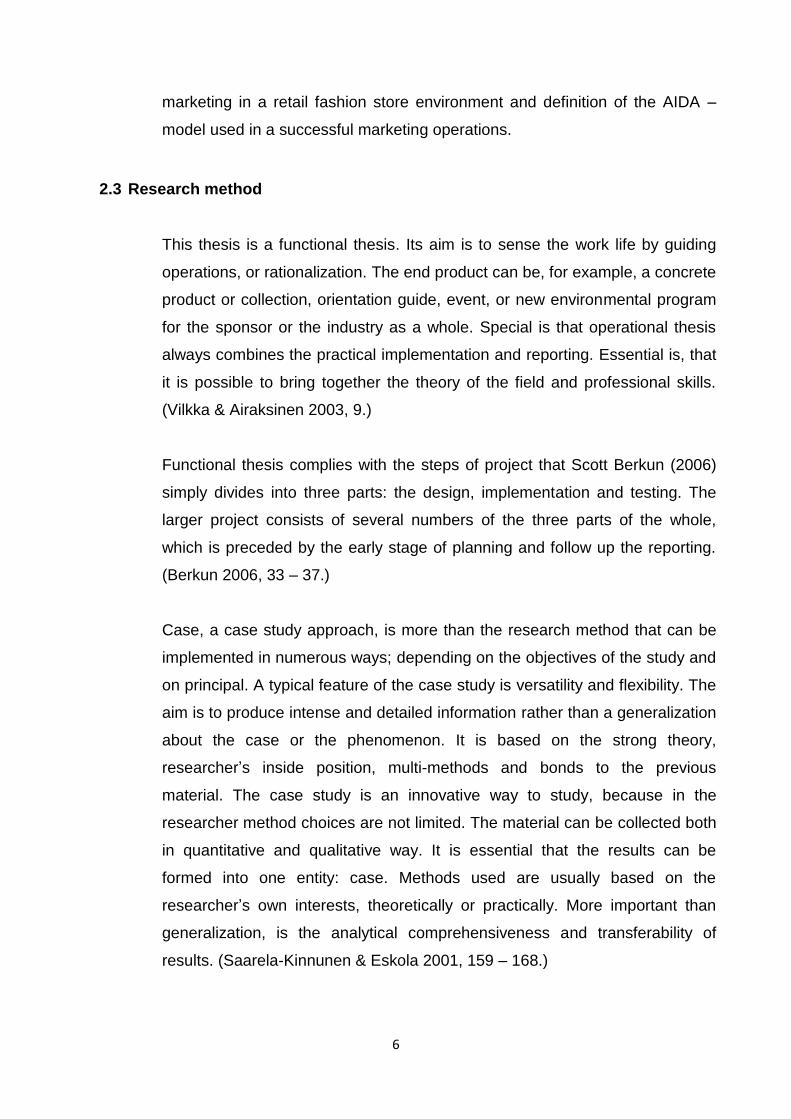
1 INTRODUCTION
It is said that more and more visual marketing is heading to social media with
visual effects; Facebook, Twitter and Pinterest are more and more popular
ways to marketing communications among companies. After the real
breakthrough in 2012, is there a space for visuality in stores anymore?
Consumers can post almost three billion images per week in a social media,
but the most powerful for marketing operations today seems to be Pinterest.
Companies can benefit using modern marketing ways both locally and
internationally, according to their marketing plan, and reach consumers where
ever they are. (Campbell 2013.) On the other hand, it is the wholeness that
determines.
Visual marketing is an interesting field among marketing plate. And of course,
part of very important daily operations within clothing business and stores. I
was interested in how much a company can benefit of visual marketing well
done and what the measures are that can be done better to reach better
results when improving sales and business in whole.
The case company of this thesis, Karhulanlehto Ltd., is a clothing company
specialized in quality brands both for men and women. Company has six
different stores in Kymenlaakso region located in Kotka, Kouvola, Myllykoski
and Lahti.
Trademarks that are bought from their stores are for example Gerry Weber,
Armani Jeans, Boss, and Guess. Karhulanlehto Ltd.’s core competence is the
unique service. Professional seamstress helps if repairs are needed. As a
result of several good feedbacks, it was interesting to know if the company
could do something even better and reach better results via successful visual
marketing totality.

5
2 RESEARCH OBJECTIVES AND METHODOLOGY
This chapter is for the research objectives and methodology and it consists of
objective of the study, research questions and delimitations concerning the
whole process. Theoretical framework of the research is presented and a
research method chosen. Structure of the study gathers the whole thesis
together.
2.1 Objective, research questions and delimitations
The aim of this thesis is to find out the efficiency of the visual marketing in
Karhulanlehto Ltd. at the moment and the key points that need to be
developed for the successful future marketing. Result of this thesis will be the
recommendations and results of the study for the future actions. The research
questions are:
What is the state of the company’s visual marketing in Karhula store
and in Pasaati store today
How visual marketing can be developed in these two stores for the
future
This study only considers two stores of total six of the whole chain, so clear
picture of the whole chain’s state of the visuality cannot be drawn. It is not
possible to reach all the customers that may want to answer, so the responses
need to be considered as a guideline for the future actions.
2.2 Theoretical framework
Theoretical framework of this thesis consists of three different sections.
Number one is about consumer behavior and customer relationship; things
that have effect on consumer behavior, description of consumer’s buying
process and customer relationship. Second section discusses the specialties
of marketing fashion in retail store environment. Third part is about visual
marketing; description of what is visual marketing, meaning of visual
6
marketing in a retail fashion store environment and definition of the AIDA –
model used in a successful marketing operations.
2.3 Research method
This thesis is a functional thesis. Its aim is to sense the work life by guiding
operations, or rationalization. The end product can be, for example, a concrete
product or collection, orientation guide, event, or new environmental program
for the sponsor or the industry as a whole. Special is that operational thesis
always combines the practical implementation and reporting. Essential is, that
it is possible to bring together the theory of the field and professional skills.
(Vilkka & Airaksinen 2003, 9.)
Functional thesis complies with the steps of project that Scott Berkun (2006)
simply divides into three parts: the design, implementation and testing. The
larger project consists of several numbers of the three parts of the whole,
which is preceded by the early stage of planning and follow up the reporting.
(Berkun 2006, 33 – 37.)
Case, a case study approach, is more than the research method that can be
implemented in numerous ways; depending on the objectives of the study and
on principal. A typical feature of the case study is versatility and flexibility. The
aim is to produce intense and detailed information rather than a generalization
about the case or the phenomenon. It is based on the strong theory,
researcher’s inside position, multi-methods and bonds to the previous
material. The case study is an innovative way to study, because in the
researcher method choices are not limited. The material can be collected both
in quantitative and qualitative way. It is essential that the results can be
formed into one entity: case. Methods used are usually based on the
researcher’s own interests, theoretically or practically. More important than
generalization, is the analytical comprehensiveness and transferability of
results. (Saarela-Kinnunen & Eskola 2001, 159 – 168.)
7
Theme interview has been one of the most popular ways to gather information
during several years. Instead of making questions and getting answers, theme
interview gives a possibility to get a qualitative data with a high usability for the
research question or explaining a certain phenomenon. Themes for the
interview are decided beforehand, but a strict order of the questions is
missing. It is the research question that covers the questions asked to whole
one entity. Theme interview is always more like a conversation, whose leader
is the researcher; all the designed themes must go through and it is a
responsibility of the researcher to get the information needed for the study.
Theme interview can give rich, versatile and honest information for the study
and the researcher can observe reactions at the same time. On the other
hand, weaknesses can be seen too; theme can be so hard to understand that
interviewee just cannot answer properly, there might be external interferences
or maybe the chemistry between the interviewer and the interviewee does not
just work and the results can be weak. (Eskola & Vastamäki 2001, 24 – 34.)
With questionnaires, it is possible to gather standardized information of certain
phenomena or just get more information about facts, actions, and ways of
behaviors, attitudes, beliefs and opinions; as well as arguments and
assessments affecting background. It is an efficient and good way to get wide
range of information quickly. With a good technique, it is also cost efficient and
a quite predictable way to gather information. Negative point of getting
information via questionnaires is that there might be high per cent of non-
responses, or target group may not want to answer properly at all. The
questionnaire may not be as tested as possible beforehand and the key
research questions may remain in the dark. (Hirsjärvi & Remes & Sajavaara
2004, 182 – 186.)
2.4 Structure of the study
This study begins with the theory part concerning consumer behavior and
customer relationship; inside these chapter things that have an effect on
consumer behavior, consumer’s buying process and customer relationship are
presented. Next step is to create a picture of specialties of marketing fashion
8
in retail store environment and then, visual marketing is handled. Inside visual
marketing chapter, at first, definition of visual marketing is clarified, meaning of
the visual marketing is told and successful AIDA –marketing model presented.
Empirical part of the study begins with the presentation of the case company,
after that, research of the visual marketing is done and finally results are
revealed and recommendations for the future given.
3 CONSUMER BEHAVIOUR AND CUSTOMER RELATIONSHIP
Consumer is usually seen as the person who identifies a need, searches for a
purchase to satisfy the need, buys the product and after that, consumes the
product. But in many cases different individuals can be involved in this chain.
(Noel 2009, 12.)
Consumer behavior tells how individuals acquire, use and dispose of company
offerings. Goods and services can be acquired through purchase, leasing or
borrowing. (Noel 2009, 13.)
3.1 Things that affect consumer behavior
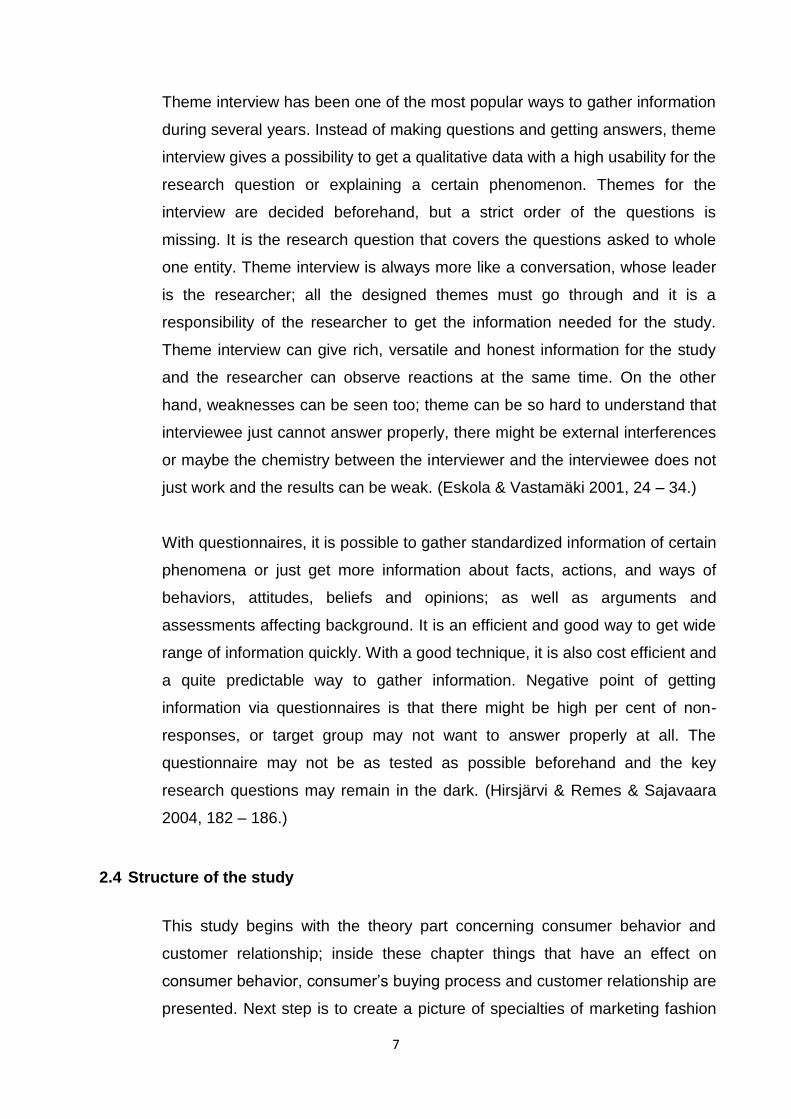
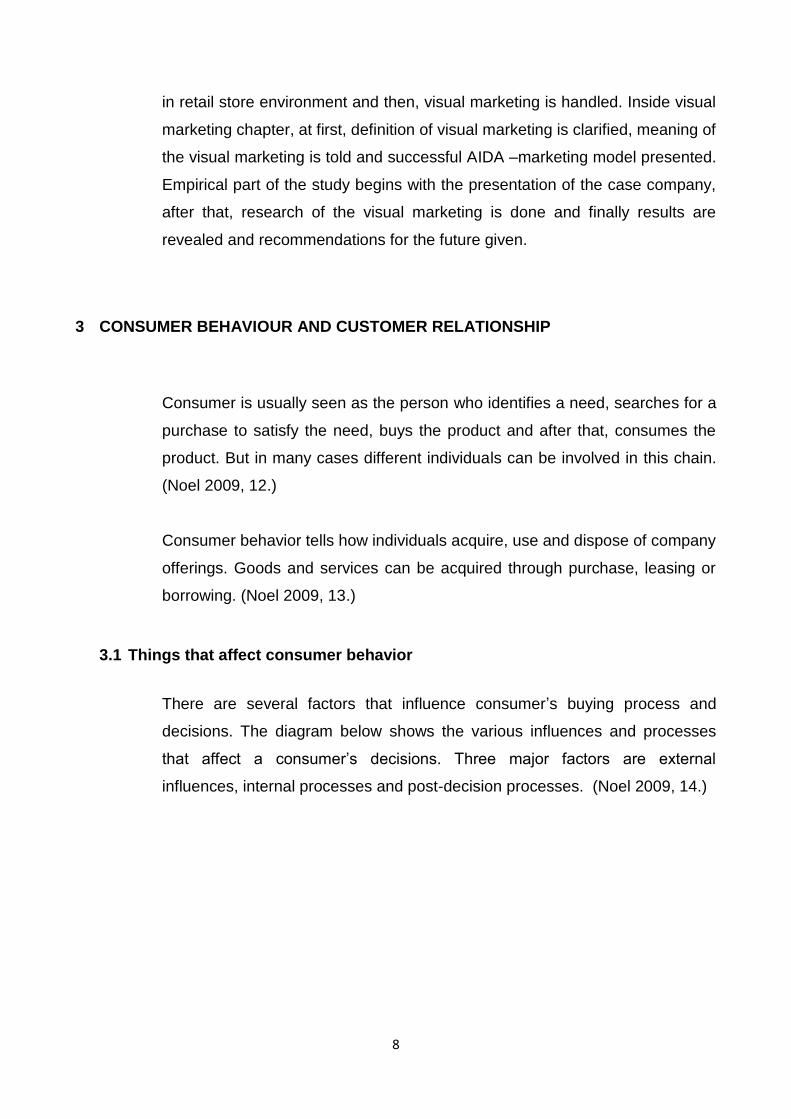
There are several factors that influence consumer’s buying process and
decisions. The diagram below shows the various influences and processes
that affect a consumer’s decisions. Three major factors are external
influences, internal processes and post-decision processes. (Noel 2009, 14.)
9
Picture 1. The model of consumer behavior (Noel 2009, 15)
External influences can be categorizes mainly into two different sectors; the
efforts of the companies and the various factors that affect the consumer’s
culture. Marketing mix is used to influence consumers’ mind and thoughts,
price, place, promotion and product are not affected by of the individual needs
and consumer’s background. Culture has an enormous impact on many
aspects of customer behavior; it is shared and learned symbolic system of
values, beliefs and attitudes that influence our behavior. Customers have
attitudes and values depending on the group to which they belong, culture can
influence the way we perceive and process information given. Religion can
provide a structured set of values and beliefs that help individuals make their
choices. Age and gender reflect mainly the choices consumers make between
different technologies for example. Reference groups have a significant
impact when consumer is processing the buying in his or her mind. Some
consumers may want try to indicate which social class they belong by
consuming only certain type of products, on the other hand, some consumers
simply have more wealth and opportunities to buy products and services.
(Noel 2009, 16 – 17.)
Internal processes are psychological factors that affect every individual in the
process of decision making and consuming. They can be divided into
psychological processes and the decision making process itself. Motivation is
settled towards achieving the certain goal – getting a certain product for
External influences
•Firm's marketing efforts
•Product, Promotion, Price, Place
• The consumer's culture
•Religion, Ethnicity, Reference groups, Social class
Internal processes
•Psychological processes
• Motivation, Perception, Attitudes, Knowledge
• Decision making
• Problem recognition, Information search, Judgment, Decision making
Post-decision processes
• Purchase
• Post-purchase behaviour
10
example. Perception means paying attention to the information given
concerning the goal. Knowledge reflects the information the consumer gathers
concerning different brands, product categories and companies. Consumers
often organize the knowledge into similar object categories. Attitudes towards
products do not always mean making purchase, but they may change over
time and that is why they are so important when designing marketing.
Memories form a great storage of information and knowledge about services,
products, shopping and product usage experiences, this information will be
used when evaluating different available options. Internal processes also
consist of the traditional decision making process that is analyzed deeper later
on. (Noel 2009, 18 – 21.)
Once the decision making process has gone through, it is time for post-
decision processes. Company’s responses to the customer’s behavior after
consumption have a remarkable role when speaking about the success of the
business. One customer with a negative feeling can lead to loss of ten
consumers, on average. (Noel 2009, 23.)
Customers can be roughly divided into two categories. The first want ease of
doing business, while others seek experiences. The one who turns to the
familiar and safe service is rarely comparing or changing opportunities.
Commitment to a safe and familiar option can be seen the a meaning of
easiness. Well-informed and demanding customers are curious and trend-
conscious experience seekers. In them lays the challenge for marketers,
because even though the commitment is difficult, it is they who are willing to
spend the money when finding a comfortable solution. The role of selection is
based on how important the product is to the customer. The more relevant
and personalized product is, the more important it is to stand out from other
product providers. For the customer is not at all indifferent with whom he
visits. (Mattinen & Sierla 2009, 26.)
Companies must go beyond the various influences that affect consumers’
buying process and have deep understanding of how consumers actually
make their decisions. It is not relevant who makes the buying decision, what
11
the types of buying decisions are and what the stages of the buying process
are. Smart organizations research the process of consuming; it can be asked
when the consumer first came acquainted with the product and brand, how
involved he or she is and what the beliefs are with the brand, how the
consumer makes the choice and how satisfied he was afterwards. (Kotler
2001, 96, 98.)
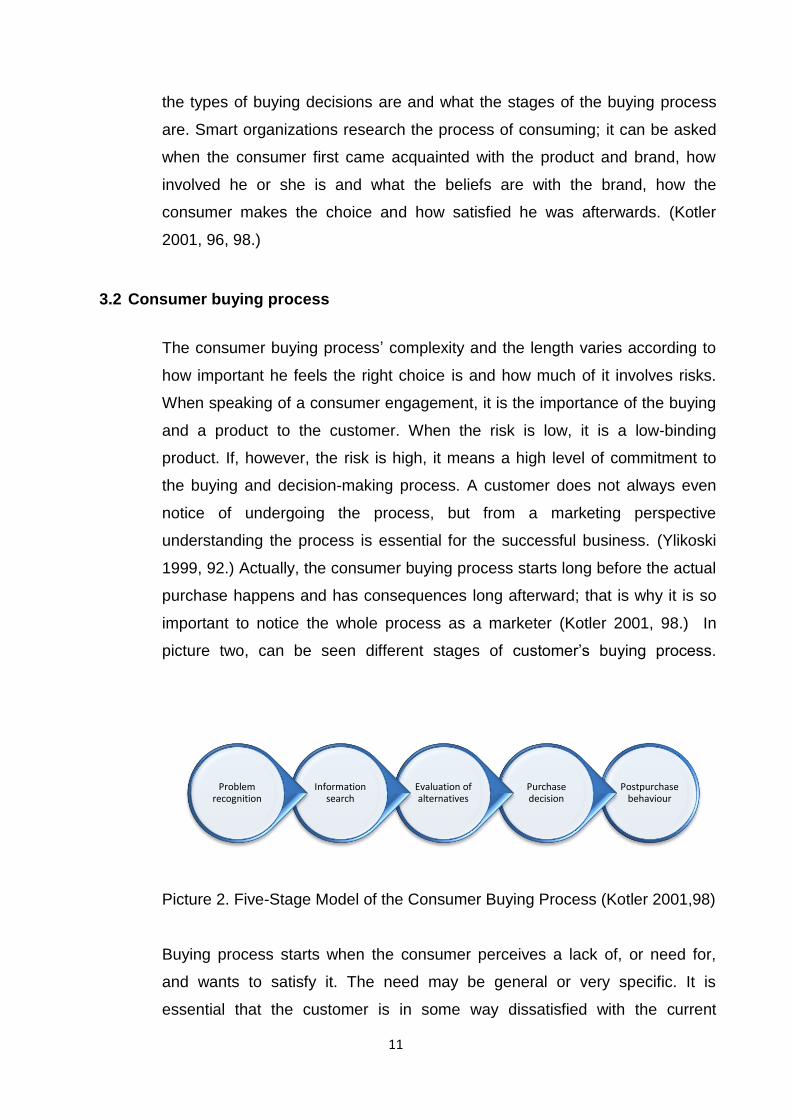
3.2 Consumer buying process
The consumer buying process’ complexity and the length varies according to
how important he feels the right choice is and how much of it involves risks.
When speaking of a consumer engagement, it is the importance of the buying
and a product to the customer. When the risk is low, it is a low-binding
product. If, however, the risk is high, it means a high level of commitment to
the buying and decision-making process. A customer does not always even
notice of undergoing the process, but from a marketing perspective
understanding the process is essential for the successful business. (Ylikoski
1999, 92.) Actually, the consumer buying process starts long before the actual
purchase happens and has consequences long afterward; that is why it is so
important to notice the whole process as a marketer (Kotler 2001, 98.) In
picture two, can be seen different stages of customer’s buying process.
Picture 2. Five-Stage Model of the Consumer Buying Process (Kotler 2001,98)
Buying process starts when the consumer perceives a lack of, or need for,
and wants to satisfy it. The need may be general or very specific. It is
essential that the customer is in some way dissatisfied with the current
Postpurchase behaviour
Purchase decision
Evaluation of alternatives
Information search
Problem recognition
12
situation and willing to change it. What is needed is a stimulus to initiate the
process. Marketing communication methods can be used to get the consumer
more aware of their own situation, awake and understand the current
dissatisfaction. Once the customer has identified the needs, he will search
information about the available options that might satisfy his or her
dissatisfaction. The first thing he will react is the memory trace, which is the
so-called "internal" information, possible previous experience. Only when he
starts to search for information to support the decision-making process, starts
the so-called "external" data exploration. (Ylikoski 1999, 96 – 97.) Internal
stimuli can be so simple as feeling hungry or thirsty, external stimuli can be
noticed via advertising. By gathering information from the customers,
marketers can identify the most frequent stimuli that rises interest in a product
category, afterwards marketing strategies can be focused better in order to
reach the second stage in the buying process. (Kotler 2001, 98.)
For the effectiveness of the company's marketing communication, it is
essential to differentiate between the client's needs, desires, and intentions.
After customer’s recognition, company needs to blow the customer's need by
communicating the company's products and services. The need, therefore, is
not enough. The intentions are like New Year's promises, which are, after all,
not lead in to anything concrete. The marketer must be able to eliminate and
redirect its energy to key processes. (Rissanen 2006, 56.)
The largest number of information the consumer gets, comes through the
marketing communication of the enterprises. Information given is especially
important in the early stages of information retrieval and prior to making the
important decision. Advertisement utility will come up in the form in which it is
presented and how much of the essential information has been incorporated.
Customer service’s role is the most important when speaking about high risk
products. (Ylikoski 1999, 99.) In a milder stage of information search a
consumer just becomes more receptive to information about a product or
service, active searching means surfing the Internet, talking with friends, and
visiting stores just to get more information to support the decision. Consumer’s
information sources include personal, commercial, public and experimental
13
sources, when gathering information a customer usually becomes more and
more aware about the competing companies, brands and services. (Kotler
2001, 98.)
When the consumer has done the information search, how does he or she
make the final decision? There can be seen several evaluation processes,
that usually are based on rational consciousness. (Kotler 2001, 99.) When
processing a product selection, the client estimates the core benefit; how well
the chosen product will satisfy the need. The consumer also measures the
quality and the price of the chosen product and weighs if he or she is ready to
pay the price asked. The selection will be done when the offered product or
service characteristics meet the expectations of its customers and benefit
criteria. (Ylikoski 1999, 103.) However, the final decision can be made based
on different factors; first one is the attitude of others, second one is
unanticipated situational factors that may cause to change the purchase
decision, and the third one perceived risk that varies with the amount of
money at stake (Kotler 2001, 100.)
After purchasing the consumer reaches the final stage of the process – post
purchase behavior. At this stage the customer feels satisfaction or
dissatisfaction out of the consuming. Companies must monitor post purchase
satisfaction, actions and product uses. Marketer’s job does not stop on the
level of buying, but continues at this stage, in order to keep the customer
relationship lively and strong. (Kotler 2001, 101.)
3.3 Customer relationship
Customer relationship is teamwork between a consumer and the service
provider. Good customer relationship requires a long-term collaboration, which
assumes both parties to benefit from the situation. Creating a customer
relationship is always driven by marketing. (Rissanen, 2006, 47 – 48.)
The first step for the company is to find the right customers on the market via
marketing operations. Second step is to create customer relationship via
14
everyday business and building of trust between the company and the
customer. In the third stage, the emphasis is on customer maintenance and
deepening, which often means the sharing of profit and success with the
customer. (Rissanen 2006, 48 – 49.) There are five processes that can be
underlined: the economic, technical, social, legal and environmental. In the
first stage, the content of communications can be selected depending on the
company image wanted to point out for the potential new customers;
ecologically can be selected one of the messages. The second phase of
economy can be just to get the client to the company. The third step can pay
particular attention to the social process in which the customer feels him or
herself more than just a consumer for the company. (Rissanen, 2006, 48 –
49.)
The business benefits from a customer orientation. According to research, firm
customer orientation is directly related to its profitability. It also contributes to
the staff's commitment to the organization and increases customer loyalty. On
the other hand, customer orientation needs to be understood as the guiding
philosophy of the whole organization and an implementation of the marketing
strategy chosen. The starting point is to meet the needs of customers so that
the company itself will benefit from it. Successful organization will be able to
identify customers' needs and desires, to communicate in their own capacity
as well as to satisfy these consumer needs in a competitive manner. (Ylikoski
1999, 33 – 35.)
Customer orientation requires the organization to the following issues:
• information: customer-centric organization to understand their customers'
needs and factors affecting purchasing decisions.
• liability: The organization must be able to respond to the needs of customers
of the enterprise.
• coordinated decisions and commitment to these decisions: customer focus
throughout the organization of a series of processes rather than specific
measures.
• knowledge and resources to meet the needs of customers using the best
means possible.
15
• understanding of the broad concept of competition, then the organization
itself, as well as customers point of view. (Ylikoski 1999, 38.)
Customer focus needs always be visible to the customer. Client must feel that
he is served, and wanted to be served, and his very needs and wishes as well
as their implementation meet genuine interest. We can also talk about a
culture of service in which the customer's interest is one of the basic
assumptions. (Ylikoski 1999, 41, 43.)
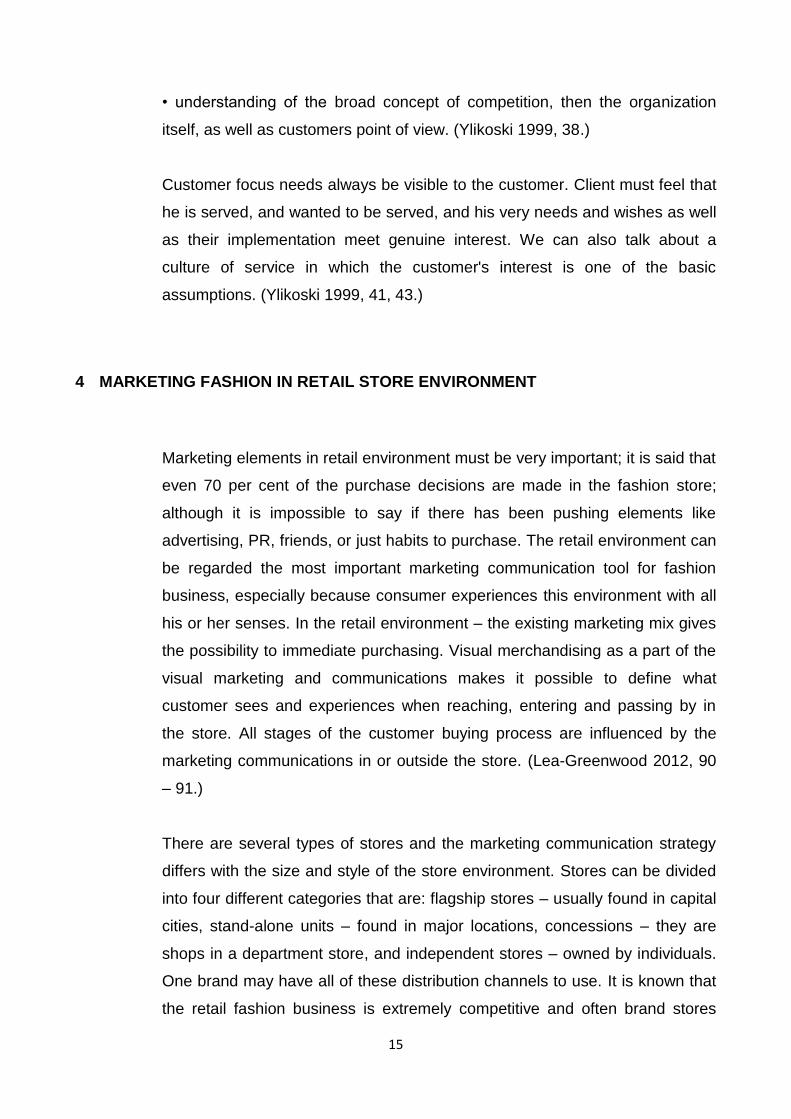
4 MARKETING FASHION IN RETAIL STORE ENVIRONMENT
Marketing elements in retail environment must be very important; it is said that
even 70 per cent of the purchase decisions are made in the fashion store;
although it is impossible to say if there has been pushing elements like
advertising, PR, friends, or just habits to purchase. The retail environment can
be regarded the most important marketing communication tool for fashion
business, especially because consumer experiences this environment with all
his or her senses. In the retail environment – the existing marketing mix gives
the possibility to immediate purchasing. Visual merchandising as a part of the
visual marketing and communications makes it possible to define what
customer sees and experiences when reaching, entering and passing by in
the store. All stages of the customer buying process are influenced by the
marketing communications in or outside the store. (Lea-Greenwood 2012, 90
– 91.)
There are several types of stores and the marketing communication strategy
differs with the size and style of the store environment. Stores can be divided
into four different categories that are: flagship stores – usually found in capital
cities, stand-alone units – found in major locations, concessions – they are
shops in a department store, and independent stores – owned by individuals.
One brand may have all of these distribution channels to use. It is known that
the retail fashion business is extremely competitive and often brand stores
16
tend to gather together for example in one street via gender of the consumers
and target groups. (Lea-Greenwood 2012, 91 – 92.)
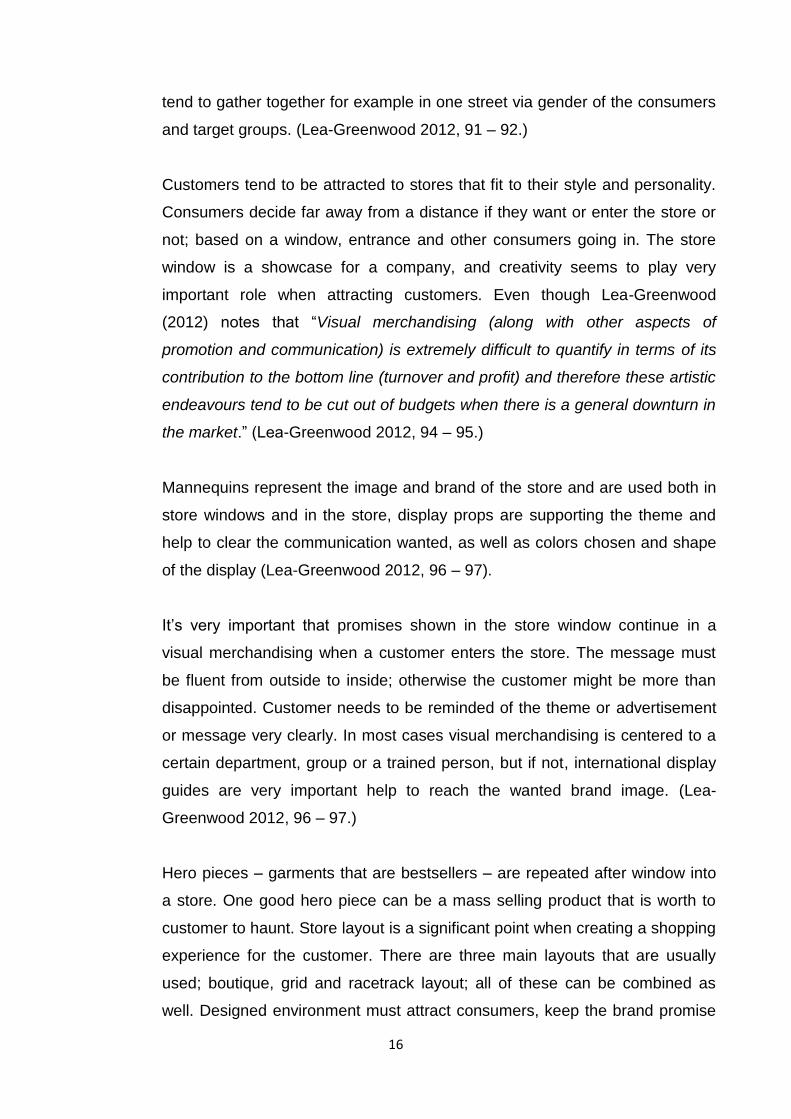
Customers tend to be attracted to stores that fit to their style and personality.
Consumers decide far away from a distance if they want or enter the store or
not; based on a window, entrance and other consumers going in. The store
window is a showcase for a company, and creativity seems to play very
important role when attracting customers. Even though Lea-Greenwood
(2012) notes that “Visual merchandising (along with other aspects of
promotion and communication) is extremely difficult to quantify in terms of its
contribution to the bottom line (turnover and profit) and therefore these artistic
endeavours tend to be cut out of budgets when there is a general downturn in
the market.” (Lea-Greenwood 2012, 94 – 95.)
Mannequins represent the image and brand of the store and are used both in
store windows and in the store, display props are supporting the theme and
help to clear the communication wanted, as well as colors chosen and shape
of the display (Lea-Greenwood 2012, 96 – 97).
It’s very important that promises shown in the store window continue in a
visual merchandising when a customer enters the store. The message must
be fluent from outside to inside; otherwise the customer might be more than
disappointed. Customer needs to be reminded of the theme or advertisement
or message very clearly. In most cases visual merchandising is centered to a
certain department, group or a trained person, but if not, international display
guides are very important help to reach the wanted brand image. (Lea-
Greenwood 2012, 96 – 97.)
Hero pieces – garments that are bestsellers – are repeated after window into
a store. One good hero piece can be a mass selling product that is worth to
customer to haunt. Store layout is a significant point when creating a shopping
experience for the customer. There are three main layouts that are usually
used; boutique, grid and racetrack layout; all of these can be combined as
well. Designed environment must attract consumers, keep the brand promise

17
and keep the customers inside store as long as possible. (Lea-Greenwood
2012, 97 – 103.)
The powers of senses have been noticed by fashion retailers, too. Visual
stimulation is the way environment communicates and that is why it is so
important in terms of garment and color design. We react 70 per cent to what
we see, instead of 30 per cent to what we hear. By handling a garment, we
imagine what it would feel like having it as our own, tables full of products are
invitations to touch and buy the product. Music is for keeping customers
moving rapidly or just calm down, and are carefully selected to the target.
Smells can raise memories and are one of the key issues when speaking
about boosting purchasing experience, chain stores all around Europe can
smell exactly the same intentionally. (Lea-Greenwood 2012, 103 – 106.)
Store personnel communicates the brand image through their personality and
appearance, they can be considered as the personification of the brand; that
is why it is so important to hire right persons to serve the certain target market.
Despite the professional personnel in chain stores, many brands sell their
products in online stores, too. (Lea-Greenwood 2012, 107.) There are
consumers who rather spend their time shopping in Internet than entering a
retail store environment. There are huge possibilities to reach greater amount
of consumers via social media and offering a possibility to shop online twenty-
four hours per day. As Lea-Greenwood (2012) says: “A number of interactive
mirrors are in various stages of development. Some simply suggest add-on
purchases; others share choices with social media friends, so the customer
can get real-time advice from friends who are far away.”
Visual merchandising becomes visual marketing when all aspects of the visual
brand image wanted are reinforced all over the environment. Consumer needs
to know what the themes and stories a company wants to tell are – without no
doubts where she or he is. Message must be clear all in all, everywhere. (Lea-
Greenwood 2012, 98.)

18
5 VISUAL MARKETING
Our world is visual. We use our eyes to deal with the content that influences
our behavior, tempers our reaction, and informs the decisions made. The most
effective ways to market products or services are those that crab our attention.
(Shain, Campbell & Langton 2011.)
With the exploring growth of the technology, the way of transmitting and
consuming information is changing. More and more, companies use social
media and different mobile Apps to create a visual relationship with the buying
customer and keeping the good contact on. That increases the product sales
and enhances brand engagement. Wherever the customer is, companies are
with them. (Shain, Campbell & Langton 2011, 9-10, 62.)
5.1 What is visual marketing?
Visual marketing is a part of the company’s whole marketing entity, completing
the marketing palette with the visual stimulus. The idea of the visual marketing
is to illustrate the company's identity and products. Visual merchandising
shows as a display and presentation of the products, showing the prices,
guiding customers to testing and pushing for the acquisition. At the same time
it presents the company's service culture and style, as well as the values
contained in the various visual means. (Nieminen 2010, 8-9.)
Visual marketing:
is based on the company's business idea, image and marketing plan
follows the annual marketing plan and different theme campaigns
planned
strengthens the company's image by means of a visual language
strengthens the customer’s willingness to purchase with attractive
product displays
is implemented with the same form in different locations and with the
same concept (Nieminen 2010, 161).
19
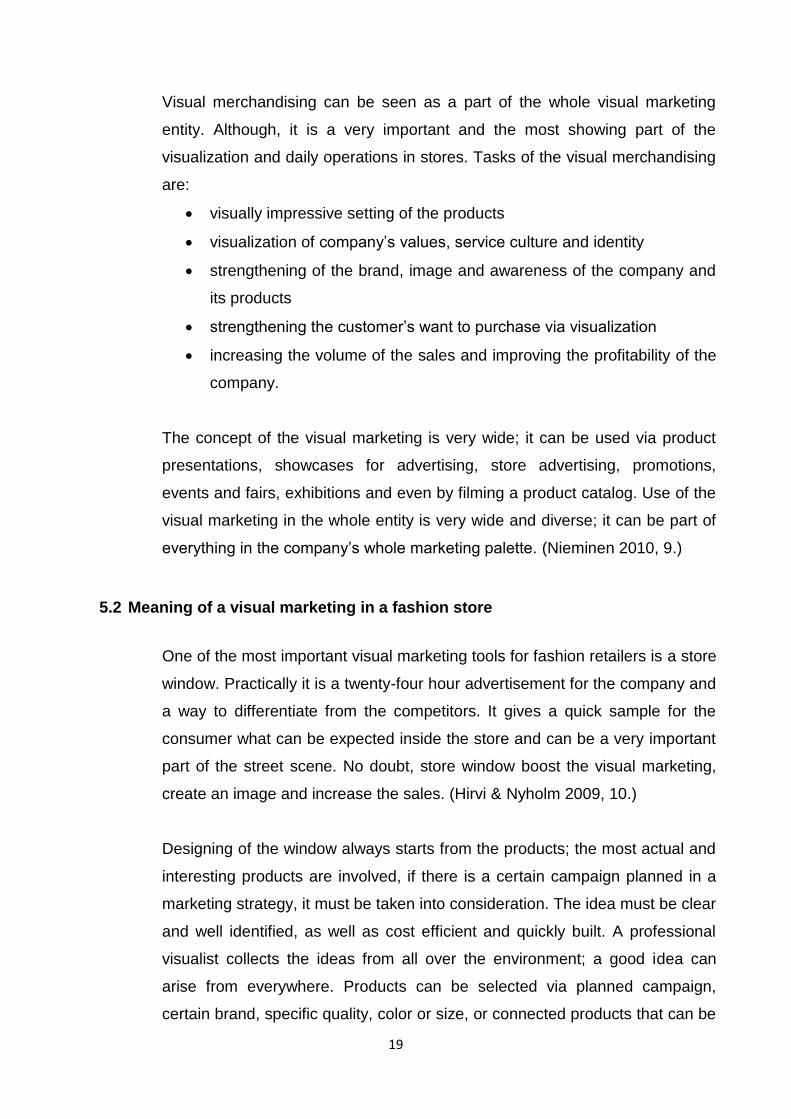
Visual merchandising can be seen as a part of the whole visual marketing
entity. Although, it is a very important and the most showing part of the
visualization and daily operations in stores. Tasks of the visual merchandising
are:
visually impressive setting of the products
visualization of company’s values, service culture and identity
strengthening of the brand, image and awareness of the company and
its products
strengthening the customer’s want to purchase via visualization
increasing the volume of the sales and improving the profitability of the
company.
The concept of the visual marketing is very wide; it can be used via product
presentations, showcases for advertising, store advertising, promotions,
events and fairs, exhibitions and even by filming a product catalog. Use of the
visual marketing in the whole entity is very wide and diverse; it can be part of
everything in the company’s whole marketing palette. (Nieminen 2010, 9.)
5.2 Meaning of a visual marketing in a fashion store
One of the most important visual marketing tools for fashion retailers is a store
window. Practically it is a twenty-four hour advertisement for the company and
a way to differentiate from the competitors. It gives a quick sample for the
consumer what can be expected inside the store and can be a very important
part of the street scene. No doubt, store window boost the visual marketing,
create an image and increase the sales. (Hirvi & Nyholm 2009, 10.)
Designing of the window always starts from the products; the most actual and
interesting products are involved, if there is a certain campaign planned in a
marketing strategy, it must be taken into consideration. The idea must be clear
and well identified, as well as cost efficient and quickly built. A professional
visualist collects the ideas from all over the environment; a good idea can
arise from everywhere. Products can be selected via planned campaign,
certain brand, specific quality, color or size, or connected products that can be
20
used and look good together. Composition and grouping can be done with
several techniques, depending on the products and the wanted atmosphere.
(Hirvi, Nyholm 2009, 13 – 32.)
Light and lighting is one of the important points when speaking of visual
marketing. Creating an impressive and efficient lighting environment for the
whole store usually needs a professional planning and needs to be done by
professionals as well. Positive light creates positive shopping environment and
the entirety must be connected. Entrance must be well lighted to attract
customers in; inside the store the need and the nature of the light varies
depending of the wanted atmosphere. Colors are important part of the
physical and mental world we are living. It is possible to increase sales via
colors and create pleasure of the shopping environment. Cool colors give
smooth and relaxed atmosphere, warm colors increase the intensity and
energy. (Hirvi & Nyholm 2009, 33 – 53.)
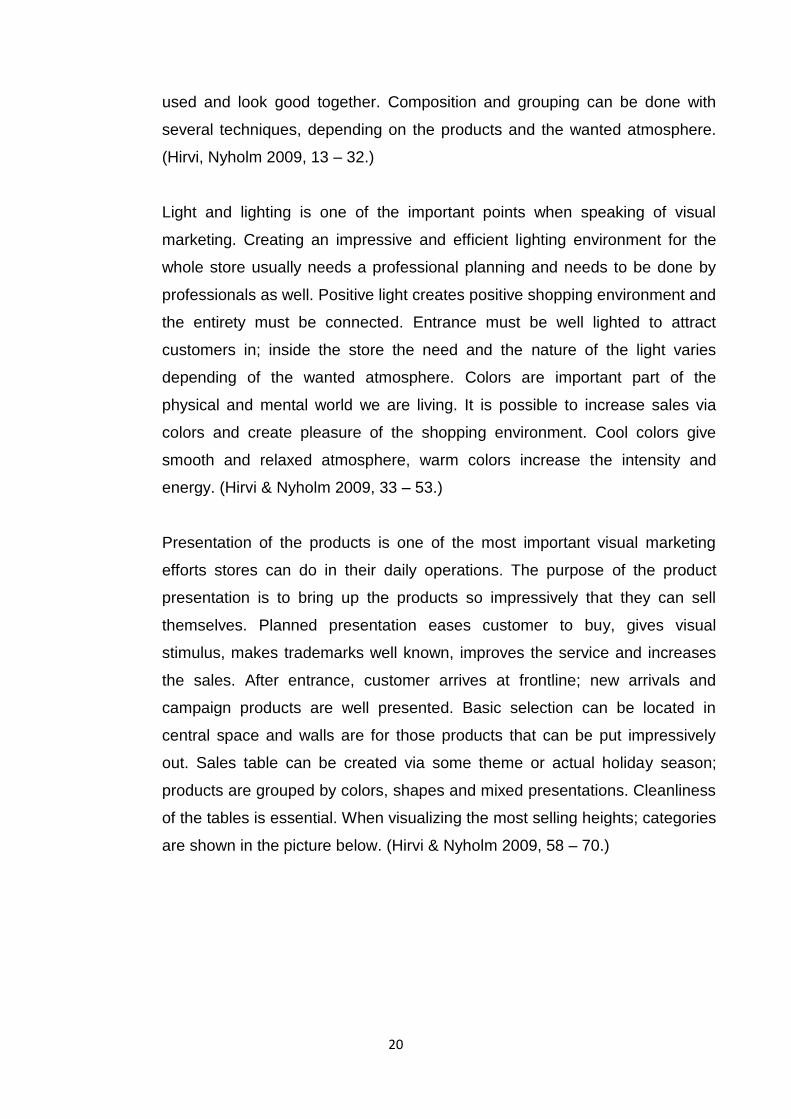
Presentation of the products is one of the most important visual marketing
efforts stores can do in their daily operations. The purpose of the product
presentation is to bring up the products so impressively that they can sell
themselves. Planned presentation eases customer to buy, gives visual
stimulus, makes trademarks well known, improves the service and increases
the sales. After entrance, customer arrives at frontline; new arrivals and
campaign products are well presented. Basic selection can be located in
central space and walls are for those products that can be put impressively
out. Sales table can be created via some theme or actual holiday season;
products are grouped by colors, shapes and mixed presentations. Cleanliness
of the tables is essential. When visualizing the most selling heights; categories
are shown in the picture below. (Hirvi & Nyholm 2009, 58 – 70.)
21
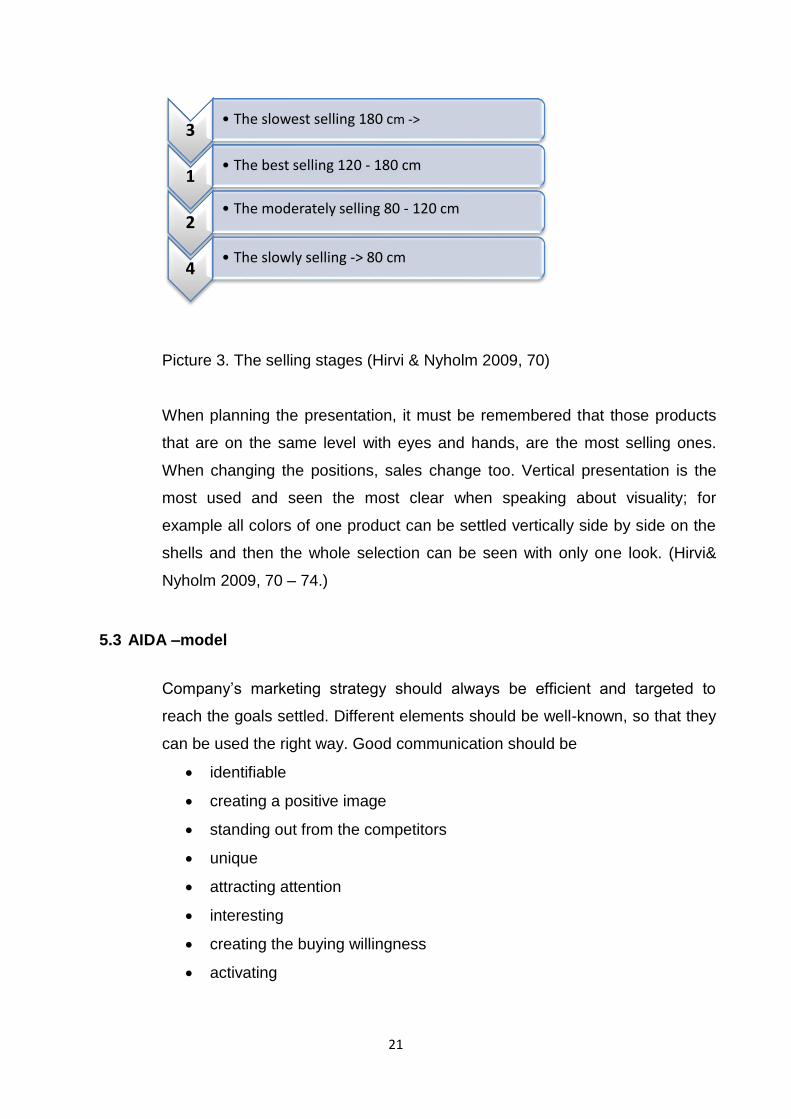
Picture 3. The selling stages (Hirvi & Nyholm 2009, 70)
When planning the presentation, it must be remembered that those products
that are on the same level with eyes and hands, are the most selling ones.
When changing the positions, sales change too. Vertical presentation is the
most used and seen the most clear when speaking about visuality; for
example all colors of one product can be settled vertically side by side on the
shells and then the whole selection can be seen with only one look. (Hirvi&
Nyholm 2009, 70 – 74.)
5.3 AIDA –model
Company’s marketing strategy should always be efficient and targeted to
reach the goals settled. Different elements should be well-known, so that they
can be used the right way. Good communication should be
identifiable
creating a positive image
standing out from the competitors
unique
attracting attention
interesting
creating the buying willingness
activating
3 • The slowest selling 180 cm ->
1 • The best selling 120 - 180 cm
2
• The moderately selling 80 - 120 cm
4 • The slowly selling -> 80 cm
22
When planning and setting the goals, AIDA –model should be remembered. It
includes the most important elements of successful communication.
Depending on the way of the communication, it is very important to carefully
think how AIDA is exploited the most efficient way. Picture below shows what
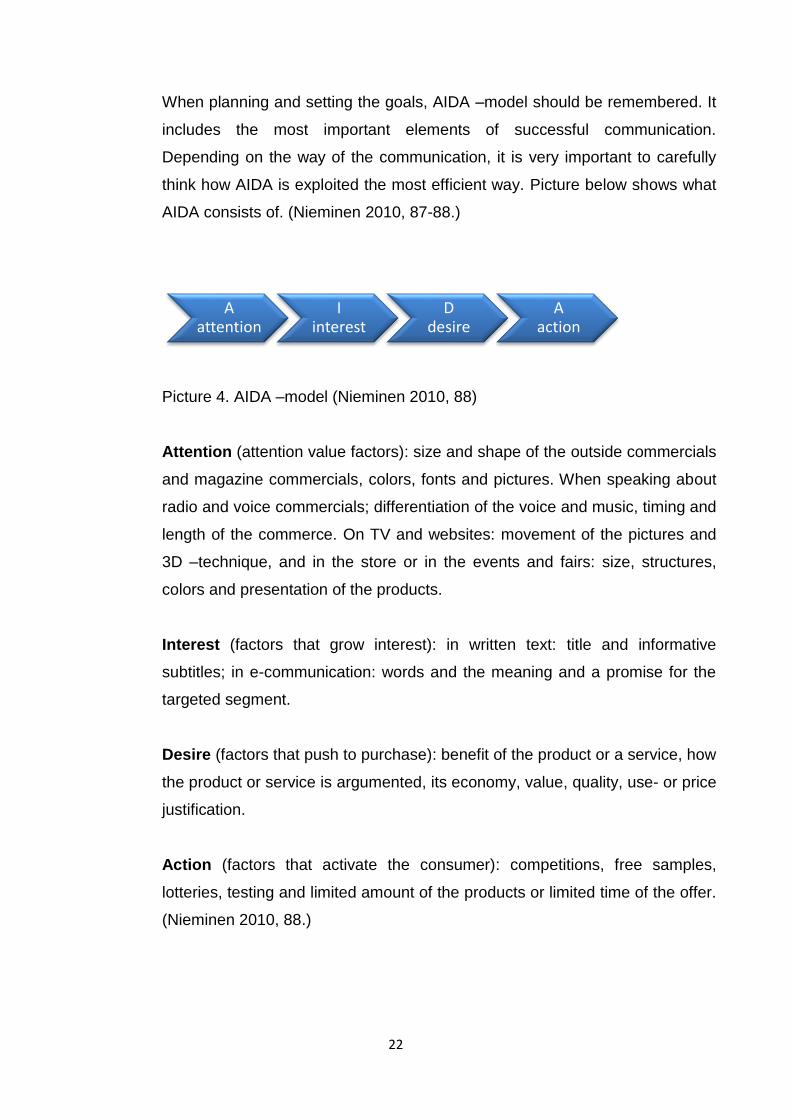
AIDA consists of. (Nieminen 2010, 87-88.)
Picture 4. AIDA –model (Nieminen 2010, 88)
Attention (attention value factors): size and shape of the outside commercials
and magazine commercials, colors, fonts and pictures. When speaking about
radio and voice commercials; differentiation of the voice and music, timing and
length of the commerce. On TV and websites: movement of the pictures and
3D –technique, and in the store or in the events and fairs: size, structures,
colors and presentation of the products.
Interest (factors that grow interest): in written text: title and informative
subtitles; in e-communication: words and the meaning and a promise for the
targeted segment.
Desire (factors that push to purchase): benefit of the product or a service, how
the product or service is argumented, its economy, value, quality, use- or price
justification.
Action (factors that activate the consumer): competitions, free samples,
lotteries, testing and limited amount of the products or limited time of the offer.
(Nieminen 2010, 88.)
A attention
I interest
D desire
A action

23
6 VISUAL MARKETING IN KARHULANLEHTO LTD.
6.1 Presentation of the case company
Karhulanlehto Ltd. is a clothing company, specialized in quality brands both
for men and women. Company has six different stores in Kymenlaakso region
located in Kotka, Kouvola, Myllykoski and Lahti. Organization was originally
founded in Myllykoski, Finland in 1954. Kotka store was founded in 2002,
Karhula strore (located in Kotka) in 1992, Kouvola town center store “Manski”
in 1994, Shopping center Veturi store in 2012, and Lahti store in 1998.
(Karhulanlehto Ltd. 2014.)
Trademarks that are bought from their stores are for example Gerry Weber,
Masai, Steilmann, Hajo, Frank Lyman, Nanso, Esprit, Desigual, Samoon,
Taifun, 2 Biz, Joutsen, Soya Concept, Christa Probst, Skovhus, Triumph,
Armani Jeans, Boss, Guess, Vila, Only, Vero Moda, Pieces, Jack&Jones,
Tommy Hilfiger and Hilfiger Denim, Turo Tailor, Para Jumpers, and Lebek.
(Karhulanlehto Ltd. 2014.)
Karhulanlehto Ltd.’s core competence is the unique service. Professional
seamstress helps if repairs are needed. Seamstress offices are located in
Karhula store, Lahti store and Myllykoski store. Inside Karhula store, there is
located chain’s central warehouse with four workers. From the central
warehouse, clothes and accessories are delivered to other locations. Financial
management and accounting are located in Karhula position. Picture of the
organization can be seen below. (Karhulanlehto Ltd. 2014.)

24
Picture 4. Organization of Karhulanlehto Ltd. (Karhulanlehto Ltd. 2014)
As the picture shows, Karhulanlehto Ltd. is a family owned company.
Structure of the organization is very low, and there is no hierarchy between
different levels.
6.2 Visual marketing research via AIDA- model
Empirical part of this thesis concerns visual marketing in Muotitalo Lehto
Karhula store and Pasaati store. We wanted to know how personnel
experiences and creates the best possible visual appearance and what the
opinions of their customers are. We wanted to find out what is good and if
there is something we could do better to please the customers and consumers
more in the future. Visual marketing is essential daily routine in a fashion store
and a very important part of the selling and customer relationship. It is one of
the most important competition tools today and that is why it is so important to
manage it successfully, continuously.
Karhulanlehto Ltd.
E. Lehto Ltd.
CEO
Myllykoski Kotka Kouvola
Manski Veturi
Muotilehto Ltd. Lahti
CEO
CEO
25
6.2.1 Description of the process
Idea of this thesis came up to authors during spring 2014. Visual marketing is
one of the most important daily routines in retail fashion stores and a very
important competitive advantage when speaking of attracting customers to
consume with a very little usage of marketing money. I was interested in what
was the company’s status in the opinion of our personnel and on the other
hand how customers see company’s activities; I was interested in how
effective company are now, how effective company could be in the future and
what actions it might need. My idea got an approval of the executive team,
and we were ready and excited to find it out.
The process was started with the visual marketing interviews of the personnel,
both in Karhula store and Pasaati store. Personnel was asked to freely answer
the questions, and all the questions were given beforehand to the
respondents, so that they had time to think about answers.
The questions were divided into four categories: entrance, store overall, table
next to cashpoint and wall space; we also wanted to know the overall
appearance and what is the impression that personnel believes the store
gives to the customers. Questions were concerning these different peak points
of the visual marketing and how personnel create AIDA –affection – or how
they believe that they do that. Visualist was answering questions concerning
the showcases in both stores; how employee creates AIDA –affection when
visualizing showcase. Both questionnaires can be seen attached in the end of
this thesis.
In Karhula store, five members of the personnel were interviewed and in
Pasaati store two of the personnel were willing to answer questions. All the
answers given in personnel interviews were moved to response alternatives of
the questionnaire that was directed to both stores’ customers later on. In this
way, opinions of the personnel and customers were connected for the final
result.

26
After getting answers from the personnel, a questionnaire for the customers
was created. This questionnaire followed the same frame that personnel
answered. The questions with the response alternatives given by the staff
were repeated. The basic idea was to get to know the statement of the visual
marketing of the stores now, and how to act the best way in the future; of
course we also wanted to know if there is something the company could do
better to reach customers and give the best possible visual experience in
stores in the future.
The questionnaire was designed on the basis of the answers from the
personnel, quick enough to answer, easy to understand and it did not
contained only structured response options, but also an open question in the
end for the precious open feedback. After designing the questionnaire, it was
tested to several trusted persons beforehand, just to make sure that there
were no incorrect facts, spelling mistakes or small wrong details that could
affect the final result. This questionnaire can be seen attached in the end of
this thesis.
This questionnaire was launched in both stores for one week, and the results
from the consumers were obtained during this time. The idea was to offer the
possibility to answer in a cashpoint while waiting for the salesperson to get the
products ready for payment. Karhula store got 87 answers during the week
and Pasaati store 64 answers. This was 23 per cent of the week’s paid
customers in Karhula store and 16. 4 per cent in Pasaati store. Differences
between willingness of respondents was clear; in Karhula store customers
were glad to answer – in Pasaati store customers usually refused to answer
and the work was much, much harder. This also explains the differences
between the stand alone stores and a store located in a shopping center. After
getting answers, the results were analyzed for the overall picture.
27
6.2.2 Visual marketing in Karhula store, results and conclusions
Question one was concerning basic information of the respondent. The
Company wanted to know if the answers were from a male or from a female.
Of course, the customer structure of the store was wanted to know.
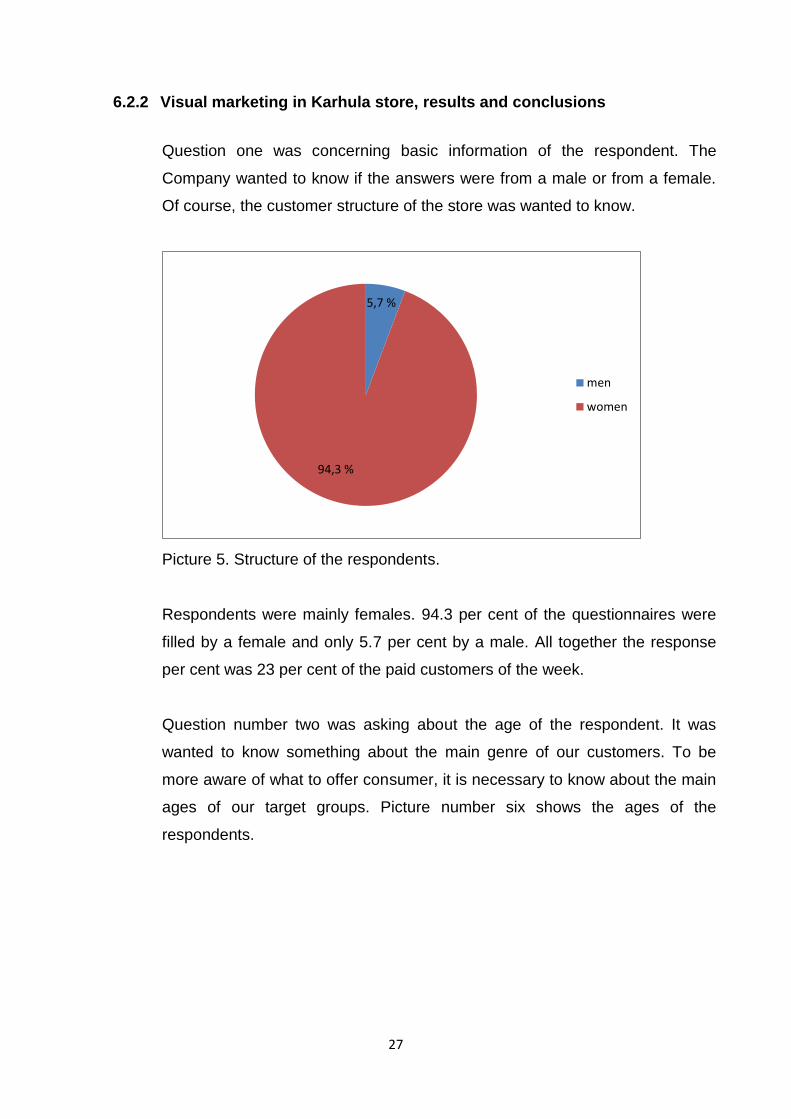
Picture 5. Structure of the respondents.
Respondents were mainly females. 94.3 per cent of the questionnaires were
filled by a female and only 5.7 per cent by a male. All together the response
per cent was 23 per cent of the paid customers of the week.
Question number two was asking about the age of the respondent. It was
wanted to know something about the main genre of our customers. To be
more aware of what to offer consumer, it is necessary to know about the main
ages of our target groups. Picture number six shows the ages of the
respondents.
5,7 %
94,3 %
men
women
28
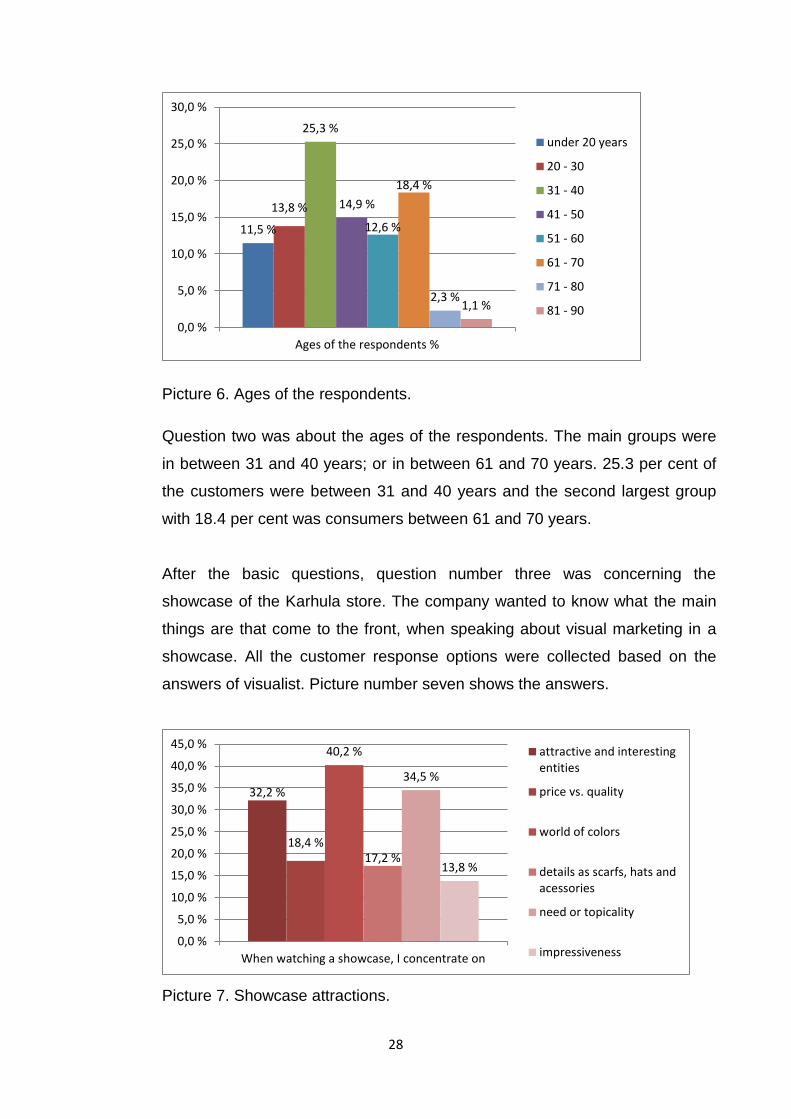
Picture 6. Ages of the respondents.
Question two was about the ages of the respondents. The main groups were
in between 31 and 40 years; or in between 61 and 70 years. 25.3 per cent of
the customers were between 31 and 40 years and the second largest group
with 18.4 per cent was consumers between 61 and 70 years.
After the basic questions, question number three was concerning the
showcase of the Karhula store. The company wanted to know what the main
things are that come to the front, when speaking about visual marketing in a
showcase. All the customer response options were collected based on the
answers of visualist. Picture number seven shows the answers.
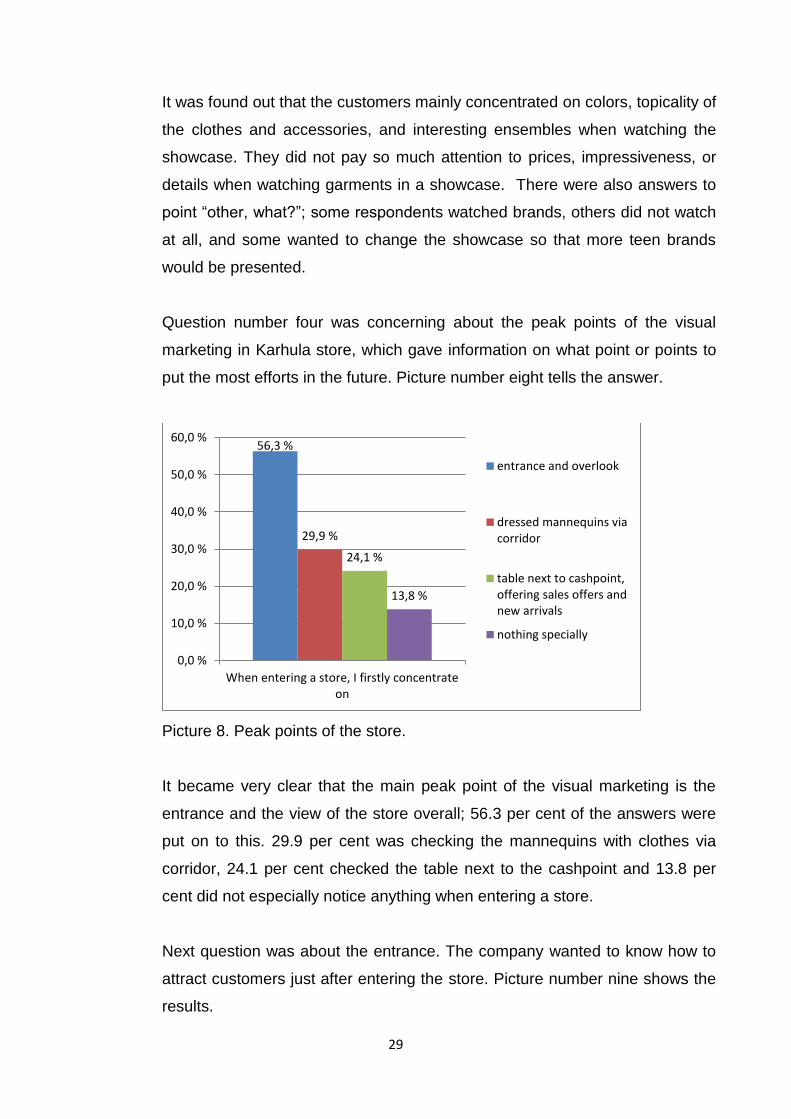
Picture 7. Showcase attractions.
11,5 %
13,8 %
25,3 %
14,9 %
12,6 %
18,4 %
2,3 % 1,1 %
0,0 %
5,0 %
10,0 %
15,0 %
20,0 %
25,0 %
30,0 %
Ages of the respondents %
under 20 years
20 - 30
31 - 40
41 - 50
51 - 60
61 - 70
71 - 80
81 - 90
32,2 %
18,4 %
40,2 %
17,2 %
34,5 %
13,8 %
0,0 %
5,0 %
10,0 %
15,0 %
20,0 %
25,0 %
30,0 %
35,0 %
40,0 %
45,0 %
When watching a showcase, I concentrate on
attractive and interestingentities
price vs. quality
world of colors
details as scarfs, hats andacessories
need or topicality
impressiveness
29
It was found out that the customers mainly concentrated on colors, topicality of
the clothes and accessories, and interesting ensembles when watching the
showcase. They did not pay so much attention to prices, impressiveness, or
details when watching garments in a showcase. There were also answers to
point “other, what?”; some respondents watched brands, others did not watch
at all, and some wanted to change the showcase so that more teen brands
would be presented.
Question number four was concerning about the peak points of the visual
marketing in Karhula store, which gave information on what point or points to
put the most efforts in the future. Picture number eight tells the answer.
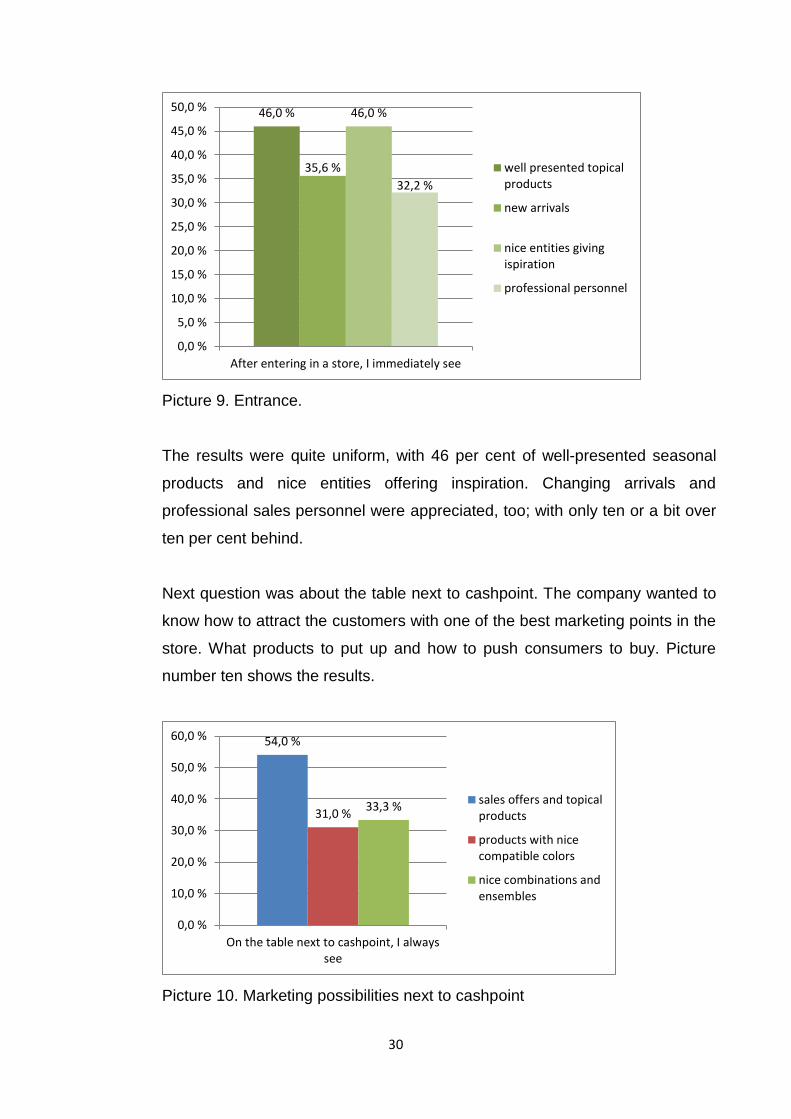
Picture 8. Peak points of the store.
It became very clear that the main peak point of the visual marketing is the
entrance and the view of the store overall; 56.3 per cent of the answers were
put on to this. 29.9 per cent was checking the mannequins with clothes via
corridor, 24.1 per cent checked the table next to the cashpoint and 13.8 per
cent did not especially notice anything when entering a store.
Next question was about the entrance. The company wanted to know how to
attract customers just after entering the store. Picture number nine shows the
results.
56,3 %
29,9 %
24,1 %
13,8 %
0,0 %
10,0 %
20,0 %
30,0 %
40,0 %
50,0 %
60,0 %
When entering a store, I firstly concentrateon
entrance and overlook
dressed mannequins viacorridor
table next to cashpoint,offering sales offers andnew arrivals
nothing specially
30
Picture 9. Entrance.
The results were quite uniform, with 46 per cent of well-presented seasonal
products and nice entities offering inspiration. Changing arrivals and
professional sales personnel were appreciated, too; with only ten or a bit over
ten per cent behind.
Next question was about the table next to cashpoint. The company wanted to
know how to attract the customers with one of the best marketing points in the
store. What products to put up and how to push consumers to buy. Picture
number ten shows the results.
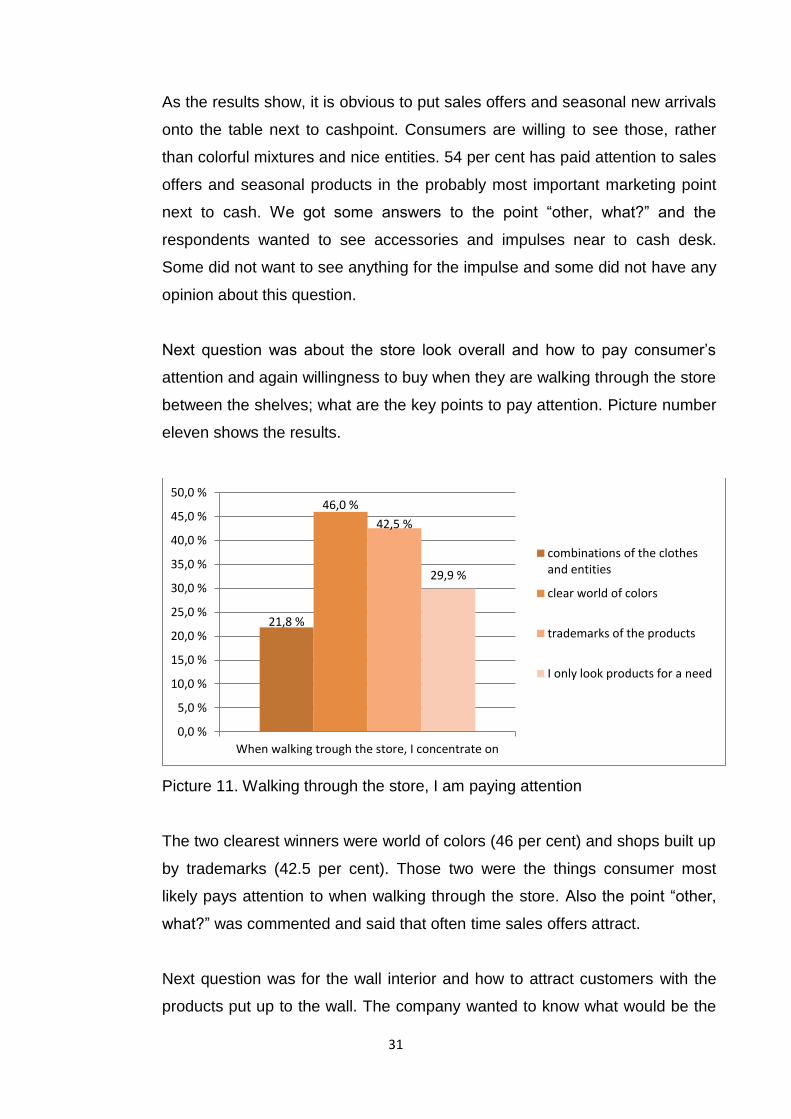
Picture 10. Marketing possibilities next to cashpoint
46,0 %
35,6 %
46,0 %
32,2 %
0,0 %
5,0 %
10,0 %
15,0 %
20,0 %
25,0 %
30,0 %
35,0 %
40,0 %
45,0 %
50,0 %
After entering in a store, I immediately see
well presented topicalproducts
new arrivals
nice entities givingispiration
professional personnel
54,0 %
31,0 % 33,3 %
0,0 %
10,0 %
20,0 %
30,0 %
40,0 %
50,0 %
60,0 %
On the table next to cashpoint, I alwayssee
sales offers and topicalproducts
products with nicecompatible colors
nice combinations andensembles
31
As the results show, it is obvious to put sales offers and seasonal new arrivals
onto the table next to cashpoint. Consumers are willing to see those, rather
than colorful mixtures and nice entities. 54 per cent has paid attention to sales
offers and seasonal products in the probably most important marketing point
next to cash. We got some answers to the point “other, what?” and the
respondents wanted to see accessories and impulses near to cash desk.
Some did not want to see anything for the impulse and some did not have any
opinion about this question.
Next question was about the store look overall and how to pay consumer’s
attention and again willingness to buy when they are walking through the store
between the shelves; what are the key points to pay attention. Picture number
eleven shows the results.
Picture 11. Walking through the store, I am paying attention
The two clearest winners were world of colors (46 per cent) and shops built up
by trademarks (42.5 per cent). Those two were the things consumer most
likely pays attention to when walking through the store. Also the point “other,
what?” was commented and said that often time sales offers attract.
Next question was for the wall interior and how to attract customers with the
products put up to the wall. The company wanted to know what would be the
21,8 %
46,0 %
42,5 %
29,9 %
0,0 %
5,0 %
10,0 %
15,0 %
20,0 %
25,0 %
30,0 %
35,0 %
40,0 %
45,0 %
50,0 %
When walking trough the store, I concentrate on
combinations of the clothesand entities
clear world of colors
trademarks of the products
I only look products for a need
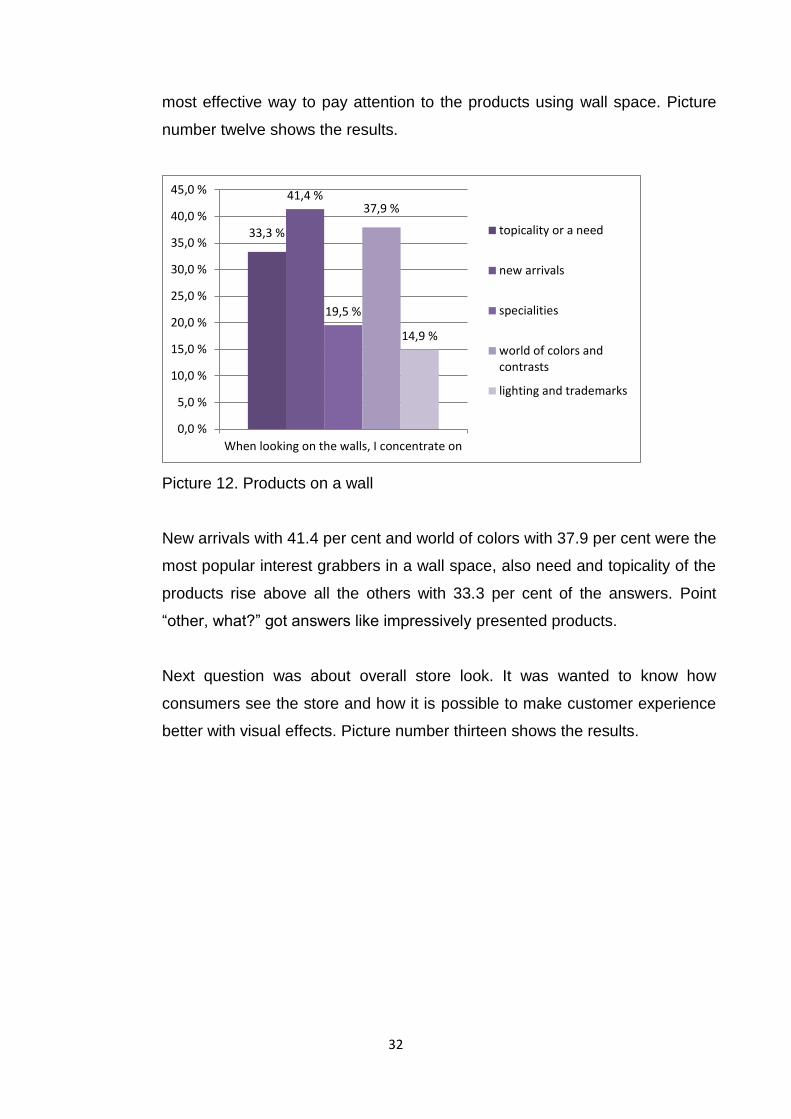
32
most effective way to pay attention to the products using wall space. Picture
number twelve shows the results.
Picture 12. Products on a wall
New arrivals with 41.4 per cent and world of colors with 37.9 per cent were the
most popular interest grabbers in a wall space, also need and topicality of the
products rise above all the others with 33.3 per cent of the answers. Point
“other, what?” got answers like impressively presented products.
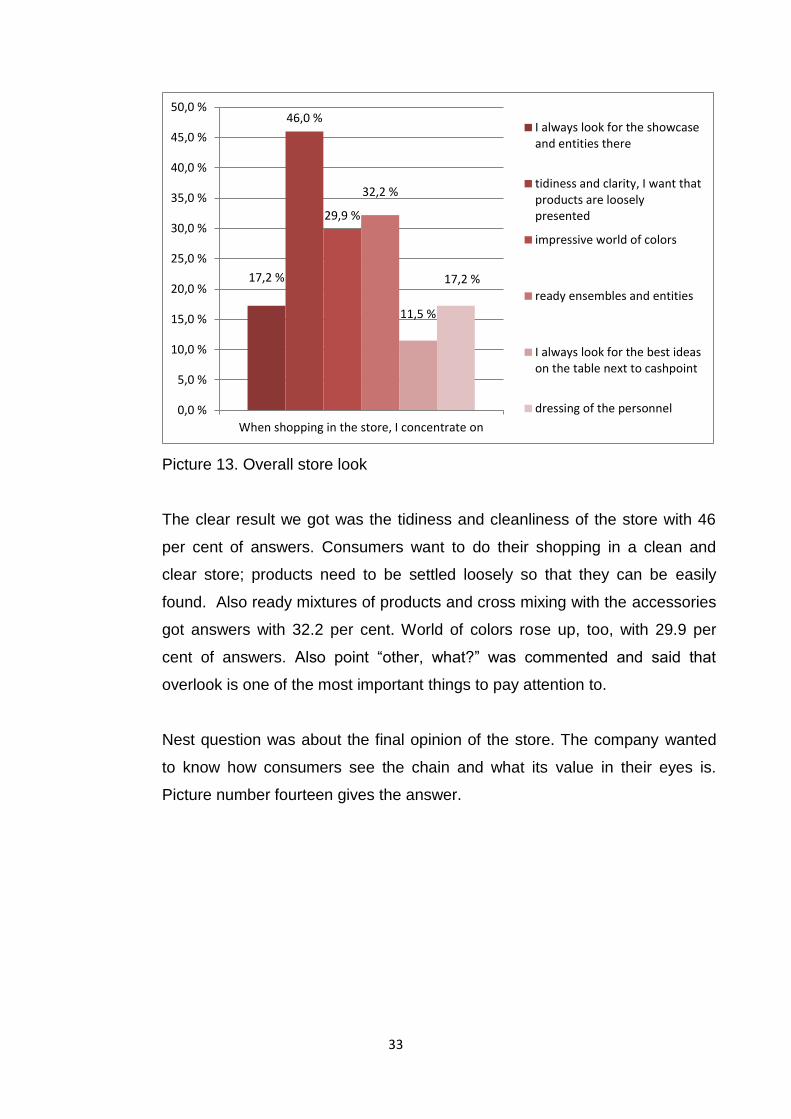
Next question was about overall store look. It was wanted to know how
consumers see the store and how it is possible to make customer experience
better with visual effects. Picture number thirteen shows the results.
33,3 %
41,4 %
19,5 %
37,9 %
14,9 %
0,0 %
5,0 %
10,0 %
15,0 %
20,0 %
25,0 %
30,0 %
35,0 %
40,0 %
45,0 %
When looking on the walls, I concentrate on
topicality or a need
new arrivals
specialities
world of colors andcontrasts
lighting and trademarks
33
Picture 13. Overall store look
The clear result we got was the tidiness and cleanliness of the store with 46
per cent of answers. Consumers want to do their shopping in a clean and
clear store; products need to be settled loosely so that they can be easily
found. Also ready mixtures of products and cross mixing with the accessories
got answers with 32.2 per cent. World of colors rose up, too, with 29.9 per
cent of answers. Also point “other, what?” was commented and said that
overlook is one of the most important things to pay attention to.
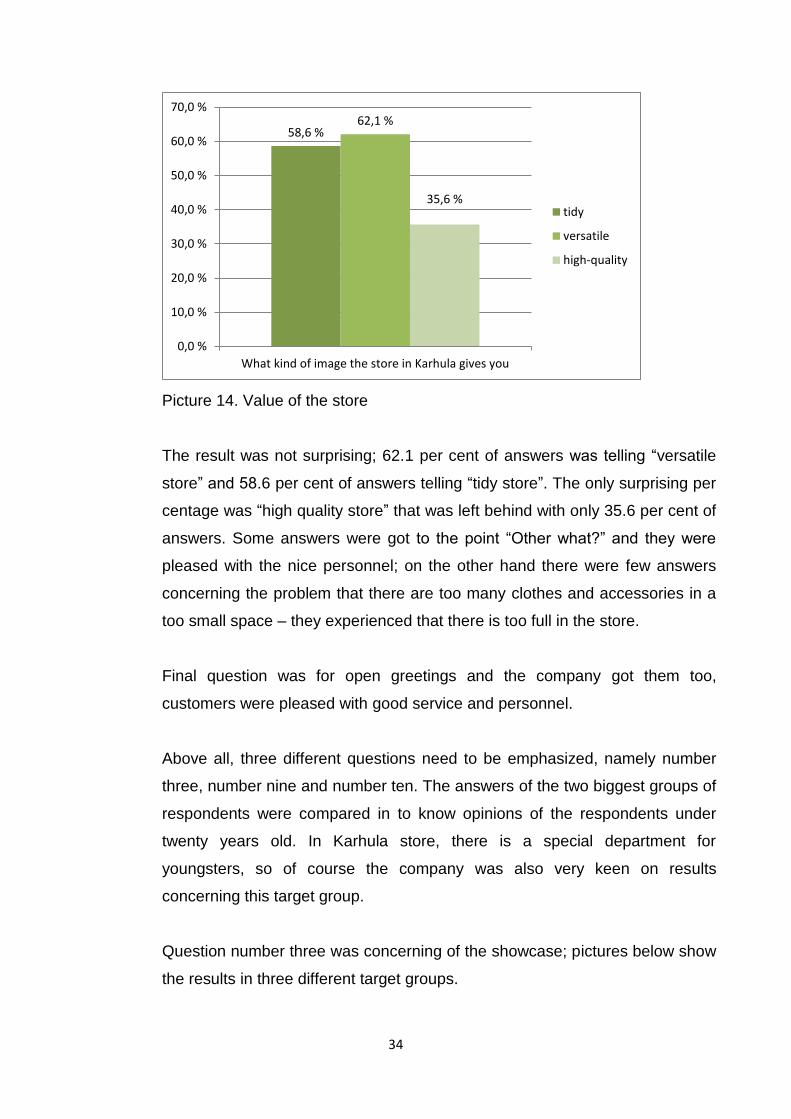
Nest question was about the final opinion of the store. The company wanted
to know how consumers see the chain and what its value in their eyes is.
Picture number fourteen gives the answer.
17,2 %
46,0 %
29,9 %
32,2 %
11,5 %
17,2 %
0,0 %
5,0 %
10,0 %
15,0 %
20,0 %
25,0 %
30,0 %
35,0 %
40,0 %
45,0 %
50,0 %
When shopping in the store, I concentrate on
I always look for the showcaseand entities there
tidiness and clarity, I want thatproducts are looselypresented
impressive world of colors
ready ensembles and entities
I always look for the best ideason the table next to cashpoint
dressing of the personnel
34
Picture 14. Value of the store
The result was not surprising; 62.1 per cent of answers was telling “versatile
store” and 58.6 per cent of answers telling “tidy store”. The only surprising per
centage was “high quality store” that was left behind with only 35.6 per cent of
answers. Some answers were got to the point “Other what?” and they were
pleased with the nice personnel; on the other hand there were few answers
concerning the problem that there are too many clothes and accessories in a
too small space – they experienced that there is too full in the store.
Final question was for open greetings and the company got them too,
customers were pleased with good service and personnel.
Above all, three different questions need to be emphasized, namely number
three, number nine and number ten. The answers of the two biggest groups of
respondents were compared in to know opinions of the respondents under
twenty years old. In Karhula store, there is a special department for
youngsters, so of course the company was also very keen on results
concerning this target group.
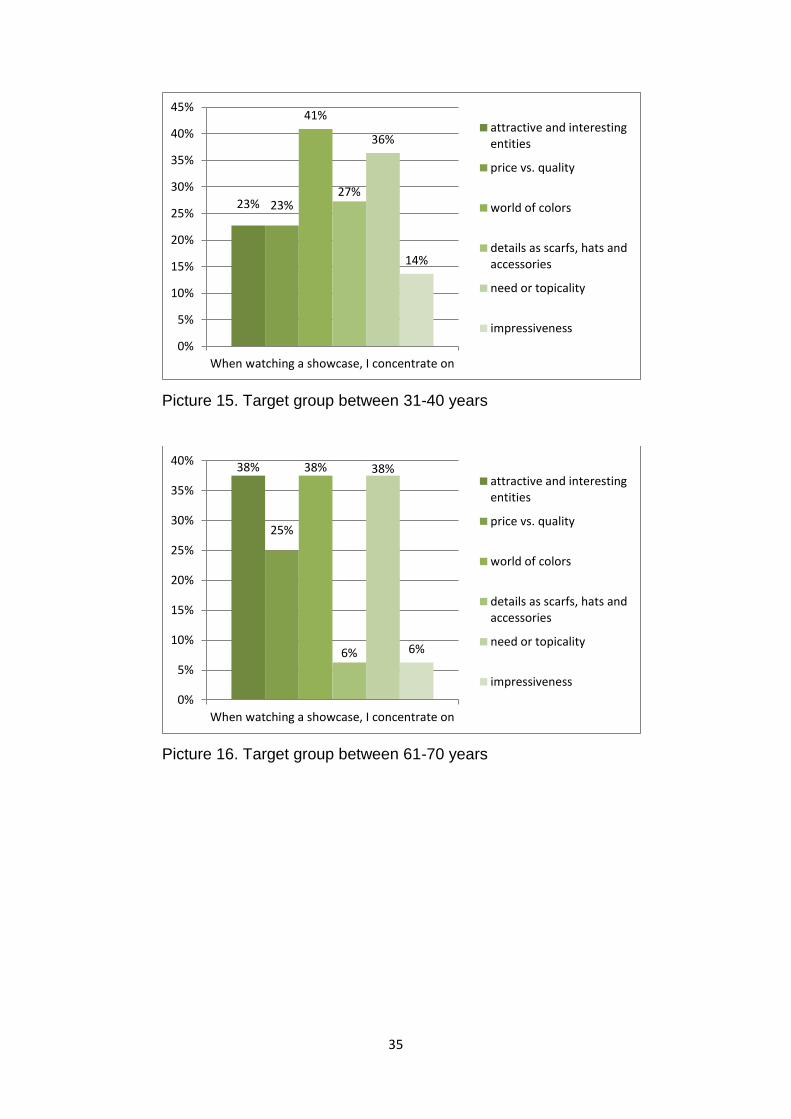
Question number three was concerning of the showcase; pictures below show
the results in three different target groups.
58,6 % 62,1 %
35,6 %
0,0 %
10,0 %
20,0 %
30,0 %
40,0 %
50,0 %
60,0 %
70,0 %
What kind of image the store in Karhula gives you
tidy
versatile
high-quality
35
Picture 15. Target group between 31-40 years
Picture 16. Target group between 61-70 years
23% 23%
41%
27%
36%
14%
0%
5%
10%
15%
20%
25%
30%
35%
40%
45%
When watching a showcase, I concentrate on
attractive and interestingentities
price vs. quality
world of colors
details as scarfs, hats andaccessories
need or topicality
impressiveness
38%
25%
38%
6%
38%
6%
0%
5%
10%
15%
20%
25%
30%
35%
40%
When watching a showcase, I concentrate on
attractive and interestingentities
price vs. quality
world of colors
details as scarfs, hats andaccessories
need or topicality
impressiveness
36
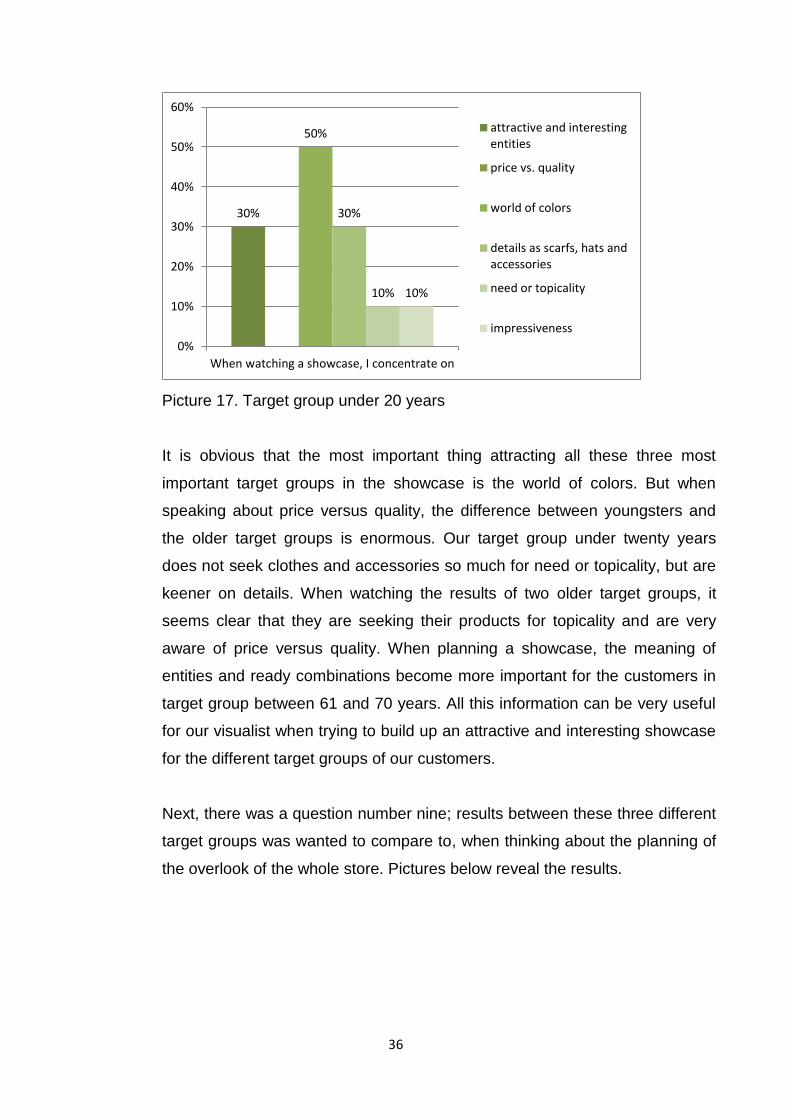
Picture 17. Target group under 20 years
It is obvious that the most important thing attracting all these three most
important target groups in the showcase is the world of colors. But when
speaking about price versus quality, the difference between youngsters and
the older target groups is enormous. Our target group under twenty years
does not seek clothes and accessories so much for need or topicality, but are
keener on details. When watching the results of two older target groups, it
seems clear that they are seeking their products for topicality and are very
aware of price versus quality. When planning a showcase, the meaning of
entities and ready combinations become more important for the customers in
target group between 61 and 70 years. All this information can be very useful
for our visualist when trying to build up an attractive and interesting showcase
for the different target groups of our customers.
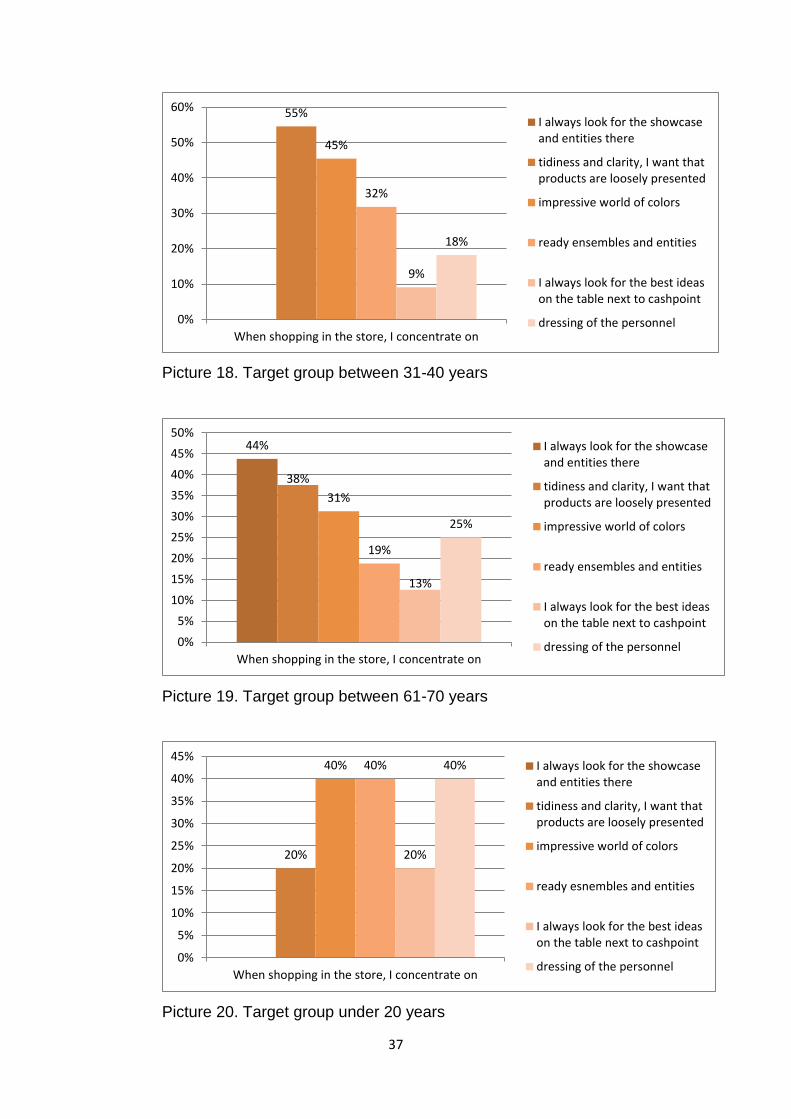
Next, there was a question number nine; results between these three different
target groups was wanted to compare to, when thinking about the planning of
the overlook of the whole store. Pictures below reveal the results.
30%
50%
30%
10% 10%
0%
10%
20%
30%
40%
50%
60%
When watching a showcase, I concentrate on
attractive and interestingentities
price vs. quality
world of colors
details as scarfs, hats andaccessories
need or topicality
impressiveness
37
Picture 18. Target group between 31-40 years
Picture 19. Target group between 61-70 years
Picture 20. Target group under 20 years
55%
45%
32%
9%
18%
0%
10%
20%
30%
40%
50%
60%
When shopping in the store, I concentrate on
I always look for the showcaseand entities there
tidiness and clarity, I want thatproducts are loosely presented
impressive world of colors
ready ensembles and entities
I always look for the best ideason the table next to cashpoint
dressing of the personnel
44%
38%
31%
19%
13%
25%
0%
5%
10%
15%
20%
25%
30%
35%
40%
45%
50%
When shopping in the store, I concentrate on
I always look for the showcaseand entities there
tidiness and clarity, I want thatproducts are loosely presented
impressive world of colors
ready ensembles and entities
I always look for the best ideason the table next to cashpoint
dressing of the personnel
20%
40% 40%
20%
40%
0%
5%
10%
15%
20%
25%
30%
35%
40%
45%
When shopping in the store, I concentrate on
I always look for the showcaseand entities there
tidiness and clarity, I want thatproducts are loosely presented
impressive world of colors
ready esnembles and entities
I always look for the best ideason the table next to cashpoint
dressing of the personnel

38
The basic and the most enormous difference between the target groups is that
only customers between 61 and 70 years seek ideas from the showcase.
Youngsters are looking at the dressing of the personnel and getting ideas from
there, too. Ready combinations seem to be very important to young
customers, but for consumers between 31 and 40 years, as well. Tidiness and
clarity of the store clearly rose to be one of the peak points for all the target
groups, not forgetting the world of colors.
Finally, question number ten was compared between the target groups. We
wanted to know if there were any differences in how these consumers see the
store in Karhula. Pictures below reveal the results.
Picture 21. Target group between 31-40 years
73%
59%
27%
0%
10%
20%
30%
40%
50%
60%
70%
80%
What kind of image the store in Karhula gives you
tidy
versatile
high-quality

39
Picture 22. Target group between 61-70 years
Picture 23. target group under 20 years
The most important difference between these target groups seems to be that
youngsters and younger consumers does not see image of Karhula store as a
high-quality store, compared to target group between ages 61-70. All target
groups mentioned the store to be tidy and versatile. The huge difference of the
high-quality –image between the consumers of different ages might be the
trademarks of the store; younger consumers does not see the same brands as
quality brands compared to older customers. Representing different
63% 63%
50%
0%
10%
20%
30%
40%
50%
60%
70%
What kind of image the store in Karhula gives you
tidy
versatile
high-quality
40%
70%
10%
0%
10%
20%
30%
40%
50%
60%
70%
80%
What kind of image the store in Karhula gives you
tidy
versatile
high-quality
40
trademarks to different consumers is one of the very important key success
points in the future, too.
Conclusions and recommendations
These results tell that customers in Karhula store are mainly females; on the
other hand it might be so that women wanted to participate to fill in the
questionnaire and men did not. We can say that the main target marketing
groups are women between the ages of 30 and 40 and on the other hand
between 60 and 70 years.
For the future the company needs to be on time, use great ensembles and
delicious colors when building important business card towards street view. It
was clear that the entrance and overlook of the store were the most important
peak points of the store when speaking about visual impressiveness; it must
be ensured that the visuality comes out in the very moment when the
customers arrive at the store and put all efforts on that. It was found out that
topicality and nice ensembles are the key words to attract customers in the
entrance, new arrivals must be put on stage and keep mannequins well
dressed for the future as well. It was important to know that customers think
that the personnel is professional and wanted to underline that, too.
It was not a surprise that the table next to cashpoint was seen as a place of
new arrivals or good sales offers; and that is how it must be kept in the future,
too. These two groups sell the most from that point of the store. When thinking
about the store overall, we need to create clear world of colors with clear
shops of brands. Customers wanted to find out their products by searching for
certain colors but in the same time they were looking for certain brands.
It was wanted to know what sells the best from the wall, and found out that
new arrivals and peak colors are the things that customers are looking for on
the eye level of the store. So, these two things can be found from the walls in
the future. The company also wanted to know how consumers see the store
and how it is possible to make customer experience better with visual effects;

41
customers wanted to shop in a clean and tidy store where clothes and
accessories are loosely presented and easily found. They wanted to see clear
color combinations and ensembles that can give inspiration and push to buy.
The store must be kept tidy and loose, and we need to pay special attention to
colors and ready to go entities for the customers to buy.
The company wanted to value the store with clear definitions from customers
and found out that they thought that Karhula store is versatile and clean.
There were also got comments where customers were pleased with the nice
personnel, but on the other hand there were few answers concerning the
problem that there are too many clothes and accessories in a too small space
in the store. This gives a question, why the customers do not think that the
store is a high quality store? Do they probably perceive only stores with high
quality brands as a high quality store? The company sells quality products
with fine brand names, but still customers do not think that Karhula store is a
high quality store. On the other hand, it might be so, that when consumers
think that basic brands are sold for basic people it makes the company
successful.
Final question was for open comments and there was feedback about nice
and professional personnel. Customers commented that it is always nice to
visit this store. It seems that personnel is the heart of this store and customers
rely a lot on their visual recommendations and professional visual eye.
Overall, there were quite few surprises on the results of this store’s visual
outlook; Good results confirmed the present spirit of the store.
Three different questions were raised above all and the results were
compared between the most important target groups of this store especially.
Differences that came up among the answers help personnel and
management plan actions and marketing, especially for the needs of the
different consumers.

42
6.2.3 Visual marketing in Pasaati store, results and conclusions
Structure of the answers in Pasaati store was a little bit different than in
Karhula store. Structure of the customers changes a bit, depending on the
store and it can be seen in the results. Picture number twenty-four shows the
meaning.
Picture 24. Structure of the respondents
Most of the respondents were females, but also males answered. 23.4 per
cent of the answers was from men, 76.6 per cent was from women. All
together the response per cent was 16.5 per cent of the paid customers of the
week.
Question number two was again about the age of the respondent. The
company wanted to know something about the main target groups, and how
much the target groups differ from each other when speaking about traditional
store and a store located in a shopping center. Picture number twenty five
shows the ages of the respondents.
23,4 %
76,6 %
men
women
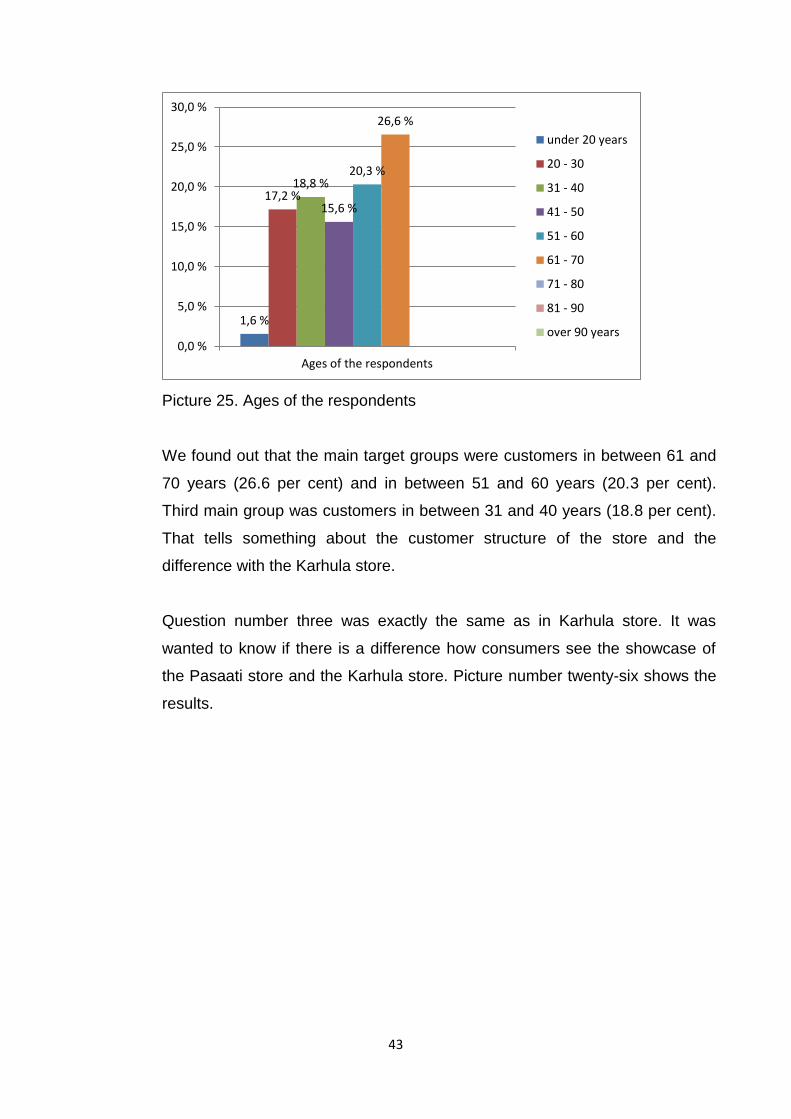
43
Picture 25. Ages of the respondents
We found out that the main target groups were customers in between 61 and
70 years (26.6 per cent) and in between 51 and 60 years (20.3 per cent).
Third main group was customers in between 31 and 40 years (18.8 per cent).
That tells something about the customer structure of the store and the
difference with the Karhula store.
Question number three was exactly the same as in Karhula store. It was
wanted to know if there is a difference how consumers see the showcase of
the Pasaati store and the Karhula store. Picture number twenty-six shows the
results.
1,6 %
17,2 % 18,8 %
15,6 %
20,3 %
26,6 %
0,0 %
5,0 %
10,0 %
15,0 %
20,0 %
25,0 %
30,0 %
Ages of the respondents
under 20 years
20 - 30
31 - 40
41 - 50
51 - 60
61 - 70
71 - 80
81 - 90
over 90 years
44
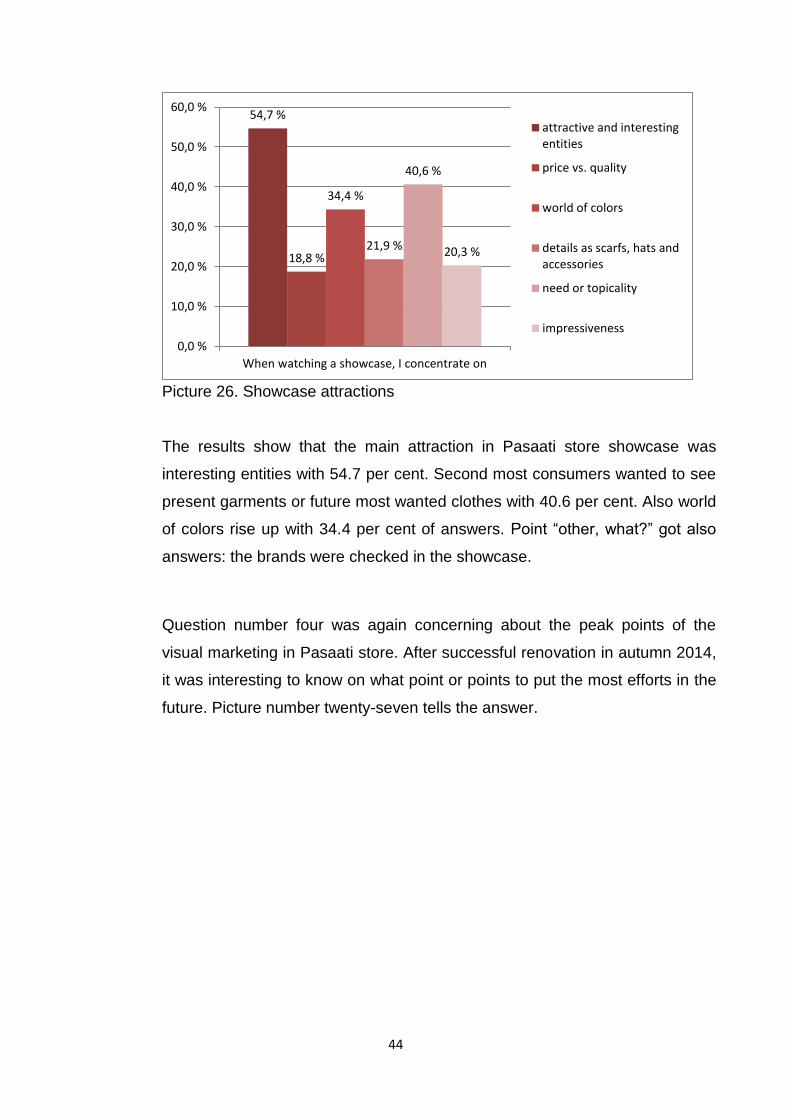
Picture 26. Showcase attractions
The results show that the main attraction in Pasaati store showcase was
interesting entities with 54.7 per cent. Second most consumers wanted to see
present garments or future most wanted clothes with 40.6 per cent. Also world
of colors rise up with 34.4 per cent of answers. Point “other, what?” got also
answers: the brands were checked in the showcase.
Question number four was again concerning about the peak points of the
visual marketing in Pasaati store. After successful renovation in autumn 2014,
it was interesting to know on what point or points to put the most efforts in the
future. Picture number twenty-seven tells the answer.
54,7 %
18,8 %
34,4 %
21,9 %
40,6 %
20,3 %
0,0 %
10,0 %
20,0 %
30,0 %
40,0 %
50,0 %
60,0 %
When watching a showcase, I concentrate on
attractive and interestingentities
price vs. quality
world of colors
details as scarfs, hats andaccessories
need or topicality
impressiveness
45
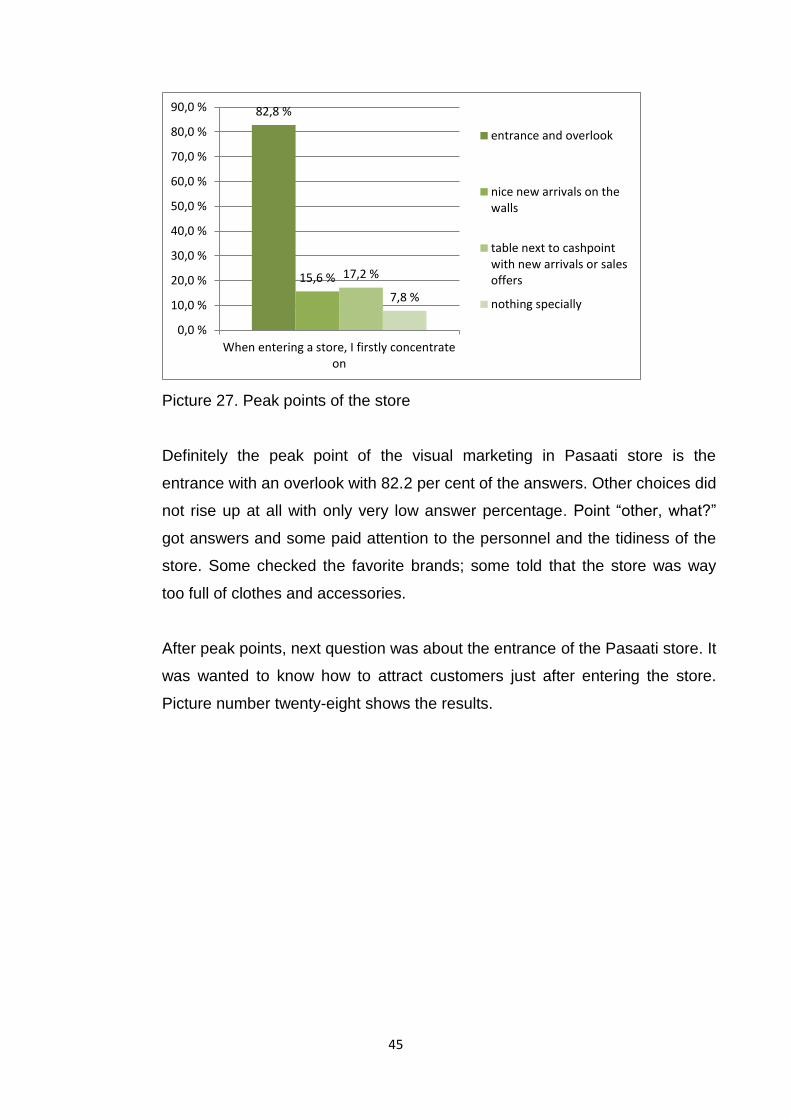
Picture 27. Peak points of the store
Definitely the peak point of the visual marketing in Pasaati store is the
entrance with an overlook with 82.2 per cent of the answers. Other choices did
not rise up at all with only very low answer percentage. Point “other, what?”
got answers and some paid attention to the personnel and the tidiness of the
store. Some checked the favorite brands; some told that the store was way
too full of clothes and accessories.
After peak points, next question was about the entrance of the Pasaati store. It
was wanted to know how to attract customers just after entering the store.
Picture number twenty-eight shows the results.
82,8 %
15,6 % 17,2 %
7,8 %
0,0 %
10,0 %
20,0 %
30,0 %
40,0 %
50,0 %
60,0 %
70,0 %
80,0 %
90,0 %
When entering a store, I firstly concentrateon
entrance and overlook
nice new arrivals on thewalls
table next to cashpointwith new arrivals or salesoffers
nothing specially
46
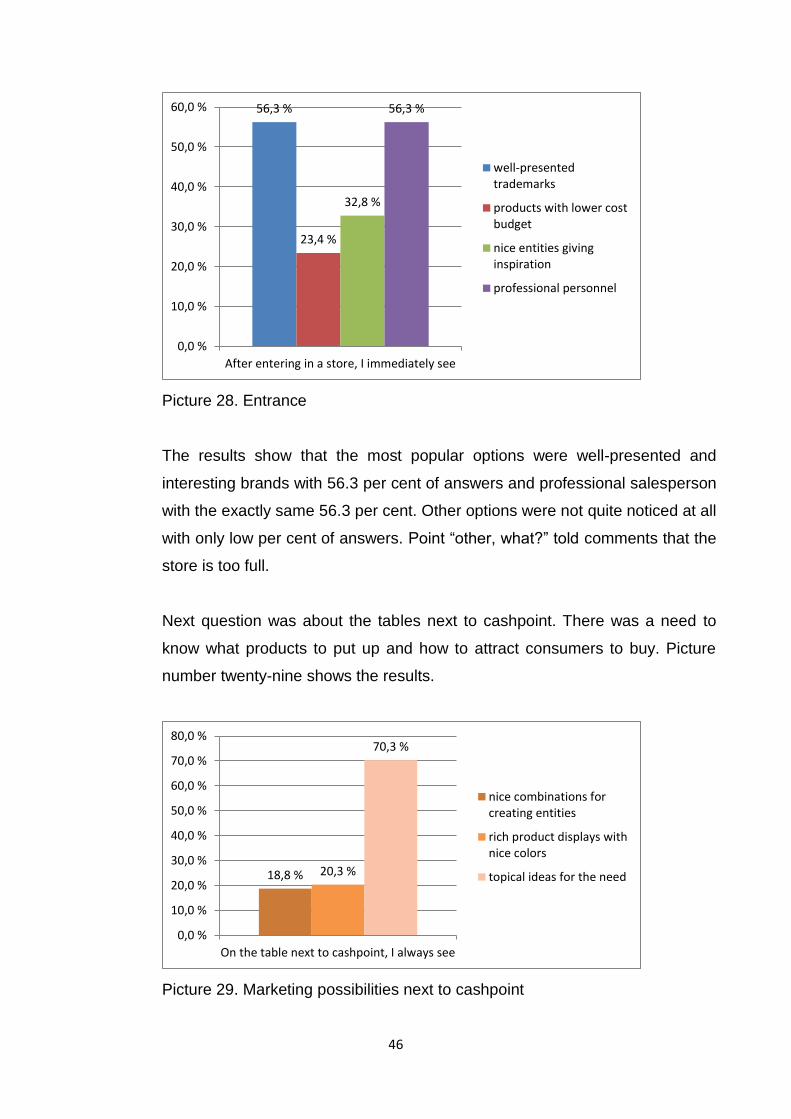
Picture 28. Entrance
The results show that the most popular options were well-presented and
interesting brands with 56.3 per cent of answers and professional salesperson
with the exactly same 56.3 per cent. Other options were not quite noticed at all
with only low per cent of answers. Point “other, what?” told comments that the
store is too full.
Next question was about the tables next to cashpoint. There was a need to
know what products to put up and how to attract consumers to buy. Picture
number twenty-nine shows the results.
Picture 29. Marketing possibilities next to cashpoint
56,3 %
23,4 %
32,8 %
56,3 %
0,0 %
10,0 %
20,0 %
30,0 %
40,0 %
50,0 %
60,0 %
After entering in a store, I immediately see
well-presentedtrademarks
products with lower costbudget
nice entities givinginspiration
professional personnel
18,8 % 20,3 %
70,3 %
0,0 %
10,0 %
20,0 %
30,0 %
40,0 %
50,0 %
60,0 %
70,0 %
80,0 %
On the table next to cashpoint, I always see
nice combinations forcreating entities
rich product displays withnice colors
topical ideas for the need
47
The picture shows that next to cashpoint 70.3 per cent of the customers want
to see current ideas for the current needs. Other possibilities were not noticed
that much. This can be seen for a good tip for the seasonal visual marketing in
this store. Point “other, what?” got answers where customers were wondering
“what table?” and told us that they had not ever even paid attention to the
table near cashpoint. Some answers mixed the table and the basket cart next
to cashpoint.
Question number seven was asked exactly in the same way both in Karhula
store and in Pasaati store. It was wanted to know how the customers see
these two different stores when walking through, and is there any difference
when they come to a traditional store and then into a store located in a
shopping center – is there a difference to where they pay their attention.
Picture number thirty shows the results.
Picture 30. Walking through the store, I’m paying attention to
Results of this question were quite uniform. Looking for a certain brand was a
popular way to navigate through this store with 45.3 per cent of answers; with
exactly the same per cent of answers, customers were looking for products for
their needs. 39.1 per cent of consumers were looking for clear world of colors
to reach the clothes for their own needs. 21.9 per cent of customers was
21,9 %
39,1 %
45,3 % 45,3 %
0,0 %
5,0 %
10,0 %
15,0 %
20,0 %
25,0 %
30,0 %
35,0 %
40,0 %
45,0 %
50,0 %
When walking trough the store, I concentrate on
combinations of the clothes andentities
clear world of colors
trademarks of the products
I only look products for a need

48
looking for ready sets and ideas for themselves. Again, there was answers to
the point “other, what?” and they told that the store is too full.
Next question was about the fact that there is a lot of wall space in this store;
what would be the most effective way to pay attention to the products using
wall space, and how to attract customers with the products put up on the wall.
Picture number thirty-one shows the results.
Picture 31. Products on a wall
The most important way to attract customers in this store was the brand
name. 46.9 per cent of customers was looking for a certain brand and paid
their attention to walls with certain shops with certain products. On the other
hand 45.3 per cent of customers was looking for a certain world of colors and
combinations. 40.6 per cent of consumers were paying attention to new
arrivals and current products. Point “other, what?” got answers for quality
versus price products.
Question number nine was about the store overlook. It was interesting to know
how the customers see the store that was just renovated in the autumn 2014.
Picture number thirty-two reveals the results.
46,9 %
40,6 %
45,3 %
37,0 %
38,0 %
39,0 %
40,0 %
41,0 %
42,0 %
43,0 %
44,0 %
45,0 %
46,0 %
47,0 %
48,0 %
When looking on the walls, I concentrateon
I only look for trademarks
new arrivals or topicalproducts
world of colors andcombinations

49
Picture 32. Overall store look
The results show that the most important point with 68.8 per cent of answers
is the fact of how clean and clear the store is. Products must be loosely
presented to attract customers. The second point that rose up was the ready
sets and mixed combinations of clothes and accessories with 34.4 per cent of
answers. Point “other, what?” got answers for the service orientation of the
personnel.
Question number ten was about the value of the store. It was wanted to know
how consumers see this store and what its value in their eyes is. Picture
number thirty-three reveals the results.
25,0 %
68,8 %
28,1 %
34,4 %
28,1 %
0,0 %
10,0 %
20,0 %
30,0 %
40,0 %
50,0 %
60,0 %
70,0 %
80,0 %
When shopping in the store, I concentrate on
I always look for the showcaseand entities there
tidiness and clarity, I want thatproducts are looselypresented
entities presented viatrademarks
ready ensembles and entities
dressing of the personnel
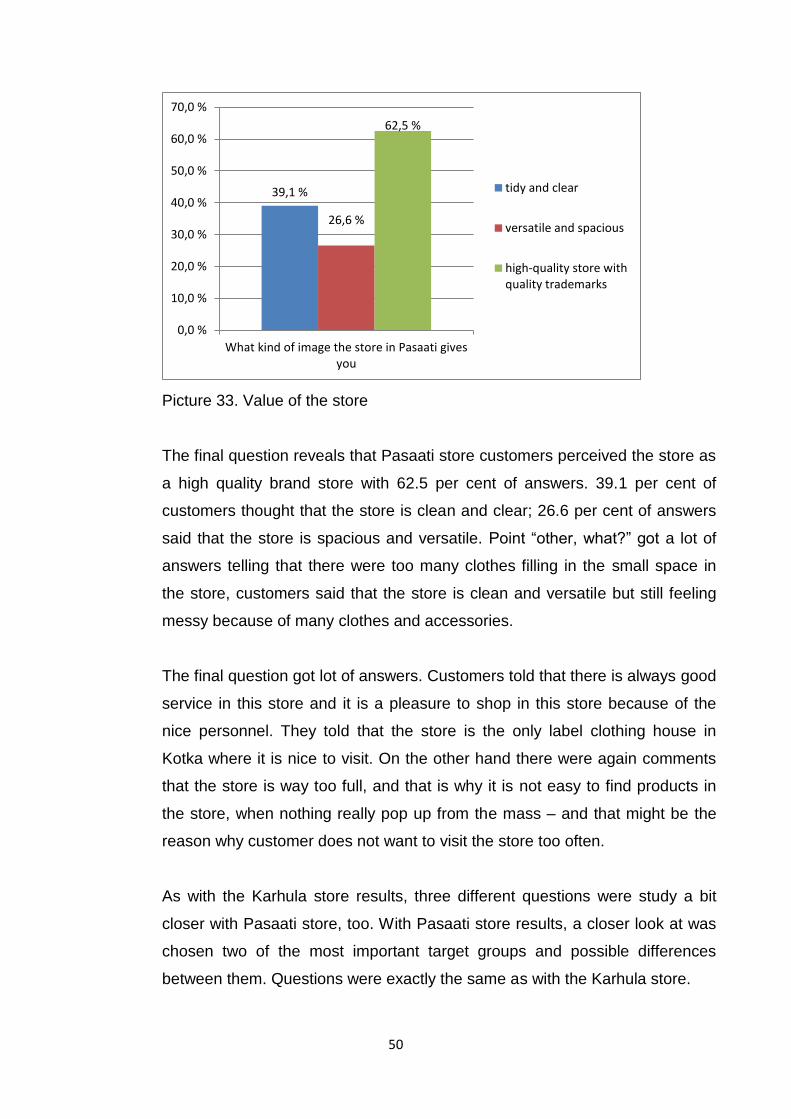
50
Picture 33. Value of the store
The final question reveals that Pasaati store customers perceived the store as
a high quality brand store with 62.5 per cent of answers. 39.1 per cent of
customers thought that the store is clean and clear; 26.6 per cent of answers
said that the store is spacious and versatile. Point “other, what?” got a lot of
answers telling that there were too many clothes filling in the small space in
the store, customers said that the store is clean and versatile but still feeling
messy because of many clothes and accessories.
The final question got lot of answers. Customers told that there is always good
service in this store and it is a pleasure to shop in this store because of the
nice personnel. They told that the store is the only label clothing house in
Kotka where it is nice to visit. On the other hand there were again comments
that the store is way too full, and that is why it is not easy to find products in
the store, when nothing really pop up from the mass – and that might be the
reason why customer does not want to visit the store too often.
As with the Karhula store results, three different questions were study a bit
closer with Pasaati store, too. With Pasaati store results, a closer look at was
chosen two of the most important target groups and possible differences
between them. Questions were exactly the same as with the Karhula store.
39,1 %
26,6 %
62,5 %
0,0 %
10,0 %
20,0 %
30,0 %
40,0 %
50,0 %
60,0 %
70,0 %
What kind of image the store in Pasaati givesyou
tidy and clear
versatile and spacious
high-quality store withquality trademarks

51
First the question number three was studied: the planning of a showcase of
the Pasaati store. Pictures below reveal the results.
Picture 34. Target group between 61-70 years
Picture 35. Target group between 51-60 years
Interesting comparison of these two target groups reveals that customers
between ages 51-60 are seeking for attractive entities but not really looking for
price versus quality products, as consumers between ages 61-70 do. World of
colors seems to be quite important for both as well as need and topicality of
the products. When planning a showcase of the Pasaati store, it seems to be
24%
47%
41%
29%
65%
18%
0%
10%
20%
30%
40%
50%
60%
70%
When watching a showcase, I concentrate on
attractive and interestingentities
price vs. quality
world of colors
details as scarfs, hats andaccessories
need or topicality
impressiveness
77%
0%
31%
15%
46%
8%
0%
10%
20%
30%
40%
50%
60%
70%
80%
90%
When watching a showcase, I concentrate on
attractive and interestingentities
price vs. quality
world of colors
details as scarfs, hats andaccessories
need or topicality
impressiveness
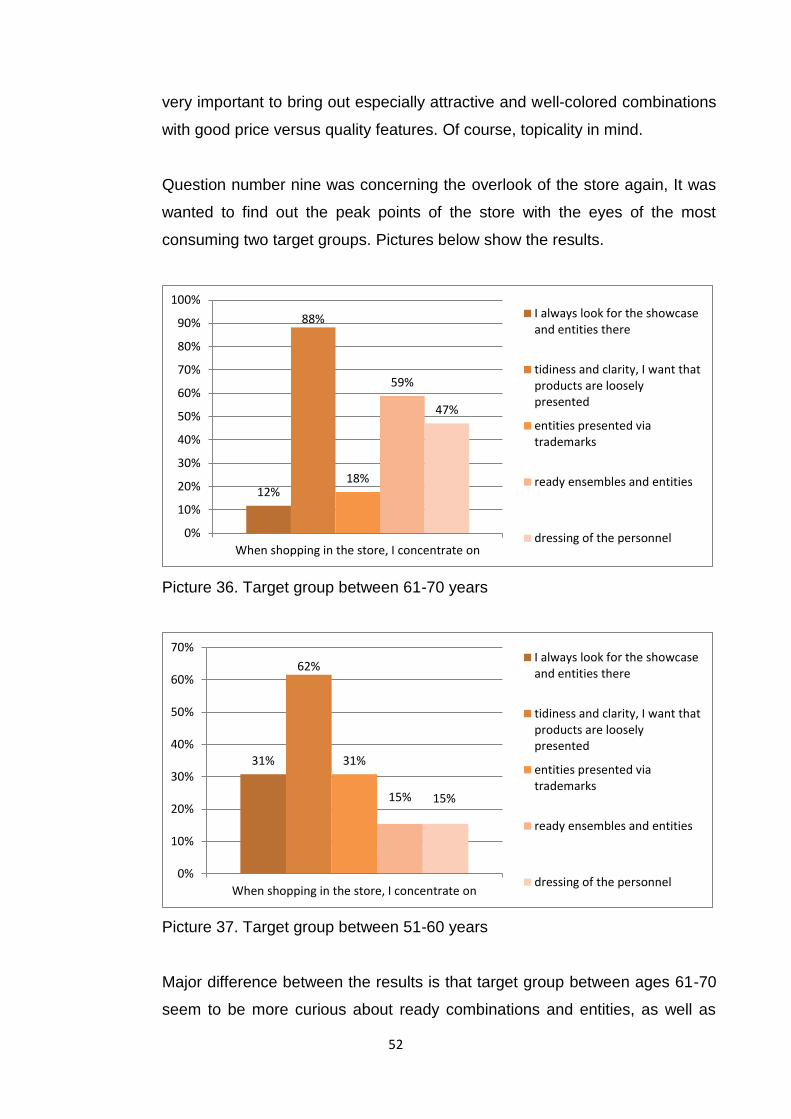
52
very important to bring out especially attractive and well-colored combinations
with good price versus quality features. Of course, topicality in mind.
Question number nine was concerning the overlook of the store again, It was
wanted to find out the peak points of the store with the eyes of the most
consuming two target groups. Pictures below show the results.
Picture 36. Target group between 61-70 years
Picture 37. Target group between 51-60 years
Major difference between the results is that target group between ages 61-70
seem to be more curious about ready combinations and entities, as well as
12%
88%
18%
59%
47%
0%
10%
20%
30%
40%
50%
60%
70%
80%
90%
100%
When shopping in the store, I concentrate on
I always look for the showcaseand entities there
tidiness and clarity, I want thatproducts are looselypresented
entities presented viatrademarks
ready ensembles and entities
dressing of the personnel
31%
62%
31%
15% 15%
0%
10%
20%
30%
40%
50%
60%
70%
When shopping in the store, I concentrate on
I always look for the showcaseand entities there
tidiness and clarity, I want thatproducts are looselypresented
entities presented viatrademarks
ready ensembles and entities
dressing of the personnel
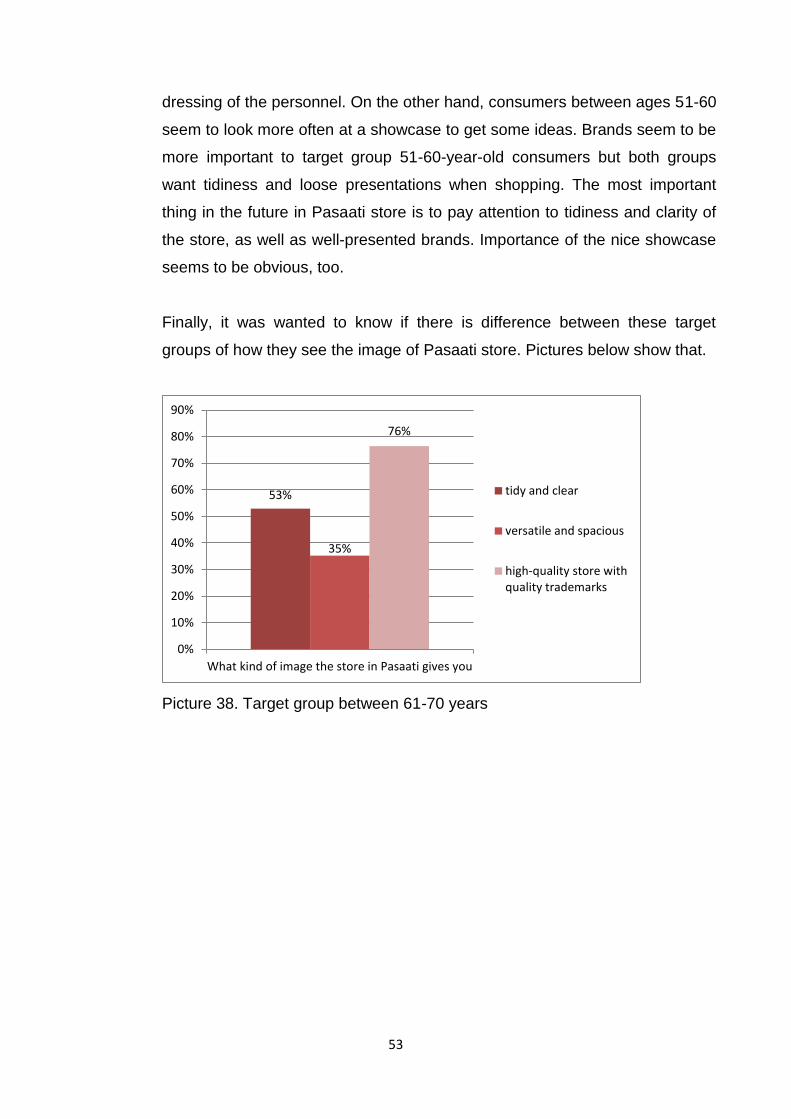
53
dressing of the personnel. On the other hand, consumers between ages 51-60
seem to look more often at a showcase to get some ideas. Brands seem to be
more important to target group 51-60-year-old consumers but both groups
want tidiness and loose presentations when shopping. The most important
thing in the future in Pasaati store is to pay attention to tidiness and clarity of
the store, as well as well-presented brands. Importance of the nice showcase
seems to be obvious, too.
Finally, it was wanted to know if there is difference between these target
groups of how they see the image of Pasaati store. Pictures below show that.
Picture 38. Target group between 61-70 years
53%
35%
76%
0%
10%
20%
30%
40%
50%
60%
70%
80%
90%
What kind of image the store in Pasaati gives you
tidy and clear
versatile and spacious
high-quality store withquality trademarks
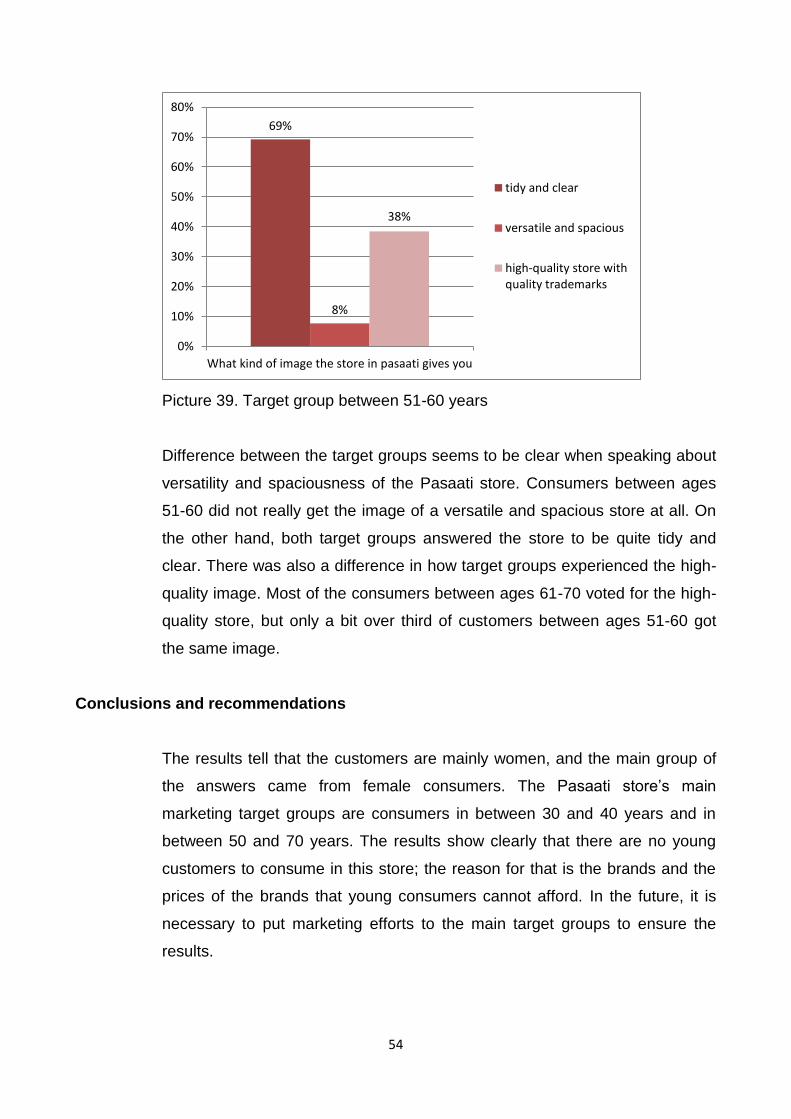
54
Picture 39. Target group between 51-60 years
Difference between the target groups seems to be clear when speaking about
versatility and spaciousness of the Pasaati store. Consumers between ages
51-60 did not really get the image of a versatile and spacious store at all. On
the other hand, both target groups answered the store to be quite tidy and
clear. There was also a difference in how target groups experienced the high-
quality image. Most of the consumers between ages 61-70 voted for the high-
quality store, but only a bit over third of customers between ages 51-60 got
the same image.
Conclusions and recommendations
The results tell that the customers are mainly women, and the main group of
the answers came from female consumers. The Pasaati store’s main
marketing target groups are consumers in between 30 and 40 years and in
between 50 and 70 years. The results show clearly that there are no young
customers to consume in this store; the reason for that is the brands and the
prices of the brands that young consumers cannot afford. In the future, it is
necessary to put marketing efforts to the main target groups to ensure the
results.
69%
8%
38%
0%
10%
20%
30%
40%
50%
60%
70%
80%
What kind of image the store in pasaati gives you
tidy and clear
versatile and spacious
high-quality store withquality trademarks

55
When thinking about the showcase of the store, company’s visualist needs to
ensure that colors, topicality and ensembles are well presented. That is
exactly the same result as was received in Karhula store. The peak point of
visual marketing of this store is the entrance, too. The result was so clear that
the other choices did not rise up at all. So the result tells us that it is definitely
important for visual marketing of this store to put all the efforts to the entrance
and surrounding of it. Tidiness and cleanliness and visual impressiveness
must be clear in this area to attract customers to come in and push to buy.
About entrance, it came up that when entering our store customers see well-
presented and interesting brands and professional sales personnel. This tells
that the company does have professionals to serve customers and brands that
attract consumers; On the other hand, it became clear that cheaper quality
brands that have their own place near to entrance are not visible to customers
at all – why? Do they remain under their feet for larger and more expensive
brands?
Tables next to cashpoint were seen for topical products and that is the way
they should be kept in the future, too. New arrivals and seasonal products
should be seen there continuously. It was surprising that so many responses
did not notice the table at all; is there a reason to change the order maybe, so
that customers could clearly separate the one important visual marketing point
and maybe do some impulse purchases more actively.
When walking through the store, customers paid attention to brands and the
world of colors. They also came just for a reason and bought some product
only for a need. Also with this question, it became clear that when entering a
store in a shopping center, customers are seeking for certain brands and
names and they can come in only for a certain brand and products it offers.
We got answers concerning the tidiness of the store and notices that the store
is way too full. When a personnel thinks that there is a rich presentation, can
customer think that there are too much clothes and tidiness disappears? In the
future, it is very important to pay attention to that every brand has its own clear

56
world of colors to attract customers and presentations are not too rich;
sometimes less is more.
Next it was found out that when attracting customers with products put on the
wall, we should use colors and combinations. And again, brand name is the
guiding line to Pasaati’s store customers. The more clearly the brand name
and visual image can be repeated, the better.
Store overlook must be kept so that products are loosely presented to attract
customers and there must be enough ready sets and mixed combinations to
inspire consumers to buy, without forgetting a service orientation of the
personnel. Mixed combinations can be presented the most effectively with the
mannequins located along corridors and clear points of the store. Value of the
store was estimated most likely to high value brand store; a bit over third of
the responses thought that the store was tidy and clean, but only few thought
that it would be versatile and spacious. Many negative answers were received
concerning tidiness and spaciousness which must be recognized and fixed to
offer the customers better visual image of the company, on the other hand
there were many positive feedbacks concerning the service and professional
personnel that the company can be proud of.
As with the Karhula store, again, three different questions were raised above
all and the results were compared between the most important target groups
of this store especially. Interesting points and differences between the results
can help management to improve the key points of this store and overlook
actions for the future as well. Results ease visual marketing for the special
target group customers and give new ideas for the future to improve business
to the next level.
6.3 Recommendations for the future
It would definitely be interesting to find out all the chains’ stores’ visual
marketing statement nowadays, and how it could be improved in the future for
the better competitiveness and better attraction of the consumers. This would
57
be a larger project and would need some more time than it is possible to
implement during just one thesis. On the basis of the respondents of the
personnel could be created an image that would help to inform and train the
staff to do daily visual routines better in the future. Ideas could be shared
more actively and people could act more effectively together. No doubt, the
company could innovate the actions and be more innovative together.
Feedback from the customers brings the company more close to consumers
and creates the image that it cares to do business together with them, too.
From this thesis arise many ideas and thoughts for the future, one just needs
to bring them into action.
58
REFERENCES
Berkun, S. 2006. Projektinhallinnan taito. Alkuperäisen teoksen nimi: The Art
Of Project Management. Suomentanut: Holttinen, J. Helsinki: Readme.fi
Campbell, K. 2013. Using Pinterest for Visual Marketing.
http://webmarketingtoday.com/articles/109811-Using-Pinterest-for-Visual-
Marketing/. (Accessed 5 Jan. 2015)
Eskola, J. & Vastamäki, J. 2001. Teemahaastattelu, opit ja opetukset. In
Aaltola, J. & Valli, R. Ikkunoita tutkimusmetodeihin 1. Jyväskylä: PS-
kustannus
Hirsjärvi, S. & Remes, P. & Sajavaara, P. 2004. Tutki ja kirjoita. Helsinki:
Tammi
Hirvi, A. & Nyholm, S. 2009. Visualistin työkalupakki. Zolan Oy.
Karhulanlehto Ltd. 2014. Orientation guide, company presentation.
Kotler, P. 2001. A Framework for Marketing Management. New Jersey:
Prentice-Hall , Inc.
Lea-Greenwood, G. 2011. Fashion Marketing Communications.
http://ezproxy.saimia.fi:2051/lib/scp/reader.action?docID=10611540
(Accessed 8 Aug. 2014)
Mattinen, H. & Sierla, S. 2009. Tutkimusmatka lojaliteettimarkkinointiin: kuinka
edelläkävijät uudistavat markkinointikäytäntöjä. Helsinki: Talentum.
Nieminen, T. 2010, Visuaalinen markkinointi. Helsinki: WSOYpro Oy.
59
Noel, H. 2009. Consumer behaviour. Singapore: AVA Book Production Pte.
Ltd.
Rissanen, T. 2006. Hyvän palvelun kehittäminen. Jyväskylä: Pohjantähti.
Saarela-Kinnunen, M. & Eskola, J. 2001. Tapaus ja tutkimus =
tapaustutkimus? Teoksessa Aaltola J., Valli R. (toim.) Ikkunoita
tutkimusmetodeihin 1. Jyväskylä: PS-kustannus.
Shain, D., Campbell, A., Langton, D. 2011. Visual Marketing : 99 Proven
Ways for Small Businesses to Market with Images and Design.
http://ezproxy.saimia.fi:2051/lib/scp/detail.action?docID=10494574
(Accessed 2 Oct. 2014)
Vilkka, H. & Airaksinen, T. 2003. Toiminnallinen opinnäytetyö. Helsinki:
Tammi.
Ylikoski, T. 1999. Unohtuiko asiakas? 2. uudistettu painos. Helsinki: KY-
Palvelu Oy.

60
APPENDIX 1 Interview of the visualist
Myymälän näyteikkunoiden kokoamisen lähtökohta ? (teeman/vuodenajan/juhlapyhän mukaan(ko)? )
A (attention) : huomion herättäminen
I (interest) : mielenkiinnon herättäminen
D (desire) : halu ostaa
A (action) : toiminta eli ostopäätös
Ajatellaan myymälämme näyteikkunat edellä mainitun markkinointiprosessin kautta:
Millä keinoin herätät huomion?
Millä keinoin herätät mielenkiinnon?
Millä keinoin herätät asiakkaassa halun ostaa?
Ja millä keinoin kannustat ostopäätökseen?
Mielestäsi tärkein tai tärkeimmät asiat joita haluat korostaa näyteikkunan kokoamisessa visualistin silmin
markkinointimielessä?
Millaisen mielikuvan visuaalinen ilmeemme mielestäsi antaa yrityksestämme?
Avoimet kommentit myymälämme näyteikkunoiden visuaaliseen ilmeeseen liittyen? (esim. yleisilme,
selkeys, värien käyttö, ryhmittely, rytmitys, valaistus jne.)

61
APPENDIX 2 Interview of the personnel
Jos jaetaan myymälä osiin: sisääntulo, ykköspöytä, välitila ja seinusta; mikä tai mitkä näistä on/ovat
mielestäsi myymälälle oman osastosi visuaalisesti tärkeimmät kohteet?
A (attention) : huomion herättäminen
I (interest) : mielenkiinnon herättäminen
D (desire) : halu ostaa
A (action) : toiminta eli ostopäätös
Ajatellaan myymälän ja osastosi eri osa-alueita edellä mainitun markkinointiprosessin kautta:
Sisääntulo: mikä siinä herättää huomion, mielenkiinnon, halun ostaa ja viimein osotopäätöksen? Millä
konstein nuo saadaan aikaiseksi?
Ykköspöytä: mikä siinä herättää huomion, mielenkiinnon, halun ostaa ja viimein osotopäätöksen? Millä
konstein nuo saadaan aikaiseksi?
Välitila: mikä siinä herättää huomion, mielenkiinnon, halun ostaa ja viimein osotopäätöksen? Millä konstein
nuo saadaan aikaiseksi?
Seinusta: mikä siinä herättää huomion, mielenkiinnon, halun ostaa ja viimein osotopäätöksen? Millä
konstein nuo saadaan aikaiseksi?
Mitkä ovat mielestäsi tärkeimmät visuaaliset välineet joita osastoltasi haluat korostaa? Pöytäsommittelut,
valaistus, asiakkaan ohjaaminen näytekuvin, väriryhmittelyt, mix-markkinointi jne...
Millaisen mielikuvan visuaalinen ilmeemme mielestäsi antaa yrityksestämme?
Avoimet kommentit visuaaliseen ilmeeseen liittyen? (esim. yleisilme, selkeys, opasteet, värien käyttö,
henkilökunnan työvaatetus jne.)

62
APPENDIX 3 Questionnaire for Karhula store customers
1. Vastaajan sukupuoli (ympyröi oikea vaihtoehto)
a. mies / nainen
2. vastaajan ikä (ympyröi oikea vaihtoehto)
a. alle 20 b. 20 - 30 c. 31 – 40 d. 41 – 50 e. 51 – 60 f. 61 – 70 g. 71 – 80 h. 81 – 90 i. yli 90
3. Myymälän näyteikkunaa tarkastellessani kiinnitän huomioni (ympyröi sopiva vaihtoehto tai vaihtoehdot, enintään kolme)
a. houkutteleviin ja kiinnostaviin kokonaisuuksiin b. tuotteiden hinta/laatusuhteeseen c. värien käyttöön d. yksityiskohtiin, kuten huivit, päähineet ja korut e. ajankohtaisuuteen tai tulevaan tarpeeseen f. näyttävyyteen g. jokin muu, mikä? ___________________________________________________________
4. Saapuessani myymälään, mihin kiinnitän ensimmäiseksi huomiota (ympyröi sopiva vaihtoehto tai vaihtoehdot, enintään kolme)
a. sisääntulo ja yleisilme b. puettuihin mallinukkeihin käytävän varrella c. kassan vieressä oleva pöytä, jolla uutuuksia tai kampanjatuotteita esillä d. en mihinkään erityisesti e. jokin muu, mikä? __________________________________________________________
5. Myymälässä minua vastassa ovat (ympyröi sopiva vaihtoehto tai vaihtoehdot, enintään kolme)
a. hyvin esillä olevat ajankohtaiset tuotteet b. vaihtuvat uutuudet joihin kiinnitän huomioni c. kivasti yhdisteltyjä kokonaisuuksia joista saan inspiraatiota d. ammattitaitoinen myyjä e. jokin muu, mikä? __________________________________________________________
6. Kassan vieressä olevalta pöydältä löydän aina (ympyröi sopiva vaihtoehto tai vaihtoehdot, enintään kolme)
a. tarjouksia ja ajankohtaisia tuotteita b. värisävyittäin aseteltuja tuotteita c. kivoja yhdistelmiä ja kokonaisuuksia d. jokin muu, mikä? __________________________________________________________
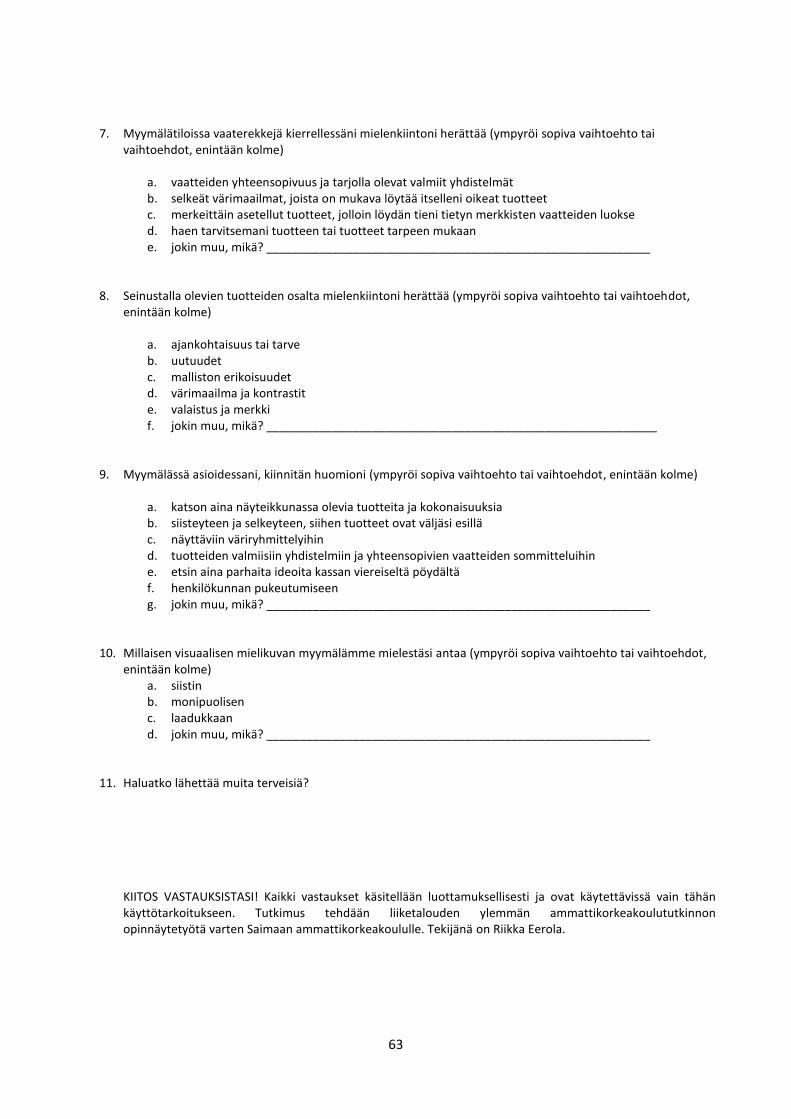
63
7. Myymälätiloissa vaaterekkejä kierrellessäni mielenkiintoni herättää (ympyröi sopiva vaihtoehto tai vaihtoehdot, enintään kolme)
a. vaatteiden yhteensopivuus ja tarjolla olevat valmiit yhdistelmät b. selkeät värimaailmat, joista on mukava löytää itselleni oikeat tuotteet c. merkeittäin asetellut tuotteet, jolloin löydän tieni tietyn merkkisten vaatteiden luokse d. haen tarvitsemani tuotteen tai tuotteet tarpeen mukaan e. jokin muu, mikä? __________________________________________________________
8. Seinustalla olevien tuotteiden osalta mielenkiintoni herättää (ympyröi sopiva vaihtoehto tai vaihtoehdot, enintään kolme)
a. ajankohtaisuus tai tarve b. uutuudet c. malliston erikoisuudet d. värimaailma ja kontrastit e. valaistus ja merkki f. jokin muu, mikä? ___________________________________________________________
9. Myymälässä asioidessani, kiinnitän huomioni (ympyröi sopiva vaihtoehto tai vaihtoehdot, enintään kolme)
a. katson aina näyteikkunassa olevia tuotteita ja kokonaisuuksia b. siisteyteen ja selkeyteen, siihen tuotteet ovat väljäsi esillä c. näyttäviin väriryhmittelyihin d. tuotteiden valmiisiin yhdistelmiin ja yhteensopivien vaatteiden sommitteluihin e. etsin aina parhaita ideoita kassan viereiseltä pöydältä f. henkilökunnan pukeutumiseen g. jokin muu, mikä? __________________________________________________________
10. Millaisen visuaalisen mielikuvan myymälämme mielestäsi antaa (ympyröi sopiva vaihtoehto tai vaihtoehdot, enintään kolme)
a. siistin b. monipuolisen c. laadukkaan d. jokin muu, mikä? __________________________________________________________
11. Haluatko lähettää muita terveisiä? KIITOS VASTAUKSISTASI! Kaikki vastaukset käsitellään luottamuksellisesti ja ovat käytettävissä vain tähän käyttötarkoitukseen. Tutkimus tehdään liiketalouden ylemmän ammattikorkeakoulututkinnon opinnäytetyötä varten Saimaan ammattikorkeakoululle. Tekijänä on Riikka Eerola.
64
APPENDIX 4 Questionnaire for Pasaati store customers
1. Vastaajan sukupuoli (ympyröi oikea vaihtoehto)
a. mies / nainen
2. vastaajan ikä (ympyröi oikea vaihtoehto)
a. alle 20 b. 20 - 30 c. 31 – 40 d. 41 – 50 e. 51 – 60 f. 61 – 70 g. 71 – 80 h. 81 – 90 i. yli 90
3. Myymälän näyteikkunaa tarkastellessani kiinnitän huomioni (ympyröi sopiva vaihtoehto tai vaihtoehdot, enintään kolme)
a. houkutteleviin ja kiinnostaviin kokonaisuuksiin b. tuotteiden hinta/laatusuhteeseen c. värien käyttöön d. yksityiskohtiin, kuten huivit, päähineet ja korut e. ajankohtaisuuteen tai tulevaan tarpeeseen f. näyttävyyteen g. jokin muu, mikä? ___________________________________________________________
4. Saapuessani myymälään, mihin kiinnitän ensimmäiseksi huomiota (ympyröi sopiva vaihtoehto tai vaihtoehdot, enintään kolme)
a. sisääntulo ja yleisilme, avoin näyteikkuna josta näen myymälään b. seinustalle, sieltä löydän kivoja uutuuksia c. kassan vieressä oleva pöytä, jolla uutuuksia tai kampanjatuotteita esillä d. en mihinkään erityisesti e. jokin muu, mikä? __________________________________________________________
5. Myymälässä minua vastassa ovat (ympyröi sopiva vaihtoehto tai vaihtoehdot, enintään kolme)
a. hyvin esillä olevat mielenkiintoiset merkkituotteet b. hinta-laatusuhteeltaan edulliset tuotteet, jotka kiinnittävät huomioni c. kivasti yhdisteltyjä ja runsaita kokonaisuuksia joista saan inspiraatiota d. ammattitaitoinen myyjä e. jokin muu, mikä? __________________________________________________________
6. Kassan vieressä olevalta pöydältä löydän aina (ympyröi sopiva vaihtoehto tai vaihtoehdot, enintään kolme)
a. kivoja yhdistelmiä joista saan luotua kokonaisuuksia b. runsaasti erilaisia värisävyittäin aseteltuja tuotteita c. ajankohtaisia ideoita tarpeeni mukaan d. jokin muu, mikä? __________________________________________________________
65
7. Myymälätiloissa vaaterekkejä kierrellessäni mielenkiintoni herättää (ympyröi sopiva vaihtoehto tai vaihtoehdot, enintään kolme)
a. vaatteiden yhteensopivuus ja tarjolla olevat valmiit yhdistelmät b. selkeät värimaailmat, joista on mukava löytää itselleni oikeat tuotteet c. merkeittäin asetellut tuotteet, jolloin löydän tieni tietyn merkkisten vaatteiden luokse d. haen tarvitsemani tuotteen tai tuotteet tarpeen mukaan e. jokin muu, mikä? __________________________________________________________
8. Seinustalla olevien tuotteiden osalta mielenkiintoni herättää (ympyröi sopiva vaihtoehto tai vaihtoehdot, enintään kolme)
a. haen tuotteeni merkkien mukaan; merkki b. uutuudet ja ajankohtaiset tuotteet c. värimaailma ja yhdistelmät d. jokin muu, mikä? ___________________________________________________________
9. Myymälässä asioidessani, kiinnitän huomioni (ympyröi sopiva vaihtoehto tai vaihtoehdot, enintään kolme)
a. katson aina näyteikkunassa olevia tuotteita ja kokonaisuuksia b. siisteyteen ja selkeyteen, siihen että tuotteet ovat väljästi esillä c. merkeittäin asetelluihin kokonaisuuksiin d. tuotteiden valmiisiin yhdistelmiin ja yhteensopivien vaatteiden sommitteluihin e. henkilökunnan pukeutumiseen f. jokin muu, mikä? __________________________________________________________
10. Millaisen visuaalisen mielikuvan myymälämme mielestäsi antaa (ympyröi sopiva vaihtoehto tai vaihtoehdot, enintään kolme)
a. siistin ja selkeän b. monipuolisen ja avaran c. laadukkaan merkkituotemyymälän d. jokin muu, mikä? __________________________________________________________
11. Haluatko lähettää muita terveisiä? KIITOS VASTAUKSISTASI! Kaikki vastaukset käsitellään luottamuksellisesti ja ovat käytettävissä vain tähän käyttötarkoitukseen. Tutkimus tehdään liiketalouden ylemmän ammattikorkeakoulututkinnon opinnäytetyötä varten Saimaan ammattikorkeakoululle. Tekijänä on Riikka Eerola.
Related Documents