The Journal of General Physiology J. Gen. Physiol. © The Rockefeller University Press $8.00 Volume 128 Number 2 August 2006 153–169 http://www.jgp.org/cgi/doi/10.1085/jgp.200609557 153 ARTICLE Visual Cycle: Dependence of Retinol Production and Removal on Photoproduct Decay and Cell Morphology Petri Ala-Laurila, 1 Alexander V. Kolesnikov, 2 Rosalie K. Crouch, 3 Efthymia Tsina, 4 Sergey A. Shukolyukov, 2 Victor I. Govardovskii, 2 Yiannis Koutalos, 3 Barbara Wiggert, 5 Maureen E. Estevez, 1 and M. Carter Cornwall 1 1 Department of Physiology and Biophysics, Boston University School of Medicine, Boston, MA 02118 2 Institute for Evolutionary Physiology and Biochemistry, Russian Academy of Sciences, 194223 St. Petersburg, Russia 3 Department of Ophthalmology, Medical University of South Carolina, Charleston, SC 29425 4 Department of Ophthalmology, Agia Sophia Children’s Hospital, University of Athens, Athens 11527, Greece 5 National Eye Institute, National Institutes of Health, Bethesda, MD 20892 The visual cycle is a chain of biochemical reactions that regenerate visual pigment following exposure to light. Initial steps, the liberation of all-trans retinal and its reduction to all-trans retinol by retinol dehydrogenase (RDH), take place in photoreceptors. We performed comparative microspectrophotometric and microfluorometric mea- surements on a variety of rod and cone photoreceptors isolated from salamander retinae to correlate the rates of photoproduct decay and retinol production. Metapigment decay rate was spatially uniform within outer segments and 50–70 times faster in the cells that contained cone-type pigment (SWS2 and M/LWS) compared to cells with rod-type pigment (RH1). Retinol production rate was strongly position dependent, fastest at the base of outer segments. Retinol production rate was 10–40 times faster in cones with cone pigments (SWS2 and M/LWS) than in the basal OS of rods containing rod pigment (RH1). Production rate was approximately five times faster in rods containing cone pigment (SWS2) than the rate in basal OS of rods containing the rod pigment (RH1). We show that retinol production is defined either by metapigment decay rate or RDH reaction rate, depending on cell type or outer segment region, whereas retinol removal is defined by the surface-to-volume ratio of the outer segment and the availability of retinoid binding protein (IRBP). The more rapid rates of retinol production in cones com- pared to rods are consistent with the more rapid operation of the visual cycle in these cells. INTRODUCTION Photon absorption by a visual pigment within rod and cone photoreceptors produces a cis-to-trans isomeriza- tion of its retinal chromophore, resulting in an activa- tion of the visual pigment (R* or metarhodopsin II). This initial photochemical event triggers the activation of the visual transduction cascade that eventually leads to transmission of a visual signal from the photorecep- tor to other cells within the retina and thence to the brain. Once the chromophore has undergone photo- isomerization, the visual pigment is said to be “bleached,” i.e., it is no longer able to absorb photons in the “visual” region of the spectrum. The regeneration of the visual pigment to its previous dark state occurs by a series of biochemical reactions referred to as the visual cycle. The initial steps in the visual cycle occur immediately following photon absorption and appearance of the ac- tive form of the visual pigment. These initial steps are slow thermal reactions that result in separation of the all-trans retinal chromophore from opsin, the apopro- tein portion of the visual pigment, followed by the reduction of all-trans retinal to all-trans retinol. All of these steps occur within the photoreceptor outer segment. Beyond this point, the visual cycle for rod and cone photoreceptors appears to diverge. In rods, reti- nol translocates from the outer segment via the intercel- lular matrix to the retinal pigment epithelium, where it is subjected to a multistep enzymatic conversion to 11-cis retinal. After this regenerative isomerization, the 11-cis retinal chromophore is translocated back to rod outer segments, where it condenses with the apoprotein to regenerate the dark visual pigment. In cones, recent work has proposed that all-trans retinol is likely to trans- locate from outer segments to Müller cells, where enzy- matic isomerization to 11-cis retinol is suggested to occur (Mata et al., 2002, see also Das et al., 1992). It is proposed that after transfer of this chromophore back to cones, oxidation of the retinol to retinal is followed by recombination of retinal with opsin to form the dark visual pigment. P. Ala-Laurila and A.V. Kolesnikov contributed equally to this work. Correspondence to Petri Ala-Laurila: [email protected] Abbreviations used in this paper: IRBP, interphotoreceptor retinoid binding protein; IS, inner segment; LED, light-emitting diode; MSP, microspectrophotometry; NADPH, nicotinamide adenine dinucleo- tide phosphate (reduced form); OS, outer segment; PSB, protonated Schiff base; RAL, retinal; RDH, retinol dehydrogenase; ROL, retinol; ROS, rod outer segment. on February 10, 2016 jgp.rupress.org Downloaded from Published July 17, 2006

Welcome message from author
This document is posted to help you gain knowledge. Please leave a comment to let me know what you think about it! Share it to your friends and learn new things together.
Transcript
The
Jour
nal o
f G
ener
al P
hysi
olo
gy
J. Gen. Physiol. © The Rockefeller University Press $8.00Volume 128 Number 2 August 2006 153–169http://www.jgp.org/cgi/doi/10.1085/jgp.200609557
153
A RT I C L E
Visual Cycle: Dependence of Retinol Production and Removal on Photoproduct Decay and Cell Morphology
Petri Ala-Laurila,1 Alexander V. Kolesnikov,2 Rosalie K. Crouch,3 Efthymia Tsina,4 Sergey A. Shukolyukov,2 Victor I. Govardovskii,2 Yiannis Koutalos,3 Barbara Wiggert,5 Maureen E. Estevez,1 and M. Carter Cornwall1
1Department of Physiology and Biophysics, Boston University School of Medicine, Boston, MA 021182Institute for Evolutionary Physiology and Biochemistry, Russian Academy of Sciences, 194223 St. Petersburg, Russia3Department of Ophthalmology, Medical University of South Carolina, Charleston, SC 294254Department of Ophthalmology, Agia Sophia Children’s Hospital, University of Athens, Athens 11527, Greece5National Eye Institute, National Institutes of Health, Bethesda, MD 20892
The visual cycle is a chain of biochemical reactions that regenerate visual pigment following exposure to light. Initial steps, the liberation of all-trans retinal and its reduction to all-trans retinol by retinol dehydrogenase (RDH), take place in photoreceptors. We performed comparative microspectrophotometric and microfl uorometric mea-surements on a variety of rod and cone photoreceptors isolated from salamander retinae to correlate the rates of photoproduct decay and retinol production. Metapigment decay rate was spatially uniform within outer segments and 50–70 times faster in the cells that contained cone-type pigment (SWS2 and M/LWS) compared to cells with rod-type pigment (RH1). Retinol production rate was strongly position dependent, fastest at the base of outer segments. Retinol production rate was 10–40 times faster in cones with cone pigments (SWS2 and M/LWS) than in the basal OS of rods containing rod pigment (RH1). Production rate was approximately fi ve times faster in rods containing cone pigment (SWS2) than the rate in basal OS of rods containing the rod pigment (RH1). We show that retinol production is defi ned either by metapigment decay rate or RDH reaction rate, depending on cell type or outer segment region, whereas retinol removal is defi ned by the surface-to-volume ratio of the outer segment and the availability of retinoid binding protein (IRBP). The more rapid rates of retinol production in cones com-pared to rods are consistent with the more rapid operation of the visual cycle in these cells.
I N T R O D U C T I O N
Photon absorption by a visual pigment within rod and
cone photoreceptors produces a cis-to-trans isomeriza-
tion of its retinal chromophore, resulting in an activa-
tion of the visual pigment (R* or metarhodopsin II).
This initial photochemical event triggers the activation
of the visual transduction cascade that eventually leads
to transmission of a visual signal from the photorecep-
tor to other cells within the retina and thence to the
brain. Once the chromophore has undergone photo-
isomerization, the visual pigment is said to be “bleached,”
i.e., it is no longer able to absorb photons in the “visual”
region of the spectrum. The regeneration of the visual
pigment to its previous dark state occurs by a series of
biochemical reactions referred to as the visual cycle.
The initial steps in the visual cycle occur immediately
following photon absorption and appearance of the ac-
tive form of the visual pigment. These initial steps are
slow thermal reactions that result in separation of the
all-trans retinal chromophore from opsin, the apopro-
tein portion of the visual pigment, followed by the
reduction of all-trans retinal to all-trans retinol. All of
these steps occur within the photoreceptor outer
segment. Beyond this point, the visual cycle for rod and
cone photoreceptors appears to diverge. In rods, reti-
nol translocates from the outer segment via the intercel-
lular matrix to the retinal pigment epithelium, where it
is subjected to a multistep enzymatic conversion to
11-cis retinal. After this regenerative isomerization, the
11-cis retinal chromophore is translocated back to rod
outer segments, where it condenses with the apoprotein
to regenerate the dark visual pigment. In cones, recent
work has proposed that all-trans retinol is likely to trans-
locate from outer segments to Müller cells, where enzy-
matic isomerization to 11-cis retinol is suggested to
occur (Mata et al., 2002, see also Das et al., 1992). It is
proposed that after transfer of this chromophore back
to cones, oxidation of the retinol to retinal is followed
by recombination of retinal with opsin to form the dark
visual pigment.
P. Ala-Laurila and A.V. Kolesnikov contributed equally to this work.
Correspondence to Petri Ala-Laurila: [email protected]
Abbreviations used in this paper: IRBP, interphotoreceptor retinoid
binding protein; IS, inner segment; LED, light-emitting diode; MSP,
microspectrophotometry; NADPH, nicotinamide adenine dinucleo-
tide phosphate (reduced form); OS, outer segment; PSB, protonated
Schiff base; RAL, retinal; RDH, retinol dehydrogenase; ROL, retinol;
ROS, rod outer segment.
on February 10, 2016
jgp.rupress.orgD
ownloaded from
Published July 17, 2006
154 Retinol Kinetics in Rods and Cones
It is well known that under normal bright daylight
conditions, rod photoreceptors are unresponsive to
light, and our visual system relies substantially, if not ex-
clusively, on cones to transmit visual images to the brain.
This is in large part due to biochemical and physiologi-
cal differences within rod and cone outer segments that
regulate their fl ash sensitivity, as well as differences in
recovery mechanisms during and following exposure to
varying levels of background light. For instance, cones
of cold-blooded vertebrates (salamander) recover sensi-
tivity following bright bleaching light �10-fold faster
than do rods of the same species (Jones et al., 1989;
Jones et al., 1993). Similarly, in man, both classical psy-
chophysical results and recent work comparing human
rod and cone ERGs show that the recovery of sensitivity
after massive bleach takes in cones 1–2 min, whereas
in rods it needs �20 min (Thomas and Lamb, 1999;
Mahroo and Lamb, 2004).
Difference in the rates of recovery may be related to
a difference in the way rods and cones handle the pho-
toproducts of bleaching, in particular, all-trans retinal.
This idea is based on two important observations. First,
exposure of photoreceptors to bright light results in the
persistence of metaproducts and leads to a prolonged
activation of the transduction cascade that limits recov-
ery of sensitivity (for review see McBee et al., 2001).
Second, all-trans retinal can combine in vitro with opsin
to form complexes that have signifi cant G-protein
activity (Fukada and Yoshizawa, 1981; Cohen et al.,
1992; Surya et al., 1995; Jäger et al., 1996), thereby
maintaining the activity of the transduction cascade at
a high level. Thus, reduction of retinal to retinol may
be necessary for the quenching of the catalytic activity.
In addition, experiments have shown that the reduc-
tion of retinal to retinol under some circumstances may
be rate limiting in the visual cycle (Saari et al., 1998).
The idea is also consistent with biochemical studies
(Palczewski et al., 1994; Rattner et al., 2000), both of
which implicate the possible involvement of outer seg-
ment retinol dehydrogenase (RDH) in limiting the rate
of response recovery by perhaps regulating the activities
of transducin, rhodopsin kinase, arrestin, or the rate of
pigment regeneration.
The large differences in the rate of pigment regen-
eration and response recovery that have been observed
in rods and cones could derive from a variety of factors.
Principal among these are (1) different rates of libera-
tion of retinal following metapigment decay in different
cell types, and (2) differences in the intrinsic rates of
cone versus rod retinal dehyrogenases (RDHs). Some
measurements of differences in RDH activity have been
documented in cone-rich and rod-rich retinae (Mata
et al., 2002). However, no systematic characterization of
the intrinsic rod and cone RDH activities has yet been
undertaken. Thus, is it not clear to what extent differ-
ences in RDH rate may explain the observed large differ-
ences in cone vs. rod recovery. Whether such rod/cone
differences in recovery rate may be due to differences
in photoproduct decay rate has never been investigated
either. Thus, the primary goal of the present study was
to measure the rates of photoproduct decay in rods
and cones and to determine the extent to which these
rates contribute to different rates of retinol production.
A second goal was to measure rates of retinol clearance
in these same photoreceptor outer segments following
bleaching and to determine what relationship may exist
between the observed clearance rates of retinol and dif-
ferent outer segment morphologies.
In this study, we employed microfl uorometry and
microspectrophotometry of intact, isolated salamander
photoreceptors to characterize the time courses of
metarhodopsin decay and all-trans retinol production
in various types of rods and cones that differ in their
pigment type and morphology. These cell types were
red and green rods in which the pigments (RH1 and
SWS2, respectively) are contained in internal disk mem-
branes and red- and blue-sensitive cones in which the
pigments (L/MWS and SWS2) are contained in the
plasma membrane (see Ebrey and Koutalos, 2001, for a
discussion of the classifi cation of visual pigment types).
We applied a simple kinetic scheme of retinal-to-
retinol conversion to the data to defi ne the rate-limiting
step(s) of retinol production in each cell type. Our
analysis shows that the rate of retinol production is de-
fi ned either by the metapigment decay rate or the RDH
reaction rate. Either of these can be the rate-limiting
step of retinol production depending on the cell type
and the OS region. Results showed that metarhodopsin
decay rate limited retinol production only at the basal
OS of salamander red rods with the RH1 pigment. In all
other cell types and OS regions, the rate-limiting step
was the RDH reaction. We hypothesize that the modula-
tory step that rate limits the RDH reaction is the limited
supply of the RDH cofactor NADPH. Further, we show
that retinol removal is defi ned by the surface-to-volume
ratio of the outer segment.
M AT E R I A L S A N D M E T H O D S
Animals and PreparationExperiments were performed on red- and blue-sensitive cones, and red and green rods of larval tiger salamanders (Ambystoma tigrinum). Larval salamanders were purchased from Charles D. Sullivan Company, Inc. and kept at �10°C in aquarium tanks on a 12-h light/12-h dark cycle.
Salamanders were dark adapted overnight at room tempera-ture before each experiment. Intact photoreceptors were me-chanically isolated from dark-adapted retinae under infrared illumination as described previously (Cornwall et al., 1990; Tsina et al., 2004). All procedures were performed according to proto-cols approved by the Animal Care and Use Committee of Boston University School of Medicine and in accordance with the stan-dards set forth in the Guide for the Care and Use of Laboratory Animals and the Animal Welfare Act.
on February 10, 2016
jgp.rupress.orgD
ownloaded from
Published July 17, 2006
Ala-Laurila et al. 155
SolutionsThe Ringer solution used for dissection of retinae and super-fusion of photoreceptors had the following composition (in mM): 110 NaCl, 2.5 KCl, 1.6 MgCl2, 1.0 CaCl2, 10 dextrose, 10 HEPES, pH 7.8. The Ringer solution also contained 1.5 μM BSA.
Microfl uorometryAfter dissection, a suspension of cells in physiological solution containing intact rods and cones was placed in a recording cham-ber located on the stage of an inverted microscope (ECLIPSE TE300, Nikon). The microscope was equipped for use in conven-tional epi-fl uorescence mode. An infrared-sensitive TV camera and an infrared light source were attached to the microscope optical system to allow bright-fi eld viewing of the cells in the chamber during experiments.
Microfl uorometric measurements of changes in intrinsic fl uo-rescence within outer segments of photoreceptors were made on dark-adapted cells after bleaching with bright light. Measure-ments of increases in intrinsic fl uorescence within bleached rod outer segments have been shown previously to be due to the ap-pearance of all-trans retinol after its reduction from all-trans reti-nal (Liebman, 1969; Tsina et al., 2004; Chen et al., 2005). Light for fl uorescence excitation of the cells entered the microscope via the fl uorescence port from a Xenon continuous arc (Optosource Arc Lamp and power supply, Cairn Instruments, Ltd.). Prior to entering the microscope, this light was passed through neutral density fi lters (Chroma Technology), a 360-nm narrow-band interference fi lter (Chroma Technology), and an electronic shutter (Vincent Associates). The beam of light was refl ected upward by a dichroic mirror (4000DCLP, Chroma Technology) and focused through a microscope objective (Nikon 100X S Fluor, Nikon) onto the plane at which the cells were located within the record-ing chamber. Cells within the recording chamber were continu-ously superfused with Ringer solution. The fl ow rate of the superfusate was controlled by gravity and was �1.0 ml/min. In the experiments where the effect of interphotoreceptor retinoid binding protein (IRBP) was tested, 100 μM IRBP was added di-rectly to the physiological solution in the recording chamber. The temperature of the superfusate solution in the recording cham-ber was maintained at 22 ± 1.0°C.
Exposure of individual photoreceptors to a 200–800-ms step of excitation light resulted in fl uorescence emission from the cells. The fl uorescence light was collected by the microscope objective, passed through the dichroic fi lter and a wide-band emission fi lter (pass band 465 nm–550 nm, D510/80M, Chroma Technology), and focused on the face of an image intensifi er (VS4-1845; Video-scope International, Ltd.). Images were captured using a CCD camera (CoolSNAP fx; Roper Scientifi c, Inc.; Photometrics). The output of the camera was used to produce bright-fi eld images and pseudocolor fl uorescence images, as illustrated in Fig. 1. Using this method, the spatial and temporal changes in the distribution of fl uorescence were measured before and at different times after exposure to a bright bleaching light. Data acquisition was per-formed using Openlab 3.0 (Improvision, Inc.). Digitized images were stored on a computer hard drive for later processing.
Light Stimulation and Pigment BleachingAn optical stimulator provided light stimuli for visual pigment bleaching in microfl uorometric recordings as well as for test fl ashes used for electrophysiological recordings (Tsina et al., 2004). The stimulator focused a light spot of 400 μm diameter and uniform intensity at the plane of the preparation through a 10× microscope objective mounted in the condenser holder of the inverted microscope. At the beginning of each experiment, the unattenuated intensity of light passed through a 520-nm interference fi lter (10-nm half band) was adjusted to a value of 7.1 × 10⁷ photons μm−2s−1 with a calibrated photometer (United
Detector Technology, Model 80X). The wavelength of light stimu-lation for each receptor type was selected to be near the wavelength of maximum sensitivity of that type: 520 nm (red rods), 440 nm (green rods and blue-sensitive cones), and 620 nm (red-sensitive cones). The intensity of light at these other wavelengths was mea-sured periodically to see that systematic changes did not occur.
The fraction of visual pigment bleached (F) was calculated according to the relation:
λ− −= 1 exp( ),F IP t (1)
where I is the absolute light intensity at the selected wavelength (photons μm−2s−1), Pλ is the photosensitivity at the wavelength of the stimulus light (μm2), and t is the duration of the light expo-sure (s). The value that we used for the photosensitivity of red and green rods, as well as red- and blue-sensitive cones at the wave-length of peak absorbance, was Pλ = 6 × 10⁻⁹ μm2 (Jones et al., 1993; Cornwall et al., 2000). In all fl uorescence experiments, we used bleaching intensities and exposure times that were calcu-lated to have bleached >90% of the pigment.
Identifi cation of Cell TypesSalamander retina contains two different types of rod photo-receptors with visual pigments embedded in closed discs (“red” rods and “green” rods) and three different types of cone photo-receptors with visual pigments embedded in the plasma membrane (UV-sensitive cones, blue-sensitive cones, and red-sensitive cones) (Hárosi, 1975; Cornwall et al., 1984; Mariani, 1986; Makino and Dodd, 1996; Sherry et al., 1998). Salamander green and red rods were identifi ed morphologically, based on the size and shape of their OSs and ellipsoid regions. Green rods have elongated ellip-soid regions, and the OSs are typically shorter than those of red rods (Mariani, 1986; Ma et al., 2001; see also the bright fi eld images, Fig.1).
Salamander red-sensitive cones and blue-sensitive cones were identifi ed before bleaching using electrophysiological criteria by measuring the relative amplitude of their fl ash responses to 440-, 520-, and 620-nm light stimuli. These measurements were made by drawing the inner segment/ellipsoid portion of each of the cells into a close-fi tting glass micropipette that was connected to a patch clamp amplifi er (EPC-7, List Associates) and the photocur-rent was recorded extracellularly. This suction pipette technique for recording of photocurrent responses to measure cell sensitiv-ity has been described previously (Baylor et al., 1979; Cornwall et al., 1990). The photocurrent signal was low-pass fi ltered at 20 Hz, digitized at 100 Hz, and stored on a computer hard drive for later analysis. Data acquisition and analysis were performed using pCLAMP 8 software (Axon Instruments).
Analysis of Fluorescence ImagesThe average fl uorescence intensity was calculated in different parts of the cells by establishing regions of interest based on bright fi eld images of the cells obtained during the fl uorescence experi-ments (see Tsina et al., 2004). These regions were the inner seg-ment containing the nucleus, the ellipsoid region containing numerous mitochondria, and different regions within the OS. To study the spatial differences in OS fl uorescence, the OS was di-vided into several regions of similar longitudinal size. The average fl uorescence was calculated in each region and corrected for back-ground fl uorescence measured within the region before bleaching. Interphotoreceptor differences were evaluated by comparing changes in the averaged fl uorescence intensity in regions of ap-proximately similar longitudinal size measured in the most proxi-mal region of rod OSs. Comparisons in cones were made based on measurements in the whole OSs as well as in regions. The analyses of fl uorescence images were performed using Openlab 3.1 soft-ware (Improvision, Inc.) and Origin 6.1 (OriginLab Co.).
on February 10, 2016
jgp.rupress.orgD
ownloaded from
Published July 17, 2006
156 Retinol Kinetics in Rods and Cones
Microspectrophotometric Analysis of PhotolysisThe time course of photolysis of visual pigments was studied with a high-speed dichroic microspectrophotometry (MSP) instrument described earlier (Govardovskii and Zueva, 2000; Kolesnikov et al., 2003). The microspectrophotometer was equipped with a computer-controlled jumping beam mask that allowed fast sequential recordings from tip and base of the same rod outer segment. The mask had a changeable width and a fi xed length of 8 μm; its longitudinal excursion (with respect to the rod outer segment [ROS] long axis) can be adjusted to place the measuring beam in different positions along the ROS. The solution used for measurements was identical to the one used in electrophysiologi-cal and microfl uorometric measurements.
In most cases, measurements were performed on retinal sam-ples placed in a superfusion chamber that consisted of a well �2 mm in depth, with the bottom made of a microscope coverslip. Solution was fed to the chamber by gravity; outfl ow was removed by suction. A water immersion objective (58×, 0.8 NA UV, Leningrad Optical-Mechanical Factory) was used for sample viewing and light collection. Recordings were made from intact isolated photo-receptors, isolated outer segments, or intact photoreceptors whose outer segments protruded from a retinal fragment. Sometimes measurements were made from nonperfused samples contained in a sealed chamber.
For baseline recording, the measuring beam was fi rst placed in a cell-free space near the cell to be measured, and baseline inten-sities were recorded at two beam polarizations and slit positions used for spectral scans. The axis of polarization of the measuring light was either in the transverse direction (orthogonal to the long axis of the outer segment, hereafter labeled T) or in the longitu-dinal direction (parallel to the outer segment, hereafter labeled L). T-scans were made from longer to shorter wavelengths and L-scans in the reverse direction. A full spectral scan at a given slit position and two polarizations took from 0.9 to 1.1 s, depending on the spectral range. After averaging four baseline scans at each polarization and position, the beam was placed on the outer seg-ment, and absorbance spectra were recorded. The time lapse between scans at two slit positions was 50 ms. Then the visual pig-ment was bleached with a fl ash of 1,000–1,500 ms duration from a high-intensity light-emitting diode (LED), and a series of post bleach spectra recorded at predefi ned time intervals. The LEDs used for bleaching had peak emissions at 615 nm (for red- sensitive cones), 525 nm (for red rods), and 465 nm (for green rods) (Marl International). The fl ash exposure was suffi cient to bleach the visual pigment to a photoequilibrium state. The small fraction of unbleached and photoregenerated pigment was determined by applying a second exhaustive bleach after complete decay of meta-photoproducts, as previously described (Kolesnikov et al., 2003).
Processing of MSP DataRaw MSP spectra from several cells were averaged to reduce noise. Correction for nonspecifi c absorbance and light scattering was made by fi tting a straight line by the method of least-squares to the long-wavelength portion of the spectrum, where absorbance of the visual pigment is negligible. This region was either between 700 and 800 nm or between 600 and 800 nm, depending on the wavelength of peak sensitivity (λmax) of the pigment. Differences between these derived values and zero absorbance were then sub-tracted from the raw spectrum to produce a baseline corrected spectrum. Next, the spectrum of the unbleached pigment frac-tion was subtracted. The resulting spectrum was used to calculate the composition of the mixture of photoproducts.
Generally, after bleaching, six spectrally distinct long-lived photo-products were observed. These are metarhodopsin I, II, and III (meta I, II, and III), all-trans retinal/dehydroretinal, nonspecifi c protonated Schiff bases of retinal (PSBs), and all-trans retinol/dehydroretinol. The analysis of the mixture is facilitated by the
fact that meta I and II are in a rapid equilibrium, so from a kinetic standpoint they can be considered as a single product, hereafter referred to as M. Thus, fi ve coexisting products with largely over-lapping spectra can be considered, namely M, meta III, all-trans retinal, its PSBs, and all-trans retinol. T- and L-absorbances of ret-inol were treated separately, which added the sixth variable. Spec-trally similar products (M and all-trans retinal, or meta III and retinal Schiff bases) have different orientations of their chromo-phores with respect to the disk plane. Therefore, measurements of absorbances at three wavelengths and two polarizations can be analyzed by a system of six linearly independent equations whose solutions yield the contribution of each product to the recorded spectra. The wavelengths for measurements were chosen to lie close to absorbance maxima of main products. They were 340 nm (isosbestic point of retinol/dehydroretinol), 390 nm (isosbestic point of retinal/dehydroretinal), and 470–490 nm (near MIII and PSB maxima, depending on the chromophore composition;see below). Since the noise in the short-wave region around 340 nm is high, retinol absorbances found this way were rather inaccurate. To refi ne the result, absorbances of M, meta III, PSB, and retinal (RAL) were subtracted from the experimental spec-trum to obtain the remaining T- and L-spectra of all-trans retinol. Their amplitudes were then determined by the least-square fi t with the standard retinol template. This approach is described in more detail by Kolesnikov et al. (2003) and Golobokova and Govardovskii (2006).
The analysis of MSP data is complicated by the fact that larval tiger salamanders contain a mixture of two visual pigment chro-mophores: 11-cis retinal (A1) and 11-cis-3-dehydroretinal (A2). Chromophoric composition was determined in each animal by fi t-ting the dark-adapted spectra with a combination of A1/A2 visual pigment templates (Govardovskii et al., 2000). Corresponding mixtures of standard retinal/dehydroretinal and retinol/dehy-droretinol spectra were then used in further computations. To establish the template for M formed by a mixture of A1- and A2-based metapigments, we fi tted the T- and L-absorbance record-ings at 1.5 s post-bleach with a sum of two Gaussians. It usually provided an excellent approximation. As for the templates for Meta III and PSB, their exact shape is not crucial for fi nding con-centrations of all photolysis products. Only the absorbances at the wavelengths of measurements (340 and 390 nm) relative to their maxima at 470–490 nm are required. These relative absorbances were taken as 0.25 (Meta III both at 390 and 340 nm; Kolesnikov et al., 2003), 0.54 (PSB at 390 nm), and 0.23 (PSB at 340 nm; Morton and Pitt, 1955; Pitt et al., 1955), as in A1-based pigments. Since these values characterize minor components, their uncer-tainty does not substantially infl uence the results.
Surface to Volume Ratio EstimatesThe estimates of the surface to volume ratio for each cell type were based on the bright fi eld images taken during fl uorescence recordings. For each cell, the radius of the OS in the proximal (R), the distal (r) regions, as well as the total length of the OS (L) were measured (see Table I). The volume (V) and the total sur-face area of the cell (S) were calculated by estimating the cone OS as a frustum of a right circular cone. Under these assumptions:
2 2 = /3 ( + + )V L R r R r⋅ ⋅ ⋅� (2)
and
2 2 1/2 2 = (( ) + ) ( + ) + .S R r L r R r⋅ − ⋅ ⋅� � (3)
We estimated rod OSs as cylinders. The surface to volume ratio estimates (S/V) for rods were then obtained by substituting r = R in the above formulas. This simple approach for the surface to volume ratio calculations does not take into account the additional
on February 10, 2016
jgp.rupress.orgD
ownloaded from
Published July 17, 2006
Ala-Laurila et al. 157
surface area of membrane invaginations found in cone outer seg-ments (see Discussion for consideration of cone invaginations).
R E S U LT S
Distribution of Retinol Fluorescence in Bleached PhotoreceptorsA signifi cant advantage to the use of the microfl uoro-
metric technique is that it provides detailed measure-
ments of the spatial profi le as well as the kinetics of
production of retinol within bleached rod and cone
photoreceptors. Measurements of this kind are illus-
trated in the four columns of pseudocolor images dis-
played in Fig. 1 A. These images compare the spatial
and temporal changes in intrinsic fl uorescence that oc-
cur in the inner and outer segments of a variety of intact
rod and cone photoreceptors after exposure to a bright
light that bleached >90% of the visual pigment.
These cells were chosen to be representative of three
classes of photoreceptors, differentiated based on their
cellular morphology and their visual pigment content.
Red rods (RR, far left column) contain rhodopsin
pigment (RH1) primarily in internal disc membranes.
Green rods (GR, second from left) contain pigment
in internal discs, but this pigment belongs to the cone
pigment family (SWS2) (Ma et al., 2001). Blue- sensitive
cones (BC, second from right) and red-sensitive cones
(RC, far right) contain cone pigments (SWS2 and
M/LWS, respectively) embedded in infoldings of the
plasma membrane (Mariani, 1986; Sherry et al., 1998;
Ma et al., 2001). At the top of each column is a bright
fi eld image of a representative of each cell type. Each
of these is shown at the same scale and in the same
orientation: the inner segment (IS) of each cell is on
the left side of each panel and the outer segment (OS)
on the right. The ISs of blue- and red-sensitive cones
are shown drawn into glass recording micropipettes
in order that they could be discriminated from one
another by electrophysiological criteria (see Materials
and Methods). Below each bright fi eld image is a col-
umn of fi ve pseudocolor fl uorescence images. The top
image was taken before exposure to bright bleaching
light; the bottom four images were measured at differ-
ent times following the bleach. Fluorescence intensi-
ties are coded by different colors (see the color bar in
Fig. 1). Together, these images illustrate the different
rates at which retinol fl uorescence fi rst increased in
the OSs after the exposure to bright light and later
decreased as retinol was cleared in these different cell
types. Spatial and temporal increases of retinol fl uo-
rescence that are qualitatively similar to those shown
in Fig. 1 have been observed previously in bleached
frog rods (Liebman, 1969, 1973; Chen et al., 2005)
and in salamander red rods (Tsina et al., 2004). Based
on the spectrum and the polarization of the fl uores-
cence light, the fl uorescence increase in the OS after
bleaching in these cells has been attributed to the
production of all-trans retinol, and the spatially local-
ized fl uorescence in the ellipsoid region has been at-
tributed to substances other than retinol, presumably
to reduced nicotinamide adenine dinucleotide phos-
phate (NADPH) (Liebman, 1969; Tsina et al., 2004;
Chen et al., 2005).
Before bleaching occurred, fl uorescence levels within
outer segments of all of the cells were generally very
low. The fl uorescence levels in the inner segment (el-
lipsoid) regions of the cells, which contain mitochon-
dria, were somewhat higher and changed little after
exposure to bleaching light. However, after bleaching, a
large and spatially nonuniform increase in fl uorescence
was observed to develop in the OSs of all the cells.
As shown by the fl uorescence recordings in red and green
rods (see fi rst two columns of Fig. 1 A), the fl uorescence
increased fastest in the most proximal part of the OS
and slowest in the most distal part of the OS.
Fig. 1 B shows the time course of changes in the nor-
malized relative fl uorescence levels in the whole OS for
each of the cells shown in A. The same acronyms (RR,
GR, etc.) are used as in A. The fi ve data points corre-
sponding to the pseudocolor images illustrated in each
column in A are highlighted by red squares in the cor-
responding plots in B, whereas all other data points of
the fl uorescence measurements that are not shown in A
are marked by black symbols. It can be seen from these
plots that there is a wide variation in both the kinetics of
production and clearance of retinol fl uorescence in
these different cell types.
The relative fl uorescence change averaged over the
whole OS reached its maximum in �25 min in the red
rod, and in �4 min in the green rod (see Fig. 1, A and
B, RR and GR). In salamander cones, the fl uorescence
increase in the OS is signifi cantly faster than in either of
the rods and reaches its maximum value within 1–2 min
in both red- and blue-sensitive cones, as shown by the
two rightmost columns of A and the corresponding
plots in B. The clearance of fl uorescence is also signifi -
cantly faster in salamander cones than in the rod photo-
receptors. As shown in B, 50% of the relative fl uorescence
was cleared in both the red- and the blue-sensitive cones
in �9 min, whereas in both of the rods illustrated in
Fig. 1, the same level of clearance occurs only on the
time-scale of 2–3 h.
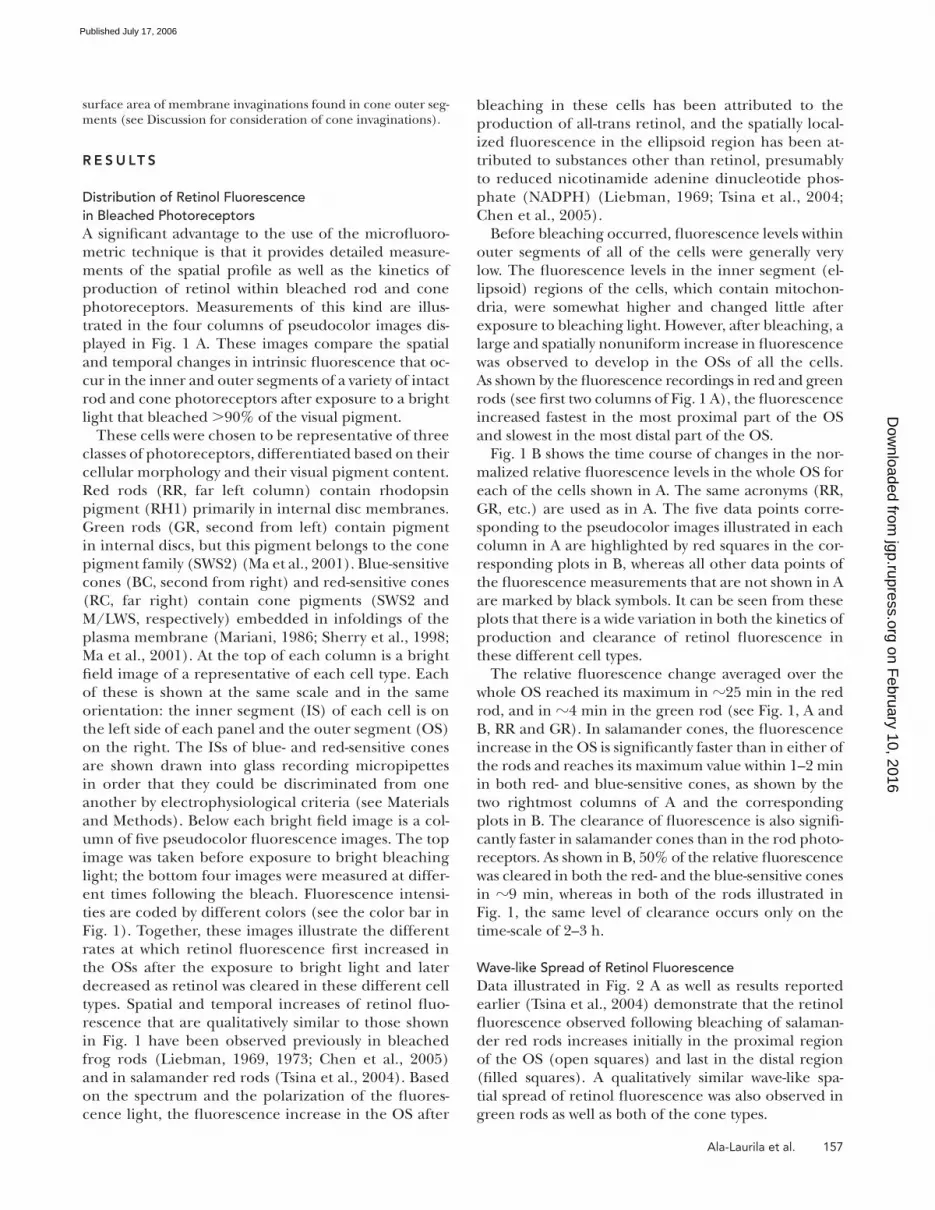
Wave-like Spread of Retinol FluorescenceData illustrated in Fig. 2 A as well as results reported
earlier (Tsina et al., 2004) demonstrate that the retinol
fl uorescence observed following bleaching of salaman-
der red rods increases initially in the proximal region
of the OS (open squares) and last in the distal region
(fi lled squares). A qualitatively similar wave-like spa-
tial spread of retinol fl uorescence was also observed in
green rods as well as both of the cone types.
on February 10, 2016
jgp.rupress.orgD
ownloaded from
Published July 17, 2006

158 Retinol Kinetics in Rods and Cones
The graphs shown in Fig. 2 B illustrate an example of
this wave-like behavior in red-sensitive cones. The two
plots in the main panel show the time course of fl uo-
rescence change after exposure to bright light in two
regions of roughly similar longitudinal size (3–4 μm)
within the outer segments of six intact cones. The plot
composed of the open squares illustrates the fl uores-
cence increase measured in the most proximal region of
the outer segment; the fi lled squares illustrate the fl uo-
rescence increase at the distal tip. The inset shows the
same data as in the main panel plotted on an expanded
time scale. The lower amplitude of relative fl uorescence
observed at the tip of the OS can be explained purely
based on geometrical considerations, i.e., the peak level
of fl uorescence depends on the average thickness of the
OS in this region. Here, the overall average thickness
of the OS at the tip is much smaller than at the base.
However, when correction for compartment thickness
is made, it is also apparent that the fl uorescence signal
rises more slowly at the tip of the OS than at the base.
Figure 1. Bright fi eld and pseudo-color fl uo-rescence images before and after bleaching the visual pigment of salamander rod and cone pho-toreceptor cells. (A) The top row shows bright fi eld images of single photoreceptor cells: (from left to right) red rod (RR), green rod (GR), blue-sensitive cone (BC), and red-sensitive cone (RC). The fi ve pseudo-color images shown be-low each bright fi eld image were measured be-fore (top) and at different times after exposure to a bright light (at time = 0) that bleached >90% of the visual pigment. The time at which the image was taken and the normalized relative fl uorescence (%) averaged over the whole OS are shown at the bottom of each fl uorescence image. (B) Plots of the time course of the aver-age normalized relative fl uorescence intensity for each of the cells shown in A. The fi ve data points highlighted by red squares correspond to the fl uorescence images shown in A. Data points from fl uorescence images not illustrated in A are indicated by black circles.
on February 10, 2016
jgp.rupress.orgD
ownloaded from
Published July 17, 2006
Ala-Laurila et al. 159
Metarhodopsin Decay Rate and Retinal Release As Assessed by MicrospectrophotometryIt is apparent from the fl uorescence data presented in
Fig. 1 that the rate of retinol production is grossly differ-
ent among different cell types. It is also clear from mea-
surements within the different regions of the same outer
segment (Fig. 1 A; Fig. 2) that these production rates also
differ widely. An important question is whether these
differences result from different rates of liberation of
all-trans retinal that serves as a substrate for the RDH
reaction or from differences in the speed of retinal
reduction. Microfl uorometric measurement of retinol
fl uorescence is a useful tool to measure the differential
rates of production of retinol, but this technique pro-
vides no direct information about the rate of retinal
production. For this we made microspectrophotometric
measurements of the kinetics of metaproduct decay in
bleached photoreceptor outer segments to determine
the rate at which the retinal substrate was produced.
We fi rst tested whether there is a regional difference
in the metaproduct decay rate within the same outer
segment. MSP measurements were conducted on sala-
mander red and green rods, since the large size of their
outer segments allows accurate positioning of the mea-
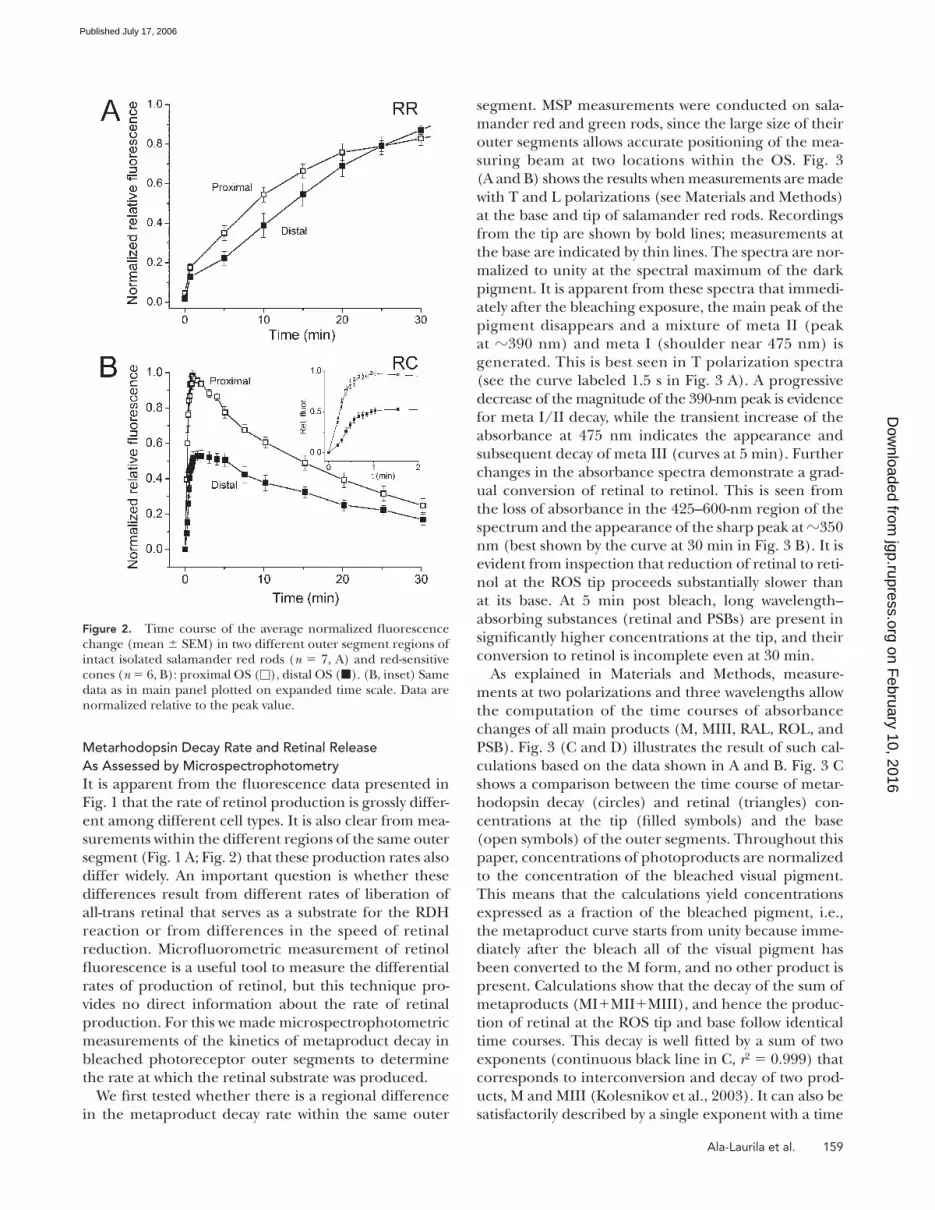
suring beam at two locations within the OS. Fig. 3
(A and B) shows the results when measurements are made
with T and L polarizations (see Materials and Methods)
at the base and tip of salamander red rods. Recordings
from the tip are shown by bold lines; measurements at
the base are indicated by thin lines. The spectra are nor-
malized to unity at the spectral maximum of the dark
pigment. It is apparent from these spectra that immedi-
ately after the bleaching exposure, the main peak of the
pigment disappears and a mixture of meta II (peak
at �390 nm) and meta I (shoulder near 475 nm) is
generated. This is best seen in T polarization spectra
(see the curve labeled 1.5 s in Fig. 3 A). A progressive
decrease of the magnitude of the 390-nm peak is evidence
for meta I/II decay, while the transient increase of the
absorbance at 475 nm indicates the appearance and
subsequent decay of meta III (curves at 5 min). Further
changes in the absorbance spectra demonstrate a grad-
ual conversion of retinal to retinol. This is seen from
the loss of absorbance in the 425–600-nm region of the
spectrum and the appearance of the sharp peak at �350
nm (best shown by the curve at 30 min in Fig. 3 B). It is
evident from inspection that reduction of retinal to reti-
nol at the ROS tip proceeds substantially slower than
at its base. At 5 min post bleach, long wavelength–
absorbing substances (retinal and PSBs) are present in
signifi cantly higher concentrations at the tip, and their
conversion to retinol is incomplete even at 30 min.
As explained in Materials and Methods, measure-
ments at two polarizations and three wavelengths allow
the computation of the time courses of absorbance
changes of all main products (M, MIII, RAL, ROL, and
PSB). Fig. 3 (C and D) illustrates the result of such cal-
culations based on the data shown in A and B. Fig. 3 C
shows a comparison between the time course of metar-
hodopsin decay (circles) and retinal (triangles) con-
centrations at the tip (fi lled symbols) and the base
(open symbols) of the outer segments. Throughout this
paper, concentrations of photoproducts are normalized
to the concentration of the bleached visual pigment.
This means that the calculations yield concentrations
expressed as a fraction of the bleached pigment, i.e.,
the metaproduct curve starts from unity because imme-
diately after the bleach all of the visual pigment has
been converted to the M form, and no other product is
present. Calculations show that the decay of the sum of
metaproducts (MI+MII+MIII), and hence the produc-
tion of retinal at the ROS tip and base follow identical
time courses. This decay is well fi tted by a sum of two
exponents (continuous black line in C, r2 = 0.999) that
corresponds to interconversion and decay of two prod-
ucts, M and MIII (Kolesnikov et al., 2003). It can also be
satisfactorily described by a single exponent with a time
Figure 2. Time course of the average normalized fl uorescence change (mean ± SEM) in two different outer segment regions of intact isolated salamander red rods (n = 7, A) and red-sensitive cones (n = 6, B): proximal OS (□), distal OS (■). (B, inset) Same data as in main panel plotted on expanded time scale. Data are normalized relative to the peak value.
on February 10, 2016
jgp.rupress.orgD
ownloaded from
Published July 17, 2006
160 Retinol Kinetics in Rods and Cones
constant of 470 s (r2 = 0.997, not depicted) that we use
in further computations (see Discussion). However, ret-
inal accumulates to much higher extent at the tip than
at the base of the outer segment owing to the fact that
reduction of retinal to retinol proceeds signifi cantly
more slowly at the tip than at the base. This is confi rmed
by the time course of retinol itself (Fig. 3 D). Its concen-
tration at the OS base (empty squares) increases sub-
stantially faster than at the tip (fi lled squares). For
comparison, fl uorescence data on retinol production
(red symbols) are scaled (using the same factor in the
tip and base) for best visual fi t relative to MSP data
(black symbols). The correspondence between the two
datasets is reasonable. Together these fi ndings show
that the regional differences in retinol production rate
along the outer segment do not arise from differences
in the rate of metarhodopsin decay but rather at some
later stage in retinol production.
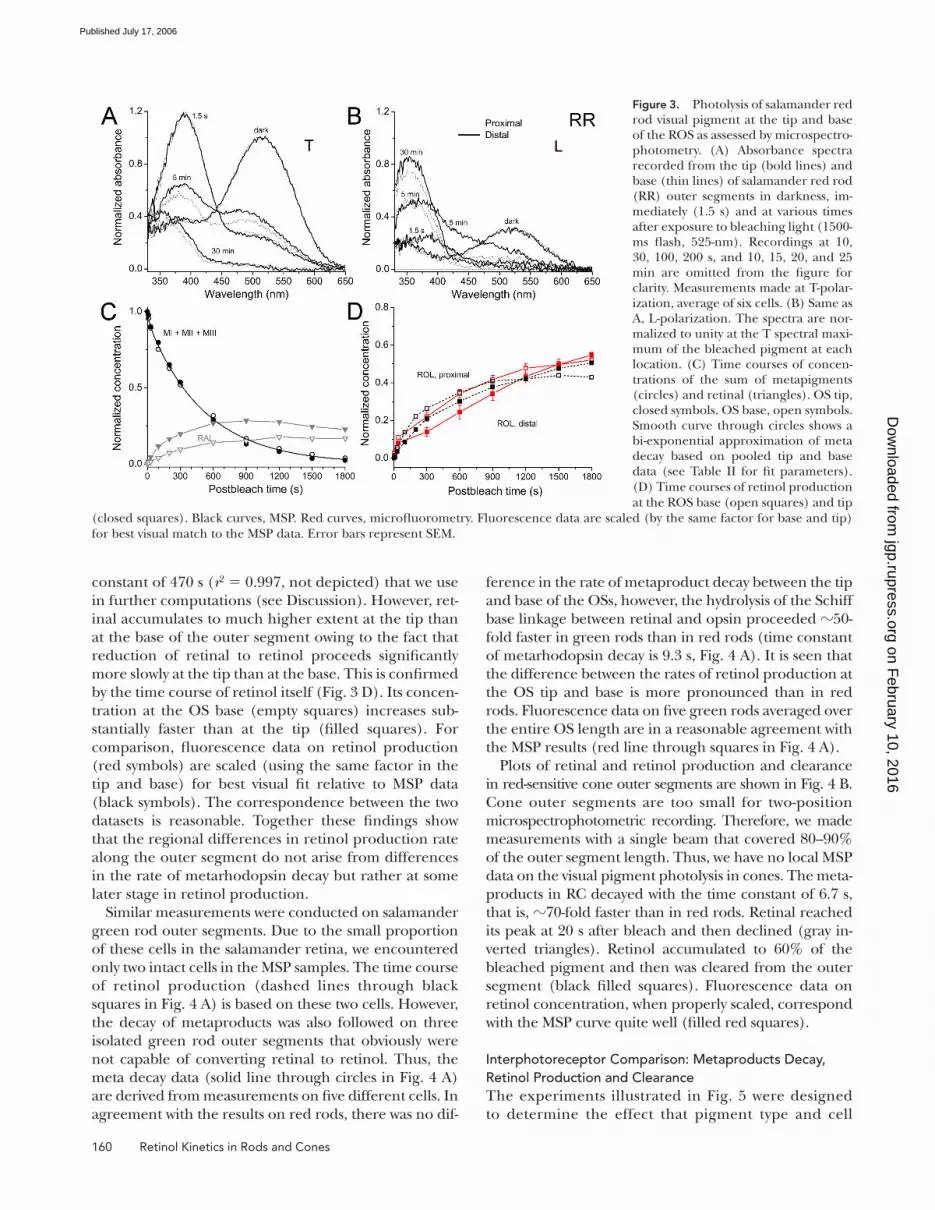
Similar measurements were conducted on salamander
green rod outer segments. Due to the small pro portion
of these cells in the salamander retina, we encountered
only two intact cells in the MSP samples. The time course
of retinol production (dashed lines through black
squares in Fig. 4 A) is based on these two cells. However,
the decay of metaproducts was also followed on three
isolated green rod outer segments that obviously were
not capable of converting retinal to retinol. Thus, the
meta decay data (solid line through circles in Fig. 4 A)
are derived from measurements on fi ve different cells. In
agreement with the results on red rods, there was no dif-
ference in the rate of metaproduct decay between the tip
and base of the OSs, however, the hydrolysis of the Schiff
base linkage between retinal and opsin proceeded �50-
fold faster in green rods than in red rods (time constant
of metarhodopsin decay is 9.3 s, Fig. 4 A). It is seen that
the difference between the rates of retinol production at
the OS tip and base is more pronounced than in red
rods. Fluorescence data on fi ve green rods averaged over
the entire OS length are in a reasonable agreement with
the MSP results (red line through squares in Fig. 4 A).
Plots of retinal and retinol production and clearance
in red-sensitive cone outer segments are shown in Fig. 4 B.
Cone outer segments are too small for two-position
microspectrophotometric recording. Therefore, we made
measurements with a single beam that covered 80–90%
of the outer segment length. Thus, we have no local MSP
data on the visual pigment photolysis in cones. The meta-
products in RC decayed with the time constant of 6.7 s,
that is, �70-fold faster than in red rods. Retinal reached
its peak at 20 s after bleach and then declined (gray in-
verted triangles). Retinol accumulated to 60% of the
bleached pigment and then was cleared from the outer
segment (black fi lled squares). Fluore scence data on
retinol concentration, when properly scaled, correspond
with the MSP curve quite well (fi lled red squares).
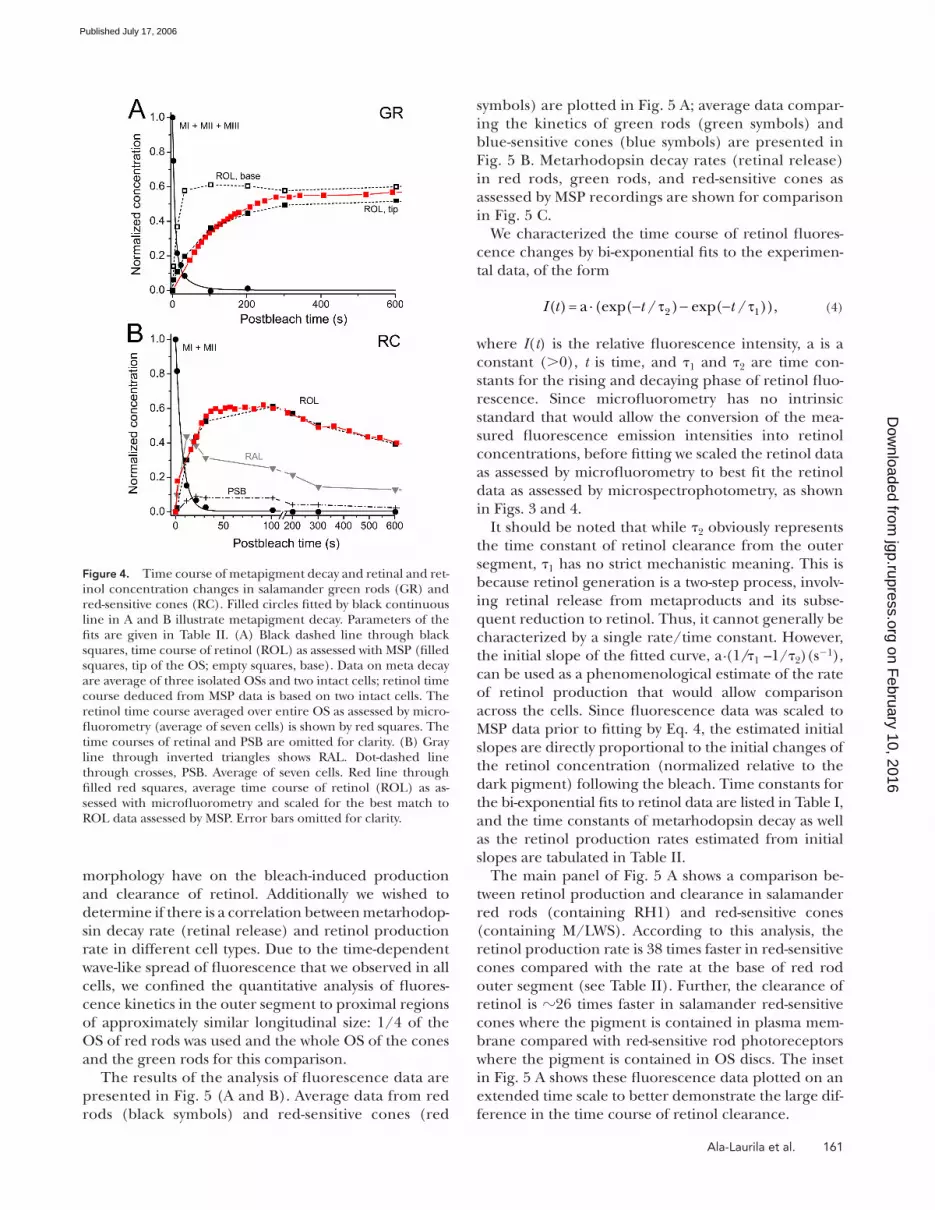
Interphotoreceptor Comparison: Metaproducts Decay, Retinol Production and ClearanceThe experiments illustrated in Fig. 5 were designed
to determine the effect that pigment type and cell
Figure 3. Photolysis of salamander red rod visual pigment at the tip and base of the ROS as assessed by microspectro-photometry. (A) Absorbance spectra recorded from the tip (bold lines) and base (thin lines) of salamander red rod (RR) outer segments in darkness, im-mediately (1.5 s) and at various times after exposure to bleaching light (1500-ms fl ash, 525-nm). Recordings at 10, 30, 100, 200 s, and 10, 15, 20, and 25 min are omitted from the fi gure for clarity. Measurements made at T-polar-ization, average of six cells. (B) Same as A, L-polarization. The spectra are nor-malized to unity at the T spectral maxi-mum of the bleached pigment at each location. (C) Time courses of concen-trations of the sum of metapigments (circles) and retinal (triangles). OS tip, closed symbols. OS base, open symbols. Smooth curve through circles shows a bi-exponential approximation of meta decay based on pooled tip and base data (see Table II for fi t parameters).
(D) Time courses of retinol production
at the ROS base (open squares) and tip
(closed squares). Black curves, MSP. Red curves, microfl uorometry. Fluorescence data are scaled (by the same factor for base and tip)
for best visual match to the MSP data. Error bars represent SEM.
on February 10, 2016
jgp.rupress.orgD
ownloaded from
Published July 17, 2006
Ala-Laurila et al. 161
morphology have on the bleach-induced production
and clearance of retinol. Additionally we wished to
determine if there is a correlation between metarhodop-
sin decay rate (retinal release) and retinol production
rate in different cell types. Due to the time-dependent
wave-like spread of fl uorescence that we observed in all
cells, we confi ned the quantitative analysis of fl uores-
cence kinetics in the outer segment to proximal regions
of approximately similar longitudinal size: 1/4 of the
OS of red rods was used and the whole OS of the cones
and the green rods for this comparison.
The results of the analysis of fl uorescence data are
presented in Fig. 5 (A and B). Average data from red
rods (black symbols) and red-sensitive cones (red
symbols) are plotted in Fig. 5 A; average data compar-
ing the kinetics of green rods (green symbols) and
blue-sensitive cones (blue symbols) are presented in
Fig. 5 B. Metarhodopsin decay rates (retinal release)
in red rods, green rods, and red-sensitive cones as
assessed by MSP recordings are shown for comparison
in Fig. 5 C.
We characterized the time course of retinol fl uores-
cence changes by bi-exponential fi ts to the experimen-
tal data, of the form
2 1( )= a (exp( / ) exp( / )),I t t t⋅ − τ − − τ (4)
where I(t) is the relative fl uorescence intensity, a is a
constant (>0), t is time, and τ1 and τ2 are time con-
stants for the rising and decaying phase of retinol fl uo-
rescence. Since microfl uorometry has no intrinsic
standard that would allow the conversion of the mea-
sured fl uorescence emission intensities into retinol
concentrations, before fi tting we scaled the retinol data
as assessed by microfl uorometry to best fi t the retinol
data as assessed by microspectrophotometry, as shown
in Figs. 3 and 4.
It should be noted that while τ2 obviously represents
the time constant of retinol clearance from the outer
segment, τ1 has no strict mechanistic meaning. This is
because retinol generation is a two-step process, involv-
ing retinal release from metaproducts and its subse-
quent reduction to retinol. Thus, it cannot generally be
characterized by a single rate/time constant. However,
the initial slope of the fi tted curve, a·(1/τ1 –1/τ2)(s−1),
can be used as a phenomenological estimate of the rate
of retinol production that would allow comparison
across the cells. Since fl uorescence data was scaled to
MSP data prior to fi tting by Eq. 4, the estimated initial
slopes are directly proportional to the initial changes of
the retinol concentration (normalized relative to the
dark pigment) following the bleach. Time constants for
the bi-exponential fi ts to retinol data are listed in Table I,
and the time constants of metarhodopsin decay as well
as the retinol production rates estimated from initial
slopes are tabulated in Table II.
The main panel of Fig. 5 A shows a comparison be-
tween retinol production and clearance in salamander
red rods (containing RH1) and red-sensitive cones
(containing M/LWS). According to this analysis, the
retinol production rate is 38 times faster in red-sensitive
cones compared with the rate at the base of red rod
outer segment (see Table II). Further, the clearance of
retinol is �26 times faster in salamander red-sensitive
cones where the pigment is contained in plasma mem-
brane compared with red-sensitive rod photoreceptors
where the pigment is contained in OS discs. The inset
in Fig. 5 A shows these fl uorescence data plotted on an
extended time scale to better demonstrate the large dif-
ference in the time course of retinol clearance.
Figure 4. Time course of metapigment decay and retinal and ret-inol concentration changes in salamander green rods (GR) and red-sensitive cones (RC). Filled circles fi tted by black continuous line in A and B illustrate metapigment decay. Parameters of the fi ts are given in Table II. (A) Black dashed line through black squares, time course of retinol (ROL) as assessed with MSP (fi lled squares, tip of the OS; empty squares, base). Data on meta decay are average of three isolated OSs and two intact cells; retinol time course deduced from MSP data is based on two intact cells. The retinol time course averaged over entire OS as assessed by micro-fl uorometry (average of seven cells) is shown by red squares. The time courses of retinal and PSB are omitted for clarity. (B) Gray line through inverted triangles shows RAL. Dot-dashed line through crosses, PSB. Average of seven cells. Red line through fi lled red squares, average time course of retinol (ROL) as as-sessed with microfl uorometry and scaled for the best match to ROL data assessed by MSP. Error bars omitted for clarity.
on February 10, 2016
jgp.rupress.orgD
ownloaded from
Published July 17, 2006
162 Retinol Kinetics in Rods and Cones
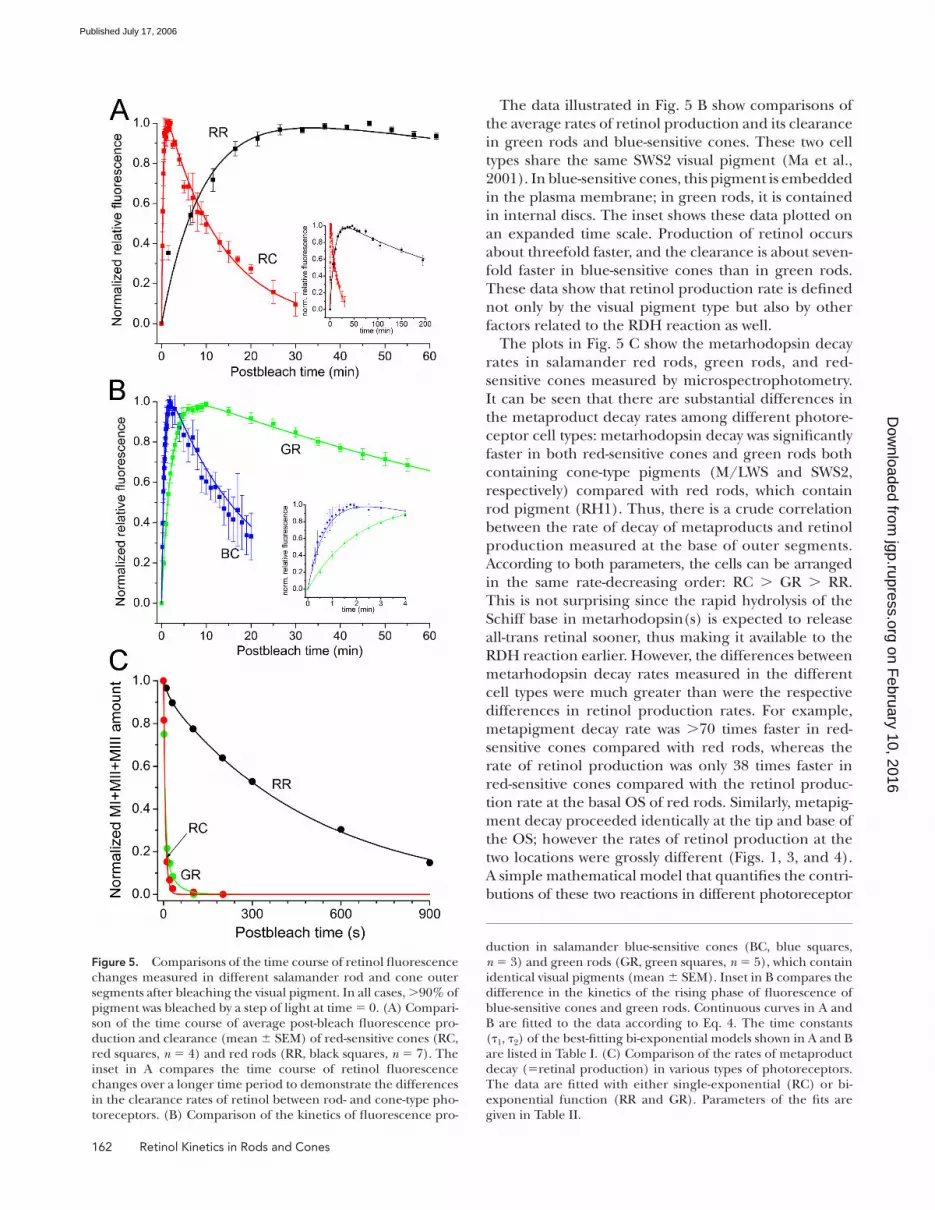
The data illustrated in Fig. 5 B show comparisons of
the average rates of retinol production and its clearance
in green rods and blue-sensitive cones. These two cell
types share the same SWS2 visual pigment (Ma et al.,
2001). In blue-sensitive cones, this pigment is embedded
in the plasma membrane; in green rods, it is contained
in internal discs. The inset shows these data plotted on
an expanded time scale. Production of retinol occurs
about threefold faster, and the clearance is about seven-
fold faster in blue-sensitive cones than in green rods.
These data show that retinol production rate is defi ned
not only by the visual pigment type but also by other
factors related to the RDH reaction as well.
The plots in Fig. 5 C show the metarhodopsin decay
rates in salamander red rods, green rods, and red-
sensitive cones measured by microspectrophotometry.
It can be seen that there are substantial differences in
the metaproduct decay rates among different photore-
ceptor cell types: metarhodopsin decay was signifi cantly
faster in both red-sensitive cones and green rods both
containing cone-type pigments (M/LWS and SWS2,
respectively) compared with red rods, which contain
rod pigment (RH1). Thus, there is a crude correlation
between the rate of decay of metaproducts and retinol
production measured at the base of outer segments.
According to both parameters, the cells can be arranged
in the same rate-decreasing order: RC > GR > RR.
This is not surprising since the rapid hydrolysis of the
Schiff base in metarhodopsin(s) is expected to release
all-trans retinal sooner, thus making it available to the
RDH reaction earlier. However, the differences between
metarhodopsin decay rates measured in the different
cell types were much greater than were the respective
differences in retinol production rates. For example,
metapigment decay rate was >70 times faster in red-
sensitive cones compared with red rods, whereas the
rate of retinol production was only 38 times faster in
red-sensitive cones compared with the retinol produc-
tion rate at the basal OS of red rods. Similarly, metapig-
ment decay proceeded identically at the tip and base of
the OS; however the rates of retinol production at the
two locations were grossly different (Figs. 1, 3, and 4).
A simple mathematical model that quantifi es the contri-
butions of these two reactions in different photoreceptor
Figure 5. Comparisons of the time course of retinol fl uorescence changes measured in different salamander rod and cone outer segments after bleaching the visual pigment. In all cases, >90% of pigment was bleached by a step of light at time = 0. (A) Compari-son of the time course of average post-bleach fl uorescence pro-duction and clearance (mean ± SEM) of red-sensitive cones (RC, red squares, n = 4) and red rods (RR, black squares, n = 7). The inset in A compares the time course of retinol fl uorescence changes over a longer time period to demonstrate the differences in the clearance rates of retinol between rod- and cone-type pho-toreceptors. (B) Comparison of the kinetics of fl uorescence pro-
duction in salamander blue-sensitive cones (BC, blue squares, n = 3) and green rods (GR, green squares, n = 5), which contain identical visual pigments (mean ± SEM). Inset in B compares the difference in the kinetics of the rising phase of fl uorescence of blue-sensitive cones and green rods. Continuous curves in A and B are fi tted to the data according to Eq. 4. The time constants (τ1, τ2) of the best-fi tting bi-exponential models shown in A and B are listed in Table I. (C) Comparison of the rates of metaproduct decay (=retinal production) in various types of photoreceptors. The data are fi tted with either single-exponential (RC) or bi- exponential function (RR and GR). Parameters of the fi ts are given in Table II.
on February 10, 2016
jgp.rupress.orgD
ownloaded from
Published July 17, 2006
Ala-Laurila et al. 163
types and different regions of their outer segments is
presented in Discussion.
Effect of IRBP on Retinol ClearanceMechanisms of retinol transfer from the outer segments
to further processing steps are poorly understood. Both
fl uorometric and MSP measurements performed in
standard Ringer solution demonstrated that, after its
production, retinol is translocated from the outer seg-
ment (Figs. 4 and 5). However, it has been shown earlier
by Tsina et al. (2004) in bleached salamander red rods
that when no lipophilic substance is present in the bath-
ing solution, retinol fl uorescence declines slowly and
may persist for hours. Furthermore, this study showed
that the clearance of retinol was signifi cantly accelerated
in salamander red rods in the presence of exogenous
lipophilic substances (IRBP and BSA; IRBP being sub-
stantially more effi cient than BSA). Thus, we performed
experiments to assess whether the clearance of retinol
can be facilitated by IRBP, and to determine if the rate of
production of retinol and its clearance from the cell are
essentially independent of one another. IRBP, a 140-kD
glycoprotein (Shaw and Noy, 2001; Loew and Gonzalez-
Fernandez, 2002), is the most abundant soluble protein
in the interphotoreceptor matrix. It has been shown to
bind retinoids and is believed to assist in the transfer
of retinol from photoreceptors to the retinal pigment
epithelium and/or to Müller cells (Edwards and Adler,
2000; Tsina et al., 2004; Qtaishat et al., 2005). Fig. 6 illus-
trates the time course of fl uorescence changes that oc-
cur following bright light in the absence and presence
of 100 μM IRBP added to the superfusate.
Measurements were made on salamander red rods
and red-sensitive cones as examples of the two different
cell morphologies (pigment enclosed in discs vs. pig-
ment embedded in the plasma membrane). The con-
tinuous curves through the data points were constructed
as bi-exponential fi ts to the experimental data accord-
ing to Eq. 4. As can be seen from the data presented in
Fig. 6 and from the time constants of retinol clearance
(τ2) shown in Table I, IRBP treatment resulted in an in-
crease of >10-fold in the rate of clearance of retinol
from red rods and about a threefold increase in the rate
in red-sensitive cones. In addition, the peak level of fl u-
orescence measured in the presence of IRBP in both
cell types was signifi cantly lower than when no IRBP was
present (unpublished data). These changes in the peak
levels of fl uorescence were consistent with the observed
acceleration of the clearance rate.
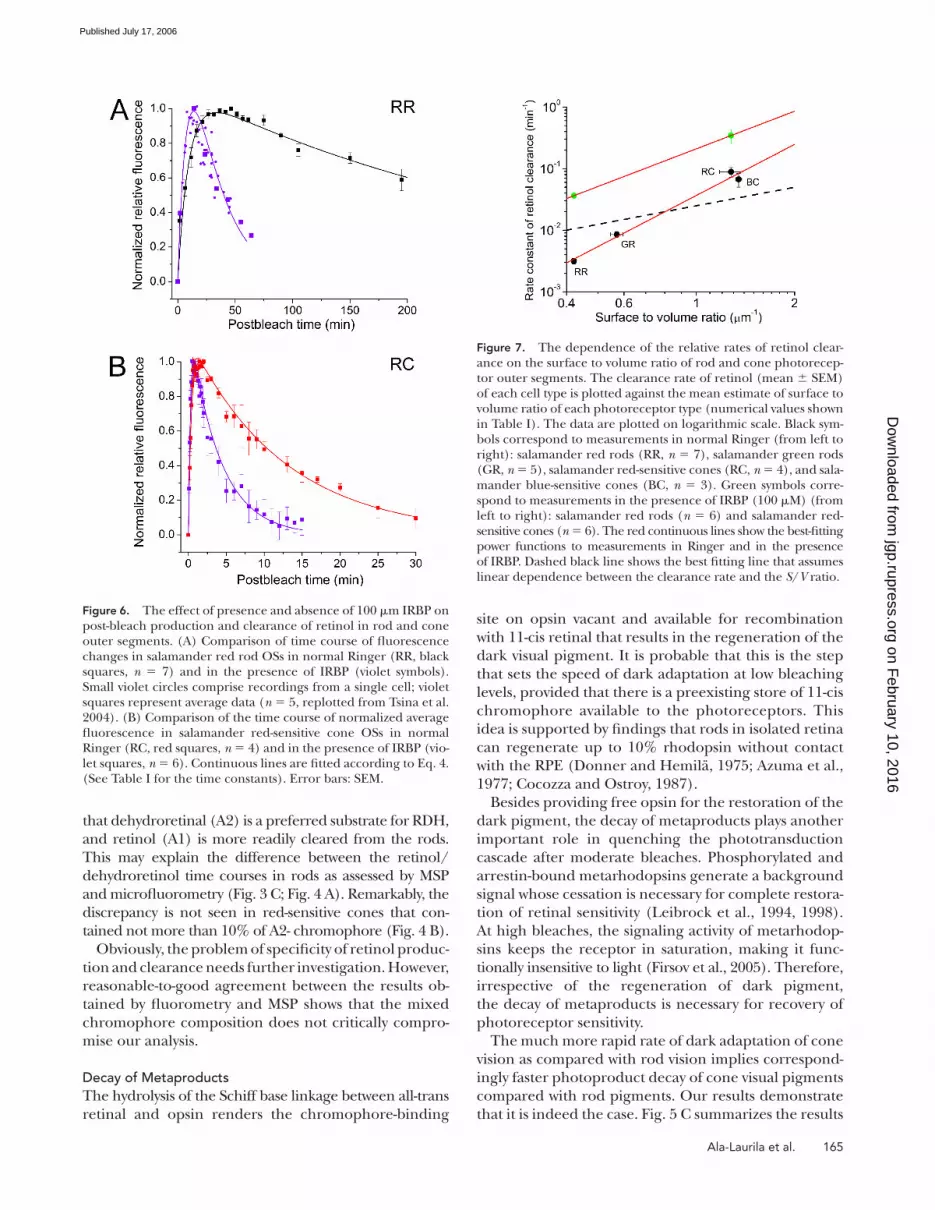
The Dependence of Retinol Clearance on the Surface to Volume Ratio of the PhotoreceptorWe have shown by fl uorescence measurements and mi-
crospectrophotometry that clearance of retinol from
salamander cones occurs 18–26-fold faster than from
salamander red rods (see Fig. 5; Table I). This fi nding is
generally consistent with a faster operation of the cone
visual cycle. As clearance implies the transfer of retinol
across the OS plasma membrane to its outer face,
photoreceptors with the largest surface to volume ratios
may be expected to have higher clearance rates of
retinol. A test of this notion is shown in Fig. 7.
Here the mean estimates of the rate constants of reti-
nol clearance (1/τ2) are plotted against the average sur-
face to volume ratio for each cell type. Both axes are
plotted on logarithmic scale. The surface to volume ratio
estimates were calculated as described in Materials and
Methods without taking into account the invaginations
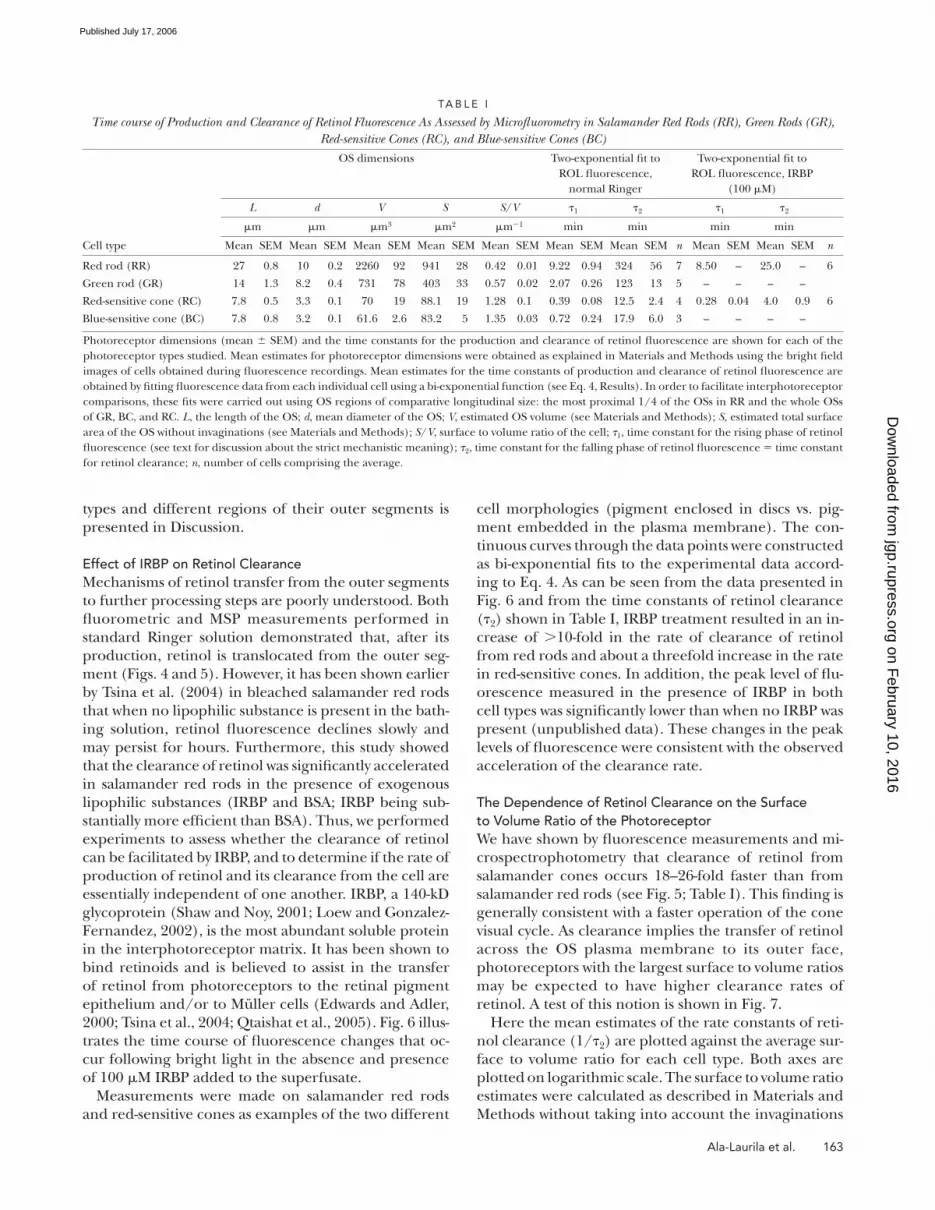
TA B L E I
Time course of Production and Clearance of Retinol Fluorescence As Assessed by Microfl uorometry in Salamander Red Rods (RR), Green Rods (GR), Red-sensitive Cones (RC), and Blue-sensitive Cones (BC)
OS dimensions
Two-exponential fi t to
ROL fl uorescence,
normal Ringer
Two-exponential fi t to
ROL fl uorescence, IRBP
(100 μM)
L d V S S/V τ1 τ2 τ1 τ2
μm μm μm3 μm2 μm−1 min min min min
Cell type Mean SEM Mean SEM Mean SEM Mean SEM Mean SEM Mean SEM Mean SEM n Mean SEM Mean SEM n
Red rod (RR) 27 0.8 10 0.2 2260 92 941 28 0.42 0.01 9.22 0.94 324 56 7 8.50 – 25.0 – 6
Green rod (GR) 14 1.3 8.2 0.4 731 78 403 33 0.57 0.02 2.07 0.26 123 13 5 – – – –
Red-sensitive cone (RC) 7.8 0.5 3.3 0.1 70 19 88.1 19 1.28 0.1 0.39 0.08 12.5 2.4 4 0.28 0.04 4.0 0.9 6
Blue-sensitive cone (BC) 7.8 0.8 3.2 0.1 61.6 2.6 83.2 5 1.35 0.03 0.72 0.24 17.9 6.0 3 – – – –
Photoreceptor dimensions (mean ± SEM) and the time constants for the production and clearance of retinol fl uorescence are shown for each of the
photoreceptor types studied. Mean estimates for photoreceptor dimensions were obtained as explained in Materials and Methods using the bright fi eld
images of cells obtained during fl uorescence recordings. Mean estimates for the time constants of production and clearance of retinol fl uorescence are
obtained by fi tting fl uorescence data from each individual cell using a bi-exponential function (see Eq. 4, Results). In order to facilitate interphotoreceptor
comparisons, these fi ts were carried out using OS regions of comparative longitudinal size: the most proximal 1/4 of the OSs in RR and the whole OSs
of GR, BC, and RC. L, the length of the OS; d, mean diameter of the OS; V, estimated OS volume (see Materials and Methods); S, estimated total surface
area of the OS without invaginations (see Materials and Methods); S/V, surface to volume ratio of the cell; τ1, time constant for the rising phase of retinol
fl uorescence (see text for discussion about the strict mechanistic meaning); τ2, time constant for the falling phase of retinol fl uorescence = time constant
for retinol clearance; n, number of cells comprising the average.
on February 10, 2016
jgp.rupress.orgD
ownloaded from
Published July 17, 2006
164 Retinol Kinetics in Rods and Cones
in the OS membranes. Black symbols correspond to rel-
ative clearance rates measured in Ringer solution (from
left to right: red rods, green rods, red-sensitive cones,
and blue-sensitive cones). Green symbols correspond to
the clearance rates measured in the presence of 100 μM
IRBP. Straight lines through the experimental points
correspond to power functions; the dashed line shows
a linear relation on log-log coordinates. It is obvious
from the comparison between the data and the dashed
line that the clearance rate increases more steeply than
would be predicted by assuming a linear relation be-
tween the clearance rate and the surface to volume ra-
tio (without invaginations). Thus, it appears that cone
invaginations increase the effective surface to volume
ratio for retinol clearance, although this effect is not as
large as would be expected from purely geometric con-
siderations. If cone outer segment membrane invagina-
tions are considered (assuming �33 discs/μm of OS
length; Blaurock and Wilkins, 1969; Vanderkooi and
Sundaralingam, 1970), a 50-fold larger surface to vol-
ume ratio is calculated (unpublished data). However,
the prediction based on the rod data and the clearance
rate in cones is that the invaginations only increase the
effective surface to volume ratio by a factor of two to
three. This modest effect may be due to the limited dif-
fusional accessibility of the extracellular spaces between
adjacent infoldings of the plasma membrane.
D I S C U S S I O N
We have characterized the rates of the principal reac-
tions of the visual cycle that occur within intact isolated
salamander photoreceptors after bleaching. These se-
quential key reactions are the hydrolysis of the Schiff
base linkage in metarhodopsins that liberates all-trans
retinal, the reduction of all-trans retinal to all-trans reti-
nol, and the translocation of all-trans retinol from the
outer segment to the extracellular matrix before its up-
take by the retinal pigment epithelium or Müller cells.
The cell types that we investigated included salamander
rod and cone photoreceptors: red rods with the rod pig-
ment (RH1), green rods with the cone pigment (SWS2),
as well as blue- and red-sensitive cones with the cone
pigments (SWS2 and M/LWS, respectively).
Comparison of Retinol Kinetics As Obtained by Microfl uorometry and MicrospectrophotometryAn important consideration in the analysis and inter-
pretation of our data is whether the observed fl uores-
cence changes truly represent the entire pool of retinal
found in salamander photoreceptors and whether fl uo-
rescence and microspectrophotometry data are in
agreement. The former question arises from the fact
that salamander photoreceptor cells contain a mixture
of vitamin A1 and A2 chromophores. It has been shown
earlier that the fl uorescence signal comes mostly from
retinol (A1) because the quantum yield of its fl uores-
cence is almost 40-fold higher than that of dehydroreti-
nol (A2) (Tsin et al., 1988). The latter question arises
because absorbance measurements made with the MSP
allow characterization of the total chromophore com-
position in each cell and yield total concentration of
both forms of retinol (see Materials and Methods).
As MSP has shown, different animals may have greatly
varying proportions of A1/A2 chromophores. However,
no signifi cant differences in time courses of photoprod-
ucts were found between the cells of the same type with
the A1/A2 ratio differing in the range of 20%/80%–
75%/25%. Nevertheless, fi tting the absorbance spectra
with a mixture of A1/A2 retinal and retinol templates re-
vealed that the fi nal products at the end of photolysis in
both types of rods clearly contained a lower proportion of
dehydroretinal and higher proportion of dehydroretinol
compared with the dark pigment. The result may indicate
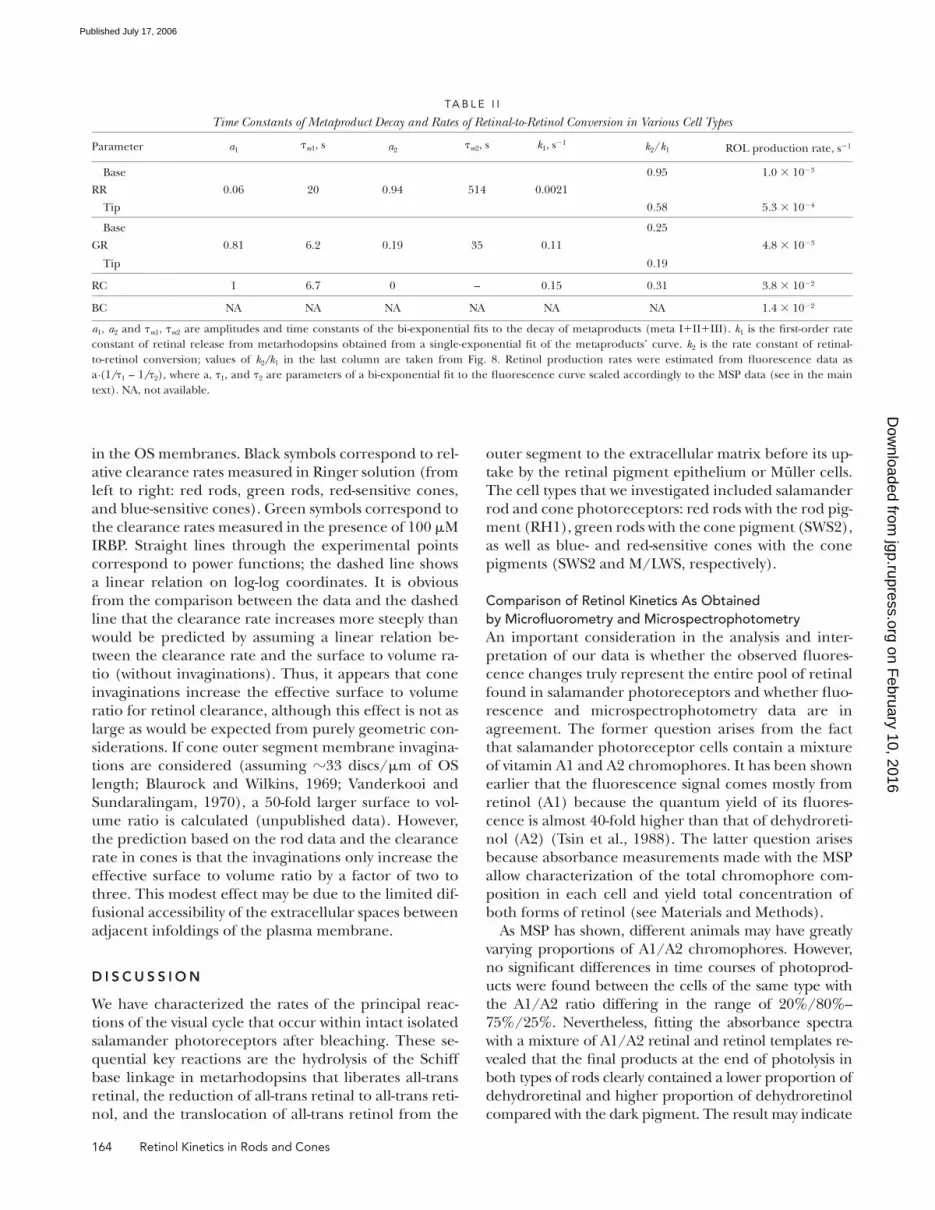
TA B L E I I
Time Constants of Metaproduct Decay and Rates of Retinal-to-Retinol Conversion in Various Cell Types
Parameter a1τm1, s a2
τm2, s k1, s−1 k2/k1 ROL production rate, s−1
Base 0.95 1.0 × 10⁻³
RR 0.06 20 0.94 514 0.0021
Tip 0.58 5.3 × 10⁻⁴
Base 0.25
GR 0.81 6.2 0.19 35 0.11 4.8 × 10⁻³
Tip 0.19
RC 1 6.7 0 – 0.15 0.31 3.8 × 10⁻²
BC NA NA NA NA NA NA 1.4 × 10⁻²
a1, a2 and τm1, τm2 are amplitudes and time constants of the bi-exponential fi ts to the decay of metaproducts (meta I+II+III). k1 is the fi rst-order rate
constant of retinal release from metarhodopsins obtained from a single-exponential fi t of the metaproducts’ curve. k2 is the rate constant of retinal-
to-retinol conversion; values of k2/k1 in the last column are taken from Fig. 8. Retinol production rates were estimated from fl uorescence data as
a·(1/τ1 – 1/τ2), where a, τ1, and τ2 are parameters of a bi-exponential fi t to the fl uorescence curve scaled accordingly to the MSP data (see in the main
text). NA, not available.
on February 10, 2016
jgp.rupress.orgD
ownloaded from
Published July 17, 2006
Ala-Laurila et al. 165
that dehydroretinal (A2) is a preferred substrate for RDH,
and retinol (A1) is more readily cleared from the rods.
This may explain the difference between the retinol/
dehydroretinol time courses in rods as assessed by MSP
and microfl uorometry (Fig. 3 C; Fig. 4 A). Remarkably, the
discrepancy is not seen in red-sensitive cones that con-
tained not more than 10% of A2- chromophore (Fig. 4 B).
Obviously, the problem of specifi city of retinol produc-
tion and clearance needs further investigation. However,
reasonable-to-good agreement between the results ob-
tained by fl uorometry and MSP shows that the mixed
chromophore composition does not critically compro-
mise our analysis.
Decay of MetaproductsThe hydrolysis of the Schiff base linkage between all-trans
retinal and opsin renders the chromophore-binding
site on opsin vacant and available for recombination
with 11-cis retinal that results in the regeneration of the
dark visual pigment. It is probable that this is the step
that sets the speed of dark adaptation at low bleaching
levels, provided that there is a preexisting store of 11-cis
chromophore available to the photoreceptors. This
idea is supported by fi ndings that rods in isolated retina
can regenerate up to 10% rhodopsin without contact
with the RPE (Donner and Hemilä, 1975; Azuma et al.,
1977; Cocozza and Ostroy, 1987).
Besides providing free opsin for the restoration of the
dark pigment, the decay of metaproducts plays another
important role in quenching the phototransduction
cascade after moderate bleaches. Phosphorylated and
arrestin-bound metarhodopsins generate a background
signal whose cessation is necessary for complete restora-
tion of retinal sensitivity (Leibrock et al., 1994, 1998).
At high bleaches, the signaling activity of metarhodop-
sins keeps the receptor in saturation, making it func-
tionally insensitive to light (Firsov et al., 2005). Therefore,
irrespective of the regeneration of dark pigment,
the decay of metaproducts is necessary for recovery of
photoreceptor sensitivity.
The much more rapid rate of dark adaptation of cone
vision as compared with rod vision implies correspond-
ingly faster photoproduct decay of cone visual pigments
compared with rod pigments. Our results demonstrate
that it is indeed the case. Fig. 5 C summarizes the results
Figure 6. The effect of presence and absence of 100 μm IRBP on post-bleach production and clearance of retinol in rod and cone outer segments. (A) Comparison of time course of fl uorescence changes in salamander red rod OSs in normal Ringer (RR, black squares, n = 7) and in the presence of IRBP (violet symbols). Small violet circles comprise recordings from a single cell; violet squares represent average data (n = 5, replotted from Tsina et al. 2004). (B) Comparison of the time course of normalized average fl uorescence in salamander red-sensitive cone OSs in normal Ringer (RC, red squares, n = 4) and in the presence of IRBP (vio-let squares, n = 6). Continuous lines are fi tted according to Eq. 4. (See Table I for the time constants). Error bars: SEM.
Figure 7. The dependence of the relative rates of retinol clear-ance on the surface to volume ratio of rod and cone photorecep-tor outer segments. The clearance rate of retinol (mean ± SEM) of each cell type is plotted against the mean estimate of surface to volume ratio of each photoreceptor type (numerical values shown in Table I). The data are plotted on logarithmic scale. Black sym-bols correspond to measurements in normal Ringer (from left to right): salamander red rods (RR, n = 7), salamander green rods (GR, n = 5), salamander red-sensitive cones (RC, n = 4), and sala-mander blue-sensitive cones (BC, n = 3). Green symbols corre-spond to measurements in the presence of IRBP (100 μM) (from left to right): salamander red rods (n = 6) and salamander red-sensitive cones (n = 6). The red continuous lines show the best-fi tting power functions to measurements in Ringer and in the presence of IRBP. Dashed black line shows the best fi tting line that assumes linear dependence between the clearance rate and the S/V ratio.
on February 10, 2016
jgp.rupress.orgD
ownloaded from
Published July 17, 2006
166 Retinol Kinetics in Rods and Cones
obtained by microspectrophotometry. As an extreme
example, the time constant of metaproduct decay in sala-
mander red-sensitive cones is �70 times shorter than in
salamander red rods (6.7 vs. 470 s, respectively). Green
rods occupy an intermediate position (Fig. 5 C; see also
Golobokova et al., 2003). This is in agreement with the re-
sults recently obtained by Golobokova and Govardovskii
(2006) on goldfi sh rods and cones. Thus, the prerequisite
condition of faster metaproduct decay for faster dark
adaptation of cones compared with rods is fulfi lled.
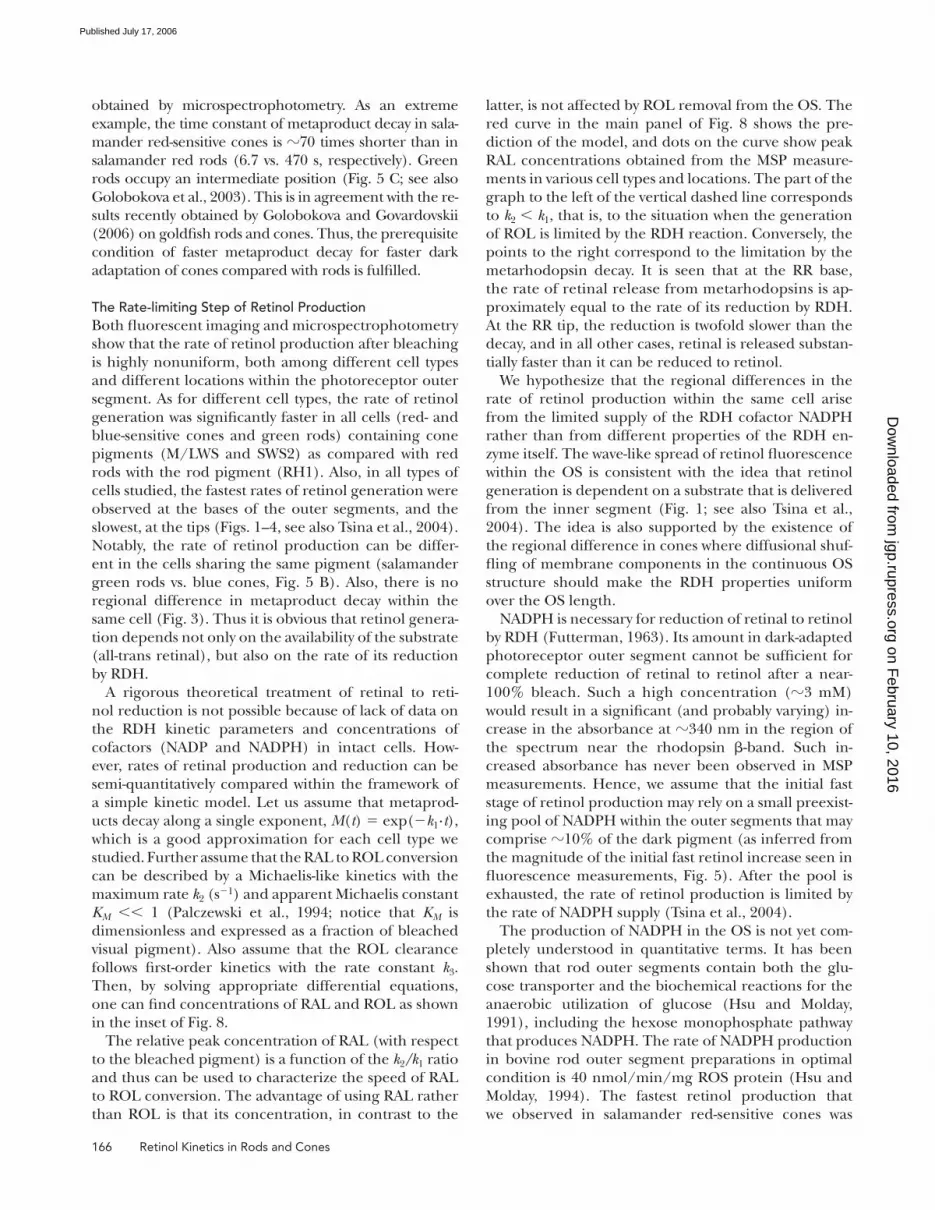
The Rate-limiting Step of Retinol ProductionBoth fl uorescent imaging and microspectrophotometry
show that the rate of retinol production after bleaching
is highly nonuniform, both among different cell types
and different locations within the photoreceptor outer
segment. As for different cell types, the rate of retinol
generation was signifi cantly faster in all cells (red- and
blue-sensitive cones and green rods) containing cone
pigments (M/LWS and SWS2) as compared with red
rods with the rod pigment (RH1). Also, in all types of
cells studied, the fastest rates of retinol generation were
observed at the bases of the outer segments, and the
slowest, at the tips (Figs. 1–4, see also Tsina et al., 2004).
Notably, the rate of retinol production can be differ-
ent in the cells sharing the same pigment (salamander
green rods vs. blue cones, Fig. 5 B). Also, there is no
regional difference in metaproduct decay within the
same cell (Fig. 3). Thus it is obvious that retinol genera-
tion depends not only on the availability of the substrate
(all-trans retinal), but also on the rate of its reduction
by RDH.
A rigorous theoretical treatment of retinal to reti-
nol reduction is not possible because of lack of data on
the RDH kinetic parameters and concentrations of
cofactors (NADP and NADPH) in intact cells. How-
ever, rates of retinal production and reduction can be
semi-quantitatively compared within the framework of
a simple kinetic model. Let us assume that metaprod-
ucts decay along a single exponent, M(t) = exp(−k1·t),
which is a good approximation for each cell type we
studied. Further assume that the RAL to ROL conversion
can be described by a Michaelis-like kinetics with the
maximum rate k2 (s−1) and apparent Michaelis constant
KM << 1 (Palczewski et al., 1994; notice that KM is
dimensionless and expressed as a fraction of bleached
visual pigment). Also assume that the ROL clearance
follows fi rst-order kinetics with the rate constant k3.
Then, by solving appropriate differential equations,
one can fi nd concentrations of RAL and ROL as shown
in the inset of Fig. 8.
The relative peak concentration of RAL (with respect
to the bleached pigment) is a function of the k2/k1 ratio
and thus can be used to characterize the speed of RAL
to ROL conversion. The advantage of using RAL rather
than ROL is that its concentration, in contrast to the
latter, is not affected by ROL removal from the OS. The
red curve in the main panel of Fig. 8 shows the pre-
diction of the model, and dots on the curve show peak
RAL concentrations obtained from the MSP measure-
ments in various cell types and locations. The part of the
graph to the left of the vertical dashed line corresponds
to k2 < k1, that is, to the situation when the generation
of ROL is limited by the RDH reaction. Conversely, the
points to the right correspond to the limitation by the
metarhodopsin decay. It is seen that at the RR base,
the rate of retinal release from metarhodopsins is ap-
proximately equal to the rate of its reduction by RDH.
At the RR tip, the reduction is twofold slower than the
decay, and in all other cases, retinal is released substan-
tially faster than it can be reduced to retinol.
We hypothesize that the regional differences in the
rate of retinol production within the same cell arise
from the limited supply of the RDH cofactor NADPH
rather than from different properties of the RDH en-
zyme itself. The wave-like spread of retinol fl uorescence
within the OS is consistent with the idea that retinol
generation is dependent on a substrate that is delivered
from the inner segment (Fig. 1; see also Tsina et al.,
2004). The idea is also supported by the existence of
the regional difference in cones where diffusional shuf-
fl ing of membrane components in the continuous OS
structure should make the RDH properties uniform
over the OS length.
NADPH is necessary for reduction of retinal to retinol
by RDH (Futterman, 1963). Its amount in dark-adapted
photoreceptor outer segment cannot be suffi cient for
complete reduction of retinal to retinol after a near-
100% bleach. Such a high concentration (�3 mM)
would result in a signifi cant (and probably varying) in-
crease in the absorbance at �340 nm in the region of
the spectrum near the rhodopsin β-band. Such in-
creased absorbance has never been observed in MSP
measurements. Hence, we assume that the initial fast
stage of retinol production may rely on a small preexist-
ing pool of NADPH within the outer segments that may
comprise �10% of the dark pigment (as inferred from
the magnitude of the initial fast retinol increase seen in
fl uorescence measurements, Fig. 5). After the pool is
exhausted, the rate of retinol production is limited by
the rate of NADPH supply (Tsina et al., 2004).
The production of NADPH in the OS is not yet com-
pletely understood in quantitative terms. It has been
shown that rod outer segments contain both the glu-
cose transporter and the biochemical reactions for the
anaerobic utilization of glucose (Hsu and Molday,
1991), including the hexose monophosphate pathway
that produces NADPH. The rate of NADPH production
in bovine rod outer segment preparations in optimal
condition is 40 nmol/min/mg ROS protein (Hsu and
Molday, 1994). The fastest retinol production that
we observed in salamander red-sensitive cones was
on February 10, 2016
jgp.rupress.orgD
ownloaded from
Published July 17, 2006

Ala-Laurila et al. 167
0.038 s−1 = 2.3 min−1 (Table II). Since the number is
normalized to bleached visual pigment, and there is
�12 nmol rhodopsin per milligram ROS protein, it
translates into consumption of �30 nmol NADPH/
min/mg ROS protein. Thus, the rate of NADPH gener-
ation measured by Hsu and Molday (1994) seems more
than suffi cient to support the fastest retinal-to-retinol
conversion. However, it is not clear whether the data
obtained in vitro can be applied to the situation in in-
tact outer segments. The wave-like development of fl uo-
rescence observed in our experiments (see also Tsina
et al., 2004) is more in line with the notion that after
exhaustion of the local store, retinal reduction relies
mostly on the NADPH that derives from energy supplies
(ATP, phosphocreatine, malate, etc.) that are produced
in the inner segment/ellipsoid regions of the cells.
Additional sources of NADPH could derive from
NADP+-linked dehydrogenases or NADH/NADPH
transhydrogenases that operate in these regions (Tsina
et al., 2004; Chen et al., 2005). It may also be that the
NADPH supply is the factor that limits the speed of the
RDH reaction in cones where its substrate, retinal, is
generated quickly from decaying metaproducts. Clearly,
a quantitative study of NADPH production in intact
photoreceptors is necessary to clarify this issue.
It has been hypothesized that in addition to providing
the substrate for making 11-cis retinal via RPE and/or
Müller cells, reduction of retinal to retinol plays other
important roles in photoreceptor function. For in-
stance, it may serve to remove potentially toxic retinal
by converting it to more benign retinol. Failure to elimi-
nate retinal due to a defective RDH pathway is impli-
cated in the genesis of Stargardt’s disease (Rattner et al.,
2000). Besides being toxic, all-trans retinal and all-trans
retinol have both been shown to block cGMP-gated
cationic channels of the OS plasma membrane (Dean
et al., 2002; McCabe et al., 2004; Horrigan et al., 2005).
Thus, the reduction of retinal to retinol and its subse-
quent translocation from the OS may be necessary for
complete recovery of photoreceptor dark current. The
latter problem may be especially acute in cones that
function at high intensities (hence higher levels of
bleaching). In accordance with this, we fi nd that the
maximum rate of retinol production in salamander
cones is 38-fold higher than the maximum rate in red
rods (Table II).
Retinol ClearanceThe last step of the visual cycle within the photorecep-
tor outer segment is the transfer of all-trans retinol
through the plasma membrane to the extracellular
space. This step serves both as the source of substrate
for the reactions of the visual cycle in RPE and Müller
cells, and also as a means of clearance of retinol from
the OS to facilitate the recovery of the dark current.
The rate of unaided clearance of retinol inferred from
our experiments is too slow compared with the regener-
ation rate of the visual pigment. Normally, rhodopsin
regeneration is virtually complete within �1 h while the
time constant of retinol clearance from red rods in stan-
dard Ringer solution is roughly 5 h (Table I). Similarly,
a 12–18-min time constant for retinol removal from
cones (Table I) would imply �30 min for complete re-
cycling of cone chromophore, provided that delays at
other stages of the cycle can be neglected.
The foregoing considerations suggest that there are
additional mechanisms that must facilitate retinol clear-
ance from the outer segment and its transfer to further
processing steps. One candidate agent is IRBP. Its role
as a chaperon to traffi c retinoids between photorecep-
tors and RPE cells has long been discussed (for recent
review see Lamb and Pugh, 2004). Its key importance,
however, has been questioned based on results with
IRBP-knockout mice whose visual cycle appeared only
modestly perturbed (Palczewski et al., 1999; Ripps et al.,
2000). We have shown here that the presence of IRBP
in the bathing solution greatly accelerates retinol clear-
ance from all photoreceptor types studied, so it becomes
more compatible with the overall rate of the visual cycle.
Still, transfer of retinol from the OS to the intercellular
space remains the slowest step of the visual cycle within
photoreceptors.
The fact that all-trans retinal in isolated photorecep-
tors can be virtually completely converted to retinol,
and a substantial fraction of the latter can be cleared to
Figure 8. Assessing relative rates of retinal and retinol genera-tion from the height of the retinal peak. The red curve in the main panel shows the peak retinal concentration as a function of k2/k1 ratio calculated based on the model described in the text and assuming KM = 0.1. Dots correspond to peak retinal concen-trations obtained by the MSP for various cell types. Inset, an ex-ample of RAL and ROL time courses calculated for the RAL peak 0.44 and k1 = 0.15 s−1, as measured with MSP in RC. Height of the RAL peak corresponds to the k2/k1 ratio of 0.31.
on February 10, 2016
jgp.rupress.orgD
ownloaded from
Published July 17, 2006
168 Retinol Kinetics in Rods and Cones
the extracellular space (Fig. 1 B and Figs. 2 and 3), is at
variance with the so-called tunneling hypothesis. This
hypothesis suggests that all-trans retinal released from
the chromophore binding site after bleaching stays
bound at an exit site of opsin and can only be removed
from it when “fresh” 11-cis retinal binds to an entrance
site before regeneration can occur (Heck et al., 2003;
Schädel et al., 2003). If the proposed tunneling mecha-
nism were obligatory, it would mean that no all-trans
retinoid generated after bleach could be removed from
the OS without fi rst providing 11-cis retinal. This is
clearly not the case in our experiments done on isolated
cells devoid of any 11-cis retinal supply.
Taken together, the results we present here provide a
mechanistic basis for the much more rapid operation of
the visual cycle in cone photoreceptors compared with
rod photoreceptors. This is so for three principal rea-
sons. First, metapigment decay occurs much more rap-
idly in cells containing cone pigment compared with
cells containing rod pigment. Second, the reduction of
retinal to retinol occurs more rapidly in cones than in
rods. Third, retinol clearance is signifi cantly faster from
cones than from rods because of the larger surface to
volume ratio of cones. The fi rst two reasons, i.e., fast
metarhodopsin decay rate as well as the fast RDH reac-
tion in cones, also underlie the faster retinol produc-
tion rates observed in cones compared with rods. In
rods containing rod-type pigment, the metapigment de-
cay rate is signifi cantly slower than in cells containing
cone-type pigments, and in certain regions of the outer
segment (i.e., the distal tip), retinol production appears
to be limited by factors unrelated to metapigment
decay. We hypothesize that this limitation is likely due to
insuffi cient supplies of the RDH cofactor, NADPH, that
derive from energy sources within mitochondria located
in the inner segments of these cells. Additional compar-
ative studies of the energy metabolism of rods and cones
will be required to determine the dynamic role of
NADPH production in the operation of the visual cycle
to resolve this issue.
This work was supported by National Institutes of Health grants EY01157, EY04939, and EY14850 and CRDF grant RUB1-2628 and the Russian Foundation for Basic Research grant 06-04-48914.
Olaf S. Andersen served as editor.
Submitted: 12 April 2006Accepted: 27 June 2006
R E F E R E N C E S Azuma, K., M. Azuma, and W. Sickel. 1977. Regeneration of rho-
dopsin in frog outer segments. J. Physiol. 271:747–759.
Baylor, D.A., T.D. Lamb, and K.W. Yau. 1979. The membrane cur-
rent of single rod outer segments. J. Physiol. 288:589–611.
Blaurock, A.E., and M.H. Wilkins. 1969. Structure of frog photore-
ceptor membranes. Nature. 223:906–909.
Chen, C., E. Tsina, M.C. Cornwall, R.K. Crouch, S. Vijayaraghavan,
and Y. Koutalos. 2005. Reduction of all-trans retinal to all-trans ret-
inol in the outer segments of frog and mouse rod photoreceptors.
Biophys. J. 88:2278–2287.
Cocozza, J.D., and S.E. Ostroy. 1987. Factors affecting the regen-
eration of rhodopsin in the isolated amphibian retina. Vision Res. 27:1085–1091.
Cohen, G.B., D.D. Oprian, and P.R. Robinson. 1992. Mechanism of
activation and inactivation of opsin: role of Glu113 and Lys296.
Biochemistry. 31:12592–12601.
Cornwall, M.C., E.F. MacNichol Jr., and A. Fein. 1984. Absorptance
and spectral sensitivity measurements of rod photoreceptors of the
tiger salamander, Ambystoma tigrinum. Vision Res. 24:1651–1659.
Cornwall, M.C., A. Fein, and E.F. MacNichol Jr. 1990. Cellular mech-
anisms that underlie bleaching and background adaptation.
J. Gen. Physiol. 96:345–372.
Cornwall, M.C., G.J. Jones, V.J. Kefalov, G.L. Fain, and H.R.
Matthews. 2000. Electrophysiological methods for measurement
of activation of phototransduction by bleached visual pigment in
salamander photoreceptors. Methods Enzymol. 316:224–252.
Das, S.R., N. Bhardwaj, H. Kjeldbye, and P. Gouras. 1992. Muller
cells of chicken retina synthesize 11-cis-retinol. Biochem. J. 285(Pt 3):907–913.
Dean, D.M., W. Nguitragool, A. Miri, S.L. McCabe, and A.L.
Zimmerman. 2002. All-trans-retinal shuts down rod cyclic nu-
cleotide-gated ion channels: a novel role for photoreceptor reti-
noids in the response to bright light? Proc. Natl. Acad. Sci. USA.
99:8372–8377.
Donner, K.O., and S. Hemilä. 1975. Kinetics of long-lived rhodop-
sin photoproducts in the frog retina as a function of the amount
bleached. Vision Res. 15:985–995.
Ebrey, T., and Y. Koutalos. 2001. Vertebrate photoreceptors. Prog. Retin. Eye Res. 20:49–94.
Edwards, R.B., and A.J. Adler. 2000. IRBP enhances removal of 11-
cis-retinaldehyde from isolated RPE membranes. Exp. Eye Res. 70:235–245.
Firsov, M.L., A.V. Kolesnikov, E.Y. Golobokova, and V.I. Govardovskii.
2005. Two realms of dark adaptation. Vision Res. 45:147–151.
Fukada, Y., and T. Yoshizawa. 1981. Activation of phosphodiesterase
in frog rod outer segment by an intermediate of rhodopsin
photolysis. II. Biochim. Biophys. Acta. 675:195–200.
Futterman, S. 1963. Metabolism of the retina. J. Biol. Chem. 238:1145–1150.
Golobokova, E.Y., and V.I. Govardovskii. 2006. Late stages of
visual pigment photolysis in situ: cones vs. rods. Vision Res. 46:2287–2297.
Golobokova, E.Y., A.V. Kolesnikov, and V.I. Govardovskii. 2003. Slow
stages of photolysis of the green rods visual pigment of the frog,
Rana temporaria. Sens. Syst. 17:134–143 (in Russian).
Govardovskii, V.I., and L.V. Zueva. 2000. Fast microspectrophotom-
eter for studying the photolysis of visual pigments in situ. Sensornye Sistemy. 14:288–296.
Govardovskii, V.I., N. Fyhrquist, T. Reuter, D.G. Kuzmin, and K.
Donner. 2000. In search of the visual pigment template. Vis. Neurosci. 17:509–528.
Hárosi, F.I. 1975. Absorption spectra and linear dichroism of some
amphibian photoreceptors. J. Gen. Physiol. 66:357–382.
Heck, M., S.A. Schädel, D. Maretzki, and K.P. Hofmann. 2003.
Secondary binding sites of retinoids in opsin: characterization
and role in regeneration. Vision Res. 43:3003–3010.
Horrigan, D.M., M.L. Tetreault, N. Tsomaia, C. Vasileiou, B. Borhan,
D.F. Mierke, R.K. Crouch, and A.L. Zimmerman. 2005. Defi ning
the retinoid binding site in the rod cyclic nucleotide-gated channel.
J. Gen. Physiol. 126:453–460.
Hsu, S.C., and R.S. Molday. 1991. Glycolytic enzymes and a GLUT-1
glucose transporter in the outer segments of rod and cone pho-
toreceptor cells. J. Biol. Chem. 266:21745–21752.
on February 10, 2016
jgp.rupress.orgD
ownloaded from
Published July 17, 2006
Ala-Laurila et al. 169
Hsu, S.C., and R.S. Molday. 1994. Glucose metabolism in photo-
receptor outer segments. Its role in phototransduction and in
NADPH-requiring reactions. J. Biol. Chem. 269:17954–17959.
Jäger, S., K. Palczewski, and K.P. Hofmann. 1996. Opsin/all-trans-
retinal complex activates transducin by different mechanisms
than photolyzed rhodopsin. Biochemistry. 35:2901–2908.
Jones, G.J., R.K. Crouch, B. Wiggert, M.C. Cornwall, and G.J.
Chader. 1989. Retinoid requirements for recovery of sensitivity
after visual-pigment bleaching in isolated photoreceptors. Proc. Natl. Acad. Sci. USA. 86:9606–9610.
Jones, G.J., A. Fein, E.F. MacNichol Jr., and M.C. Cornwall. 1993.
Visual pigment bleaching in isolated salamander retinal cones.
Microspectrophotometry and light adaptation. J. Gen. Physiol. 102:483–502.
Kolesnikov, A.V., E.Y. Golobokova, and V.I. Govardovskii. 2003. The
identity of metarhodopsin III. Vis. Neurosci. 20:249–265.
Lamb, T.D., and E.N. Pugh Jr. 2004. Dark adaptation and the reti-
noid cycle of vision. Prog. Retin. Eye Res. 23:307–380.
Leibrock, C.S., T. Reuter, and T.D. Lamb. 1994. Dark adaptation
of toad rod photoreceptors following small bleaches. Vision Res. 34:2787–2800.
Leibrock, C.S., T. Reuter, and T.D. Lamb. 1998. Molecular basis of
dark adaptation in rod photoreceptors. Eye. 12:511–520.
Liebman, P.A. 1969. Microspectrophotometry of retinal cells. Ann. NY Acad. Sci. 157:250–264.
Liebman, P.A. 1973. Microspectrophotometry of Visual Receptors.
In Biochemistry and Physiology of Visual Pigments. H. Langer,
editor. Springer-Verlag, New York. 299–305.
Loew, A., and F. Gonzalez-Fernandez. 2002. Crystal structure of the
functional unit of interphotoreceptor retinoid binding protein.
Structure. 10:43–49.
Ma, J., S. Znoiko, K.L. Othersen, J.C. Ryan, J. Das, T. Isayama, M.
Kono, D.D. Oprian, D.W. Corson, M.C. Cornwall, et al. 2001.
A visual pigment expressed in both rod and cone photoreceptors.
Neuron. 32:451–461.
Mahroo, O.A., and T.D. Lamb. 2004. Recovery of the human phot-
opic electroretinogram after bleaching exposures: estimation of
pigment regeneration kinetics. J. Physiol. 554:417–437.
Makino, C.L., and R.L. Dodd. 1996. Multiple visual pigments in a pho-
toreceptor of the salamander retina. J. Gen. Physiol. 108:27–34.
Mariani, A.P. 1986. Photoreceptors of the larval tiger salamander
retina. Proc. R. Soc. Lond. B. Biol. Sci. 227:483–492.
Mata, N.L., R.A. Radu, R.C. Clemmons, and G.H. Travis. 2002.
Isomerization and oxidation of vitamin a in cone-dominant reti-
nas: a novel pathway for visual-pigment regeneration in daylight.
Neuron. 36:69–80.
McBee, J.K., K. Palczewski, W. Baehr, and D.R. Pepperberg. 2001.
Confronting complexity: the interlink of phototransduction and
retinoid metabolism in the vertebrate retina. Prog. Retin. Eye Res. 20:469–529.
McCabe, S.L., D.M. Pelosi, M. Tetreault, A. Miri, W. Nguitragool, P.
Kovithvathanaphong, R. Mahajan, and A.L. Zimmerman. 2004.
All-trans-retinal is a closed-state inhibitor of rod cyclic nucleotide-
gated ion channels. J. Gen. Physiol. 123:521–531.
Morton, R.A., and G.A. Pitt. 1955. Studies on rhodopsin. IX. pH
and the hydrolysis of indicator yellow. Biochem. J. 59:128–134.
Palczewski, K., S. Jager, J. Buczylko, R.K. Crouch, D.L. Bredberg,
K.P. Hofmann, M.A. Asson-Batres, and J.C. Saari. 1994. Rod outer
segment retinol dehydrogenase: substrate specifi city and role in
phototransduction. Biochemistry. 33:13741–13750.
Palczewski, K., J.P. Van Hooser, G.G. Garwin, J. Chen, G.I. Liou, and
J.C. Saari. 1999. Kinetics of visual pigment regeneration in ex-
cised mouse eyes and in mice with a targeted disruption of the
gene encoding interphotoreceptor retinoid-binding protein or
arrestin. Biochemistry. 38:12012–12019.
Pitt, G.A., F.D. Collins, R.A. Morton, and P. Stok. 1955. Studies on
rhodopsin. VIII. Retinylidenemethylamine, an indicator yellow
analogue. Biochem. J. 59:122–128.
Qtaishat, N.M., B. Wiggert, and D.R. Pepperberg. 2005.
Interphotoreceptor retinoid-binding protein (IRBP) promotes
the release of all-trans retinol from the isolated retina following
rhodopsin bleaching illumination. Exp. Eye. Res. 81:455–463.
Rattner, A., P.M. Smallwood, and J. Nathans. 2000. Identifi cation and
characterization of all-trans-retinol dehydrogenase from photore-
ceptor outer segments, the visual cycle enzyme that reduces all-
trans-retinal to all-trans-retinol. J. Biol. Chem. 275:11034–11043.
Ripps, H., N.S. Peachey, X. Xu, S.E. Nozell, S.B. Smith, and G.I.
Liou. 2000. The rhodopsin cycle is preserved in IRBP “knockout”
mice despite abnormalities in retinal structure and function. Vis. Neurosci. 17:97–105.
Saari, J.C., G.G. Garwin, J.P. Van Hooser, and K. Palczewski. 1998.
Reduction of all-trans-retinal limits regeneration of visual pig-
ment in mice. Vision Res. 38:1325–1333.
Schädel, S.A., M. Heck, D. Maretzki, S. Filipek, D.C. Teller, K.
Palczewski, and K.P. Hofmann. 2003. Ligand channeling within
a G-protein-coupled receptor. The entry and exit of retinals in
native opsin. J. Biol. Chem. 278:24896–24903.
Shaw, N.S., and N. Noy. 2001. Interphotoreceptor retinoid- binding
protein contains three retinoid binding sites. Exp. Eye Res. 72:183–190.
Sherry, D.M., D.D. Bui, and W.J. Degrip. 1998. Identifi cation and
distribution of photoreceptor subtypes in the neotenic tiger sala-
mander retina. Vis. Neurosci. 15:1175–1187.
Surya, A., K.W. Foster, and B.E. Knox. 1995. Transducin activation
by the bovine opsin apoprotein. J. Biol. Chem. 270:5024–5031.
Thomas, M.M., and T.D. Lamb. 1999. Light adaptation and dark ad-
aptation of human rod photoreceptors measured from the a-wave
of the electroretinogram. J. Physiol. 518:479–496.
Tsin, A.T., H.A. Pedrozo-Fernandez, J.M. Gallas, and J.P. Chambers.
1988. The fl uorescence quantum yield of vitamin A2. Life Sci. 43:1379–1384.
Tsina, E., C. Chen, Y. Koutalos, P. Ala-Laurila, M. Tsacopoulos, B.
Wiggert, R.K. Crouch, and M.C. Cornwall. 2004. Physiological
and microfl uorometric studies of reduction and clearance of reti-
nal in bleached rod photoreceptors. J. Gen. Physiol. 124:429–443.
Vanderkooi, G., and M. Sundaralingam. 1970. Biological membrane
structure. II. A detailed model for the retinal rod outer segment
membrane. Proc. Natl. Acad. Sci. USA. 67:233–238.
on February 10, 2016
jgp.rupress.orgD
ownloaded from
Published July 17, 2006
Related Documents