VIDEO GAME VISUAL DEMANDS, READING, AND ATTENTION 1 What’s in a game: Video game visual-spatial demand location exhibits a double dissociation with reading speed Shaylyn Kress, Josh Neudorf, Braedyn Borowsky, and Ron Borowsky Department of Psychology, University of Saskatchewan Author Note Shaylyn Kress https://orcid.org/0000-0003-3526-2900 Josh Neudorf https://orcid.org/0000-0001-9227-1358 Ron Borowsky https://orcid.org/0000-0003-0002-4021 This work was supported by the Natural Sciences and Engineering Research Council of Canada (NSERC) through Alexander Graham Bell Canada Graduate Scholarships to the lead author Shaylyn Kress and co-author Josh Neudorf and a Discovery Grant (18968-2013- 22). The authors have no competing interests to declare. The datasets for this study are openly available at https://doi.org/10.5281/zenodo.6366587. Correspondence regarding this article should be addressed to Ron Borowsky, Cognitive Neuroscience Lab, Department of Psychology, 9 Campus Drive, Saskatoon, SK, Canada, S7N 5A5. Email: [email protected]

Welcome message from author
This document is posted to help you gain knowledge. Please leave a comment to let me know what you think about it! Share it to your friends and learn new things together.
Transcript
VIDEO GAME VISUAL DEMANDS, READING, AND ATTENTION 1
What’s in a game: Video game visual-spatial demand location exhibits a double
dissociation with reading speed
Shaylyn Kress, Josh Neudorf, Braedyn Borowsky, and Ron Borowsky
Department of Psychology, University of Saskatchewan
Author Note
Shaylyn Kress https://orcid.org/0000-0003-3526-2900
Josh Neudorf https://orcid.org/0000-0001-9227-1358
Ron Borowsky https://orcid.org/0000-0003-0002-4021
This work was supported by the Natural Sciences and Engineering Research
Council of Canada (NSERC) through Alexander Graham Bell Canada Graduate Scholarships to
the lead author Shaylyn Kress and co-author Josh Neudorf and a Discovery Grant (18968-2013-
22).
The authors have no competing interests to declare.
The datasets for this study are openly available at
https://doi.org/10.5281/zenodo.6366587.
Correspondence regarding this article should be addressed to Ron Borowsky, Cognitive
Neuroscience Lab, Department of Psychology, 9 Campus Drive, Saskatoon, SK, Canada, S7N
5A5. Email: [email protected]

VIDEO GAME VISUAL DEMANDS, READING, AND ATTENTION 2
Abstract
This research sought to clarify the nature of the relationship between video game experience,
attention, and reading. Previous studies have suggested playing action video games can improve
reading ability in children with dyslexia. Other research has linked video game experience with
visual-spatial attention, and visual-spatial attention with reading. We hypothesized that the
visual-spatial demands of video games may drive relationships with reading through attentional
processing. In this experiment we used a hybrid attention/reading task to explore the relationship
between video game visual-spatial demands, reading and attention. We also conducted a novel
visual-spatial demand analysis using participants’ top five played video games for an individual-
specific measure of visual demands. Peripheral visual demands in video games were associated
with faster reaction times, while central visual demands were associated with slower reaction
times for both phonetic decoding and lexical reading. In addition, video game experience in
terms of hours spent playing video games each week was related to faster reaction times during
dorsal stream phonetic decoding and validly cued trials. These results suggest that exposure to
peripheral visual spatial demands in video games may be related to both lexical and sublexical
reading processes in skilled adult readers, which has implications not only for models of how
ventral and dorsal stream reading and visual-spatial attention are integrated, but also for the
development of dyslexia diagnostics and remediation.
Keywords: video games, lexical reading, sublexical reading, phonetic decoding, visual-
spatial attention

VIDEO GAME VISUAL DEMANDS, READING, AND ATTENTION 3
What’s in a game: Video game visual-spatial demand location exhibits a double
dissociation with reading speed
1. Introduction
Playing video games is a popular hobby. In the Entertainment Software Association of
Canada’s Real Canadian Gamer Essential Facts report (2020), 61% of surveyed Canadians
reported playing video games. In the United States of America, 65% of adults play video games
and 70% of families have a child who plays video games (Entertainment Software Association,
2019) and in 2020, 50% of the surveyed European population between the ages of 6 and 64 play
video games (Europe’s Video Games Industry & European Games Developer Federation, 2021).
With video games present in the daily lives of so many people, it is important to understand its
impact on cognition. Some studies have demonstrated that playing video games is beneficial to
various cognitive domains, particularly reading (e.g., Antzaka et al., 2017; Basak et al., 2008;
Bertoni et al., 2021; Dye et al., 2009; Franceschini et al., 2017; Franceschini & Bertoni, 2019;
Green & Bavelier, 2003; see Franceschini et al., 2015 for a review). Other researchers have
suggested screen-use/video games may have a detrimental effect on brain structure (e.g., Hutton
et al., 2019; West et al., 2018). Determining how video games are related to reading and
associated cognitive and brain functions will help researchers gain knowledge on what factors
are involved in the development and maintenance of various reading processes.
The extant research on video games and cognitive processes focuses heavily on the
specific genre of action video games, which is one of the most popular video game genres among
children and teenagers (Entertainment Software Association of Canada, 2020). Games that fit
within the action video game genre are defined in the literature as those with high speeds (in
terms of object appearance/disappearance speeds as well as movement speeds), high perceptual,
VIDEO GAME VISUAL DEMANDS, READING, AND ATTENTION 4
cognitive, and motor loads, high temporal/spatial unpredictability, and an emphasis on peripheral
processing (Green & Bavelier, 2012). Typical exemplars of the action video game genre are first-
and third-person shooter games such as Call of Duty: Black Ops Cold War (a first-person shooter
game and among the top 5 best-selling games of 2020 in Europe; Europe’s Video Games
Industry & European Games Developer Federation, 2021) or Fortnite (a third-person shooter
game).
1.1 Reading Processes
1.1.1 Models of Reading
According to dual-route models of reading (e.g., Borowsky et al., 2006; see also
Coltheart et al., 2001, Perry et al., 2009, 2010, 2013) there are two streams in the brain, typically
left-hemisphere dominant, for processing written words into sound. One is the dorsal-sublexical
stream which is involved in phonetic decoding. This stream originates in the occipital lobe and
proceeds anteriorly through the parietal lobe. Pseudohomophones (PHs) are ideal stimuli to
encourage realistic sublexical-phonetic decoding because items in this special class of nonwords
sound like real words if phonetic decoding is utilized (e.g., the PH “shue” is pronounced like the
real word “shoe; Borowsky et al., 2006).
The other stream is the ventral-lexical stream. Like the dorsal-sublexical stream, the
ventral-lexical stream originates in the occipital lobe, but it proceeds anteriorly through the
temporal lobe. Lexical/whole-word reading is the process by which a word’s pronunciation can
be accessed directly rather than using phonetic decoding and is typically employed when reading
highly familiar words (i.e., “sight reading”; see Borowsky et al., 2006, 2007; Cummine et al.,
2013; Ekstrand et al., 2019a, 2019b, 2020; Neudorf et al., 2019; Pugh et al., 2000; Sandak et al.,
2004 for more information about these two processing systems). The optimal stimuli to

VIDEO GAME VISUAL DEMANDS, READING, AND ATTENTION 5
encourage lexical-whole word reading and activate the ventral-lexical stream are exception
words (EWs). EWs are words that cannot be correctly pronounced if phonetically decoded, and
thus require lexical/whole-word reading. The word “shoe” is one example of an EW, as if one
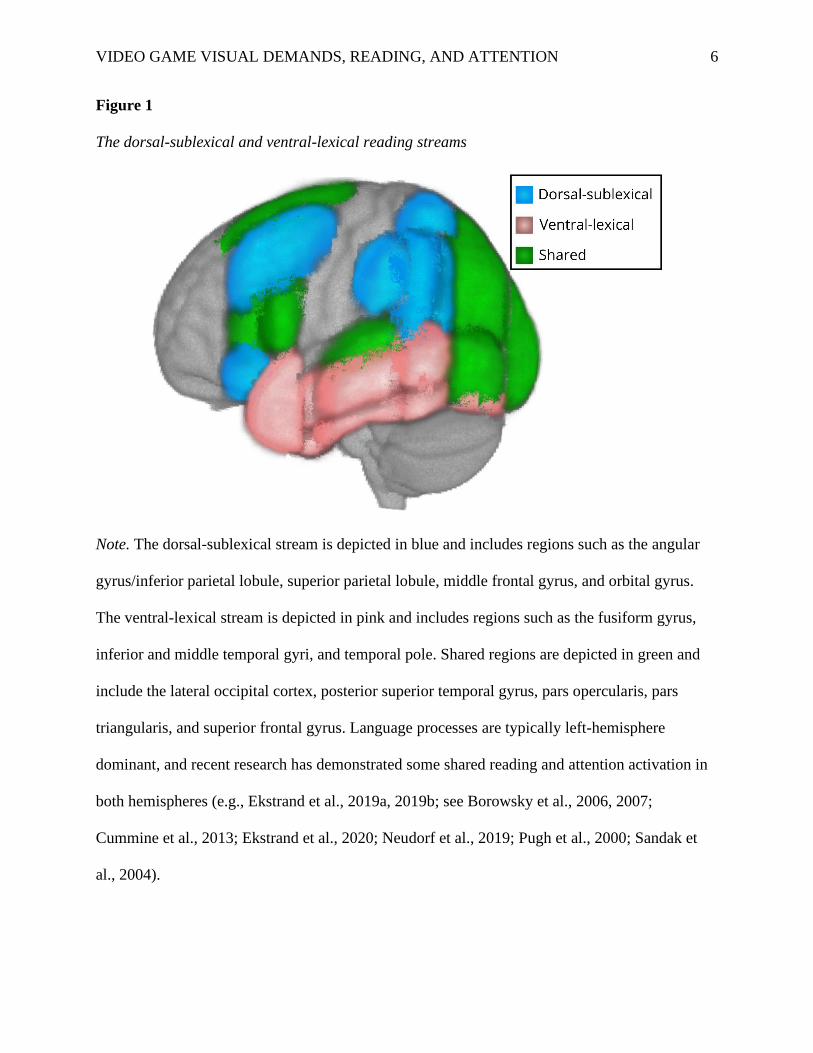
attempted to phonetically decode “shoe”, it would sound like “shoh”. Figure 1 depicts some of
these key regions of the dorsal-sublexical and ventral-lexical streams.
VIDEO GAME VISUAL DEMANDS, READING, AND ATTENTION 6
Figure 1
The dorsal-sublexical and ventral-lexical reading streams
Note. The dorsal-sublexical stream is depicted in blue and includes regions such as the angular
gyrus/inferior parietal lobule, superior parietal lobule, middle frontal gyrus, and orbital gyrus.
The ventral-lexical stream is depicted in pink and includes regions such as the fusiform gyrus,
inferior and middle temporal gyri, and temporal pole. Shared regions are depicted in green and
include the lateral occipital cortex, posterior superior temporal gyrus, pars opercularis, pars
triangularis, and superior frontal gyrus. Language processes are typically left-hemisphere
dominant, and recent research has demonstrated some shared reading and attention activation in
both hemispheres (e.g., Ekstrand et al., 2019a, 2019b; see Borowsky et al., 2006, 2007;
Cummine et al., 2013; Ekstrand et al., 2020; Neudorf et al., 2019; Pugh et al., 2000; Sandak et
al., 2004).
VIDEO GAME VISUAL DEMANDS, READING, AND ATTENTION 7
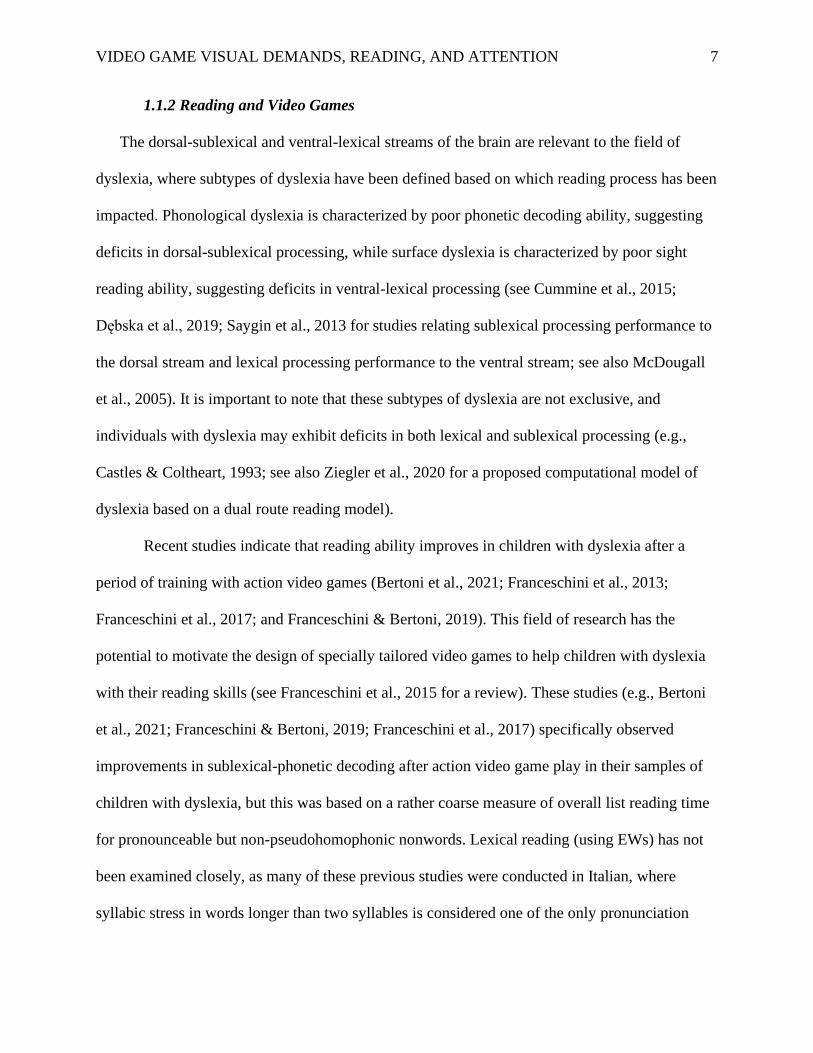
1.1.2 Reading and Video Games
The dorsal-sublexical and ventral-lexical streams of the brain are relevant to the field of
dyslexia, where subtypes of dyslexia have been defined based on which reading process has been
impacted. Phonological dyslexia is characterized by poor phonetic decoding ability, suggesting
deficits in dorsal-sublexical processing, while surface dyslexia is characterized by poor sight
reading ability, suggesting deficits in ventral-lexical processing (see Cummine et al., 2015;
Dębska et al., 2019; Saygin et al., 2013 for studies relating sublexical processing performance to
the dorsal stream and lexical processing performance to the ventral stream; see also McDougall
et al., 2005). It is important to note that these subtypes of dyslexia are not exclusive, and
individuals with dyslexia may exhibit deficits in both lexical and sublexical processing (e.g.,
Castles & Coltheart, 1993; see also Ziegler et al., 2020 for a proposed computational model of
dyslexia based on a dual route reading model).
Recent studies indicate that reading ability improves in children with dyslexia after a
period of training with action video games (Bertoni et al., 2021; Franceschini et al., 2013;
Franceschini et al., 2017; and Franceschini & Bertoni, 2019). This field of research has the
potential to motivate the design of specially tailored video games to help children with dyslexia
with their reading skills (see Franceschini et al., 2015 for a review). These studies (e.g., Bertoni
et al., 2021; Franceschini & Bertoni, 2019; Franceschini et al., 2017) specifically observed
improvements in sublexical-phonetic decoding after action video game play in their samples of
children with dyslexia, but this was based on a rather coarse measure of overall list reading time
for pronounceable but non-pseudohomophonic nonwords. Lexical reading (using EWs) has not
been examined closely, as many of these previous studies were conducted in Italian, where
syllabic stress in words longer than two syllables is considered one of the only pronunciation
VIDEO GAME VISUAL DEMANDS, READING, AND ATTENTION 8
features that requires lexical processing (see Franceschini et al., 2021). Determining whether
video game experience is related to lexical/whole-word reading ability as well as sublexical-
phonetic decoding would not only advance models of basic reading processes, but also indicate
which reading processes might benefit from the use of video games as a training tool.
1.2 Attention Processes
1.2.1 Models of Attention
Much like reading processes, a dual-route model can be applied to attentional orienting
processes (see Corbetta & Shulman, 2002 for a review). In the dual-route model of attention, the
two types of attention that are highlighted are the typically right hemisphere dominant dorsal-
endogenous attention and ventral-exogenous attention. Endogenous attention is also called
voluntary or top-down attention and can be cued with centrally presented symbolic cues such as
coloured symbols (e.g., Ekstrand et al., 2019b). Exogenous attention is also called automatic or
stimulus-driven attention and can be cued with peripheral visual indicators at the target location
(e.g., a flashing box on the left side of the screen). Additionally, in research relating reading and
attention, the temporal-parietal junction was involved during both reading processes and
attentional cueing processes during a typical 2-location Posner attentional cueing paradigm
(Ekstrand et al., 2019a, 2019b). Specifically, the researchers identified overlap between lexical
reading and exogenous peripheral visual attention processes and between phonetic decoding and
endogenous central visual attention processes. Figure 2 depicts some of these key regions of the
dorsal-endogenous and ventral-exogenous streams.
VIDEO GAME VISUAL DEMANDS, READING, AND ATTENTION 9
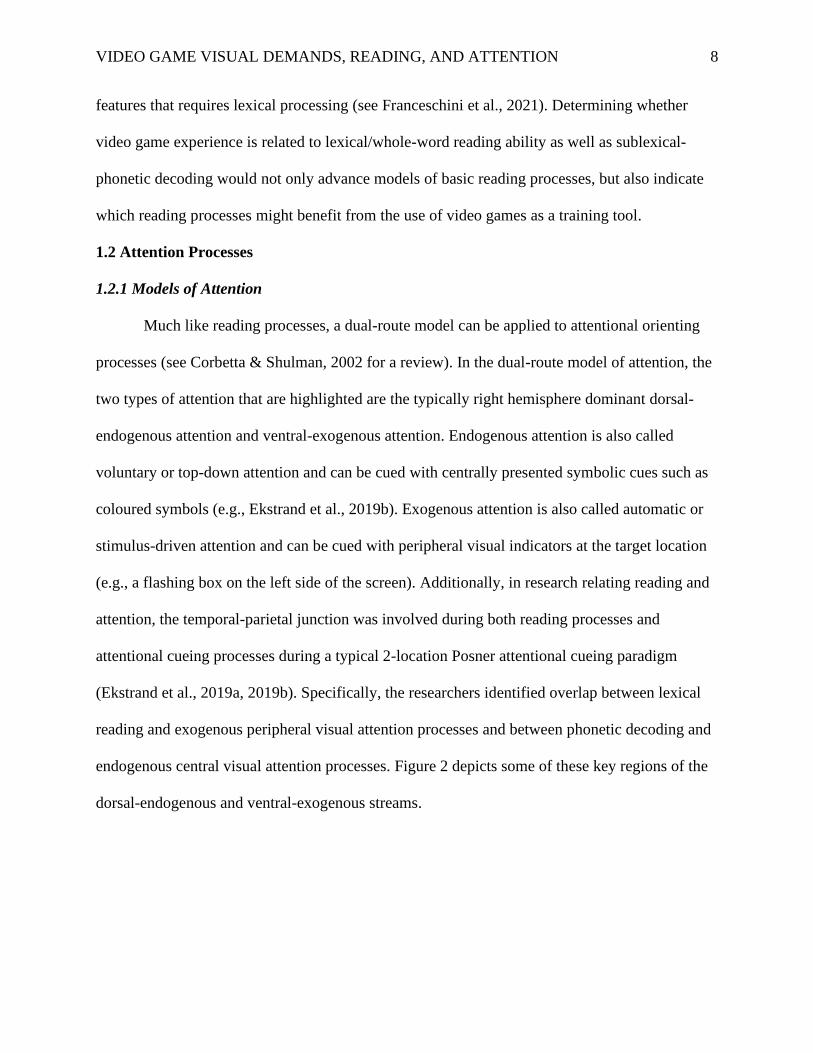
Figure 2
The dorsal-endogenous and ventral-exogenous attention streams
Note. The dorsal-endogenous stream is depicted in blue and includes regions such as the superior
parietal lobule/intraparietal sulcus and frontal eye field. The ventral-exogenous stream is
depicted in pink and includes regions such as the temporal-parietal junction (inferior parietal
lobule and superior temporal gyrus) and supramarginal gyrus. Shared regions are depicted in
green and include the occipital cortex and inferior frontal gyrus. Attention processes are typically
right-hemisphere dominant, and recent research has demonstrated some shared reading and
attention activation in both hemispheres (e.g., Ekstrand et al., 2019a, 2019b). See also Corbetta
& Shulman, 2002 and Mickleborough et al., 2015.
VIDEO GAME VISUAL DEMANDS, READING, AND ATTENTION 10
1.2.2 Attention and Video Games
In their seminal research, Green & Bavelier (2003) observed action video game
experience was related to attentional processes in adults (specifically, increased attentional
capacity and decreased attentional blink – the duration between two targets before the second
target can be easily perceived), both in group analyses of action video game players versus non-
video game players, and in training studies. The relationship between action video games and
decreased attentional blink has been replicated (e.g., Li et al., 2015; Dye & Bavelier, 2010)
although the relationship between video games and attentional capacity is less consistent (e.g.,
Irons et al., 2011). A relationship between video games and attentional orienting processes has
also been observed in the voluntary Attentional Network Test (e.g., Dye et al., 2009; Wilms et
al., 2013) but not consistently in automatic two-location cueing tasks (e.g., Castel et al., 2005;
West et al., 2008) and a review of the literature by Green & Bavelier (2019) highlights that
action video game experience appears to be most associated with training of voluntary attention
processes (see also Hubert-Wallander et al., 2011). More recently, structural neuroimaging
studies have identified an occipital-parietal network of increased connectivity in experienced
real-time strategy players (a video game genre that includes some action video game elements)
compared to non-video game players, including regions such as the angular gyrus, and inferior
parietal lobule (Kowalczyk et al., 2018).
1.3 Video Games, Reading, and Attentional Overlap
It has not yet been fully determined what characteristics of action video games are related
to this improvement in reading ability. Given the extensive research that has already associated
action video games with performance in attentional tasks, it may be the case that attentional
processing ability underlies the observed improvements in reading ability after video game play.
VIDEO GAME VISUAL DEMANDS, READING, AND ATTENTION 11
Previous research on video games, reading, and attention have theorized that regions related to
the magnocellular dorsal stream, occipital-parietal network, and fronto-parietal network may be
important to understanding the relationship between video games and these cognitive processes
(e.g., Bertoni et al., 2021; Kowalczyk et al., 2018; and Dye et al., 2009, respectively). In dyslexia
research, dysfunction in regions such as posterior superior temporal gyrus and angular gyrus are
thought to be related to the observed reading and attentional deficits (Shaywitz et al., 1998), and
the magnocellular dorsal stream is a key stream in most hypothesized explanations for the
deficits observed in dyslexia (e.g., Gori et al., 2014, 2016; see also Boden & Giaschi, 2007; Stein
& Walsh, 1997, for reviews). In neuroimaging studies of adult readers, the angular gyrus was
identified as an active region for both lexical and sublexical reading (e.g., Borowsky et al., 2006)
and in research on video games and attention, the angular gyrus was part of an occipital-parietal
network that exhibited increased connectivity in video-game players compared to non-gamers
(Kowalczyk et al., 2018). Research on children with dyslexia has revealed that these children are
delayed in both their spatial and temporal attentional abilities in comparison to their age-matched
peers, demonstrating that attentional deficits are relevant to the reading disorder (e.g., Facoetti et
al., 2000, 2008; Visser et al., 2004). During video game training studies involving children with
dyslexia, improvements in attentional ability have been observed alongside the previously
mentioned improvements in reading ability (e.g., Franceschini et al., 2017; Bertoni et al., 2021).
Additionally, Antzaka et al. (2017) observed a positive correlation between visual attention span
and French pseudoword reading speed in their group of skilled adult readers, and action video
gamers performed better than non-gamers in these tasks. This combination of findings in the
literature suggests that visual-spatial attentional processes may be driving the relationship
between video games, reading, and attention.
VIDEO GAME VISUAL DEMANDS, READING, AND ATTENTION 12
1.4 The Problem with Action Video Game Classification
Given the previously discussed overlap between reading and attentional processes, it may
be the case that the frequency of visual-spatial attention demands in video games drives the
observed relationship between video game experience and these cognitive processes. This idea is
supported by the commonly used action vs non-action video games categorization, where action
games are subjectively distinguished by high perceptual, cognitive, and motor loads (Green &
Bavelier, 2012). Historically researchers have focused on these “action” vs “non-action/non-
gamer” group analyses (e.g., Franceschini et al., 2017; Green & Bavelier 2003; Kowalczyk et al.,
2018) which facilitates the replication of results with training studies (however, the practice of
group analyses has been criticized by some researchers; see Unsworth et al., 2015; see Green et
al., 2017 for a rebuttal).
There are also some issues with the action vs non-action categorization, which were of
primary concern for the present experiment. Action games have typically been the focus in
previous studies, however the definition of an action video game is somewhat subjective, even
with the criteria outlined by Green & Bavelier (2012). As discussed by Bavelier & Green (2019),
modern video games tend to blend genres, which makes categorization complicated. For
example, Bavelier & Green (2019) mention the game, The Elder Scrolls V: Skyrim, which blends
role-playing game mechanics (historically role-playing games would be considered non-action)
with shooter game mechanics (consistently considered part of the action genre).
Additionally, as noted by Wilms et al. (2013), technological advances have allowed game
developers to improve game mechanics and increase the complexity of games, which means the
latest release of a game from a given franchise is likely to be more complex and
visually/attentionally demanding than a previous game in the franchise. The Nintendo Switch
VIDEO GAME VISUAL DEMANDS, READING, AND ATTENTION 13
game Tetris 99 is a good example of this phenomenon. The original Tetris is considered a non-
action game (e.g., Green & Bavelier, 2003 and Dye et al., 2009; see also Bediou et al., 2018 who
describes Tetris as a puzzle game) and has been used as a non-action control game in training
studies (e.g., Green & Bavelier, 2003). In the original Tetris, the single-player game involves the
player managing the placement of various shaped blocks that fall one at a time from the top of
the screen. In contrast, Tetris 99 is a multiplayer game where the player still is managing the
placement of blocks that fall one at a time while also adapting to the actions of many opponents,
making it less clear whether this game belongs in the non-action category with its predecessor.
Another issue with the action/non-action categorization of video games is the
inconsistency between studies when classifying sub-genres, for example real-time strategy and
driving-racing games. Some studies classify these sub-genres as non-action games (see Dye et
al., 2009, where their appendix of non-action games includes real-time strategy games such as
Starcraft and driving-racing games such as Need for Speed) however other studies argue that
driving-racing games and real-time strategy games are action games. Wu & Spence (2013) used
a driving-racing game from the Need for Speed franchise in their training study and observed
reaction time improvements in a visual search task. These reaction time improvements were also
observed in participants trained with a first-person shooter game, but not when participants were
trained with a 3-D puzzle game. In another study, Kowalcyzk et al. (2018) compared structural
connectivity in experienced Starcraft II players versus novice/non-video game players and
observed increased numbers of white matter fibres in occipital-parietal tracts for the Starcraft II
players. In both these studies, driving-racing and real-time strategy games were selected because
the researchers argue these games meet the action game criteria, even though previous studies
have categorized games from the same genres and same franchises as non-action (Dye et al.,
VIDEO GAME VISUAL DEMANDS, READING, AND ATTENTION 14
2009). This issue is also related to the previously discussed problem of genre blending and game
evolution, as Dye et al. (2009) classified the first Starcraft game as non-action, while Kowalczyk
et al. (2018) were investigating the sequel, Starcraft II.
Dobrowolski et al. (2015) have examined these issues in action game classification. In
their study, group differences were observed between real-time strategy players and non-video
game players in task switching and multiple object tracking paradigms, but no differences were
observed between first-person shooter players and non-video game players in these same tasks.
The researchers argue that both real-time strategy and first-person shooter games fit within the
action game genre, demonstrating the importance of moving past broad genre classification to
determine which games (or specific characteristics of games) drive differences in cognitive
performance.
2. The Current Study
This study consists of two parts. First, we examined the proposed link between video
game experience, attention and reading, with a more demanding 8-location hybrid reading-
attention task (attentional cueing paradigms typically use only two locations; see Chica et al.,
2014 for a review of spatial attentional cueing task design). For this study we focused on
endogenous-voluntary attentional cueing, as that has been previously associated with video game
experience (e.g., Dye et al., 2009). Furthermore, previous studies have identified overlap
between central (endogenous) visual attention and phonetic decoding (e.g., Ekstrand, Neudorf,
Gould, et al., 2019; Ekstrand, Neudorf, Kress, & Borowsky, 2019), and phonetic decoding has
been most consistently related to video game experience in the literature (e.g., Bertoni et al.,
2021; Franceschini et al., 2017; Franceschini & Bertoni, 2019). Second, we then investigated
whether specific visual features in video games are related to performance differences in reading

VIDEO GAME VISUAL DEMANDS, READING, AND ATTENTION 15
and attention. To answer this question, we have developed an individually-relevant and
continuous measure of visual-spatial demands in the video games regularly played by each of our
participants to evaluate whether the frequency of these demands is related to reading and
attentional performance.
2.1 Hypotheses
1a. Previous research has observed larger orienting effects in video game players than
non-video game players (e.g., Dye et al., 2009). If this is generalizable to other cueing tasks and
video game player samples, we would expect cueing effects to be of a larger magnitude for
individuals with higher levels of video game experience in our attentional cueing paradigm.
1b. Alternatively, West et al. (2008) observed video game players are better at attending
to multiple locations than non-video game players. If this is consistent across other video game
players then one could predict that increased video game experience would be related to
decreased cueing effect sizes.
2. Consistent with previous studies (Bertoni et al., 2021; Franceschini et al., 2013;
Franceschini et al., 2017; and Franceschini & Bertoni, 2019), we expect video game experience
to be associated with better phonetic decoding, which should present as faster PH reading RTs.
3. Our previous neuroimaging research identified overlap between EW (lexical) reading
and peripheral visual attention processes and between PH reading (phonetic decoding) and
central visual attention processes (e.g., Ekstrand et al., 2019a; Ekstrand et al., 2019b). Given
these relationships, one would expect that phonetic decoding should show stronger associations
to game-specific centrally located visual-spatial demands than peripherally located visual-spatial
demands. The opposite could be the case during lexical reading, which we expect should be
associated with peripherally located visual-spatial demands.
VIDEO GAME VISUAL DEMANDS, READING, AND ATTENTION 16
2.2 Method
2.2.1 Participants
Twenty-four participants were recruited through the University of Saskatchewan
participant pool or an online bulletin on the University of Saskatchewan website. If recruited
through the participant pool they received 1 bonus course credit and if recruited through the
online bulletin they received $5 as compensation. One participant was excluded prior to analysis
because their video game experience exceeded three standard deviations greater than the mean.
As such 23 participants were included in the analyses below (14 female, 9 male, M = 26.82
years, SD = 9.26 years). All participants spoke English as their first language and provided
informed written consent before taking part in the study. This study was approved by the
University of Saskatchewan Research Ethics Board.
2.2.2 Apparatus and Stimuli
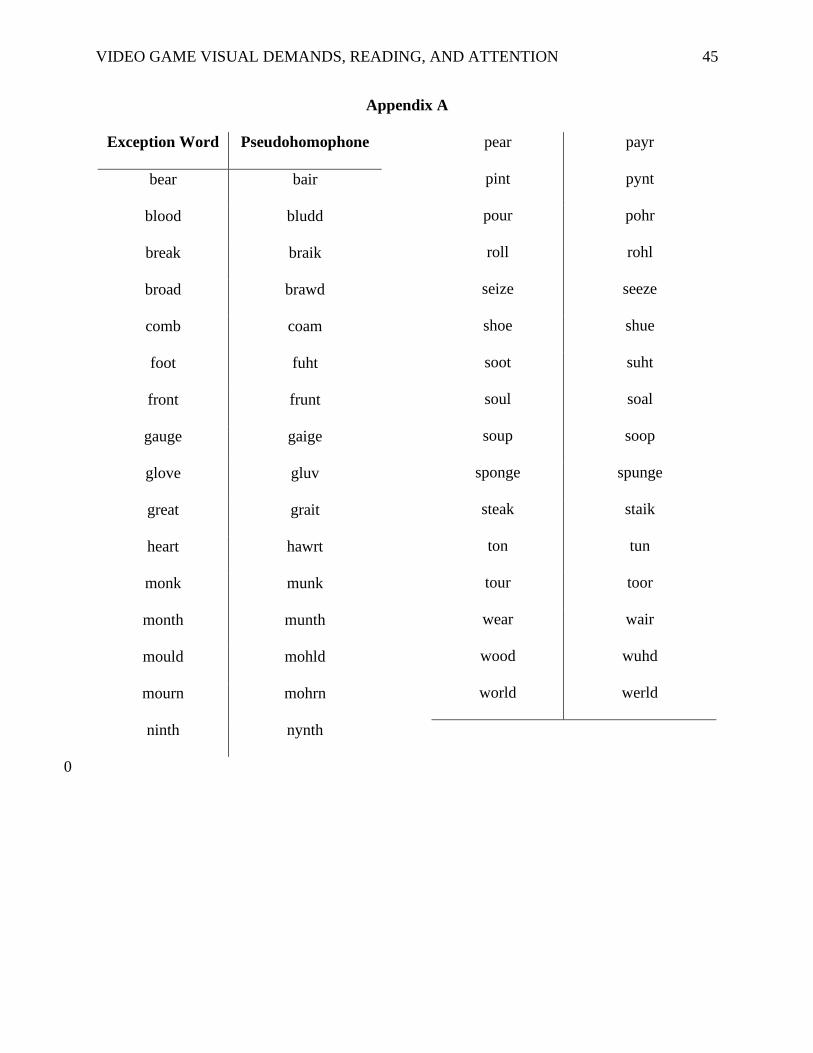
Thirty-two pairs of monosyllabic EWs and the corresponding PHs were selected as the stimuli
for this study (see Appendix A). The stimuli were grouped in EW and PH blocks, which
contained 32 trials each. Each trial included a centrally presented one or two letter cue
representing one of eight cardinal compass directions and cue validity was 75%. The order of the
EW and PH blocks was counterbalanced and the order of trials within a block was randomized.
Target stimuli were in 18 pt. Courier New white font on a black background and appeared in
either valid or invalid locations along an invisible square that was 7 cm × 7 cm, with the fixation
cross in the centre. The experiment was run using E-Prime (Psychology Software Tools,
https://pstnet.com) with a Compaq 7500 CRT monitor and an eye-to-screen distance of
approximately 40cm. Participant reaction time (RT) was recorded by a microphone connected to
the voice-key of an E-Prime serial-response box which recorded the RT when the onset of
VIDEO GAME VISUAL DEMANDS, READING, AND ATTENTION 17
speech was detected.
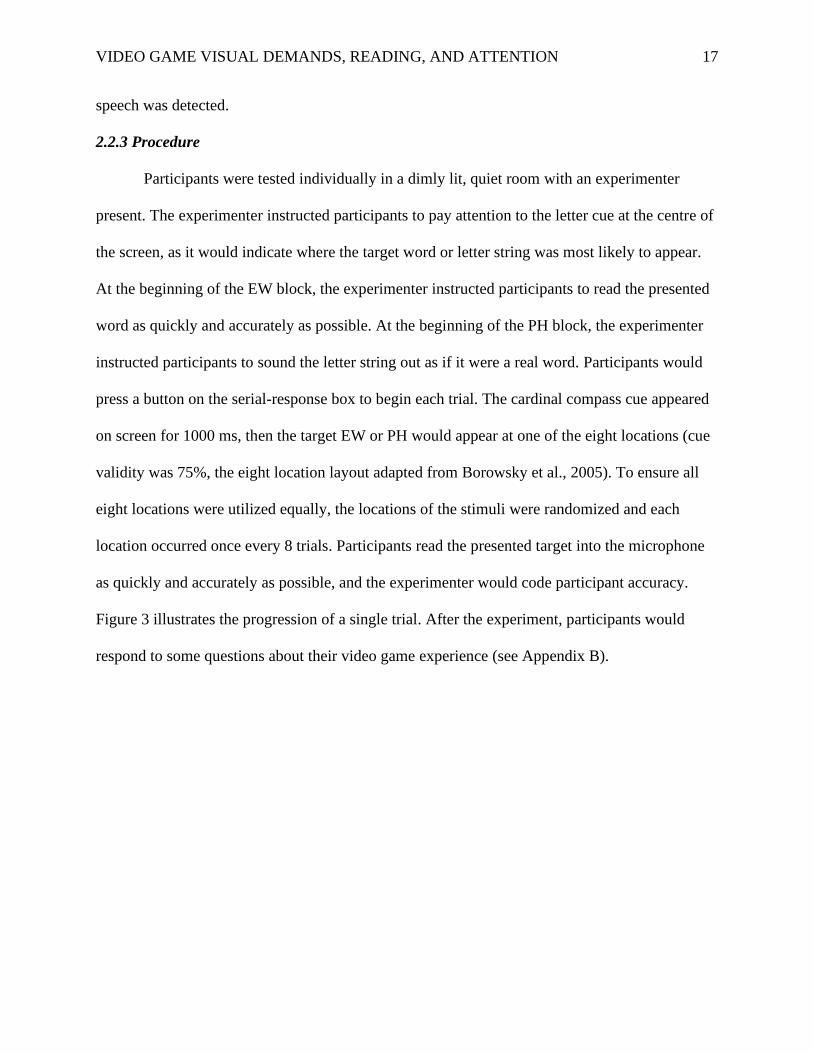
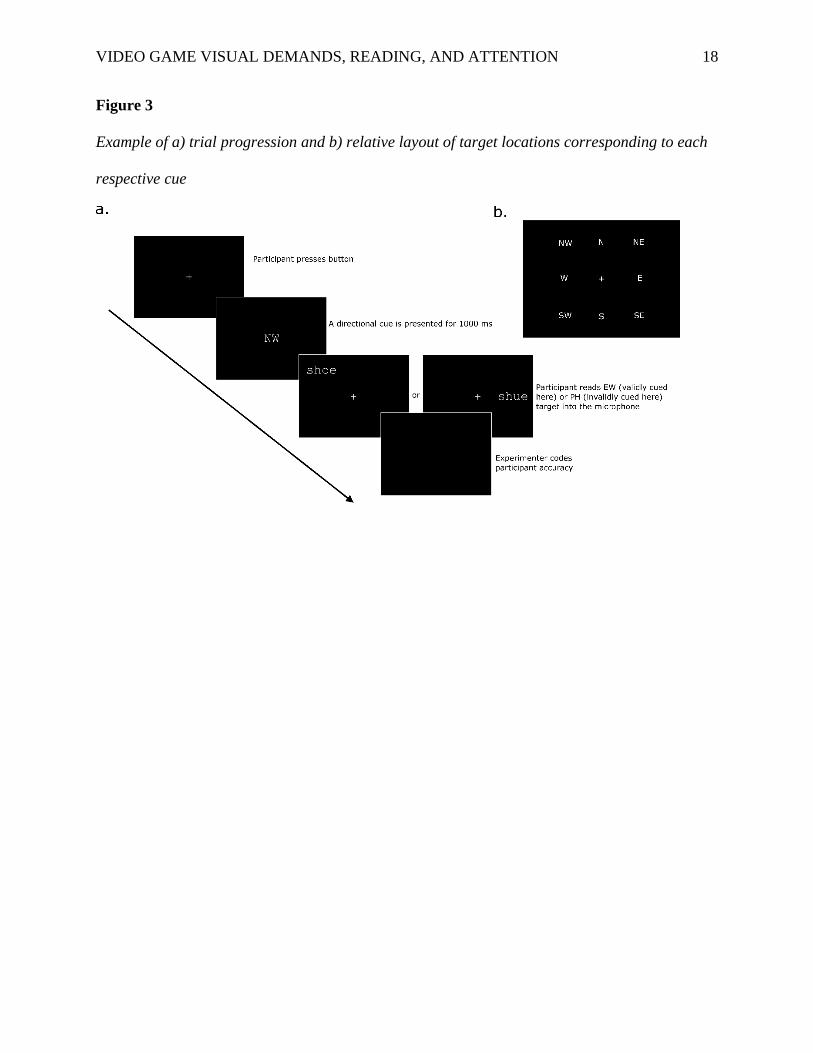
2.2.3 Procedure
Participants were tested individually in a dimly lit, quiet room with an experimenter
present. The experimenter instructed participants to pay attention to the letter cue at the centre of
the screen, as it would indicate where the target word or letter string was most likely to appear.
At the beginning of the EW block, the experimenter instructed participants to read the presented
word as quickly and accurately as possible. At the beginning of the PH block, the experimenter
instructed participants to sound the letter string out as if it were a real word. Participants would
press a button on the serial-response box to begin each trial. The cardinal compass cue appeared
on screen for 1000 ms, then the target EW or PH would appear at one of the eight locations (cue
validity was 75%, the eight location layout adapted from Borowsky et al., 2005). To ensure all
eight locations were utilized equally, the locations of the stimuli were randomized and each
location occurred once every 8 trials. Participants read the presented target into the microphone
as quickly and accurately as possible, and the experimenter would code participant accuracy.
Figure 3 illustrates the progression of a single trial. After the experiment, participants would
respond to some questions about their video game experience (see Appendix B).
VIDEO GAME VISUAL DEMANDS, READING, AND ATTENTION 18
Figure 3
Example of a) trial progression and b) relative layout of target locations corresponding to each
respective cue
VIDEO GAME VISUAL DEMANDS, READING, AND ATTENTION 19
2.2.4 Visual-Spatial Demand Analysis
The visual-spatial demand analysis conducted in this experiment is a novel technique we
have developed as an individually-based method of evaluating the visual-spatial demands of a
video game. Brief gameplay segments from each reported game were collected and analysed for
the frequency of visual-spatial demands. For computer (PC) and console games (e.g., Nintendo
Switch, PlayStation 4), three one-minute segments of gameplay for each game were collected
from the streaming platform Twitch.tv where individuals publicly share their gameplay videos.
To collect the one-minute segments, an archived video of a gameplay stream that was at least
one hour in duration was selected. Videos with additional user-added overlays (e.g., stream
camera, extra chat dialogs, notifications, etc.) were avoided if possible. If unavoidable, a video
was selected where these overlays took up as little space as possible. From this gameplay stream,
one-minute segments were chosen with the constraint that the one-minute segment consisted
primarily of gameplay footage. For mobile games, an iPhone 6 was used to download the
reported games. Between 17 and 40 minutes of gameplay was captured with the screen record
feature, and three one-minute segments were randomly selected from this recording. When
conducting feature analysis, the PC and console game clips were watched on a 16:9, 61.0 cm (24
inch) HP monitor, and the mobile game clips were watched on the iPhone 6 with a 16:9, 11.9 cm
(4.7 inch) display. Each clip was viewed at least once to score each visual demand measurement
separately. Complete analysis typically took 30 minutes per game. The visual demand
measurements are described below:
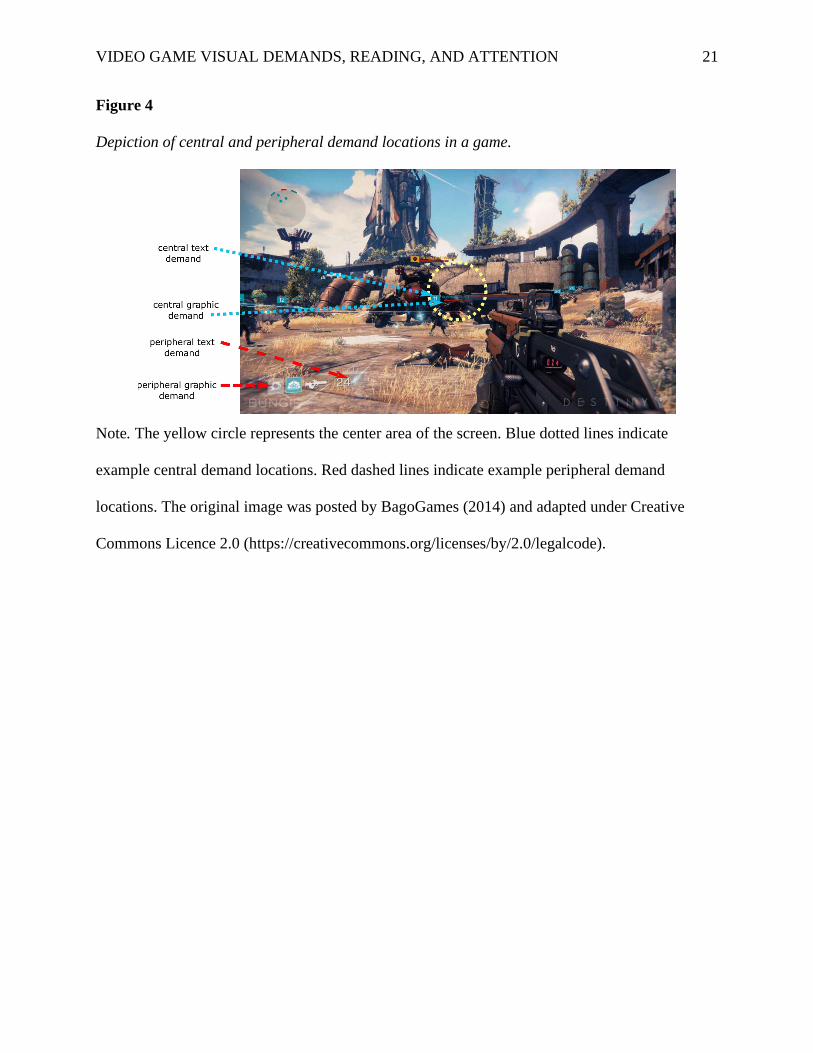
Central graphical (CG) demands were defined as the average number of graphical
changes per minute within the central area of the screen, peripheral graphical (PG) demands
were defined as the graphical changes per minute that occurred outside the central area, central
VIDEO GAME VISUAL DEMANDS, READING, AND ATTENTION 20
textual (CT) demands were text-based changes within the central area, and peripheral textual
(PT) demands were text-based changes outside the central area. The radius of the central area
was dependent on whether the game clip was PC/console, or mobile, and was designed to
encompass the foveal area, which has a radius of approximately 2.5° visual angle (as discussed
by Gutwin et al., 2017; 2.6° in Wandell, 1995, as cited in Strasburger et al., 2011). The radius of
the central area was drawn to 3.5 cm (2.5° visual angle at an eye-to-screen distance of 80 cm).
On the mobile device, the radius of the central area was drawn to 1.5 cm (2.5° visual angle at an
eye-screen distance of 34 cm). An item appearing or changing were the events that were counted
as a visual demand for one of these categories. For example, the text notification of an in-game
event in the corner of the screen would be considered a PT demand, a cooldown text timer in the
centre of the screen would be a CT demand, a red flash on the border of the screen indicating the
direction of enemy fire would be a PG demand, and a cooldown bar in the centre of the screen
would be a CG demand (see Figure 4). Events of the same category that occurred in close
temporal and spatial proximity (approximately < 500ms and < 1° apart) were clustered as a
single event. For example, multiple notifications appearing at the same time would be counted as
one text demand.
VIDEO GAME VISUAL DEMANDS, READING, AND ATTENTION 21
Figure 4
Depiction of central and peripheral demand locations in a game.
Note. The yellow circle represents the center area of the screen. Blue dotted lines indicate
example central demand locations. Red dashed lines indicate example peripheral demand
locations. The original image was posted by BagoGames (2014) and adapted under Creative
Commons Licence 2.0 (https://creativecommons.org/licenses/by/2.0/legalcode).

VIDEO GAME VISUAL DEMANDS, READING, AND ATTENTION 22
2.3 Results
Participants’ mean video game experience was 7.39 hours/week (SD = 9.84; min = 0
hrs/week, max = 35 hrs/week) and 51 unique video games were reported when participants were
asked to list their top five games (Question 1 of Appendix B, see Appendix C for the list of
reported games). The median RT of each participant’s correct trials was used as the RT measure
for the following analyses. Error rates were very low (ranging from 1.14% - 7.25%, see Figure
5).
2.3.1 Hybrid Reading-Attention Results
A median split was used to categorize participants into two groups: high experience video game
players (Hi: 3 hours or more per week of video game experience; N = 12, M = 13.71, SD =
10.11) and low experience video game players (Lo: less than 3 hours per week of video game
experience; N = 11, M = 0.50, SD = .55). Analyses were conducted on EWs and PHs separately
to reflect ventral-lexical vs dorsal-sublexical stream processing, respectively. When utilizing
ventral-lexical stream processes during EW reading, there was a main effect of Validity on
reaction time, participants read validly cued EWs more quickly (M = 680.44, SD = 101.62) than
invalidly cued EWs (M = 707.08, SD = 101.05), F(1, 21) = 5.32, MSE = 1529.73, p = .031. The
main effect of Video Game Experience was not significant, F(1, 21) = 0.39, MSE = 18973.29, p
= .537, but the interaction between Validity and Video Game Experience approached
significance, F(1, 21) = 4.27, MSE = 159.73, p = .051. Figure 5a illustrates these results and the
95% CIs indicate that this interaction manifests in the form of a significant effect of Validity for
the high experience video game players, but no effect of Validity for the low experience video
game players.

VIDEO GAME VISUAL DEMANDS, READING, AND ATTENTION 23
Figure 5
Reaction time as a function of Validity and Video Game Experience for a) EWs and b) PHs
Note. Lo = less than 3 hours of video game experience per week; Hi = 3 or more hours of video
game experience per week. Error bars are 95% confidence intervals, following the calculation
methods of Masson & Loftus (2003), with the middle pair of error bars representing the between-
subjects effect of video game experience. Labels in brackets represent error rate for each
condition1.
1 Although the error rates are very low, we did the same ANOVA on error rates as was done on RT, and there were
no significant effects. Nonetheless, we note a trend for higher error rates in the validly cued conditions than
invalidly cued conditions. Future research should examine whether processing of these central and controlled
attentional compass cues would elicit stronger (and more typical) effects on target processing during a longer
stimulus onset asynchrony (SOA) between the cue and target.
VIDEO GAME VISUAL DEMANDS, READING, AND ATTENTION 24
For dorsal-sublexical processing during PH reading, there was no effect of Validity, F(1,
21) = .84, MSE = 2985.52, p = .370 and no Validity × Video Game Experience interaction, F(1,
21) = 0.28, MSE = 2985.52, p = .602. The ANOVA yielded a trend for Video Game Experience
(F(1,21) = 3.09, MSE = 51155.53, p = .093), which is further supported by a significant
difference based on the 95% CIs whereby Hi experience participants were significantly faster (M
= 727.44, SD = 221.42) than Lo experience participants (M = 844.84, SD = 231.25; see Figure
5b).
2.3.2 Visual Demand Analysis Results
The participants in the two groups had a wide range of video game experience and played
a combination of games that could be classified as “action” or “non-action”. This continuum of
experience provides a unique opportunity to look at how different visual-spatial demands in
video games (as determined by our visual demand analysis in the above Methods section) are
related to reading and attentional performance.
Weighted scores for each of the four analysed video game visual demands (CG, CT, PG,
and PT) were calculated for each participant, to approximate participants’ monthly exposure to
these visual demands. The formula for weighted scores is as follows, with the units of the
weighted score being (hours/month)*(occurrences/min):
𝑊𝑒𝑖𝑔ℎ𝑡𝑒𝑑 𝑠𝑐𝑜𝑟𝑒 = ∑(𝑚𝑜𝑛𝑡ℎ𝑙𝑦_ℎ𝑜𝑢𝑟𝑠𝑔𝑎𝑚𝑒𝑖∗ 𝑚𝑒𝑎𝑠𝑢𝑟𝑒𝑔𝑎𝑚𝑒𝑖
)
5
𝑖= 1
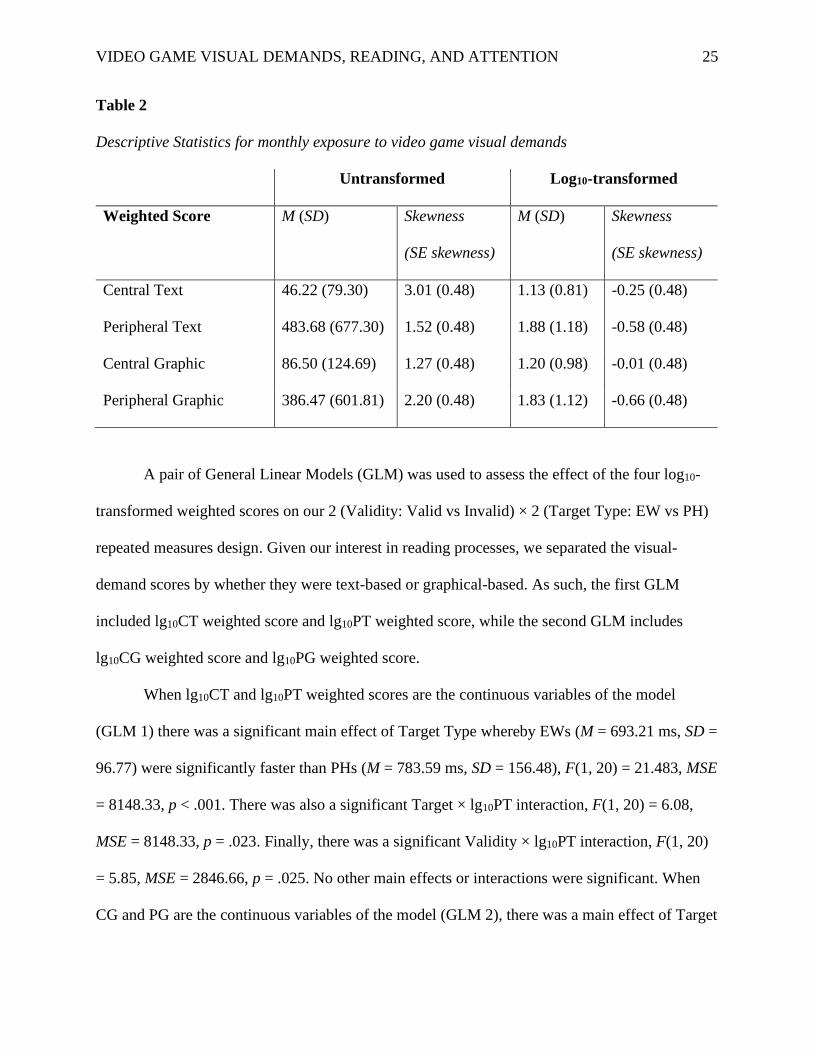
Descriptive statistics for the four weighted scores can be found in Table 2. All values
were log10-transformed to resolve skewness, which can also be found in Table 22.
2 Participants weighted scores were correlated with each other, with r-values ranging between .803 and .985.
VIDEO GAME VISUAL DEMANDS, READING, AND ATTENTION 25
Table 2
Descriptive Statistics for monthly exposure to video game visual demands
Untransformed Log10-transformed
Weighted Score M (SD) Skewness
(SE skewness)
M (SD) Skewness
(SE skewness)
Central Text 46.22 (79.30) 3.01 (0.48) 1.13 (0.81) -0.25 (0.48)
Peripheral Text 483.68 (677.30) 1.52 (0.48) 1.88 (1.18) -0.58 (0.48)
Central Graphic 86.50 (124.69) 1.27 (0.48) 1.20 (0.98) -0.01 (0.48)
Peripheral Graphic 386.47 (601.81) 2.20 (0.48) 1.83 (1.12) -0.66 (0.48)
A pair of General Linear Models (GLM) was used to assess the effect of the four log10-
transformed weighted scores on our 2 (Validity: Valid vs Invalid) × 2 (Target Type: EW vs PH)
repeated measures design. Given our interest in reading processes, we separated the visual-
demand scores by whether they were text-based or graphical-based. As such, the first GLM
included lg10CT weighted score and lg10PT weighted score, while the second GLM includes
lg10CG weighted score and lg10PG weighted score.
When lg10CT and lg10PT weighted scores are the continuous variables of the model
(GLM 1) there was a significant main effect of Target Type whereby EWs (M = 693.21 ms, SD =
96.77) were significantly faster than PHs (M = 783.59 ms, SD = 156.48), F(1, 20) = 21.483, MSE
= 8148.33, p < .001. There was also a significant Target × lg10PT interaction, F(1, 20) = 6.08,
MSE = 8148.33, p = .023. Finally, there was a significant Validity × lg10PT interaction, F(1, 20)
= 5.85, MSE = 2846.66, p = .025. No other main effects or interactions were significant. When
CG and PG are the continuous variables of the model (GLM 2), there was a main effect of Target
VIDEO GAME VISUAL DEMANDS, READING, AND ATTENTION 26
Type whereby participants responded significantly faster to EWs (M = 693.21 ms, SD = 87.67)
than PHs (M = 783.59, SD = 147.18) , F(1, 20) = 18.933, MSE = 8939.82, p < .001. There was
also a significant effect of lg10PG, F(1,20) = 8.23, p = .009 and a significant Target × lg10PG
interaction, F(1, 20) = 4.44, MSE = 8939.82, p = .048. The other main effects and interactions
were not significant.
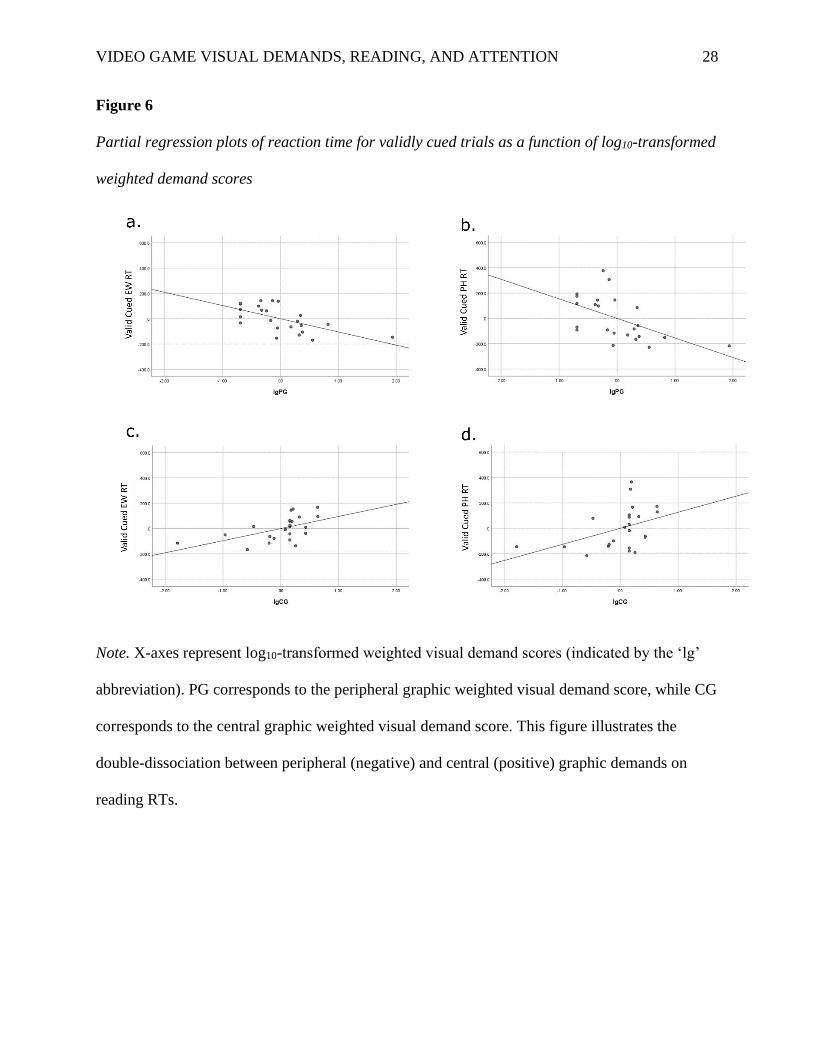
To evaluate the nature of the interactions between the log10-transformed visual demand
scores and our behavioural measures of interest, the partial-coefficients from each GLM were
examined (see Table 3). The Target × log10PT and Target × log10PG interactions appears to be
attributable to larger b magnitudes for PHs than EWs, and the Validity × log10PT interaction
appears to be related to larger b magnitudes in valid trials than invalid trials, although the partial-
coefficients involving log10PT were not significant. Increases in lg10PG were associated with
decreases in RT during invalidly cued PH trials (Figure 6a), validly cued PH trials (Figure 6b),
and validly cued EW trials (Figure 6c). Conversely, increases in lg10CG were associated with
increases in RT during validly cued EW trials (Figure 6d) and validly cued PH trials (Figure 6e).
Figure 6 focuses on the valid cued conditions, which are most similar to the highly valid cues
that video game players would experience during the games they play.

VIDEO GAME VISUAL DEMANDS, READING, AND ATTENTION 27
Table 3
Summary of Partial-Coefficients from GLM 1 (text demands) and GLM 2 (graphic demands)
Note. b-values are in milliseconds per log10-transformed weighted demand score. Seven of the
eight Visual Demand × Target Type cells show positive coefficients for central demands and
negative coefficients for peripheral demands, which is significant by a χ2 sign test, χ2 (1) = 4.5, p
= .034, supporting a double dissociation between location of visual demand and reading
performance.
Visual Demand Type
Text (GLM 1) Graphic (GLM 2)
Target Validity Central Peripheral Central Peripheral
PH Invalid b 79.33 -101.88 116.82 -138.56 *
t .83 -1.56 1.95 -2.62
p .415 .136 .066 .016
Valid b 117.98 -133.09 126.49 * -154.35 *
t 1.23 -2.02 2.09 -2.89
p .233 .057 .050 .009
EW Invalid b -22.00 10.18 61.60 -49.40
t -.36 .24 1.90 -1.45
p .722 .811 .125 .161
Valid b 52.18 -63.78 95.67 * -104.41 *
t .90 -1.60 2.88 -3.57
p .379 .126 .009 .002
VIDEO GAME VISUAL DEMANDS, READING, AND ATTENTION 28
Figure 6
Partial regression plots of reaction time for validly cued trials as a function of log10-transformed
weighted demand scores
Note. X-axes represent log10-transformed weighted visual demand scores (indicated by the ‘lg’
abbreviation). PG corresponds to the peripheral graphic weighted visual demand score, while CG
corresponds to the central graphic weighted visual demand score. This figure illustrates the
double-dissociation between peripheral (negative) and central (positive) graphic demands on
reading RTs.
VIDEO GAME VISUAL DEMANDS, READING, AND ATTENTION 29
3. General Discussion
In this study, we have used an attentionally-demanding, hybridized reading-attention task
along with our novel visual demand analysis to examine the relationship between video game
experience, reading, and attention, as well as the specific visual-spatial demands of participants’
most frequently played video games that may drive these relationships. During lexical EW
reading, we observed that our group of high experience video game players had larger attentional
cueing effects than our low experience video game players, supporting our hypothesis 1a and the
previous research of Dye et al. (2009). Visual cues/demands in video games usually have 100%
validity (if some form of visual cue or indicator appears on screen, that means an important event
is occurring that should be attended to), so it may be the case that video game players of visually
demanding games place a lot of trust in the visual cues they observe, resulting in the RT
improvements observed here.
During sublexical PH reading, our group of high experience video game players had
faster reading RTs than our low experience video game players, supporting our hypothesis 2 and
previous research that has demonstrated that video game experience can improve phonetic
decoding ability (Bertoni et al., 2021; Franceschini et al., 2013; Franceschini et al., 2017; and
Franceschini & Bertoni, 2019), and extended their results to an ecologically valid paradigm of
realistic phonetic decoding using PH stimuli that participants know will correspond to a word in
their spoken vocabulary.
With our development of the visual-demand analysis technique to measure visual-spatial
demands in video games, we were able to determine peripheral graphic visual demands are
associated with this improvement in reading RTs during validly cued trials. These results suggest
that these visual demands are particularly important to the relationship between video games and
VIDEO GAME VISUAL DEMANDS, READING, AND ATTENTION 30
reading when attentional cueing is a factor, which aligns with the emphasis on peripheral
demands in the action video game definition provided by Green & Bavelier (2012). Additionally,
we observed that central graphic demands are associated with slower reaction times. The
combined observations of peripheral graphic demands speeding up reading RTs while central
graphic demands slow down reading RTs demonstrates an important double dissociation that
goes beyond our predictions in hypothesis 3. As predicted, we observed lexical reading of
exception words benefiting from peripheral demands, and these results extend to phonetic
decoding of PHs as well. We did not predict the detrimental effect of central graphic demands,
which is a novel and important finding to consider. These results could be explained by effects
of video games on oculomotor control (e.g., West et al., 2013). When a video game player
frequently experiences a high degree of peripheral visual demands, their oculomotor
performance may be improved, resulting in faster RTs during tasks that involve multiple
peripheral locations, such as the task used in this experiment. In contrast, if a video game
primarily involves fixating on the centre of the screen (as would be suggested by high central
visual demand scores), the player will not be required to do much shifting of the eyes, and their
oculomotor performance might not benefit. Further research will need to be conducted to clarify
the nature of this significant double dissociation between peripheral vs central graphic demands
and reading performance. It is also important to note that although often similar in sign, text
demands in video games did not show a significant double dissociation, which may point to key
differences in the information that text and graphic cues provide in video games. For example,
graphics may require an additional stage of cognitive analysis whereby the graphic is first
mapped onto a linguistic representation (e.g., blue dots could mean friendly allies, while red dots
mean enemies on a mini-map), which may serve to enhance these effects for graphics over text.
VIDEO GAME VISUAL DEMANDS, READING, AND ATTENTION 31
These results are informative for researchers studying models of basic reading and
attentional processes. Contrary to our expectations, peripheral visual demands were related to
both lexical (EWs) and sublexical (PHs) reading, rather than just to lexical reading. Although we
specifically hypothesized peripheral visual demands to be related to lexical reading, given the
overlap observed in previous neuroimaging studies (e.g., Ekstrand, Neudorf, Gould, et al., 2019;
Ekstrand, Neudorf, Kress, & Borowsky, 2019), our results suggest both lexical and sublexical
reading both benefit from peripheral graphic demands. Given the hybrid attention-reading
paradigm used here, it seems plausible that both reading streams may employ some shared
attentional processes, and video game experience facilitates these shared processes. It could be
the case that the early visual processing of letter units in a word is a relevant shared process, as
both lexical and sublexical reading involve letter identification (e.g., orthographic feature
encoding or orthographic analysis in dual route models of reading; see Coltheart et al., 2001 or
Owen & Borowsky, 2003). Models of both reading and attention will benefit from these visual-
spatial considerations which provides opportunities for further integration of reading and
attentional processing models beyond what we have discussed elsewhere (e.g., Ekstrand et al.,
2016; Ekstrand, Neudorf, Gould, et al., 2019; Ekstrand, Neudorf, Kress, & Borowsky, 2019).
The integration of reading and attention processes also has applications in the clinical field for
the development of dyslexia diagnostics and treatment. Both lexical and sublexical reading were
associated with peripheral graphic demands, which means videogame-style treatments that
exercise mostly peripheral graphic demands could broadly benefit individuals with multiple
forms of reading deficits.
3.1 Future Directions
With the visual-demand analysis technique introduced in this experiment, we hope future

VIDEO GAME VISUAL DEMANDS, READING, AND ATTENTION 32
studies will consider this technique as an option to objectively evaluate the visual demands of
video games, rather than being limited by the binary action/non-action video game classification.
Given the presently observed relationship between peripheral demands and combined reading
and attentional processes, we find the peripheral demand measures in particular to more
effectively capture the relationships one would expect to see between video game experience and
reading/attention, with the added benefit that players of ambiguously classified genres (such as
driving games or real-time strategy games) will not have portions of their video game experience
excluded from consideration. Along with the application of this measure in cross-sectional
studies, experimental training studies can also benefit. The visual-spatial demand scores for each
reported video game in this study are included in Appendix C, and we invite researchers to refer
to this data when selecting video games for their training study to verify that the games are
sufficiently different in their visual-spatial demands.
Future behavioural studies could also expand the field further by including different
visual language processing tasks, for example lexical decision tasks, to help determine which
aspects of language processing are improved by video games (e.g., lexical decision tasks can be
more focused on lexical and semantic processing than naming tasks, Borowsky & Masson,
1996). Additionally, the double dissociation between peripheral and central demands should be
investigated further, such as by experimentally manipulating exposure to peripheral and central
stimuli in cueing tasks with high validity (similar to the high cue validity present in video
games). We are currently developing such a paradigm to further investigate the extent of these
effects during short term exposure.
Future research could investigate the potential for educational video games to be
developed to help children practice their reading skills. Franceschini et al. (2017) have shown

VIDEO GAME VISUAL DEMANDS, READING, AND ATTENTION 33
training with commercial video games improves reading ability in children with dyslexia and
Pasqualotto et al. (2022) demonstrated the use of the cognitive video game “Skies of Manawak”
as a tool to improve reading skills in school-aged children with normal reading ability. The
present study has demonstrated that video game experience is related to reading ability in adults
as well, so an educational video game to train reading skills could benefit all ages. As mentioned
earlier, such a video game may want to emphasize peripheral graphic visual-spatial demands, as
we observed this characteristic to be related to beneficial reading and attentional processes.
The current studies were behavioural in nature. It will be important for future studies to
examine the relationship between video games, reading, and attention through neuroimaging
techniques, such as with functional magnetic resonance imaging. Of substantial interest will be
occipital-parietal regions, especially the angular gyrus and neighbouring temporal-parietal
junction, which have already been associated with video games, reading, and attention
(temporal-parietal junction and reading/attention: Ekstrand, Neudorf, Gould, et al., 2019;
Ekstrand, Neudorf, Kress, & Borowsky, 2019; angular gyrus and video games: Kowalczyk et al.,
2018). The middle occipital gyrus may also be a region of interest, as it has been found to be a
region of interaction between reading and attentional processes (e.g., Ekstrand, Neudorf, Kress,
& Borowsky, 2019) and may be a key region for early visual processing before the dorsal and
ventral streams of the brain diverge (e.g., Laycock et al., 2009). Finding ways for participants to
play video games during neuroimaging will also be an important consideration, as this will allow
researchers to identify which regions are most active during video game play, rather than being
limited to inferences from pre/post-training data.
3.2 Conclusion
These studies demonstrate support for the relationships between video games, reading,
VIDEO GAME VISUAL DEMANDS, READING, AND ATTENTION 34
and attentional processes. Our visual-demand analysis provides an individually-relevant measure
with which future studies can assess visual demands in video games of interest, and suggests that
there are benefits to both lexical and sublexical reading performance with increases in video
game peripheral graphic demands, and detriments to lexical and sublexical reading performance
with increases in central graphic demands. With the novel techniques and results presented here,
this research will help inform models of reading and attention, as well as game developers in
their game design to create games or game mechanics that promote reading ability, which would
provide immense benefits to individuals with reading deficits such as surface or phonological
dyslexia.
VIDEO GAME VISUAL DEMANDS, READING, AND ATTENTION 35
References
Antzaka, A., Lallier, M., Meyer, S., Diard, J., Carreiras, M., & Valdois, S. (2017). Enhancing
reading performance through action video games: The role of visual attention span.
Scientific Reports, 7(1), 14563. https://doi.org/10.1038/s41598-017-15119-9
Basak, C., Boot, W.R., Voss, M.W., & Kramer, A.F. (2008). Can training in a real-time strategy
video game attenuate cognitive decline in older adults? Psychology and Aging, 23(4),
765-777. https://doi.org/10.1037/a0013494
Bavelier, D., & Green, C.S. (2019). Enhancing attentional control: Lessons from action video
games. Neuron, 104. https://doi.org/10.1016/j.neuron.2019.09.031
Benady-Chorney, J., Aumont, É., Yau, Y., Zeighami, Y., Bohbot, V. D., & West, G. L. (2020).
Action video game experience is associated with increased resting state functional
connectivity in the caudate nucleus and decreased functional connectivity in the
hippocampus. Computers in Human Behavior, 106, 106200.
https://doi.org/10.1016/j.chb.2019.106200
Bertoni, S., Franceschini, S., Puccio, G., Mancarella, M., Gori, S., & Facoetti, A. (2021). Action
Video Games Enhance Attentional Control and Phonological Decoding in Children with
Developmental Dyslexia. Brain Sciences, 11(2), 171.
https://doi.org/10.3390/brainsci11020171
Boden, C., & Giaschi, D. (2007). M-stream deficits and reading-related visual processes in
developmental dyslexia. Psychological Bulletin, 133(2), 346–366.
https://doi.org/10.1037/0033-2909.133.2.346
Borowsky, R., Cummine, J., Owen, W. J., Friesen, C. K., Shih, F., & Sarty, G. E. (2006). FMRI
of Ventral and Dorsal Processing Streams in Basic Reading Processes: Insular Sensitivity

VIDEO GAME VISUAL DEMANDS, READING, AND ATTENTION 36
to Phonology. Brain Topography, 18(4), 233–239. https://doi.org/10.1007/s10548-006-
0001-2
Borowsky, R., Esopenko, C., Cummine, J., & Sarty, G. E. (2007). Neural Representations of
Visual Words and Objects: A Functional MRI Study on the Modularity of Reading and
Object Processing. Brain Topography, 20(2), 89–96. https://doi.org/10.1007/s10548-007-
0034-1
Borowsky, R., Loehr, J., Friesen, C. K., Kraushaar, G., Kingstone, A., & Sarty, G. (2005).
Modularity and intersection of “what”, “where” and “how” processing of visual stimuli:
A new method of fMRI localization. Brain Topography, 18(2), 67–75.
https://doi.org/10.1007/s10548-005-0276-8
Castles, A., & Coltheart, M. (1993). Varieties of developmental dyslexia. Cognition, 47(2), 149–
180. https://doi.org/10.1016/0010-0277(93)90003-E
Chica, A. B., Martín-Arévalo, E., Botta, F., & Lupiáñez, J. (2014). The Spatial Orienting
paradigm: How to design and interpret spatial attention experiments. Neuroscience &
Biobehavioral Reviews, 40, 35–51. https://doi.org/10.1016/j.neubiorev.2014.01.002
Coltheart, M., Rastle, K., Perry, C., Langdon, R., & Ziegler, J. (2001). DRC: A Dual Route
Cascaded Model of Visual Word Recognition and Reading Aloud. Psychological Review,
108(1), 204–256. https://doi.org/10.1037/0033-295X.108.1.204
Cummine, J., Dai, W., Borowsky, R., Gould, L., Rollans, C., & Boliek, C. (2015). Investigating
the ventral-lexical, dorsal-sublexical model of basic reading processes using diffusion
tensor imaging. Brain Structure and Function, 220(1), 445–455.
https://doi.org/10.1007/s00429-013-0666-8

VIDEO GAME VISUAL DEMANDS, READING, AND ATTENTION 37
Cummine, J., Gould, L., Zhou, C., Hrybouski, S., Siddiqi, Z., Chouinard, B., & Borowsky, R.
(2013). Manipulating instructions strategically affects reliance on the ventral-lexical
reading stream: Converging evidence from neuroimaging and reaction time. Brain and
Language, 125(2), 203–214. https://doi.org/10.1016/j.bandl.2012.04.009
Dębska, A., Chyl, K., Dzięgiel, G., Kacprzak, A., Łuniewska, M., Plewko, J., Marchewka, A.,
Grabowska, A., & Jednoróg, K. (2019). Reading and spelling skills are differentially
related to phonological processing: Behavioral and fMRI study. Developmental Cognitive
Neuroscience, 39, 100683. https://doi.org/10.1016/j.dcn.2019.100683
Dobrowolski, P., Hanusz, K., Sobczyk, B., Skorko, M., & Wiatrow, A. (2015). Cognitive
enhancement in video game players: The role of video game genre. Computers in Human
Behavior, 44, 59–63. https://doi.org/10.1016/j.chb.2014.11.051
Dye, M. W. G., & Bavelier, D. (2010). Differential development of visual attention skills in
school-age children. Vision Research, 50(4), 452–459.
https://doi.org/10.1016/j.visres.2009.10.010
Dye, M.W.G., Green, C.S., & Bavelier, D. (2009). The development of attention skills in action
video game players. Neuropsychologia, 47, 1780-1789.
https://doi.org/10.1016/j.neuropsychologia.2009.02.002
Ekstrand, C., Gould, L., Mickleborough, M., Lorentz, E., & Borowsky, R. (2016). When words
and space collide: Spatial attention interacts with lexical access during word recognition.
Visual Cognition, 24(3), 284-291. https://doi.org/10.1080/13506285.2016.1236867
Ekstrand, C., Neudorf, J., Gould, L., Mickleborough, M., Borowsky, R. (2019). Where words
and space collide: The overlapping neural activation of lexical and sublexical reading

VIDEO GAME VISUAL DEMANDS, READING, AND ATTENTION 38
with voluntary and reflexive spatial attention. Brain Research.
https://doi.org/10.1016/j.brainres.2018.10.022
Ekstrand, C., Neudorf, J., Kress, S., & Borowsky, R. (2019). How words and space collide:
Lexical and sublexical reading are reliant on separable reflexive and voluntary attention
regions in hybrid tasks. Cortex, 121, 104–116.
https://doi.org/10.1016/j.cortex.2019.08.006
Ekstrand, C., Neudorf, J., Kress, S., & Borowsky, R. (2020). Structural connectivity predicts
functional activation during lexical and sublexical reading. NeuroImage, 218, 117008.
https://doi.org/10.1016/j.neuroimage.2020.117008
Entertainment Software Association. (2019). 2019 Essential Facts about the Computer and
Video Game Industry. Last accessed June 3, 2021 from https://www.theesa.com/wp-
content/uploads/2019/05/ESA_Essential_facts_2019_final.pdf
Entertainment Software Association of Canada. (2020). Real Canadian Gamer Essential Facts
2020. Last accessed June 6, 2021 from https://essentialfacts2020.ca/wp-
content/uploads/2020/11/RCGEF_en.pdf
Europe’s Video Games Industry, & European Games Developer Federation. (2021). Key Facts
2020: The year we played together. Last accessed October 26, 2021 from
https://www.isfe.eu/wp-content/uploads/2021/10/2021-ISFE-EGDF-Key-Facts-
European-video-games-sector-FINAL.pdf
Franceschini, S., & Bertoni, S. (2019). Improving action video games abilities increases the
phonological decoding speed and phonological short-term memory in children with
developmental dyslexia. Neuropsychologia, 130, 100-106.
https://doi.org/10.1016/j.neuropsychologia.2018.10.023
VIDEO GAME VISUAL DEMANDS, READING, AND ATTENTION 39
Franceschini, S., Bertoni, S., & Facoetti, A. (2021). Manual dexterity predicts phonological
decoding speed in typical reading adults. Psychological Research, 85.
https://doi.org/10.1007/s00426-020-01464-4
Franceschini, S., Bertoni, S., Ronconi, L., Molteni, M., Gori, S., & Facoetti, A. (2015). “Shall
We Play a Game?”: Improving Reading Through Action Video Games in Developmental
Dyslexia. Current Developmental Disorders Reports, 2, 318-329.
https://doi.org/10.1007/s40474-015-0064-4
Franceschini, S., Gori, S., Ruffino, M., Viola, S., Molteni, M., & Facoetti, A. (2013). Action
Video Games Make Dyslexic Children Read Better. Current Biology, 23(6), 462–466.
https://doi.org/10.1016/j.cub.2013.01.044
Franceschini, S., Trevisan, P., Ronconi, L., Bertoni, S., Colmar, S., Double, K., Facoetti, A., &
Gori, S. (2017). Action video games improve reading abilities and visual-to-auditory
attentional shifting in English-speaking children with dyslexia. Scientific Reports, 7(1),
5863. https://doi.org/10.1038/s41598-017-05826-8
Facoetti, A., Paganoni, P., Turatto, M., Marzola, V., & Mascetti, G. (2000). Visual-Spatial
Attention in Developmental Dyslexia. Cortex, 36(1), 109–123.
https://doi.org/10.1016/S0010-9452(08)70840-2
Facoetti, A., Ruffino, M., Peru, A., Paganoni, P., & Chelazzi, L. (2008). Sluggish engagement
and disengagement of non-spatial attention in dyslexic children. Cortex, 44(9), 1221–
1233. https://doi.org/10.1016/j.cortex.2007.10.007
Gori, S., Cecchini, P., Bigoni, A., Molteni, M., & Facoetti, A. (2014). Magnocellular-dorsal
pathway and sub-lexical route in developmental dyslexia. Frontiers in Human
Neuroscience, 8. https://doi.org/10.3389/fnhum.2014.00460

VIDEO GAME VISUAL DEMANDS, READING, AND ATTENTION 40
Gori, S., Seitz, A. R., Ronconi, L., Franceschini, S., & Facoetti, A. (2016). Multiple Causal
Links Between Magnocellular–Dorsal Pathway Deficit and Developmental Dyslexia.
Cerebral Cortex, 26(11), 4356–4369. https://doi.org/10.1093/cercor/bhv206
Green, C.S., & Bavelier, D. (2003). Action video game modifies visual selective attention.
Nature, 423, 534-537. https://doi.org/10.1038/nature01647
Green, C.S., & Bavelier, D. (2012). Learning, attentional control, and action video games.
Current Biology, 22, 197-206. https://doi.org/10.1016/j.cub.2012.02.012
Green, C. S., Kattner, F., Eichenbaum, A., Bediou, B., Adams, D. M., Mayer, R. E., & Bavelier,
D. (2017). Playing Some Video Games but Not Others Is Related to Cognitive Abilities:
A Critique of Unsworth et al. (2015). Psychological Science, 28(5), 679–682.
https://doi.org/10.1177/0956797616644837
Gutwin, C., Cockburn, A., & Coveney, A. (2017). Peripheral popout: The influence of visual
angle and stimulus intensity on popout effects. Proceedings of the 2017 CHI Conference
on Human Factors in Computing Systems, 208–219.
https://doi.org/10.1145/3025453.3025984
Hubert‐Wallander, B., Green, C. S., & Bavelier, D. (2011). Stretching the limits of visual
attention: The case of action video games. WIREs Cognitive Science, 2(2), 222–230.
https://doi.org/10.1002/wcs.116
Hutton, J. S., Dudley, J., Horowitz-Kraus, T., DeWitt, T., & Holland, S. K. (2020). Associations
Between Screen-Based Media Use and Brain White Matter Integrity in Preschool-Aged
Children. JAMA Pediatrics, 174(1), e193869.
https://doi.org/10.1001/jamapediatrics.2019.3869
VIDEO GAME VISUAL DEMANDS, READING, AND ATTENTION 41
Irons, J. L., Remington, R. W., & Mclean, J. P. (2011). Not so fast: Rethinking the effects of
action video games on attentional capacity. Australian Journal of Psychology, 63(4),
224–231. https://doi.org/10.1111/j.1742-9536.2011.00001.x
Kowalczyk, N., Shi, F., Magnuski, M., Skorko, M., Dobrowolski, P., Kossowski, B.,
Marchewka, A., Bielecki, M., Kossut, M., & Brzezicka, A. (2018). Real-time strategy
video game experience and structural connectivity – A diffusion tensor imaging study.
Human Brain Mapping, 39, 3742-3758. https://doi.org/10.1002/hbm.24208
Laycock, R., Crewther, D. P., Fitzgerald, P. B., & Crewther, S. G. (2009). TMS disruption of
V5/MT+ indicates a role for the dorsal stream in word recognition. Experimental Brain
Research, 197(1), 69–79. https://doi.org/10.1007/s00221-009-1894-2
Li, R. W., Ngo, C. V., & Levi, D. M. (2015). Relieving the Attentional Blink in the Amblyopic
Brain with Video Games. Scientific Reports, 5(1), 8483.
https://doi.org/10.1038/srep08483
Masson, M. E. J., & Loftus, G. R. (2003). Using confidence intervals for graphically based data
interpretation. Canadian Journal of Experimental Psychology/Revue Canadienne de
Psychologie Expérimentale, 57(3), 203–220. https://doi.org/10.1037/h0087426
McDougall, P., Borowsky, R., MacKinnon, G. E., & Hymel, S. (2005). Process dissociation of
sight vocabulary and phonetic decoding in reading: A new perspective on surface and
phonological dyslexias. Brain and Language, 92(2), 185–203.
https://doi.org/10.1016/j.bandl.2004.06.003
Mickleborough, M. J. S., Kelly, M. E., Gould, L., Ekstrand, C., Lorentz, E., Ellchuk, T., Babyn,
P., & Borowsky, R. (2015). Inclusion of Attentional Networks in the Pre-Surgical
Neuroimaging Assessment of a Large Deep Hemispheric Cavernous Malformation: An
VIDEO GAME VISUAL DEMANDS, READING, AND ATTENTION 42
fMRI Case Report. Cerebrovascular Diseases, 39(3–4), 202–208.
https://doi.org/10.1159/000376612
Neudorf, J., Ekstrand, C., Kress, S., & Borowsky, R. (2019). FMRI of shared-stream priming of
lexical identification by object semantics along the ventral visual processing stream.
Neuropsychologia, 133, 107185. https://doi.org/10.1016/j.neuropsychologia.2019.107185
Owen, W. J., & Borowsky, R. (2003). Examining the Interactivity of Lexical Orthographic and
Phonological Processing. Canadian Journal of Experimental Psychology, 57(4), 290–
303. https://doi.org/10.1037/h0087432
Pasqualotto, A., Altarelli, I., De Angeli, A., Menestrina, Z., Bavelier, D., & Venuti, P. (2022).
Enhancing reading skills through a video game mixing action mechanics and cognitive
training. Nature Human Behaviour. https://doi.org/10.1038/s41562-021-01254-x
Pugh, K. R., Mencl, W. E., Jenner, A. R., Katz, L., Frost, S. J., Lee, J. R., Shaywitz, S. E., &
Shaywitz, B. A. (2000). Functional Neuroimaging Studies of Reading and Reading
Disability (Developmental Dyslexia). Mental Retardation and Developmental
Disabilities Research Reviews, 6, 207–213. https://doi.org/10.1002/1098-
2779(2000)6:3<207::AID-MRDD8>3.0.CO;2-P
Sandak, R., Mencl, W. E., Frost, S. J., & Pugh, K. R. (2004). The Neurobiological Basis of
Skilled and Impaired Reading: Recent Findings and New Directions. Scientific Studies of
Reading, 8(3), 273–292. https://doi.org/10.1207/s1532799xssr0803_6
Saygin, Z. M., Norton, E. S., Osher, D. E., Beach, S. D., Cyr, A. B., Ozernov-Palchik, O.,
Yendiki, A., Fischl, B., Gaab, N., & Gabrieli, J. D. E. (2013). Tracking the Roots of
Reading Ability: White Matter Volume and Integrity Correlate with Phonological
Awareness in Prereading and Early-Reading Kindergarten Children. Journal of

VIDEO GAME VISUAL DEMANDS, READING, AND ATTENTION 43
Neuroscience, 33(33), 13251–13258. https://doi.org/10.1523/JNEUROSCI.4383-12.2013
Shaywitz, S. E., Shaywitz, B. A., Pugh, K. R., Fulbright, R. K., Constable, R. T., Mencl, W. E.,
Shankweiler, D. P., Liberman, A. M., Skudlarski, P., Fletcher, J. M., Katz, L., Marchione,
K. E., Lacadie, C., Gatenby, C., & Gore, J. C. (1998). Functional disruption in the
organization of the brain for reading in dyslexia. Proceedings of the National Academy of
Sciences, 95(5), 2636–2641. https://doi.org/10.1073/pnas.95.5.2636
Strasburger, H., Rentschler, I., & Juttner, M. (2011). Peripheral vision and pattern recognition: A
review. Journal of Vision, 11(5), 13–13. https://doi.org/10.1073/pnas.95.5.2636
Stein, J., & Walsh, V. (1997). To see but not to read; the magnocellular theory of dyslexia.
Trends in Neurosciences, 20(4), 147–152. https://doi.org/10.1016/S0166-2236(96)01005-
3
Unsworth, N., Redick, T. S., McMillan, B. D., Hambrick, D. Z., Kane, M. J., & Engle, R. W.
(2015). Is Playing Video Games Related to Cognitive Abilities? Psychological Science,
26(6), 759–774. https://doi.org/10.1177/0956797615570367
Visser, T. A. W., Boden, C., & Giaschi, D. E. (2004). Children with dyslexia: Evidence for
visual attention deficits in perception of rapid sequences of objects. Vision Research,
44(21), 2521–2535. https://doi.org/10.1016/j.visres.2004.05.010
West, G. L., Al-Aidroos, N., & Pratt, J. (2013). Action video game experience affects
oculomotor performance. Acta Psychologica, 142(1), 38–42.
https://doi.org/10.1016/j.actpsy.2011.08.005
West, G. L., Konishi, K., Diarra, M., Benady-Chorney, J., Drisdelle, B. L., Dahmani, L.,
Sodums, D. J., Lepore, F., Jolicoeur, P., & Bohbot, V. D. (2018). Impact of video games
VIDEO GAME VISUAL DEMANDS, READING, AND ATTENTION 44
on plasticity of the hippocampus. Molecular Psychiatry, 23(7), 1566–1574.
https://doi.org/10.1038/mp.2017.155
West, G.L., Stevens, S.A., Pun, C., & Pratt, J. (2008). Visuospatial experience modulates
attentional capture: Evidence from action video game players. Journal of Vision, 8(16).
https://doi.org/10.1167/8.16.13
West, G. L., Zendel, B. R., Konishi, K., Benady-Chorney, J., Bohbot, V. D., Peretz, I., &
Belleville, S. (2017). Playing Super Mario 64 increases hippocampal grey matter in older
adults. PLOS ONE, 12(12), Article e0187779.
https://doi.org/10.1371/journal.pone.0187779
Wilms, I. L., Petersen, A., & Vangkilde, S. (2013). Intensive video gaming improves encoding
speed to visual short-term memory in young male adults. Acta Psychologica, 142(1),
108–118. https://doi.org/10.1016/j.actpsy.2012.11.003
Wu, S., & Spence, I. (2013). Playing shooter and driving videogames improves top-down
guidance in visual search. Attention, Perception, & Psychophysics, 75(4), 673–686.
https://doi.org/10.3758/s13414-013-0440-2
Ziegler, J. C., Perry, C., & Zorzi, M. (2020). Learning to Read and Dyslexia: From Theory to
Intervention Through Personalized Computational Models. Current Directions in
Psychological Science, 29(3), 293–300. https://doi.org/10.1177/0963721420915873
VIDEO GAME VISUAL DEMANDS, READING, AND ATTENTION 45
Appendix A
Exception Word Pseudohomophone
bear bair
blood bludd
break braik
broad brawd
comb coam
foot fuht
front frunt
gauge gaige
glove gluv
great grait
heart hawrt
monk munk
month munth
mould mohld
mourn mohrn
ninth nynth
pear payr
pint pynt
pour pohr
roll rohl
seize seeze
shoe shue
soot suht
soul soal
soup soop
sponge spunge
steak staik
ton tun
tour toor
wear wair
wood wuhd
world werld
0
VIDEO GAME VISUAL DEMANDS, READING, AND ATTENTION 46
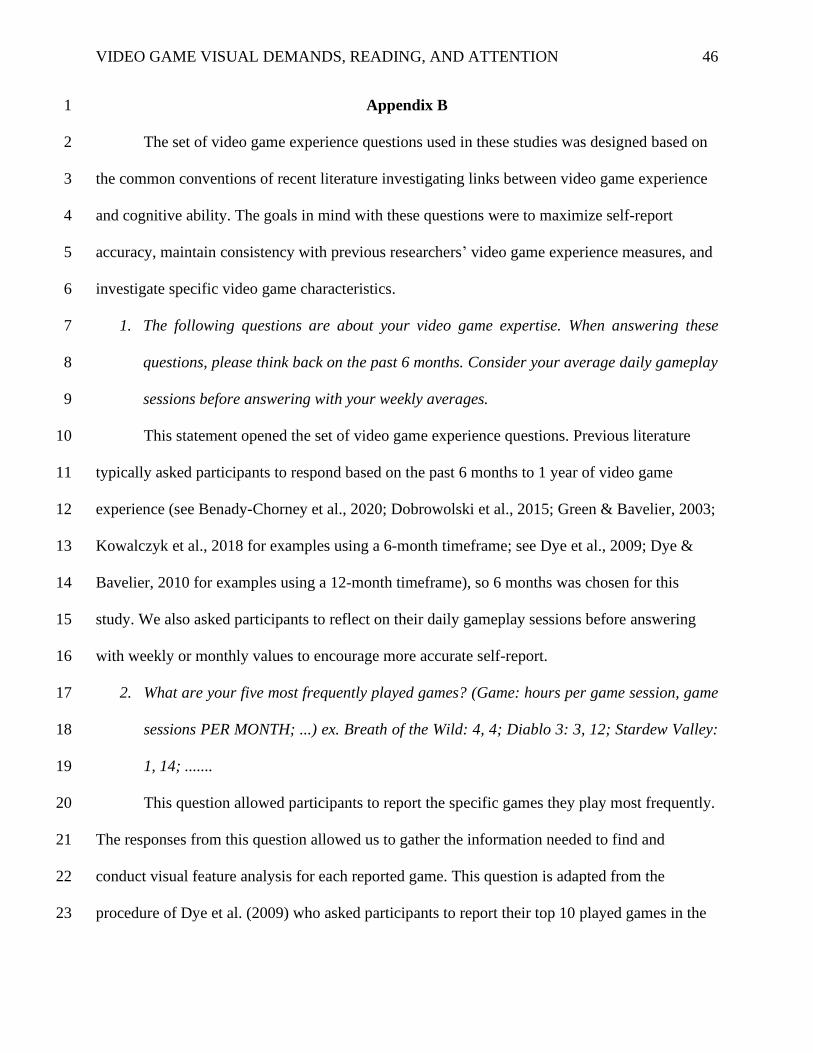
Appendix B 1
The set of video game experience questions used in these studies was designed based on 2
the common conventions of recent literature investigating links between video game experience 3
and cognitive ability. The goals in mind with these questions were to maximize self-report 4
accuracy, maintain consistency with previous researchers’ video game experience measures, and 5
investigate specific video game characteristics. 6
1. The following questions are about your video game expertise. When answering these 7
questions, please think back on the past 6 months. Consider your average daily gameplay 8
sessions before answering with your weekly averages. 9
This statement opened the set of video game experience questions. Previous literature 10
typically asked participants to respond based on the past 6 months to 1 year of video game 11
experience (see Benady-Chorney et al., 2020; Dobrowolski et al., 2015; Green & Bavelier, 2003; 12
Kowalczyk et al., 2018 for examples using a 6-month timeframe; see Dye et al., 2009; Dye & 13
Bavelier, 2010 for examples using a 12-month timeframe), so 6 months was chosen for this 14
study. We also asked participants to reflect on their daily gameplay sessions before answering 15
with weekly or monthly values to encourage more accurate self-report. 16
2. What are your five most frequently played games? (Game: hours per game session, game 17
sessions PER MONTH; ...) ex. Breath of the Wild: 4, 4; Diablo 3: 3, 12; Stardew Valley: 18
1, 14; ....... 19
This question allowed participants to report the specific games they play most frequently. 20
The responses from this question allowed us to gather the information needed to find and 21
conduct visual feature analysis for each reported game. This question is adapted from the 22
procedure of Dye et al. (2009) who asked participants to report their top 10 played games in the 23
VIDEO GAME VISUAL DEMANDS, READING, AND ATTENTION 47
past 12 months, along with length of a typical session and sessions played per month. 24
3. How many hours PER WEEK do you play video games on average? (this includes your top 25
games as well as other games) 26
By preceding this question with the top five games report (Question 2), we hoped to 27
encourage accurate self-report of weekly average game hours. 28
4. This question is about ACTION GAMES 29
Of the [VideoGameHours.RESP] hours spent playing games in general, how many hours 30
are spent playing ACTION video games? (these are games involving high speed, quick 31
actions, and divided attention: for example first person shooters or real time strategy) 32
This question is based on the common definition of action video games found in the 33
literature (see introduction for a description of this definition from Green & Bavelier, 2012). 34
Based on this definition, first- and third-person shooter games are considered action video 35
games. Some real-time strategy games have been considered action video games (e.g. 36
Kowalczyk et al., 2018), however this is inconsistent (e.g., Dye et al., 2009). Fighting games, 37
racing games, and sports games have been considered non-action based on this definition (e.g., 38
Dye et al., 2009), so the researcher clarified that time spent playing those genres of games should 39
not be included in this category but this has also been inconsistent (e.g. Wu & Spence, 2013). 40
41
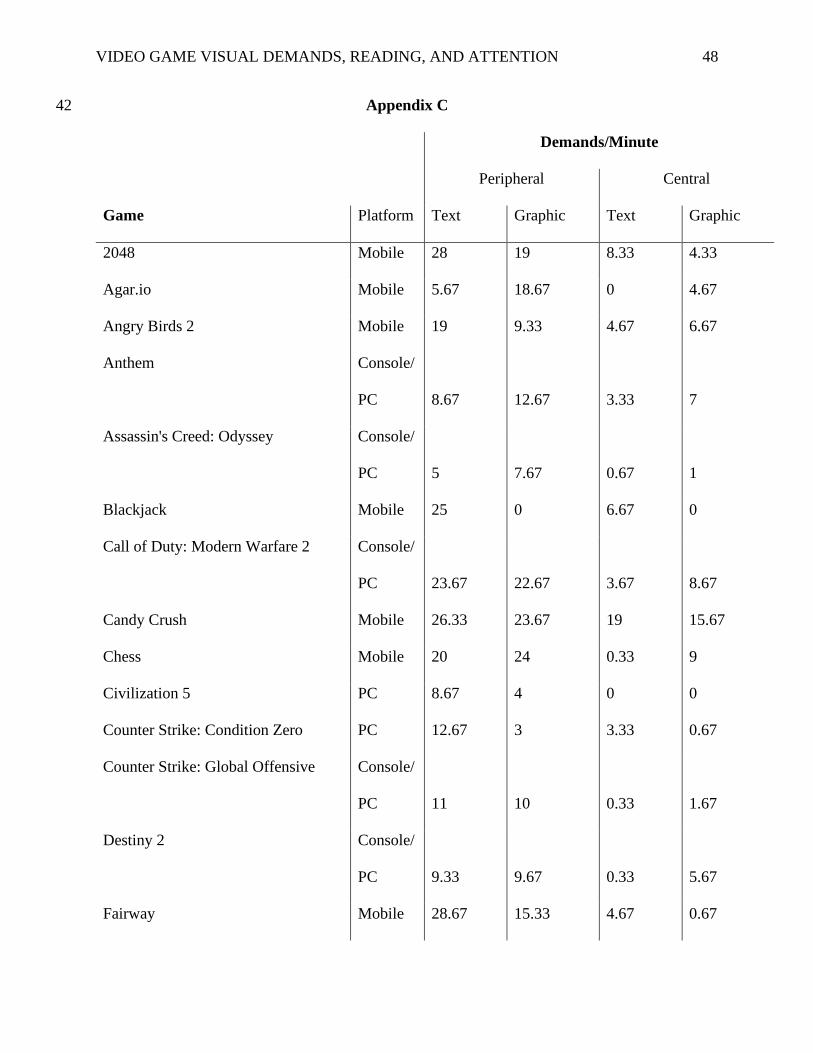
VIDEO GAME VISUAL DEMANDS, READING, AND ATTENTION 48
Appendix C 42
Demands/Minute
Peripheral Central
Game Platform Text Graphic Text Graphic
2048 Mobile 28 19 8.33 4.33
Agar.io Mobile 5.67 18.67 0 4.67
Angry Birds 2 Mobile 19 9.33 4.67 6.67
Anthem Console/
PC 8.67 12.67 3.33 7
Assassin's Creed: Odyssey Console/
PC 5 7.67 0.67 1
Blackjack Mobile 25 0 6.67 0
Call of Duty: Modern Warfare 2 Console/
PC 23.67 22.67 3.67 8.67
Candy Crush Mobile 26.33 23.67 19 15.67
Chess Mobile 20 24 0.33 9
Civilization 5 PC 8.67 4 0 0
Counter Strike: Condition Zero PC 12.67 3 3.33 0.67
Counter Strike: Global Offensive Console/
PC 11 10 0.33 1.67
Destiny 2 Console/
PC 9.33 9.67 0.33 5.67
Fairway Mobile 28.67 15.33 4.67 0.67
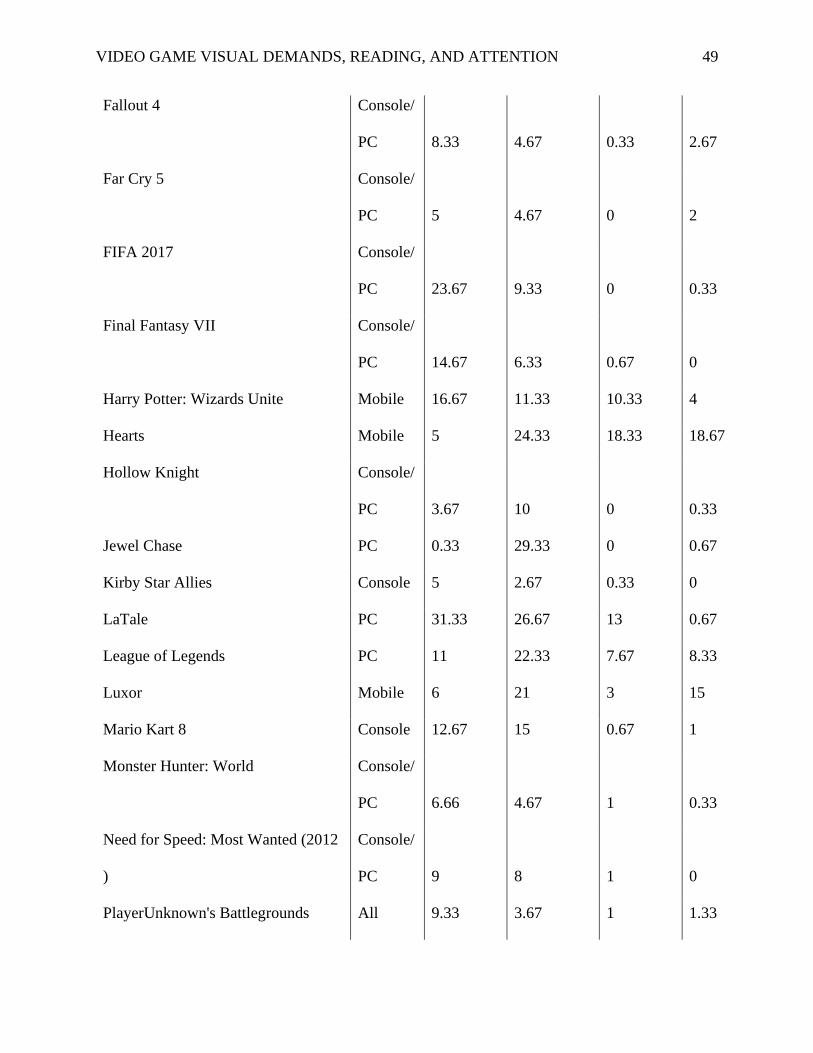
VIDEO GAME VISUAL DEMANDS, READING, AND ATTENTION 49
Fallout 4 Console/
PC 8.33 4.67 0.33 2.67
Far Cry 5 Console/
PC 5 4.67 0 2
FIFA 2017 Console/
PC 23.67 9.33 0 0.33
Final Fantasy VII Console/
PC 14.67 6.33 0.67 0
Harry Potter: Wizards Unite Mobile 16.67 11.33 10.33 4
Hearts Mobile 5 24.33 18.33 18.67
Hollow Knight Console/
PC 3.67 10 0 0.33
Jewel Chase PC 0.33 29.33 0 0.67
Kirby Star Allies Console 5 2.67 0.33 0
LaTale PC 31.33 26.67 13 0.67
League of Legends PC 11 22.33 7.67 8.33
Luxor Mobile 6 21 3 15
Mario Kart 8 Console 12.67 15 0.67 1
Monster Hunter: World Console/
PC 6.66 4.67 1 0.33
Need for Speed: Most Wanted (2012
)
Console/
PC 9 8 1 0
PlayerUnknown's Battlegrounds All 9.33 3.67 1 1.33
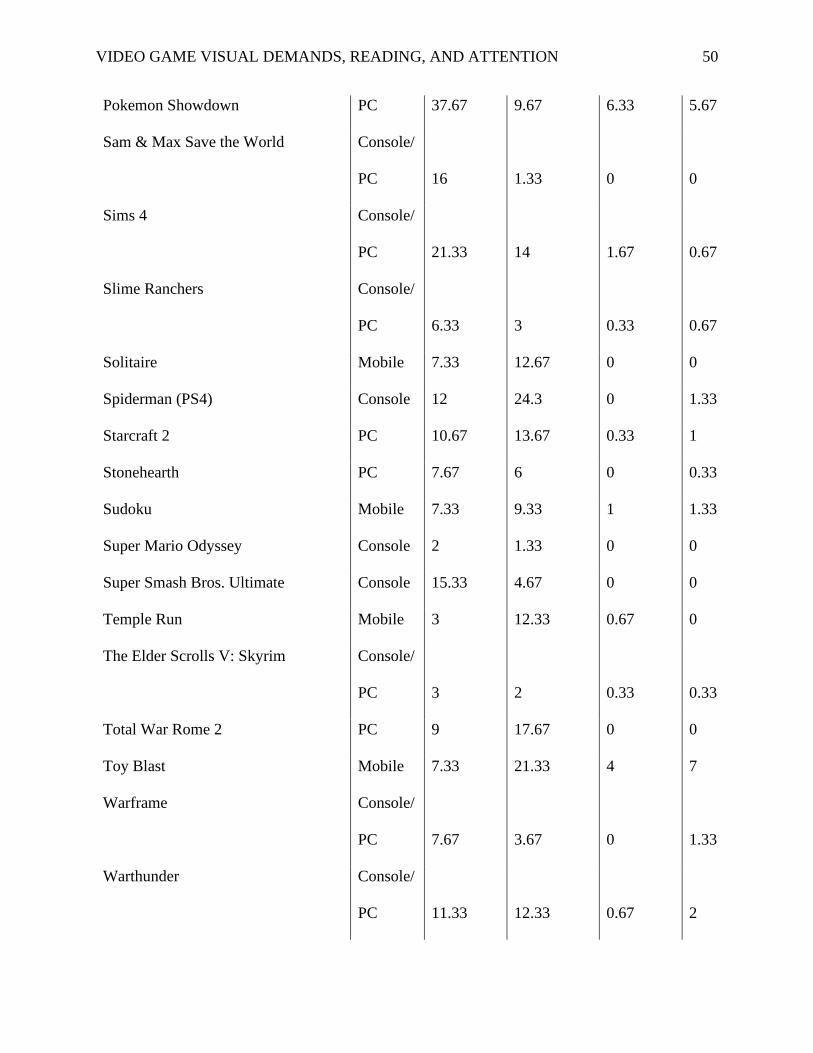
VIDEO GAME VISUAL DEMANDS, READING, AND ATTENTION 50
Pokemon Showdown PC 37.67 9.67 6.33 5.67
Sam & Max Save the World Console/
PC 16 1.33 0 0
Sims 4 Console/
PC 21.33 14 1.67 0.67
Slime Ranchers Console/
PC 6.33 3 0.33 0.67
Solitaire Mobile 7.33 12.67 0 0
Spiderman (PS4) Console 12 24.3 0 1.33
Starcraft 2 PC 10.67 13.67 0.33 1
Stonehearth PC 7.67 6 0 0.33
Sudoku Mobile 7.33 9.33 1 1.33
Super Mario Odyssey Console 2 1.33 0 0
Super Smash Bros. Ultimate Console 15.33 4.67 0 0
Temple Run Mobile 3 12.33 0.67 0
The Elder Scrolls V: Skyrim Console/
PC 3 2 0.33 0.33
Total War Rome 2 PC 9 17.67 0 0
Toy Blast Mobile 7.33 21.33 4 7
Warframe Console/
PC 7.67 3.67 0 1.33
Warthunder Console/
PC 11.33 12.33 0.67 2
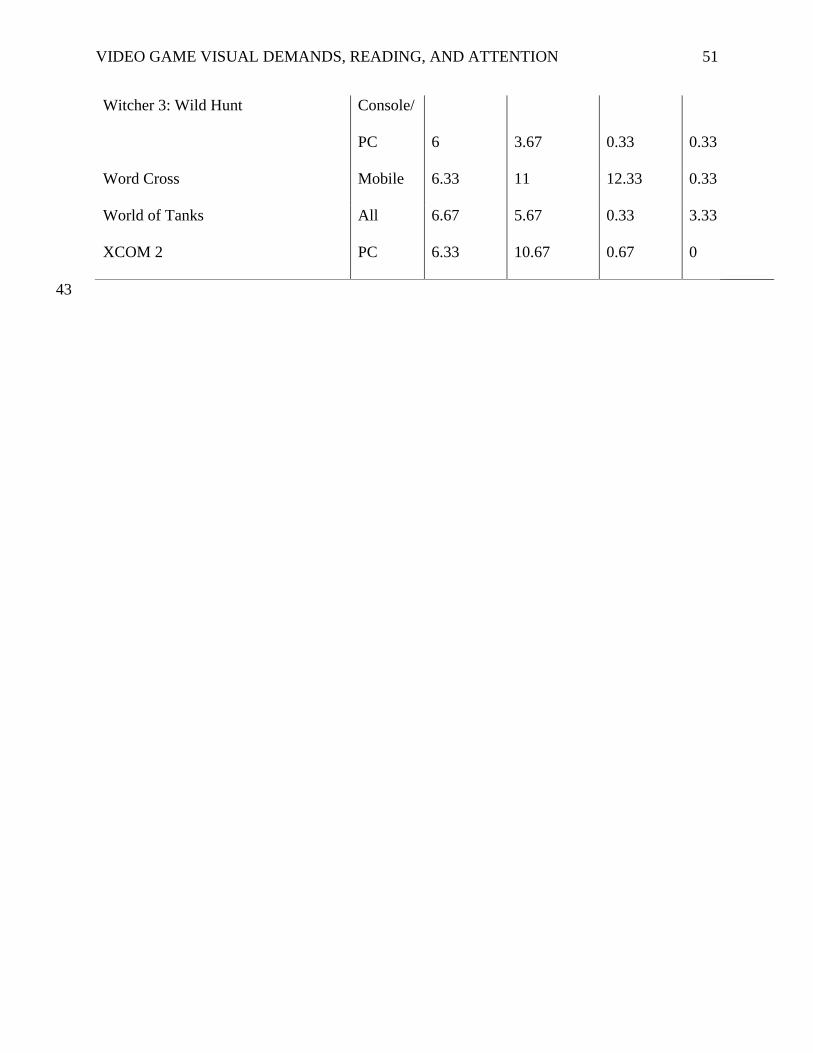
VIDEO GAME VISUAL DEMANDS, READING, AND ATTENTION 51
Witcher 3: Wild Hunt Console/
PC 6 3.67 0.33 0.33
Word Cross Mobile 6.33 11 12.33 0.33
World of Tanks All 6.67 5.67 0.33 3.33
XCOM 2 PC 6.33 10.67 0.67 0
43
Related Documents


