1 Visual representation of emotions in Virtual Reality Andres Pinilla 1,2 * , Jaime Garcia 2 , William Raffe 2 , Jan-Niklas Voigt-Antons 1, 3 , Sebastian Möller 1, 3 1 Quality and Usability Lab, Institute for Software Technology and Theoretical Computer Science, Faculty of Electrical Engineering and Computer Science, Technische Universität Berlin, Germany 2 UTS Games Studio, Faculty of Engineering and IT, University of Technology Sydney UTS, Sydney, Australia 3 German Research Center for Artificial Intelligence (DFKI), Berlin, Germany * Correspondence: Andres Pinilla [email protected] Keywords: virtual reality, emotions, emotional design, abstract design, visual metaphors, user-testing Abstract One of the challenges during the post-COVID pandemic era will be to foster social connections between people. Previous research suggests that people who is able to regulate their emotions tends to have better social connections with others. Additional studies indicate that it is possible to train the ability to regulate emotions voluntarily, using a procedure that involves three steps: (1) asking participants to evoke an autobiographical memory associated with a positive emotion; (2) analyze participants’ brain activity in real-time to estimate their emotional state; and (3) provide visual feedback about the emotions evoked with the autobiographical memory. However, there is not enough research on how to provide the visual feedback required for the third step. Therefore, this manuscript introduces five virtual environments that can be used to provide emotional visual feedback. Each virtual environment was designed based on evidence found in previous studies, suggesting that there are visual cues, such as colors, shapes and motion patterns, that tend to be associated with emotions. In each virtual environment, the visual cues changed, intending to represent five emotional categories. An experiment was conducted to analyze the emotions that participants associated with the virtual environments. The results indicate that each environment is associated with the emotional categories that they were meant to represent. 1 Introduction Is it possible to observe emotions? Previous experiments suggest that it is possible to create audiovisual representations of the users' mental states (De Boeck, 2009; Sobell & Trivich, 1990). This practice, known as brain-painting, has shown that it is possible to use Brain- Computer Interfaces (BCIs) to analyze users' brain activity in real-time, interpret that information as computer commands, and automatically generate audiovisual metaphors of mental states. However, it is not clear how to create visual metaphors of emotional states. We address this challenge by developing five Virtual Reality (VR) environments for emotion visualization. The design of these virtual environments is based on previous studies suggesting that visual cues,

Welcome message from author
This document is posted to help you gain knowledge. Please leave a comment to let me know what you think about it! Share it to your friends and learn new things together.
Transcript
1
Visual representation of emotions in Virtual Reality
Andres Pinilla1,2 *, Jaime Garcia2, William Raffe2, Jan-Niklas Voigt-Antons1, 3, Sebastian Möller1, 3
1 Quality and Usability Lab, Institute for Software Technology and Theoretical Computer Science, Faculty of Electrical Engineering and Computer Science, Technische Universität Berlin, Germany 2 UTS Games Studio, Faculty of Engineering and IT, University of Technology Sydney UTS, Sydney, Australia 3 German Research Center for Artificial Intelligence (DFKI), Berlin, Germany
* Correspondence: Andres Pinilla [email protected]
Keywords: virtual reality, emotions, emotional design, abstract design, visual metaphors, user-testing
Abstract One of the challenges during the post-COVID pandemic era will be to foster social connections between people. Previous research suggests that people who is able to regulate their emotions tends to have better social connections with others. Additional studies indicate that it is possible to train the ability to regulate emotions voluntarily, using a procedure that involves three steps: (1) asking participants to evoke an autobiographical memory associated with a positive emotion; (2) analyze participants’ brain activity in real-time to estimate their emotional state; and (3) provide visual feedback about the emotions evoked with the autobiographical memory. However, there is not enough research on how to provide the visual feedback required for the third step. Therefore, this manuscript introduces five virtual environments that can be used to provide emotional visual feedback. Each virtual environment was designed based on evidence found in previous studies, suggesting that there are visual cues, such as colors, shapes and motion patterns, that tend to be associated with emotions. In each virtual environment, the visual cues changed, intending to represent five emotional categories. An experiment was conducted to analyze the emotions that participants associated with the virtual environments. The results indicate that each environment is associated with the emotional categories that they were meant to represent.
1 Introduction
Is it possible to observe emotions? Previous experiments suggest that it is possible to create audiovisual representations of the users' mental states (De Boeck, 2009; Sobell & Trivich, 1990). This practice, known as brain-painting, has shown that it is possible to use Brain-Computer Interfaces (BCIs) to analyze users' brain activity in real-time, interpret that information as computer commands, and automatically generate audiovisual metaphors of mental states. However, it is not clear how to create visual metaphors of emotional states. We address this challenge by developing five Virtual Reality (VR) environments for emotion visualization. The design of these virtual environments is based on previous studies suggesting that visual cues,
2
such as colors (Gao et al., 2007; Valdez & Mehrabian, 1994), shapes (Feng et al., 2014; Lockyer et al., 2011; Piwek et al., 2015) and motion patterns (Aronoff, 2006; Bar & Neta, 2006) tend to be associated with particular emotions, regardless of individual differences between users. The environments were tested in an experiment where participants indicated the emotions that they associated with each environment. Results showed that the environments represent the emotions we expected them to represent. We aim to use this virtual environment in a biofeedback VR game for training emotion self-regulation. In this game, players will recall an autobiographical memory associated with positive emotions while their electrophysiological signals are analyzed in real-time. The analysis of the electrophysiological signals will allow to infer participant's emotional state. The visual stimuli in the virtual environment will change automatically to represent the user's emotions graphically. Previous evidence indicates that this procedure might increase the ability of users to self-regulate their emotions (Barreiros et al., 2019; Z. Li et al., 2016; Zotev et al., 2014), which in turn might help to foster social connections (English et al., 2012). The final aim is to create a tool that can help to rebuilt the social bonds that have been lost as a consequence of the social isolation measures that were taken to fight COVID-19.
The development of this game requires visual cues that represent similar emotional categories for any player. Otherwise, the visual cues will not accurately inform participants about the emotions they are evoking with their memories. In this regard, one of the main challenges is to create visual stimuli that any user would associate with similar emotions. Emotional experiences are subjective, hence it is likely that players will associate similar visual stimuli to different emotions. For example, a user who suffered a traumatic experience with fire might associate the shape of a bonfire with negative emotions, while other users might associate the same shape with positive emotions. Given that abstract figures are not directly associated with real-world contexts, they might help to reduce associations to personal experiences and avoid biases caused by individual differences between users. On that account, the virtual environment presented in this manuscript was developed using abstract figures.
Since VR is more immersive than other technologies (Perkis et al., 2020; Visch et al., 2010), it is more likely that users will engage with a VR game, as compared to a game based on traditional technologies that use 2D displays. Therefore, VR is an ideal technology to create a biofeedback therapy game for training emotion self-regulation.
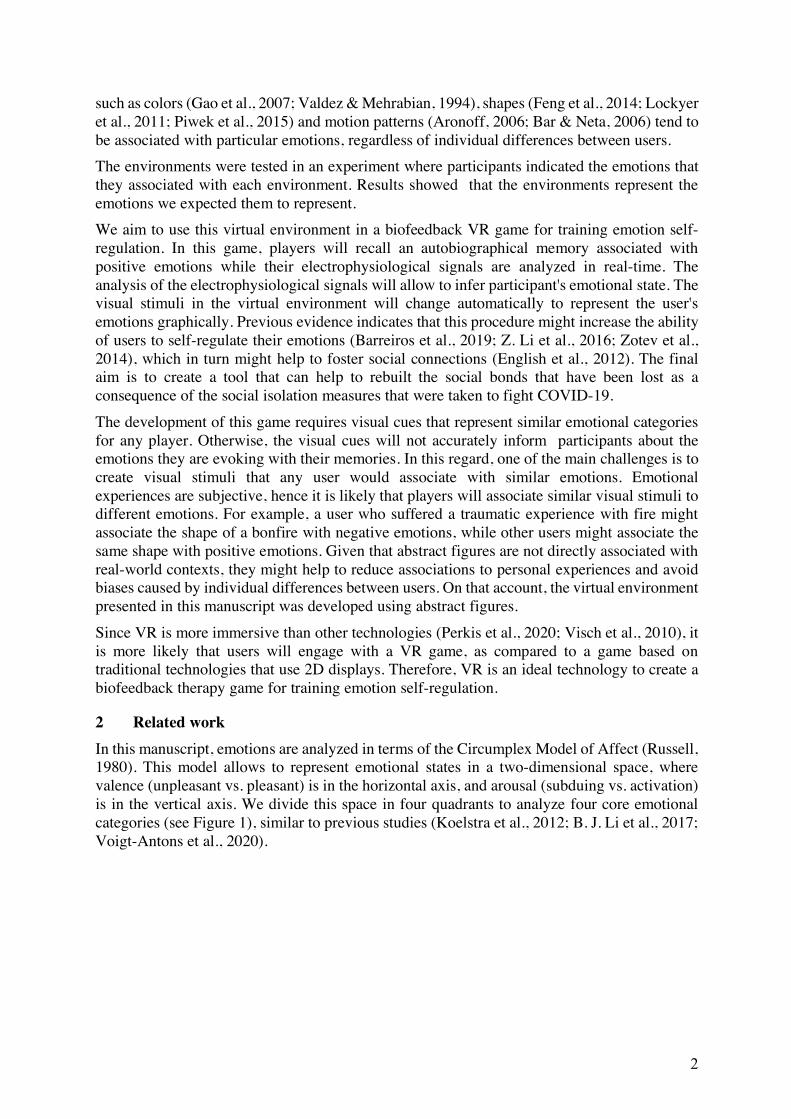
2 Related work In this manuscript, emotions are analyzed in terms of the Circumplex Model of Affect (Russell, 1980). This model allows to represent emotional states in a two-dimensional space, where valence (unpleasant vs. pleasant) is in the horizontal axis, and arousal (subduing vs. activation) is in the vertical axis. We divide this space in four quadrants to analyze four core emotional categories (see Figure 1), similar to previous studies (Koelstra et al., 2012; B. J. Li et al., 2017; Voigt-Antons et al., 2020).
3
Figure 1: The four quadrants of the Circumplex Model of Affect [16].
A cluster of evidence in psychology and graphics design suggests that it is possible to design visual compositions that represent similar emotions for different users. On the one hand, the studies in psychology support a user-independent mechanism for processing emotional stimuli. Ekman and Friesen (Ekman & Friesen, 1971) found evidence suggesting the existence of at least six basic facial expressions of emotion (happiness, sadness, boredom, disgust, fear, and anger) that are culture-independent. Further studies indicate that facial muscles are automatically activated when negative and positive emotional stimuli are observed (Dimberg, 1982; Dimberg et al., 2000). Additional evidence suggests that negative and positive emotions are processed in the right and left frontal cortex, respectively (Davidson, 1992; Huster et al., 2009; Pfurtscheller & Lopes da Silva, 1999). Taken together, these studies suggest the existence of a psychological mechanism related to perception of emotional stimuli that operate similarly in different users.
On the other hand, the previous studies in graphics design suggest the existence of visual cues that tend to be associated with particular emotions. It has been found that features such as shape, color, and visual complexity tend to be associated with emotional responses. Rounded objects tend to be associated with higher valence and lower arousal than sharp objects (Aronoff, 2006; Aronoff et al., 1992; Bar & Neta, 2006), rounded lines tend to be associated with higher valence than straight lines (Aronoff, 2006; Aronoff et al., 1992), and extremely complex objects tend to be more pleasant (higher valence) than objects with middle-level of visual complexity (Norman et al., 2010).
Colors have three main components: hue, brightness, and saturation. According to Valdez et al. (1994), bright colors tend to be associated with high valence and low arousal, while saturated colors tend to be more arousing than unsaturated colors. The hue of a color can be expressed in terms of its wavelength. Wavelengths above 585 (yellow-red and red) are more pleasant than wavelengths between 565 and 575 (green-yellow and yellow) but less pleasant than wavelengths between 475 and 525 (purple-blue, blue, blue-green, and green) (Valdez & Mehrabian, 1994). These results are consistent with findings reported by Gao et al. (2007), suggesting cross-cultural constants in color associations.
Motion patterns such as speed, motion shape, direction and path curvature tend to trigger emotional associations (Feng et al., 2014; Lockyer et al., 2011; Piwek et al., 2015). Fast movements, spherical motion shape, and jerky path curvature are associated with high arousal, while slow movements, linear motion shapes, and straight paths are associated with low arousal
4
(Feng et al., 2014; Piwek et al., 2015). Downwards-right movements tend to be associated with high valence, while upwards-left movements tend to be associated with low valence (Lockyer et al., 2011). Semertzidis et al. (2020) created Neo-Noumena, an Augmented Reality (AR) system for enhancing emotional communication between dyads. This system consists of a BCI that analyses the brain activity of the user in real-time. When two persons interact while using the device, they can see fractal figures in the AR display, representing the other person's emotions. The results reported by Semertzidis et al. (2020) suggest that it is possible to create visual representations of emotions in virtual environments.
Additional evidence suggests that it is possible to train emotion self-regulation through biofeedback therapy. In an experiment conducted by Li et al. (Z. Li et al., 2016), twenty-three participants were asked to evoke a memory associated with positive emotions, while their brain activity was analyzed in real-time using functional Magnetic Brain Imaging (fMRI). Participants received visual feedback about the emotions that they were evoking with their memories. The visual feedback consisted of a bar on a screen. An increase in the bar level indicated that participants were evoking more positive emotions.
We aim to implement the procedure proposed by Li et al. (2016) in a Virtual Reality game. Instead of providing feedback with a bar, we plan to use the virtual environments presented in this manuscript. This game could be beneficial for a large population because emotional self-regulation can help to create better social connections and reduce the risk of suffering from psychiatric disorders (English et al., 2012).
3 Virtual environment
Five virtual environments were created using Unity. The design process was based on graphics design guidelines found in previous studies (Aronoff, 2006; Aronoff et al., 1992; Bar & Neta, 2006; Feng et al., 2014; Lockyer et al., 2011; Palmer & Schloss, 2010; Piwek et al., 2015; Valdez & Mehrabian, 1994) and on the criteria of a graphics designer (Andres Pinilla). The five environments had a similar structure: a flat landscape with a particles systems surrounding the participant's visual field. The graphical properties of the particles system in each environment were different. Each environment was intended to represent one of the following types of emotions: (1) High Arousal, High Valence; (2) Low Arousal, High Valence; (3) Low Arousal, Low Valence; (4) High Arousal, Low Valence; and (5) Neutral (experimental control). Details about the design of each environment are described below.
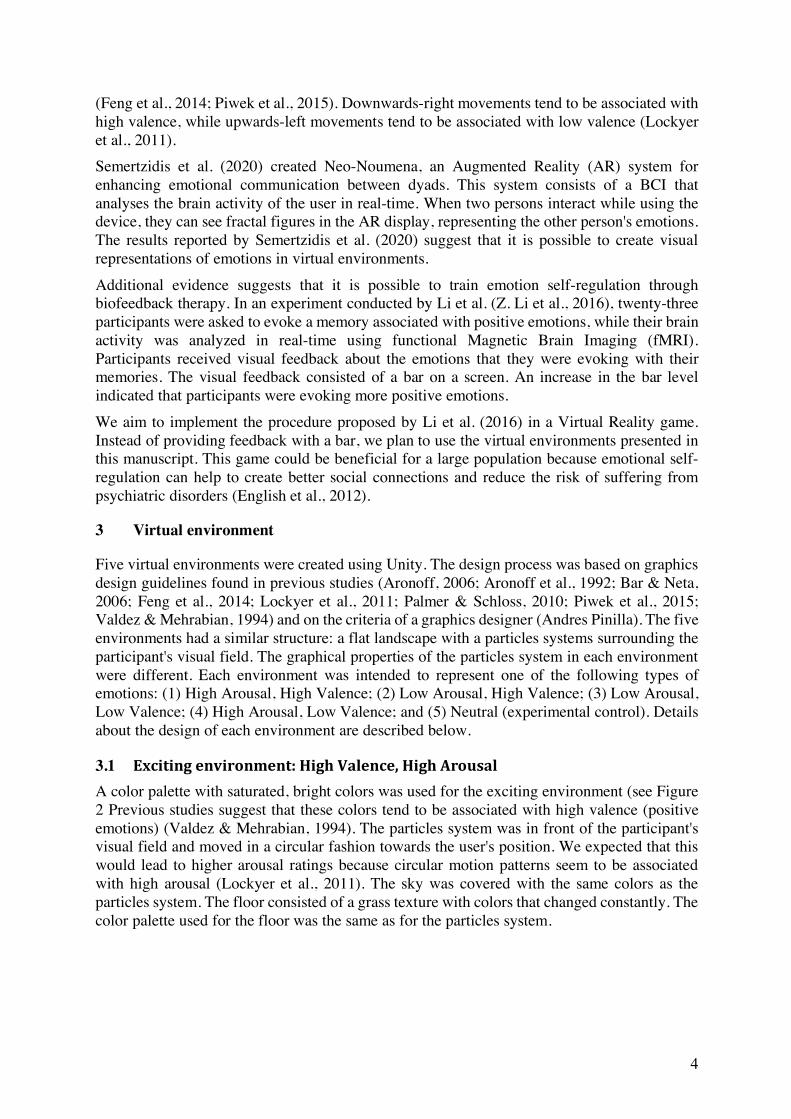
3.1 Excitingenvironment:HighValence,HighArousal A color palette with saturated, bright colors was used for the exciting environment (see Figure 2 Previous studies suggest that these colors tend to be associated with high valence (positive emotions) (Valdez & Mehrabian, 1994). The particles system was in front of the participant's visual field and moved in a circular fashion towards the user's position. We expected that this would lead to higher arousal ratings because circular motion patterns seem to be associated with high arousal (Lockyer et al., 2011). The sky was covered with the same colors as the particles system. The floor consisted of a grass texture with colors that changed constantly. The color palette used for the floor was the same as for the particles system.
5
Figure 2: Screenshot of the exciting environment.
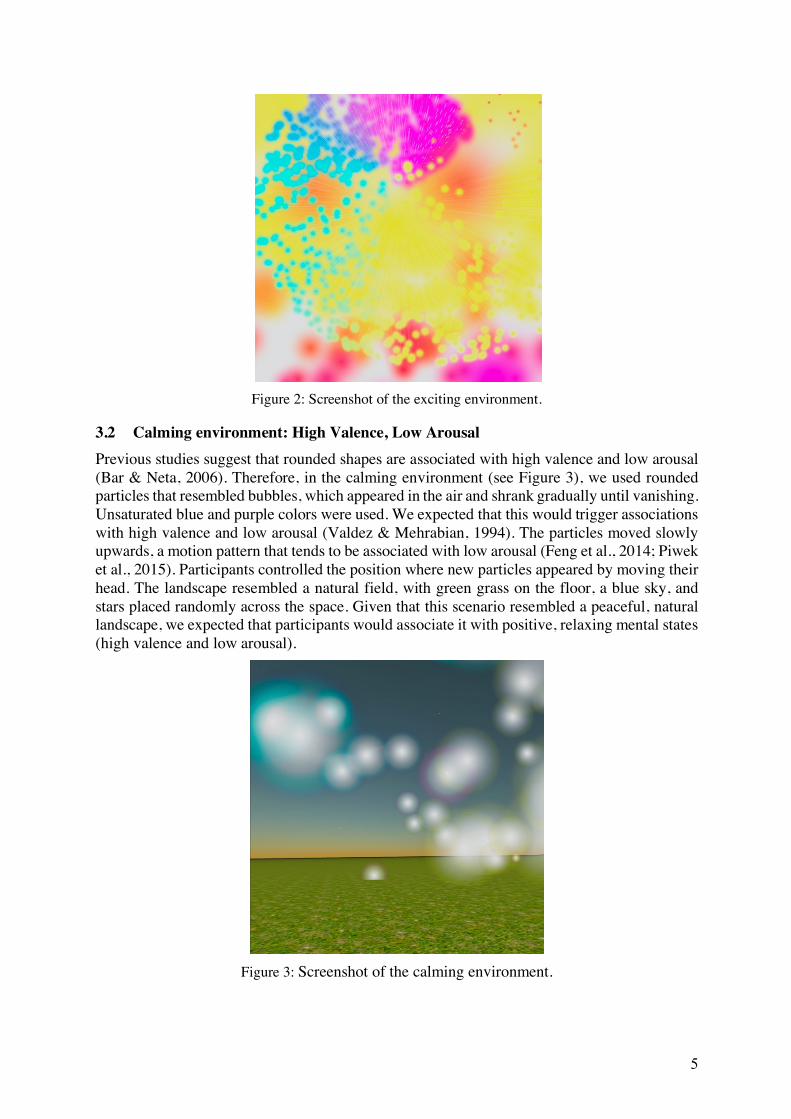
3.2 Calming environment: High Valence, Low Arousal Previous studies suggest that rounded shapes are associated with high valence and low arousal (Bar & Neta, 2006). Therefore, in the calming environment (see Figure 3), we used rounded particles that resembled bubbles, which appeared in the air and shrank gradually until vanishing. Unsaturated blue and purple colors were used. We expected that this would trigger associations with high valence and low arousal (Valdez & Mehrabian, 1994). The particles moved slowly upwards, a motion pattern that tends to be associated with low arousal (Feng et al., 2014; Piwek et al., 2015). Participants controlled the position where new particles appeared by moving their head. The landscape resembled a natural field, with green grass on the floor, a blue sky, and stars placed randomly across the space. Given that this scenario resembled a peaceful, natural landscape, we expected that participants would associate it with positive, relaxing mental states (high valence and low arousal).
Figure 3: Screenshot of the calming environment.
6
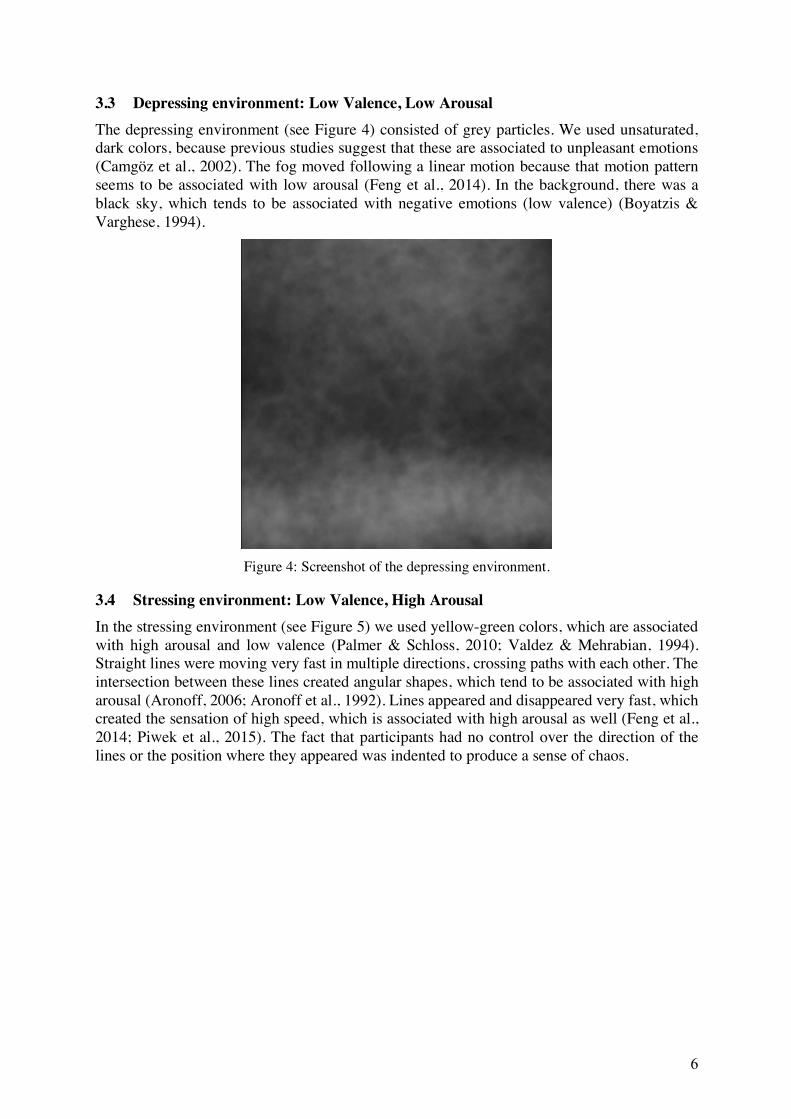
3.3 Depressing environment: Low Valence, Low Arousal The depressing environment (see Figure 4) consisted of grey particles. We used unsaturated, dark colors, because previous studies suggest that these are associated to unpleasant emotions (Camgöz et al., 2002). The fog moved following a linear motion because that motion pattern seems to be associated with low arousal (Feng et al., 2014). In the background, there was a black sky, which tends to be associated with negative emotions (low valence) (Boyatzis & Varghese, 1994).
Figure 4: Screenshot of the depressing environment.
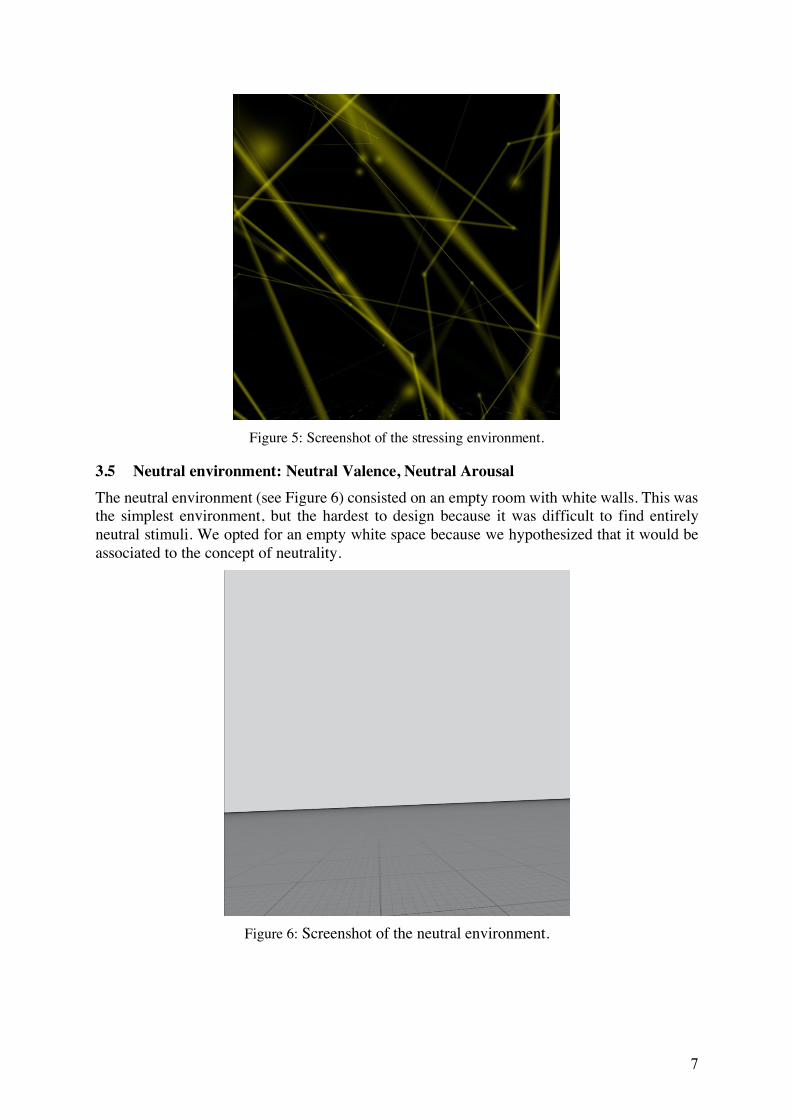
3.4 Stressing environment: Low Valence, High Arousal In the stressing environment (see Figure 5) we used yellow-green colors, which are associated with high arousal and low valence (Palmer & Schloss, 2010; Valdez & Mehrabian, 1994). Straight lines were moving very fast in multiple directions, crossing paths with each other. The intersection between these lines created angular shapes, which tend to be associated with high arousal (Aronoff, 2006; Aronoff et al., 1992). Lines appeared and disappeared very fast, which created the sensation of high speed, which is associated with high arousal as well (Feng et al., 2014; Piwek et al., 2015). The fact that participants had no control over the direction of the lines or the position where they appeared was indented to produce a sense of chaos.
7
Figure 5: Screenshot of the stressing environment.
3.5 Neutral environment: Neutral Valence, Neutral Arousal The neutral environment (see Figure 6) consisted on an empty room with white walls. This was the simplest environment, but the hardest to design because it was difficult to find entirely neutral stimuli. We opted for an empty white space because we hypothesized that it would be associated to the concept of neutrality.
Figure 6: Screenshot of the neutral environment.
8
4 Methods
4.1 Participants
Twenty-one university students participated in the study (9 women and 12 men). Their age was between 18 and 31 (M = 24.81; SD = 3.57). All participants gave their written informed consent before participating in the experiment. No compensation was given to participants.
4.2 Apparatus
The virtual environment was developed in Unity 2020.1.3, a software commonly used for game development, and presented in an Oculus Quest, which consists of two displays (one for each eye). Each display has a resolution of 1440 x 1660 pixels. The Self-Assessment Manikin (SAM) (Bradley & Lang, 1994) was used to evaluate the emotions associated with each virtual environment.
4.3 Procedure
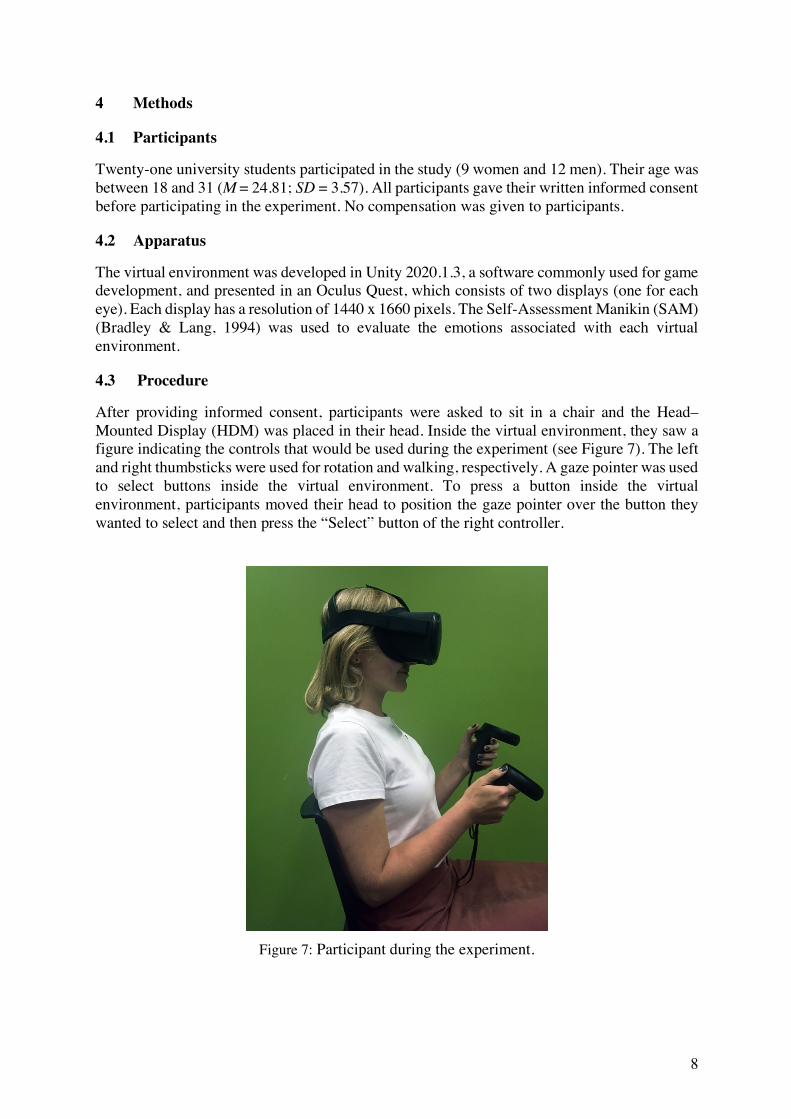
After providing informed consent, participants were asked to sit in a chair and the Head–Mounted Display (HDM) was placed in their head. Inside the virtual environment, they saw a figure indicating the controls that would be used during the experiment (see Figure 7). The left and right thumbsticks were used for rotation and walking, respectively. A gaze pointer was used to select buttons inside the virtual environment. To press a button inside the virtual environment, participants moved their head to position the gaze pointer over the button they wanted to select and then press the “Select” button of the right controller.
Figure 7: Participant during the experiment.
9
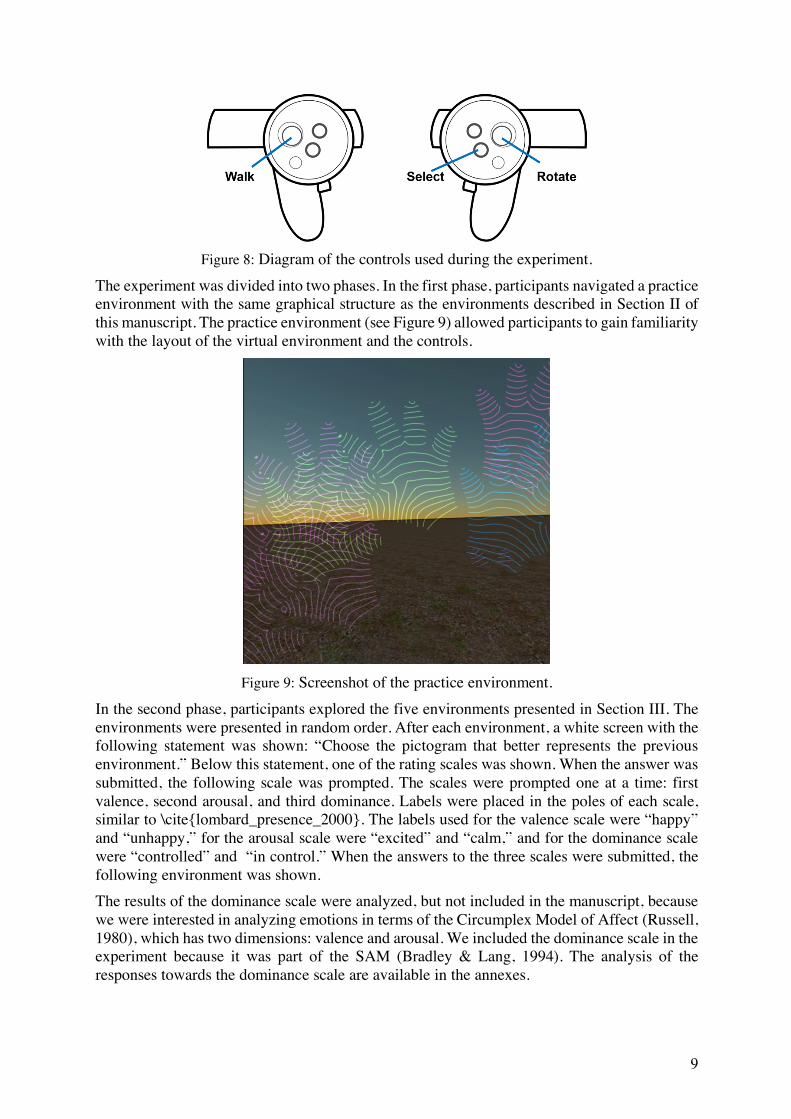
Figure 8: Diagram of the controls used during the experiment.
The experiment was divided into two phases. In the first phase, participants navigated a practice environment with the same graphical structure as the environments described in Section II of this manuscript. The practice environment (see Figure 9) allowed participants to gain familiarity with the layout of the virtual environment and the controls.
Figure 9: Screenshot of the practice environment.
In the second phase, participants explored the five environments presented in Section III. The environments were presented in random order. After each environment, a white screen with the following statement was shown: “Choose the pictogram that better represents the previous environment.” Below this statement, one of the rating scales was shown. When the answer was submitted, the following scale was prompted. The scales were prompted one at a time: first valence, second arousal, and third dominance. Labels were placed in the poles of each scale, similar to \cite{lombard_presence_2000}. The labels used for the valence scale were “happy” and “unhappy,” for the arousal scale were “excited” and “calm,” and for the dominance scale were “controlled” and “in control.” When the answers to the three scales were submitted, the following environment was shown. The results of the dominance scale were analyzed, but not included in the manuscript, because we were interested in analyzing emotions in terms of the Circumplex Model of Affect (Russell, 1980), which has two dimensions: valence and arousal. We included the dominance scale in the experiment because it was part of the SAM (Bradley & Lang, 1994). The analysis of the responses towards the dominance scale are available in the annexes.
10
5 Data analysis
We used a within-subjects design, with environment as the dependent variable, with five levels: exciting, calming, depressing, stressing, and neutral. The independent variables were the ratings in the valence and arousal scales.
6 Results
A MANOVA was conducted to analyze whether the environment explored by participants produced a significant effect on the ratings in the valence and arousal scales. No outliers were detected. The assumption of normal distribution was violated in 6 of the 10 cells of the experimental design, as assessed by Shapiro-Wilks test (p < .05). We decided to continue the analysis because ANOVA is robust towards violations of normality (Schmider et al., 2010). The assumption of homogeneity of variances was met for the two dependent variables, as assessed by Levene’s test (p > .05). There was a statistically significant difference between the evaluations towards each environment, F(8, 198.000) = 11.1171, p < .001, Wilk’s Λ = 0.4762.
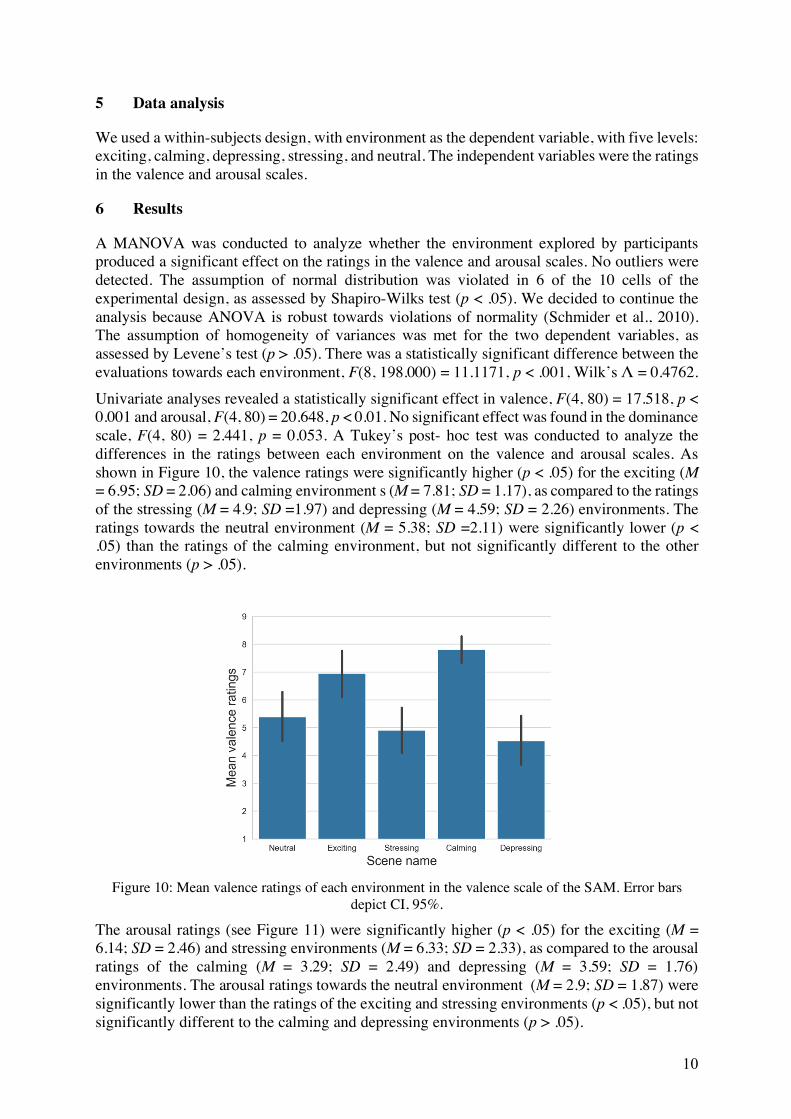
Univariate analyses revealed a statistically significant effect in valence, F(4, 80) = 17.518, p < 0.001 and arousal, F(4, 80) = 20.648, p < 0.01. No significant effect was found in the dominance scale, F(4, 80) = 2.441, p = 0.053. A Tukey’s post- hoc test was conducted to analyze the differences in the ratings between each environment on the valence and arousal scales. As shown in Figure 10, the valence ratings were significantly higher (p < .05) for the exciting (M = 6.95; SD = 2.06) and calming environment s (M = 7.81; SD = 1.17), as compared to the ratings of the stressing (M = 4.9; SD =1.97) and depressing (M = 4.59; SD = 2.26) environments. The ratings towards the neutral environment (M = 5.38; SD =2.11) were significantly lower (p < .05) than the ratings of the calming environment, but not significantly different to the other environments (p > .05).
Figure 10: Mean valence ratings of each environment in the valence scale of the SAM. Error bars
depict CI, 95%.
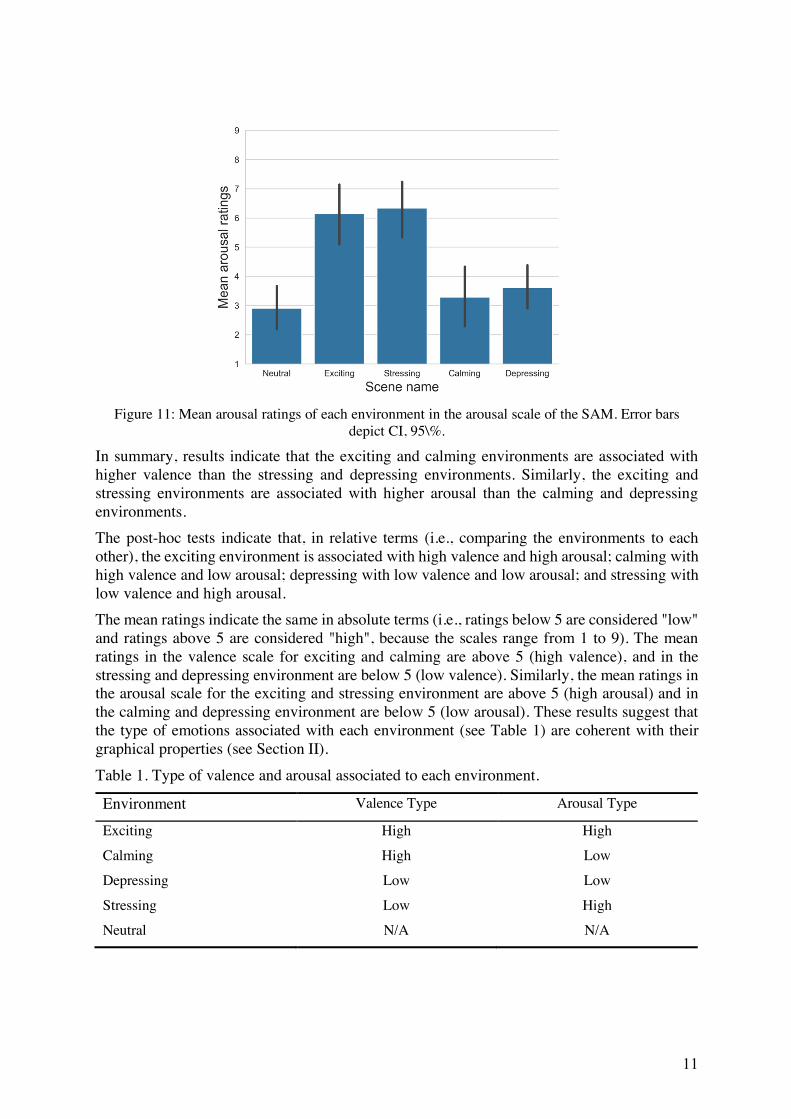
The arousal ratings (see Figure 11) were significantly higher (p < .05) for the exciting (M = 6.14; SD = 2.46) and stressing environments (M = 6.33; SD = 2.33), as compared to the arousal ratings of the calming (M = 3.29; SD = 2.49) and depressing (M = 3.59; SD = 1.76) environments. The arousal ratings towards the neutral environment (M = 2.9; SD = 1.87) were significantly lower than the ratings of the exciting and stressing environments (p < .05), but not significantly different to the calming and depressing environments (p > .05).
11
Figure 11: Mean arousal ratings of each environment in the arousal scale of the SAM. Error bars
depict CI, 95\%.
In summary, results indicate that the exciting and calming environments are associated with higher valence than the stressing and depressing environments. Similarly, the exciting and stressing environments are associated with higher arousal than the calming and depressing environments. The post-hoc tests indicate that, in relative terms (i.e., comparing the environments to each other), the exciting environment is associated with high valence and high arousal; calming with high valence and low arousal; depressing with low valence and low arousal; and stressing with low valence and high arousal. The mean ratings indicate the same in absolute terms (i.e., ratings below 5 are considered "low" and ratings above 5 are considered "high", because the scales range from 1 to 9). The mean ratings in the valence scale for exciting and calming are above 5 (high valence), and in the stressing and depressing environment are below 5 (low valence). Similarly, the mean ratings in the arousal scale for the exciting and stressing environment are above 5 (high arousal) and in the calming and depressing environment are below 5 (low arousal). These results suggest that the type of emotions associated with each environment (see Table 1) are coherent with their graphical properties (see Section II).
Table 1. Type of valence and arousal associated to each environment.
Environment Valence Type Arousal Type
Exciting High High
Calming High Low
Depressing Low Low
Stressing Low High
Neutral N/A N/A
12
7 Discussion This manuscript presents five virtual environments: exciting, calming, depressing, stressing, and neutral. We conducted an experiment where participants evaluated the emotions that those environments represent. Overall, the results suggest that the virtual environments can be used to visualize four types of emotions, covering the four quadrants of the Circumplex Model of Affect (see Figure 1). The mean valence ratings of the stressing and depressing environments were higher than expected (slightly below 5, near the middle of the valence scale). Therefore, they do not seem to be associated with extremely negative emotions. It is possible that the stressing and depressing environments were aesthetically appealing for participants. Since aesthetics has a role in valence ratings (Seo et al., 2015), it is likely that participants' aesthetic judgments biased the evaluation of these two environments. It remains an open research topic analyzing how to design abstract visual stimuli that can be used to represent extremely negative emotions. One possible approach would be to develop particles systems with aesthetically unappealing stimuli. The arousal ratings in the neutral environment were similar to the calming and depressing environments. This was expected because the calming and depressing had moving particles, hence the eyes of the participants would tend to track their movement, leading to slightly higher mental activity. In the empty space of the neutral environment, there was no visual stimuli to engage with, leading to lower arousal. Previous studies have shown that faces associated with neutral emotions tend to receive low arousal ratings (Balconi & Lucchiari, 2008). Therefore, the arousal levels associated with the neutral environment might be similar to the arousal levels associated with neutral faces. Thus, its ratings are within the normal boundaries of neutral stimuli.
The design of all the environments had a similar graphical structure: a flat landscape with a particles system (abstract figures) placed inside the participant's visual field. Using the same visual structure in all the environments helped to control the variables that could affect participants' ratings, allowing us to make a valid comparison between participants' ratings towards each environment. At the same time, this design approach limited the level of realism of the virtual environments, as there were no mountains, trees, animals, or any other objects that could produce biases in the emotional evaluations of the participants. Our results are consistent with those previous findings indicating that colors (Gao et al., 2007; Valdez & Mehrabian, 1994), shapes (Feng et al., 2014; Lockyer et al., 2011; Piwek et al., 2015) and motion patterns (Aronoff, 2006; Bar & Neta, 2006) tend to be associated with emotional responses. Moreover, we have shown that it is possible to combine those visual cues into a single graphical system. This graphical system can be used to create a more complex instrument for emotional visualization. For example, using Procedural Content Generation (PCG) to automatically create figures whose graphical parameters are associated with particular emotions, similar to Semertzidis et al. (Semertzidis et al., 2020). The visual compositions presented in this manuscript are not entirely detached from real-world contexts, but aim to produce minimal associations to them. It might be difficult to imagine a visual composition detached from a real-world images because it is often assumed that the images we create in our minds are inspired in images previously seen in the physical world. However, there is evidence that refutes this assumption. A recent study suggests that congenitally blind people have dreams with visual content (Bértolo et al., 2003). Therefore, mental imagery is psychological process that can occur independently of visual perception. Consequently, it might be possible to create abstract representations of emotions, entirely detached from visual references to real-world contexts.
13
Our experiment was intended to analyze whether there was an association between the environments' graphical properties and the emotions they represent. However, it is not clear whether the participants' emotional state was affected by the visual stimuli. Future studies could address this question by asking participants how do they feel before and after navigating each environment, rather than which emotion do they associate to the virtual environment.
8 Conclusion This manuscript presents a virtual environment that can be used to represent four emotions covering the four quadrants of the Circumplex Model of Affect (Russell, 1980). This environment was tested in an experiment with twenty-one participants. The virtual environments were presented in random order. Participants navigated each environment for one minute. Then, the pictograms of the SAM were prompt. Participants were asked to indicate which of the pictograms of the SAM represented better the environment they had explored. Results indicate that the environments are a reliable tool for that representing emotions. We intend to use these environments to provide emotional visual feedback in VR, as part of a biofeedback therapy for training emotion self-regulation, fostering social bonds in the post-COVID era. We believe that VR is an ideal tool for this purpose because (1) it can be used in social isolation, which might be attractive for users who have gotten used to maintain social distancing as a consequence of the COVID-19 pandemic and are not comfortable with social contact; and (2) it allows to create immersive environments, which can produce a more engaging experience for users (Visch et al., 2010), increasing their motivation to play our game.
9 Declarations
9.1 Funding
Not applicable.
9.2 Conflict of Interest
The authors declare that they have no conflict of interest.
9.3 Availability of data and material
Data are available in the OSF repository of the research project: https://osf.io/xk32z/
9.4 Code availability
The virtual environments presented in this manuscript are available under request. The Virtual Reality application that was used in the experiment is available as an APK file at https://osf.io/xk32z/.
9.5 Author Contributions
All authors contributed to the study conception and data analysis. Jaime Garcia and William Raffe contributed with the development of the virtual environment. Jan-Niklas Voigt-Antons and Sebastian Möller contributed with the experimental design. Andres Pinilla conducted the study, developed the virtual environments and wrote the first draft. All authors commented on previous versions of the manuscript.
14
9.6 Ethics
The experiment was approved by the Human Research ethics committee of the University of Technology Sydney, with approval number ETH20-5123.
9.7 Acknowledgments
We very thankful with Dr Gail Kenning for the valuable feedback she provided on the early stages of this research project. This work was supported by the strategic partnership between the Technische Universität Berlin, Germany and the University of Technology Sydney, Australia.
9.8 Consent to participate
All participants provided their written informed consent to participate in the experiment.
9.9 Consent for publication
All participants agreed to have their responses published, provided that no details about their identity were exposed.
9.10 Consent for publication
We very thankful with Dr Gail Kenning for the valuable feedback she provided on the early stages of this research project.
This work was supported by the strategic partnership between the Technische Universität Berlin, Germany and the University of Technology Sydney, Australia.
10 References
Aronoff, J. (2006). How We Recognize Angry and Happy Emotion in People, Places, and Things. Cross-Cultural Research, 40(1), 83–105. https://doi.org/10.1177/1069397105282597
Aronoff, J., Woike, B. A., & Hyman, L. M. (1992). Which are the stimuli in facial displays of anger and happiness? Configurational bases of emotion recognition. Journal of Personality and Social Psychology, 62(6), 1050–1066. https://doi.org/10.1037/0022-3514.62.6.1050
Balconi, M., & Lucchiari, C. (2008). Consciousness and arousal effects on emotional face processing as revealed by brain oscillations. A gamma band analysis. International Journal of Psychophysiology, 67(1), 41–46. https://doi.org/10.1016/j.ijpsycho.2007.10.002
Bar, M., & Neta, M. (2006). Humans Prefer Curved Visual Objects. Psychological Science, 17(8), 645–648. https://doi.org/10.1111/j.1467-9280.2006.01759.x
Barreiros, A. R., Almeida, I., Baía, B. C., & Castelo-Branco, M. (2019). Amygdala Modulation During Emotion Regulation Training With fMRI-Based Neurofeedback. Frontiers in Human Neuroscience, 13. https://doi.org/10.3389/fnhum.2019.00089
Bértolo, H., Paiva, T., Pessoa, L., Mestre, T., Marques, R., & Santos, R. (2003). Visual dream content, graphical representation and EEG alpha activity in congenitally blind
15
subjects. Cognitive Brain Research, 15(3), 277–284. https://doi.org/10.1016/S0926-6410(02)00199-4
Boyatzis, C. J., & Varghese, R. (1994). Children’s Emotional Associations with Colors. The Journal of Genetic Psychology, 155(1), 77–85. https://doi.org/10.1080/00221325.1994.9914760
Bradley, M. M., & Lang, P. J. (1994). Measuring emotion: The self-assessment manikin and the semantic differential. Journal of Behavior Therapy and Experimental Psychiatry, 25(1), 49–59. https://doi.org/10.1016/0005-7916(94)90063-9
Camgöz, N., Yener, C., & Güvenç, D. (2002). Effects of hue, saturation, and brightness on preference. Color Research & Application, 27(3), 199–207. https://doi.org/10.1002/col.10051
Davidson, R. J. (1992). Emotion and Affective Style: Hemispheric Substrates. Psychological Science, 3(1), 39–43. https://doi.org/10.1111/j.1467-9280.1992.tb00254.x
De Boeck, C. (2009). Staalhemel—Steel Sky. https://vimeo.com/7746875 Dimberg, U. (1982). Facial Reactions to Facial Expressions. Psychophysiology, 19(6), 643–
647. https://doi.org/10.1111/j.1469-8986.1982.tb02516.x Dimberg, U., Thunberg, M., & Elmehed, K. (2000). Unconscious Facial Reactions to
Emotional Facial Expressions. Psychological Science, 11(1), 86–89. https://doi.org/10.1111/1467-9280.00221
Ekman, P., & Friesen, W. V. (1971). Constants across cultures in the face and emotion. Journal of Personality and Social Psychology, 17(2), 124–129. https://doi.org/10.1037/h0030377
English, T., John, O. P., Srivastava, S., & Gross, J. J. (2012). Emotion regulation and peer-rated social functioning: A 4-year longitudinal study. Journal of Research in Personality, 46(6), 780–784. https://doi.org/10.1016/j.jrp.2012.09.006
Feng, C., Bartram, L., & Riecke, B. E. (2014). Evaluating affective features of 3D motionscapes. Proceedings of the ACM Symposium on Applied Perception - SAP ’14, 23–30. https://doi.org/10.1145/2628257.2628264
Gao, X.-P., Xin, J. H., Sato, T., Hansuebsai, A., Scalzo, M., Kajiwara, K., Guan, S.-S., Valldeperas, J., Lis, M. J., & Billger, M. (2007). Analysis of cross-cultural color emotion. Color Research & Application, 32(3), 223–229. https://doi.org/10.1002/col.20321
Huster, R. J., Stevens, S., Gerlach, A. L., & Rist, F. (2009). A spectralanalytic approach to emotional responses evoked through picture presentation. International Journal of Psychophysiology, 72(2), 212–216. https://doi.org/10.1016/j.ijpsycho.2008.12.009
Koelstra, S., Muhl, C., Soleymani, M., Jong-Seok Lee, Yazdani, A., Ebrahimi, T., Pun, T., Nijholt, A., & Patras, I. (2012). DEAP: A Database for Emotion Analysis ;Using Physiological Signals. IEEE Transactions on Affective Computing, 3(1), 18–31. https://doi.org/10.1109/T-AFFC.2011.15
Li, B. J., Bailenson, J. N., Pines, A., Greenleaf, W. J., & Williams, L. M. (2017). A Public Database of Immersive VR Videos with Corresponding Ratings of Arousal, Valence, and Correlations between Head Movements and Self Report Measures. Frontiers in Psychology, 8. https://doi.org/10.3389/fpsyg.2017.02116
Li, Z., Tong, L., Wang, L., Li, Y., He, W., Guan, M., & Yan, B. (2016). Self-regulating positive emotion networks by feedback of multiple emotional brain states using real-
16
time fMRI. Experimental Brain Research, 234(12), 3575–3586. https://doi.org/10.1007/s00221-016-4744-z
Lockyer, M., Bartram, L., & Riecke, B. E. (2011). Simple Motion Textures for Ambient Affect. Computational Aesthetics in Graphics, Visualization, 8 pages. https://doi.org/10.2312/COMPAESTH/COMPAESTH11/089-096
Norman, J. F., Beers, A., & Phillips, F. (2010). Fechner’s Aesthetics Revisited. Seeing and Perceiving, 23(3), 263–271. https://doi.org/10.1163/187847510X516412
Palmer, S. E., & Schloss, K. B. (2010). An ecological valence theory of human color preference. Proceedings of the National Academy of Sciences, 107(19), 8877–8882. https://doi.org/10.1073/pnas.0906172107
Perkis, A., Timmerer, C., Baraković, S., Husić, J. B., Bech, S., Bosse, S., Botev, J., Brunnström, K., Cruz, L., Moor, K. D., Saibanti, A. de P., Durnez, W., Egger-Lampl, S., Engelke, U., Falk, T. H., Hameed, A., Hines, A., Kojic, T., Kukolj, D., … Zadtootaghaj, S. (2020). QUALINET White Paper on Definitions of Immersive Media Experience (IMEx).
Pfurtscheller, G., & Lopes da Silva, F. H. (1999). Event-related EEG/MEG synchronization and desynchronization: Basic principles. Clinical Neurophysiology, 110(11), 1842–1857. https://doi.org/10.1016/S1388-2457(99)00141-8
Piwek, L., Pollick, F., & Petrini, K. (2015). Audiovisual integration of emotional signals from others’ social interactions. Frontiers in Psychology, 9. https://doi.org/10.3389/fpsyg.2015.00611
Russell, J. A. (1980). A circumplex model of affect. Journal of Personality and Social Psychology, 39(6), 1161–1178. https://doi.org/10.1037/h0077714
Schmider, E., Ziegler, M., Danay, E., Beyer, L., & Bühner, M. (2010). Is It Really Robust?: Reinvestigating the Robustness of ANOVA Against Violations of the Normal Distribution Assumption. Methodology, 6(4), 147–151. https://doi.org/10.1027/1614-2241/a000016
Semertzidis, N., Scary, M., Andres, J., Dwivedi, B., Kulwe, Y. C., Zambetta, F., & Mueller, F. F. (2020). Neo-Noumena: Augmenting Emotion Communication. Proceedings of the 2020 CHI Conference on Human Factors in Computing Systems, 1–13. https://doi.org/10.1145/3313831.3376599
Seo, K.-K., Lee, S., Chung, B. D., & Park, C. (2015). Users’ Emotional Valence, Arousal, and Engagement Based on Perceived Usability and Aesthetics for Web Sites. International Journal of Human-Computer Interaction, 31(1), 72–87. https://doi.org/10.1080/10447318.2014.959103
Sobell, N., & Trivich, M. (1990). Brainwave Drawing Game. Delicate Balance: Technics, Culture and Consequences, 360–362. https://doi.org/10.1109/TCAC.1989.697094
Valdez, P., & Mehrabian, A. (1994). Effects of color on emotions. Journal of Experimental Psychology: General, 123(4), 394–409. https://doi.org/10.1037/0096-3445.123.4.394
Visch, V. T., Tan, E. S., & Molenaar, D. (2010). The emotional and cognitive effect of immersion in film viewing. Cognition & Emotion, 24(8), 1439–1445. https://doi.org/10.1080/02699930903498186
Voigt-Antons, J.-N., Lehtonen, E., Palacios, A. P., Ali, D., Kojic, T., & Moller, S. (2020). Comparing Emotional States Induced by 360° Videos Via Head-Mounted Display and

17
Computer Screen. 2020 Twelfth International Conference on Quality of Multimedia Experience (QoMEX), 1–6. https://doi.org/10.1109/QoMEX48832.2020.9123125
Zotev, V., Phillips, R., Yuan, H., Misaki, M., & Bodurka, J. (2014). Self-regulation of human brain activity using simultaneous real-time fMRI and EEG neurofeedback. NeuroImage, 85, 985–995. https://doi.org/10.1016/j.neuroimage.2013.04.126
Related Documents