Vibrationdata 1 Non-Gaussian Random Fatigue and Peak Response Unit 36

Welcome message from author
This document is posted to help you gain knowledge. Please leave a comment to let me know what you think about it! Share it to your friends and learn new things together.
Transcript

Vibrationdata
1
Non-Gaussian Random Fatigue and Peak Response
Unit 36
Introduction
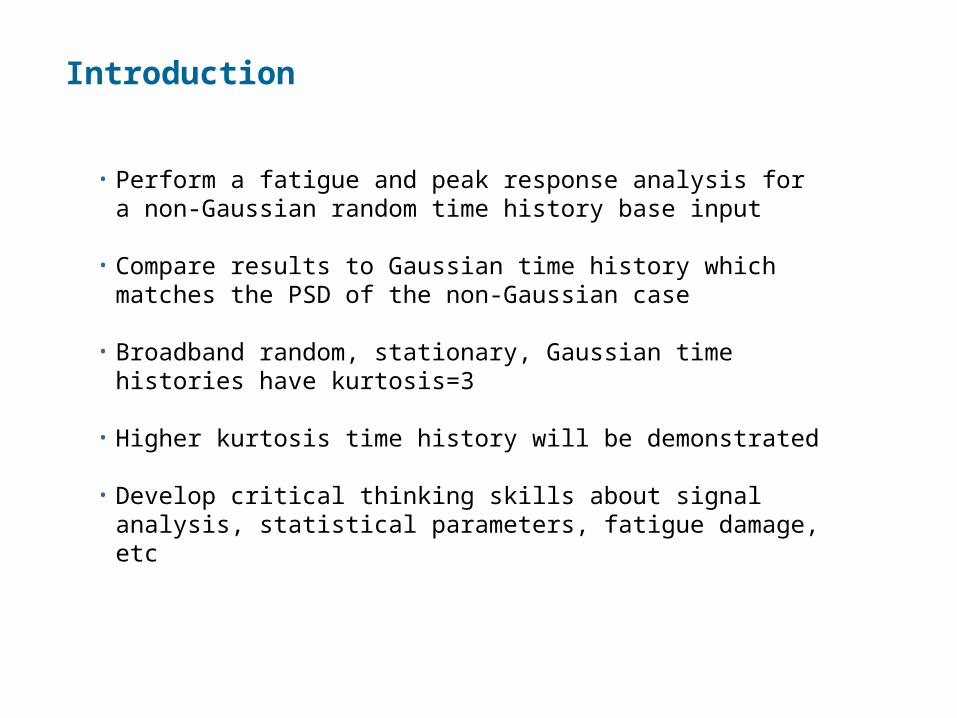
• Perform a fatigue and peak response analysis for a non-Gaussian random time history base input
• Compare results to Gaussian time history which matches the PSD of the non-Gaussian case
• Broadband random, stationary, Gaussian time histories have kurtosis=3
• Higher kurtosis time history will be demonstrated
• Develop critical thinking skills about signal analysis, statistical parameters, fatigue damage, etc
Vibrationdata
3
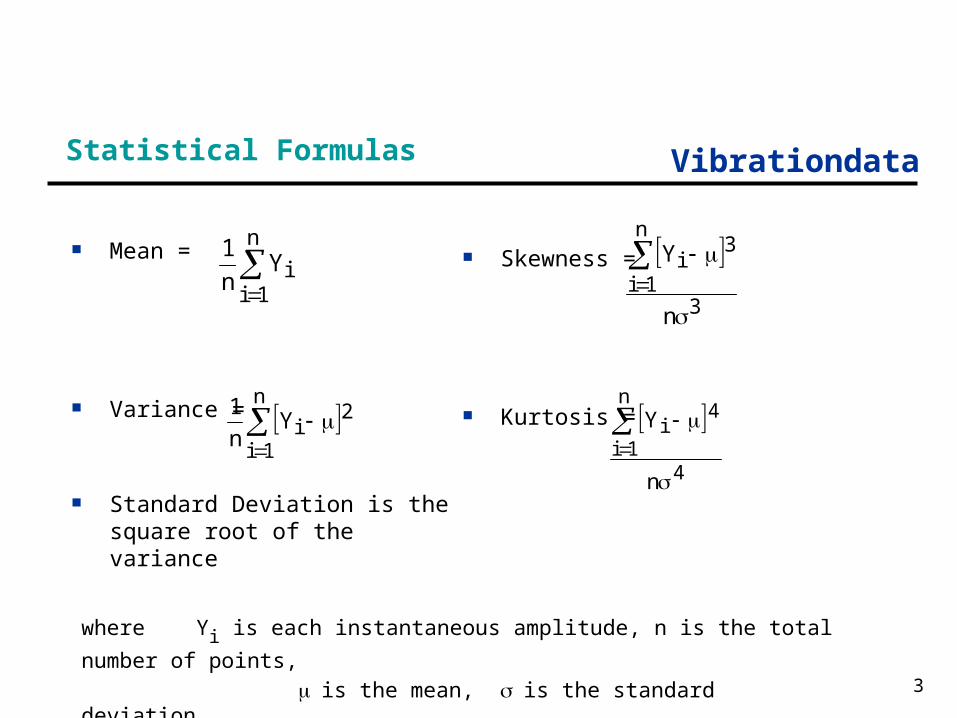
Statistical Formulas
Skewness =
Kurtosis =
4
n
1i
4i
n
Y
3
n
1i
3i
n
Y
Mean =
Variance =
Standard Deviation is the square root of the variance
n
1i
2iY
n
1
n
1iiY
n
1
where Yi is each instantaneous amplitude, n is the total number of points,
is the mean, is the standard deviation
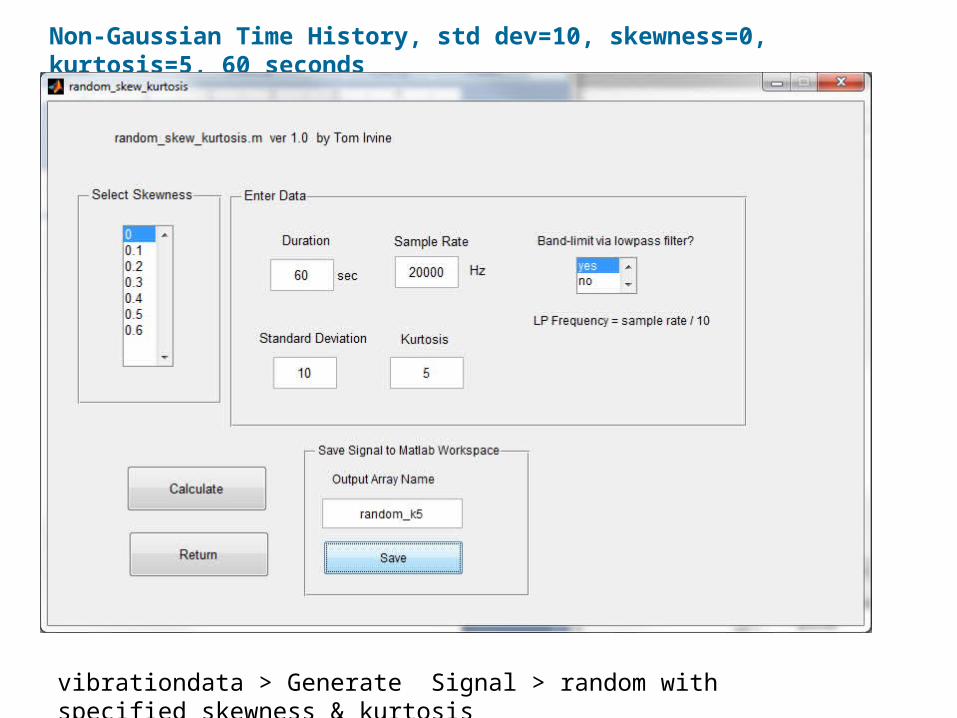
Non-Gaussian Time History, std dev=10, skewness=0, kurtosis=5, 60 seconds
vibrationdata > Generate Signal > random with specified skewness & kurtosis
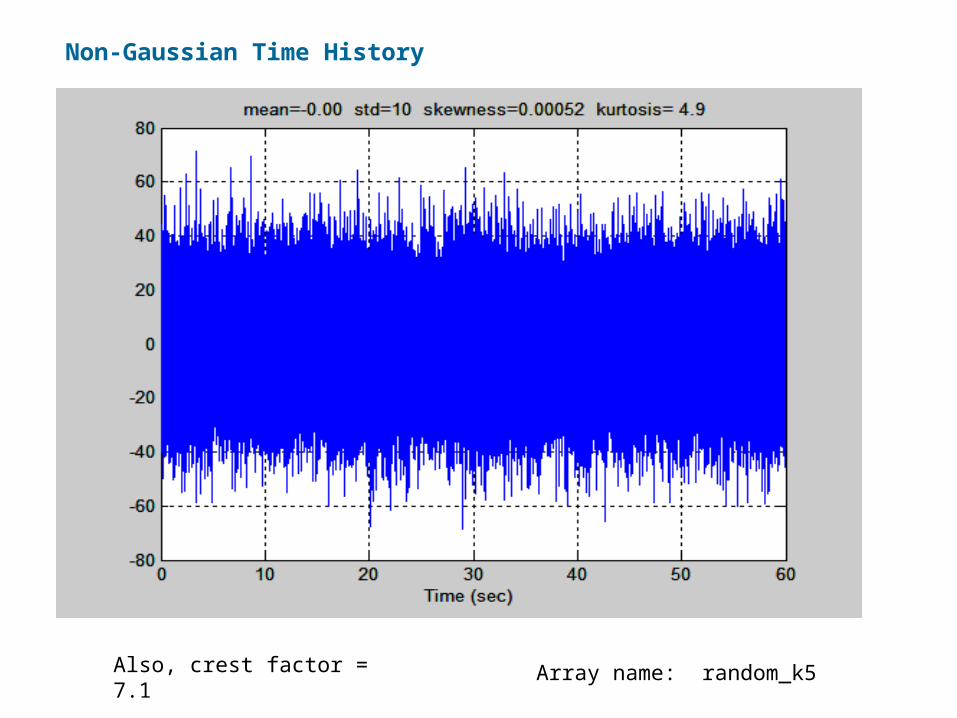
Non-Gaussian Time History
Array name: random_k5Also, crest factor = 7.1

Non-Gaussian Time History, Close-up View
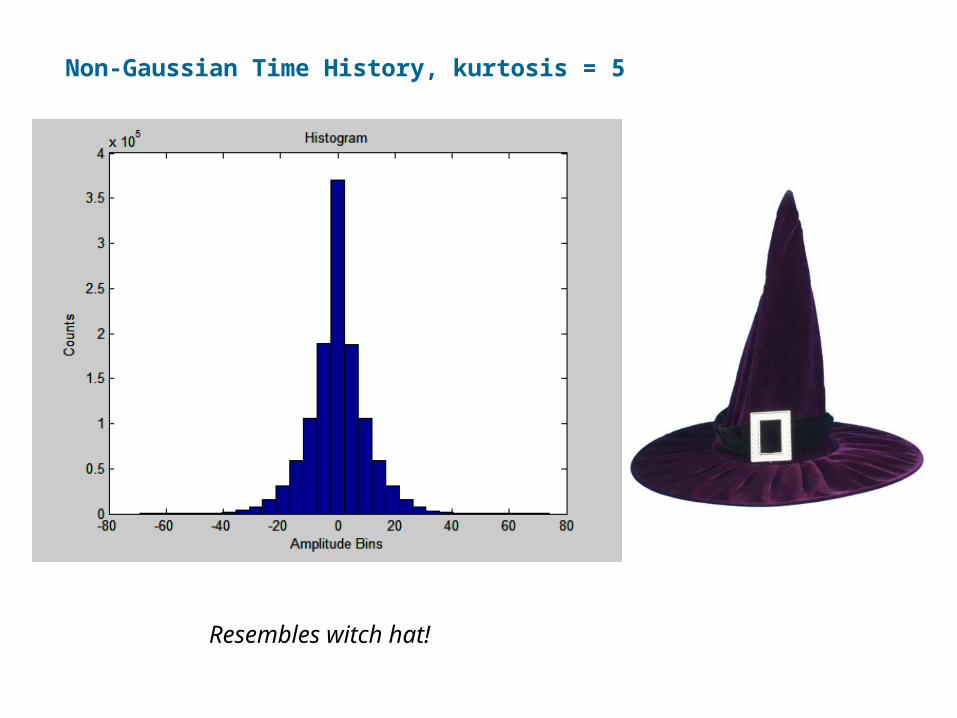
Non-Gaussian Time History, kurtosis = 5
Resembles witch hat!
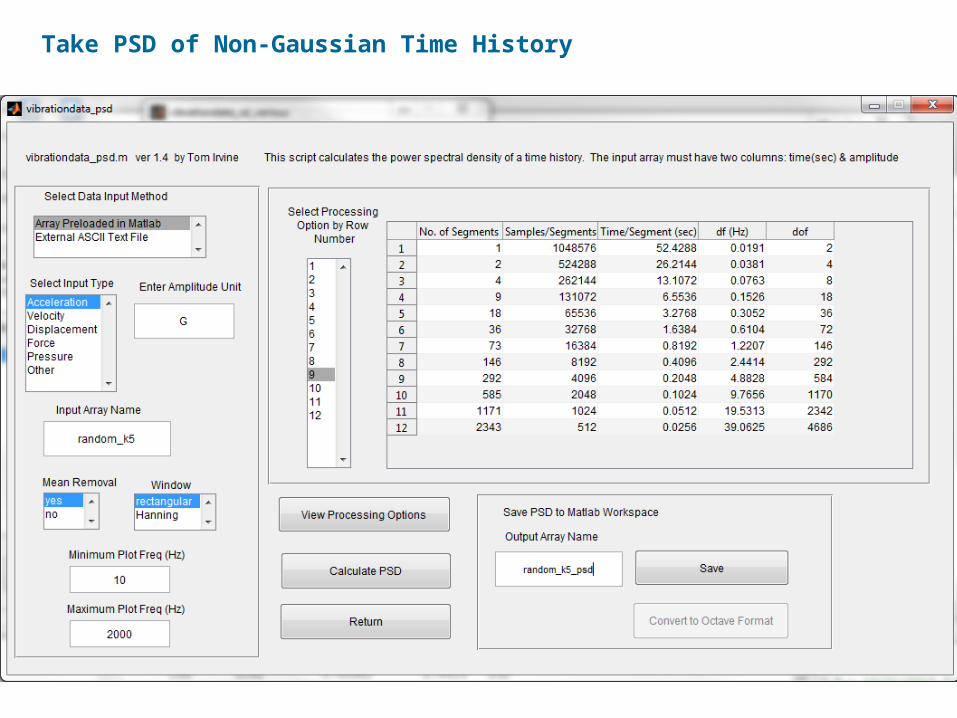
Take PSD of Non-Gaussian Time History
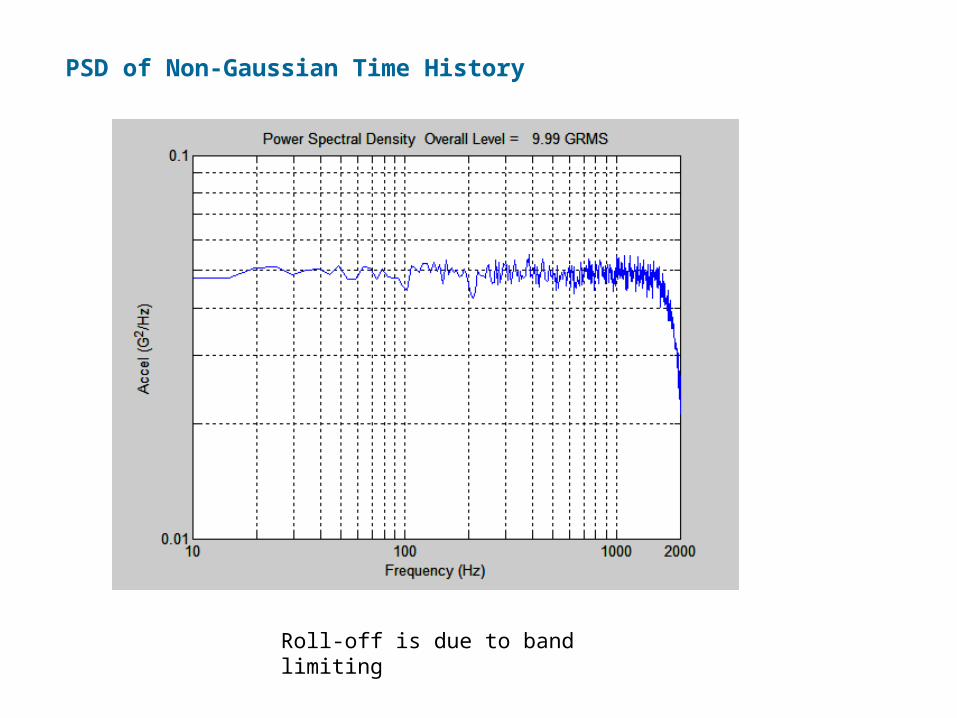
PSD of Non-Gaussian Time History
Roll-off is due to band limiting

Response to Base Input
fn = 600 Hz
Q=10
Fatigue exponent b=6.4
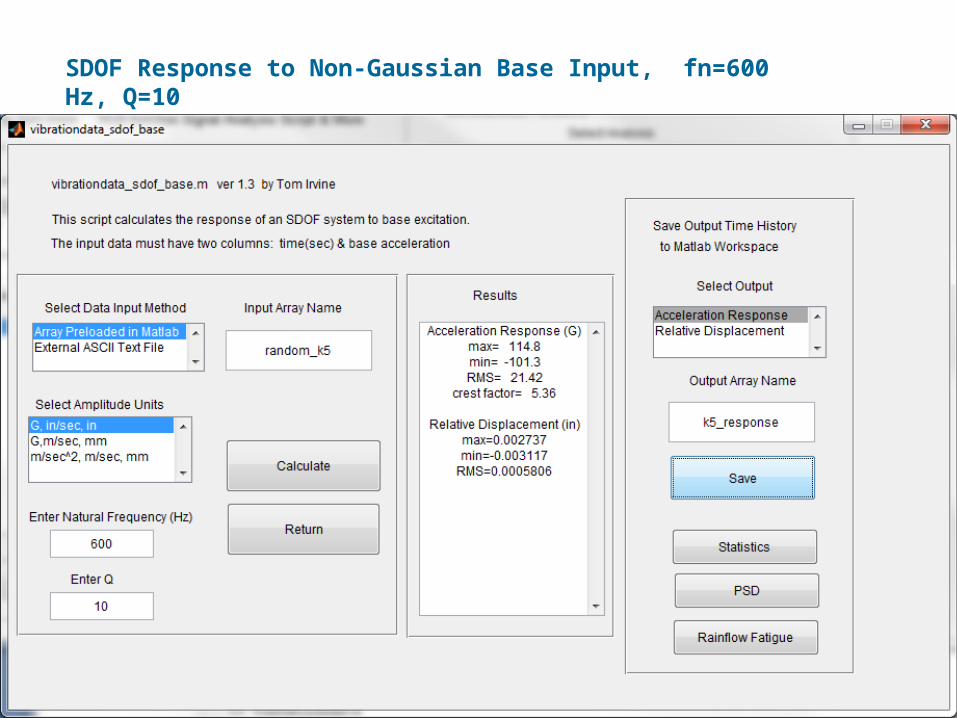
SDOF Response to Non-Gaussian Base Input, fn=600 Hz, Q=10
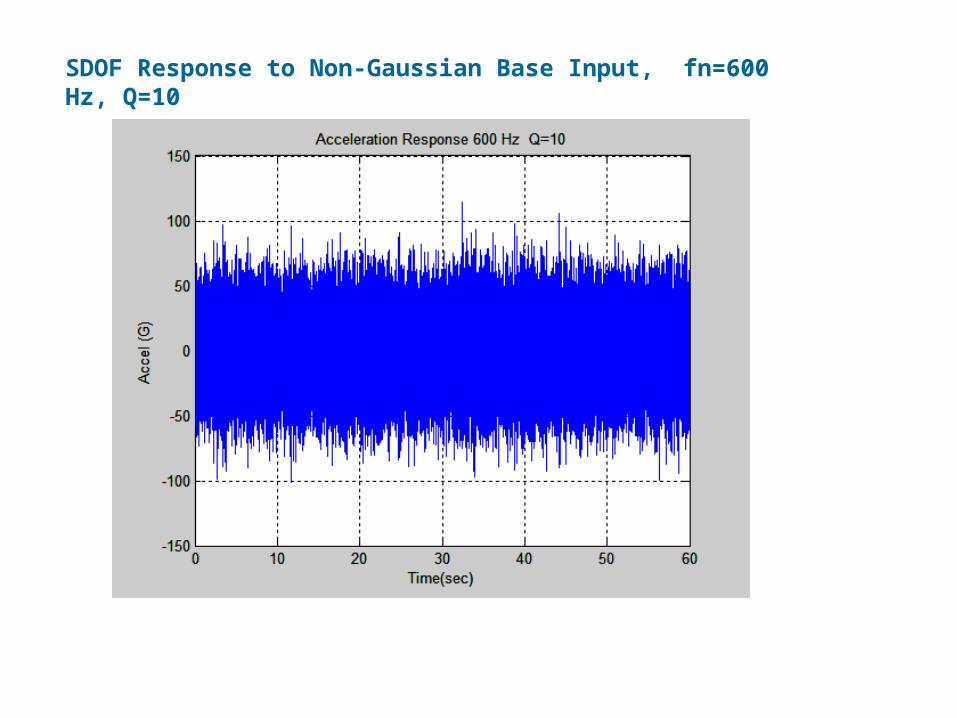
SDOF Response to Non-Gaussian Base Input, fn=600 Hz, Q=10
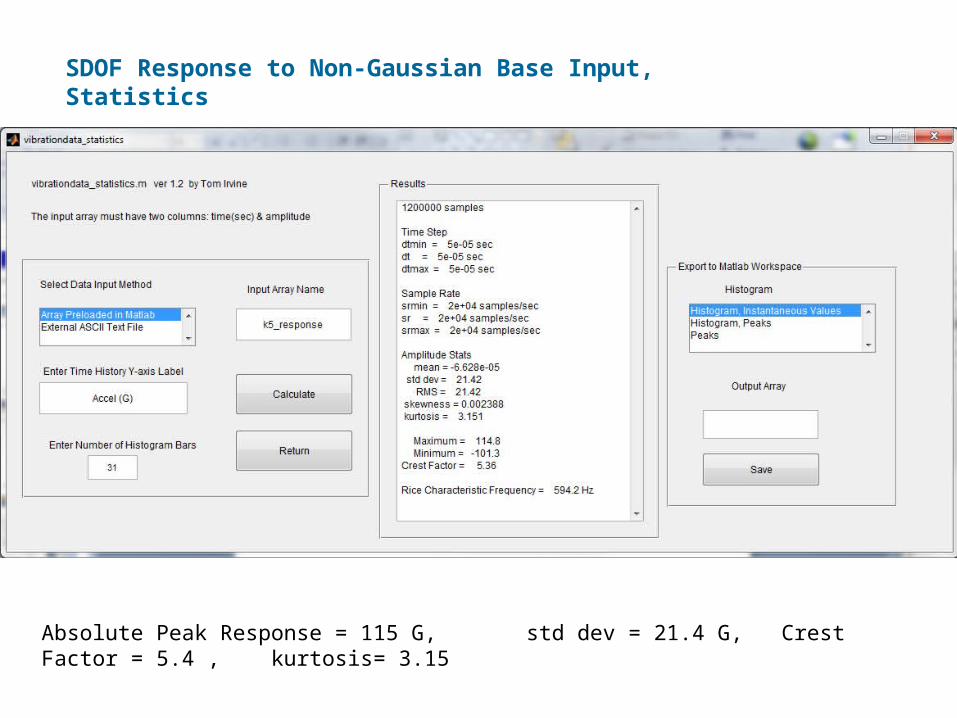
SDOF Response to Non-Gaussian Base Input, Statistics
Absolute Peak Response = 115 G, std dev = 21.4 G, Crest Factor = 5.4 , kurtosis= 3.15
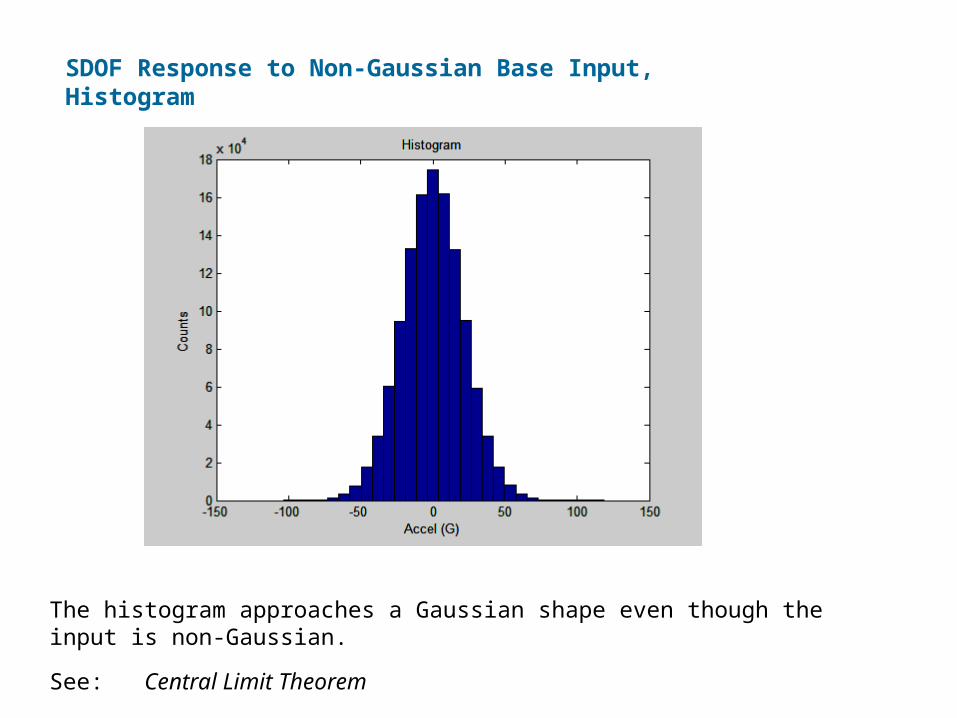
SDOF Response to Non-Gaussian Base Input, Histogram
The histogram approaches a Gaussian shape even though the input is non-Gaussian.
See: Central Limit Theorem
Central Limit Theorem
For a strongly resonant system subjected to broad band excitation, the central limit theorem makes it possible to establish that the response tends to be Gaussian even if the input is not.
This applies when the excitation is not white noise, provided that it is a broad band process covering the resonant peak.
- Christian Lalanne
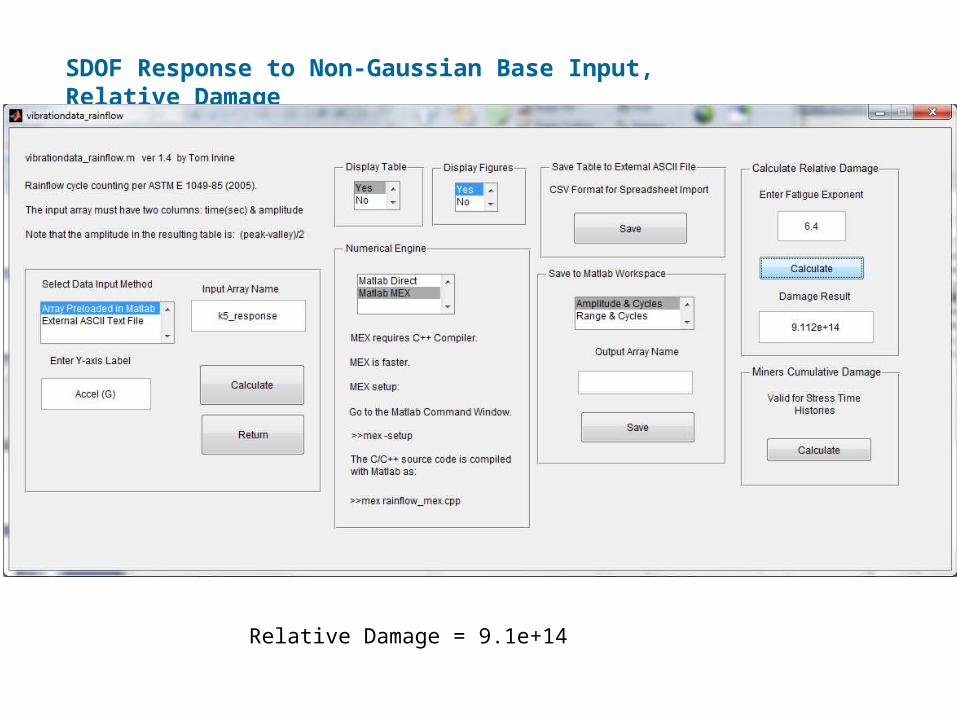
SDOF Response to Non-Gaussian Base Input, Relative Damage
Relative Damage = 9.1e+14
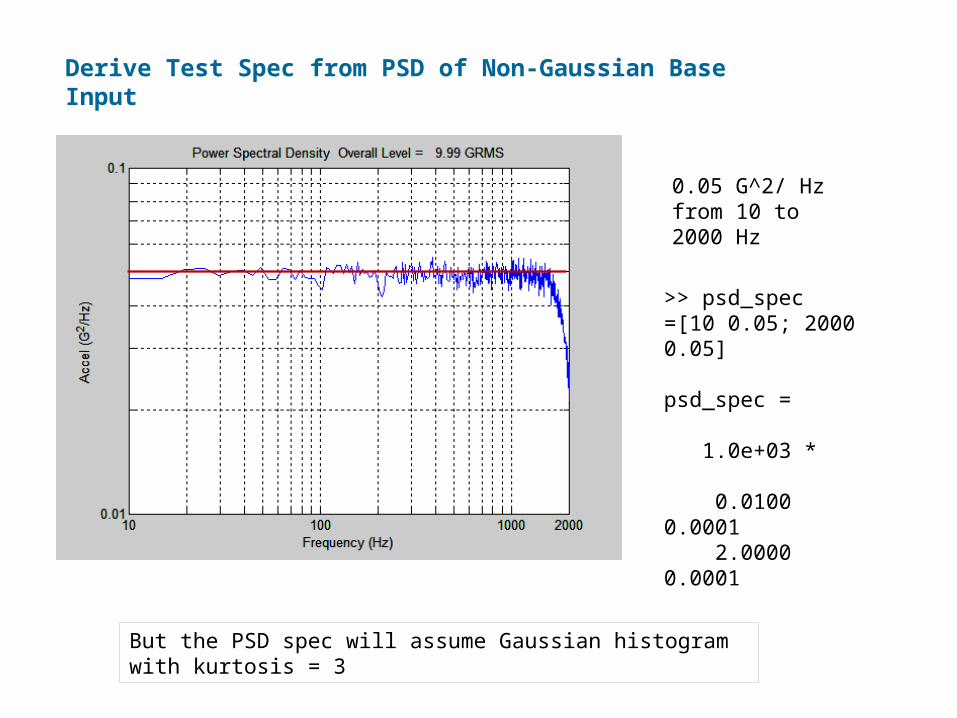
Derive Test Spec from PSD of Non-Gaussian Base Input
0.05 G^2/ Hz from 10 to 2000 Hz
>> psd_spec=[10 0.05; 2000 0.05]
psd_spec =
1.0e+03 *
0.0100 0.0001 2.0000 0.0001
But the PSD spec will assume Gaussian histogram with kurtosis = 3
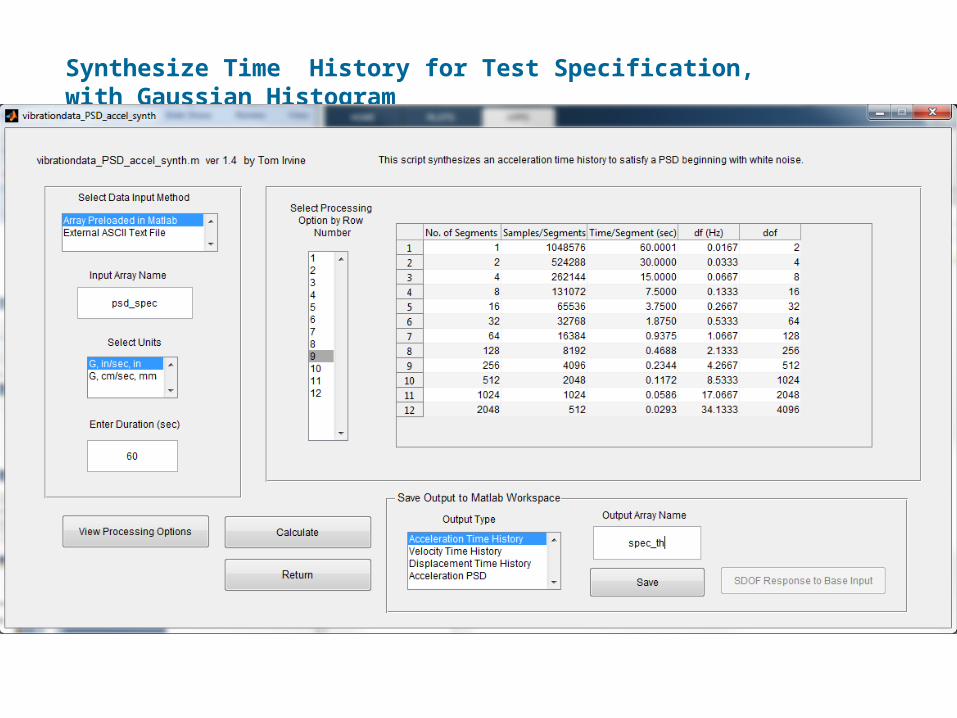
Synthesize Time History for Test Specification, with Gaussian Histogram

Synthesized Time History for Test Specification

Synthesized Time History for Test Specification, Histogram

SDOF Response to Synthesized Time History for Test Specification
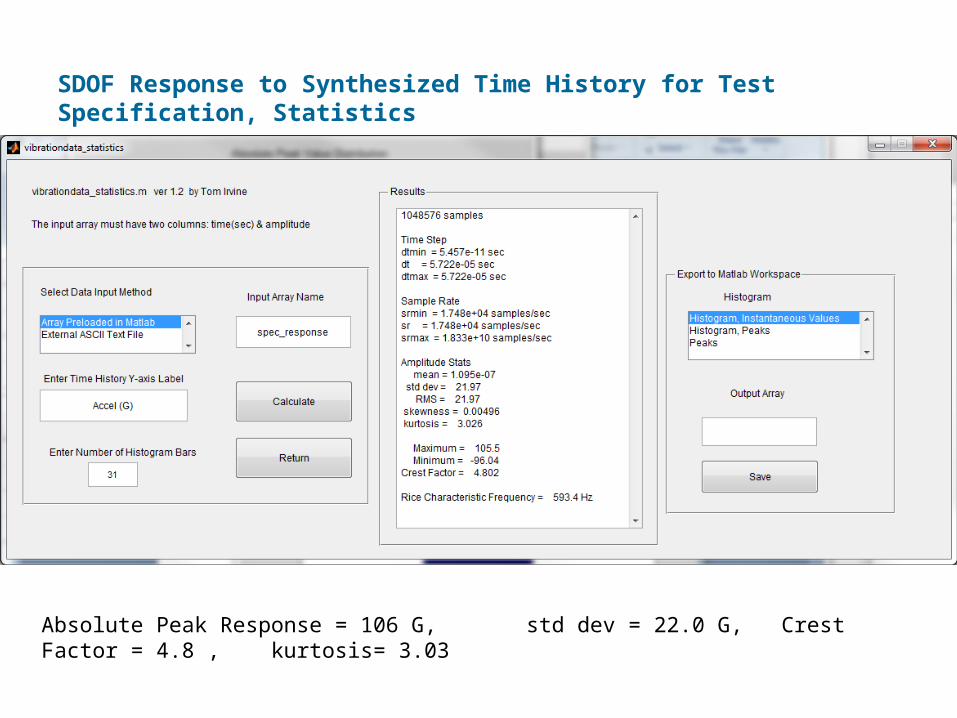
SDOF Response to Synthesized Time History for Test Specification, Statistics
Absolute Peak Response = 106 G, std dev = 22.0 G, Crest Factor = 4.8 , kurtosis= 3.03
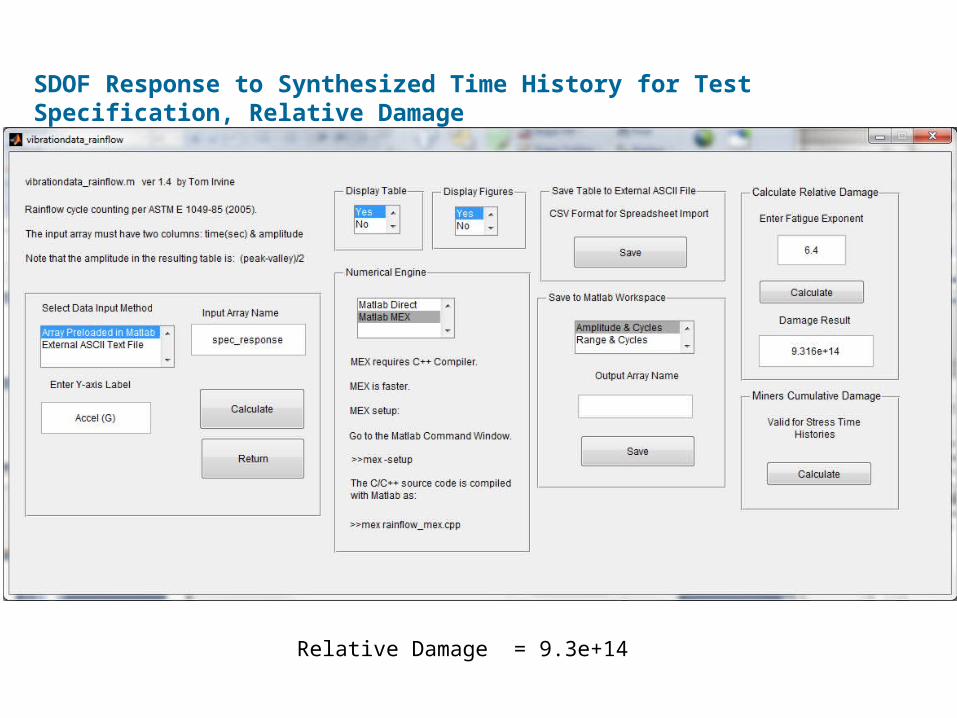
Relative Damage = 9.3e+14
SDOF Response to Synthesized Time History for Test Specification, Relative Damage

Response Parameters by Input Type
Parameter Non-Gaussian Gaussian
GRMS 21.4 22.0
Peak G 115 106
Crest Factor 5.4 4.8
Kurtosis 3.15 3.03
Damage (G^6.4) 9.1e+14 9.3e+14
SDOF System, fn = 600 Hz, Q = 10, b = 6.4
• The non-Gaussian base input causes a higher peak acceleration response
• The Gaussian input yields a slightly higher fatigue damage
Fatigue Damage Spectrum (FDS)
• The fatigue damage spectrum can be calculated if the natural frequency is unknown
• Natural frequency is an independent variable
• The FDS is conceptually similar to the SRS and VRS functions
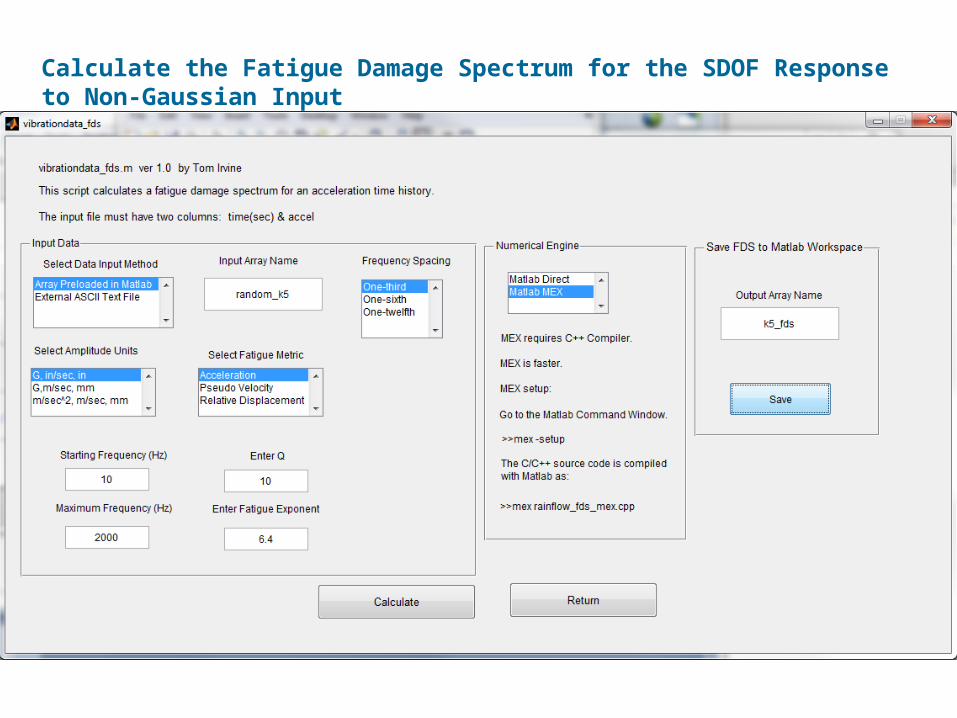
Calculate the Fatigue Damage Spectrum for the SDOF Response to Non-Gaussian Input
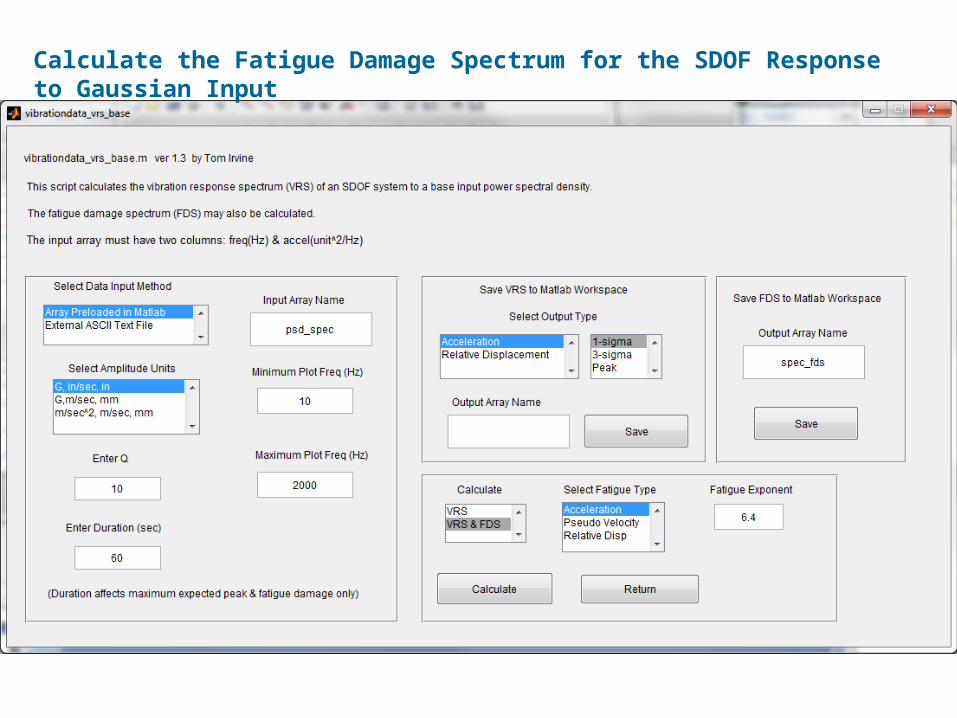
Calculate the Fatigue Damage Spectrum for the SDOF Response to Gaussian Input
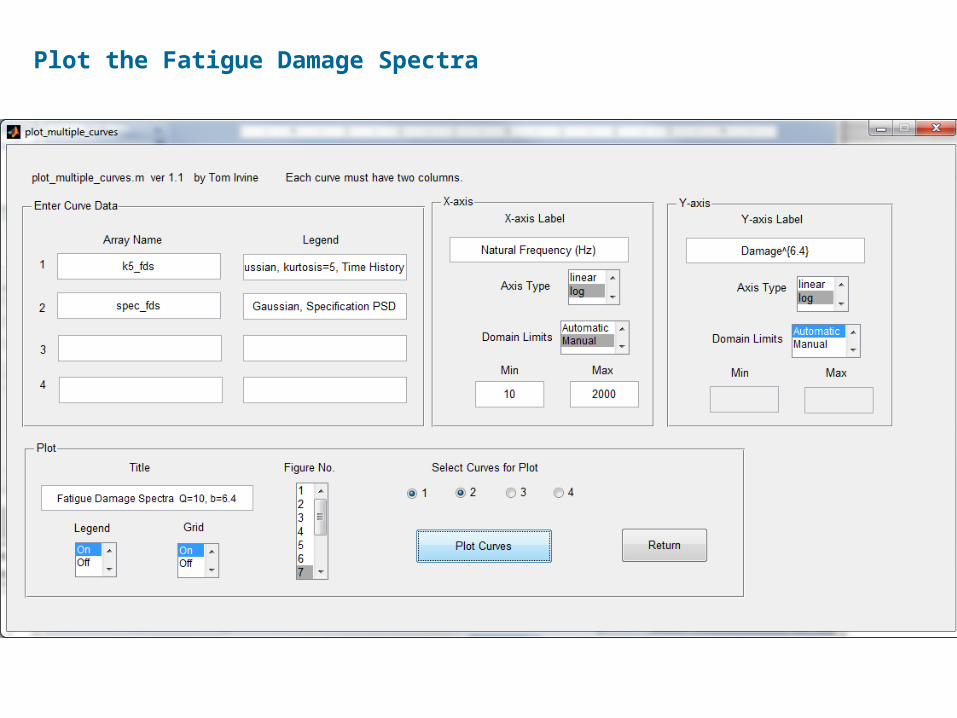
Plot the Fatigue Damage Spectra

Comparing Different Environments in Terms of Damage Potential
In this example, the kurtosis difference did not really affect the damage level. But may not always be the case! So be careful!
Related Documents