Vibrationdata 1 Unit 17 SDOF Response to Applied Force Revision A

Welcome message from author
This document is posted to help you gain knowledge. Please leave a comment to let me know what you think about it! Share it to your friends and learn new things together.
Transcript
Vibrationdata
1
Unit 17
SDOF Response to Applied Force
Revision A
Vibrationdata
2
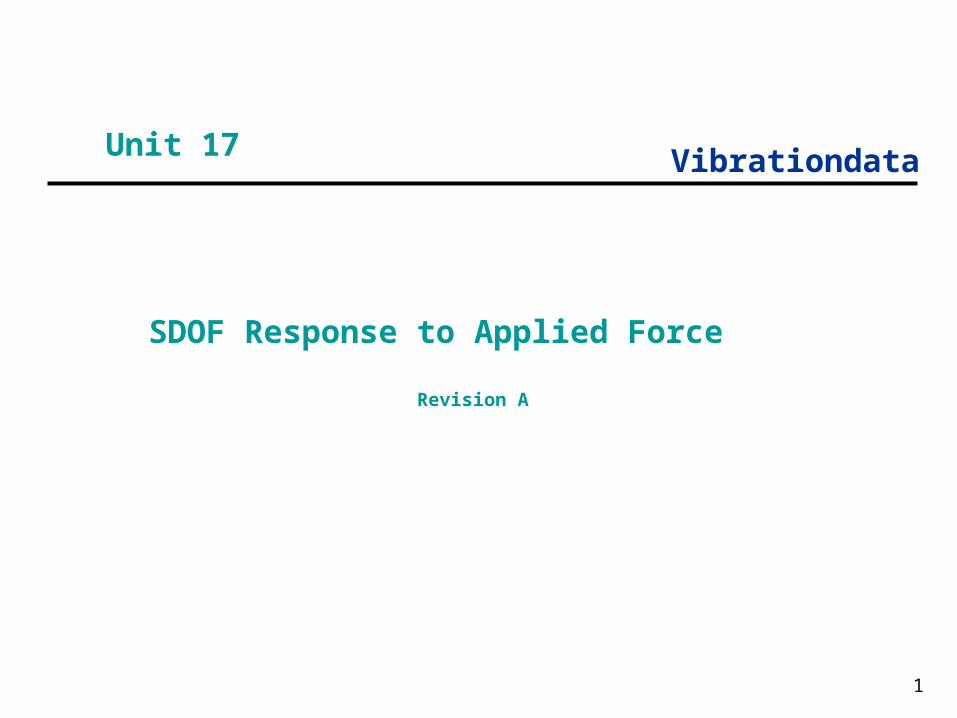
Introduction
SDOF systems may be subjected to an applied force Modal testing, impact or steady-state force Wind, fluid, or gas pressure Acoustic pressure field Rotating or reciprocating parts
Rotating imbalance
Shaft misalignment
Bearings
Blade passing frequencies
Electromagnetic force, magnetostriction

VibrationdataSDOF System, Applied Force
3
m = mass
c = viscous damping coefficient
k = stiffness
x = displacement of the mass
f(t) = applied force
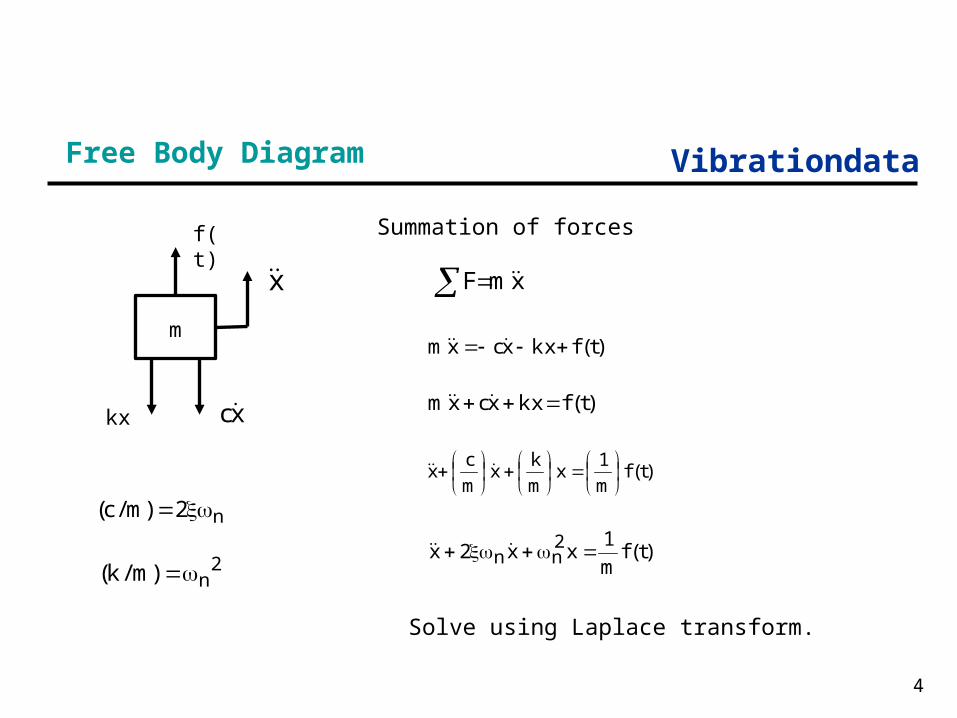
VibrationdataFree Body Diagram
4
Summation of forces
xmF
)t(fkxxcxm
)t(fkxxcxm
)t(fm
1x
m
kx
m
cx
)t(fm
1xx2x 2
nn
n2)m/c(
2n)m/k(
Solve using Laplace transform.
f(t)
m
kx
x
cx
Vibrationdata
5
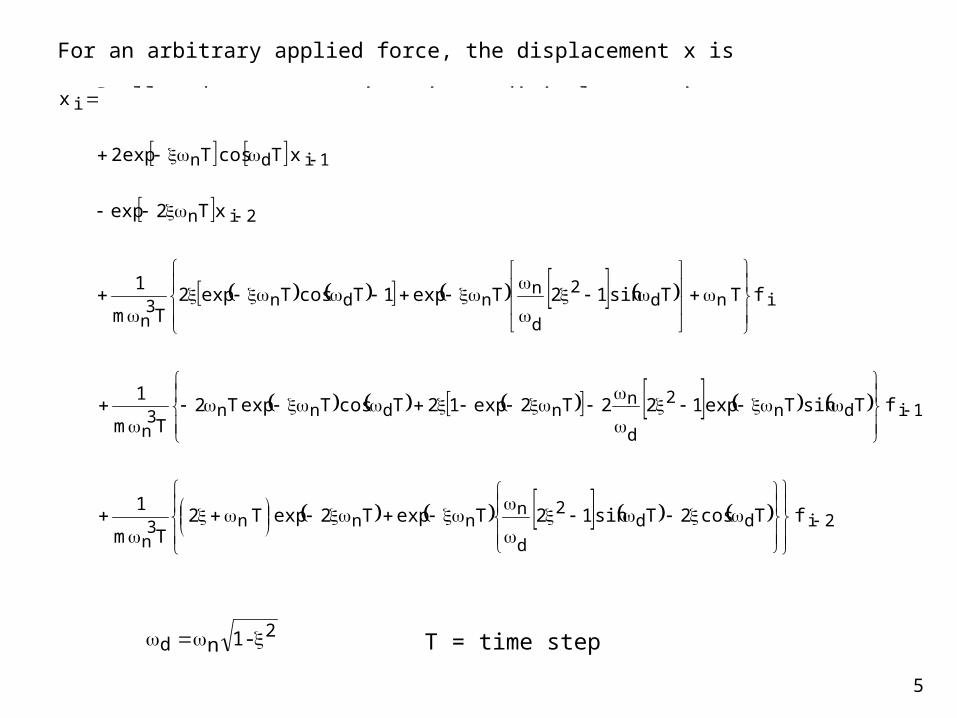
For an arbitrary applied force, the displacement x is
Smallwood-type, ramp invariant, digital recursive filtering relationship
2d -1n
2idd2
d
nnnn3
n
1idn2
d
nndnn3
n
ind2
d
nndn3
n
2in
1idn
i
fTcos2Tsin12TexpT2expT2Tm
1
fTsinTexp122T2exp12TcosTexpT2Tm
1
fTTsin12Texp1TcosTexp2Tm
1
xT2exp
xTcosTexp2
x
T = time step
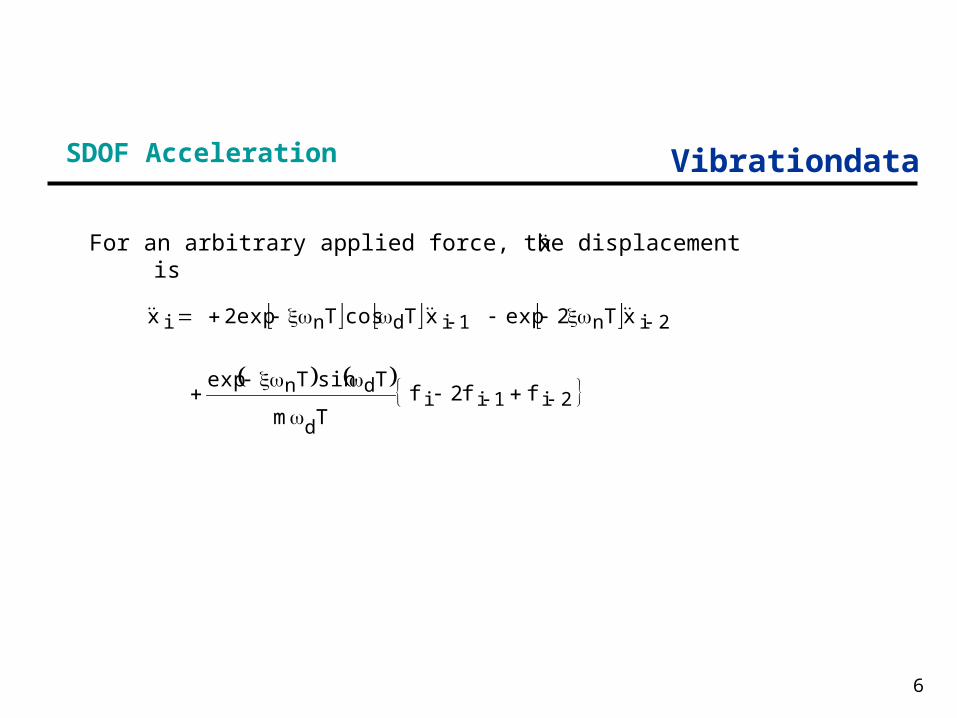
VibrationdataSDOF Acceleration
6
2i1ii
d
dn
2in1idni
ff2fTm
TsinTexp
xT2expxTcosTexp2x
For an arbitrary applied force, the displacement isx

VibrationdataTime Domain Calculation for Applied Force
7
Letfn = 10 HzQ=10mass = 20 lbm
Calculate response to applied force:
F = 4 lbf, f = 10 Hz, 4 sec duration, 400 samples/sec
First: vibrationdata > Generate Signal > Sine Save to Matlab Workspace
Next: vibrationdata > Select Input Data Type > Force > Select Analysis > SDOF Response to Applied Force

VibrationdataApplied Force Time History
8
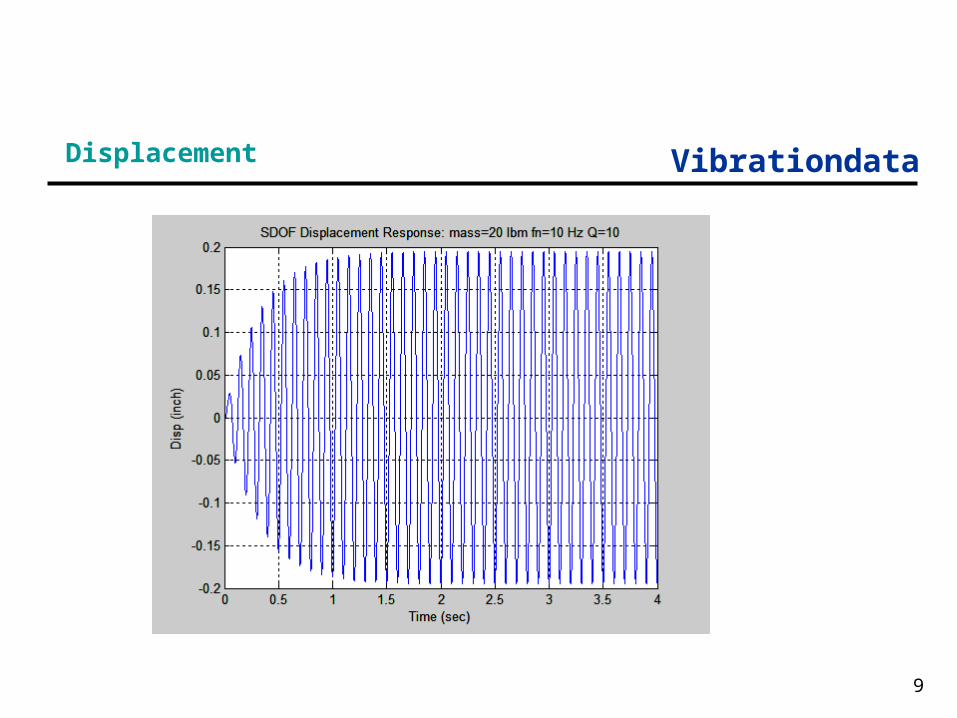
VibrationdataDisplacement
9

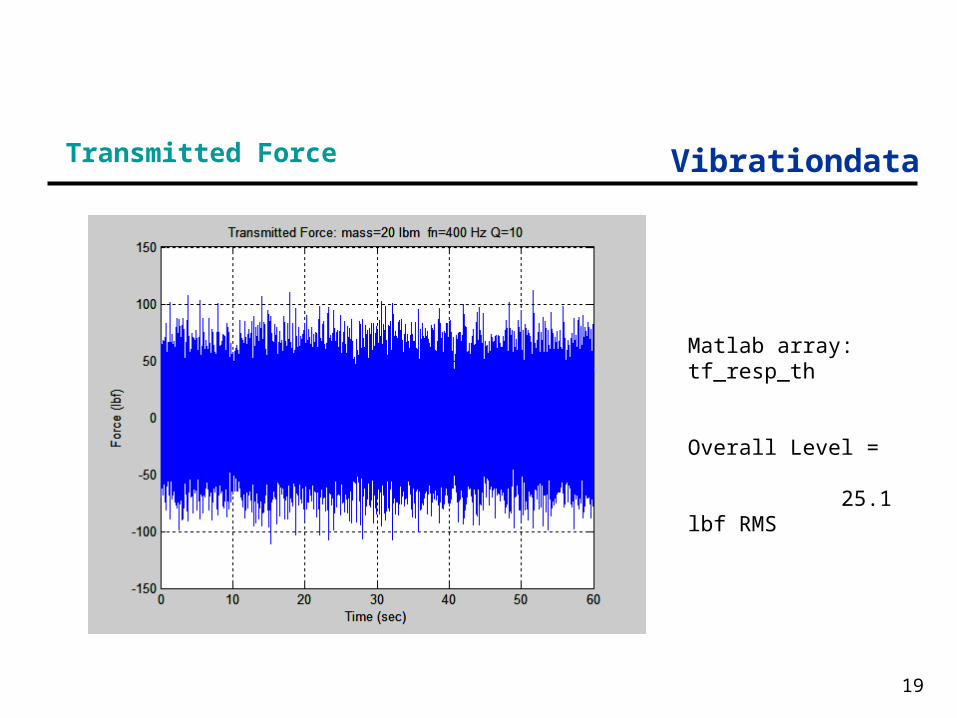
VibrationdataTransmitted Force
10
Special case:
SDOF driven at resonance
Transmitted force = ( Q )( applied force )

Vibrationdata
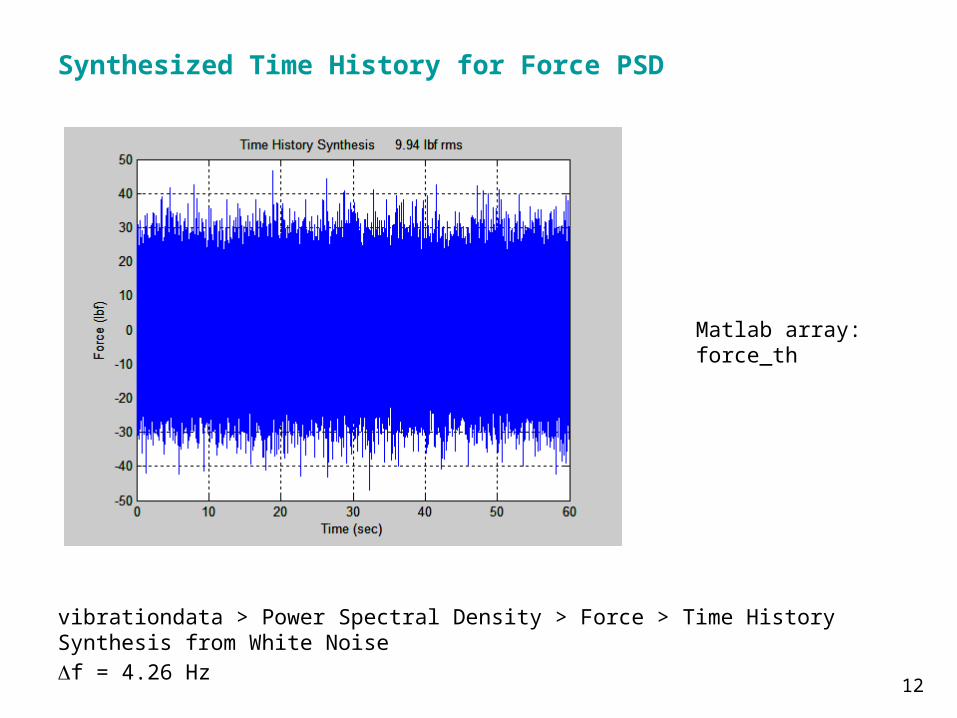
Synthesize Time History for Force PSD
11
Similar process to synthesizing a time history for acceleration PSD.But the integrated force time history does not need to have a mean value of zero.
Frequency (Hz)
Force (lbf^2/Hz)
10 0.1
1000 0.1
Duration = 60 sec
Vibrationdata
12
vibrationdata > Power Spectral Density > Force > Time History Synthesis from White Noisef = 4.26 Hz
Synthesized Time History for Force PSD
Matlab array:force_th
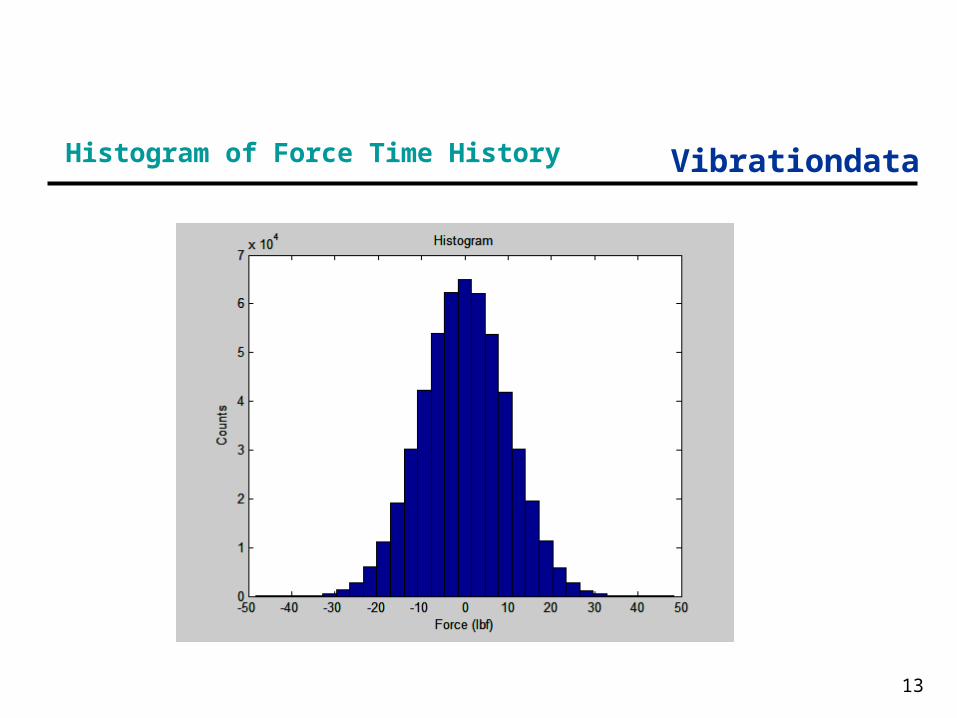
VibrationdataHistogram of Force Time History
13
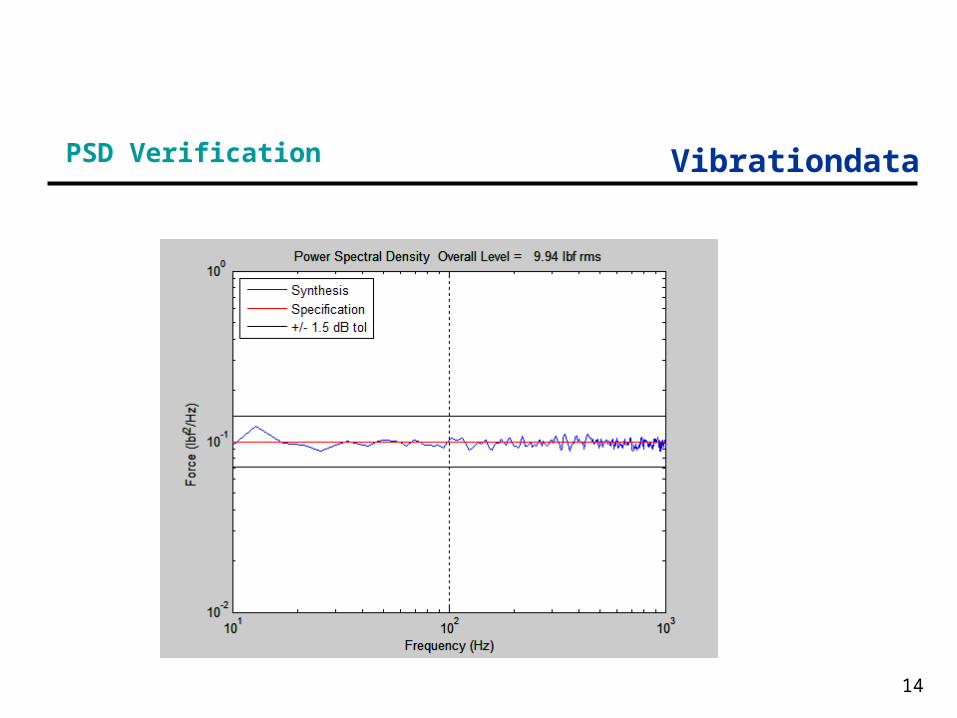
VibrationdataPSD Verification
14
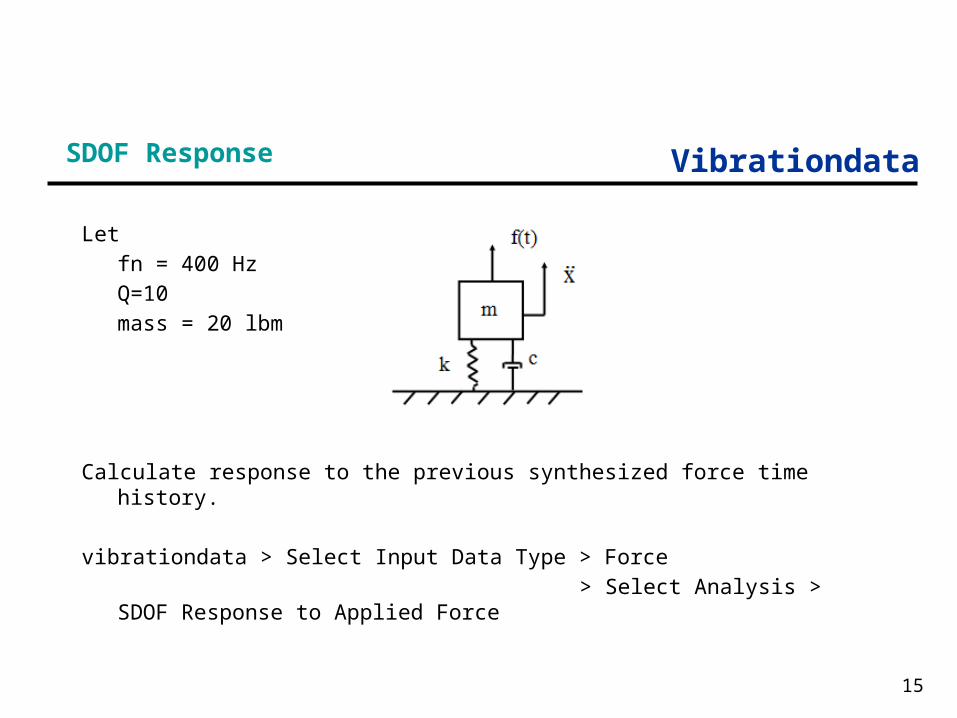
VibrationdataSDOF Response
15
Letfn = 400 HzQ=10mass = 20 lbm
Calculate response to the previous synthesized force time history.
vibrationdata > Select Input Data Type > Force > Select Analysis > SDOF Response to Applied Force

VibrationdataDisplacement
16
Matlab array:disp_resp_th
Overall Level = 7.6e-05 in RMS

VibrationdataVelocity
17
Matlab array:vel_resp_th
Overall Level = 0.19 in/sec RMS
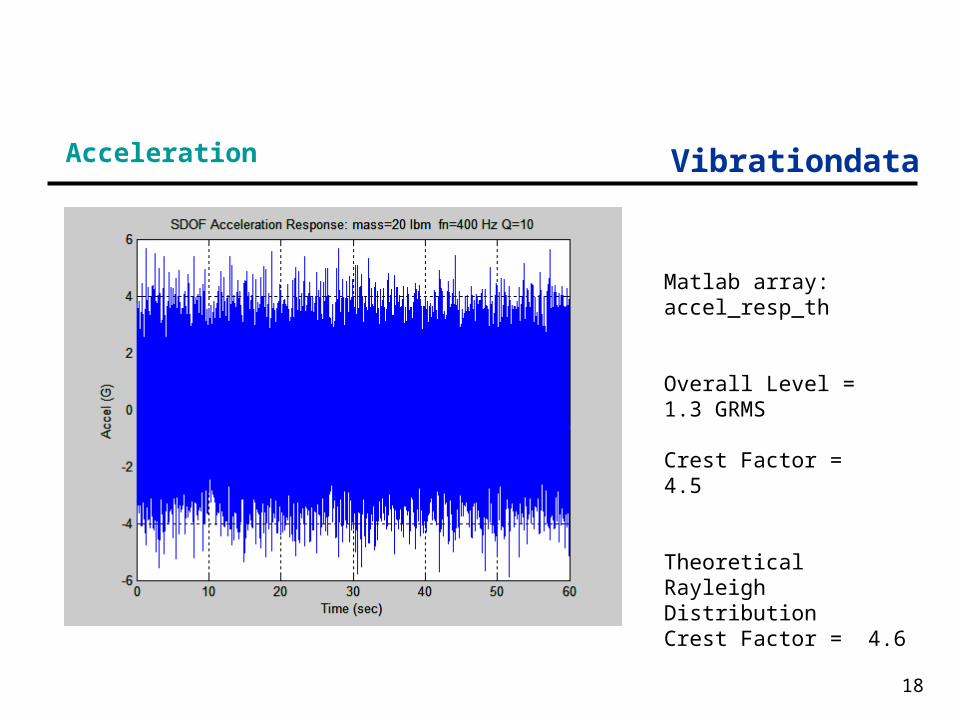
VibrationdataAcceleration
18
Matlab array:accel_resp_th
Overall Level = 1.3 GRMS
Crest Factor = 4.5
Theoretical Rayleigh Distribution Crest Factor = 4.6
Vibrationdata
19
Transmitted Force
Matlab array:tf_resp_th
Overall Level = 25.1 lbf RMS

VibrationdataFrequency Response Function
20
Dimension Displacement/Force Velocity/Force Acceleration/Force
Name Admittance,Compliance,Receptance
Mobility Accelerance,Inertance
Dimension Force/Displacement Force/Velocity Force/Acceleration
Name Dynamic Stiffness Mechanical Impedance Apparent Mass,Dynamic Mass

VibrationdataFRF Estimators
21
)(G
)(GH
FF
FX1
Cross spectrum between force and response divided by
autospectrum of force
Cross spectrum is complex conjugate of first variable Fourier transform times the second variable Fourier transform.
X*F)(GFX
* Denotes complex conjugate
The response can be acceleration, velocity or displacement.
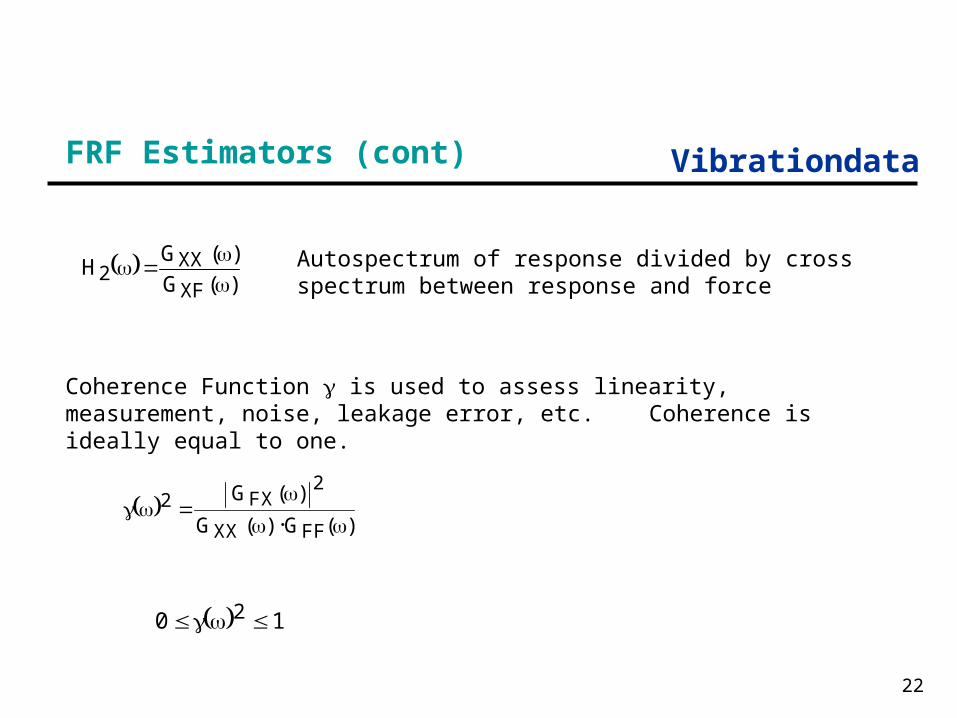
VibrationdataFRF Estimators (cont)
22
)(G
)(GH
XF
XX2
Autospectrum of response divided by cross spectrum between
response and force
Coherence Function is used to assess linearity, measurement, noise, leakage error, etc. Coherence is ideally equal to one.
)(G)(G
)(G
FFXX
2FX2
10 2
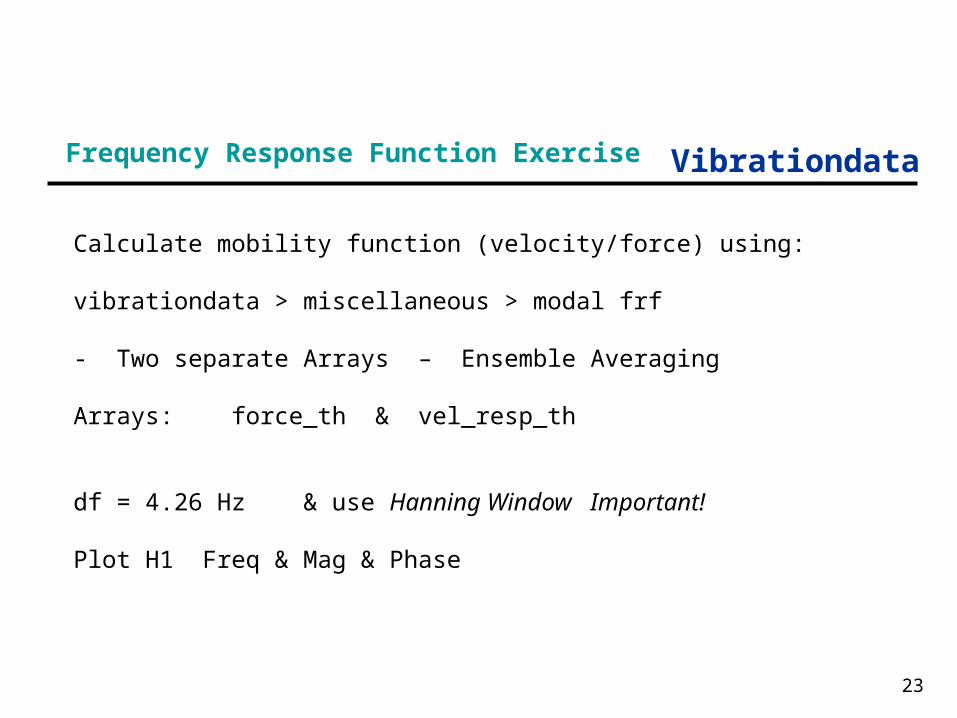
VibrationdataFrequency Response Function Exercise
23
Calculate mobility function (velocity/force) using:
vibrationdata > miscellaneous > modal frf
- Two separate Arrays – Ensemble Averaging
Arrays: force_th & vel_resp_th
df = 4.26 Hz & use Hanning Window Important!
Plot H1 Freq & Mag & Phase
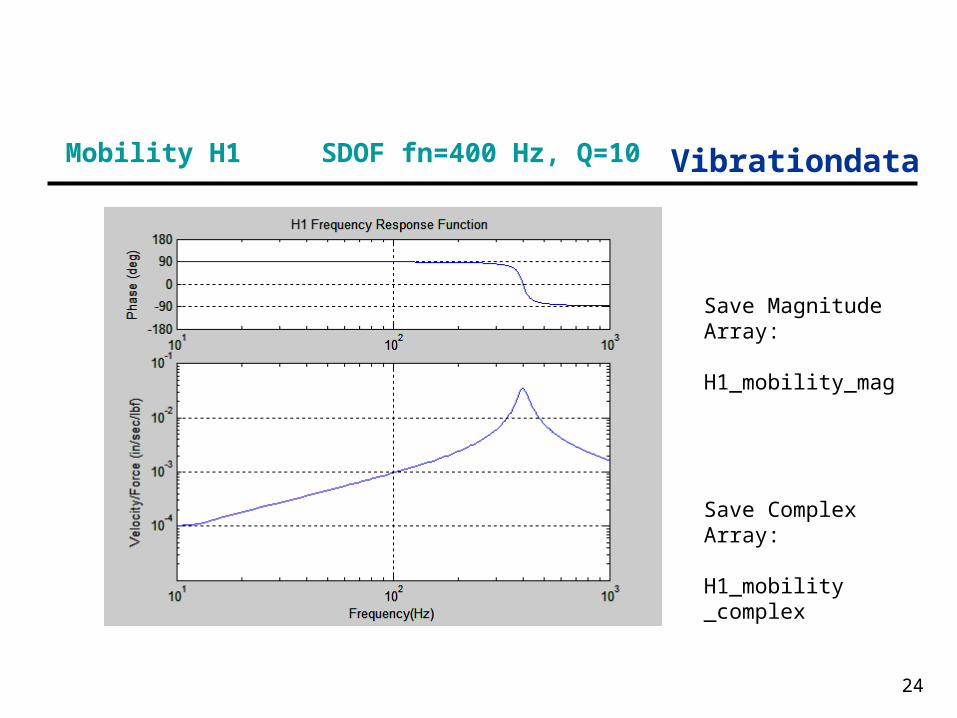
VibrationdataMobility H1 SDOF fn=400 Hz, Q=10
24
Save Magnitude Array:
H1_mobility_mag
Save Complex Array:
H1_mobility _complex

VibrationdataMobility H2 SDOF fn=400 Hz, Q=10
25

VibrationdataCoherence from Mobility
26
Coherence = 0.98 at 400 Hz
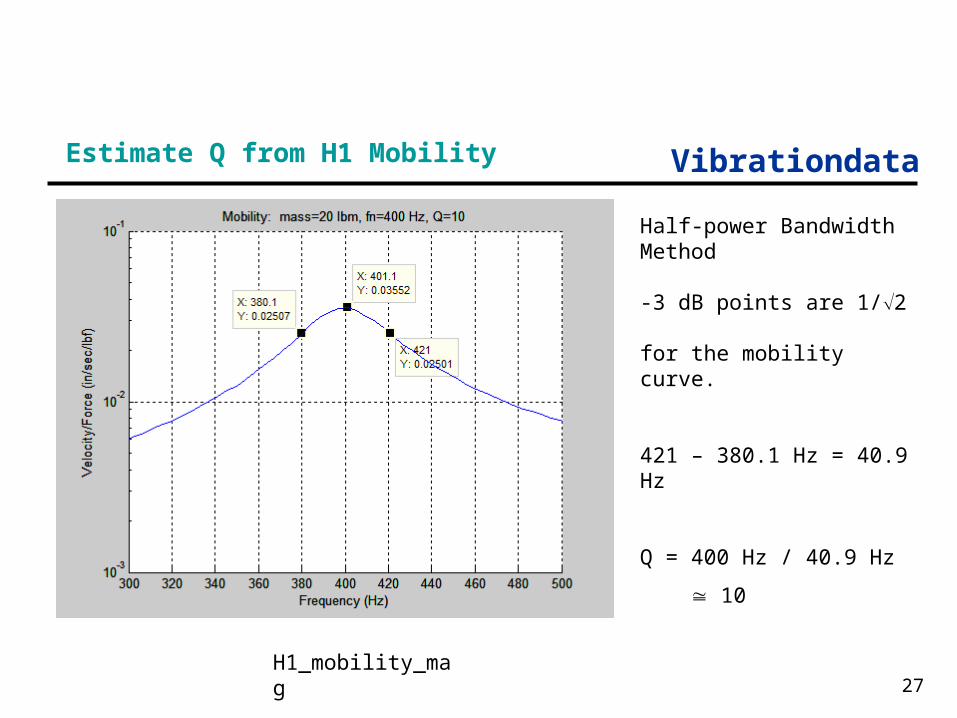
VibrationdataEstimate Q from H1 Mobility
27
Half-power Bandwidth Method
-3 dB points are 1/2
for the mobility curve.
421 – 380.1 Hz = 40.9 Hz
Q = 400 Hz / 40.9 Hz
10
H1_mobility_mag

VibrationdataEstimate Q from H1 Mobility, Curve-fit
28
vibrationdata > Damping Functions > Half-power Bandwidth Curve-fit, Modal FRF
H1_mobility _complex
fn=400 Hz
Q=9.9
Vibrationdata
29
Homework
Repeat the examples in the presentation using the Matlab scripts
Read:
• T. Irvine, Machine Mounting for Vibration Attenuation, Rev B, Vibrationdata, 2000
• Bruel & Kjaer Booklets: Mobility MeasurementModal Testing
Related Documents