1/15/14 VHF Signal Propagation 1/18 www.dxf m.com/Content/propagation.htm The Basics of VHF and UHF Signal Propagation The Electromagnetic Spectrum - The electromagnetic spectrum is a continuum of all electromagnetic waves arranged according to frequency and wavelength. Electromagnetic radiation is classified into types according to the frequency and length of the wave. Visible light that comes from a lamp in your house or radio waves transmitted by a radio station are just two of the many types of electromagnetic radiation. In order of increasing frequency the electromagnetic spectrum consists of radio waves, microwaves, infrared radiation, visible light, ultraviolet radiation, X-rays and gamma rays. An electromagnetic wave consists of the electric and magnetic components. These components repeat or oscillate at right angles to each other and to the direction of propagation, and are in phase with each other. All electromagnetic energy, regardless of frequency or wavelength, passes through a perfect vacuum at the speed of light (300 million meters per second) in the form of sinusoidal waves.

VHF Signal Propagation
Nov 28, 2015
VHF Signal Propagation
Welcome message from author
This document is posted to help you gain knowledge. Please leave a comment to let me know what you think about it! Share it to your friends and learn new things together.
Transcript

1/15/14 VHF Signal Propagation
1/18www.dxf m.com/Content/propagation.htm
The Basics of VHF and UHF Signal Propagation
The Electromagnetic Spectrum - The electromagnetic spectrum is a continuum of all
electromagnetic waves arranged according to frequency and wavelength. Electromagneticradiation is classified into types according to the frequency and length of the wave. Visible light
that comes from a lamp in your house or radio waves transmitted by a radio station are just two
of the many types of electromagnetic radiation. In order of increasing frequency the
electromagnetic spectrum consists of radio waves, microwaves, infrared radiation, visible light,
ultraviolet radiation, X-rays and gamma rays.
An electromagnetic wave consists of the electric and magnetic components. These components
repeat or oscillate at right angles to each other and to the direction of propagation, and are in
phase with each other.
All electromagnetic energy, regardless of frequency or wavelength, passes through a perfect
vacuum at the speed of light (300 million meters per second) in the form of sinusoidal waves.

www.dxf m.com/Content/propagation.htm
The Radio Spectrum - As radio and TV DXers, we are of course most interested in the"radio" portion of the electromagnetic spectrum, which exists between the frequencies of 10
Kilohertz and 300 Gigahertz, with wavelengths from 30,000 kilometers to 1 millimeter. As the
frequency of a signal is increased, its wavelength becomes shorter. For example, an
electromagnetic wave at 750 KHz in the middle of the AM broadcast band has a wavelength of
approximately 400 meters. As we increase the frequency to 100 MHz in the middle of the FM
band, the wavelength decreases to about 3 meters.
The frequencies of interest to the FM and TV DXer are situated within the Very High
Frequency (VHF) and Ultra High Frequency (UHF) regions of the radio spectrum. The VHF
portion of the radio spectrum is between 30 and 300 Megahertz, while UHF is situated between
300 and 3,000 Megahertz. The frequencies used for the FM band and television channels 2
through 13 lie within the VHF portion of the electromagnetic spectrum, while television channels
14 through 83 are within the UHF portion of the spectrum.
Signal Propagation - When we refer to signal propagation, we are talking about the radiosignal getting from one place to another, presumably from the station's transmitting antenna to the
receiver's antenna. Signals at VHF and UHF frequencies can be propagated by a variety ofmeans or "modes". Depending on the particular mode that is dominate at the time of reception,
the distances covered by VHF and UHF signals can extend hundreds or even thousands ofmiles. Here are some of the more common modes for VHF and UHF propagation:
Ground Wave - Ground wave propagated signals are signals that, generically speaking, travel
along or close to the Earth's surface on their path between the transmitting and receivingantennas. Ground wave signals are the "local" signals we receive -- the signals that are alwayspresent at your location, day and night, regardless of any any particular atmospheric or
ionospheric conditions.
The ground wave actually consists of two components, the surface wave and the space wave. The terms "surface wave", "space wave" and "ground wave" are often used interchangeably,
even though it's not exactly correct to do so.
The surface wave travels out from the transmitting antenna, remaining in contact with the Earth'ssurface. The surface wave is primarily responsible for the reception of local AM broadcast
signals. The strength of the surface wave diminishes rapidly with distance because the Earth is anot a particularly good electrical conductor. Also, the attenuation of surface wave signals
increases rapidly as the signal frequency is increased. At FM and TV frequencies the surfacewave is virtually nonexistent. The surface wave is generally not a factor in our reception of FM
and TV signals, local or otherwise.
Reception of local FM and TV signals relies almost entirely upon the space wave component ofthe ground wave. The space wave signal path is the so-called "line-of-sight" path between thetransmit and receive antennas. The curvature of the Earth is the primary limiting factor for the
maximum distance a space wave propagated signal can travel. The space wave will traveloutward from the transmitting antenna until it reaches the horizon. Beyond that point, the space
wave is blocked by the Earth itself, and reception is no longer possible for a receiver located onthe surface of the Earth (as most are). It's important to note, however, that the optical horizon
(the horizon you can see) and the "radio horizon" are not quite the same. In reality, the spacewave does not quite travel in a straight line as it moves away from the transmitting antenna.
Instead, the signal travels in a slightly downward curved path that keeps it nearer to the Earth's
1/15/14 VHF Signal Propagation
3/18www.dxf m.com/Content/propagation.htm
surface, thus extending its path a little further than the optical horizon.
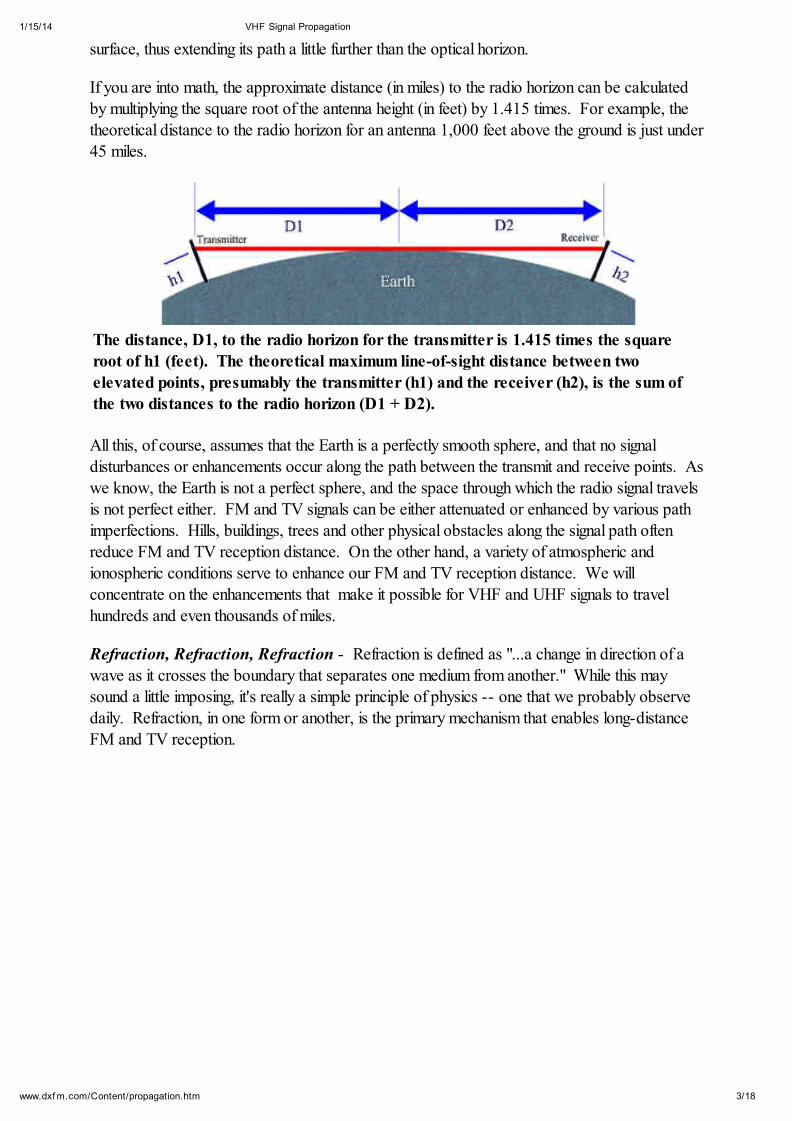
If you are into math, the approximate distance (in miles) to the radio horizon can be calculatedby multiplying the square root of the antenna height (in feet) by 1.415 times. For example, the
theoretical distance to the radio horizon for an antenna 1,000 feet above the ground is just under45 miles.
The distance, D1, to the radio horizon for the transmitter is 1.415 times the squareroot of h1 (feet). The theoretical maximum line-of-sight distance between twoelevated points, presumably the transmitter (h1) and the receiver (h2), is the sum of
the two distances to the radio horizon (D1 + D2).
All this, of course, assumes that the Earth is a perfectly smooth sphere, and that no signaldisturbances or enhancements occur along the path between the transmit and receive points. As
we know, the Earth is not a perfect sphere, and the space through which the radio signal travelsis not perfect either. FM and TV signals can be either attenuated or enhanced by various path
imperfections. Hills, buildings, trees and other physical obstacles along the signal path oftenreduce FM and TV reception distance. On the other hand, a variety of atmospheric and
ionospheric conditions serve to enhance our FM and TV reception distance. We willconcentrate on the enhancements that make it possible for VHF and UHF signals to travelhundreds and even thousands of miles.
Refraction, Refraction, Refraction - Refraction is defined as "...a change in direction of awave as it crosses the boundary that separates one medium from another." While this may
sound a little imposing, it's really a simple principle of physics -- one that we probably observe
daily. Refraction, in one form or another, is the primary mechanism that enables long-distance
FM and TV reception.

1/15/14 VHF Signal Propagation
4/18www.dxf m.com/Content/propagation.htm
Refraction explains the apparent "bending" of anobject when it is partly immersed in water and
viewed from above the surface.
As stated earlier, a radio wave travels through a perfect vacuum at the speed of light (300million meters per second). However, when the medium through which the wave travels is not a
perfect vacuum, the wave's travel is slowed. For example, an electromagnetic wave travels
slower through air or water than it does through a perfect vacuum.
Refraction comes into play when a wave enters a new medium at an angle of less than 90°. As
the wave enters the new medium, a change in the wave's speed occurs sooner on one side of the
wave than on the other. This causes the wave's direction of travel to be bent.
Under normal conditions, a signal that is not blocked or obstructed simply travels in a straight
line out into space, never to return to Earth again. However, various atmospheric conditions
often cause the normal path of FM and TV signals to be bent downward, returning the signal tothe surface of the Earth, sometimes a great distance from its point of origin.
Tropospheric Enhancements - Within the broad classification of tropospheric enhancement,
there are several different and distinct propagation modes that make it possible for FM and TVsignals to travel far greater distances than the normal radio line-of-sight horizon.
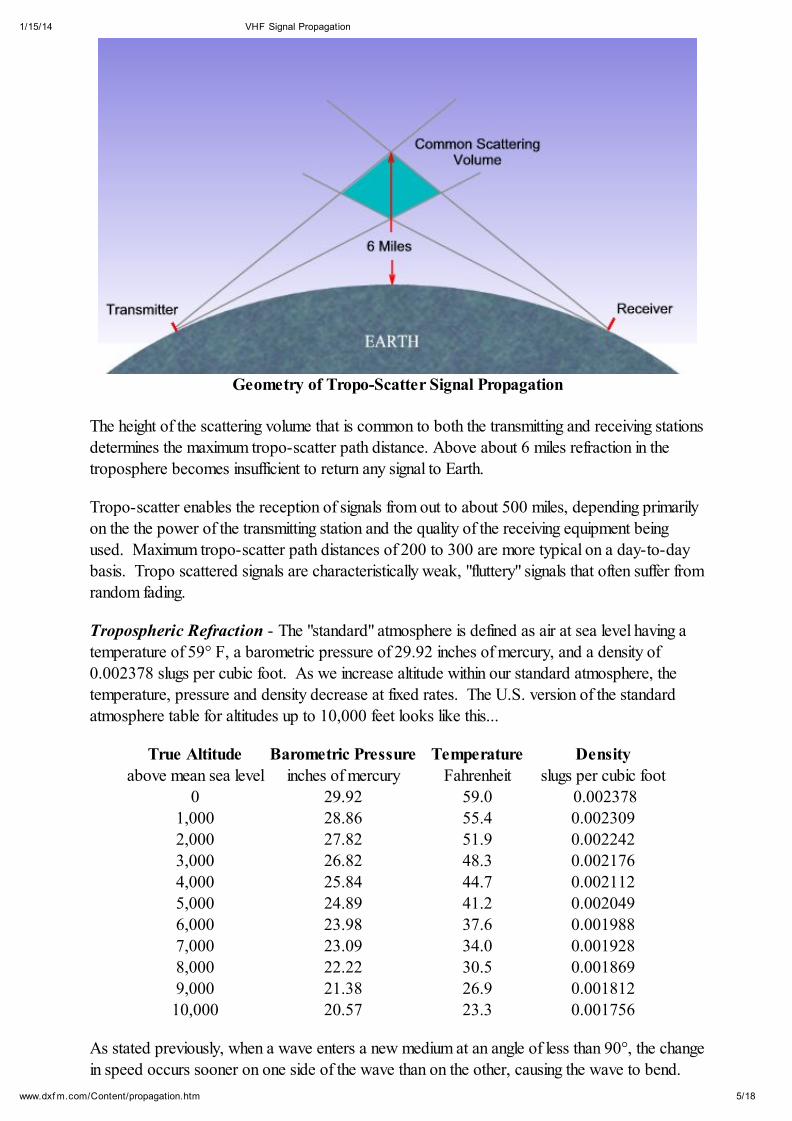
Tropospheric Scatter - Tropospheric scatter is the most common form of tropospheric
enhancement. Tropo-scatter is always present to some degree just about everywhere.Tropospheric scatter at FM and TV frequencies is caused when the paths of radio signals are
altered by slight changes in the refractive index in the lower atmosphere caused by air
turbulence, and small changes in temperature, humidity and barometric pressure. The signal isscattered in random fashion. The tiny portion of the transmitted signal that is scattered forward
and downward from what is called the "common scattering volume" is responsible for signal
paths longer than the normal line-of-sight horizon.
1/15/14 VHF Signal Propagation
5/18www.dxf m.com/Content/propagation.htm
Geometry of Tropo-Scatter Signal Propagation
The height of the scattering volume that is common to both the transmitting and receiving stations
determines the maximum tropo-scatter path distance. Above about 6 miles refraction in thetroposphere becomes insufficient to return any signal to Earth.
Tropo-scatter enables the reception of signals from out to about 500 miles, depending primarily
on the the power of the transmitting station and the quality of the receiving equipment beingused. Maximum tropo-scatter path distances of 200 to 300 are more typical on a day-to-day
basis. Tropo scattered signals are characteristically weak, "fluttery" signals that often suffer from
random fading.
Tropospheric Refraction - The "standard" atmosphere is defined as air at sea level having a
temperature of 59° F, a barometric pressure of 29.92 inches of mercury, and a density of
0.002378 slugs per cubic foot. As we increase altitude within our standard atmosphere, thetemperature, pressure and density decrease at fixed rates. The U.S. version of the standard
atmosphere table for altitudes up to 10,000 feet looks like this...
True Altitudeabove mean sea level
Barometric Pressureinches of mercury
TemperatureFahrenheit
Densityslugs per cubic foot
0 29.92 59.0 0.002378
1,000 28.86 55.4 0.002309
2,000 27.82 51.9 0.0022423,000 26.82 48.3 0.002176
4,000 25.84 44.7 0.002112
5,000 24.89 41.2 0.0020496,000 23.98 37.6 0.001988
7,000 23.09 34.0 0.001928
8,000 22.22 30.5 0.001869
9,000 21.38 26.9 0.00181210,000 20.57 23.3 0.001756
As stated previously, when a wave enters a new medium at an angle of less than 90°, the change
in speed occurs sooner on one side of the wave than on the other, causing the wave to bend.

1/15/14 VHF Signal Propagation
6/18www.dxf m.com/Content/propagation.htm
Close to Earth, the medium through which radio waves travel is air. The air through which the
radio wave travels is an ever changing medium due to changes in temperature, barometric
pressure and density. The "refractive index" of air in a standard atmosphere is sufficient to benda radio signal ever so slightly downward, accounting for the fact that "line-of-sight" signals travel
just a little further than the optical horizon.
An illustration of why refracted signals go further than the optical line-of-sight.
What happens when the atmosphere does not follow the standard model? Let's say everything
is "normal" until we get to 4,000 feet, where we encounter a rise in temperature instead of the
normal decrease -- a condition known as a temperature inversion. The sudden discontinuity in
the medium through which our radio wave travels will have a higher refractive index than our
standard atmosphere model. In other words, our radio signal will be bent at a sharper angle
where it encounters the discontinuity. If the bending is in a downward direction (back towardthe surface of the Earth), the normal range of the radio signal will be extended.
Various weather conditions increase the refractive index of the atmosphere, thus extending signal
propagation distances. Stable signals with good signal strength from 500+ miles away are not
uncommon when the refractive index of the atmosphere is fairly high.
Tropospheric Ducting - This is where things start getting interesting for the FM and TV
DXer. Strong temperature inversions with very well defined boundaries sometimes form from ashigh as several thousand feet above the surface of the Earth. If the inversion is strong enough, a
signal crossing the boundary into the inversion will be bent sufficiently to return it to Earth. The
inversion boundary layer and the surface of the Earth form the upper and lower walls of a "duct"
that acts much like an open-ended wave guide. Signals "trapped" in the duct follow the
curvature of the Earth, sometimes for hundreds or even thousands of miles. In the tropics and
over large bodies of water, strong inversions that cover large geographic areas are quite
common, and stable ducts can remain in tact for days on end. This form of ducting isresponsible for fairly reliable propagation between California and Hawaii at VHF and higher
frequencies.

An illustration of tropospheric ducting.
While somewhat less common, ducts sometimes form between atmospheric boundary layers at
much higher altitudes, with the upper boundary having an altitude as high as 10,000 feet or
more. The upper refractive layer bends signals downward, while the lower refractive boundary
bends the signals upward, forming a signal-trapping duct that acts much like a wave guide.
When this condition exists, FM band signals can travel thousands of miles. Indeed, there is no
theoretical limit to the distance a signal can travel via tropospheric ducting. With respect to the
receiving station, tropospherically ducted signals will usually come from a geographicallyselective area. A distant station may be heard in favor of a closer station on the same
frequency. Sometimes conditions are such that multiple ducts form, bringing in distant stations
from many different areas at the same time.
An illustration of a high-altitude tropospheric duct.
An interesting characteristic of this form of ducting is that both the transmitting and receiving
antennas must be inside of the duct to gain the maximum signal enhancement. A receiving
antenna located outside of the duct will hear little or no signal from a transmitting antennalocated inside the duct. For this type of duct to be useful to us, the signal must get in and exit
the duct somewhere along the signal path. This can occur if the ends of a duct are open at each
end, or through "holes" that form along the bottom layer of the duct.
A basic principal of radio is that the wavelength of a signal gets shorter as the frequency of the
signal is increased. Because of this, the size of the tropospheric duct determines the lowest
signal frequency that it can successfully propagate. This is knows as the Lowest Usable
Frequency or LUF of the duct. A physically small duct, a duct with its upper and lowerboundaries close together, will propagate only higher frequency signals with very short

www.dxf m.com/Content/propagation.htm
wavelengths. As the distance between the boundaries of the duct increases, the signal frequency
the duct will propagate decreases. In other words, a larger duct will accommodate a lowerfrequency signal having a physically longer wavelength. It's possible for a duct to form that only
supports signal propagation at UHF television frequencies, while not effectively passing anything
in the VHF television or FM bands.
Ducted signals from 900 - 1,000 miles are fairly common, but it's more common for ducted
signals to travel 500 - 800 miles. Ducted signals are typically quite strong, sometimes so strong
that they can cause interference to local signals on the same frequency.
Weather Suitable for a Duct - Tropospheric ducting most often occurs because of a dramatic
increase in temperature at higher altitudes. If the temperature inversion layer has a lower
humidity than the air below or above it, the refractive index of the layer will be enhanced further.
There are several common weather conditions that often bring about strong temperature
inversions.
While not usually the cause of strong ducting, radiation inversions can bring about pronounced
signal enhancement, extending the DX range up to a few hundred miles. This is probably the themost common and widespread form of inversion a DXer is likely to encounter on a regular
basis.
A radiation inversion forms over land after sunset. The Earth cools by radiating heat into space.
This is a progressive process where the radiation of surface heat upwards causes further cooling
at the Earth's surface as cooler air moves in to replace the upward moving warm air. At higher
altitudes the air tends to cool more slowly, thus setting up the inversion. This process oftencontinues all the way through the night until dawn, sometimes producing inversion layers at 1,000
to 2,000 feet above the ground.
Radiation inversions are most common during the summer months on clear, calm nights. The
effect is diminished by blowing winds, cloud cover and wet ground. Radiation inversions are
often more pronounced in dry climates, in valleys and over large expanses of flat, open ground.
Another meteorological process called "subsidence" often produces strong ducting conditionsand excellent DX. Subsidence is the process of sinking air that becomes compressed and
heated as it descends. This process often causes strong temperature inversions to form at
altitudes ranging from 1,000 feet to as high as 10,000 feet. Subsidence is commonly produced
by large, slow-moving high-pressure zones (anticyclones). These almost stationary high-
pressure zones often form over the eastern half of the United States during the late summer and
early fall months. They usually move out of Canada, traveling toward the southeast. As the
high-pressure zone stalls over the Midwest, strong inversions form, bringing outstanding 1,000+mile DX that can last for days at a time. This condition is most common in the Southeastern
states and lower Midwest. It also shows up from time to time in the upper Midwest and East
Coast states. It rarely shows up in the Western states.
The following weather maps are from September 5 and 6 of 2001. They provide a real-world
illustration of tropospheric ducting associated with a slow moving high-pressure zone.

1/15/14 VHF Signal Propagation
www.dxf m.com/Content/propagation.htm
On September 5th, 2001, a very slow moving high-pressure zone was pushing out of Canada
toward the southeast. As the high was centered over Northern Michigan, we observed
excellent tropospheric DX conditions here in Lexington, Kentucky. Strong FM and TV signals
out of Minnesota, North and South Dakota, Iowa, and Illinois were plentiful throughout the
day. Signals from 800-900 miles were common.
On September 6, 2001, a full 24 hours later, the sluggish high pressure zone had moved only as
far as western New York. Here in Lexington, our DX zone had expanded east. The 800-900mile TV and FM signals from the Midwest were still present, but strong signals from the

1/15/14 VHF Signal Propagation
10/18www.dxf m.com/Content/propagation.htm
Northeast as far away as central Ontario were also added to the mix. This excellent DX
"opening" lasted almost a full 48 hours.
In the northern hemisphere, the strongest signals and longest signal paths will usually be
observed to the south of the high-pressure center. In the southern hemisphere, the reverse is
true -- the best signal paths will be to the north of the high-pressure center. Subsidence ducting
is often intensified during the evening and early morning hours when the effects of radiationinversions are added to the mix.
Well positioned warm and cold fronts sometimes bring about ducting and enhanced DX
conditions.
A warm front is the surface boundary between a mass of warm air flowing over an area of
cooler, relatively stationary air. Enhanced DX conditions will often be observed out to
approximately 100 miles ahead of the advancing front. The best paths will be along a lineparallel to the frontal boundary.
Likewise, cold fronts can also produce some nice DX conditions. A cold front is the surface
boundary between a mass of cooler air that pushes itself under a mass more stationary warm
air. This forces the warm air up and behind the advancing front. The ducts produced by a
passing cold front are often unstable. The best signal paths will be behind and along a line that's
parallel to the advancing front.
On November 9, 2001, this cold front and well-positioned high-pressure zone (over southeast
Kansas) produced a full day of outstanding tropospheric FM and TV DX here in Lexington.
We were solidly open to Arkansas, Alabama, Louisiana and Mississippi. Path distances were
upwards of 600 miles with very strong signals.

11/18
On December 7, 2001, this well positioned cold front produced excellent DX paths into eastern
Tennessee. This very geographically selective opening didn't produce very long signal paths, buteven low power stations were heard with very strong signals.
Since the tropospheric enhancements we've covered so far are all weather related, you can see
why it's important for the DXer to pay attention to day-to-day weather conditions.
Sporadic E - This is probably the most interesting and exciting forms of signal enhancement for
the FM and TV DXer. Highly ionized patches or "clouds" occasionally form in the E region ofthe ionosphere at altitudes between approximately 50 and 70 miles. We call these sporadic Eclouds. Sporadic E clouds are usually fairly small in size, but larger clouds or multiple clouds
often form during substantial openings. These clouds often, but not always, travel from theirpoint of origin to the north and northwest at speeds up to several hundred miles per hour.
It's interesting to note that after almost 70 years of study the true cause for sporadic E is stillunknown. There are many different theories as to how and why sporadic E clouds form.
It was once believed that the formation of sporadic E clouds was directly related to the eleven
year solar (sunspot) cycle. You'll still see that theory expressed in some text books even thoughoverwhelming evidence suggests that this belief is wrong. There seems to be no correlation
between the ionization level or formation of sporadic E clouds and the eleven year sunspot cycle- at least not in the mid latitudes away from the geomagnetic equator and poles. It was noted all
the way back in the 1930s and 1940s that the formation and intensity of mid-latitude sporadic Eclouds does not substantially vary over the course of the eleven year solar cycle.
There is evidence to suggest that the primary cause of sporadic E cloud formation is wind shear,
a purely weather-related phenomenon. Intense high altitude winds, traveling in oppositedirections at different altitudes, produce wind shear. It is believed that these wind shears, in the
presence of Earth's geomagnetic field, cause ions to be collected and compressed into a thin,
12/18
ion-rich layers, approximately one-half to one mile in thickness. The area of these patches can
vary from a few square miles to hundreds or even thousands of square miles.
Along the same line is the theory that sporadic E clouds are formed in the vicinity of
thunderstorms by the intense electrical activity associated with the storm. There is often (but notalways) a correlation between thunderstorm activity and the formation of sporadic E clouds,
enough to make this theory very tantalizing. However, strong thunderstorms often form alongfrontal boundaries, and intense wind sheer is usually found along the same frontal boundaries thatproduce thunderstorms. Likewise, strong sporadic E activity often appears when there is no
apparent thunderstorm activity along or near the propagation path.
Yet another emerging theory suggests that sporadic E clouds are formed by concentrations of
meteoric debris. Again, there seems to be a strong correlation between meteor shower activityand the number and intensity of sporadic E clouds.
The point is, nobody has presented a definitive explanation for how and why sporadic E clouds
form. There are many excellent papers on the subject. Just enter "sporadic E" into your favoritesearch engine, and start reading. It's entirely possible (perhaps even likely) that sporadic E
clouds are formed as the result of a combination of factors, perhaps involving wind shear,cosmic debris and thunderstorm activity.
The amount by which the path of a radio signal is refracted by sporadic E clouds depends on theintensity of ionization and the frequency of the signal. For a given level of ionization, the signalrefraction angle will decrease as the frequency is increased. Above a certain critical frequency,
refraction of the signal will be insufficient to return it to the surface of the Earth. This criticalfrequency is known as the Maximum Usable Frequency or MUF.
Sporadic E is very common on the low VHF TV channels during the summer months. Fromtime to time, the intensity of Sporadic E cloud ionization increases to the point where the MUF
rises into and sometimes above FM band frequencies (88 to 108 MHz). It is common for theMUF to rise up to and then stop at a particular frequency within the FM band. Distant signalswill be heard below the MUF, while only local or tropospherically enhanced signals will be
heard above the MUF. It has been observed over the years that the signal strength of receivedsporadic E signals will be greatest just below the Maximum Usable Frequency. Also, since the
bending angle (angle of refraction) decreases as signal frequency is increased for a givenionization level, we can surmise that the most distant receptions will occur as we approach the
MUF. In other words, an Es cloud will support longer signals paths at 100 MHz than it will at50 MHz.

1/15/14 VHF Signal Propagation
13/18www.dxf m.com/Content/propagation.htm
The above illustration shows an actual Es cloud configuration and the associated skip zone thatoccurred during the summer of 2001. Three different DXers are represented by the numbers 1,
2 and 3. The Es cloud was over Eastern Kansas and Western Missouri. The yellow band is theDX zone. Using the same sporadic E cloud, a DXer in one part of the country will hear one
assortment of stations while a DXer in a different part of the country will hear a completelydifferent set of stations. If the DXers were to plot lines between their respective locations andthe stations they were each hearing (as I did here), the approximate location of the sporadic E
cloud will be above where the lines intersect. You will note that both the DXer and the stationsbeing received are in the yellow shaded DX zone. DXers outside the yellow shaded zone did
not benefit from this particular Es cloud.
DXer #1 (me), located in Lexington, KY, heard stations in New Mexico and Colorado. DXer
#2, in West Texas heard stations in Wisconsin and Michigan. DXer #3, located in WesternSouth Dakota heard stations in Mississippi and Alabama.
Es signal paths are usually bi-directional. In other words, if the DXer in Kentucky is hearing FM
stations in Colorado, a DXer in Colorado will be able to hear stations in Kentucky.
Since Es clouds often move with respect to the receiving station, the DXer will often hear a
changing selection of distant signals.

1/15/14 VHF Signal Propagation
14/18www.dxf m.com/Content/propagation.htm
Various geometries of Sporadic E Signal Propagation
This illustration shows three sporadic E clouds. Cloud #1 is more intensively ionized, and is thus
capable of refracting signals at a sharper angle, producing a shorter skip distance for a givenfrequency. Signals being refracted by Cloud #2 are returned to Earth at a lesser angle, thusproducing longer skip distances. With clouds #2 and #3 in alignment along the signal path,
"double-hop" skip can occur. With this cloud alignment signals from both the "transmitter" andthe "Single-Hop Zone" would be heard at the receiver location.
A sporadic E cloud producing short to medium distance skip at lower frequencies (TV channel2, for example) is likely to produce longer skip at FM frequencies if the MUF is high enough.
The maximum distance for a single-hop sporadic E propagated signal is approximately 1,500
miles. However, if multiple, sufficiently ionized patches exist in a line along a particular signalpath, it's possible for a given signal to reflect off the surface of the Earth after the first hop and
get refracted back to Earth by a second sporadic E cloud. This can extend the range of E-layerpropagated signals out to 3,000 miles and beyond. Statistically speaking, the "average" skip
distance for sporadic E propagated FM DX seems to be between 950 and 1,050 miles. During2001 I received 205 stations via sporadic E (a decent statistical sample). The average distance
of these receptions was 997 miles.
Single-hop E-layer propagated signals are often as strong as local signals. Indeed, I havewitnessed more than one situation where a local station was completely "covered" by a distant
one, only a few miles from the local station's transmitter location (that's when they call theengineer to see if he can "fix" the problem). Since the surface of the Earth is not a very good
signal reflector, multi-hop E-layer propagated signals will usually be weaker than single-hopsignals, and are often covered by signals coming from stations in the single hop zone. If the mid-point of a double-hope happens to be on water (such as the ocean), the signals will be stronger
and the there will likely be no interference from mid-point stations (unless someone happens tobe operating an FM or TV broadcast station aboard a ship!).
Sometimes we hear stations via Sporadic E that don't seem to fit the normal model in terms ofpath distance. It's not uncommon to receive signals beyond the range of what would be
considered "normal" for a single hop, but at less than the range expected for "normal" doublehop.
Many theories have been advanced to explain this phenomenon, including paths along multiple,
tilted sporadic E clouds. Here's an illustration of how this might work.

1/15/14 VHF Signal Propagation
15/18www.dxf m.com/Content/propagation.htm
Geometry of "Tilted" Es Cloud-to-Cloud Signal Propagation
Based on both Earth and satellite based ionosonde readings and readings from rockets sent
through Es clouds, it is known that tilted Es clouds do form. As such, this theory does provideat least one plausible explanation for longer than "normal" Es signal propagation paths.
I think there is another, simpler means by which Es signals are propagated longer than "normal"distances out to almost double-hop distances. This would also account for receptions wheresignals from double-hop distances are received without the usual interference from stations in the
single hop zone.
Geometry of "Non-Tilted" Es Cloud-to-Cloud Signal Propagation
In this illustration, neither Es cloud is sufficiently ionized to return a single-hop signal to Earth.
However, with the two "weak" clouds working together, the refraction angles of each Es cloudare essentially added. This would have the effect of raising the apparent Maximum UsableFrequency and ultimately returning the signal to Earth at a greater than "normal" Es distance.
This is a somewhat more simple (thus more likely) Es cloud configuration than that of the "tilted"cloud theory. It would account for variable path distances which fall between that of "normal"
single- and double-hop sporadic E path distances.
In theory, a similar configuration could exist with three or more Es clouds, producing much
longer signal paths. However, as the complexity of the signal path geometry increases, thelikelihood of such configurations forming and becoming usable diminishes.
Other Es cloud configurations are certainly possible. Picture, for example, a larger sporadic E
cloud, which is not uniformly ionized...

1/15/14 VHF Signal Propagation
16/18www.dxf m.com/Content/propagation.htm
Possible Path Geometry of a Large Es Cloud with Non-uniform Ionization
A signal entering the "weaker" side of the large Es cloud does not return to Earth. Instead, it ispropagated to a part of the Es cloud that is more intensely ionized. Ionization in this region of
the Es cloud is sufficient to return the signal to Earth. The effect of such a configuration is notfundamentally different than the tilted cloud or cloud-to-cloud examples presented above. It is
another possible means by which Es signals can be propagated longer than "normal" single-hopdistances.
In the northern hemisphere, seasonal sporadic E season peaks occur during the months of May,June and July. An additional minor peak often occurs in late December around Christmas time
when the Sporadic E season is at its summertime peak in the southern hemisphere. One theoryto explain this phenomenon is that intense sporadic E clouds formed in the vicinity of the equator
manage to hold their configuration as they drift toward the north and northwest, thus producingour short December sporadic E DX season. The best time of day for sporadic E seems to be
mid morning and mid afternoon. However, sporadic E DX can happen at anytime, day or night,and can pop up any time of the year. Sporadic E DX usually lasts from a few minutes to a fewhours. However, I've seen it last several full days and nights, causing a great lack of sleep!
Aurora Effect - During periods of high solar and geomagnetic activity, aurora or "northernlights" may be present. FM signals can be returned to Earth from the auroral curtain. However,
the constantly varying intensity of the aurora and its highly variable reflectivity give auroralpropagated signals a fluttery quality. The flutter will usually be in the range of 100 Hz to 2,000
Hz, producing a "buzz" in the received signal. In some cases, this effect can be so strong,normal voice or music modulation ends up becoming distorted to the point of unintelligibility. Inthe northern hemisphere, auroral propagated signals will generally come from the north,
regardless of the true direction of the transmitting station.
Look for aurorally-propagated signals following major solaractivity, or the announcement that visible northern lights willbe seen near your area. Obviously, the further south you
live, the less likely you are to hear auroral enhanced radiosignals. The best place for auroral effect in the United
States is in Alaska or the Northeastern states. It'll be rarebelow latitude 32 in the Southeast and latitude 38 to 40 in
the West and Southwest.

The theoretical maximum distance for Auroral enhanced signals is about 1,300 miles. 200 to
800 miles is typical. High quality, very sensitive, receiving equipment is required for this DXmode.
Meteor Scatter - This interesting form of enhancement results from signals bouncing off of the
intensely ionized trails of meteors entering and "burning up" in the E region of the ionosphere. The strength and duration of meteor scatter signals decreases with increasing frequency. Thus,
the effect is much more pronounced at the lower FM band frequencies than at the upper end ofthe band. Meteor scatter can be heard anywhere, anytime of the day or night. However, bursts
are more plentiful around dawn, and during known major meteor showers.
The radio signal returns to Earth after bouncing off the meteor trail.
Meteor scatter is characterized by a sudden, short burst of a distant, strong signal. The length ofthe burst depends upon the length and intensity of the ionized meteor trail. They can be as shortas a fraction of a second, producing a short "ping" at the receiver. Larger meteors, or meteors
entering atmosphere at a glancing angle, have been known to produce signal bursts lasting up toseveral minutes. If you try, you'll hear many meteor scatter signals. However, you have to be
lucky to actually catch a station identification at exactly the same instant the meteor burstoccurs. High quality equipment helps, but meteor bursts can even be heard on the "average" car
radio if you know what to listen for..
Summary - There are other, more esoteric signal propagation modes that are often at work to
enhance long-distance reception of FM signals. Signals bounce off of airplanes and evenformations of birds. With the right equipment, it's even theoretically possible to recover
broadcast signals bounced off the surface of the moon! However, the propagation modes

1/15/14 VHF Signal Propagation
18/18www.dxf m.com/Content/propagation.htm
outlined above are the more common ones you are likely to encounter while FM DXing.
Note: All the propagation mode illustrations shown here, are obviously not drawn to scale. Thesignal "bending" angles shown are very exaggerated. In reality, they are usually fairly slight
angles.
Related Documents