SOILS, SEC 2 • GLOBAL CHANGE, ENVIRON RISK ASSESS, SUSTAINABLE LAND USE • RESEARCH ARTICLE Vertical distributions of 137 Cs in soils: a meta-analysis Marianna Jagercikova & Sophie Cornu & Christine Le Bas & Olivier Evrard Received: 30 May 2014 /Accepted: 10 September 2014 # Springer-Verlag Berlin Heidelberg 2014 Abstract Purpose The vertical distribution of 137 Cs—an artificial fall- out radionuclide—is controlled by soil characteristics and processes that may differ among soil groups. The application of a single modelling approach to large number of soil profiles provides an original contribution to the literature and allows for comparison between these different soil groups. Materials and methods In order to quantify 137 Cs migration in soils, we compiled and modelled depth-distributed data doc- umented in the literature published before 2013. The resulting database comprised ninety-nine 137 Cs profiles sampled in 14 soil groups of the World Reference Base (WRB) classification (FAO 1998) under different land uses or covers and collected at various geographical locations in the Northern hemisphere between 1992 and 2007. Results and discussion The 137 Cs profiles were classified in seven different categories according to the shape and location of radiocaesium peak. Depth of the latter ranged between 0 and 12 cm (median of 2 cm) and maximal penetration of cesium reached from 12 to 60 cm. The 137 Cs depth distribu- tions in these soils were fitted using a diffusion-convection equation to allow comparison between different soil groups. Diffusion coefficients ranged from 0.02 to 4.44 cm 2 years −1 in soils (median of 0.64 cm 2 year −1 ), and convection velocities varied from 0 to 0.74 cm year −1 (median of 0.1 cm year −1 ). The model underestimated 137 Cs concentrations by a median value of 1.9 % of the total inventory in soil samples collected below a 13-cm depth. Conclusions Global 137 Cs penetration velocities ranged from 0.05 to 0.76 cm year −1 (median of 0.28 cm year −1 ) over a 25- year period. Our results showed that modelling 137 Cs depth profile with a diffusion-convection equation allowed estimat- ing the bioturbation and clay translocation velocity in a certain number of soil groups. This quantification is crucial as these processes partially control the development of soil surface characteristics and several soil services. Keywords Bioturbation . Clay translocation . Diffusion-convection equation . Fallout radionuclides . Numerical modelling . Pedogenesis 1 Introduction Ceasium-137 is characterised by a strong affinity for fine soil particles and is therefore widely used to quantify soil erosion at the plot and hillslope scales (Ritchie and Ritchie 2007), but it is also employed to quantify the relative contribution of sources delivering sediment to rivers (Ben Slimane et al. 2013). However, its ability to trace vertical transfers of solid matter in soils was much less investigated. Despite the impor- tance of these transfers in controlling the soil surface charac- teristics, the occurrence and the velocity at which those trans- fers operate are still poorly understood and quantified. To this end, measurement of tracers that are strongly bound to the solid phase and that were absent from the parent material before the start of pedogenesis along soil profiles could Responsible editor: Ying Ouyang Electronic supplementary material The online version of this article (doi:10.1007/s11368-014-0982-5) contains supplementary material, which is available to authorized users. M. Jagercikova : S. Cornu (*) INRA, UR1119 Géochimie des Sols et des Eaux, 13100 Aix en Provence, France e-mail: [email protected] C. Le Bas INRA, US 1106 Infosol, 45075 Orléans, France O. Evrard LSCE, UMR8212 CEA-CNRS-UVSQ, Domaine du CNRS, 91198 Gif-sur-Yvette Cedex, France J Soils Sediments DOI 10.1007/s11368-014-0982-5

Welcome message from author
This document is posted to help you gain knowledge. Please leave a comment to let me know what you think about it! Share it to your friends and learn new things together.
Transcript
SOILS, SEC 2 • GLOBAL CHANGE, ENVIRON RISK ASSESS, SUSTAINABLE LAND USE • RESEARCH ARTICLE
Vertical distributions of 137Cs in soils: a meta-analysis
Marianna Jagercikova & Sophie Cornu &
Christine Le Bas & Olivier Evrard
Received: 30 May 2014 /Accepted: 10 September 2014# Springer-Verlag Berlin Heidelberg 2014
AbstractPurpose The vertical distribution of 137Cs—an artificial fall-out radionuclide—is controlled by soil characteristics andprocesses that may differ among soil groups. The applicationof a single modelling approach to large number of soil profilesprovides an original contribution to the literature and allowsfor comparison between these different soil groups.Materials and methods In order to quantify 137Cs migration insoils, we compiled and modelled depth-distributed data doc-umented in the literature published before 2013. The resultingdatabase comprised ninety-nine 137Cs profiles sampled in 14soil groups of the World Reference Base (WRB) classification(FAO 1998) under different land uses or covers and collectedat various geographical locations in the Northern hemispherebetween 1992 and 2007.Results and discussion The 137Cs profiles were classified inseven different categories according to the shape and locationof radiocaesium peak. Depth of the latter ranged between 0and 12 cm (median of 2 cm) and maximal penetration ofcesium reached from 12 to 60 cm. The 137Cs depth distribu-tions in these soils were fitted using a diffusion-convectionequation to allow comparison between different soil groups.
Diffusion coefficients ranged from 0.02 to 4.44 cm2 years−1 insoils (median of 0.64 cm2 year−1), and convection velocitiesvaried from 0 to 0.74 cm year−1 (median of 0.1 cm year−1).The model underestimated 137Cs concentrations by a medianvalue of 1.9 % of the total inventory in soil samples collectedbelow a 13-cm depth.Conclusions Global 137Cs penetration velocities ranged from0.05 to 0.76 cm year−1 (median of 0.28 cm year−1) over a 25-year period. Our results showed that modelling 137Cs depthprofile with a diffusion-convection equation allowed estimat-ing the bioturbation and clay translocation velocity in a certainnumber of soil groups. This quantification is crucial as theseprocesses partially control the development of soil surfacecharacteristics and several soil services.
Keywords Bioturbation . Clay translocation .
Diffusion-convection equation . Fallout radionuclides .
Numerical modelling . Pedogenesis
1 Introduction
Ceasium-137 is characterised by a strong affinity for fine soilparticles and is therefore widely used to quantify soil erosionat the plot and hillslope scales (Ritchie and Ritchie 2007), butit is also employed to quantify the relative contribution ofsources delivering sediment to rivers (Ben Slimane et al.2013). However, its ability to trace vertical transfers of solidmatter in soils was much less investigated. Despite the impor-tance of these transfers in controlling the soil surface charac-teristics, the occurrence and the velocity at which those trans-fers operate are still poorly understood and quantified. To thisend, measurement of tracers that are strongly bound to thesolid phase and that were absent from the parent materialbefore the start of pedogenesis along soil profiles could
Responsible editor: Ying Ouyang
Electronic supplementary material The online version of this article(doi:10.1007/s11368-014-0982-5) contains supplementary material,which is available to authorized users.
M. Jagercikova : S. Cornu (*)INRA, UR1119 Géochimie des Sols et des Eaux, 13100 Aix enProvence, Francee-mail: [email protected]
C. Le BasINRA, US 1106 Infosol, 45075 Orléans, France
O. EvrardLSCE, UMR8212 CEA-CNRS-UVSQ, Domaine du CNRS,91198 Gif-sur-Yvette Cedex, France
J Soils SedimentsDOI 10.1007/s11368-014-0982-5
provide relevant information to improve our knowledge onthose processes.
Although some limitations to this method exist (e.g. Par-sons and Foster 2011), caesium-137 fulfils both conditions. Itwas released into the atmosphere by the nuclear weapon testsor, more recently, by nuclear accidents like Chernobyl orFukushima. Soils may therefore be considered as free of thisisotope prior to the first nuclear weapon tests in 1953. Duringthe nuclear weapon tests, from the 1950s to the 1970s, 137Cswas mixed in the stratosphere, and its deposition pattern to theterrestrial surface, referred to as global fallout, reflects theatmospheric circulation and its latitude dependence(UNSCEAR 1982). In contrast, 137Cs atmospheric depositsafter nuclear accidents displayed locally heterogeneous spatialpatterns, mostly depending on the weather conditions thatprevailed shortly after the emissions (Chartin et al. 2013;Korsakissok et al. 2013). As a result of the combination ofwet and dry fallout, 137Cs is delivered to the soil surface, and itmay then migrate in depth at a rate depending on processescontrolling this transfer and on soil characteristics.
These characteristics control the fixation of 137Cs on solidphases. Caesium-137 was shown to be fixed on soil constitu-ents such as micaceous clay minerals (Tamura and Jacobs1960; Sawhney 1972; Konoplev et al. 1996; Bunzl et al.1998), bearing frayed edge sites (FES) which are specific sitesfor caesium sorption (Cremers et al. 1988). According toVandebroek et al. (2012), surface layers of most soils foundacross the world were shown to have a high selectivity forcaesium adsorption, with the exception of Oxysols, Podzolsand Andosols that are depleted in micas. Regarding the othersoil types, Gil-Garcia et al. (2009) found high solid/liquiddistribution coefficients (Kd) for caesium with meanKd valuesof 530, 5500 and 3 500 L kg−1 for sandy, clayey and loamysoils, respectively. Under these conditions, transport of caesi-um in dissolved form may be considered negligible after theinitial fixation of this radionuclide onto mineral soil particles(Elshamy et al. 2007; Jarvis et al. 2010; Matisoff et al. 2011).Consequently, over the long-term, radionuclides are mainlytransported along hillslopes with soil particles (Müller-Lemans and van Dorp 1996; Turner et al. 2006). In thiscontext, the presence of artificial fallout radionuclides in depthcan be interpreted as resulting from a particle-borne transferdue to clay migration or to a physical mixing by turbationincluding bioturbation processes (Müller-Lemans and vanDorp 1996; VandenBygaart et al. 1998; Ireson and Butler2009). Nevertheless, organic soils containing more than20 % of organic matter were shown to have a relatively lowerKd value (mean of 270 L kg−1) (Gil-Garcia et al. 2009). Inthese soils, a significant contribution of solute transfer of137Cs that may be associated with DOC cannot be ruled out(AIEA 2010).
Finally, the relatively short half-life of 137Cs (T1/2=30 years) is particularly relevant for investigating processes
occurring at decadal scales (Kaste et al. 2007). Although soilformation occurs over much longer periods, individual pedo-logical processes may be characterised by temporal variationswith a succession of active and inactive periods throughout theentire story of soil development. The use of 137Cs as a tracerprovides therefore a relevant tool to understand and quantifythose variations during the last 50 years.
Most approaches that aimed to quantify the migrationvelocities of fallout radionuclides in soils solved thediffusion-convection equation (e.g. Bossew and Kirchner2004; Schuller et al. 2004; Schimmack and Márquez 2006),using either analytical or numerical solutions (Smith and Elder1999; Bunzl et al. 2000; Bossew and Kirchner 2004).
In this study, we aimed at quantifying the kinetics ofvertical transfers of 137Cs in soils depending on their charac-teristics and the relative contribution of processes controllingthis transfer in soils. To this end, we modelled the verticaldistributions of 137Cs fallout along soil profiles documented inthe literature.
2 Materials and methods
2.1 Database description
The database compiles 99 profiles with detailed evolution of137Cs activities with depth retrieved from 17 publicationspublished before 2013 (Table 1, detailed information is pro-vided in the Electronic supplementary material, Annex A).Werestricted our work to the investigations mentioning the soilgroup of the studied profiles. This reduced considerably theamount of relevant studies among the hundreds of studiesdedicated to 137Cs in soils that have been continuously pub-lished since the mid 1990s (Ritchie and Ritchie 2007). Landuse or cover, altitude, annual precipitation, sampling date andpedological data such as pH and organic matter content werecompiled when available. The depth of maximum 137Cs con-centration and the maximum depth reached by 137Cs were alsocollected.
In these studies, 137Cs data were expressed in differentunits: Bq kg−1 (direct measurement of 137Cs activity in gammaspectrometry—85% of observations), Bq cm−3 (137Cs activityper volume of soil, which requires multiplying the values inBq kg−1 by the bulk density—2 % of observations), Bq cm−2
(inventory per layer, which requires multiplying the values inBq cm−3 by the sample thickness—7 % of observations) orpercentage of the total inventory % Bq cm−2 (inventory perlayer divided by the total inventory—6 % of observations).All 137Cs data were therefore converted into Bq cm−3 tofacilitate modelling. Several pedotransfer functions exist toestimate soil bulk density (De Vos et al. 2005). However, theyare generally based on the measurements of organic mattercontent or particle-size distributions, and these data were not
J Soils Sediments

Tab
le1
Studiesandsoilprofilescontainedin
thedatabase
andtheirmaincharacteristics
WRBsoilgroups
Landuse
orcover
Country
Samplingyear
Nbof
profiles
Inventoryrange
(Bqm
−2)
Profile
class
Clim
ateKöppen-Geiger
classificatio
nOM
range(%
)pH
range
Paper
Acrisol
Grassland
China
2004
11300
2Cwa
NA
NA
Zhang
etal.(2008)
Arenosol
Forest
Germany
1999
136,123
4Cfb
6.3
7.7
Kruse-Irm
erandGiani
(2003)
Grassland
Serbia
2001
111,523
5Cfb
3.3
5.2
Krstic
etal.(2004)
Cam
bisol
Forest
Germany
1998–99
31465–28,452
1Cfb
6.2–19.6
4.1–4.4
Kruse-Irm
erandGiani
(2003)
Grassland
Syria
2000
22814–6420
1,5
Csa
NA
NA
Al-Masri(2006)
Sweden
1998
11927
3Cfb
NA
NA
Isaksson
etal.(2001)
Sweden
2007
155,950
6Dfb
22.0
5.2
Jarvisetal.(2010)
Serbia
2001
49947–17,842
3,4,6
Cfb
5.8–8.8
5.2–5.9
Krstic
etal.(2004)
Germany
1999
126,302
4Cfb
9.1
6.3
Kruse-Irm
erandGiani
(2003)
Spain
2006
12771
6Csb
NA
NA
Legarda
etal.(2011)
Sweden
1994
175,147
3Dfb
22.0
5.2
Rosén
etal.(1999)
Hungary
1995–97
72200–13,500
1,3,4
Cfb
1.1–8.2
5.6–7.5
Szerbin
etal.(1999)
Chernozem
Grassland
Hungary
1995
24200–6100
3,6
Cfb
3.4–4.4
7.2–8.1
Szerbin
etal.(1999)
Fluvisol
Grassland
Serbia
2001
24595–20,632
3,5
Cfb
1.0–7.3
4.8–7.0
Krstic
etal.(2004)
Hungary
1995
51300–7800
3,4
Cfb
0.9–5.0
6.2–7.9
Szerbin
etal.(1999)
Histosol
Forest
Germany
1998
15040
3Cfb
93.0
4.0
Kruse-Irm
erandGiani
(2003)
Grassland
Germany
1999
153,712
1Cfb
78.9
4.4
Kruse-Irm
erandGiani
(2003)
Sweden
2007
1111,400
6Dfb
46.3
5.9
Matisoffetal.(2011)a
Sweden
1994
253,463–165,913
3Dfb
64.6
5.5
Rosén
etal.(1999)
Peat
Ireland
NA
23900–4800
5Cfb
NA
NA
Gallagher
etal.(2001)
Leptosol
Grassland
Hungary
1995–97
26000–21,500
1,4
Cfb
2.0–4.6
7.7–7.8
Szerbin
etal.(1999)
Luvisol
Forest
Canada
NA
11610
6Dfb
NA
7.7
Milton
etal.(2001)
Grassland
Syria
2000
22218–9647
1,3
Csa
NA
NA
Al-Masri(2006)
Germany
2001
518,161–23,640
3,5
Cfb
12.4
NA
SchimmackandSchultz
(2006)
Phaeozem
Grassland
Sweden
1992
1159,923
3Dfb
1.1
6.2
Rosén
etal.(1999)
Podzol
Forest
Canada
NA
13030
3Dfb
NA
4.9
Milton
etal.(2001)
Grassland
Sweden
1994
12921
6Dfc
3.0
4.9
Rosén
etal.(1999)
Regosol
Cultiv
ated
China
2002
3898–1840
7Cwa
NA
NA
Zhang
etal.(2006)
Forest
Turkey
2002
162974–21,201
1,2,5,6
Csa
3.8–11.0
5.1–7.5
KaradenizandYaprak(2008)
Germany
1999
123,486
2Cfb
3.8
7.7
Kruse-Irm
erandGiani
(2003)
Grassland
Germany
1999
150,642
2Cfb
8.4
7.4
Kruse-Irm
erandGiani
(2003)
Sweden
1994–95
311,214–47,230
1,3,5
Dfc
7.2–7.5
5.4–6.3
Rosén
etal.(1999)
China
2002
11984
2Cwa
NA
NA
Zhang
etal.(2006)
J Soils Sediments

available in most of the compiled studies. We therefore de-rived a relationship between this parameter and the soil depthfrom the values available for 13 soil profiles.
We determined the duration between soil sampling andpublication (mean of 4 years with a standard deviation of1 year). Therefore, when not available (six profiles), the sam-pling date was estimated as the publication date minus 4 years.
Soil groups were given according to different classifica-tions (WRB in 38 % of studies (FAO, 1998); soil taxonomy in36 % of studies (Soil Survey Staff 1999) and national classi-fication systems in the remaining studies). To allow for com-parison, all soil groups were reclassified according to theWRB system (FAO 1998). Among the 30 main soil groupsof the WRB classification, only 14 soil groups were repre-sented in the database (Table 1).
The studies were conducted in 12 countries from theNorthern Hemisphere that were submitted to different levelsof 137Cs contamination due to the Chernobyl accident, whichresulted in a large variability in 137Cs inventories (Table 1).
Soil profiles were collected under different land uses orcovers, i.e. grassland (56 % of the cases), woodland (25 % ofthe cases), peatland (2 % of the cases), and cropland (4 % ofthe cases), and land use or cover was not specified in 13 % ofthe cases. In the latter case, the sites were described as undis-turbed and we hypothesized that they were under grassland.
Most studies restricted sampling to the uppermost 20-cmlayer (87 %). However, in 79 % of the cases, the deepestsample had 137Cs non-null concentration. The inventoriesestimated by the authors were therefore probablyunderestimated.
In some studies, only three samples were analysed alongthe profile. The modelling approach was therefore not appli-cable to such a small number of samples, and these soilprofiles were removed from further analysis (16 profiles).We did not model 137Cs distribution in the profiles locatedunder cropland, as our model did not take tillage processesinto account.
2.2 Modelling of radionuclide vertical distributions
The migration of fallout radionuclides in soils is often de-scribed using the diffusion-convection equation (e.g. He andWalling 1997; Schuller et al. 1997):
∂A∂t
¼ ∂∂z
Ds∂A∂z
−vsA� �
−λA ð1Þ
With A—the total 137Cs activity per volume of soil(Bq m−3; obtained by multiplying the 137Cs activity inBq kg−1 by the soil bulk density), z—the soil depth (m), t—the time (s), Ds—the diffusion coefficients (m2 s−1), vs—theconvection velocity (m s−1) and λ—the radioactive decayT
able1
(contin
ued)
WRBsoilgroups
Landuse
orcover
Country
Samplingyear
Nbof
profiles
Inventoryrange
(Bqm
−2)
Profile
class
Clim
ateKöppen-Geiger
classificatio
nOM
range(%
)pH
range
Paper
China
2004
12244
6Cwa
NA
NA
Zheng
etal.(2007)
Solonetz
Grassland
Hungary
1995–97
31300–4400
1,4
Cfb
2.1–4.6
6.3–7.4
Szerbin
etal.(1999)
Vertisol
Cultiv
ated
Morocco
NA
1952
7Csa
NA
NA
Mabitetal.(2008)
Grassland
Syria
2000
15646
4Csa
NA
NA
Al-Masri(2006)
Serbia
2001
312,104–19,975
2,4
Cfb
3.9–6.0
5.7–7.5
Krstic
etal.(2004)
Morocco
NA
11445
3Csa
NA
NA
Mabitetal.(2008)
Yermosol
Grassland
Syria
2000
72000–6477
1,3,4,6
BSh
,BSk
,BWk
NA
NA
Al-Masri(2006)
OM
organicmatter,NAnotanalysed(orprovided)
aFo
urotherprofilesfrom
thisstudywereexcluded
aswewerenotableto
determ
inethesoilbulk
density
with
thesoilbulk
density
modelandtheinventoriesreported
inthepaper(negativevalues)
J Soils Sediments
constant (s−1). The diffusion coefficients Ds and the convec-tion velocity vs were considered as spatially and temporallyconstant in this study. This is an oversimplification, as weknow that mixing processes and vertical transfers in soil mayvary in both time and depth. However, we considered thatintensity of these processes remained constant during the lastdecades.
In the model, 137C is given as a bulk concentration, hy-pothesizing that 137Cs is evenly distributed within the soilmass of the considered layer. However, as 137Cs is mainlydeposited as the result of wet fallout, its distribution is hetero-geneous in soils and depends on soil structure, macroporedistribution and preferential flow (Bundt et al. 2000). Further-more, it evolves throughout time due to the occurrence ofwetting/drying cycles and bioturbation, and it depends onthe soil moisture content at the time of deposition. Therefore,we acknowledge that 137Cs distribution in soils may be morecomplex than modelled in our study.
2.2.1 Boundary conditions
At the soil surface, we applied a boundary condition with apulse-like input of radionuclides. This pulse-like input wasobtained by multiplying the annual fallout deposition a0(t') inBq m−2 of the considered year t’ by a Dirac delta function a(0,t’)=a0(t’)δ(t−t’):
Ds∂A 0; t0ð Þ
∂z¼ a0 t0ð Þδ t−t0ð Þ ð2Þ
Isotopes were delivered to the surface, at z=0, annually andinput time series were dealt as a time-dependent boundarycondition, i.e. A(0, t’)=A(0, t’−1)+a0(t’)δ (t−t’).
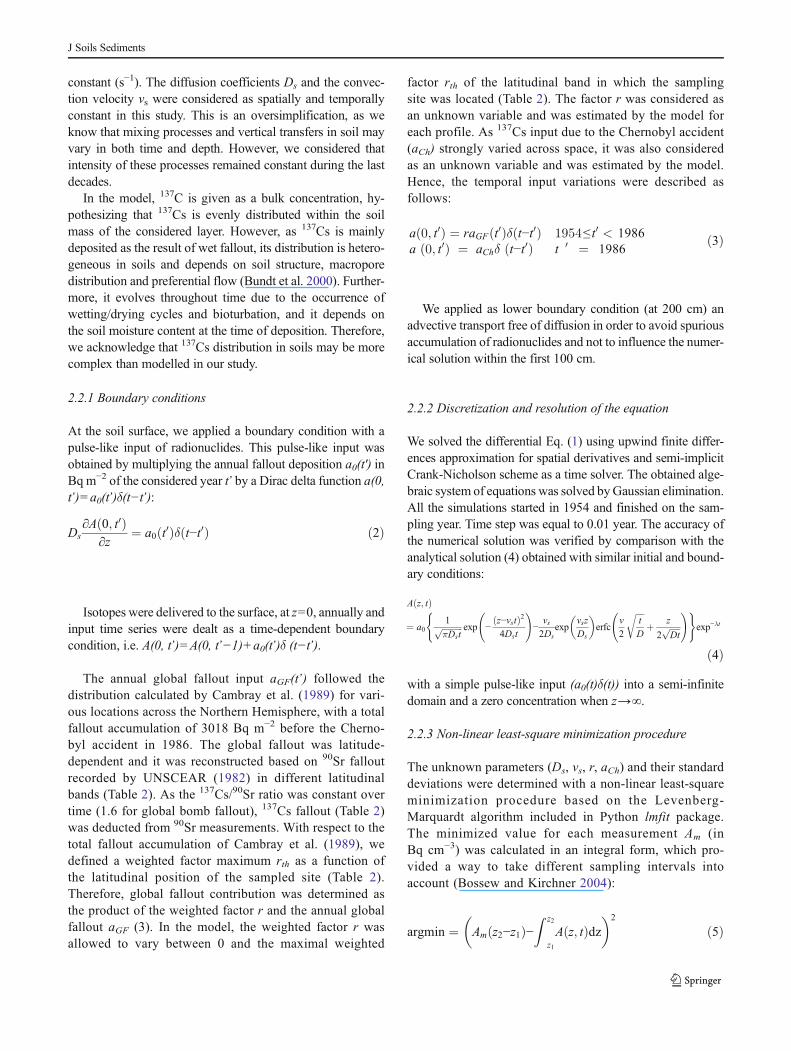
The annual global fallout input aGF(t’) followed thedistribution calculated by Cambray et al. (1989) for vari-ous locations across the Northern Hemisphere, with a totalfallout accumulation of 3018 Bq m−2 before the Cherno-byl accident in 1986. The global fallout was latitude-dependent and it was reconstructed based on 90Sr falloutrecorded by UNSCEAR (1982) in different latitudinalbands (Table 2). As the 137Cs/90Sr ratio was constant overtime (1.6 for global bomb fallout), 137Cs fallout (Table 2)was deducted from 90Sr measurements. With respect to thetotal fallout accumulation of Cambray et al. (1989), wedefined a weighted factor maximum rth as a function ofthe latitudinal position of the sampled site (Table 2).Therefore, global fallout contribution was determined asthe product of the weighted factor r and the annual globalfallout aGF (3). In the model, the weighted factor r wasallowed to vary between 0 and the maximal weighted
factor rth of the latitudinal band in which the samplingsite was located (Table 2). The factor r was considered asan unknown variable and was estimated by the model foreach profile. As 137Cs input due to the Chernobyl accident(aCh) strongly varied across space, it was also consideredas an unknown variable and was estimated by the model.Hence, the temporal input variations were described asfollows:
a 0; t0ð Þ ¼ raGF t0ð Þδ t−t0ð Þ 1954≤ t0 < 1986a 0; t0ð Þ ¼ aChδ t−t0ð Þ t 0 ¼ 1986
ð3Þ
We applied as lower boundary condition (at 200 cm) anadvective transport free of diffusion in order to avoid spuriousaccumulation of radionuclides and not to influence the numer-ical solution within the first 100 cm.
2.2.2 Discretization and resolution of the equation
We solved the differential Eq. (1) using upwind finite differ-ences approximation for spatial derivatives and semi-implicitCrank-Nicholson scheme as a time solver. The obtained alge-braic system of equations was solved byGaussian elimination.All the simulations started in 1954 and finished on the sam-pling year. Time step was equal to 0.01 year. The accuracy ofthe numerical solution was verified by comparison with theanalytical solution (4) obtained with similar initial and bound-ary conditions:
A z; tð Þ
¼ a01ffiffiffiffiffiffiffiffiffiffiπDst
p exp −z−vstð Þ24Dst
!−
vs2Ds
expvsz
Ds
� �erfc
v
2
ffiffiffiffit
D
rþ z
2ffiffiffiffiffiDt
p !( )
exp−λt
ð4Þ
with a simple pulse-like input (a0(t)δ(t)) into a semi-infinitedomain and a zero concentration when z→∞.
2.2.3 Non-linear least-square minimization procedure
The unknown parameters (Ds, vs, r, aCh) and their standarddeviations were determined with a non-linear least-squareminimization procedure based on the Levenberg-Marquardt algorithm included in Python lmfit package.The minimized value for each measurement Am (inBq cm−3) was calculated in an integral form, which pro-vided a way to take different sampling intervals intoaccount (Bossew and Kirchner 2004):
argmin ¼ Am z2−z1ð Þ−Z z2
z1
A z; tð Þdz� �2
ð5Þ
J Soils Sediments
In order to estimate the performance of the fitting proce-dure, we calculated residual sum of squares (RSS) for Nsampled layers and modelling efficiency (EF):
RSS ¼Xi−0
N
Am ið Þ zi2−zi1ð Þ−Z zi2
zi1
A z; tð Þdz� �2
ð6Þ
EF ¼ 1−
XN
i¼0
Z zi2
zi1
A z; tð Þdz−Am ið Þ zi2−zi1ð Þ� �2
XN
i¼0Am ið Þ zi2−zi1ð Þ− 1
N
XN
i¼0Am ið Þ
� �2 ð7Þ
The first simulation was run to fit all four parameters (Ds,vs, r, aCh). If the resulting model parameters remained in therange of possible values (0<r≤rth, 0≤aCh), the simulation wasretained as the best fit. Otherwise, we added the followingassumptions: aCh=0 if the sampling site was located in aregion spared by Chernobyl deposits and raGF=4527 Bq m−2 (the maximum global fallout input) if the modelattributed larger global fallout input than expected, which wasoften the case for the sites characterised by high levels ofChernobyl contamination. All sites affected by soil erosionor soil accumulation were excluded from the database forfurther analysis, and these processes were therefore not simu-lated by the model.
3 Results and discussion
3.1 Soil bulk density within the uppermost 20 cm of the soil:evolution and estimation
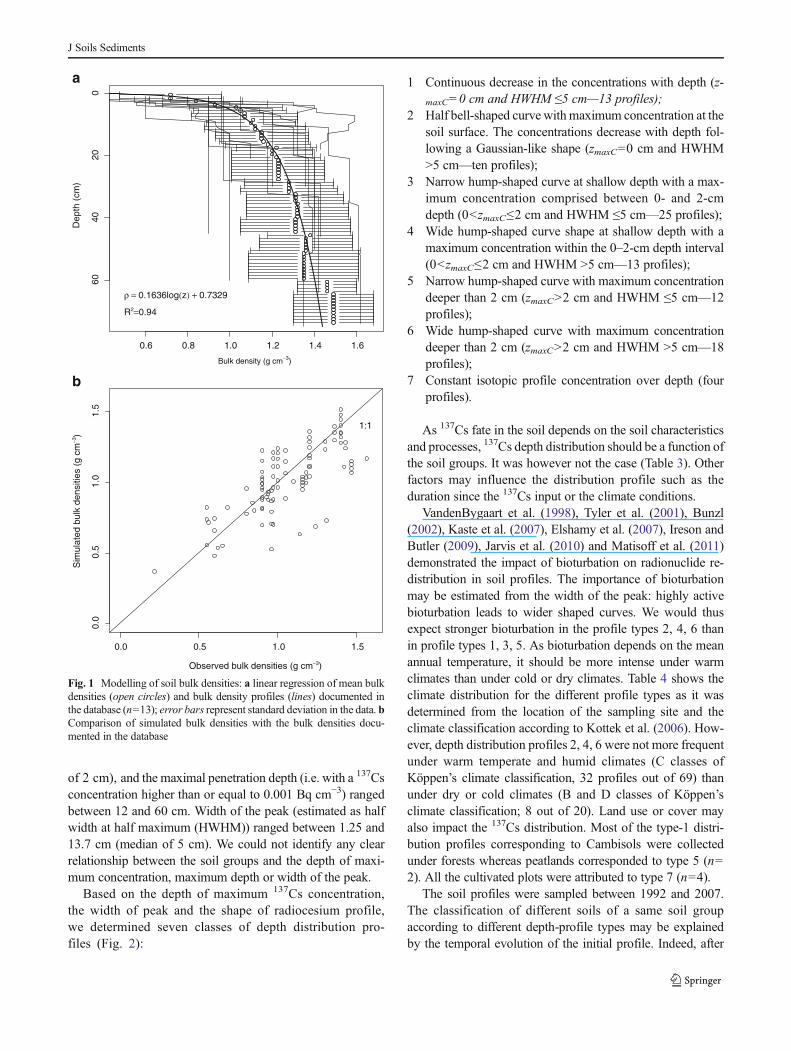
Bulk densities reported in the literature for 13 soil profilesranged from 0.6 to 1.41 g cm−3 at a 5-cm depth and from 0.9 to
1.47 g cm−3 at a 20-cm depth. The mean bulk density of these13 soil profiles evolved with depth following a logarithmicfunction (Fig. 1a; Eq. 8):
ρ zð Þ ¼ C1ln zð Þ þ C2 ð8Þ
with depth z expressed in centimetre (cm). For the consideredsoil profiles, C1 was equal to 0.1636 and C2 to 0.7329 (R2=0.94).
We considered a comparable evolution of the bulk densityin depth for the other profiles, with the same C1 value, where-as C2 was estimated in order to fit the total 137Cs inventory (I)considering the depth evolution of the activities of 137Cs inbecquerel per kilogram (Bq kg−1), using the minimizationEq. (9):
argmin ¼Xi¼0
N
C1lnzi2 þ zi1
2
� �þ C2
� �As ið Þ zi2−zi1ð Þ
� �−I
!2
ð9Þ
In order to check the accuracy of the obtained predictivemodel, bulk densities were estimated for the soil profiles forwhich these data were available (Fig. 1b). We obtained areasonable estimation of the bulk density in samples close tothe surface, but the density was underestimated by the modelbelow a 10-cm depth. However, as only a small proportionof the 137Cs was located at this depth, the impact of bulkdensity underestimation on 137Cs vertical distribution wasconsidered to be negligible.
The model was applied to the 48 soil profiles for whichbulk density data were not available (Electronic supple-mentary material, Annex A). C2 varied between 0.37 and2.53. Eighty percent of the mean bulk density of the 0–20-cm layer—estimated by the predictive model—rangedfrom 0.94 to 1.66 g cm−3, with a median value of1.22 g cm−3. The estimated soil bulk densities were con-sidered as irrelevant in five profiles compared to thevalues classically found in soils. In addition, negativevalues were obtained in four profiles. They were thereforenot considered in further analysis.
3.2 Cs-137 distributions in soils
The recorded 137Cs inventories (decay-corrected for 2013)ranged from 697 to 107 200 Bq m−2. The highest inven-tories were measured in soils collected in the areas severe-ly contaminated by Chernobyl fallout in central Europeand Sweden as documented in the atlas of Chernobylcontamination (De Cort et al. 1996). Sites in Canada,China and Spain were considered as free from Chernobylcontamination. The depth of the maximum concentration(zmaxC) ranged between 0 and 12 cm (with a median value
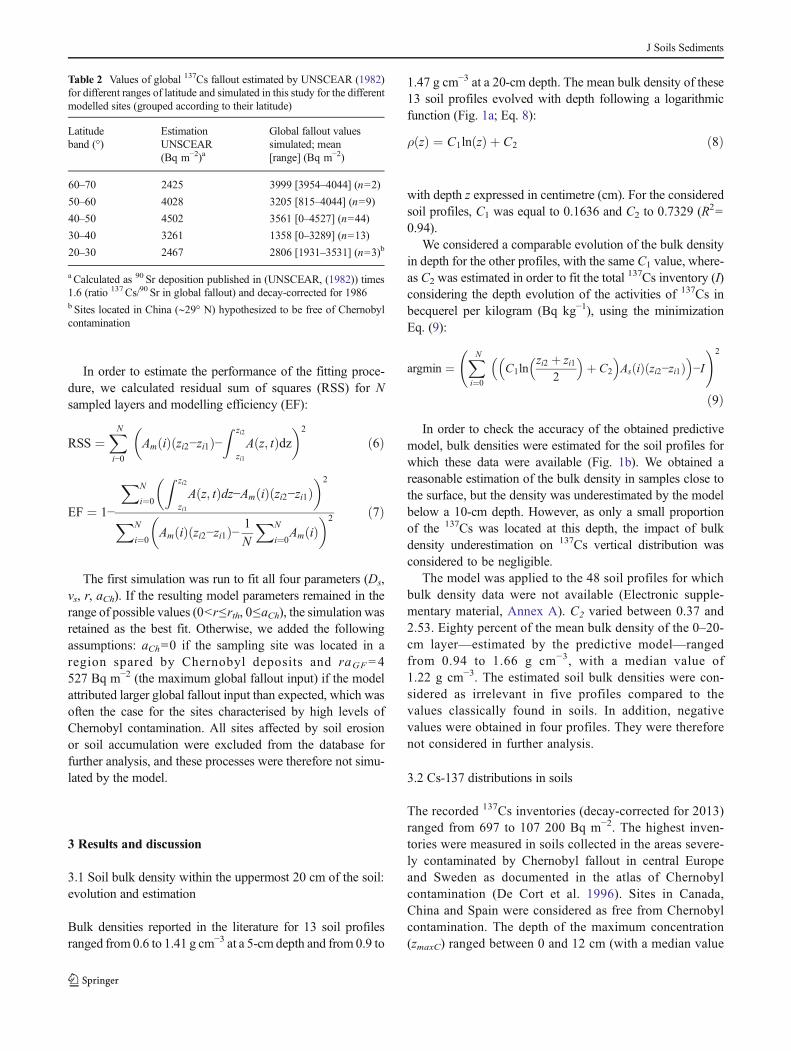
Table 2 Values of global 137Cs fallout estimated by UNSCEAR (1982)for different ranges of latitude and simulated in this study for the differentmodelled sites (grouped according to their latitude)
Latitudeband (°)
EstimationUNSCEAR(Bq m−2)a
Global fallout valuessimulated; mean[range] (Bq m−2)
60–70 2425 3999 [3954–4044] (n=2)
50–60 4028 3205 [815–4044] (n=9)
40–50 4502 3561 [0–4527] (n=44)
30–40 3261 1358 [0–3289] (n=13)
20–30 2467 2806 [1931–3531] (n=3)b
a Calculated as 90 Sr deposition published in (UNSCEAR, (1982)) times1.6 (ratio 137Cs/90 Sr in global fallout) and decay-corrected for 1986b Sites located in China (∼29° N) hypothesized to be free of Chernobylcontamination
J Soils Sediments
of 2 cm), and the maximal penetration depth (i.e. with a 137Csconcentration higher than or equal to 0.001 Bq cm−3) rangedbetween 12 and 60 cm. Width of the peak (estimated as halfwidth at half maximum (HWHM)) ranged between 1.25 and13.7 cm (median of 5 cm). We could not identify any clearrelationship between the soil groups and the depth of maxi-mum concentration, maximum depth or width of the peak.
Based on the depth of maximum 137Cs concentration,the width of peak and the shape of radiocesium profile,we determined seven classes of depth distribution pro-files (Fig. 2):
1 Continuous decrease in the concentrations with depth (z-
maxC=0 cm and HWHM ≤5 cm—13 profiles);2 Half bell-shaped curve withmaximum concentration at the
soil surface. The concentrations decrease with depth fol-lowing a Gaussian-like shape (zmaxC=0 cm and HWHM>5 cm—ten profiles);
3 Narrow hump-shaped curve at shallow depth with a max-imum concentration comprised between 0- and 2-cmdepth (0<zmaxC≤2 cm and HWHM ≤5 cm—25 profiles);
4 Wide hump-shaped curve shape at shallow depth with amaximum concentration within the 0–2-cm depth interval(0<zmaxC≤2 cm and HWHM >5 cm—13 profiles);
5 Narrow hump-shaped curve with maximum concentrationdeeper than 2 cm (zmaxC>2 cm and HWHM ≤5 cm—12profiles);
6 Wide hump-shaped curve with maximum concentrationdeeper than 2 cm (zmaxC>2 cm and HWHM >5 cm—18profiles);
7 Constant isotopic profile concentration over depth (fourprofiles).
As 137Cs fate in the soil depends on the soil characteristicsand processes, 137Cs depth distribution should be a function ofthe soil groups. It was however not the case (Table 3). Otherfactors may influence the distribution profile such as theduration since the 137Cs input or the climate conditions.
VandenBygaart et al. (1998), Tyler et al. (2001), Bunzl(2002), Kaste et al. (2007), Elshamy et al. (2007), Ireson andButler (2009), Jarvis et al. (2010) and Matisoff et al. (2011)demonstrated the impact of bioturbation on radionuclide re-distribution in soil profiles. The importance of bioturbationmay be estimated from the width of the peak: highly activebioturbation leads to wider shaped curves. We would thusexpect stronger bioturbation in the profile types 2, 4, 6 thanin profile types 1, 3, 5. As bioturbation depends on the meanannual temperature, it should be more intense under warmclimates than under cold or dry climates. Table 4 shows theclimate distribution for the different profile types as it wasdetermined from the location of the sampling site and theclimate classification according to Kottek et al. (2006). How-ever, depth distribution profiles 2, 4, 6 were not more frequentunder warm temperate and humid climates (C classes ofKöppen’s climate classification, 32 profiles out of 69) thanunder dry or cold climates (B and D classes of Köppen’sclimate classification; 8 out of 20). Land use or cover mayalso impact the 137Cs distribution. Most of the type-1 distri-bution profiles corresponding to Cambisols were collectedunder forests whereas peatlands corresponded to type 5 (n=2). All the cultivated plots were attributed to type 7 (n=4).
The soil profiles were sampled between 1992 and 2007.The classification of different soils of a same soil groupaccording to different depth-profile types may be explainedby the temporal evolution of the initial profile. Indeed, after
0.6 0.8 1.0 1.2 1.4 1.6
6040
200
Bulk density (g cm−3)
Dep
th (
cm)
ρ = 0.1636log(z) + 0.7329
R2=0.94
0.0 0.5 1.0 1.5
0.0
0.5
1.0
1.5
Observed bulk densities (g cm−3)
Sim
ulat
ed b
ulk
dens
ities
(g
cm−3
)
1:1
a
b
Fig. 1 Modelling of soil bulk densities: a linear regression of mean bulkdensities (open circles) and bulk density profiles (lines) documented inthe database (n=13); error bars represent standard deviation in the data. bComparison of simulated bulk densities with the bulk densities docu-mented in the database
J Soils Sediments

137Cs inputs, the peak progressively migrates in depth, and itsdistribution profile will widen with time depending on theturbation rate. This evolution will nevertheless depend on thetime elapsed after the main 137Cs input that may either be dueto the bomb tests or to the Chernobyl accident depending onthe site. This probably explains why we could not find anyrelationship between 137Cs depth profiles and the samplingdates. In addition, for similar sampling dates, classificationaccording to different profile shapes may originate from dif-ferences in values of diffusion coefficient (Ds in cm2 year−1)and convection velocity (vs in cm year−1): profile type 1 beingobtained forDs>0 and vs≈0; profile type 2 forDs>>0 and vs≈0; profile type 3 for Ds>0 and vs>0; profile type 4 for Ds>>0and vs>0; profile type 5 forDs>0 and vs>>0; and profile type6 for Ds>>0 and vs>>0. The profiles belonging to class 7result either from a disturbance or from a mixing of the entireprofile that may have been achieved by agricultural practicessuch as tillage.
As a conclusion, the 137Cs profile type is a complex result ofthe variations in soil processes affecting the diffusion and con-vection transport and resulting in contrasted temporal evolutions.
3.3 Diffusion and convection in soils
3.3.1 Overall quality of the simulation results
We have simulated the evolution of 71 profiles out of the 99profiles compiled in the database (detailed results are providedin the Electronic supplementary material, Annex A and B).We have excluded four cultivated profiles, four profiles withthick organic horizons containing more than 30 % of the total137Cs inventory, four profiles with unrealistic bulk densityvalues and 16 profiles with only three measurements perprofile, which was insufficient for optimizing the four re-quired parameters. Overall, modelling efficiency (EF) reacheda mean of 0.89±0.20, and a median of 0.96 (max(EF)=1),
Fig. 2 The different depth-distribution profile types for 137Cs compiledin the database. Typical examples are provided. The distributions werenormalized by their maximum concentrations. Type 1—example of pro-file CMg of Kruse-Irmer and Giani (2003), type 2—example of the
reference profile of Zhang et al. (2008), type 3—example of Möjsjövikfrom Rosén et al. (1999), type 4—example of Somogy from Szerbin et al.(1999), type 5—example of profile E from Schimmack and Schultz(2006), and type 6—example of Veszprém from Szerbin et al. (1999)
Table 3 Types of profile depthdistributions attributed to the dif-ferent soil groups
Profile depth distribution Type 1 Type 2 Type 3 Type 4 Type 5 Type 6 Type 7
Acrisols 0 1 0 0 0 0 0
Arenosols 0 0 0 1 1 0 0
Cambisols 5 0 7 5 1 3 0
Chernozems 0 0 1 0 0 1 0
Fluvisols 0 0 4 2 1 0 0
Histosols 1 0 3 0 2 1 0
Leptosols 1 0 0 1 0 0 0
Luvisols 0 0 4 0 2 1 0
Phaeozems 0 0 1 0 0 0 0
Podzols 0 0 1 0 0 1 0
Regosols 2 6 1 0 5 9 3
Solonetz 2 0 0 1 0 0 0
Vertisols 0 2 1 2 0 0 1
Yermosols 3 0 1 1 0 3 0
J Soils Sediments
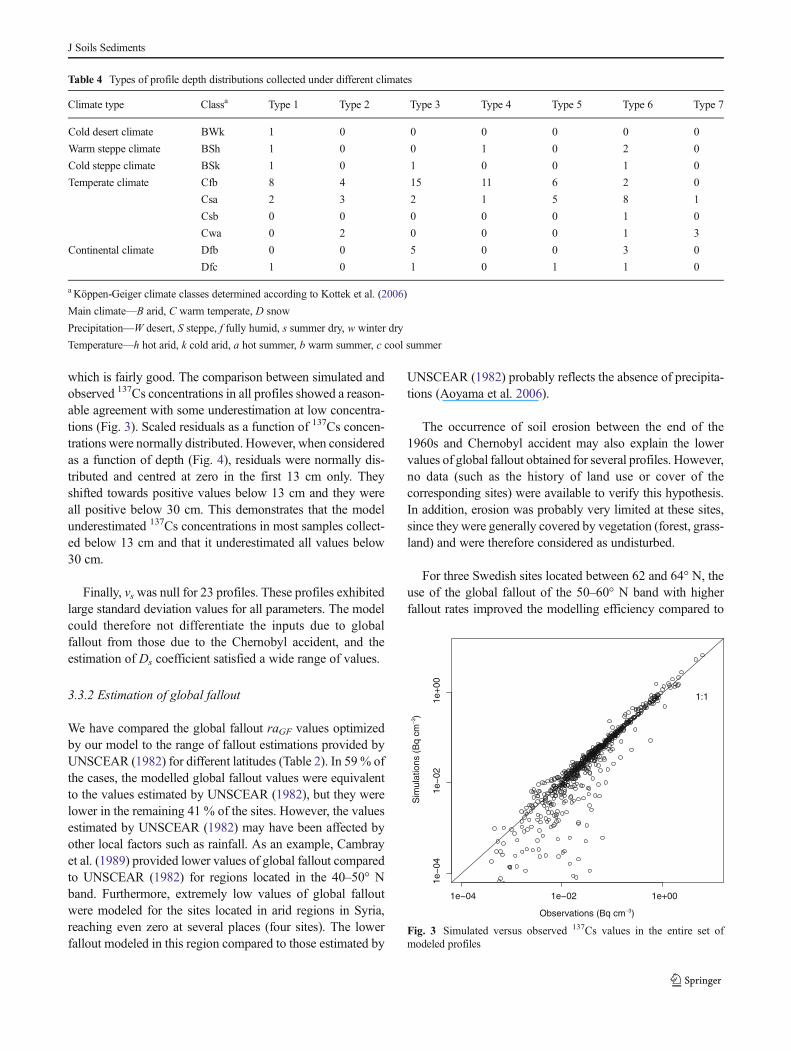
which is fairly good. The comparison between simulated andobserved 137Cs concentrations in all profiles showed a reason-able agreement with some underestimation at low concentra-tions (Fig. 3). Scaled residuals as a function of 137Cs concen-trations were normally distributed. However, when consideredas a function of depth (Fig. 4), residuals were normally dis-tributed and centred at zero in the first 13 cm only. Theyshifted towards positive values below 13 cm and they wereall positive below 30 cm. This demonstrates that the modelunderestimated 137Cs concentrations in most samples collect-ed below 13 cm and that it underestimated all values below30 cm.
Finally, vswas null for 23 profiles. These profiles exhibitedlarge standard deviation values for all parameters. The modelcould therefore not differentiate the inputs due to globalfallout from those due to the Chernobyl accident, and theestimation of Ds coefficient satisfied a wide range of values.
3.3.2 Estimation of global fallout
We have compared the global fallout raGF values optimizedby our model to the range of fallout estimations provided byUNSCEAR (1982) for different latitudes (Table 2). In 59 % ofthe cases, the modelled global fallout values were equivalentto the values estimated by UNSCEAR (1982), but they werelower in the remaining 41 % of the sites. However, the valuesestimated by UNSCEAR (1982) may have been affected byother local factors such as rainfall. As an example, Cambrayet al. (1989) provided lower values of global fallout comparedto UNSCEAR (1982) for regions located in the 40–50° Nband. Furthermore, extremely low values of global falloutwere modeled for the sites located in arid regions in Syria,reaching even zero at several places (four sites). The lowerfallout modeled in this region compared to those estimated by
UNSCEAR (1982) probably reflects the absence of precipita-tions (Aoyama et al. 2006).
The occurrence of soil erosion between the end of the1960s and Chernobyl accident may also explain the lowervalues of global fallout obtained for several profiles. However,no data (such as the history of land use or cover of thecorresponding sites) were available to verify this hypothesis.In addition, erosion was probably very limited at these sites,since they were generally covered by vegetation (forest, grass-land) and were therefore considered as undisturbed.
For three Swedish sites located between 62 and 64° N, theuse of the global fallout of the 50–60° N band with higherfallout rates improved the modelling efficiency compared to
Table 4 Types of profile depth distributions collected under different climates
Climate type Classa Type 1 Type 2 Type 3 Type 4 Type 5 Type 6 Type 7
Cold desert climate BWk 1 0 0 0 0 0 0
Warm steppe climate BSh 1 0 0 1 0 2 0
Cold steppe climate BSk 1 0 1 0 0 1 0
Temperate climate Cfb 8 4 15 11 6 2 0
Csa 2 3 2 1 5 8 1
Csb 0 0 0 0 0 1 0
Cwa 0 2 0 0 0 1 3
Continental climate Dfb 0 0 5 0 0 3 0
Dfc 1 0 1 0 1 1 0
aKöppen-Geiger climate classes determined according to Kottek et al. (2006)
Main climate—B arid, C warm temperate, D snow
Precipitation—W desert, S steppe, f fully humid, s summer dry, w winter dry
Temperature—h hot arid, k cold arid, a hot summer, b warm summer, c cool summer
1e−04 1e−02 1e+00
1e−
041e
−02
1e+
00
Observations (Bq cm−3)
Sim
ulat
ions
(B
q cm
−3)
1:1
Fig. 3 Simulated versus observed 137Cs values in the entire set ofmodeled profiles
J Soils Sediments

the one obtained when taking values of the 60–70° band.Similarly, Sigurgeirsson et al. (2005) reported that 137Cs de-position was underestimated for 60–70° N band byUNSCEAR (1982) in Icelandic soils. We observe the samephenomena for Chinese sites at 29° N, showing that thelatitude parallels defining the limit between two bands shouldbe rather considered as transition zones.
Overall, differences between observed and simulated globalfallout may be explained by the following: (i) a virtual absenceof fallout because of the lack of precipitation in arid regions (asit was probably the case in Syria) and (ii) the possible occur-rence of soil erosion between the end of the 1960s and Cher-nobyl accident.
3.3.3 Possible mechanisms behind D and v
Diffusion coefficient is widely used to estimate bioturbationin the literature (e.g. Elzein and Balesdent 1995; Schifferset al. 2011). Bioturbation in soil is due to the activity ofmicro- and macroorganisms. Under temperate climates, it ismainly controlled by earthworm activity (Wilkinson et al.2009). However, diffusion coefficient only represents a localmixing, whereas a non-negligible part of bioturbation may bedue to non-local feeder earthworm species (Jarvis et al. 2010;Schiffers et al. 2011). As the diffusion coefficient is unable tosimulate this non-local behaviour, alternative models weredeveloped (Müller-Lemans and van Dorp 1996; Schifferset al. 2011). A non-local mixing term was integrated intothe general diffusion-convection equation (Jarvis et al. 2010),which improved the simulations of deep penetration of137Cs. The transfer function describing the behaviour ofnon-local feeders requires the implementation of other pa-rameters (i.e. ingestion rate of non-local feeders, depth ofingestion), which were calibrated by Jarvis et al. (2010) fortheir field site based on an ecological study of anecic and
endogeic earthworm species (i.e. classical non-local feedersin temperate soils). As such data were not available for thestudy sites, we could not model the behaviour of non-localfeeders. However, Jarvis et al. (2010) showed that estimatingbioturbation with a diffusion coefficient fits reasonably wellwith 137Cs profiles, although it underestimates concentra-tions at depth.
The simulated diffusion coefficients Ds ranged from0.02 to 4.44 cm2 years−1 (median of 0.64 cm2 year−1).Among the profiles compiled in our database, modellinghad already been conducted on 35 soils using differentmethods for solving the diffusion-convection equation(Szerbin et al. 1999; Krstic et al. 2004; Schimmack andMárquez 2006; Zhang et al. 2008; Legarda et al. 2011).These studies obtained a medianDs value of 0.53 cm
2 year−1,which is slightly different from our findings. However, thisdiscrepancy may be explained by the inclusion of ca. 40additional profiles in our study, which may have enlargedthe range of Ds values in soils.
These Ds values were the highest for depth distributiontype 4 (mean of 1.4 cm2 year−1). Then, they were higher fordepth distribution types 2, 3 and 6 (mean ranging from 0.8 to1.3 cm2 year−1) than for depth distribution types 1 and 5 (meanof 0.5 cm2 year−1; analysis of variance (ANOVA) with aFisher test at 5 % level of confidence).
We could not observe any significant difference in Ds
values as a function of land use or cover, the time elapsedafter the main 137Cs input, soil group or the climate type.
One of the difficulties associated with our approach isthat Ds may account for both a diffusion process and adispersion of the convection velocities when the convec-tion operates. Therefore, a correlation between both pa-rameters may indicate that Ds is not exclusively linked tobioturbation but that it is also affected by convectionprocesses. However, we did not observe any correlationbetween Ds and either the precipitation or vs when con-sidering the entire set of profiles. When the different soilgroups were considered separately (Fig. 5), Ds remainedindependent from vs in Luvisols and Regosols, whereas inYermosols, a positive linear relationship was observedbetween Ds and vs (Ds=4.13vs+0.08, R
2=0.84, n=8). Thisrelationship suggested that an important dispersive effectexists in Yermosols with increasing convection velocity.The relatively high Ds values observed in this soil groupunder a dry climate are therefore likely due to the convec-tion process occurring in these soils and not to bioturba-tion, which is probably low under dry climate conditions.In Cambisols, i.e. the most documented soil group (n=19),three trends between Ds and vs were observed: a variable
-3
-2
-1
0
1
2
3
4
0 20 40 60 80
Sca
led
resi
dual
s
Depth (cm)
All scaled residuals
Moving average
Fig. 4 Scaled residuals (n=809) of all simulations and its movingaverage as a function of soil depth. Note that the moving average of thescaled residuals shifted towards positive values below 13 cm and that thescaled residuals remained systematically positive below 30 cm
J Soils Sediments
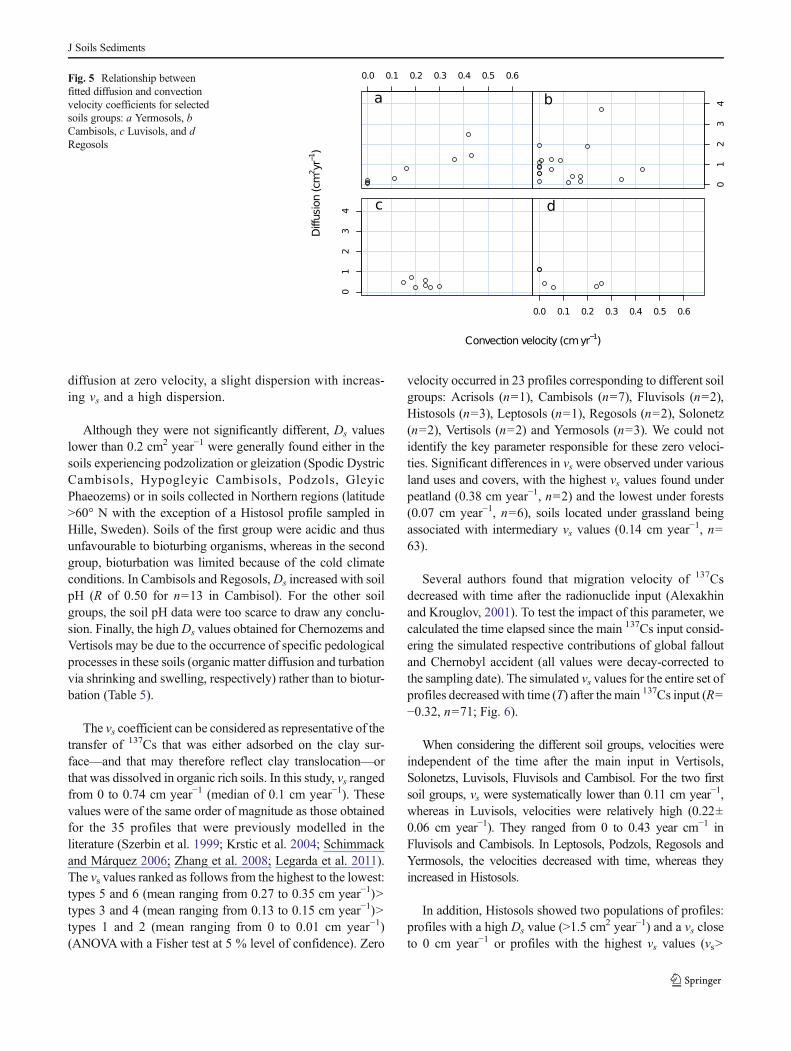
diffusion at zero velocity, a slight dispersion with increas-ing vs and a high dispersion.
Although they were not significantly different, Ds valueslower than 0.2 cm2 year−1 were generally found either in thesoils experiencing podzolization or gleization (Spodic DystricCambisols, Hypogleyic Cambisols, Podzols, GleyicPhaeozems) or in soils collected in Northern regions (latitude>60° N with the exception of a Histosol profile sampled inHille, Sweden). Soils of the first group were acidic and thusunfavourable to bioturbing organisms, whereas in the secondgroup, bioturbation was limited because of the cold climateconditions. In Cambisols and Regosols,Ds increased with soilpH (R of 0.50 for n=13 in Cambisol). For the other soilgroups, the soil pH data were too scarce to draw any conclu-sion. Finally, the highDs values obtained for Chernozems andVertisols may be due to the occurrence of specific pedologicalprocesses in these soils (organic matter diffusion and turbationvia shrinking and swelling, respectively) rather than to biotur-bation (Table 5).
The vs coefficient can be considered as representative of thetransfer of 137Cs that was either adsorbed on the clay sur-face—and that may therefore reflect clay translocation—orthat was dissolved in organic rich soils. In this study, vs rangedfrom 0 to 0.74 cm year−1 (median of 0.1 cm year−1). Thesevalues were of the same order of magnitude as those obtainedfor the 35 profiles that were previously modelled in theliterature (Szerbin et al. 1999; Krstic et al. 2004; Schimmackand Márquez 2006; Zhang et al. 2008; Legarda et al. 2011).The vs values ranked as follows from the highest to the lowest:types 5 and 6 (mean ranging from 0.27 to 0.35 cm year−1)>types 3 and 4 (mean ranging from 0.13 to 0.15 cm year−1)>types 1 and 2 (mean ranging from 0 to 0.01 cm year−1)(ANOVAwith a Fisher test at 5 % level of confidence). Zero
velocity occurred in 23 profiles corresponding to different soilgroups: Acrisols (n=1), Cambisols (n=7), Fluvisols (n=2),Histosols (n=3), Leptosols (n=1), Regosols (n=2), Solonetz(n=2), Vertisols (n=2) and Yermosols (n=3). We could notidentify the key parameter responsible for these zero veloci-ties. Significant differences in vs were observed under variousland uses and covers, with the highest vs values found underpeatland (0.38 cm year−1, n=2) and the lowest under forests(0.07 cm year−1, n=6), soils located under grassland beingassociated with intermediary vs values (0.14 cm year−1, n=63).
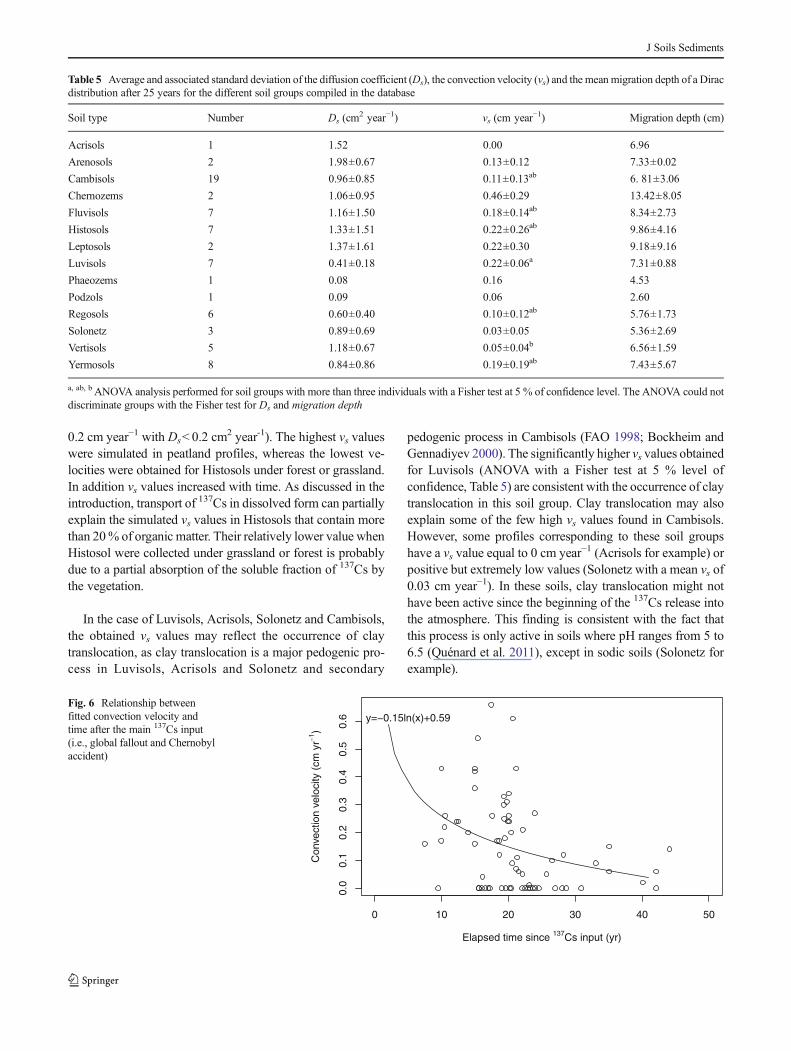
Several authors found that migration velocity of 137Csdecreased with time after the radionuclide input (Alexakhinand Krouglov, 2001). To test the impact of this parameter, wecalculated the time elapsed since the main 137Cs input consid-ering the simulated respective contributions of global falloutand Chernobyl accident (all values were decay-corrected tothe sampling date). The simulated vs values for the entire set ofprofiles decreased with time (T) after the main 137Cs input (R=−0.32, n=71; Fig. 6).
When considering the different soil groups, velocities wereindependent of the time after the main input in Vertisols,Solonetzs, Luvisols, Fluvisols and Cambisol. For the two firstsoil groups, vs were systematically lower than 0.11 cm year−1,whereas in Luvisols, velocities were relatively high (0.22±0.06 cm year−1). They ranged from 0 to 0.43 year cm−1 inFluvisols and Cambisols. In Leptosols, Podzols, Regosols andYermosols, the velocities decreased with time, whereas theyincreased in Histosols.
In addition, Histosols showed two populations of profiles:profiles with a high Ds value (>1.5 cm
2 year−1) and a vs closeto 0 cm year−1 or profiles with the highest vs values (vs>
Fig. 5 Relationship betweenfitted diffusion and convectionvelocity coefficients for selectedsoils groups: a Yermosols, bCambisols, c Luvisols, and dRegosols
J Soils Sediments
0.2 cm year−1 with Ds<0.2 cm2 year-1). The highest vs values
were simulated in peatland profiles, whereas the lowest ve-locities were obtained for Histosols under forest or grassland.In addition vs values increased with time. As discussed in theintroduction, transport of 137Cs in dissolved form can partiallyexplain the simulated vs values in Histosols that contain morethan 20% of organic matter. Their relatively lower value whenHistosol were collected under grassland or forest is probablydue to a partial absorption of the soluble fraction of 137Cs bythe vegetation.
In the case of Luvisols, Acrisols, Solonetz and Cambisols,the obtained vs values may reflect the occurrence of claytranslocation, as clay translocation is a major pedogenic pro-cess in Luvisols, Acrisols and Solonetz and secondary
pedogenic process in Cambisols (FAO 1998; Bockheim andGennadiyev 2000). The significantly higher vs values obtainedfor Luvisols (ANOVA with a Fisher test at 5 % level ofconfidence, Table 5) are consistent with the occurrence of claytranslocation in this soil group. Clay translocation may alsoexplain some of the few high vs values found in Cambisols.However, some profiles corresponding to these soil groupshave a vs value equal to 0 cm year−1 (Acrisols for example) orpositive but extremely low values (Solonetz with a mean vs of0.03 cm year−1). In these soils, clay translocation might nothave been active since the beginning of the 137Cs release intothe atmosphere. This finding is consistent with the fact thatthis process is only active in soils where pH ranges from 5 to6.5 (Quénard et al. 2011), except in sodic soils (Solonetz forexample).
Table 5 Average and associated standard deviation of the diffusion coefficient (Ds), the convection velocity (vs) and the mean migration depth of a Diracdistribution after 25 years for the different soil groups compiled in the database
Soil type Number Ds (cm2 year−1) vs (cm year−1) Migration depth (cm)
Acrisols 1 1.52 0.00 6.96
Arenosols 2 1.98±0.67 0.13±0.12 7.33±0.02
Cambisols 19 0.96±0.85 0.11±0.13ab 6. 81±3.06
Chernozems 2 1.06±0.95 0.46±0.29 13.42±8.05
Fluvisols 7 1.16±1.50 0.18±0.14ab 8.34±2.73
Histosols 7 1.33±1.51 0.22±0.26ab 9.86±4.16
Leptosols 2 1.37±1.61 0.22±0.30 9.18±9.16
Luvisols 7 0.41±0.18 0.22±0.06a 7.31±0.88
Phaeozems 1 0.08 0.16 4.53
Podzols 1 0.09 0.06 2.60
Regosols 6 0.60±0.40 0.10±0.12ab 5.76±1.73
Solonetz 3 0.89±0.69 0.03±0.05 5.36±2.69
Vertisols 5 1.18±0.67 0.05±0.04b 6.56±1.59
Yermosols 8 0.84±0.86 0.19±0.19ab 7.43±5.67
a, ab, b ANOVA analysis performed for soil groups with more than three individuals with a Fisher test at 5 % of confidence level. The ANOVA could notdiscriminate groups with the Fisher test for Ds and migration depth
0 20 1 0 30 40 50
0.0
0.1
0.2
0.3
0.4
0.5
0.6
Elapsed time since 137Cs input (yr)
Con
vect
ion
velo
city
(cm
yr−1
)
y=−0.15ln(x)+0.59Fig. 6 Relationship betweenfitted convection velocity andtime after the main 137Cs input(i.e., global fallout and Chernobylaccident)
J Soils Sediments
3.3.4 Global penetration velocity of caesium-137
Soils compiled in the database were submitted to differentinputs of 137Cs and were sampled at various dates. Asmentioned above, these parameters control the actual depthof penetration. We modelled Ds and vs that are responsiblefor the penetration of caesium in the soils, but these param-eters did not provide a direct picture of the penetrationvelocity of caesium in the soil. To obtain it, we calculatedthe mean depth reached by 137Cs after 25 years of migration,considering that 137Cs was instantaneously injected into thesoil as a Dirac distribution representing a ‘spike’ of concen-trated 137Cs (Table 5). Mean penetration velocity of 137Csover 25 years varied between 0.05 and 0.76 cm year−1 (me-dian of 0.28 cm year−1). It was significantly lower forRegosols in which soil processes are poorly expressed andsignificantly higher in Histosols, where 137Cs may migrateunder soluble form, than in other soil groups (ANOVA witha Fisher test at a level of confidence of 5 %). When calcu-lated over 50 years, these values decreased by about 20 % inaverage because of diffusive processes and ranged from 0.04to 0.71 cm year-1 (median of 0.21 cm year−1).
3.3.5 Caesium-137 content at depth below 13 cm
As mentioned before, the distribution of scaled residualssuggested that the model underestimated the deep penetra-tion of 137Cs below 13 cm. We therefore estimated theunmodelled Cs inventory and quantified its migration rate.The proportion of the inventory underestimated by the modelbelow 13 cm ranged between −3.8 and 37.2 %, with amedian value of 1.9 %. The mean transfer rate below13 cm was then calculated by dividing the underestimatedfraction by the time after the main 137Cs input. It rangedfrom 7.5 to 44.1 years (median of 20.1 years), and theobtained rate of transfer below 13 cm varied from 0 to0.02 year−1 (median of 0.001 year−1). As discussed above,this transfer in depth could be due to the behaviour of non-local feeders. Matisoff et al. (2011) estimated that the feedingrate of non-local feeders ranged from 0.002 to 0.02 years−1
depending on the soil group. As our results are of the sameorder of magnitude, this suggests that non-local feederscould be responsible for these deep transfers.
3.3.6 Approximations in the model: implicationsfor estimating solid matter transfers
Initial distribution of radionuclides was modelled as an injec-tion at the surface (z=0), which is an oversimplification as137Cs wet deposits are inherently heterogeneous. Cs-137 ismost likely sorbed in soil macropores, and sorbing zones areaffected by preferential flow (Bundt et al. 2000), which de-pends itself on soil structure and moisture. Prediction of initial
137Cs distribution is therefore case-dependent, and as such, itis difficult to reproduce in a general modelling approach.
Furthermore, in our modelling approach, we consideredthat the diffusion and convection velocity coefficients wereconstant in time and depth. However, some authors predicteda decrease in migration velocities with time (Alexakhin andKrouglov 2001). Nevertheless, as outlined by Kirchner(1998), this apparent decrease simulated by compartmentmodels may be explained by the occurrence of the diffusiveprocess itself. The heterogeneous distribution of 137Cs canalso be a cause of this decrease: 137Cs was likely initiallylocated on the surface of macropores and aggregates and itwas then progressively incorporated within the soil matrix andbecome therefore less mobile. Nevertheless, it has been shownthat preferential flow paths (and thus the soil structure) mayremain stable for more than 40 years in soils (Bundt et al.2000). Moreover, pedogenic processes affecting the verticalsolid matter transfers such as bioturbation were recognized tobe depth-dependent (Müller-Lemans and Van Dorp 1996).Similarly, integrating non-local feeders modelling as in Jarviset al. (2010) has a direct influence on the soil displacementrate (corresponding to vs in our study), which decreasedlinearly with depth in the feeding zone. Therefore, we expectthat the inclusion of depth-variable coefficients in the modelmay improve simulations of 137Cs distributions at depths<13 cm. However, including spatially variable coefficientsin the model would require the inclusion of new parameters(at least two additional factors to account for exponentiallydecreasing Ds and vs), the improvement of the database or thecollection of additional samples and measurements in thefield.
4 Conclusions
The modelling approach proposed in this study provides anoriginal basis for comparing 137Cs depth migration in differentsoil groups. It ranged from 0.05 to 0.76 cm year−1 (median of0.28 cm year−1), with a significantly lower velocity for soilgroups poorly evolved (Regosol) and a significantly higher forsoils rich in organic matter (Histosols). The modelunderestimated this velocity under a 13-cm depth. In thefuture, the model could be improved by introducing a non-local feeder term or by allowing Ds and vs values to vary withsoil depth in the diffusion-convection equation.
Ds and vs values explained the depth profile of 137Cs insoils and were shown to partly reflect the occurrence ofturbation including bioturbation for Ds and clay translocationfor vs, except in Histosols where the transfer of 137Cs indissolved form was very likely. Ds values ranged from 0.02to 4.44 cm2 years−1 (median of 0.64 cm2 year−1) and vs varied
J Soils Sediments
from 0 to 0.74 cm year−1 (median of 0.1 cm year−1). Due to thelimited number of documented profiles per soil group andother potential sources of variability that could not be docu-mented (climate, land use or cover, pH), it was not possible toattribute precisely Ds and vs variations to the occurrence ofdifferent soil processes. However, clear trends were observedfor certain soil groups. Lower Ds values were simulated inacidic soils or under cold climate conditions, and they likelyreflected the lower-intensity bioturbation prevailing underthose pedoclimatic conditions. In addition, high vs values weresimulated in soils submitted to clay translocation (notablyLuvisols). A relationship was also derived between vs andcertain land uses or covers. In this context, our results showedthat modelling 137Cs depth profile with a diffusion-convectionequation allowed estimating the bioturbation and clay trans-location velocity in a certain number of soil groups. Althoughthe occurrence of these soil processes is well-known in mostsoils, they have been rarely quantified. Still, this quantificationis crucial as these processes partially control the developmentof soil surface characteristics and several soil services such asplant nutrition, organic carbon storage or pollutant fixation. Inthe future, to overcome the limitations associated with themodelling of diffusion-convection parameters based on137Cs measurements, we suggest to conduct a multi-isotopiccharacterisation of different types of soil profiles in order toquantify the relative contribution of the different processesresponsible for vertical solid matter transfer.
Acknowledgments The authors are grateful to Dr. Jérôme Balesdentfor his helpful advises, as well to Dr. Frédéric Golay, Dr. CédricGalusinski and Dr. Gloria Faccanoni for their help with model simula-tions. We thank the French Research Agency (ANR) that funded theAgriped project (ANR 10 Blanc 605). M. Jagercikova received a PhDfellowship from the French National Institute of Agronomy (INRA). Weare also grateful to Dr. Luise Giani, Dr. Gwen Milton, Dr. ConcepciónOlondo Castro and Dr. Klas Rosén for kindly providing their soil datasetsand additional information regarding their studies.
References
AIEA (2010) Handbook of parameter values for the prediction of radio-nuclide transfer in terrestrial and freshwater environments. TechnicalReports SeriEs No. 472. International Atomic Energy Agency
Alexakhin RM, Krouglov SV (2001) Soil as the main compartment forradioactive substances in terrestrial ecosystems. In: Bréchignac F,Howard BJ (eds) Radioactive pollutants. Impact on the environ-ment, EDP Sciences, Les Ulis, France, pp 149–174
Al-Masri M (2006) Vertical distribution and inventories of Cs-137 in theSyrian soils of the easternMediterranean region. J Environ Radioact86:187–198
Aoyama M, Hirose K, Igarashi Y (2006) Re-construction and updatingour understanding on the global weapons test 137Cs fallout. JEnviron Monit 8:431–438
Ben Slimane A, Raclot D, Evrard O, Sanaa M, Lefèvre I, AhmadiM, Tounsi M, Rumpel C, Ben Mammou A, Le Bissonnais Y(2013) Fingerprinting sediment sources in the outlet reservoir
of a hilly cultivated catchment of Tunisia. J Soils Sediments13:801–815
Bockheim J, Gennadiyev A (2000) The role of soil-forming processes inthe definition of taxa in soil taxonomy and the world soil referencebase. Geoderma 95:53–72
Bossew P, Kirchner G (2004) Modelling the vertical distribution ofradionuclides in soil. Part 1: the convection–dispersion equationrevisited. J Environ Radioact 73:127–150
Bundt M, Albrecht A, Froidevaux P, Blaser P, Flühler H (2000) Impact ofpreferential flow on radionuclide distribution in soil. Environ SciTech 34:3895–3899
Bunzl K (2002) Transport of fallout radiocesium in the soil by bioturba-tion: a random walk model and application to a forest soil with ahigh abundance of earthworms. Sci Total Environ 293:191–200
Bunzl K, Kracke W, Schimmack W, Zelles L (1998) Forms of fallout Cs-137 and Pu239 + 240 in successive horizons of a forest soil. JEnviron Radioact 39:55–68
Bunzl K, Schimmack W, Zelles L, Albers B (2000) Spatial variability ofthe vertical migration of fallout Cs-137 in the soil of a pasture, andconsequences for long-term predictions. Radiat Environ Biophys39:197–205
Cambray RS, Playford K, Lewis G, Carpenter R (1989) Radioactivefallout in air and rain: results to the end of 1988. Environmentaland Medical Sciences Division, United Kingdom Atomic EnergyAuthority
Chartin C, Evrard O, Onda Y, Patin J, Lefèvre I, Ayrault S, Lepage H,Bonté P (2013) Tracking the early dispersion of contaminatedsediment along rivers draining the Fukushima radioactive pollutionplume. Anthropocene 1:23–34
Cremers A, Elsen A, Depreter P, Maes A (1988) Quantitative-analysis ofradiocesium retention in soils. Nat 335:247–249
De Cort M, Dubois G, Fridman SD, Germenchuk MG, Izrael YA,Janssens A, Jones AR, Kelly GN, Kvasnikova EV, Matveenko II,Nazarov IM, Pokumeiko YM, Sitak VA, Stukin ED, Tabachnyi LY,Tsaturov YS, Avdyushin SI (1996) Atlas of caesium deposition onEurope after the Chernobyl accident. EUR Report 16733, EC.Office for Official Publications of the European Communities,Luxembourg
De Vos B, Van Meirvenne M, Quataert P, Deckers J, Muys B (2005)Predictive quality of pedotransfer functions for estimating bulkdensity of forest soils. Soil Sci Soc Am J 69:500–510
Elshamy M, Mathias S, Butler A (2007) Demonstration of radionuclidetransport modelling under field conditions: 50-year simulation ofcaesium migration in soil. Tech. Rep. Imperial/ NRP_016, UnitedKingdom Nirex Limited
Elzein A, Balesdent J (1995) Mechanistic simulation of vertical distribu-tion of carbon concentrations and residence times in soils. Soil SciSoc Am J 59:1328–1335
FAO (1998) World reference base for soil resources. World SoilResources Rep. 84, Rome
Gallagher D, McGee E, Mitchell P (2001) A recent history of C-14, Cs-137, Pb-210, and Am-241 accumulation at two Irish peat bog sites:An east versus west coast comparison. Radiocarbon 43:517–525
Gil-Garcia C, Rigol A, Vidal M (2009) New best estimates forradionuclide solid liquid distribution coefficients in soils. Part1: radiostrontium and radiocaesium. J Environ Radioact 100:690–696
He Q, Walling D (1997) The distribution of fallout Cs-137 and Pb-210 inundisturbed and cultivated soils. App Radiat Isot 48:677–690
Ireson M, Butler A (2009) A review of soil bioturbation and soil devel-opment. Tech. Rep. Imperial/NRP_018, United Kingdom NirexLimited
Isaksson M, Erlandsson B, Mattsson S (2001) A 10-year study ofthe Cs-137 distribution in soil and a comparison of Cs soilinventory with precipitation-determined deposition. J EnvironRadioact 55:47–59
J Soils Sediments
Jarvis NJ, Taylor A, Larsbo M, Etana A, Rosen K (2010) Modelling theeffects of bioturbation on the re-distribution of 137Cs in an undis-turbed grassland soil. Eur J Soil Sci 61:24–34
Karadeniz O, Yaprak G (2008) Geographical and vertical distribution ofradiocesium levels in coniferous forest soils in Izmir. J RadioanalNucl Chem 277:567–577
Kaste JM, Heimsath AM, Bostick BC (2007) Short-term soil mixingquantified with fallout radionuclides. Geol 35:243–246
Kirchner G (1998) Applicability of compartmental models for simulatingthe transport of radionuclides in soil. J Environ Radioact 38:339–352
Konoplev A, Bulgakov A, Popov V, Hilton J, Comans R (1996) Long-term investigation of Cs-137 fixation by soils. Radiat Prot Dosim64:15–18
Korsakissok I, Mathieu A, Didier D (2013) Atmospheric dispersion andground deposition induced by the Fukushima nuclear power plantaccident: a local-scale simulation and sensitivity study. AtmosEnviron 70:267–279
KottekM, Grieser J, Beck C, Rudolf B, Rubel F (2006)World map of theKoppen Geiger climate classification updated. Meteorol Z 15(3):259–263
Krstic D, Nikezic D, Stevanovic N, Jelic M (2004) Vertical profile of137Cs in soil. App Radiat Isot 61:1487–1492
Kruse-Irmer S, Giani L (2003) Vertical distribution and bioavailability of Cs-137 in organic and mineral soils. J Plant Nutr Soil Sci 166:635–641
Legarda F, Romero LM, Herranz M, Barrera M, Idoeta R, Valino F,Olondo C, Caro A (2011) Inventory and vertical migration of Cs-137 in Spanish mainland soils. J Environ Radioact 102:589–597
Mabit L, Benmansour M, Walling DE (2008) Comparative advantagesand limitations of the fallout radionuclides Cs-137, Pb-210(ex) andBe-7 for assessing soil erosion and sedimentation. J EnvironRadioactiv 99:1799–1807
Matisoff G, Ketterer ME, Rosen K, Mietelski JW, Vitko LF, Persson H,Lokas E (2011) Downward migration of Chernobyl-derived radio-nuclides in soils in Poland and Sweden. Appl Geochem 26:105–115
Milton G, Kramer S, WatsonW, Kotzer T (2001) Qualitative estimates ofsoil disturbance in the vicinity of CANDU stations, utilizing mea-surements of Cs-137 and Pb- 210 in soil cores. J Environ Radioact55:195–205
Müller-Lemans H, van Dorp F (1996) Bioturbation as a mechanism forradionuclide transport in soil: relevance of earthworms. J EnvironRadioact 31:7–20
Parsons AJ, Foster IDL (2011)What can we learn about soil erosion fromthe use of 137Cs? Earth-Sci Rev 108:101–113
Quénard L, Samouelian A, Laroche B, Cornu S (2011) Lessivage as amajor process of soil formation: a revisitation of existing data.Geoderma 167–168:135–147
Ritchie JC, Ritchie CA (2007) Bibliography of publications of 137cesiumstudies related to erosion and sediment deposition. Tech. rep.,USDA Agricultural Research Service
Rosén K, Öborn I, Lönsjö H (1999) Migration of radiocaesium inSwedish soil profiles after the Chernobyl accident, 1987–1995. JEnviron Radioact 46:45–66
Sawhney B (1972) Selective sorption and fixation of cations by clayminerals: a review. Clays Clay Miner 20:93–100
Schiffers K, Teal LR, Travis JMJ, Solan M (2011) An open sourcesimulation model for soil and sediment bioturbation. PLoS ONE6:e28028
SchimmackW,Márquez FF (2006)Migration of fallout radiocaesium in agrassland soil from 1986 to 2001. Part II: evaluation of the activity-depth profiles by transport models. Sci Total Environ 368:863–874
Schimmack W, Schultz W (2006) Migration of fallout radiocaesium in agrassland soil from 1986 to 2001—part I: activity-depth profiles ofCs-134 and Cs-137. Sci Total Environ 368:853–862
Schuller P, Ellies A, Kirchner G (1997) Vertical migration of fallout Cs-137 in agricultural soils from Southern Chile. Sci Total Environ 193:197–205
Schuller P, Bunzl K, Voigt G, Ellies A, Castillo A (2004) Global falloutCs-137 accumulation and vertical migration in selected soils fromSouth Patagonia. J Environ Radioactiv 71:43–60
Sigurgeirsson MA, Arnalds O, Palsson SE, Howard BJ, Gudnason K(2005) Radiocaesium fallout behaviour in volcanic soils in Iceland. JEnviron Radioact 79:39–53
Smith JT, Elder DG (1999) A comparison of models for characterizingthe distribution of radionuclides with depth in soils. Eur J Soil Sci50:295–307
Soil Survey Staff (1999) Soil taxonomy: a basic system of soil classifi-cation for making and interpreting soil surveys, 2nd edn. USDepartment of Agriculture, Agriculture Handbook, N° 436,Washington
Szerbin P, Koblinger-Bokori E, Koblinger L, Vegvari I, Ugron A (1999)Caesium- 137 migration in Hungarian soils. Sci Total Environ 227:215–227
Tamura T, Jacobs D (1960) Structural implications in cesium sorption.Health Phys 2:391–398
Turner NB, Ryan JN, Saiers JE (2006) Effect of desorption kinetics oncolloid facilitated transport of contaminants: cesium, strontium, andillite colloids. Water Resour Res 42:W12S09
Tyler A, Carter S, Davidson D, Long D, Tipping R (2001) The extent andsignificance of bioturbation on Cs-137 distributions in upland soils.Catena 43:81–99
UNSCEAR (1982) Ionizing radiation: sources and biological effectsreport to the general assembly, with annexes. Tech. rep., UnitedNations, New York
Vandebroek L, Van Hees M, Delvaux B, Spaargaren O, Thiry Y (2012)Relevance of radiocaesium interception potential (RIP) on a world-wide scale to assess soil vulnerability to 137Cs contamination. JEnviron Radioact 104:87–93
VandenBygaart A, Protz R, Tomlin A, Miller J (1998) Cs-137 asan indicator of earthworm activity in soils. Appl Soil Ecol 9:167–173
Wilkinson MT, Richards PJ, Humphreys GS (2009) Breaking ground:pedological, geological, and ecological implications of soil biotur-bation. Earth Sci Rev 97:257–272
Zhang X, Qi Y, Walling DE, He X, Wen A, Fu J (2006) A preliminaryassessment of the potential for using Pb-210(ex) measurement toestimate soil redistribution rates on cultivated slopes in the Sichuanhilly basin of China. Catena 68:1–9
Zhang X, Long Y, He X, Fu J, Zhang Y (2008) A simplified (CS)-C-137transport model for estimating erosion rates in undisturbed soil. JEnviron Radioactiv 99:1242–1246
Zheng JJ, He XB, Walling D, Zhang XB, Flanagan D, Qi YQ (2007)Assessing soil erosion rates on manually-tilled hillslopes in theSichuan hilly basin using Cs-137 and Pb-210(ex) measurements.Pedosphere 17:273–283
J Soils Sediments
Related Documents