HYDROLOGICAL PROCESSES Hydrol. Process. 25, 886–900 (2011) Published online 21 October 2010 in Wiley Online Library (wileyonlinelibrary.com) DOI: 10.1002/hyp.7874 Using 137 Cs measurements to establish catchment sediment budgets and explore scale effects Paolo Porto, 1,2 * Desmond E. Walling 1 and Giovanni Callegari 3 1 Department of Geography—University of Exeter, Exeter, UK 2 Dipartimento di Scienze e Tecnologie Agro-Forestali e Ambientali—Universit` a degli Studi Mediterranea di Reggio Calabria, Italy 3 CNR—Istituto per i Sistemi Agricoli e Forestali del Mediterraneo, Sezione Ecologia e Idrologia Forestale, Rende (CS), Italy Abstract: Growing awareness of the wider environmental significance of fine sediment transport by rivers and associated sediment problems linked to sediment–water quality interactions, nutrient and contaminant transfer, and the degradation of aquatic habitats has resulted in the need for an improved understanding of the mobilization and transfer of sediment in catchments to support the development of effective sediment management strategies. The sediment budget provides a key integrating concept for assembling information on the internal functioning of a catchment in terms of its sediment dynamics by providing information on the mobilization, transfer, storage and output of sediment. One key feature of a catchment sediment budget is the relationship between the sediment yield at the catchment outlet and rates of sediment mobilization and transfer within the catchment, which is commonly represented by the sediment delivery ratio. To date, most attempts to derive estimates of this ratio have been based on a comparison of the measured sediment yield from a catchment with an estimate of the erosion occurring within the catchment, derived from an erosion prediction procedure, such as the Universal Soil Loss Equation (USLE) or its revised version, RUSLE. There is a need to obtain more direct and spatially distributed evidence of the erosion rates occurring within a catchment and to characterize the links between sediment mobilization, transfer, storage and output more explicitly. In this context, fallout radionuclides have proved particularly useful as sediment tracers. This paper reports the results of a study aimed at exploring the use of caesium-137 ( 137 Cs) measurements to establish sediment budgets for three catchments of different sizes and contrasting land use located in Calabria, southern Italy. Long-term measurements of sediment output were available for the catchments, and, by using the estimates of gross and net rates of soil loss within the catchments provided by 137 Cs measurements, it was possible to establish the key components of the sediment budget for each catchment. By documenting the sediment budgets of three catchments of different sizes, the study provides a basis for exploring the effects of scale on catchment sediment budgets and, in particular, the increasing importance of catchment storage as the size of the catchment increases. The results of this study demonstrate a reduction in the sediment delivery ratio from 98 to 2% as catchment area increases from 1Ð47 ha to 31Ð2 km 2 . Copyright 2010 John Wiley & Sons, Ltd. KEY WORDS 137 Cs; sediment delivery; sediment budget; scale effect Received 1 January 2010; Accepted 19 August 2010 INTRODUCTION Traditionally, sediment investigations in drainage basins have focused on measuring the sediment load or yield at the basin outlet or at key points along a river. Such infor- mation was required to address problems associated with reservoir sedimentation, the siltation of river channels and water distribution networks and the use and treat- ment of water containing appreciable amounts of fine sediment. It also provided a general assessment of the intensity of land degradation within the catchment. More recently, a growing awareness of the wider environmen- tal significance of the fine sediment loads of rivers linked to sediment–water quality interactions, the importance of fine sediment in the transfer and fate of sediment- associated pollutants and contaminants, including pesti- cides and other organic pollutants (Stone, 2000; Warren et al., 2003), and the role of fine sediment in degrading * Correspondence to: Paolo Porto, Department of Geography— University of Exeter, Exeter, UK. E-mail: [email protected]; [email protected] aquatic habitats, through, for example, the siltation of fish-spawning gravels and the smothering of aquatic veg- etation and benthic habitats (Wood and Armitage, 1999; Soulsby et al., 2001; Heywood and Walling, 2007), has promoted increased interest in sediment investigations. Furthermore, whereas sediment investigations have tradi- tionally been undertaken primarily in areas with relatively high sediment loads, these new problems are frequently of particular relevance in areas with relatively low sed- iment loads, which are highly sensitive to changes in sediment mobilization and transport. These changing per- spectives have been paralleled by changing needs in the investigation of the sediment dynamics of catchments and river systems. The wider environmental concerns noted above also require information on the mobilization, delivery and storage of fine sediment within the entire catchment and introduce the need for new approaches to investigate the sediment dynamics of a catchment. In areas where erosion rates and sediment yields are relatively low, obtaining information on the mobiliza- tion, delivery and storage of sediment may prove more Copyright 2010 John Wiley & Sons, Ltd.

Welcome message from author
This document is posted to help you gain knowledge. Please leave a comment to let me know what you think about it! Share it to your friends and learn new things together.
Transcript
HYDROLOGICAL PROCESSESHydrol. Process. 25, 886–900 (2011)Published online 21 October 2010 in Wiley Online Library(wileyonlinelibrary.com) DOI: 10.1002/hyp.7874
Using 137Cs measurements to establish catchment sedimentbudgets and explore scale effects
Paolo Porto,1,2* Desmond E. Walling1 and Giovanni Callegari3
1 Department of Geography—University of Exeter, Exeter, UK2 Dipartimento di Scienze e Tecnologie Agro-Forestali e Ambientali—Universita degli Studi Mediterranea di Reggio Calabria, Italy
3 CNR—Istituto per i Sistemi Agricoli e Forestali del Mediterraneo, Sezione Ecologia e Idrologia Forestale, Rende (CS), Italy
Abstract:
Growing awareness of the wider environmental significance of fine sediment transport by rivers and associated sedimentproblems linked to sediment–water quality interactions, nutrient and contaminant transfer, and the degradation of aquatichabitats has resulted in the need for an improved understanding of the mobilization and transfer of sediment in catchmentsto support the development of effective sediment management strategies. The sediment budget provides a key integratingconcept for assembling information on the internal functioning of a catchment in terms of its sediment dynamics by providinginformation on the mobilization, transfer, storage and output of sediment. One key feature of a catchment sediment budgetis the relationship between the sediment yield at the catchment outlet and rates of sediment mobilization and transfer withinthe catchment, which is commonly represented by the sediment delivery ratio. To date, most attempts to derive estimates ofthis ratio have been based on a comparison of the measured sediment yield from a catchment with an estimate of the erosionoccurring within the catchment, derived from an erosion prediction procedure, such as the Universal Soil Loss Equation(USLE) or its revised version, RUSLE. There is a need to obtain more direct and spatially distributed evidence of the erosionrates occurring within a catchment and to characterize the links between sediment mobilization, transfer, storage and outputmore explicitly. In this context, fallout radionuclides have proved particularly useful as sediment tracers. This paper reportsthe results of a study aimed at exploring the use of caesium-137 (137Cs) measurements to establish sediment budgets for threecatchments of different sizes and contrasting land use located in Calabria, southern Italy. Long-term measurements of sedimentoutput were available for the catchments, and, by using the estimates of gross and net rates of soil loss within the catchmentsprovided by 137Cs measurements, it was possible to establish the key components of the sediment budget for each catchment.By documenting the sediment budgets of three catchments of different sizes, the study provides a basis for exploring theeffects of scale on catchment sediment budgets and, in particular, the increasing importance of catchment storage as the sizeof the catchment increases. The results of this study demonstrate a reduction in the sediment delivery ratio from 98 to 2% ascatchment area increases from 1Ð47 ha to 31Ð2 km2. Copyright 2010 John Wiley & Sons, Ltd.
KEY WORDS 137Cs; sediment delivery; sediment budget; scale effect
Received 1 January 2010; Accepted 19 August 2010
INTRODUCTION
Traditionally, sediment investigations in drainage basinshave focused on measuring the sediment load or yield atthe basin outlet or at key points along a river. Such infor-mation was required to address problems associated withreservoir sedimentation, the siltation of river channelsand water distribution networks and the use and treat-ment of water containing appreciable amounts of finesediment. It also provided a general assessment of theintensity of land degradation within the catchment. Morerecently, a growing awareness of the wider environmen-tal significance of the fine sediment loads of rivers linkedto sediment–water quality interactions, the importanceof fine sediment in the transfer and fate of sediment-associated pollutants and contaminants, including pesti-cides and other organic pollutants (Stone, 2000; Warrenet al., 2003), and the role of fine sediment in degrading
* Correspondence to: Paolo Porto, Department of Geography—University of Exeter, Exeter, UK.E-mail: [email protected]; [email protected]
aquatic habitats, through, for example, the siltation offish-spawning gravels and the smothering of aquatic veg-etation and benthic habitats (Wood and Armitage, 1999;Soulsby et al., 2001; Heywood and Walling, 2007), haspromoted increased interest in sediment investigations.Furthermore, whereas sediment investigations have tradi-tionally been undertaken primarily in areas with relativelyhigh sediment loads, these new problems are frequentlyof particular relevance in areas with relatively low sed-iment loads, which are highly sensitive to changes insediment mobilization and transport. These changing per-spectives have been paralleled by changing needs in theinvestigation of the sediment dynamics of catchmentsand river systems. The wider environmental concernsnoted above also require information on the mobilization,delivery and storage of fine sediment within the entirecatchment and introduce the need for new approachesto investigate the sediment dynamics of a catchment.In areas where erosion rates and sediment yields arerelatively low, obtaining information on the mobiliza-tion, delivery and storage of sediment may prove more
Copyright 2010 John Wiley & Sons, Ltd.
137CS MEASUREMENTS AND SCALE EFFECTS 887
difficult than in areas where such processes are moreactive and therefore more amenable to visual assessment.In this context, Walling (2006) has demonstrated the needto combine more traditional monitoring techniques withtracing techniques that are able to provide spatially dis-tributed information on the mobilization and transfer offine sediment through the fluvial system. Fallout radionu-clides, including caesium-137 (137Cs), unsupported orexcess lead-210 (210Pbex) and beryllium-7 (7Be), haveproved particularly useful as sediment tracers in this con-text (Loughran et al., 1992; Zapata, 2002; Walling, 2004,2006; Porto et al., 2009).
The sediment budget provides a key integrating con-cept for assembling information on the internal function-ing of a catchment in terms of its sediment dynamics byproviding information on the mobilization, transfer, stor-age and output of sediment. Establishment of a catchmentsediment budget can both provide an improved under-standing of catchment functioning and assist the designand implementation of effective sediment managementstrategies (Walling and Collins, 2008). One importantcomponent of a catchment sediment budget is the rela-tionship between the sediment yield at the catchment out-let and rates of sediment mobilization and transfer withinthe catchment. The sediment delivery ratio (Walling,1983), which represents the ratio of the sediment yieldat the catchment outlet to the gross erosion occurringwithin the catchment, has traditionally provided a spa-tially lumped representation of this relationship. To date,however, most attempts to derive estimates of this ratiohave been based on a comparison of the measured sed-iment yield from a catchment with an estimate of theerosion occurring within the catchment, derived from anerosion prediction procedure, such as the Universal SoilLoss Equation (USLE) (Wischmeier and Smith, 1978) orits revised version, RUSLE (Renard et al., 1994). There isa need to obtain more direct and spatially distributed evi-dence of the erosion rates occurring within a catchmentand to characterize the links between sediment mobiliza-tion, transfer, storage and output more explicitly. Whenlinked to the catchment sediment budget, such informa-tion provides a valuable indication of the extent to whichthe sediment yield measured at a catchment outlet pro-vides a meaningful assessment of rates of soil loss ordegradation within the upstream catchment, the likelysensitivity of the sediment output from a catchment tochanges in the erosion rates within the catchment, such asmight be caused by climate or land use change, and thepotential for implementing soil conservation and othersediment control measures to reduce downstream sedi-ment loads and related sediment problems.
This paper reports the results of a study aimed atexploring the use of 137Cs measurements to establishsediment budgets for three catchments of different sizesand contrasting land use located in Calabria, southernItaly. By including catchments of different sizes, itwas hoped to both assess the potential for using 137Csmeasurements to document soil redistribution rates atdifferent scales and to examine the influence of scale or
catchment size on the form of the catchment sedimentbudget. Long-term measurements of sediment outputwere available for the study catchments, and, by usingthe estimates of gross and net rates of soil loss withinthe catchments provided by 137Cs measurements, itwas possible to establish the key components of theirsediment budgets. Some of the results of the 137Csmeasurements undertaken in two of the catchments havebeen published previously (Porto et al., 2004, 2009).However, this paper introduces equivalent data froma third contrasting catchment, focuses attention on thecatchment sediment budgets, rather than rates of soil lossand uses the information from the three catchments ofvarying sizes to examine scale effects on the functioningof catchment sediment budgets.
THE STUDY CATCHMENTS
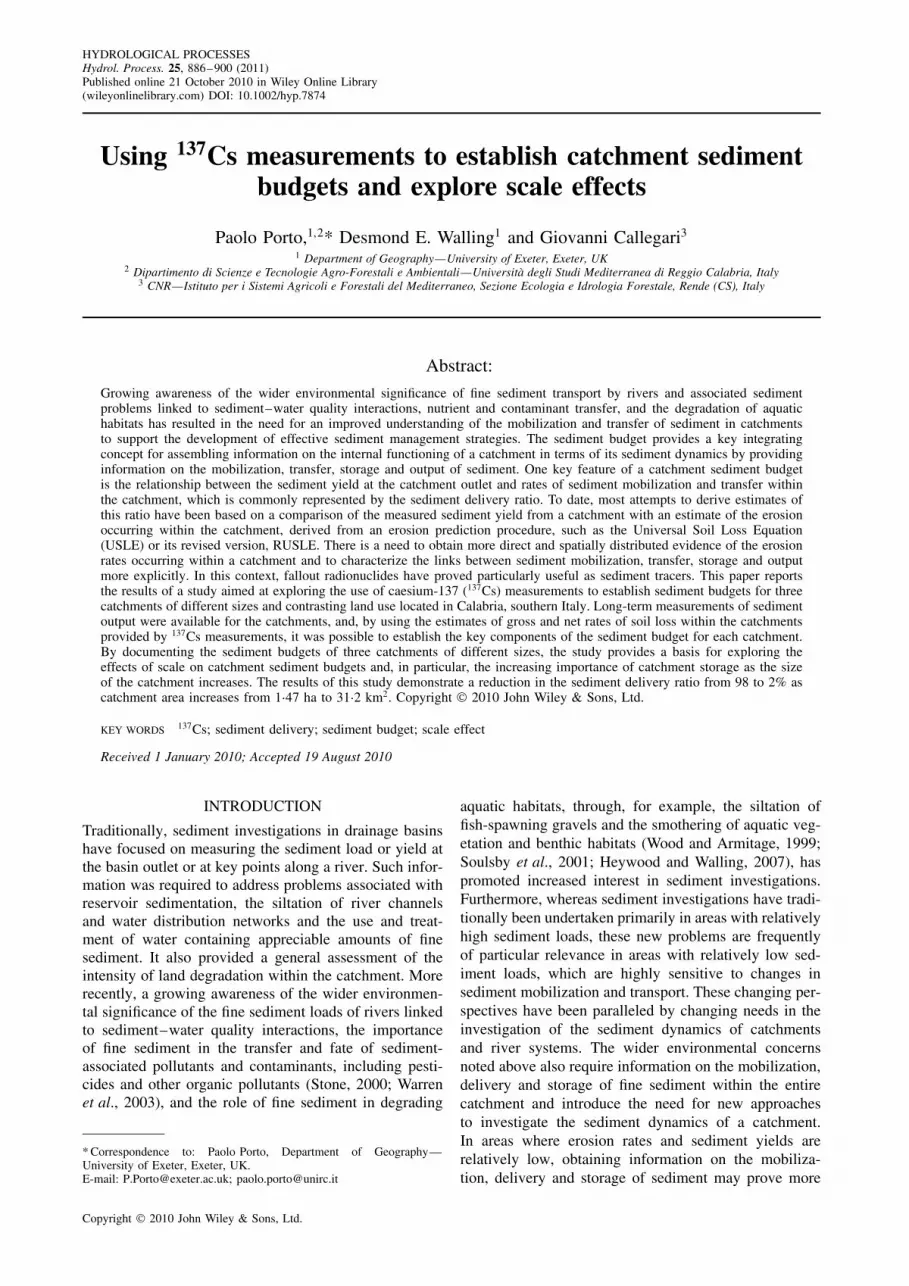
The investigation focuses on three contrasting catchmentslocated in Calabria, southern Italy, namely catchmentW1 at Crotone, the Bonis catchment and the Triontocatchment (Figure 1). Catchment W1 (Figure 1a), thesmallest catchment, with a drainage area of 1Ð47 haand a mean elevation of 122 m a.s.l., is located in theephemeral headwaters of the larger Crepacuore basin,which is incised into the local Upper Pliocene andQuaternary clays, sandy clays and sands. This catchmenthas never been cultivated and supports a rangelandvegetation cover dominated by Lygeum spartum andAtriplex halimus (Avolio et al., 1980). The ephemeralchannel network in this catchment is poorly developedand field observations indicate that such channels areof very limited importance as a sediment source. Thedominant soils are classified as regosols and exhibit anAp-C profile with non-homogenous depth. The climateof the area is typically Mediterranean, with a meanannual precipitation of ¾670 mm, most of which fallsduring the period extending from October to March. Thiscatchment was instrumented in 1978 to provide records ofrainfall, runoff and sediment yield (Avolio et al., 1980).Precipitation has been recorded using a tipping bucketrain gauge and runoff is measured at the outlet of thecatchment using an H-flume structure equipped with amechanical stage recorder. The sediment load passing thegauging structure is measured using a Coshocton wheelsampler installed below the H-flume (Porto et al., 2004).
The Bonis catchment (Figure 1b) is located in themountain area of Sila Greca, at a mean elevation of1131 m a.s.l. The catchment has a drainage area of1Ð39 km2, most of which (ca 93%) is covered by for-est stands, dominated by Calabrian pine (Pinus laricioPoiret). Small areas covered by chestnut (Castanea sativaMill.) and some areas of riparian forest comprising com-mon alder (Alnus glutinosa L.) are also present. A smallproportion of the catchment (about 6% of the drainagearea) has no tree cover and is largely devoid of vegeta-tion. These areas are highly susceptible to erosion duringperiods of heavy rainfall. Geologically, the catchment is
Copyright 2010 John Wiley & Sons, Ltd. Hydrol. Process. 25, 886–900 (2011)
888 P. PORTO, D. E. WALLING AND G. CALLEGARI
145
135
125
115
105
95
Height (m)
20m
W1Site 1
12°E
40°NStudy areas
1240
1200
1160
1120
1080
1040
Height (m)
200m
Bonis
Catchment outlet
Sampling siteReference sampling site
Site 2
Site 1
Site 3
1300
1250
1200
1150
1100
1050
Height (m)
0 2km
Trionto
Site 1 Site 1
Site 2 Site 2 Site 2 Site 2
Trionto Site 3
(A) (B)
(C)
Figure 1. The study catchments: (A) W1, (B) Bonis and (C) Trionto
underlain by acid plutonic rocks (Callegari et al., 2003)that support sandy soils characterized as Typic Xerum-brepts and Ulpic Haploxeralfs. The climate of the areais typical of that of the mountain areas of Calabria,with a short dry period in summer and rainfall almostuniformly distributed though the period extending fromSeptember to April. The catchment was instrumented in1986. Rainfall is measured by three rain gauges locatedat the basin outlet (975 m a.s.l.) and at representativesites within the north-eastern (1258 m a.s.l.) and south-western (1175 m a.s.l.) parts of the catchment. The meanannual precipitation for the catchment is estimated to be¾1250 mm. Runoff is measured at the catchment out-let using a gauging structure comprising a concrete-linedchannel and equipped with a mechanical stage recordercapable of measuring discharges up to ca 17 m3 s�1. Atthe downstream end of the concrete-lined channel, a largestilling basin (8 m ð 15 m ð 2 m) constructed of rein-forced concrete was built to trap and collect the sedimentpassing through the monitoring system. Observations dur-ing storm events confirmed that this stilling basin had ahigh trap efficiency and therefore intercepted a large pro-portion of the sediment output from the catchment. Thestilling basin was periodically emptied and the mass ofthe deposited sediment was documented by surveying thesurface topography of the deposits and comparing this
with the elevation of the base of the stilling basin andthe adjacent concrete channel.
The Trionto catchment (Figure 1c), located on theSila Plateau of central Calabria, has a drainage areaof 31Ð61 km2 and ranges in altitude from 1467 m a.s.l.at the highest point (Mt Paleparto) to 983 m a.s.l.at the catchment outlet (Difesella). Geologically, thecatchment is underlain by a number of contrasting rocktypes, including sedimentary rocks (mainly flysch-typeunits), intrusive igneous rocks and intermediate and high-grade metamorphic rocks associated with crustal Alpineunits (Sorriso-Valvo, 1993; Molin et al., 2004). Detailedsurveys undertaken by Dimase and Iovino (1996) haveshown that the soils developed on these rock types arecharacterized by a range of textures, although sandyand silt-sandy soils are dominant. Large areas of thecatchment are cultivated and only a small part is coveredby trees, which primarily include pines (Pinus laricio P.),but also some beech (Fagus sylvatica L.) and chestnut(Castanea sativa Mill.) and some stands of alder (Alnusglutinosa L.), willow (Salix spp.) and aspen (Populusspp.) along the river corridors.
Precipitation is almost uniformly distributed throughthe period extending from October to March; but in springand summer frequent heavy rainstorms can occur andthese account for ca 20–25% of the annual total. This
Copyright 2010 John Wiley & Sons, Ltd. Hydrol. Process. 25, 886–900 (2011)
137CS MEASUREMENTS AND SCALE EFFECTS 889
catchment was monitored by the Italian HydrographicService (SIMI) during the period 1964–1979. The meanannual rainfall depends heavily on altitude and distancefrom the sea and, for the period 1922–2000, ranged from990 mm measured at Acri (39°2903800N, 16°230400E), to1302 at Longobucco (39°2605700N, 16°3604000E) (SIMI,1920–2000). Records of runoff and sediment output areavailable for the catchment outlet for the same period.The sediment load data are based on suspended sedimentsampling.
SEDIMENT OUTPUT FROM THE STUDYCATCHMENTS
Catchment W1
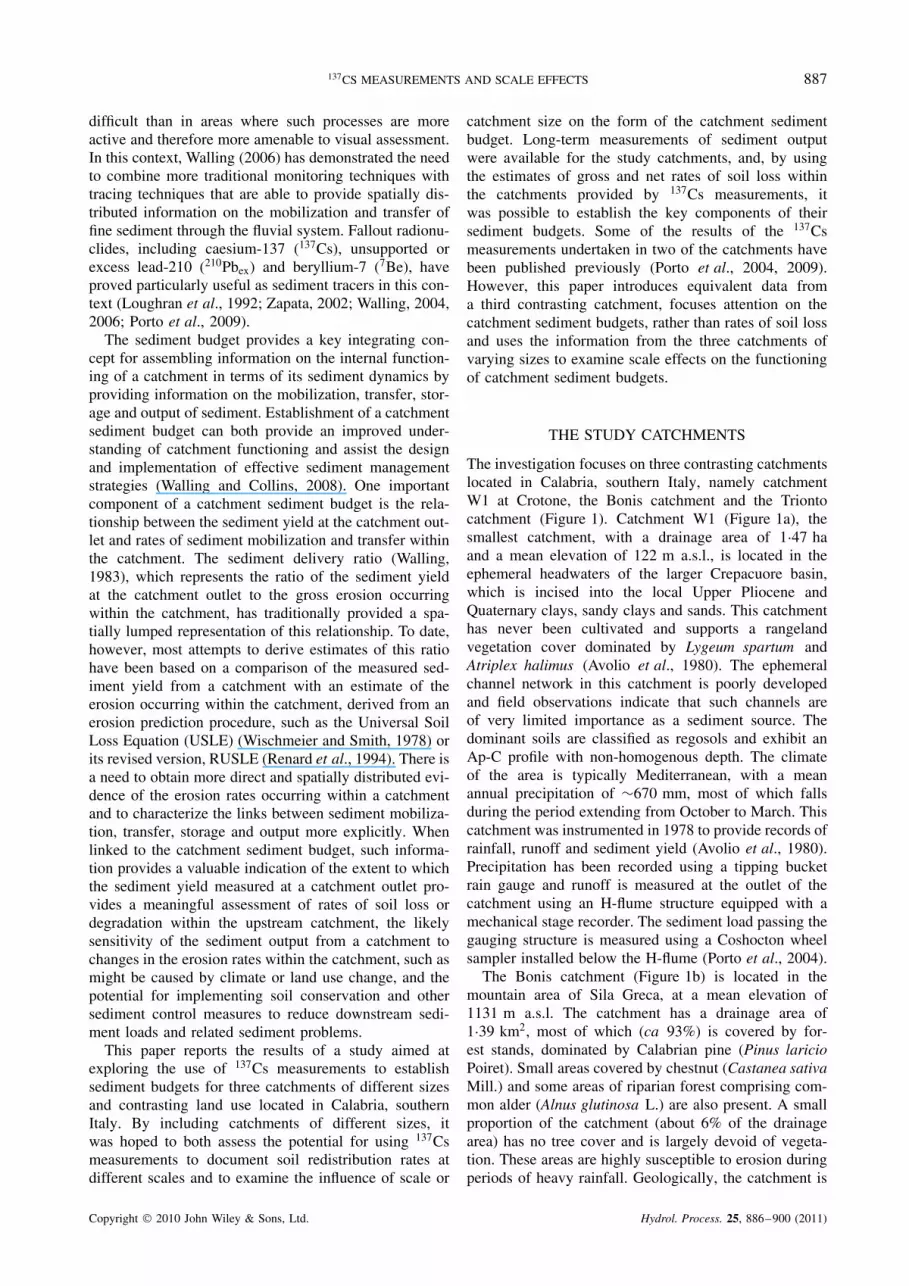
A record of sediment yield associated with individualevents is available for catchment W1 from 1978 to 1994.Because of malfunctioning of the sediment samplingequipment, values of sediment yield are not available forca 15% of the events. The sediment loads for these eventswere estimated using the sediment delivery distributed(SEDD) model (Ferro and Porto, 2000) and incorporatedinto the record. The record of annual sediment yield forthe catchment is shown in Figure 2. The mean annualspecific sediment yield from this catchment has beenestimated to be 11Ð6 t ha�1 year�1(Porto et al., 2004).
The Bonis catchment
Two field campaigns were undertaken in 2000 and2003 aimed at quantifying the amount of sedimentaccumulated in the stilling basin and adjacent concrete
1978
1979
1980
1981
1982
1983
1984
1985
1986
1987
1988
1989
1990
1991
1992
1993
1994
0
5
10
15
20
25
30
35
40
Sed
imen
t out
put t
ha-1
yr-1
W1
Year
Figure 2. The record of annual sediment yield for catchment W1
channel during the period from November 1998 to August2003. On both the occasions, prior to emptying thestilling basin, the elevation of the sediment depositswithin the stilling basin and within the adjacent channelwas determined using a sampling grid. A total of 267 and95 measuring points were established for the 2000 andthe 2003 campaigns. In each case, the sediment depth wasestablished by comparison of the surface elevation withmeasurements of the base of the stilling basin obtained forthe same points when the sediment was removed. Duringeach of the field surveys, a total of 80 sediment sampleswere also collected using a 1-m coring tube in order toestimate the bulk density of the sediment. Most of thedeposited sediment comprised silt and fine sand, with atexture that was similar to the soils of the catchment.By linking the mass of sediment accumulated in thestilling basin and adjacent channel to the 5-year periodof accumulation, the mean annual sediment output fromthe catchment was estimated to be 0Ð25 t ha�1 year�1
(Table I).
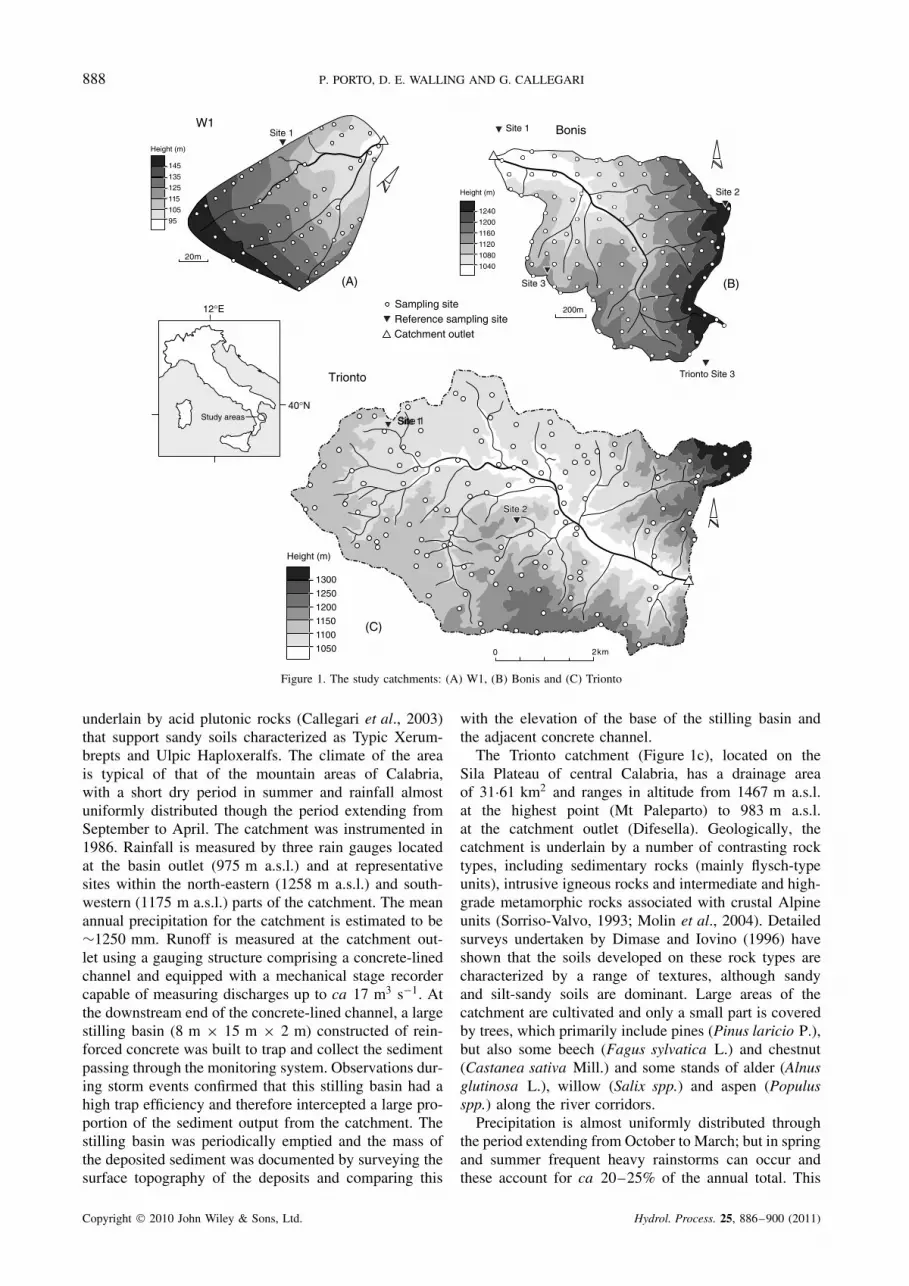
The Trionto catchment
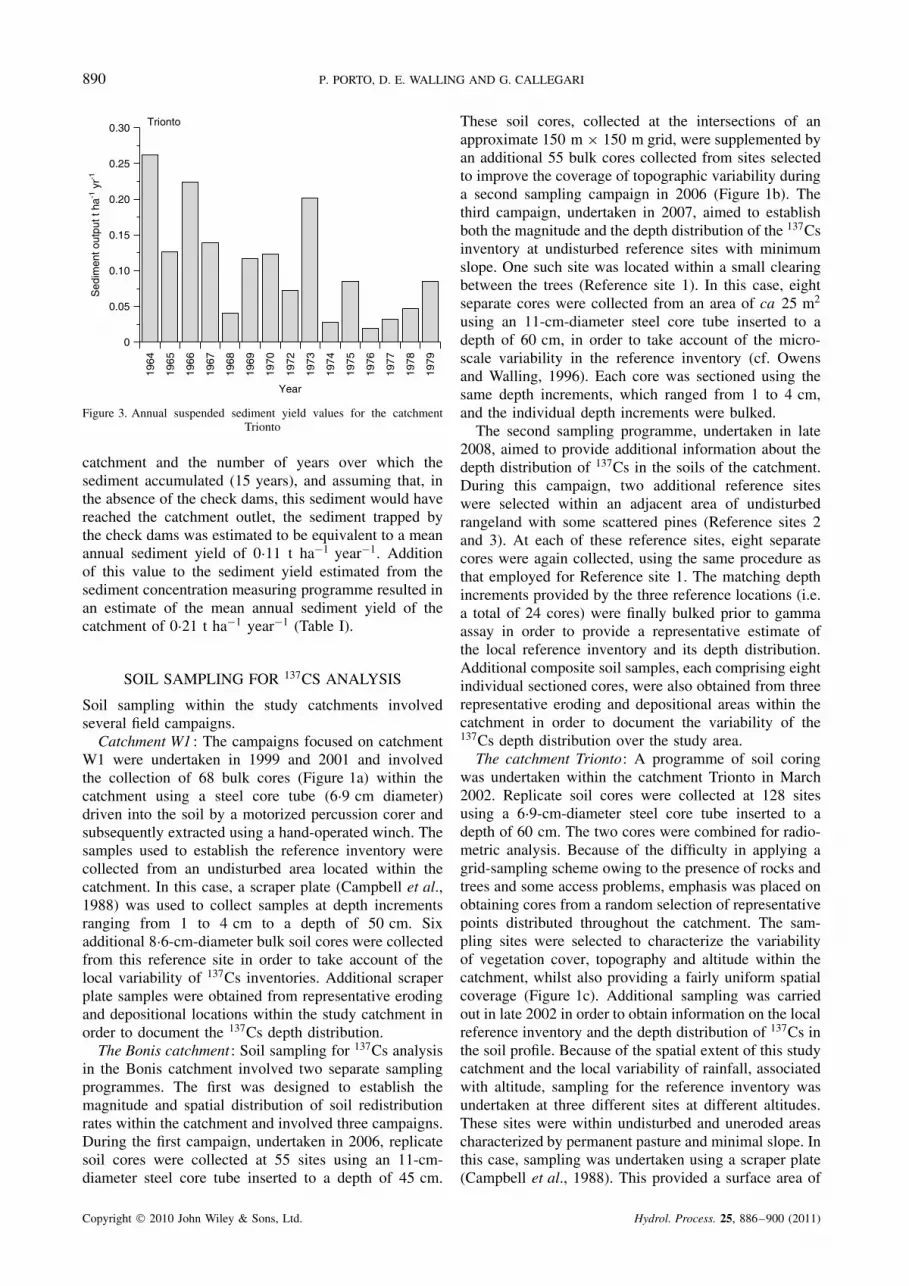
The values of the annual suspended sediment yieldfor the monitoring period, based on the measurementsundertaken by SIMI, are depicted in Figure 3. In addition,part of the sediment load transported from the steepestmountain areas during the period covered by the sedimentmeasuring programme was trapped by ten check damsbuilt at this time to stabilize the bed upstream of thecatchment outlet. In order to account for the influence ofthese check dams on the sediment output from the studycatchment, a programme of field surveys was undertakenin 2006, which was aimed at quantifying the amount ofsediment deposited upstream of each structure.
The measurements were carried out using a theodoliteand involved documenting the new longitudinal profilethat had developed after the construction of the checkdam. Information on the original longitudinal profilebefore construction of the dams was available fromtopographic maps. Additional measurements, includingthe width and length of the stream reach upstream of eachstructure, were also taken in order to calculate the volumeof the deposited sediment. Several sediment samples werecollected from the depositional areas and bulk densityvalues were determined in the laboratory in order toderive an estimate of the mass of the deposited sediment.The total amount of sediment deposited upstream of thecheck dams was estimated to be 5154 t. It is knownthat the basins behind the check dams were filled withinabout 15 years. By taking account of the area of the
Table I. Characteristic data of the study catchments
Catchment Drainage area(ha)
Mean altitude(m a.s.l.)
Mean slope(%)
Reliefratio
Sedimentoutput (t ha�1 year�1)
W1 1Ð47 122 53 0Ð17 11Ð6Bonis 139 1131 40 0Ð14 0Ð25Trionto 3161 1100 8Ð4 0Ð05 0Ð21
Copyright 2010 John Wiley & Sons, Ltd. Hydrol. Process. 25, 886–900 (2011)
890 P. PORTO, D. E. WALLING AND G. CALLEGARI
1964
1965
1966
1967
1968
1969
1970
1972
1973
1974
1975
1976
1977
1978
1979
0
Sed
imen
t out
put t
ha-1
yr-1
Year
0.05
0.10
0.15
0.20
0.25
0.30 Trionto
Figure 3. Annual suspended sediment yield values for the catchmentTrionto
catchment and the number of years over which thesediment accumulated (15 years), and assuming that, inthe absence of the check dams, this sediment would havereached the catchment outlet, the sediment trapped bythe check dams was estimated to be equivalent to a meanannual sediment yield of 0Ð11 t ha�1 year�1. Additionof this value to the sediment yield estimated from thesediment concentration measuring programme resulted inan estimate of the mean annual sediment yield of thecatchment of 0Ð21 t ha�1 year�1 (Table I).
SOIL SAMPLING FOR 137CS ANALYSIS
Soil sampling within the study catchments involvedseveral field campaigns.
Catchment W1 : The campaigns focused on catchmentW1 were undertaken in 1999 and 2001 and involvedthe collection of 68 bulk cores (Figure 1a) within thecatchment using a steel core tube (6Ð9 cm diameter)driven into the soil by a motorized percussion corer andsubsequently extracted using a hand-operated winch. Thesamples used to establish the reference inventory werecollected from an undisturbed area located within thecatchment. In this case, a scraper plate (Campbell et al.,1988) was used to collect samples at depth incrementsranging from 1 to 4 cm to a depth of 50 cm. Sixadditional 8Ð6-cm-diameter bulk soil cores were collectedfrom this reference site in order to take account of thelocal variability of 137Cs inventories. Additional scraperplate samples were obtained from representative erodingand depositional locations within the study catchment inorder to document the 137Cs depth distribution.
The Bonis catchment : Soil sampling for 137Cs analysisin the Bonis catchment involved two separate samplingprogrammes. The first was designed to establish themagnitude and spatial distribution of soil redistributionrates within the catchment and involved three campaigns.During the first campaign, undertaken in 2006, replicatesoil cores were collected at 55 sites using an 11-cm-diameter steel core tube inserted to a depth of 45 cm.
These soil cores, collected at the intersections of anapproximate 150 m ð 150 m grid, were supplemented byan additional 55 bulk cores collected from sites selectedto improve the coverage of topographic variability duringa second sampling campaign in 2006 (Figure 1b). Thethird campaign, undertaken in 2007, aimed to establishboth the magnitude and the depth distribution of the 137Csinventory at undisturbed reference sites with minimumslope. One such site was located within a small clearingbetween the trees (Reference site 1). In this case, eightseparate cores were collected from an area of ca 25 m2
using an 11-cm-diameter steel core tube inserted to adepth of 60 cm, in order to take account of the micro-scale variability in the reference inventory (cf. Owensand Walling, 1996). Each core was sectioned using thesame depth increments, which ranged from 1 to 4 cm,and the individual depth increments were bulked.
The second sampling programme, undertaken in late2008, aimed to provide additional information about thedepth distribution of 137Cs in the soils of the catchment.During this campaign, two additional reference siteswere selected within an adjacent area of undisturbedrangeland with some scattered pines (Reference sites 2and 3). At each of these reference sites, eight separatecores were again collected, using the same procedure asthat employed for Reference site 1. The matching depthincrements provided by the three reference locations (i.e.a total of 24 cores) were finally bulked prior to gammaassay in order to provide a representative estimate ofthe local reference inventory and its depth distribution.Additional composite soil samples, each comprising eightindividual sectioned cores, were also obtained from threerepresentative eroding and depositional areas within thecatchment in order to document the variability of the137Cs depth distribution over the study area.
The catchment Trionto: A programme of soil coringwas undertaken within the catchment Trionto in March2002. Replicate soil cores were collected at 128 sitesusing a 6Ð9-cm-diameter steel core tube inserted to adepth of 60 cm. The two cores were combined for radio-metric analysis. Because of the difficulty in applying agrid-sampling scheme owing to the presence of rocks andtrees and some access problems, emphasis was placed onobtaining cores from a random selection of representativepoints distributed throughout the catchment. The sam-pling sites were selected to characterize the variabilityof vegetation cover, topography and altitude within thecatchment, whilst also providing a fairly uniform spatialcoverage (Figure 1c). Additional sampling was carriedout in late 2002 in order to obtain information on the localreference inventory and the depth distribution of 137Cs inthe soil profile. Because of the spatial extent of this studycatchment and the local variability of rainfall, associatedwith altitude, sampling for the reference inventory wasundertaken at three different sites at different altitudes.These sites were within undisturbed and uneroded areascharacterized by permanent pasture and minimal slope. Inthis case, sampling was undertaken using a scraper plate(Campbell et al., 1988). This provided a surface area of
Copyright 2010 John Wiley & Sons, Ltd. Hydrol. Process. 25, 886–900 (2011)
137CS MEASUREMENTS AND SCALE EFFECTS 891
652 cm2 and samples were collected at depth incrementsranging from 1 to 4 cm to a depth of 50 cm. For eachreference site, two scraper plate samples were collectedand the matching depth increments were bulked prior toanalysis in order to take account of micro-scale variabil-ity in the reference inventory. Additional bulk cores werealso collected from the reference site, using the coringdevice, and these were analysed separately to providefurther estimates of the reference inventory. A numberof scraper plate profiles were also obtained from severalrepresentative sites within the study catchment using thesame procedure as that employed at the reference site inorder to characterize the depth distributions of 137Cs.
All bulk core and depth incremental samples col-lected in the three catchments were oven dried at 105 °Cfor 48 h, disaggregated and dry sieved to separate the<2 mm fraction. A representative sub-sample of thisfraction (ranging from 0Ð1 to 1Ð2 kg) was packed into per-spex Marinelli beakers or plastic pots for determination ofits 137Cs activity by gamma spectroscopy. The137Cs activ-ity in the samples was measured by gamma spectrometryusing a high-resolution, low-background, low energy, n-type HPGe detector, in the laboratory of the Departmentof Geography at the University of Exeter, United King-dom. Count times were typically ca 30 000 s, providinga precision of ca š10% at the 95% level of confidence.
137CS INVENTORIES IN THE STUDYCATCHMENTS
The reference inventories
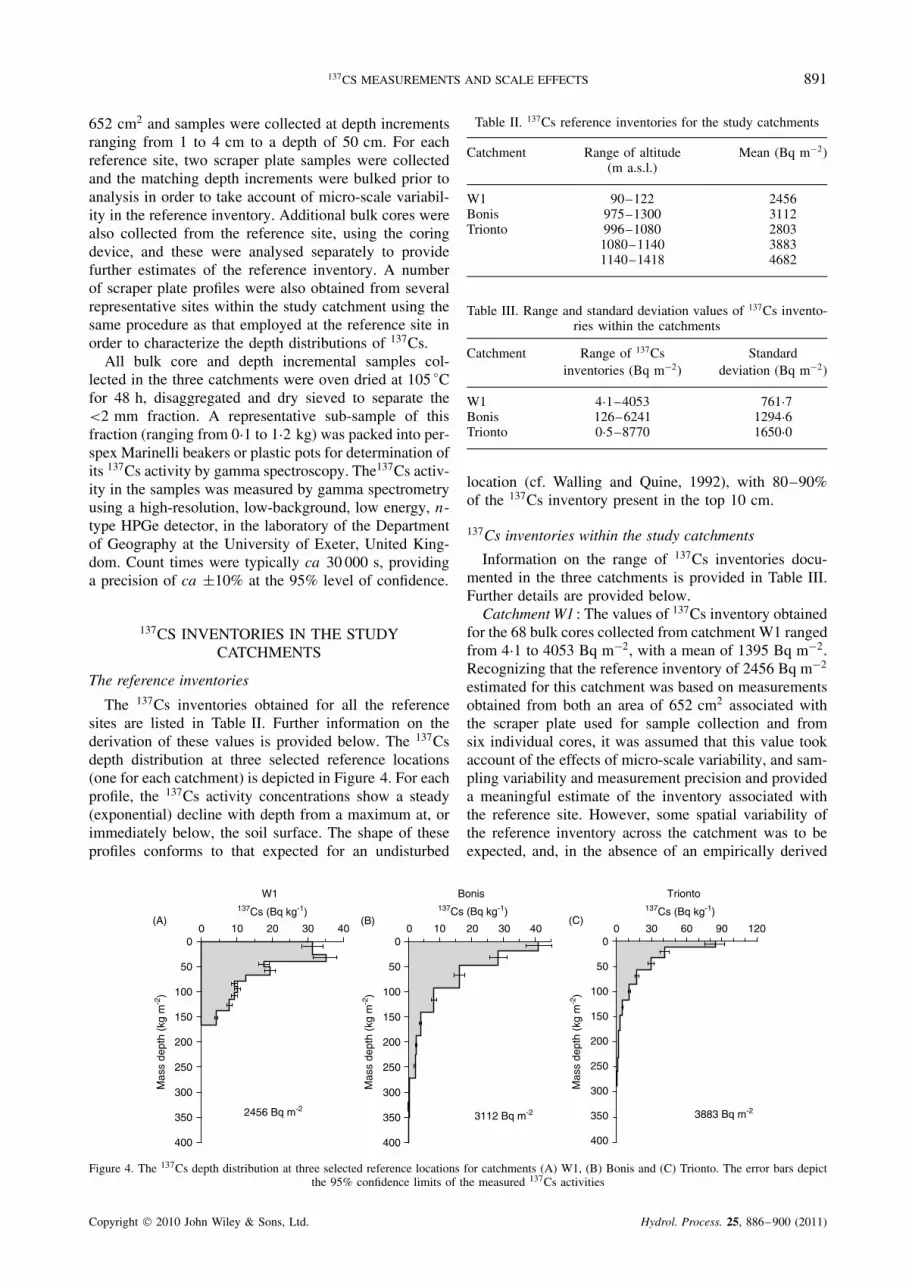
The 137Cs inventories obtained for all the referencesites are listed in Table II. Further information on thederivation of these values is provided below. The 137Csdepth distribution at three selected reference locations(one for each catchment) is depicted in Figure 4. For eachprofile, the 137Cs activity concentrations show a steady(exponential) decline with depth from a maximum at, orimmediately below, the soil surface. The shape of theseprofiles conforms to that expected for an undisturbed
Table II. 137Cs reference inventories for the study catchments
Catchment Range of altitude(m a.s.l.)
Mean (Bq m�2)
W1 90–122 2456Bonis 975–1300 3112Trionto 996–1080 2803
1080–1140 38831140–1418 4682
Table III. Range and standard deviation values of 137Cs invento-ries within the catchments
Catchment Range of 137Csinventories (Bq m�2)
Standarddeviation (Bq m�2)
W1 4Ð1–4053 761Ð7Bonis 126–6241 1294Ð6Trionto 0Ð5–8770 1650Ð0
location (cf. Walling and Quine, 1992), with 80–90%of the 137Cs inventory present in the top 10 cm.
137Cs inventories within the study catchments
Information on the range of 137Cs inventories docu-mented in the three catchments is provided in Table III.Further details are provided below.
Catchment W1 : The values of 137Cs inventory obtainedfor the 68 bulk cores collected from catchment W1 rangedfrom 4Ð1 to 4053 Bq m�2, with a mean of 1395 Bq m�2.Recognizing that the reference inventory of 2456 Bq m�2
estimated for this catchment was based on measurementsobtained from both an area of 652 cm2 associated withthe scraper plate used for sample collection and fromsix individual cores, it was assumed that this value tookaccount of the effects of micro-scale variability, and sam-pling variability and measurement precision and provideda meaningful estimate of the inventory associated withthe reference site. However, some spatial variability ofthe reference inventory across the catchment was to beexpected, and, in the absence of an empirically derived
Bonis
3112 Bq m-2
137Cs (Bq kg-1)
Mas
s de
pth
(kg
m-2
)
400
350
300
250
200
150
100
50
00 10 20 30 40
W1
2456 Bq m-2
0 10 20
137Cs (Bq kg-1)
30 400
50
100
150
400
350
300
250
200
Mas
s de
pth
(kg
m-2
)
400
300
350
200
250
100
150
50
00 30 60 90 120
Mas
s de
pth
(kg
m-2
)
137Cs (Bq kg-1)
3883 Bq m-2
Trionto
(B)(A) (C)
Figure 4. The 137Cs depth distribution at three selected reference locations for catchments (A) W1, (B) Bonis and (C) Trionto. The error bars depictthe 95% confidence limits of the measured 137Cs activities
Copyright 2010 John Wiley & Sons, Ltd. Hydrol. Process. 25, 886–900 (2011)
892 P. PORTO, D. E. WALLING AND G. CALLEGARI
estimate of this variability, an uncertainty of š10% wasassumed for the catchment reference inventory. On thebasis of this assumption, the results indicated that ca 4%of the 137Cs inventory values obtained for the individ-ual sampling points were not significantly different fromthe reference value, indicating that these sampling pointswere essentially stable. However, most (ca 90%) of thesoil cores collected within this catchment were character-ized by 137Cs inventories less than the lower bound of therange assumed for the local reference inventory (i.e. 2456Bq m�2 š10%), suggesting that the surface of the catch-ment W1 has been dominated by net soil loss over theperiod covered by the 137Cs measurements. Depositionalareas, represented by cores where the measured inventoryexceeded the upper bound of the range assumed for thelocal reference inventory, were associated with only fourcores (ca 6%) and were therefore shown to be of verylimited significance.
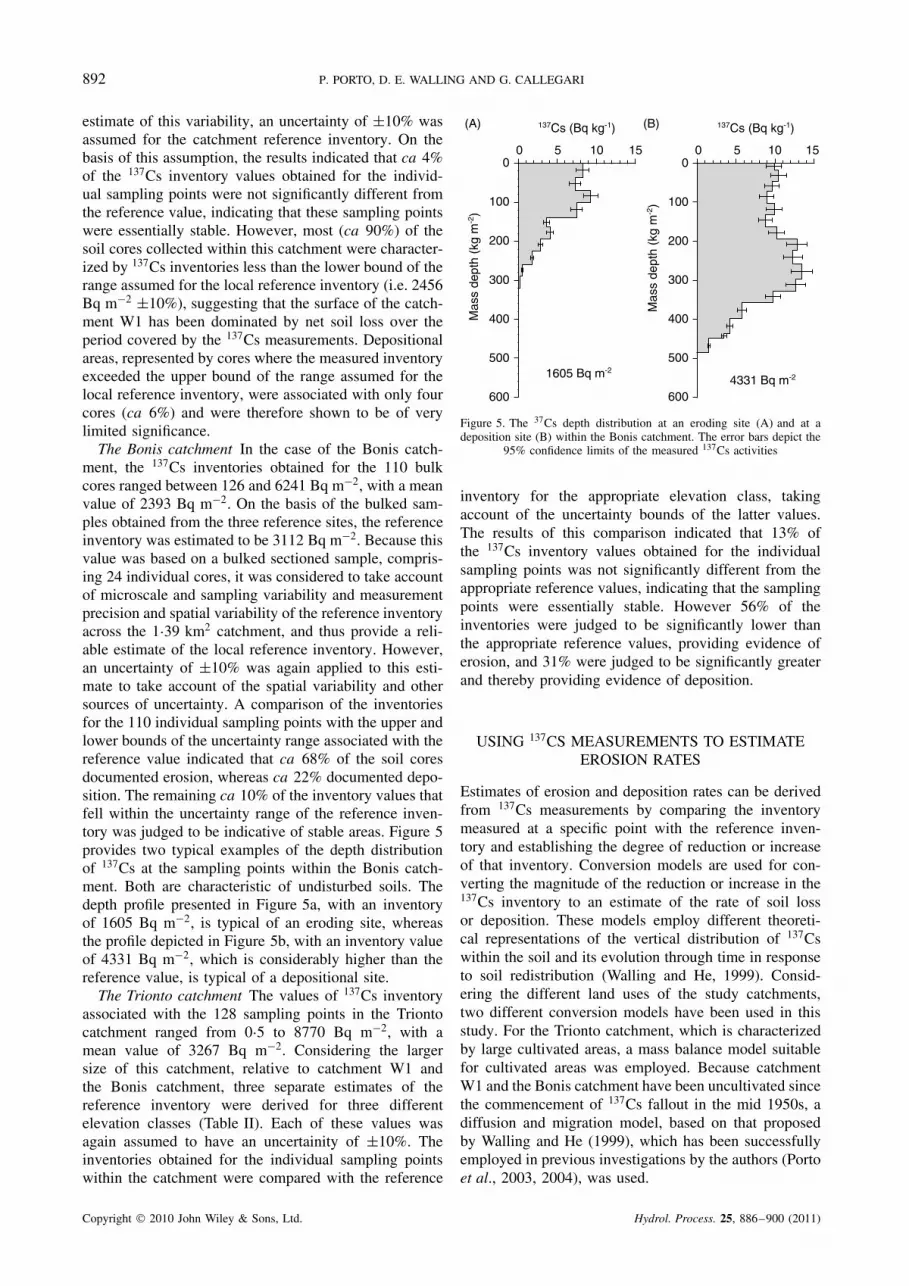
The Bonis catchment In the case of the Bonis catch-ment, the 137Cs inventories obtained for the 110 bulkcores ranged between 126 and 6241 Bq m�2, with a meanvalue of 2393 Bq m�2. On the basis of the bulked sam-ples obtained from the three reference sites, the referenceinventory was estimated to be 3112 Bq m�2. Because thisvalue was based on a bulked sectioned sample, compris-ing 24 individual cores, it was considered to take accountof microscale and sampling variability and measurementprecision and spatial variability of the reference inventoryacross the 1Ð39 km2 catchment, and thus provide a reli-able estimate of the local reference inventory. However,an uncertainty of š10% was again applied to this esti-mate to take account of the spatial variability and othersources of uncertainty. A comparison of the inventoriesfor the 110 individual sampling points with the upper andlower bounds of the uncertainty range associated with thereference value indicated that ca 68% of the soil coresdocumented erosion, whereas ca 22% documented depo-sition. The remaining ca 10% of the inventory values thatfell within the uncertainty range of the reference inven-tory was judged to be indicative of stable areas. Figure 5provides two typical examples of the depth distributionof 137Cs at the sampling points within the Bonis catch-ment. Both are characteristic of undisturbed soils. Thedepth profile presented in Figure 5a, with an inventoryof 1605 Bq m�2, is typical of an eroding site, whereasthe profile depicted in Figure 5b, with an inventory valueof 4331 Bq m�2, which is considerably higher than thereference value, is typical of a depositional site.
The Trionto catchment The values of 137Cs inventoryassociated with the 128 sampling points in the Triontocatchment ranged from 0Ð5 to 8770 Bq m�2, with amean value of 3267 Bq m�2. Considering the largersize of this catchment, relative to catchment W1 andthe Bonis catchment, three separate estimates of thereference inventory were derived for three differentelevation classes (Table II). Each of these values wasagain assumed to have an uncertainity of š10%. Theinventories obtained for the individual sampling pointswithin the catchment were compared with the reference
600
500
400
300
200
100
00 105 15
4331 Bq m-2
137Cs (Bq kg-1)
Mas
s de
pth
(kg
m-2)
600
500
400
300
200
100
00 10 15
1605 Bq m-2
137Cs (Bq kg-1)
Mas
s de
pth
(kg
m-2)
5
(A) (B)
Figure 5. The 37Cs depth distribution at an eroding site (A) and at adeposition site (B) within the Bonis catchment. The error bars depict the
95% confidence limits of the measured 137Cs activities
inventory for the appropriate elevation class, takingaccount of the uncertainty bounds of the latter values.The results of this comparison indicated that 13% ofthe 137Cs inventory values obtained for the individualsampling points was not significantly different from theappropriate reference values, indicating that the samplingpoints were essentially stable. However 56% of theinventories were judged to be significantly lower thanthe appropriate reference values, providing evidence oferosion, and 31% were judged to be significantly greaterand thereby providing evidence of deposition.
USING 137CS MEASUREMENTS TO ESTIMATEEROSION RATES
Estimates of erosion and deposition rates can be derivedfrom 137Cs measurements by comparing the inventorymeasured at a specific point with the reference inven-tory and establishing the degree of reduction or increaseof that inventory. Conversion models are used for con-verting the magnitude of the reduction or increase in the137Cs inventory to an estimate of the rate of soil lossor deposition. These models employ different theoreti-cal representations of the vertical distribution of 137Cswithin the soil and its evolution through time in responseto soil redistribution (Walling and He, 1999). Consid-ering the different land uses of the study catchments,two different conversion models have been used in thisstudy. For the Trionto catchment, which is characterizedby large cultivated areas, a mass balance model suitablefor cultivated areas was employed. Because catchmentW1 and the Bonis catchment have been uncultivated sincethe commencement of 137Cs fallout in the mid 1950s, adiffusion and migration model, based on that proposedby Walling and He (1999), which has been successfullyemployed in previous investigations by the authors (Portoet al., 2003, 2004), was used.
Copyright 2010 John Wiley & Sons, Ltd. Hydrol. Process. 25, 886–900 (2011)
137CS MEASUREMENTS AND SCALE EFFECTS 893
The mass balance model
This model is based on the assumption that a samplingpoint with a total radionuclide inventory A (Bq m�2)less than the local reference inventory Aref (Bq m�2)represents an eroding site, whilst a point with a totalradionuclide inventory greater than the local referenceinventory is assumed to be a depositional site. Foran eroding soil profile, the change in the activity ofaccumulated 137Cs A�t� (Bq m�2) per unit area with timet (year) is controlled by the receipt of 137Cs fallout andthe loss associated with radioactive decay and soil erosionand can be represented as follows:
dA�t�
dtD �1 � �I�t� �
(� C P
R
Dc
)A�t� �1�
whereR D erosion rate (kg m�2 year�1);Dc D the average plough depth expressed as a cumu-
lative mass depth (kg m�2);� D decay constant for 137Cs (0Ð023 year�1);I�t� D annual 137Cs deposition flux (Bq m�2 year�1); D proportion of the freshly deposited 137Cs fallout
removed by erosion before being mixed into the ploughlayer;
P D particle size correction factor.The particle size correction factor P in Equation (1)
accounts for the strong association of 137Cs with fine soilparticles and the grain size selectivity of erosion pro-cesses (Livens and Baxter, 1988; Walling and Woodward,1992; He and Walling, 1996). The value of P reflects thegrain size composition of both mobilized sediment andthe original soil. Because the grain size composition ofthe mobilized sediment is commonly enriched in finesrelative to the original soil, P is generally greater than1Ð0 (He and Walling, 1996).
The parameter in Equation (1) accounts for theremoval of freshly deposited 137Cs fallout by surfaceerosion before its incorporation into the plough layerby cultivation. Because 137Cs fallout occurs primarily inassociation with precipitation, it is initially distributedwithin a shallow surface layer of the soil (Nevissi, 1985;Ritchie and McHenry, 1990; He and Walling, 1997).When erosion occurs, the sediment mobilized from thesoil surface contains higher levels of 137Cs than thatin the sediment originating from the plough layer moregenerally. If sheet erosion is assumed, can be expressedas (Walling and He, 1999):
D P��1 � e�R/H� �2�
In Equation (2), � is the proportion of the annual137Cs fallout susceptible to removal by erosion priorto incorporation into the soil profile by tillage, whichis dependent on the timing of cultivation and the localrainfall regime; H (kg m�2) is the relaxation mass depthof the initial distribution of the fallout radionuclide in thesoil profile, which can be determined experimentally forlocal conditions (He and Walling, 1997).
Solution of Equation (1) under continuous fallout inputI�t0� yields:
A�t� D A�t0�e�
∫ t
t0�PR/DcC��dt0
C∫ t
t0
�1 � �I�t0�e��PR/DcC���t�t0�dt0 �3�
where t0 (year) is the year when cultivation started andA�t0� (Bq m�2) is the fallout 137Cs inventory at t0. Ifthe annual 137Cs deposition flux I�t0�, the total inventoryA�t� for the soil profile and the value of H are known,Equation (3) can be used to estimate the erosion rate.
In situations where A�t� exceeds the local referenceinventory Aref at a sampling point, deposition may beassumed. The excess 137Cs inventory Aex (Bq m�2)(defined as the measured total inventory A�t� less thelocal direct fallout input Aref) can be attributed to theaccumulation of radiocaesium associated with depositionof sediment derived from the upslope eroding area, whichcan be expressed as follows:
Aex D∫ t
t0
R0Cd�t0�e���t�t0�dt0 �4�
where R0 (kg m�2 year�1) is the deposition rate andCd�t0� (Bq kg�1) is the 137Cs concentration of thedeposited sediment. Cd�t0� reflects the combination ofsediment and its associated 137Cs mobilized from allthe eroding areas that converge on the aggrading point.Generally, Cd�t0� can be assumed to be represented bythe weighted mean of the 137Cs concentrations of thesediment mobilized from the upslope contributing areaS (m2). Cd�t0� can therefore be calculated using thefollowing equation:
Cd�t0� D 1∫S
RdS
∫S
P0Ce�t0�RdS �5�
where Ce�t0� (Bq kg�1) is the 137Cs concentration ofthe mobilized sediment and P0 is a further particle sizecorrection factor reflecting differences in grain size com-position between the mobilized sediment and depositedsediment, defined as the ratio of the 137Cs concentrationof deposited sediment to that of the mobilized sediment.Because the grain size composition of the deposited sed-iment is usually depleted in fine fractions compared withthe mobilized sediment, P0 is generally less than 1Ð0. Asthe mobilized sediment is derived from the surface of theplough layer, its 137Cs concentration is closely related tothat of the surface soil and can be expressed as follows:
Ce�t0� D P
(I�t0�R
��1 � e�R/H� C A�t0�Dc
)�6�
In Equation (6), the first term on the right-hand siderepresents the removal of a proportion of the annualradiocaesium fallout, which accumulates at the soilsurface prior to incorporation into the plough layer bytillage, and the second term represents erosion of the
Copyright 2010 John Wiley & Sons, Ltd. Hydrol. Process. 25, 886–900 (2011)
894 P. PORTO, D. E. WALLING AND G. CALLEGARI
accumulated radiocaesium stored in the plough layer. Themean soil deposition rate R0 can be calculated from thefollowing equation:
R0 D Aex∫ t
t0
Cd�t0�e���t�t0�dt0
DAex
∫S
RdS
PP0∫ t
t0
dt0∫
S�I�t0���1 � e�R/H�/R C A�t0�/Dc�dS
�7�
A computer-based conversion model, which convertsthe percentage loss or gain in the 137Cs inventory, relativeto the reference value, to an equivalent rate of soil lossor deposition was used to solve Equations (3) and (7) inorder to estimate the erosion and deposition rates withinthe Trionto catchment.
The diffusion and migration model
Following the work of several authors (Pegoyev andFridman, 1978; Bachhuber et al., 1982; Reynolds et al.,1982; Walling and He, 1992, 1993; Likar et al., 2001),the vertical distribution of 137Cs within the soil can beseen as varying through time in response to the time-dependent fallout input and the post-depositional redistri-bution of 137Cs within the profile. For an undisturbed soil,this redistribution can be represented by simple diffusionand convection equations. According to Walling and He(1993), by treating the soil as a semi-infinite homoge-neous porous medium, the post-depositional redistribu-tion can be characterized by a constant effective diffusioncoefficient and a constant migration rate. Assuming thatfallout inputs are initially uniformly distributed at the soilsurface, the vertical distribution of 137Cs concentrationfrom the surface downwards can be represented by thefollowing partial differential equation (Crank, 1975):
∂C�x, t�
∂tD D
∂2C�x, t�
∂x2 � V∂C�x, t�
∂x� �C�x, t� �8�
whereD D the effective diffusion coefficient
(kg2 m�4 year�1);V D the downward migration rate (kg m�2 year�1);x D the mass depth from the soil surface downwards
(kg m�2);t D the time since the first deposition of 137Cs (year);C�x, t� D the activity of 137Cs at time t and cumulative
mass depth x (Bq kg�1).The initial condition for Equation (8) for an instanta-
neous input I�t0� can be approximated by the followingequation (He, 1993):
Ci�x, t0� D I�t0�H
e�x/H �9�
where I�t0� is a pulse input (Bq m�2 year�1) at time t0and H (kg m�2) is the relaxation depth expressed as a
mass depth. If the post-depositional movement of 137Csin the soil is restricted to the soil profile itself, massconservation requires the following boundary conditionsfor Equation (8) for an initial input I�t0�:
� D∂C�x, t�
∂xjxD0 C VC�x, t�jxD0 D 0 �10�
limx!1
∂C�x, t�
∂xD 0
A solution C�x, t, t0� of Equation (8) for an undisturbedsoil, for any cumulative mass depth and time underinitial condition (9) and boundary conditions (10), andafter t � t0, can be expressed (Lindstrom and Boersma,1971; Officer and Lynch, 1982; Walling and He, 1993)as follows:
C�x, t, t0� D e���t�t0�∫ 1
0
I�t0�H
e�y/H
{eV�x�y�/2D�V2�t�t0�/4D
[e��xCy�2/4D�t�t0� C e��x�y�2/4D�t�t0�
]
ð 1√4�D�t � t0�
� V
2DeVx/D
erfc
[x C y C V�t � t0�√
4D�t � t0�
]}dy �11�
where erfc(u) is the error-function complement definedas Crank (1975):
erfc�u� D 2p�
∫ 1
ue�y2
dy �12�
Taking account of a continuous input I�t0�, the 137Csconcentration distribution C�x, t� (Bq kg�1) in the soilprofile at time t can be obtained by integrating C�x, t, t0�over time t0 (Walling and He, 1993):
C�x, t� D∫ t
0C�x, t, t0�dt �13�
The ability of Equations (11) and (13) to modelthe 137Cs concentration distribution documented in soilprofiles has been demonstrated elsewhere (Walling andHe, 1993; He and Walling, 1997).
For a soil affected by sheet erosion, with a constantannual erosion rate R (kg m�2 year�1), the concentra-tion of 137Cs in the eroded sediment Ce�t� (Bq kg�1),assuming no enrichment, may be approximated by thatof the surface soil Cu�0, t� obtained from Equation (13).According to Walling and He (1999), the erosion rateR may be estimated from the reduction in the 137Csinventory Au,ls�t� (Bq m�2), defined as the 137Cs refer-ence inventory Aref minus the measured total inventoryA�t�, and the 137Cs concentration in the surface soil Cu�t0�according to
Au,ls�t� D∫ t
0RCu�t0�e���t�t0�dt0 �14�
Copyright 2010 John Wiley & Sons, Ltd. Hydrol. Process. 25, 886–900 (2011)
137CS MEASUREMENTS AND SCALE EFFECTS 895
The same authors tested the validity of Equations (13)and (14), employing a wide range of values for theparameters D, V and H. This exercise (Walling andHe, 1999) showed that the predicted erosion rates arepositively related to these parameters, although the modelis more sensitive to D than to V and H.
For a depositional site, the deposition rate R0 can beestimated from the 137Cs concentration in the depositedsediment Cd�t0� and the excess 137Cs inventory (definedas the total measured 137Cs inventory A�t� minus the localreference inventory Aref) using the following relationship(Walling and He, 1997):
R0 D A�t� � Aref∫ t
t0
Cd�t0�e���t�t0�dt0�15�
Assuming that the 137Cs concentration Cd�t0� of thedeposited sediment can be represented by the weightedmean of the 137Cs concentration of the sediment mobi-lized from the upslope contributing area, Cd�t0� can becalculated as follows:
Cd�t0� D 1∫S
RdS
∫S
Ce�t0�RdS �16�
where S (m2) is the upslope contributing area and Ce�t0�(Bq kg�1) is the 137Cs concentration of the sedimentmobilized from an eroding point, which can be calculatedfrom Equation (11), assuming x D 0.
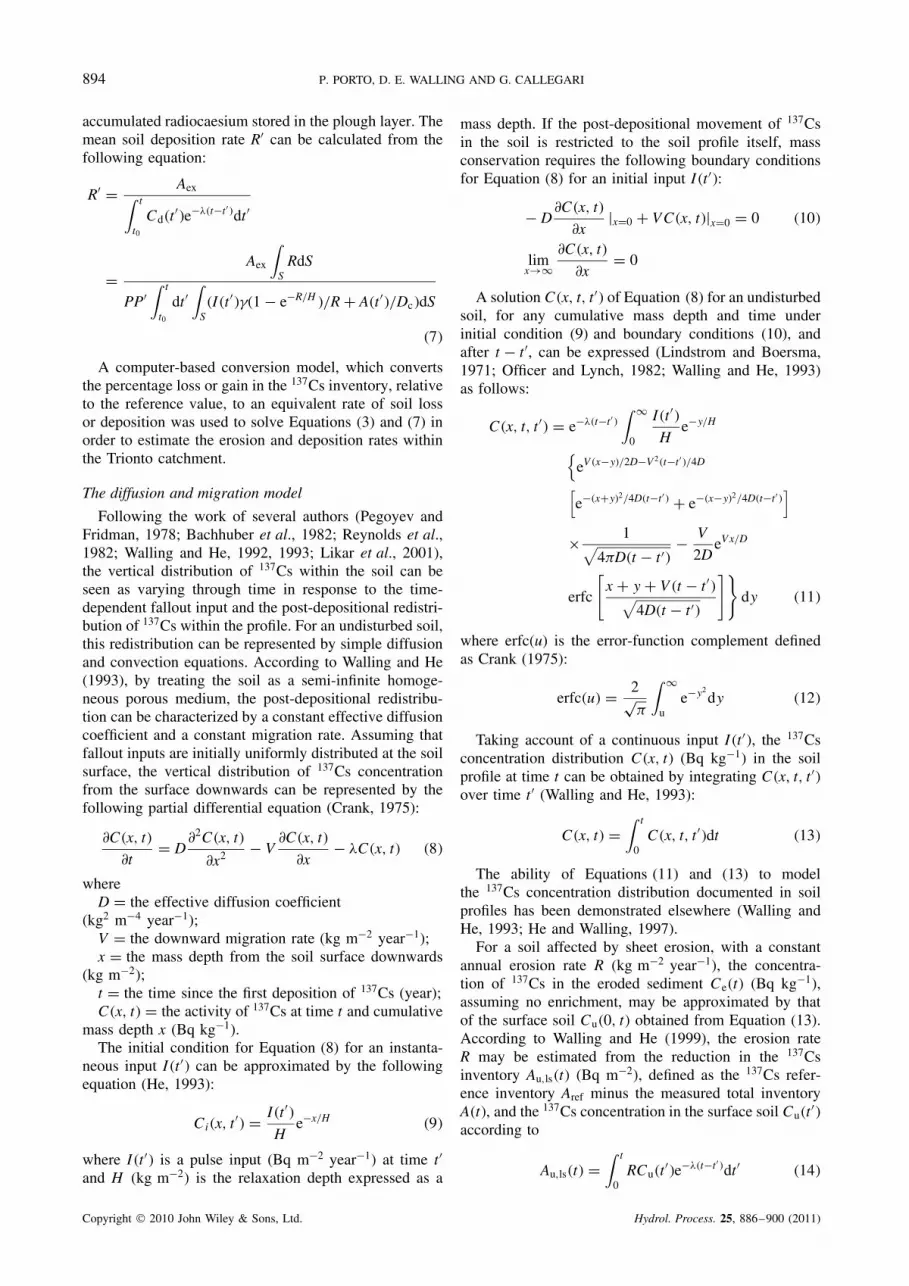
For the Bonis catchment, Equations (11) and (13) havebeen solved numerically in order to reproduce the profileobtained from the reference site described above. Inparticular, assuming a constant value of H (5 kg m�2),as suggested by Walling and He (1999), and a valueof V equal to zero, the value for parameter D wascalculated for each profile using least squares. The secondassumption (V D 0), which implies that the transport isessentially diffusional, can be justified by the fact that theprofile does not show a clear peak below the soil surface.The results of this fitting are shown in Figure 6 for thereference profile used in this study.
According to Walling and He (1999), Equations (11)and (13) are applicable only to soils where the erosionrate is relatively low. In this situation, the concentra-tion of 137Cs in the eroded sediment Ce�t� (Bq kg�1)can be approximated by that of the surface soil Cu�0, t�obtained from Equation (13) and erosion rates can be esti-mated using Equation (14). A computer-based conversionmodel was used to solve Equations (13), (14), (15) and(16) in order to estimate the erosion and deposition rateswithin the Bonis catchment.
For catchment W1, where erosion rates are substan-tially higher, the concentration of 137Cs in the erodedsediment Ce�t� cannot be approximated by that of the sur-face soil obtained from Equation (13) because the declinein concentration with depth must be taken into account.
In this case, assuming a constant soil lowering E(kg m�2) and that the transport is purely diffusional,
137Cs (Bq kg-1)
Mas
s de
pth
(kg
m-2)
400
350
300
250
200
150
100
50
00 10 20 30 40
Figure 6. The results of fitting the diffusion and migration model[Equations (11) and (13)] to the 137Cs depth distribution documentedfor the reference sites located within the Bonis catchment. The error bars
depict the 95% confidence limits of the measured 137Cs activities
and following Porto et al. (2003), Equation (11) can berewritten as
Ce�x, t, t0� D e���t�t0�∫ 1
0
I�t0�H
e�y/H
{[e�[�xCE�Cy]2/4D�t�t0� C e�[�xCE��y]2/4D�t�t0�
]1√
4�D�t � t0�
}dy �17�
where the value of Ce�x, t, t0� (Bq kg�1) indicates themean concentration of 137Cs in the presence of higherosion rates for any cumulative mass depth x and timet0.
The 137Cs concentration distribution Ce�x, t� (Bq kg�1)in the soil profile at time t can be obtained again byintegrating Ce�x, t, t0� over time t0:
Ce�x, t� D∫ t
0Ce�x, t, t0�dt �18�
Integration of Ce�x, t� over mass depth x gives thetotal 137Cs inventory A�t� (Bq m�2) for an erosional siteat time t:
A�t� D∫ 1
0Ce�x, t�dx �19�
Equations (17) and (19) can be solved simultaneouslyfor E (kg m�2), with A�t� (Bq m�2) representing themeasured inventory corresponding to an eroding point.Erosion rates R (kg m�2 year�1) may then be estimatedby dividing the quantity E by the time t � t0 (year) sincethe commencement of 137Cs fallout.
For a depositional site, Equations (15) and (16) stillhold, with the only difference that the 137Cs concentrationof the sediment mobilized from an eroding point can becalculated from Equation (17), assuming x D 0.
Copyright 2010 John Wiley & Sons, Ltd. Hydrol. Process. 25, 886–900 (2011)
896 P. PORTO, D. E. WALLING AND G. CALLEGARI
ESTIMATING EROSION AND DEPOSITION RATESASSOCIATED WITH THE SAMPLING POINTSWITHIN THE THREE STUDY CATCHMENTS
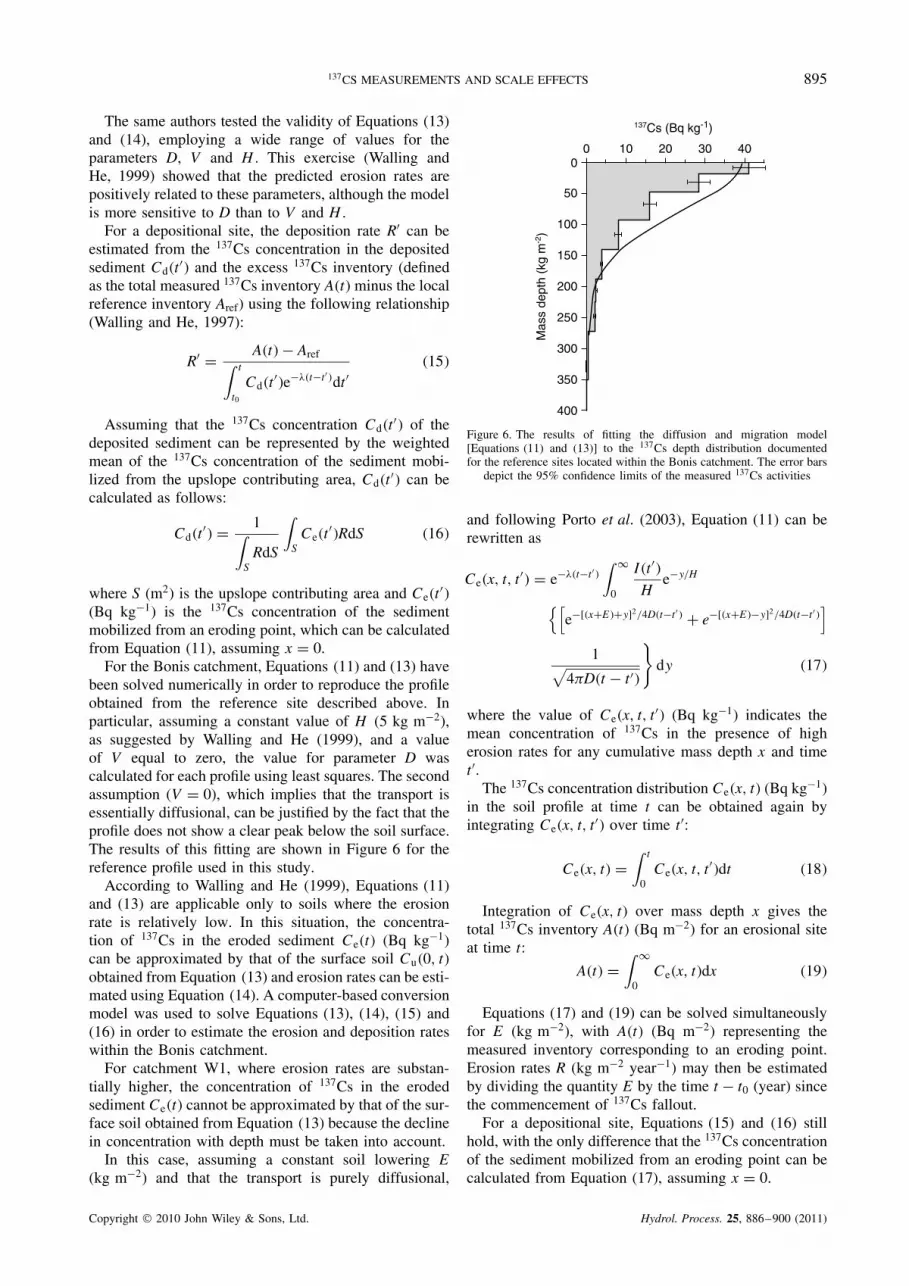
The conversion models described above were used toderive estimates of erosion and deposition rates for theindividual sampling points within the three study catch-ments. In the case of the diffusion and migration modelutilized for catchment W1 and the Bonis catchment,the model was parameterized using the reference pro-files depicted in Figure 4. The ranges of the erosion anddeposition rates estimated for the individual samplingpoints within the three study catchments are presentedin Figure 7a–c. For each catchment, the central classdesignated stable represents those sampling points wherethe measured inventories fell within the uncertainty rangeassociated with the reference inventory.
THE SEDIMENT BUDGETS OF THE STUDYCATCHMENTS
The results presented in Figure 7 clearly show that thereis evidence of both erosion and deposition within thethree study catchments. The presence of points docu-menting deposition emphasizes that not all the sedimentmobilized within the catchments by erosion is transportedout of the catchment, that storage is therefore a significantcomponent of the catchment sediment budgets and that,where the amount of storage is substantial, the measuredsediment yield does not provide a meaningful measure oferosion rates within the catchments. There are, however,important differences between both the absolute magni-tude and the distributions of the soil redistribution ratesassociated with the contrasting catchments. The soil ero-sion rates presented for the Trionto catchment in Figure 7extend over a considerably higher range than those for theother two study catchments, and, in turn, the range of ero-sion rates associated with catchment W1 is substantiallygreater than that for the Bonis catchment. However, whenthe small outliers of high values are excluded, there is lit-tle difference between the erosion rates associated withcatchment W1 and the Trionto catchment. In terms ofdeposition rates, catchment W1 is distinctive for both thelow magnitude of the deposition rates and the low inci-dence of depositional points. Both the intensity and theincidence of deposition increase in the Bonis catchmentand increase even further for the Trionto catchment.
Considering the sediment budgets of the three catch-ments, the relative incidence of sampling locations pro-viding evidence of deposition and the magnitude of thedeposition rates at those locations directly reflect theimportance of the storage component of the budgets forthe individual catchments and thus their sediment deliv-ery ratios. In this context, the storage component of thebudget can be seen to be of greatest importance in theTrionto catchment and of least importance for catch-ment W1. This trend demonstrates a positive relationshipbetween the importance of the storage component of thecatchment sediment budgets and catchment size, which
-200 -5
0-2
0-1
5
-12.
5-1
0
-7.5
÷ -
5
-2.5
Sta
ble 2.5 5
7.5 10
12.5 15 20 50
200
0
2
4
6
8
10
12
14
-200
-20 -1
5 -
12 -10 -8 -6 -4 -2
Sta
ble 2 4 6 8 10 12 15 20
200
0
4
8
12
16
20
-200
-100 -5
0
-40
-30
-20
-10
Sta
ble 10 20 30 40 50 100
200
0
4
8
12
16
20
24
Bonis
W1
Trionto
Erosion Deposition
(A)
(B)
(C)
Figure 7. The range of erosion and deposition rates (t ha�1 year�1)associated with the sampling points within each study catchment: (A) W1,
(B) Bonis and (C) Trionto
is consistent with the inverse relationship between sedi-ment delivery ratio and catchment area frequently citedin the literature (Walling, 1983) and accounted for bythe greater opportunity for sediment storage in largercatchments. This in turn reflects the greater travel dis-tance between the point of sediment mobilization and thecatchment outlet, and thus the increased probability thata sediment particle will be trapped or deposited beforeit reaches the catchment outlet, as well as the increasedincidence of lower slope gradients, well-developed valleybottoms and river floodplains commonly associated withlarger catchments, which again increase the potential fordeposition and storage.
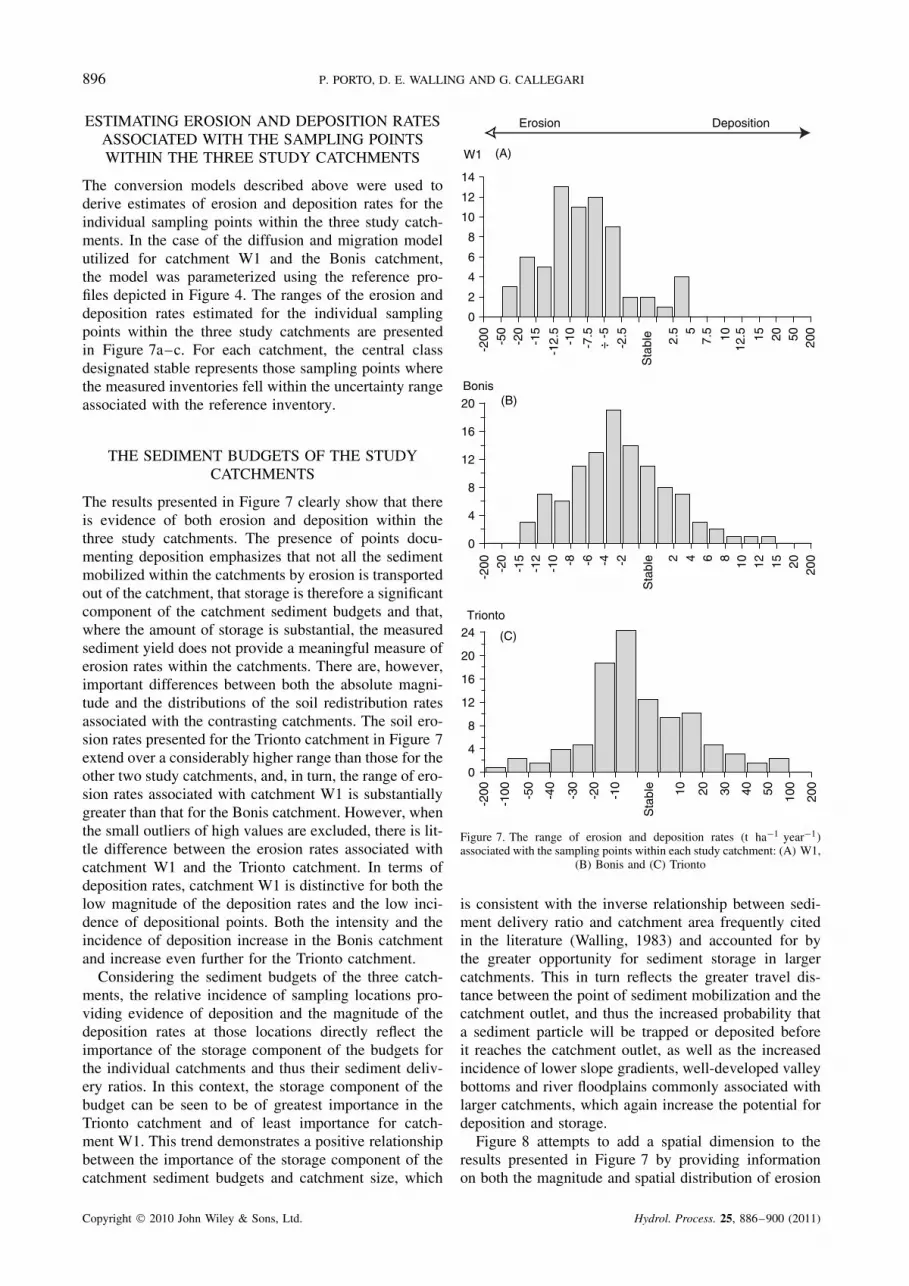
Figure 8 attempts to add a spatial dimension to theresults presented in Figure 7 by providing informationon both the magnitude and spatial distribution of erosion
Copyright 2010 John Wiley & Sons, Ltd. Hydrol. Process. 25, 886–900 (2011)
137CS MEASUREMENTS AND SCALE EFFECTS 897
Catchmentoutlet
145m
125m
105m
0 20m
W1
0.1
1
10
100
t ha-1 yr-1
Catchmentoutlet
1200m
1120m
1040m
200m
Bonis
StableErosionDeposition
10
100
10.1
t ha-1 yr-1
(A)(B)
(C)
1250m
1150m
1050m
1150m
1050m
1050m
0 2km
10
100
1000
t ha-1 yr-1
Trionto
Catchmentoutlet
Figure 8. The spatial distribution of the soil redistribution rates within catchment (A) W1, (B) the Bonis catchment and (C) the Trionto catchmentestimated from the 137Cs measurements
and deposition rates within the three study catchments.The patterns presented in Figure 8 demonstrate thatappreciable rates of sediment mobilization are widelydistributed across the three catchments, although thehighest values are frequently located within the higherparts of the catchments or along catchment divides, wherethe terrain is steepest. In contrast, the sampling pointscharacterized by deposition are preferentially located inthe lower parts of the catchments and along sedimentdelivery pathways, where the potential for deposition isgreatest.
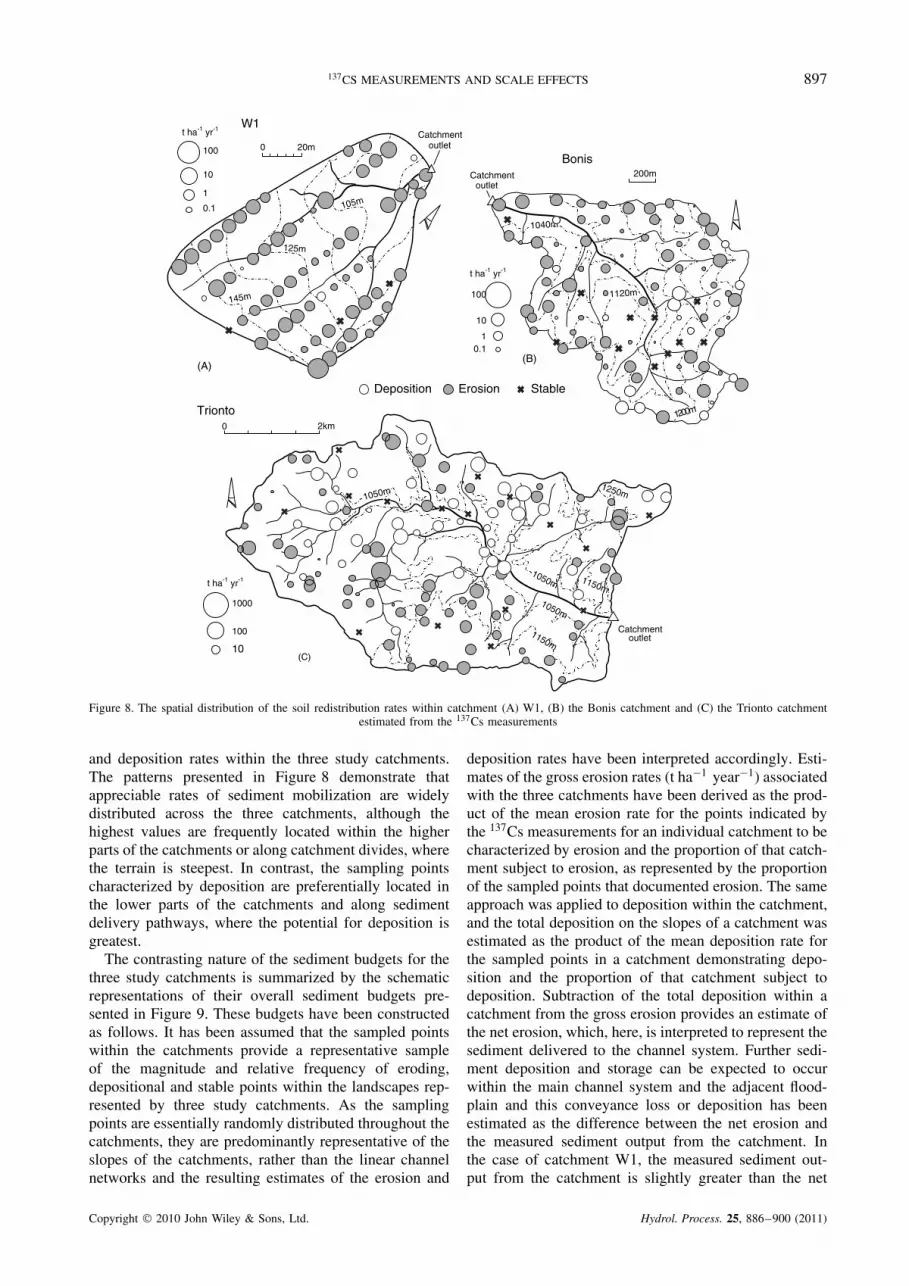
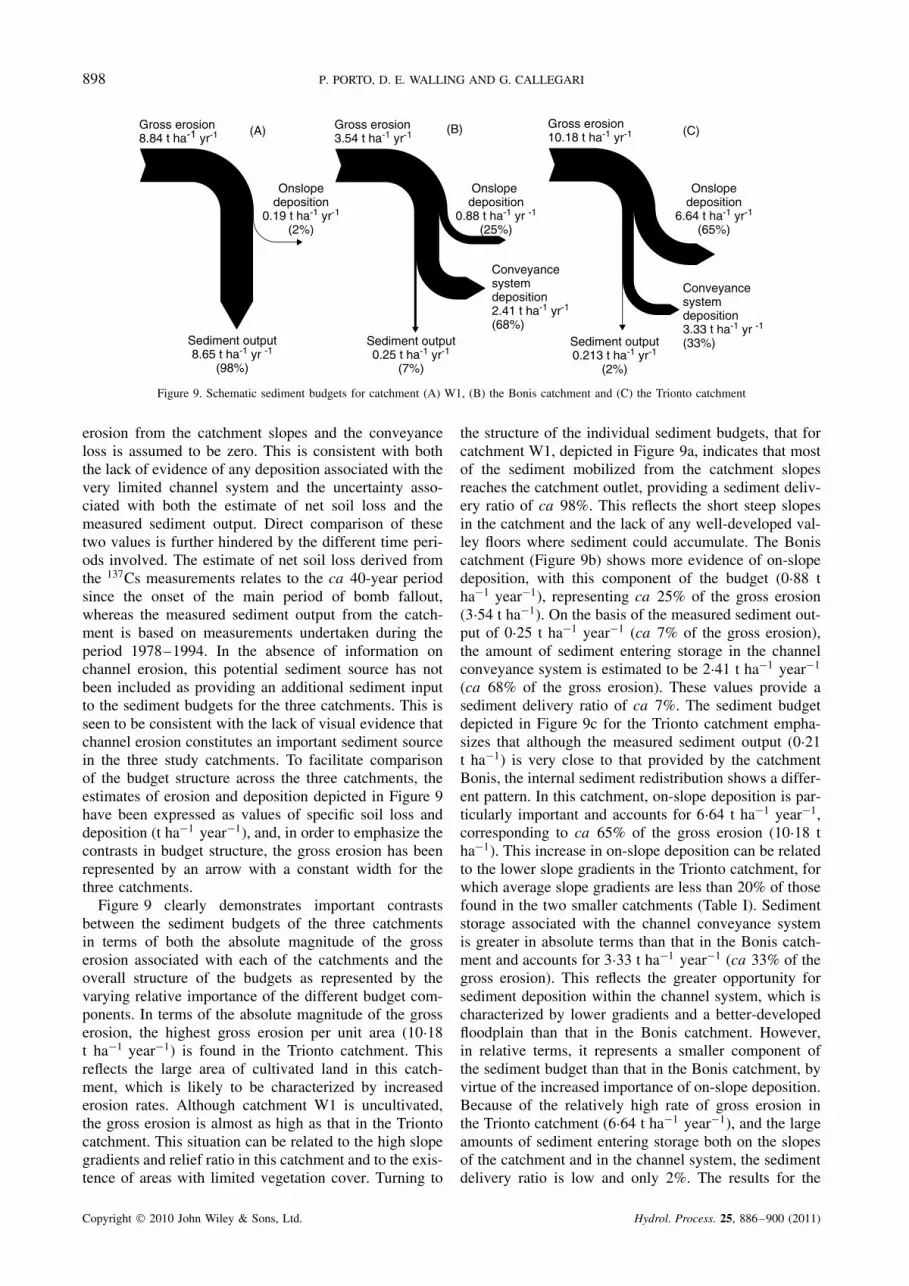
The contrasting nature of the sediment budgets for thethree study catchments is summarized by the schematicrepresentations of their overall sediment budgets pre-sented in Figure 9. These budgets have been constructedas follows. It has been assumed that the sampled pointswithin the catchments provide a representative sampleof the magnitude and relative frequency of eroding,depositional and stable points within the landscapes rep-resented by three study catchments. As the samplingpoints are essentially randomly distributed throughout thecatchments, they are predominantly representative of theslopes of the catchments, rather than the linear channelnetworks and the resulting estimates of the erosion and
deposition rates have been interpreted accordingly. Esti-mates of the gross erosion rates (t ha�1 year�1) associatedwith the three catchments have been derived as the prod-uct of the mean erosion rate for the points indicated bythe 137Cs measurements for an individual catchment to becharacterized by erosion and the proportion of that catch-ment subject to erosion, as represented by the proportionof the sampled points that documented erosion. The sameapproach was applied to deposition within the catchment,and the total deposition on the slopes of a catchment wasestimated as the product of the mean deposition rate forthe sampled points in a catchment demonstrating depo-sition and the proportion of that catchment subject todeposition. Subtraction of the total deposition within acatchment from the gross erosion provides an estimate ofthe net erosion, which, here, is interpreted to represent thesediment delivered to the channel system. Further sedi-ment deposition and storage can be expected to occurwithin the main channel system and the adjacent flood-plain and this conveyance loss or deposition has beenestimated as the difference between the net erosion andthe measured sediment output from the catchment. Inthe case of catchment W1, the measured sediment out-put from the catchment is slightly greater than the net
Copyright 2010 John Wiley & Sons, Ltd. Hydrol. Process. 25, 886–900 (2011)
898 P. PORTO, D. E. WALLING AND G. CALLEGARI
Onslopedeposition
0.19 t ha-1 yr-1
(2%)
Sediment output8.65 t ha-1 yr -1
(98%)
Gross erosion8.84 t ha-1 yr-1
Sediment output0.25 t ha-1 yr-1
(7%)
Onslope deposition
0.88 t ha-1 yr -1
(25%)
Gross erosion3.54 t ha-1 yr-1
Conveyancesystemdeposition2.41 t ha-1 yr-1
(68%) Sediment output0.213 t ha-1 yr-1
(2%)
Onslopedeposition
6.64 t ha-1 yr-1
(65%)
Gross erosion10.18 t ha-1 yr-1
Conveyance systemdeposition3.33 t ha-1 yr -1
(33%)
(A) (B) (C)
Figure 9. Schematic sediment budgets for catchment (A) W1, (B) the Bonis catchment and (C) the Trionto catchment
erosion from the catchment slopes and the conveyanceloss is assumed to be zero. This is consistent with boththe lack of evidence of any deposition associated with thevery limited channel system and the uncertainty asso-ciated with both the estimate of net soil loss and themeasured sediment output. Direct comparison of thesetwo values is further hindered by the different time peri-ods involved. The estimate of net soil loss derived fromthe 137Cs measurements relates to the ca 40-year periodsince the onset of the main period of bomb fallout,whereas the measured sediment output from the catch-ment is based on measurements undertaken during theperiod 1978–1994. In the absence of information onchannel erosion, this potential sediment source has notbeen included as providing an additional sediment inputto the sediment budgets for the three catchments. This isseen to be consistent with the lack of visual evidence thatchannel erosion constitutes an important sediment sourcein the three study catchments. To facilitate comparisonof the budget structure across the three catchments, theestimates of erosion and deposition depicted in Figure 9have been expressed as values of specific soil loss anddeposition (t ha�1 year�1), and, in order to emphasize thecontrasts in budget structure, the gross erosion has beenrepresented by an arrow with a constant width for thethree catchments.
Figure 9 clearly demonstrates important contrastsbetween the sediment budgets of the three catchmentsin terms of both the absolute magnitude of the grosserosion associated with each of the catchments and theoverall structure of the budgets as represented by thevarying relative importance of the different budget com-ponents. In terms of the absolute magnitude of the grosserosion, the highest gross erosion per unit area (10Ð18t ha�1 year�1) is found in the Trionto catchment. Thisreflects the large area of cultivated land in this catch-ment, which is likely to be characterized by increasederosion rates. Although catchment W1 is uncultivated,the gross erosion is almost as high as that in the Triontocatchment. This situation can be related to the high slopegradients and relief ratio in this catchment and to the exis-tence of areas with limited vegetation cover. Turning to
the structure of the individual sediment budgets, that forcatchment W1, depicted in Figure 9a, indicates that mostof the sediment mobilized from the catchment slopesreaches the catchment outlet, providing a sediment deliv-ery ratio of ca 98%. This reflects the short steep slopesin the catchment and the lack of any well-developed val-ley floors where sediment could accumulate. The Boniscatchment (Figure 9b) shows more evidence of on-slopedeposition, with this component of the budget (0Ð88 tha�1 year�1), representing ca 25% of the gross erosion(3Ð54 t ha�1). On the basis of the measured sediment out-put of 0Ð25 t ha�1 year�1 (ca 7% of the gross erosion),the amount of sediment entering storage in the channelconveyance system is estimated to be 2Ð41 t ha�1 year�1
(ca 68% of the gross erosion). These values provide asediment delivery ratio of ca 7%. The sediment budgetdepicted in Figure 9c for the Trionto catchment empha-sizes that although the measured sediment output (0Ð21t ha�1) is very close to that provided by the catchmentBonis, the internal sediment redistribution shows a differ-ent pattern. In this catchment, on-slope deposition is par-ticularly important and accounts for 6Ð64 t ha�1 year�1,corresponding to ca 65% of the gross erosion (10Ð18 tha�1). This increase in on-slope deposition can be relatedto the lower slope gradients in the Trionto catchment, forwhich average slope gradients are less than 20% of thosefound in the two smaller catchments (Table I). Sedimentstorage associated with the channel conveyance systemis greater in absolute terms than that in the Bonis catch-ment and accounts for 3Ð33 t ha�1 year�1 (ca 33% of thegross erosion). This reflects the greater opportunity forsediment deposition within the channel system, which ischaracterized by lower gradients and a better-developedfloodplain than that in the Bonis catchment. However,in relative terms, it represents a smaller component ofthe sediment budget than that in the Bonis catchment, byvirtue of the increased importance of on-slope deposition.Because of the relatively high rate of gross erosion inthe Trionto catchment (6Ð64 t ha�1 year�1), and the largeamounts of sediment entering storage both on the slopesof the catchment and in the channel system, the sedimentdelivery ratio is low and only 2%. The results for the
Copyright 2010 John Wiley & Sons, Ltd. Hydrol. Process. 25, 886–900 (2011)
137CS MEASUREMENTS AND SCALE EFFECTS 899
Bonis and Trionto catchments emphasize the limitationsof measured sediment yields in providing evidence of therates of erosion and soil redistribution operating withinthese two catchments. The specific sediment yields aremore than 1 order of magnitude less than the gross ero-sion rates, and deposition and sediment storage within thecatchments can be seen to dominate the sediment budgetsof these two catchments.
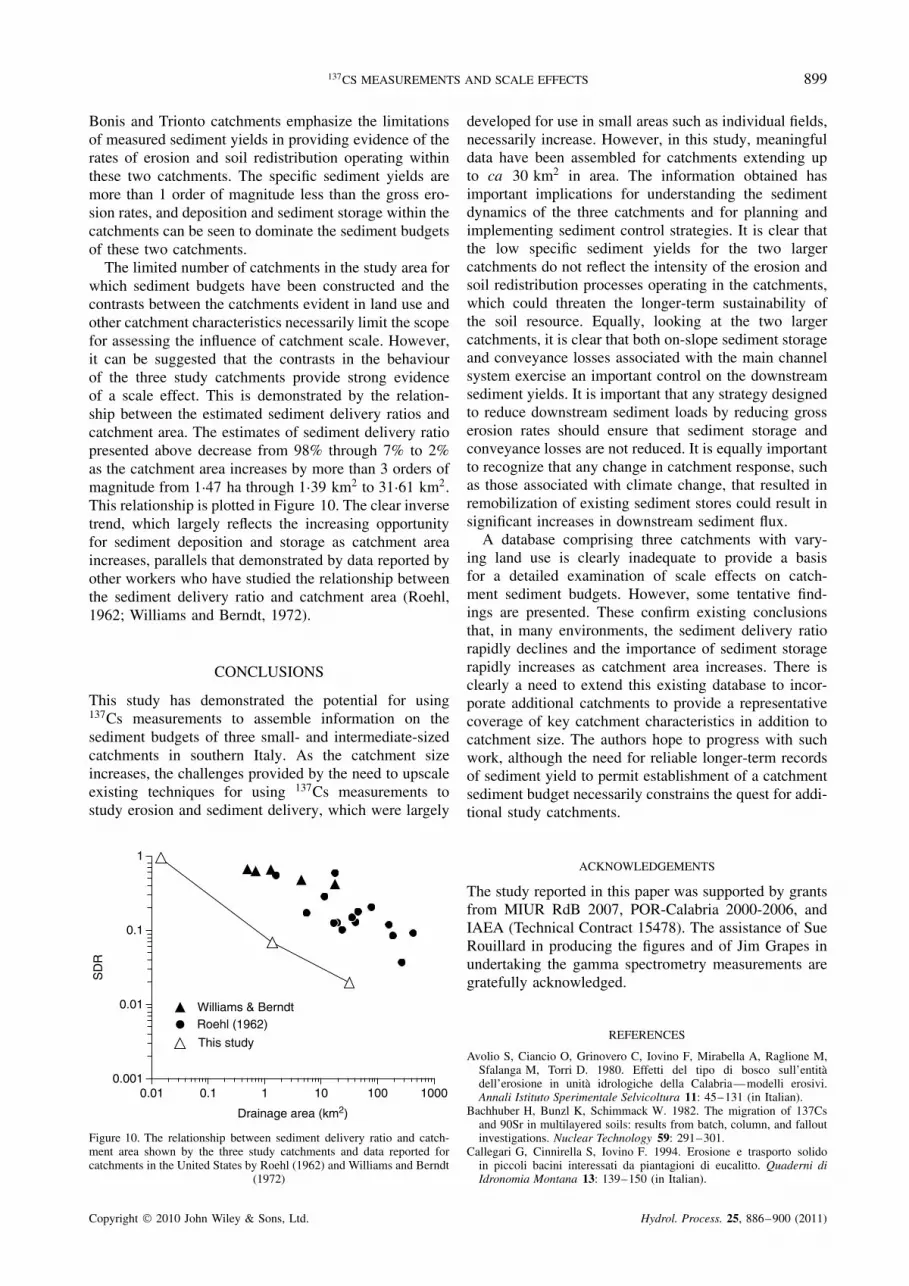
The limited number of catchments in the study area forwhich sediment budgets have been constructed and thecontrasts between the catchments evident in land use andother catchment characteristics necessarily limit the scopefor assessing the influence of catchment scale. However,it can be suggested that the contrasts in the behaviourof the three study catchments provide strong evidenceof a scale effect. This is demonstrated by the relation-ship between the estimated sediment delivery ratios andcatchment area. The estimates of sediment delivery ratiopresented above decrease from 98% through 7% to 2%as the catchment area increases by more than 3 orders ofmagnitude from 1Ð47 ha through 1Ð39 km2 to 31Ð61 km2.This relationship is plotted in Figure 10. The clear inversetrend, which largely reflects the increasing opportunityfor sediment deposition and storage as catchment areaincreases, parallels that demonstrated by data reported byother workers who have studied the relationship betweenthe sediment delivery ratio and catchment area (Roehl,1962; Williams and Berndt, 1972).
CONCLUSIONS
This study has demonstrated the potential for using137Cs measurements to assemble information on thesediment budgets of three small- and intermediate-sizedcatchments in southern Italy. As the catchment sizeincreases, the challenges provided by the need to upscaleexisting techniques for using 137Cs measurements tostudy erosion and sediment delivery, which were largely
Drainage area (km2)
0.001
0.01
0.1
1
0.01 0.1 1 10 100 1000
Williams & BerndtRoehl (1962)
This study
SD
R
Figure 10. The relationship between sediment delivery ratio and catch-ment area shown by the three study catchments and data reported forcatchments in the United States by Roehl (1962) and Williams and Berndt
(1972)
developed for use in small areas such as individual fields,necessarily increase. However, in this study, meaningfuldata have been assembled for catchments extending upto ca 30 km2 in area. The information obtained hasimportant implications for understanding the sedimentdynamics of the three catchments and for planning andimplementing sediment control strategies. It is clear thatthe low specific sediment yields for the two largercatchments do not reflect the intensity of the erosion andsoil redistribution processes operating in the catchments,which could threaten the longer-term sustainability ofthe soil resource. Equally, looking at the two largercatchments, it is clear that both on-slope sediment storageand conveyance losses associated with the main channelsystem exercise an important control on the downstreamsediment yields. It is important that any strategy designedto reduce downstream sediment loads by reducing grosserosion rates should ensure that sediment storage andconveyance losses are not reduced. It is equally importantto recognize that any change in catchment response, suchas those associated with climate change, that resulted inremobilization of existing sediment stores could result insignificant increases in downstream sediment flux.
A database comprising three catchments with vary-ing land use is clearly inadequate to provide a basisfor a detailed examination of scale effects on catch-ment sediment budgets. However, some tentative find-ings are presented. These confirm existing conclusionsthat, in many environments, the sediment delivery ratiorapidly declines and the importance of sediment storagerapidly increases as catchment area increases. There isclearly a need to extend this existing database to incor-porate additional catchments to provide a representativecoverage of key catchment characteristics in addition tocatchment size. The authors hope to progress with suchwork, although the need for reliable longer-term recordsof sediment yield to permit establishment of a catchmentsediment budget necessarily constrains the quest for addi-tional study catchments.
ACKNOWLEDGEMENTS
The study reported in this paper was supported by grantsfrom MIUR RdB 2007, POR-Calabria 2000-2006, andIAEA (Technical Contract 15478). The assistance of SueRouillard in producing the figures and of Jim Grapes inundertaking the gamma spectrometry measurements aregratefully acknowledged.
REFERENCES
Avolio S, Ciancio O, Grinovero C, Iovino F, Mirabella A, Raglione M,Sfalanga M, Torri D. 1980. Effetti del tipo di bosco sull’entitadell’erosione in unita idrologiche della Calabria—modelli erosivi.Annali Istituto Sperimentale Selvicoltura 11: 45–131 (in Italian).
Bachhuber H, Bunzl K, Schimmack W. 1982. The migration of 137Csand 90Sr in multilayered soils: results from batch, column, and falloutinvestigations. Nuclear Technology 59: 291–301.
Callegari G, Cinnirella S, Iovino F. 1994. Erosione e trasporto solidoin piccoli bacini interessati da piantagioni di eucalitto. Quaderni diIdronomia Montana 13: 139–150 (in Italian).
Copyright 2010 John Wiley & Sons, Ltd. Hydrol. Process. 25, 886–900 (2011)

900 P. PORTO, D. E. WALLING AND G. CALLEGARI
Callegari G, Ferrari E, Garfı G, Iovino F, Veltri A. 2003. Impact ofthinning on the water balance of a catchment in a Mediterraneanenvironment. The Forestry Chronicle 79(2): 301–306.
Campbell BL, Loughran RJ, Elliott GL. 1988. A method for determiningsediment budgets using cesium-137. In Sediment Budgets, Proceedingsof the Porto Alegre Symposium , Bordas MP, Walling DE (eds). IAHSPress: Wallingford, UK; IAHS Publication, 174: 171–179.
Crank J. 1975. The Mathematics of Diffusion, 2nd edn, Oxford UniversityPress: Bristol, UK; 1–414.
Dimase AC, Iovino F. 1996. I suoli dei bacini idrografici del Trionto,Nica e torrenti limitrofi (Calabria). Accademia Italiana di ScienzeForestali, Firenze (in Italian).
Ferro V, Porto P. 2000. Sediment delivery distributed (SEDD) model.Journal of Hydrologic Engineering 5(4): 411–422.
He Q. 1993. Interpretation of fallout radionuclide profiles in sedimentsfrom lakes and floodplain environments, Unpublished Ph.D. thesis,University of Exeter: UK.
He Q, Walling DE. 1996. Interpreting particle size effect in the adsorptionof 137Cs and unsupported 210Pb by mineral soils and sediments.Journal of Environmental Radioactivity 30: 117–137.
He Q, Walling DE. 1997. The distribution of fallout 137Cs and 210Pb inundisturbed and cultivated soils. Applied Radiation and Isotopes 48:677–690.
Heywood MJT, Walling DE. 2007. The sedimentation of salmonidspawning gravels in the Hampshire Avon catchment, UK: implicationsfor the dissolved oxygen content of intragravel water and embryosurvival. Hydrological Processes 21(6): 770–788.
Likar A, Omahen G, Lipoglavsek M, Vidmar T. 2001. A theoreticaldescription of diffusion and migration of 137Cs in soil. Journal ofEnvironmental Radioactivity 57: 191–201.
Lindstrom FT, Boersma L. 1971. A theory on the mass transport ofpreviously distributed chemicals in a water-saturated sorbing porousmedium. Soil Science 111: 192–199.
Livens FR, Baxter MS. 1988. Particle size and radionuclide levels insome west Cumbrian soils. The Science of the Total Environment 70:1–17.
Loughran RJ, Campbell BL, Shelley DJ, Elliott GL. 1992. Developing asediment budget for a small drainage basin in Australia. HydrologicalProcesses 16(2): 145–158.
Molin P, Dramis F, Pazzaglia FJ. 2004. Geomorphic expression ofactive tectonics in a rapidly-deforming forearc, Sila massif, Calabria,Southern Italy. American Journal of Science 304: 559–589.
Nevissi AE. 1985. Measurement of 210Pb atmospheric flux in the PacificNorthwest. Health Physics 48: 169–174.
Officer CB, Lynch DR. 1982. Interpretation procedures for thedetermination of sediment parameters from time-dependent fluximputs. Earth and Planetary Science Letters 61: 55–62.
Owens PN, Walling DE. 1996. Spatial variability of caesium-137inventories at reference sites: an example from two contrasting sites inEngland and Zimbabwe. Applied Radiation and Isotopes 47: 699–707.
Pegoyev AN, Fridman SD. 1978. Vertical profiles of caesium-137 in soils(English translation). Pochvovedenie 8: 77–81.
Porto P, Walling DE, Ferro V. 2001. Validating the use of caesium-137measurements to estimate soil erosion rates in a small drainage basinin Calabria, southern Italy. Journal of Hydrology 248: 93–108.
Porto P, Walling DE, Ferro V, Di Stefano C. 2003. Validating erosionrate estimates by caesium-137 measurements for two small forestedcatchments in Calabria, southern Italy. Land Degradation andDevelopment 14: 389–408.
Porto P, Walling DE, Callegari G. 2004. Validating the use of caesium-137 measurements to estimate erosion rates in three small catchmentsin Southern Italy. IAHS Publication 288: 75–83.
Porto P, Walling DE, Callegari G, Capra A. 2009. Using caesium-137and unsupported lead-210 measurements to explore the relationshipbetween sediment mobilisation, sediment delivery and sediment yieldfor a Calabrian catchment. Marine and Freshwater Research 60:680–689.
Renard KG, Foster GR, Yoder DC, McCool DK. 1994. RUSLE revisited:status, questions, answers, and the future. Journal of Soil and WaterConservation 49: 213–220.
Reynolds WD, Gillham RW, Cherry JA. 1982. Evaluation of distributioncoefficients for the prediction of strontium and cesium migration in auniform sand. Canadian Geotechnical Journal 19: 92–103.
Ritchie JC, McHenry JR. 1990. Application of radioactive fallout cesium-137 for measuring soil erosion and sediment accumulation rates andpatterns: a review. Journal of Environmental Quality 19: 215–233.
Roehl JE. 1962. Sediment source areas, and delivery ratios influencingmorphological factors. IAHS Publication 59: 202–213.
SIMI-Servizio Idrografico e Mareografico Nazionale. 2000. AnnaliIdrologici, Sezione di Catanzaro, Istituto Poligrafico dello Stato: Roma.
Sorriso-Valvo M. 1993. The geomorphology of Calabria—a sketch.Geografia Fisica e Dinamica Quaternaria 16: 75–80 (in Italian).
Soulsby C, Moir HJ, Youngson A, Malcolm I. 2001. Fine sedimentinfluence on salmonid spawning in a lowland stream: a preliminaryassessment. Science of the Total Environment 265: 295–307.
Stone M (ed.) 2000. The role of erosion and sediment transport in nutrientand contaminant transfer (Proc. Waterloo Symposium, July 2000).IAHS Publication 263: 69–81.
Walling DE. 1983. The sediment delivery problem. Journal of Hydrology65: 209–237.
Walling DE. 1998. Use of 137Cs and other fallout radionuclides in soilerosion investigations: Progress, problems and prospects. In Use of137Cs in the Study of Soil Erosion and Sedimentation, IAEA-TECDOC-1028, International Atomic Energy Agency, Vienna: 39–62.
Walling DE. 2004. Using environmental radionuclides to trace sedimentmobilisation and delivery in river basins as an aid to catchmentmanagement. Proceedings 9th International Symposium on RiverSedimentation. Yichang, China; 121–135.
Walling DE. 2006. Tracing versus monitoring: new challenges andopportunities in erosion and sediment delivery research. In SoilErosion and Sediment Redistribution in River Catchments , Owens PN,Collins AJ (eds). CABI: Wallingford; 13–27.
Walling DE, Collins AL. 2008. The catchment sediment budget as amanagement tool. Environmental Science and Policy 11: 136–143.
Walling DE, He Q. 1992. Interpretation of caesium-137 profiles inlacustrine and other sediments: the role of catchment-derived input.Hydrobiologia 235/236: 219–230.
Walling DE, He Q. 1993. Towards improved interpretation of 137Csprofiles in lake sediments. In Geomorphology and Sedimentology ofLakes and Reservoirs , John Wiley & Sons: Chichester; 31–53.
Walling DE, He Q. 1997. Models for converting 137Cs measurementsto estimates of soil redistribution rates on cultivated and uncultivatedsoils (including software for model implementation). Report to IAEA,University of Exeter, UK.
Walling DE, He Q. 1999. Improved models for estimating soil erosionrates from cesium-137 measurements. Journal of EnvironmentalQuality 28(2): 611–622.
Walling DE, He Q. 2001. Models for converting 137Cs measurementsto estimates of soil redistribution rates on cultivated and undisturbedsoils (including software for model implementation). Report to IAEA.University of Exeter, Exeter, UK.
Walling DE, Quine TA. 1992. The use of caesium-137 measurements insoil erosion surveys. In Erosion and Sediment Transport MonitoringProgrammes in River Basins . Bogen J, Walling DE, Day T (eds).IAHS Publication, 210, IAHS Press: Wallingford, UK; 143–152.
Walling DE, Woodward JC. 1992. Use of radiometric fingerprints toderive information on suspended sediment sources. In Erosion andSediment Transport Monitoring Programmes in River Basins , Bogen J,Walling DE, Day T (eds). IAHS Publication, 210, IAHS Press:Wallingford, UK; 153–164.
Warren N, Allan IJ, Carter JE, House WA, Parker A. 2003. Pesticidesand other micro-organic contaminants in freshwater sedimentaryenvironments—a review. Applied Geochemistry 18: 159–194.
Williams JR, Berndt HD. 1972. Sediment yield computed with universalequation. Journal of the Hydraulics Division 98(12): 2087–2098.
Wischmeier WH, Smith DD. 1978. Predicting rainfall erosion losses—aguide to conservation planning. USDA Agriculture Handbook 282:1–58.
Wood PJ, Armitage PD. 1999. Sediment deposition in a small lowlandstream: management implications. Regulated Rivers 15: 199–210.
Zapata F (ed). 2002. In Handbook for the Assessment of Soil Erosionand Sedimentation Using Environmental Radionuclides , Kluwer:Dordrecht.
Copyright 2010 John Wiley & Sons, Ltd. Hydrol. Process. 25, 886–900 (2011)
Related Documents