Langmuir 1994,10, 1427-1438 1427 Dispersions of Rhodamine-Labeled Silica Spheres: Synthesis, Characterization, and Fluores cence Confocal Scanning Laser Microscopy Nynke A. M. Verhaegh* and Alfons van Blaaderen Van't Hoff Laboratory, University o f Utrecht, Padualaan 8,3584 CH Utrecht, The Netherlands Received July 28, 1993. In Final Form: December 27, 1993@ Monodisperse colloi dal silica spheres , with a tot al ra dius of 200 nm, labeled with th e f luorescent dye rhodamine isoth iocya nate (RITC) in a core o f 100 nm radi us have b een synthesize d. The particles were characterized by tran smissi on electron mic roscop y and b y sta tic and dynamic light scatterin g. The fluorescence propertie s and dye concentr ation in the par ticl es were measured with fluorescence and absorption spe ctros copy. Stable dispersions of these hydrophilic, charge-stabilized silica spheres in polar solvents and o f organophilic, s terically stabi lized , 1-oc tadec anol- coated ilica spheres in apolar solvents were stu died with fluorescence confo cal s canning laser micros copy (CSLM). The bleachability of the se particles was determined with CSLM and compared with particles labeled with the dye fluorescein isothiocyanate (FI TC) . The possibilities and limitat ions o f confocal micros copy to study individual fluo resce nt part icles in the bulk o f conce ntrat ed model dispe rsions are discussed and d emonstrated with CSL M graphs of a ti me ser ies sh owing colloid al crystallization (cry stal growth rate approximately 4 wm/s), an eq uilib rium between a colloidal liquid and colloidal cryst al interface, and a binary mixture o f RI TC- and FITC-labeled sphe res. Furth er, the feasibility o f using th e RITC-labeled spher es wit h other tech niques relying on fluorescence is discussed as well. 1 Introduction Seve ral experimental techniques to study the st ructur e an d dynamics of dispersions rel y in one way or anothe r on fluorescence, e.g. fluorescence recov ery aft er photobleach- ing (FRAP'), fluorescence correlation spectroscop y (FCS2) , fluorescence cross correlation spectroscopy using two dyes: and luorescence confocal scanning laser microscopy (CS LM4.5). For all these t echniq ues t he a vailab ility o f well-characterizedfluorescentmode l particles is essentia l. Recently, we succeeded in synthesizing fluorescein isothiocyanate (FITC) labeled silica spheresS6 The flu- orescent dye was covalently bound to a coupling agent, which par tici pat ed in the synthes is o f monodisperse silica spher es by a modification of th e process deve loped by Stijber et al.7 This resulted in organosilicaspheres in whi ch the organic d ye is distributed homo gene ousl y. Onto this core an outer sh ell o f non fluor escent silica wa s grown. The particles so obtained are excellent model particles, because the dye can never leave th e particle (see, e.g., ref 3) and does not influence the interparticle potential since it is far awa y from the particle surface . Furthermore, the refrac- tive index o f th e silica partic les is cl ose to t hat o f apol ar solvents in which they can be dispersed after a coating reaction with 1-octadecanol, which provides steric stabi- lizat ion.8 This refractive index matching makes it possible to prepare concentrat ed (>50 7 volu me fraction) disper- sions of large particles that are hardly t ~ r bid.~ harged silica spheres can be matched and studied in the polar solvent dimethylformamide. 0 Abstract published in Advance ACS Abstracts, March 1,1994. (1) Davoust, J.; Devaux, P.; Leger, L. EMBO J. 1982, 1, 1233. (2) rewel, M ; usey, P. N. Opt. Acta 1983, 30 (lo), 483. (3) icka, J.; Binkert, T. Phys. Rev. A 1989,39 (5), 646. (4) Wilson, T . Phys. E Sci. Instrum. 1989, 22, 532. (5) rakenhoff, G. .; van de r Voort, H. T. M.; van Spronsen, E. A.; (6) an B laade ren, A.; Vrij, A. Langmuir 1992,8, 2921. (7) Mber, W.; Fink, A.; Bohn, E. J. Colloid Interface Sci. 1968,26 (l), (8) an Helden, A. K.; Jansen, J. W.; Vri j, A. J. olloid Interf ace Sci. (9) an Blaaderen, A. Adu. Mater. 1993,5 (l), 2. Nanninga, N. Scanning M icrosc. 1988,2 (l), 3. 62. 1981, 81 (2), 54. FITC-labeled silica spheres have been studied by fluoresce nce confocal scanning laser micro s~o py. ~J0 ith CSLM it is possible to image individual particles in th e bulk of a concentrated dispersion, due to a combination of a powerful depth discrimination (optical sectioning) and a n increased resolution compa red to conventional light microscopy. Both prope rties are a consequence o f the extremely limi ted field o f vie w o f CSLM. Only a diff ract ion limited point is focused inside the specimen and the fluorescence intensity is subsequently image d on a point dete ctor all Consequently, the image has to be built up by scanning . Typically, the digital construction o f a n image plane of 512 by 768 pixels takes about 1 s. With an excita tion wavelength o f 488 nm for th e dye FIT C an d a lens with numeric al ap ertu re (N.A. ) 1 .3, a latera l resolution of 0.2 pm (bo th in and y direction) and an axial resolution o f 0.65 p m are possibl e.11 Wi th th e stored da ta of several parall el cross sections, a 3-D image can be construc ted by digital image analysis. A shor t dis cussion o n th e advan- tages o f CSLM compared t o conventional dir ectly imaging methods of colloidal particles in concentrated dispersions is given in ref 9. The vulnerability of th e fluorophore FITC to photo- bleaching impedes CSLM measurements (though it is essential for FRAP measurements12); therefore, a new fluorescent silica system was prepared, labeled with anothe r dye, which woul d make th e system better suited for CS LM studies. For this purpose, the dye rhodamine isothiocyanate (RI TC) was chose n, since it is reported to be less bleachable tha n FITC13J4 nd since its fluorescence chara cteris tics supplement those o f FIT C very we ll .' 3 Free RITC in a mixture of ethanol, ammonia, and wa ter has it s excitation and emission maxima at 546 and 568 nm, (10) an B laaderen, A.; Imhof, A.; Hage, W.; Vrij, A. Langmuir 1992, (11) Wilson, T onfocal Microsco py; Academic Press: London, 1990. (12) an Blaaderen, A,; Peetermans, J.; Maret, G.; Dhont, J. K. G. J. (13) akowicz, J. R. Principles ofFluorescence Spectroscopy; Plenum (14) airn, R. C. Fluorescent Protein Tracing, 4th ed.; Churchill 8 63, 514. Chem. Phys. 1992,96 (9), 591. Press: New York, 1984. Livingstone: Edingburgh, 1976. 0743-7463/94/2410-1427 04.50/0 1994 American Chemical Society

Welcome message from author
This document is posted to help you gain knowledge. Please leave a comment to let me know what you think about it! Share it to your friends and learn new things together.
Transcript
7/25/2019 Verhaegh_vanBlaaderen_Langmuir_1994_Dispersions of Rhodamine-Labeled Silica Spheres Synthesis, Characterizat…
http://slidepdf.com/reader/full/verhaeghvanblaaderenlangmuir1994dispersions-of-rhodamine-labeled-silica 1/12
Langmuir
1994,10,
1427-1438
1427
Dispersions of Rhodamine-Labeled Silica Spheres:
Synthesis, Characterization, and Fluorescence Confocal
Scanning Laser Microscopy
Nynke A.
M.
Verhaegh* and Alfons van Blaaderen
Van't Hoff Laboratory, Universi ty o f Utrecht ,
Padualaan 8,3584 CH Utrecht , The Nether lands
Received Jul y 28, 1993. In Final Form: December
27,
1993@
Monodisperse colloidal silica spheres, with a total radius of 200 nm, labeled with the fluorescent dye
rhodamine isothiocyanate (RITC) in a core of 100 nm radius have been synthesized. The particles were
characterized by transmission electron microscopy and by static and dynamic light scattering. The
fluorescence properties and dye concentration in the particles were measured with fluorescence and
absorption spectroscopy. Stable dispersionsof these hydrophilic,charge-stabilized silica spheres in polar
solvents and of organophilic, sterically stabilized, 1-octadecanol-coated ilica spheres in apolar solvents
were studied with fluorescence confocal scanning laser microscopy (CSLM). The bleachability of these
particles was determined with CSLM and compared with particles labeled with the dye fluorescein
isothiocyanate (FITC). The possibilities and limitations of confocal microscopy to study individual
fluorescent particles in the bulk of concentrated model dispersions are discussed and demonstrated with
CSLM graphs of a time series showing colloidal crystallization (crystalgrowth rate approximately
4
wm/s),
an equilibrium between a colloidal liquid and colloidal crystal interface, and a binary mixture of RITC-
and FITC-labeled spheres. Further, the feasibility of using the RITC-labeled sphereswith other techniques
relying on fluorescence is discussed as well.
1 Introduction
Several experimental techniques to study the structure
and dynamics of dispersions rely in one way or another on
fluorescence,e.g.
fluorescence
recovery after photobleach-
ing (FRAP'),
fluorescence
correlation spectroscopy (FCS2),
fluorescence
cross correlation spectroscopy using two
dyes: and
luorescence
confocalscanning laser microscopy
(CSLM4.5). For all these techniques the availability of
well-characterized fluorescent model particles is essential.
Recently, we succeeded in synthesizing fluorescein
isothiocyanate (FITC) labeled silica spheresS6The flu-
orescent dye was covalently bound to a coupling agent,
which participated in the synthesis of monodisperse silica
spheres by a modification of the process developed by
Stijber
et al.7
This resulted inorganosilicaspheres in which
the organic dye is distributed homogeneously. Onto this
core an outer shell of nonfluorescent silica was grown. The
particles so obtained are excellent model particles, because
the dye can never leave the particle (see, e.g., ref 3) and
does not influence the interparticle potential since it is far
away from the particle surface. Furthermore, the refrac-
tive index of the silica particles is close to tha t of apolar
solvents in which they can be dispersed after a coating
reaction with 1-octadecanol, which provides steric stabi-
lization.8 This refractive index matching makes it possible
to prepare concentrated (>50
7
volume fraction) disper-
sions of large particles that are hardly t ~ r b i d . ~harged
silica spheres can be matched and studied in the polar
solvent dimethylformamide.
0
Abs t r act publ i shed in
A d v a n ce A C S A b s t r a c t s ,
M ar ch
1,1994.
(1)Davoust, J.; Devaux, P.; Leger, L. EMBO J.1982, 1, 1233.
(2)
rewel, M ;usey, P. N. Opt . Ac ta 1983, 30
(lo), 483.
(3) icka, J.; Binkert, T. Phys . Rev . A 1989,39 (5), 646.
(4)Wilson,
T
. Phys . E Sci. Instrum.
1989, 22,
532.
(5) rakenhoff, G. .; van de r Voort, H. T. M.; van Spronsen, E. A.;
(6) an B laade ren, A.; Vrij, A. Langmuir 1992,8, 2921.
(7) Mber, W.; Fink, A.; Bohn, E.
J.
Colloid Interface Sci.
1968,26
(l),
(8) an Helden, A.
K.;
Jansen,
J.
W.; Vri j, A.J. olloid Interf ace Sci.
(9) an Blaaderen, A. Adu. Mater. 1993,5 (l), 2.
Nanninga, N. Scanning M icrosc. 1988,2 (l), 3.
62.
1981, 81
(2), 54.
FITC-labeled silica spheres have been studied by
fluorescence confocal scanning laser micros~opy.~J0 ith
CSLM it is possible to image individual particles in the
bulk of a concentrated dispersion, due to a combination
of a powerful depth discrimination (optical sectioning)
and an increased resolution compared to conventional light
microscopy. Both properties are a consequence of the
extremely limited field of view of CSLM. Only a diffraction
limited point is focused inside the specimen and the
fluorescence intensity is subsequently imaged on a point
detectorall Consequently, the image has to be built up by
scanning. Typically, the digital construction of an image
plane of 512 by 768 pixels takes about 1 s. With an
excitation wavelength of 488 nm for the dye FITC and a
lens with numerical aperture (N.A.) 1.3, a lateral resolution
of 0.2 pm (both in and
y
direction) and an axial resolution
of 0.65 pm are possible.11 With the stored data of several
parallel cross sections, a 3-D image can be constructed by
digital image analysis.
A
shor t discussion on the advan-
tages of CSLM compared to conventional directly imaging
methods of colloidal particles in concentrated dispersions
is given in ref
9.
The vulnerability of the fluorophore FITC to photo-
bleaching impedes CSLM measurements (though it is
essential for FRAP measurements12); therefore, a new
fluorescent silica system was prepared, labeled with
another dye, which would make th e system better suited
for CSLM studies. For this purpose, the dye rhodamine
isothiocyanate (RITC) was chosen, since it is reported to
be less bleachable than FITC13J4 nd since its fluorescence
characteristics supplement those of FITC very well.'3 Free
RITC in a mixture of ethanol, ammonia, and water has its
excitation and emission maxima at 546 and 568 nm,
(10) an B laade ren, A.; Imhof, A.; Hage, W.; Vrij, A.
Langmuir 1992,
(11)Wilson,
T
onfocal Microsco py;Academic Press: London, 1990.
(12) an Blaaderen, A,; Peetermans,
J.;
Maret , G.; Dhont ,
J.
K. G. J.
(13)
akowicz, J. R. Principles ofFluorescence Spectroscopy; Plenum
(14) airn, R. C. Fluorescent Protein Tracing,
4th
ed.; Churchill
8 63,
514.
Chem.
Phys . 1992,96 (9), 591.
Press: New York, 1984.
Livingstone: Edingburgh, 1976.
0743-7463/94/2410-1427 04.50/0
1994 American Chemical Society
7/25/2019 Verhaegh_vanBlaaderen_Langmuir_1994_Dispersions of Rhodamine-Labeled Silica Spheres Synthesis, Characterizat…
http://slidepdf.com/reader/full/verhaeghvanblaaderenlangmuir1994dispersions-of-rhodamine-labeled-silica 2/12
1428
Langmuir,
Vol. 10,No. 5, 1994
respectively. Free FITC in the same mixture has its
excitation and emission maxima at
501
and 526 nm,
respectively.'j Since th e fluorescence characteristics of
both dyes are distinguishable, t is possible to study binary
mixtures consisting of spheres labeled with either FITC
or
RITC, in a CSLM set up th at excites and detects both
fluorophores simultaneously.
The radius of the fluorescent core was chosen close to
100 nm and that of the total radius around
200
nm. The
size of the silica layer is a consequence of the following:
first, the necessity to have particles with a thick silica
layer, so th at they become monodisperse and that the size
of the nonfluorescent intercore distance is large enough
to allow distinction of neighboring particles by CSLM;
second, the necessity to have spheres with limited sedi-
mentation rate and (for sterically stabilized spheres)
limited van der Waals forces. The size of th e core was as
small as possible for this method of synthesis.
In this paper we describe the synthesis and extensive
characterization of these RITC labeled silica spheres. The
charge stabilized spheres were dispersed in polar solvents,
and after a coating reaction with 1-octadecanol the
sterically stabilized spheres were dispersed in several
apolar solvents. Size and polydispersity of the particles
were measured with transmission electron microscopy and
static and dynamic light scattering. The amount of dye
incorporated, particle density, and refractive index were
determined. The fluorescence emission and excitation of
RITC inside the silica particles were measured, and the
bleachability of RITC and FITC labeled spheres was
compared by CSLM measurements.
Finally, CSLM micrographs of dispersions of the RITC
labeled spheres in chloroform are presented. The tech-
nique was ideally suited to study both the dynamics of
crystallization and th e structure of the crystalline phase
in this colloidal system. Further, a bimodal system
containing large FITC labeled spheres and smaller RITC
labeled spheres in chloroform was studied with dual
excitation and detection. The spatial distribution of the
two kinds of spheres was revealed by CSLM, both before
and after colloidal crystallization.
2.
Experimental
Section
A. Materials. The solvents hexadecane (9 9% , Janssen),
1-propanol (Janssen), toluene (Baker), chloroform (Bake r),
tetrachloromethane (tetra , Baker), cyclohexane (Jans sen) ,
N f l -
dimethylformamide (DM F, 99
%
, Janssen), and ammonium
hydroxide (ammonia, Merck, 25 % ) were of analytical reagent
quality. Th e ammonium hydroxide, which will subsequently be
referred to as ammonia , contained 14.8 M NH3 as was
determined by titration. Hydrofluoric acid was obtained from
Merck (38-40%, extra pure). Etha nol (absolute technicalgrade,
Nedalco) was used after distillation. Th e reagents tetraethox-
ysilane (TES , Fluka, purum grade) and (3-aminopropy1)tri-
ethoxysilane
APS,
9 % , Janss en) were freshly distilled before
the synthesis. Sodium hydroxide pellets (M erck, zur synthese),
1-octadecanol (stearyl alcohol, Merck, zur synthese), and
rhodam ine B isothiocyanate (RI TC mixed isomers, Fluka) were
used as received.
B. Particle Synthesis.
The rhodamine labeled particles
were synthesized according to th e procedure described by van
Blaaderen
e t
al. for organosilica spheres.6 Th is synthesis will be
described concisely,emphasizing he differences. N ote th at color
effects described here are d ue to absorbance and light scattering
as well as fluorescence. Th ey ar e subjective observations,
mentioned only to ind icate possible changes. Fluorescence was
observed under illumination with a UV lamp. Filters were used,
in order t o distinguish fluorescence from light scattering.
All glass reaction vessels were cleaned extensively to ensure
tha t no nucleation sites were present (washingprocedure: filling
with 8% hydrofluoric acid (H F) for half an hour; removing H F
Verhaegh and van Blaaderen
by subsequ ently rinsing with cold, hot, an d deionized water; finally
rinsing with distilled ethanol).
In a reaction vessel, which had been dried for 3 h at 120 C,
0.0938 g of th e coupling agent A PS (4.25X 1Wmol) was added
to0.1178gofthefluorophoreRITC 2.20 X 10-lmol) inam ediu m
of
10
mL of anhydrous ethanol. Th e reaction proceeded for 17
h in the dark with magnetic stirring and under nitrogen. The
color of the solution was dark purple, and due to strong self-
quenching orange fluorescence could only be observed at the
edges. Th e small surplus of APSwas required to avoid a possible
loss of RITC by a reaction with amm onia during furth er steps.
By adding free RITC to an alcosol, we determined tha t th e dye
did no t adsorb on to silica and th us changed the surface charge of
the spheres: after centrifugation the sedim ent was white and the
supernatant was red.
Th e organosilica cores were synthesized under nitrogen in
670
mL of ethano l and 51 mL of ammonia (final concentrations, 1
M NH3 and
2.8
M H2O). Reagen t concentrations were chosen
to prepare sph eres with a radius of abou t 100nm.8915 T he co up led
dye (APS-R ITC) was quantitatively transferred into the reaction
vessel under mechanical stirring, resulting in a dark red,
transparent mixture with orange fluorescence. The reaction
vessel was thermostated a t 21.5 C. Th e reagent TE S (28.3 mL,
0.127 mol) was added by a funnel un der th e solution surface and
under severe mechanical stirring.
After a few minutes the solution became turbid , and the stir
rat e was decreased. After 51/2 h a sm all fraction of fluorescent
organosilica core particles (C ORE) was isolated. Th e growth
step s were executed in the original reaction mixture, to prevent
particle aggregation by centrifugation. Consequently, there was
still dye present in the supernatant which had not been
incorporated, as could be seen after centrifuging a small fraction
of the dispersion. Although the sup erna tant remained colored
by RITC during all growth steps, the final particles had a
fluorescent core only. Apparen tly, the presence of the dye did
not disturb the coating with silica.
First, only 0.7 mL of TES was added to deposit a thin layer
of silica on the pa rticles and
to
prev ent flocculation by increasing
the ionic stren gth too much.16 After that a total am oun t of 253
mL of TE S was added in larger portions with intervals of a t east
2
h. Water was regularly added as well, to maintain th e molar
ratio water:TES a t least 10 1. Th e final radius was theoretically
predicted to be 203 nm, based on the amount of TES added.6
Th e final volume of the reaction m ixture was centrifuged a t
900 rpm in a Beckman L5-50B ultracentrifuge for
2
h. The
sediment showed crystal reflections in th e to p layer. A stable
dispersion in a fresh mixture of ethanol and am monia (1M NH3
an d 2.8 M H2O) was prepared which will be referred to as SIS0 L .
For the esterification of the alcosol with 1-octadecanol, as
described by van Held en? 215 g of steary l alcohol was dissolved
in 500 mL of ethanol under magnetic stirring at 70 C.
A
volume
of the alcosol containing ap proxim ately 43 g of silica was add ed
in three portions. Amm onia and ethan ol were removed by
distillation. Th e excess of water was removed by azeotropic
distillation by adding 250 mL of propanol in two portions. Th e
tem peratu re of th e remaining melt of 1-octadeca nolwas gradually
increased to 150 OC, afte r which the reaction mixture was placed
under a dry nitrogen flow. Finally, the tem perature was stabilized
a t 190 C, where the esterification took place during 16 h. Once
coated with 1-octadecanol, the silica particles form a gel phase
in th e liquid 1-octadecanol at tem peratures around ita melting
point. Therefore, the mixture was left in an oven at 80 C
for
48 h. Almost all stearyl alcohol, which was vaguely colored red,
could be d ecanted and , finally, the coated silica spheres were
washed in chloroform and in cyclohexane both by 3 times
centrifugation. Th e rhodamine-labeled, stearyl-coated silica
spheres, which will be referred to as STSI , seemed darker red
tha n th e uncoated ones (SISOL ), because the refractive index of
the silica spheres was matched better in apolar solvents. Visually,
no difference could be observed in th e fluorescence color of STS I
and SISOL (see also section 3B).
(15)
Bogush,
G. H.; Tracy, M.
A.; Zukoski,
C. F., IV J.Non- Cr ys t .
(16) an Blaaderen,
A.;
van
Geest,
J.; Vrij, A.
J.
Colloid
Interface
Sci.
Solids . 1988, 104,
95.
1992, 154 2),
481.
7/25/2019 Verhaegh_vanBlaaderen_Langmuir_1994_Dispersions of Rhodamine-Labeled Silica Spheres Synthesis, Characterizat…
http://slidepdf.com/reader/full/verhaeghvanblaaderenlangmuir1994dispersions-of-rhodamine-labeled-silica 3/12
Dispers ions of Rhodam ine-Labe led S i l ica Sphe res Langm ui r ,
Vol. 10, No. 5,1994
1429
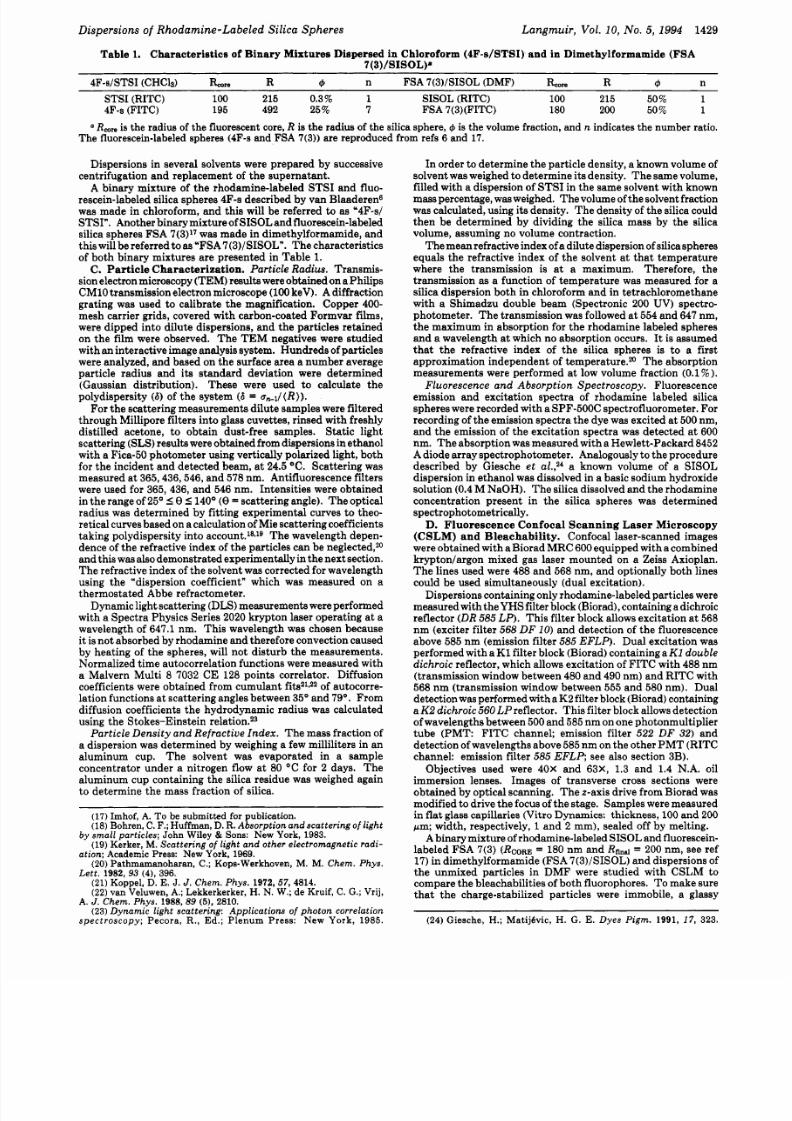
Table 1 Cha racter is t ics of B inary M ixtures Dispersed in Chloroform (4F-s /STSI) and in Dimethylformamide (FSA
7(3)/SISOL).
~~ ~
4F-d STSI (CHCls) &m
R
4 n FSA 7(3)/SISOL (DMF) RW R 4 n
STS I (RIT C) 100 215 0.3% 1 SISOL (RITC )
100
215 50% 1
4F-s (FI TC ) 195 492 25
%
7 FSA 7(3 )(F IT C) 180 200 50% 1
R is the radius of the fluorescent core, R is the rad ius of the silica sph ere ,
J
is the volume fraction, and n indicates the num ber ratio.
The fluorescein-labeled spheres (4F-s and FSA 7(3)) are reproduced from refs 6 and 17.
Dispersions in several solvents were prep ared by successive
centrifugation and replacement of the supernatant.
A
binary mixture of the rhodamine-labeled STSI and fluo-
rescein-labeled silica spheres 4F-s described by van B laaderene
was made in chloro form, and this will be referred
to
as '4F-s/
STSI . Another binary mixture of SISOL nd fluorescein-labeled
silica spheres FSA 7(3)17 was mad e in d imethylforma mide, and
this will be referred toas FSA7(3)/SISOLn. Th e characteristics
of both binary mixtures are presented in Table 1.
C. Par t ic le Character iza t ion. Partic le Radius . Transmis-
sion electronmicroscopy (T EM ) results were obtained on a Philips
CMlO transmission electron microscope(100
eV).
A diffraction
grating was used to calibrate the magn ification. Copp er 400-
mesh carrier grids, covered with carbon-co ated Formvar films,
were dipped into dilute dispersions, and the particles retained
on the film were observed. Th e TE M negatives were studied
with an interactive image analysis system. Hun dreds of particles
were analyzed, and b ased on the surface area a numb er average
particle radius and its standard deviation were determined
(Gaussian distribution). These were used to calculate the
polydispersity
(6)
of the system
6 =
u,+l/(R)).
For th e scatterin g measurements dilu te samples were filtered
through Millipore filters into glass cuvettes, rinsed with fresh ly
distilled acetone, to ob tain dust-free samples. Static light
scattering
(SLS)
esults were obtained from dispersions n ethanol
with a Fica-50 photom eter u sing vertically polarized light, both
for th e inciden t and detected beam, at 24.5 C. Scattering was
measured at 365,436,546,and 578 nm. Antifluorescence ilters
were used for 365, 436, and 546 nm. Intensities were obtained
in the ran ge of 25 5 8 5 140° (8= scattering angle). T he optical
radius was determined by fitting experimental curves to theo-
retical cu rves based on a calculation of Mie scattering coefficients
taking po lydispersity into account.18Js Th e wavelength depen-
dence of th e refractive index of th e particles can be neglected,20
and this was also demonstrated experimen tally n th e next section.
Th e refractive index of t he so lvent was corrected for wavelength
using the dispersion coefficient which was measured on a
thermostated Abbe refractometer.
Dynamic light scattering (DL S)measurementswere performed
with a Spe ctra Physics Series 2020 kryp ton laser operating at a
wavelength of 647.1 nm. Th is waveleng th was chosen because
it is not absorbed by rho damine an d therefore convection caused
by heating of the spheres, will not disturb the measurements.
Norm alized time a utocorrelation functions were measured with
a Malvern Multi 8 7032 CE 128 points correlator. Diffusion
coefficients were obtained from cumulant fitsZ1v2*f autocorre-
lation functions at scattering angles between 35 and 79 . From
diffusion coefficients the hydrody namic radius was calculated
using the Stokes-Einstein relation.23
Particle Density an d Refractiue Index. Th e mass fraction of
a dispers ion was determ ined by weighing a few milliliters in an
aluminum cup. Th e solvent was evaporated in a sample
concentrator under a nitrogen flow at 80 OC for 2 days . The
aluminum cup co ntaining the silica residue was weighed a gain
to dete rmine th e m ass fraction of silica.
(17)
mhof,
A. To be submitted for publication.
(18)
ohren, C. F.;Huffman,
D. R.
Absorption and scattering of light
by small particles; John Wiley Sons: New York, 1983.
(19)Kerker, M.
Scattering
of
light and other electromagnetic radi -
ation;
Academic
Press: New York,
1969.
(20)
athmamanoharan, C.;
ops-Werkhoven,
M. M.
Chem. Phys.
Le t t . 1982, 3 (4), 96.
(21)Koppel, D . J. J. Chem. Phys. 1972,57,4814.
(22)
an
Veluwen,
A.; Lekkerkerker, H.
N.
W.; de
Kruif,
C.
G.;
Vrij,
A. J. Chem. Phys.
1988,89
5 ) ,
2810.
(23) ynamic light scattering: Applications of photon correlation
s p e c t r o s c o p y ; Pecora,
R.,
Ed.; Plenum Press: N e w Y o r k ,
1985.
In order t o determ ine the p article density, a known volume of
solvent was weighed to determine its density. Th e same volume,
filled with a dispersion of S TSI in the same solvent with known
mass percentage,was weighed. Th e volume of the solvent raction
was calculated, using its density. Th e density of the silica could
then be determined by dividing the silica mass by the silica
volum e, assuming no volume contraction.
The m ean refractive index of a dilute dispersionof silica sph ere s
equals the refractive index of th e solvent at t ha t temperature
where the transmission is at a maximum. Therefore, the
transmission as a function of temperatur e was measured for a
silica dispersion both in chloroform and in tetrachloro meth ane
with a Shimadzu double beam (Spectronic 200 UV) spectro-
photom eter. Th e transmission was followed a t 554 and 647 nm ,
the m aximum in absorption for the rhodamine labeled spheres
and
a
wavelength at which no absorption occurs. It is assumed
that the refractive index of the silica spheres is to a first
approxim ation independe nt of temperature.20 Th e absorption
measurements were performed at low volume fraction
(0.1
%).
Fluorescence and Absorption Spectroscopy. Fluorescence
emission and excitation spectra of rhodamine labeled silica
spheres were record ed with a SPF-5OOC spectrofluorometer. For
recording of the emission spe ctra the d ye was excited at 500 nm,
and th e emission of the excitation spectra was detected a t 600
nm. Th e absorption was measured with a Hewle tt-Packar d 8452
A
diode array spectrophotom eter. Analogously to the procedure
described by Giesche et a known volume of a SISOL
dispersion in ethan ol was dissolved in a ba sic sodium hydroxide
solution (0.4 M NaO H). Th e silica dissolved and the rhodam ine
concentration present in the silica spheres was determined
spectrophotometrically.
D.
Fluorescen ce Confoca l Scann ing Lase r Mic roscopy
(CSL M) an d Blea cha bility . Confocal laser-scanned images
were obtained with a Biorad MR C 600 equipped w ith a combined
kryptodargon mixed gas laser mounted on a Zeiss Axioplan.
T he lines used were 488 and 568 nm, and optionally both lines
could be u sed simultaneou sly (dua l excitation).
Dispersions containing only rhodam ine-labeled particles were
mea suredw iththeY HS filter block (Biorad), o ntainingadichroic
reflector (DR 585LP . This filter block allows excitation a t 568
nm (exciter filter 568 D F
10
and de tection of the fluorescence
above 585 nm (emission filter
585
EFL P). Dual excitation was
performed with a K1 filter block (B iorad)containing aK1 double
dichroic reflector, which allows excitation of FIT C with 488 nm
(transmission window between 480 and
490
nm) and RITC w ith
568 nm (transmission window between 555 and
580
nm). Dual
detectionwas performedw ith a K2 filter block (Biorad)containing
aK 2 dichroic560LPref lector. Th is filter block allows detection
of wavelengthsbetween
500
and 585nm on one photonm ultiplier
tube ( P M T FITC channel; emission filter 522 DF 32) and
detection ofwaveleng ths above
585
nm on the other PMT (RITC
channel: emission filter
585
EFLP; see also section 3B).
Ob jectives used were 40X and 63X, 1.3 and 1.4 N.A. oil
imm ersion lenses. Images of transve rse cross sections were
obtain ed by optical scanning. T he z-axis drive from Biorad was
mod ified o drive the focus of the stage. Samp les were measured
in
flat
glass capillaries (Vitro Dynam ics: thickn ess, 100
and
200
fim; width, respectively, 1 and 2 mm ), sealed off by melting.
A
binary mixture of rhodam ine-labeledSISOL and fluorescein-
labeled FSA 7(3) (&ORE =
180
nm and
Rend
= 200 nm, see ref
17) in dim ethylformamide (FSA 7 (3)/SISOL)and dispersions of
the unmixed particles in DMF were studied with CSLM to
compa re th e bleachabilities of both fluorop hores. To mak e sure
that the charge-stabilized particles were immobile, a glassy
(24)Giesche,
H.; Matijbvic, H.
G.
E. Dyes P igm.
1991, 17, 323.
7/25/2019 Verhaegh_vanBlaaderen_Langmuir_1994_Dispersions of Rhodamine-Labeled Silica Spheres Synthesis, Characterizat…
http://slidepdf.com/reader/full/verhaeghvanblaaderenlangmuir1994dispersions-of-rhodamine-labeled-silica 4/12
1430 Langmuir, Vol.
10,
No.
5 ,
1994
Verhaegh and van Blaaderen
ediment in a ca pillary was made by cen trifuging
at 3000
rpm.
A line scan of th e sedim ent close to t he glass wall was made
parallel to the capillary. Both single and dua l excitation options
were used, the lat ter in order to expose th e dyes o equal intensity.
The intensity of the laser beams was about 5 mW for each
wavelength (Biorad). Each line scan consisted of
768
pixels and
typically th e time necessary for perform ing one line scan was 2
ms. Subsequen tly, 512 successive scans were made of the sa me
line so tha t the observed line could be studied
as
a function of
time. By averaging each line scan over an ad justable numb er of
times, the tota l exposure time was varied. Each line scan
contained information on the position of th e fluorescent spheres
in the studied part of the specimen,since each line scan consisted
of a pattern of bright and d ark regions. Th e bleachability was
assessed by exam ining he fluorescent intensity of a small region
of the line asa function of exposure time, i.e. th e intensity of th e
same region of the line was rec orde d for all successive line scans.
I
I
This sm all region of th e line scan over which the intensity was
-
recorded was 15 pixels wide (equiva lent to.740 nm). Th e size of
this region was chosen such that it contained one bright spot,
correlated
to
one fluorescent sphere. Averaging over a differen t
num ber of pixels did not change the results. By depicting the
512 successive line scans parallel t o each other, a picture frame
was filled, making it possible to check th at th e same p ar t of the
specimen was bleached. This was necessary because sometimes
a movement of th e sam ple of several micrometers was observed
parallel to the direction of the line scan. Therefore, only a small
region of the line scan has been analyzed for bleaching , which
was recognizable in the se quen ce of line scans, so th at we were
able to correct for the movem ent of the sample. Possible
explanations for the observed movement are internal movement
of th e microscope or an an isotropic expansion of th e capillary
due to local heating.
3. Results and Discussion
A.
Particle Synthesis and Characterization. The
molar ratio TES:RITC in the synthesis of fluorescent
CORE particles was 580:l. This ratio was chosen because
it is known that the fluorescence ntensity increases inearly
with the fluorophore concentration, until a certain con-
centration is reached. Starting from this concentration,
the slope of fluorescence intensity versus concentration
becomes smaller and may even change sign,
for
instance
due to an extra transition of excited electrons o the ground
state, without emission of photons (self-quenching13).
Therefore, tests were performed to determine the con-
centration dependence of the fluorescence intensity of
rhodamine-labeled organosilica cores. The ratio TES:
RITC was varied for several organosilica core syntheses.
Visually, fluorescence ntensities have been compared and
the self-quenching point of RITC appeared to be situated
somewhere between the molar ratios TES:RITC =
450: l
and
700:l.
During the synthesis and the growth procedure the
reaction mixture was stable and turbid. The dispersion
was colored pink and the fluorescence was orange. Small
fractions solated at various states
of
the growth procedure
were left to sediment undisturbed, leading to pink
sediments and red transparent supernatants, both with
orange fluorescence. Obviously, the RITC
was
still not
completely incorporated after all the growth steps. Since
it has been concluded that the free dye did not adsorb
onto the particles, only the dye coupled to
APS
ended up
inside the particles. Based on earlier studies it is expected
that such small concentrations of
APS
as used here would
be incorporated almost completely.16 Therefore, the dye
which was still in the supernatant after growing of the
spheres with silica up to their final size, was probably not
chemically bound to
APS.
Consequently, it is likely that
the initial reaction betweenAPS and RITC had not been
I
i
w -
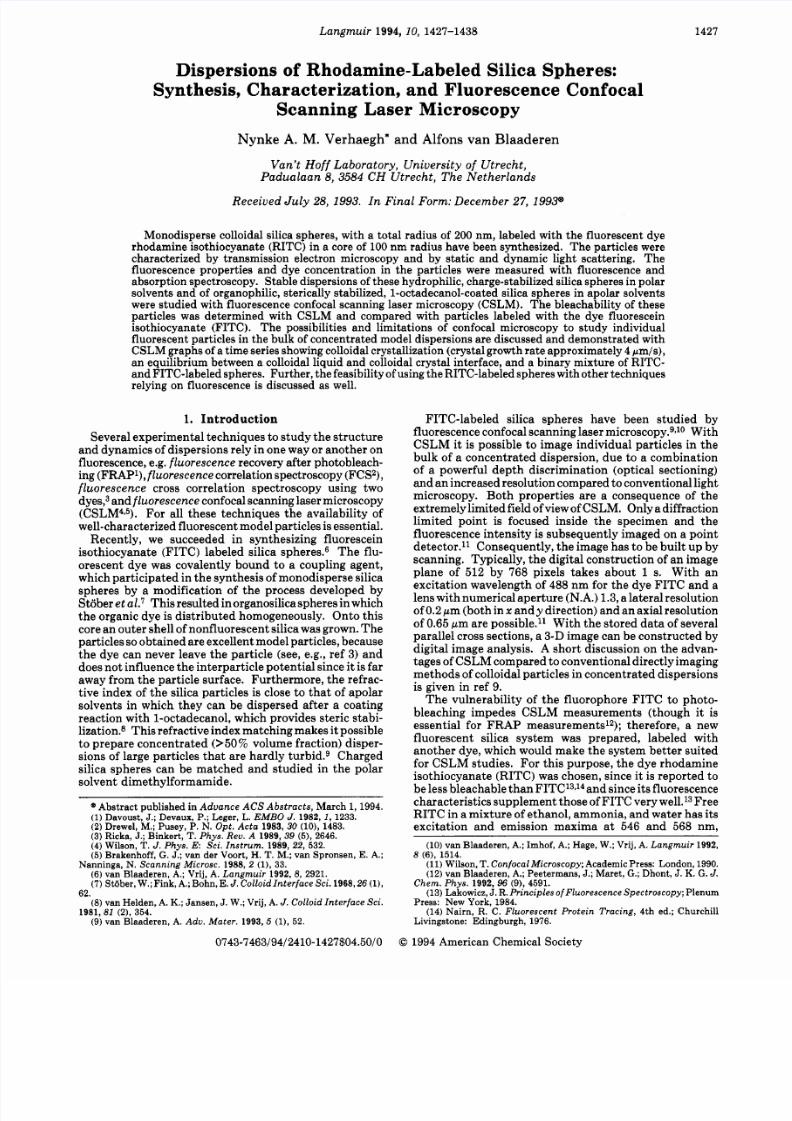
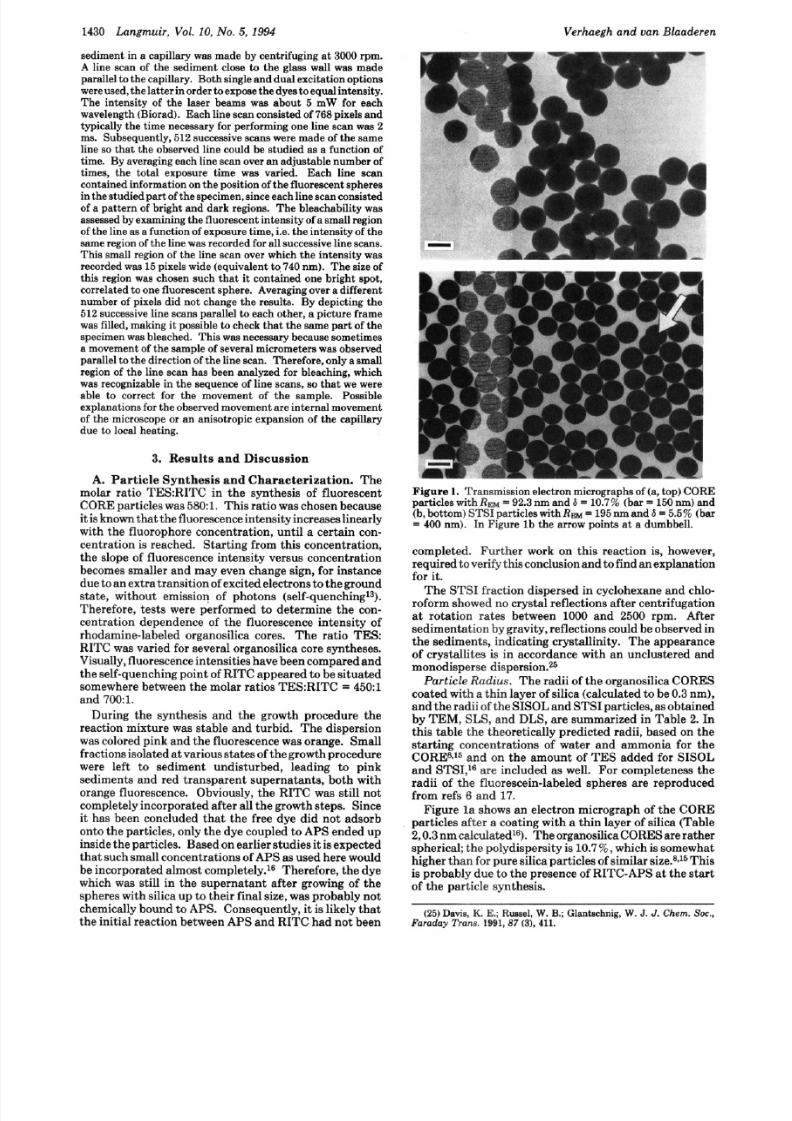
Figure 1 Transmission electron micrograp hs of (a, top)
CORE
particles with REM= 92.3 nm an d
6 =
10.7% (bar
=
150 nm) an d
(b, bottom) ST SI particles with REM 195nm and
6
= 5.5
%
(bar
= 400 nm). In Figure l b the arrow points at a dum bbell.
completed. Further work on this reaction is, however,
required to verify this conclusion and to f ind an explanation
for it.
The STSI fraction dispersed in cyclohexane and chlo-
roform showed no crystal reflections after centrifugation
at rotation rates between
1000
and
2500
rpm. After
sedimentation by gravity, reflections could be observed in
the sediments, indicating crystallinity. The appearance
of crystallites is in accordance with an unclustered and
monodisperse dispersi0n.~5
Particle Radius. The radii of the organosilica CORES
coated with a thin layer of silica (calculated to be 0.3 nm),
and the radii
of
the SISOL and
STSI
particles, as obtained
by TEM, SLS, and DLS, are summarized in Table 2. In
this table the theoretically predicted radii, based on the
starting concentrations of water and ammonia for the
CORE8J5 and on the amount of TE S added for SISOL
and STSI,16 are included as well. For completeness the
radii of the fluorescein-labeled spheres are reproduced
from refs
6
and
17.
Figure l a shows an electron micrograph of the CORE
particles after a coating with a thin layer of silica (Table
2,0.3
nm calculatedl6). The organosilica CORES are rather
spherical; the polydispersity is 10.7
% ,
which is somewhat
higher than for pure silica particles of similar ~ i z e . ~ J ~his
is probably due to the presence of RITC-APS at the start
of the particle synthesis.
25) Davis, K. E.;Russel,W .;
Glantschnig,
W .
J
Chem.
Soc.,
Faraday
Tram
1991 87
(3),
411.
7/25/2019 Verhaegh_vanBlaaderen_Langmuir_1994_Dispersions of Rhodamine-Labeled Silica Spheres Synthesis, Characterizat…
http://slidepdf.com/reader/full/verhaeghvanblaaderenlangmuir1994dispersions-of-rhodamine-labeled-silica 5/12
Dispersions
of
Rhodamine-Labeled Silica Spheres
Table
2.
Particle Radii and Polydispersities 6)
of
Rhodamine-Labeled Silica Spheres CORE, SISOL, and
STSI), As Obtained by Transmission Electron Microscopy
( EM), Static Light Scattering ( s), Dynamic Light
Scattering (RDLs),and Theoretically Calculated
( )'
system
Rth
nm)
RTEM
nm)
6
%
) Rsw
nm)
R D ~
nm)
CORE 101 92.3 10.7 100 100
SISOL 203 188 215 201
STSI 203 195 5.5 207
Core of 4F-s 195 5 210 202
4F-s 492 1.9 490
FSA 7 3) 179 5.5 200 188
are reproduced from refs
6
and 17.
a The data for the fluorescein-labeled pheres 4D, 4F-5,FSA7 3))
In Figure
l b
an electron micrograph of the
STSI
particles
is shown, which contains almost perfectly spherical
particles with smooth surfaces and a narrow size distri-
bution (6
=
5.5
% ).
The sterically stabilized particles have
arranged themselves in almost hexagonal order during
evaporation of the solvent. The arrow points at a dumbbell
particle. Apparently, a small fraction of the CORE
particles grew together during th e growth step due to an
increase in ionic strength after addition of TES.6 The
TEM radii are somewhat smaller than the light scattering
radii. Such a difference has been observed often for this
kind of system. I t is ascribed to shrinkage of the spheres
caused by electron beam damage in t he TEM microscope.8
The optical radius was determined only with static light
scatter ing in ethanol, because the refractive index of the
apolar solvents cyclohexane and chloroform is too close to
that of the particles to measure an interpretable particle
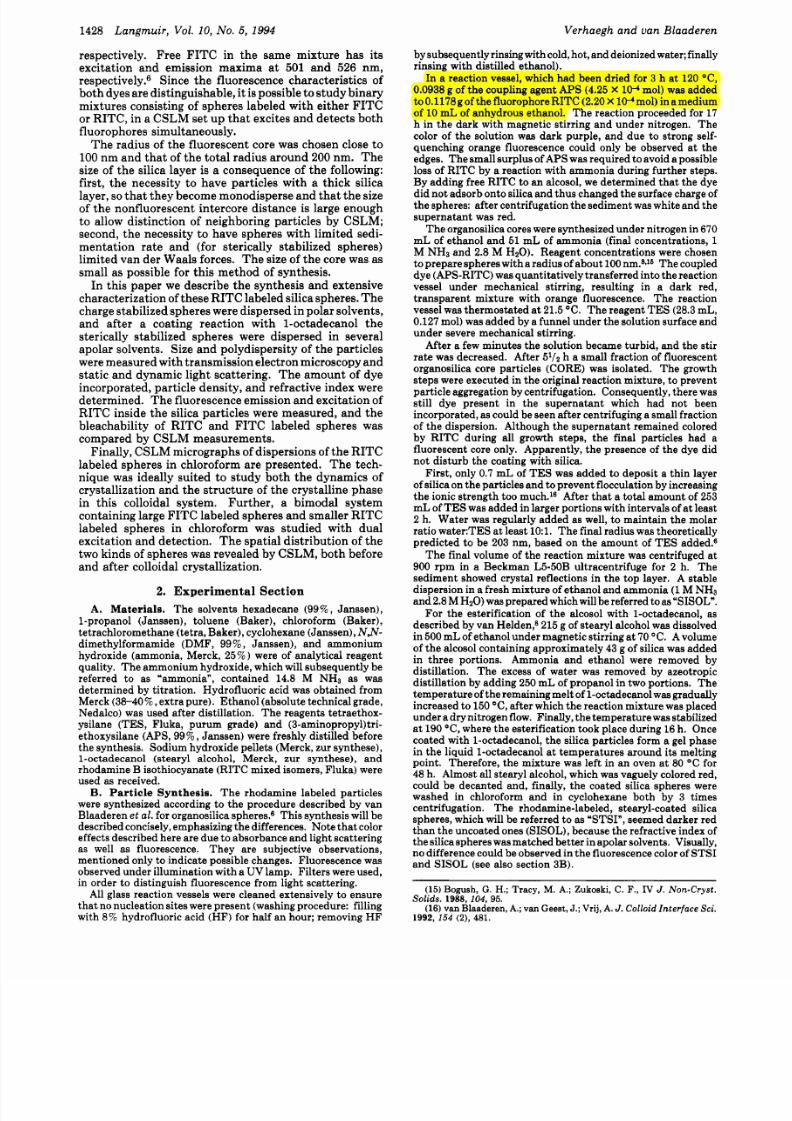
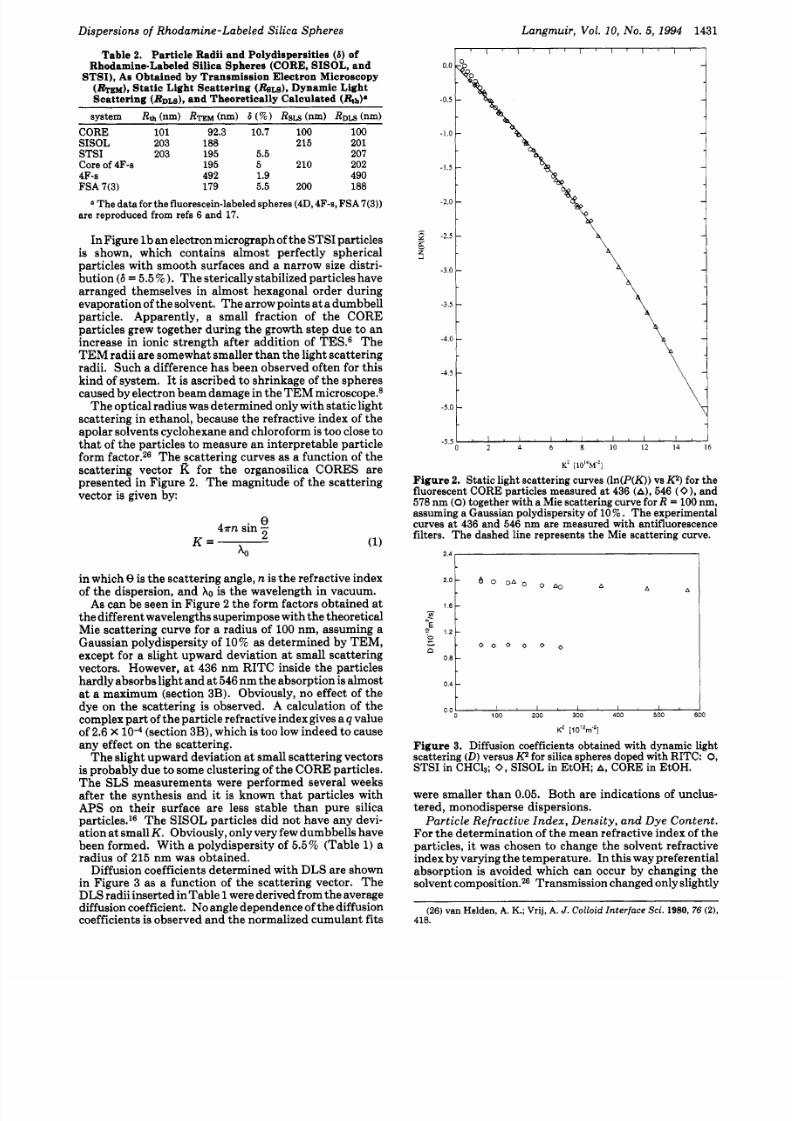
form factor.26 The5cattering curves as a function of the
scattering vector K for the organosilica CORES are
presented in Figure
2.
The magnitude of the scattering
vector is given by:
e
4 ~ n
in -
2
(1)
=
I
in which
8
s the scattering angle,
n
is the refractive index
of the dispersion, and
A0
is the wavelength in vacuum.
As can be seen in Figure 2 the form factors obtained at
the different wavelengths superimpose with the theoretical
Mie scattering curve for a radius of 100 nm, assuming a
Gaussian polydispersity of
10%
as determined by TEM,
except for a slight upward deviation at small scattering
vectors. However, at
436
nm RITC inside the particles
hardly absorbs light and a t
546
nm the absorption is almost
at a maximum (section 3B). Obviously, no effect of the
dye on the scattering is observed.
A
calculation of the
complex part of the particle refractive index gives aq value
of
2.6 X 10⁻⁴
(section
3B) ,
which is too low indeed t o cause
any effect on the scattering.
The slight upward deviation a t small scatter ing vectors
is probably due to some clustering of the CORE particles.
The
SLS
measurements were performed several weeks
after the synthesis and it is known that particles with
APS
on their surface are less stable than pure silica
particles.le The
SISOL
particles did not have any devi-
ation a t small
K .
Obviously, only very few dumbbells have
been formed. With a polydispersity of
5.5%
(Table
1)
a
radius of
215
nm was obtained.
Diffusion coefficients determined with
DLS
are shown
in Figure
3 as
a function of the scattering vector. The
DLS radii inserted in Table 1were derived from the average
diffusion coefficient.
No
angle dependence of the diffusion
coefficients is observed and the normalized cumulant fits
Langmuir,
Vol. 10,
No.
5, 1994 1431
l ' ~ ~ ~ ' ~ ' ~
i
'4
a
-5.0
i
K2 [1014M~2]
Figure
2.
Static light scattering curves ln P K))vs Kz for the
fluorescent CORE particles measured at 436 A), 546
O) ,
and
578 nm 0)ogether with a Mie scattering curve
for
R =
100
nm,
assuming a Gaussian polydispersity
of 10 .
The experimental
curves at 436 and 546 nm are measured with antifluorescence
filters. The dashed line represents the Mie scattering curve.
I
A
1 . 6 c I
: : I , ,
I , , I , , I
1 200
300
400
500 600
K' IO'^^'^]
Figure
3.
Diffusion coefficients obtained with dynamic light
scattering
D)
ersusKz
for
silica spheres doped with RITC:
0,
STSI in CHC13;
0,
ISOL in EtOH; A, CORE in EtOH.
were smaller than 0.05. Both are indications of unclus-
tered, monodisperse dispersions.
Particle Refractive Index, Dens ity, an d
Dye
Content.
For the determination of the mean refractive index of the
particles, i t was chosen to change the solvent refractive
index by varying the temperature. In this way preferential
absorption is avoided which can occur by changing the
solvent composition.26Transmission changed only slightly
(26) van Helden, A. K.; Vrij, A.
J .
Colloid Interface
Sei.
1980, 76 (2) ,
418.
7/25/2019 Verhaegh_vanBlaaderen_Langmuir_1994_Dispersions of Rhodamine-Labeled Silica Spheres Synthesis, Characterizat…
http://slidepdf.com/reader/full/verhaeghvanblaaderenlangmuir1994dispersions-of-rhodamine-labeled-silica 6/12
1432 Langmuir, V ol. 10, No.
5
1994
Verhaegh and van Blaaderen
Table 3.
Excitation and Emission Maxima
of
Free RITC and FITC and Rhodamine- and Fluorescein-Labeled Particles.
system solvent concentration b x c (nm) b m nm)
RITC ethano l/a onia 14.8M)/water 41.7M) 5.4g/L
546 568
SISOL ethano l/a onia
14.8
M)/water
41.7
M) 2.6 X 1P2 ol % 564 580
FITC ethano l/a onia 100:8 (v/v))
10-6
g/L
501 526
2c
ethanol/ammonia
10023
(v/v))
5 X 1 0 3 v o l %
500 519
2c-s cyclohexane
5
x
103vol % 525 535,385
STSI cyclohexane
1.6
X
10-l
vol %
560 575
a Data of free FITC and FITC-labeled spheres are reproduced from ref
6.
1 o
0.8
0 6
0.4
0.2
0.0
300 350
400
450 500 550
600
650
700
750
[nml
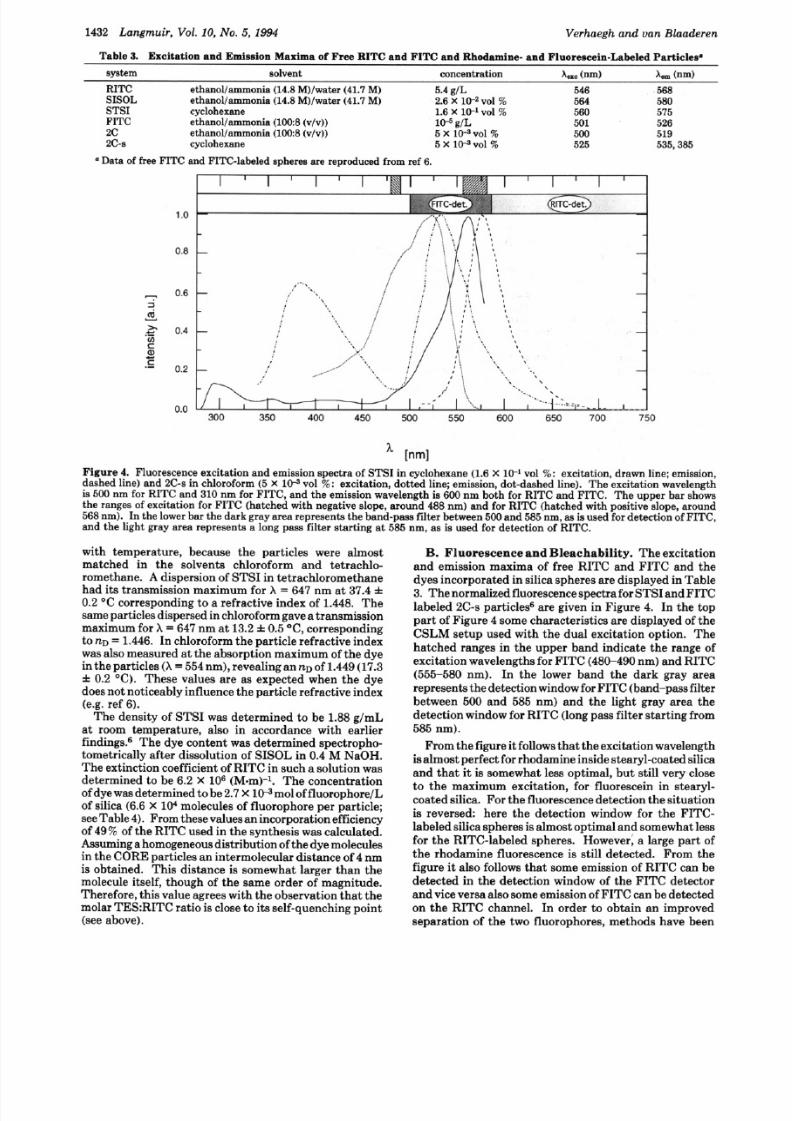
Figure . Fluorescence excitation and emission spectra of STSI in cyclo hexa ne (1.6
X
10-l
vol %: excitation, drawn line; emission,
dashed line) and 2C-s in chloroform
(5 X 10³
vol %: excitation, dotte d line; emission, dot-dashed line). Th e excitation wavelength
is 500 nm for RITC and 310 nm for FITC, and the emission wavelength is 600 nm both for RITC and FITC. Th e upper bar shows
the ranges of excitation for FITC (hatched with negative slope, around 488 nm) an d for RITC (hatched with positive slope, around
568 nm). In the lower bar the da rk gray area represents the ban d-pass filter between 500 and 585 nm, as is used for detection of FITC,
and th e light gray area represents a long pass filter startin g at 585 nm, as is used for detection of RITC.
with temperature, because the particles were almost
matched in the solvents chloroform and tetrachlo-
romethane. A dispersion of
STSI
in tetrachloromethane
had its transmission maximum for
X
= 647 nm a t 37.4
0.2 C corresponding to
a
refractive index of 1.448. The
same particles dispersed in chloroformgave
a
transmission
maximum for
X =
647 nm
at
13.2 .5 C, corresponding
to
TZD=
1.446. In chloroform the particle refractive index
was also measured at the absorption maximum of the dye
in the particles
A
= 554 nm), revealing an
n~
of 1.449 (17.3
0.2 C). These values are as expected when the dye
does not noticeably influence the particle refractive index
(e.g. ref 6).
The density of
STSI
was determined to be
1.88
g/mL
at
room temperature, also in accordance with earlier
findings.6 The dye content was determined spectropho-
tometrically after dissolution of SISOL in 0.4 M NaOH.
The extinction coefficient of RITC in such a solution was
determined to be 6.2
X lo6
(M-m)-l. The concentration
of dye was determined to be 2.7X 10³mol of fluorophore/L
of silica (6.6
X lo
molecules of fluorophore per particle;
see Table 4). From these values an incorporation efficiency
of 49% of the RITC used in the synthesis was calculated.
Assumingahomogeneousdistribution of the dye molecules
in the CORE particles an intermolecular distance of
4
nm
is obtained. This distance is somewhat larger than the
molecule itself, though of the same order of magnitude.
Therefore, this value agrees with the observation that the
molar TES:RITC ratio is close to its self-quenching point
(see above).
B. Fluorescence nd Bleachability.
The excitation
and emission maxima of free RITC and FITC and the
dyes incorporated in silica spheres are displayed in Table
3. Thenormalized fluorescence spectra for STSI and FITC
labeled
2C-s
particles6 are given in Figure 4. In the top
part of Figure 4 some characteristics are displayed of the
CSLM setup used with the dual excitation option. The
hatched ranges in the upper band indicate the range of
excitation wavelengths for FITC (480-490 nm) and RITC
(555-580 nm). In the lower band the dark gray area
represents the detection window for FITC (band-pass filter
between 500 and 585 nm) and the light gray area the
detection window
for
RITC (long pass filter starting from
585 nm).
From the figure i t follows that the excitation wavelength
is almost perfect for rhodamine inside stearyl-coated silica
and tha t i t is somewhat less optimal, but still very close
to the maximum excitation, for fluorescein in stearyl-
coated silica. For the fluorescence detection the situation
is reversed: here the detection window for the FITC-
labeled silica spheres is almost optimal and somewhat less
for the RITC-labeled spheres. However; a large part of
the rhodamine fluorescence is still detected. From the
figure i t also follows that some emission of RITC can be
detected in the detection window of the FITC detector
and vice versa also some emission of FITC can be detected
on the RITC channel. In order to obtain an improved
separation of the two fluorophores, methods have been
7/25/2019 Verhaegh_vanBlaaderen_Langmuir_1994_Dispersions of Rhodamine-Labeled Silica Spheres Synthesis, Characterizat…
http://slidepdf.com/reader/full/verhaeghvanblaaderenlangmuir1994dispersions-of-rhodamine-labeled-silica 7/12
Dispersions of Rhodamine-Labeled Silica Spheres
Langmuir, Vol.
10, No.
5 ,
1994
1433
l . O y I I I I I I I I I I I
t
0.9
0.8
0.7
,-
0.6
?
d
a 0.5
v
C
C
Y
c
0.4
1 200 300 400 500 600
700
exposure time la.u.1
:::I.1
0.0
I
'
I I I I I
1
I
I I I I I I I
0 5 1 15
2000
25 3000 3500 4000
4500
5000
exposure time [a.u.]
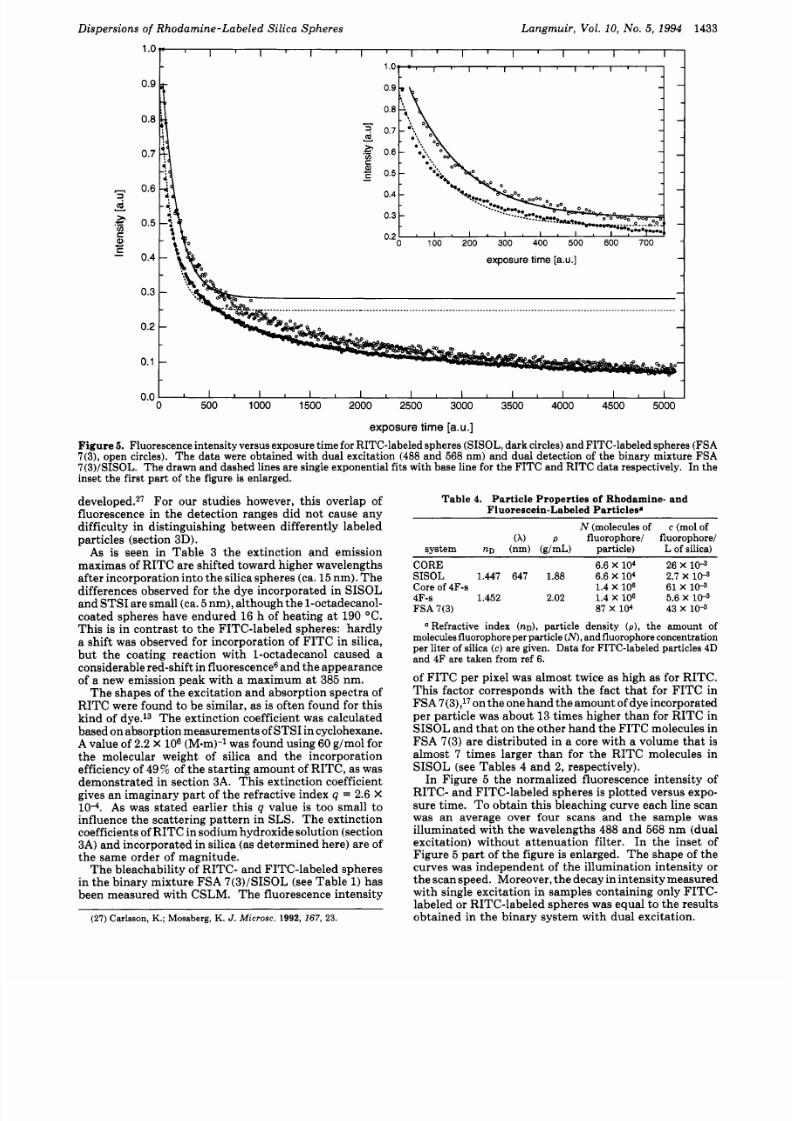
Figure
5.
Fluorescence ntensity versus exposure time
for
RITC-labeled spheres (SISOL, dark circles) and FITC-labeled spheres (FSA
7(3),open circles). The data were obtained with dual excitation
(488
and 568
nm)
and dual detection
of
the binary mixture FSA
7(3)/SISOL. The drawn and dashed lines are single exponential fits
with
base
line
for the FITC and RITC data respectively.
In
the
inset the first part of the figure is enlarged.
developed.27 For our studies however, this overlap of
fluorescence in the detection ranges did not cause any
difficulty in distinguishing between differently labeled
particles (section 3D).
As is seen in Table 3 the extinction and emission
maximas
of
RITC are shifted toward higher wavelengths
after incorporation into the silica spheres (ca. 15 nm). The
differences observed for the dye incorporated in SISOL
and STSIare small (ca.5nm), although the l-octadecanol-
coated spheres have endured 16 h of heating a t 190 C.
This is in contrast to the FITC-labeled spheres: hardly
a shift was observed for incorporation of FITC in silica,
but the coating reaction with 1-octadecanol caused a
considerable red-shift in fluorescence6 nd the appearance
of a new emission peak with a maximum a t 385 nm.
The shapes of the excitation and absorption spectra of
RITC were found to be similar, as is often found for this
kind of dye.13 The extinction coefficient was calculated
based on absorption measurements of STSI in cyclohexane.
A value of 2.2 X
lo6
(Mem1-l was found using 60 g/mol for
the molecular weight of silica and the incorporation
efficiency of 49% of the starting amount of RITC, as was
demonstrated in section 3A. This extinction coefficient
gives an imaginary part of the refractive index
q =
2.6
X
104. As was stated earlier this
q
value is too small to
influence the scattering pattern in
SLS.
The extinction
coefficientsof RITC in sodium hydroxide solution (section
3A) and incorporated in silica (as determined here) are of
the same order of magnitude.
The bleachability of RITC- and FITC-labeled spheres
in the binary mixture FSA 7(3)/SISOL (see Table
1)
has
been measured with CSLM. The fluorescence intensity
~
(27) Carlsson, K.; Mossberg, K. J . Microsc. 1992, 167,
3.
Table
4.
Particle Properties
of Rhodamine- and
Fluorescein-Labeled Particles.
N
(molecules of
A)
p fluorophore/ fluorophorel
c (mol of
system
nD (nm) (g/mL)
Darticle) L
of silica)
CORE 6.6
X
lo4
26
X
103
SISOL
1.447 647
1.88
6.6
X lo
2.7 X 1 0 3
Core
of 4F-s 1.4X lo6 61 X 103
4F-s 1.452 2.02 1.4
X l o6
5.6
X
10-9
FSA
7 3)
87 x 104
43
x 104
a
Refractive
index
n~),
article
density p ) , the amount of
molecules fluorophore per particle
(M,
nd fluorophore
concentration
per liter
of
silica (c) are given. Data for
FITC-labeled
particles 4D
and 4F are taken from
ref
6.
of FITC per pixel was almost twice as high as for RITC.
This factor corresponds with the fact that for FITC in
FSA
7(3),17on he one hand the amount of dye incorporated
per particle was about 13 times higher than for RITC in
SISOL and that on the other hand the FITC molecules in
FSA 7(3) are distributed in a core with a volume that is
almost 7 times larger than for the RITC molecules in
SISOL (see Tables 4 and 2, respectively).
In Figure
5
the normalized fluorescence intensity of
RITC- and FITC-labeled spheres is plotted versus expo-
sure time.
T o
obtain this bleaching curve each line scan
was an average over four scans and the sample was
illuminated with the wavelengths 488 and 568 nm (dual
excitation) without attenuation f ilter. In the inset of
Figure
5
par t of the figure is enlarged. The shape
of
the
curves was independent of the illumination intensity or
the scan speed. Moreover, the decay in intensity measured
with single excitation in samples containing only FITC-
labeled or RITC-labeled spheres was equal to the results
obtained in the binary system with dual excitation.
7/25/2019 Verhaegh_vanBlaaderen_Langmuir_1994_Dispersions of Rhodamine-Labeled Silica Spheres Synthesis, Characterizat…
http://slidepdf.com/reader/full/verhaeghvanblaaderenlangmuir1994dispersions-of-rhodamine-labeled-silica 8/12
1434
Langmuir, Vol.
10,
No. 5,
994
Apparently, the bleachability of both fluorophores is
comparable. Initially, the intensity of RITC seems to
decrease less than for FITC (inset), but it is only a slight
difference.
A t
larger exposure times th e intensities even
coincide. Even after 5000 scans the intensities still
decrease, ndicating that the intensity will finally approach
zero. The decay cannot be fitted by a single exponential.
A
similar bleaching curve of FITC-labeled silica spheres
was recently obtained in a fluorescence recovery after
photobleaching study.28
No
further attempts have been
made to fi t the data, since the actual bleaching mechanism
for the dye inside the silica spheres is not known. The
data seem to indicate a complex bleaching mechanism
and/or a distribution of molecules with different bleach-
abilities.
Based on these bleaching curves, it can be concluded
that RITC-labeled spheres can also be studied with FRAP
in order to determine the long-time self-diffusion coef-
ficient. Preliminary measurements on the FRAP setup
described in ref 12 have indeed corroborated this conclu-
sion.
C. Dispersion Behavior. The STSI particles formed
a stable dispersion in
cyclohexane.
Under gravity these
spheres formed a sediment with a crystalline top layer of
approximately
1
mm. After several months, the colloidal
crystals had not grown larger. This behavior is exactly as
has been reported before for monodisperse hard spheres
with a radius around
200
nm.25
Dispersions of STSI in
chloroform
were also stable.
Colloidal crystals formed spontaneously within minutes,
filling the whole volume a t volume fractions of ap-
proximately
7 % . A t
somewhat lower volume fractions
the growth rate became smaller and the final crystals, which
were also smaller, were in equilibrium with a colloidal liquid
phase.
A t
volume fractions around 0.1
%
the sedimenta-
tion rate was several imes lower than the calculated Stokes
sedimentation rate of individual spheres. Taken together,
these observations clearly indicate a particle charge, which
is remarkable in rather apolar solvents such as ch l~ ro fo rm .~
However, because of the extreme low conductivity of
chloroform (dielectric constant 4.8 electrophoresis mea-
surements on the surface charge were unsuccessful.
In
hexadecane
the dispersions formed a voluminous gel
at room temperature, which transformed into a stable
dispersion at a temperature around
35
C. This transition
was reversible.
In
toluene
the system flocculated immediately. An
increase n temperature did not result in a stable dispersion.
This observation is contrary to what has been found for
smaller 1-octadecanol-coated particles.29 Probably, this
is caused by the van der Waals forces which are stronger
between these larger spheres. After addition of cyclo-
hexane up to a total volume fraction of 50% in toluene,
a stable dispersion was created, which displayed a phase
transition into a concentrated and a dilute phase at
approximately 5
C .
Possibly, the addition of cyclohexane
reduces the van der Waals forces by reducing the refractive
index between the silica and the solvent, to allow again
the temperature-dependent phase separation as observed
bef0re.~9
The binary mixture of small
STSI
and larger 4F-s
spheres in chloroform (4F-s/STSI) formed an orange
dispersion,which phase separated after a week into
a
pink
Verhaegh and van Blaaderen
upper fraction with orange fluorescence and a yellow-
orange lower fraction with yellow-orange fluorescence
separated by a sharp boundary. Based on color and
fluorescence t was concluded th at he homogeneous upper
phase primarily consisted of the smaller rhodamine-labeled
spheres, and the homogeneous lower phase consisted of
both rhodamine- and fluorescein-labeled spheres. This
was later confirmed by CSLM (see below). Although, there
was also sedimentation during the time of observation,
the appearance of the two phases was faster than the
sedimentation of both dispersions in pure form at com-
parable concentrations. Therefore, the observed phe-
nomenon is probably a phase separation in which most of
the smaller RITC particles were expelled out of the phase
of the larger FITC spheres, which formed the lower phase
since it has a higher density. In capillaries filled with this
mixture crystal reflections were observed, first in the lower
fraction and later in the upper fraction, and these were
examined with CSLM.
D. Fluorescence Confocal Scanning Laser Mi-
croscopy
(CSLM). For dispersions in
cyclohexane it
appeared tha t the distance between the fluorescent cores
of neighboring particles was too small to distinguish them
separately in the bulk of the dispersion, both in the glasslike
sediment and in the crystalline top layer. Only in the first
layer of particles t ha t were stuck onto the glass wall of the
capillary was it possible to see touching particles as separate
spheres, if the illuminating beam was positioned in such
a way that no spheres deeper inside the sample were
illuminated (thus, with part of the laser spot focused inside
the glass wall). This clearly indicates that the lateral
resolution is indeed about 200 nm, which is the size of the
nonfluorescent silica layer of two touching particles.
Consequently, the fact th at particles from several layers
were imaged in one plane, due to the lower resolution along
the optical axis, made it hard to distinguish them in the
bulk. The resolution might be improved by exciting the
fluorophore with smaller wavelengths (e.g. 325 nm).
Another possibility is a decrease in volume of the
fluorescent core relative to the total volume of the sphere,
in order to increase the distance between the fluorescent
cores.
Micrographs of the gel of STSI in
hexadecane
were
similar to those shown in refs 9 and 10, but here, as
expected, the distance between the fluorescent CORES
also appeared insufficient to distinguish separate spheres
in th e bulk of the gel phase.
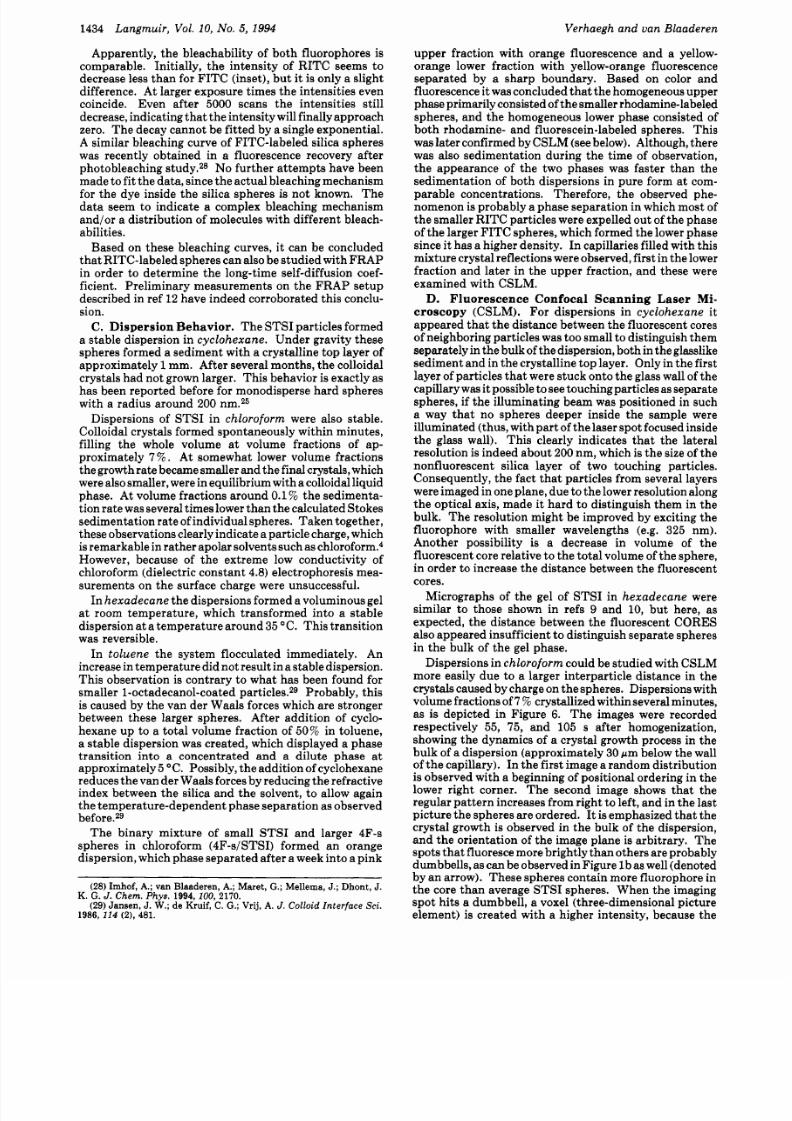
Dispersions in
chloroform
could be studied with CSLM
more easily due to a larger interparticle distance in the
crystals caused by charge on th e spheres. Dispersions with
volume fractions of 7
?
crystallized within several minutes,
as is depicted in Figure
6.
The images were recorded
respectively 55, 75, and 105
s
after homogenization,
showing the dynamics of a crystal growth process in the
bulk of a dispersion (approximately 30 pm below the wall
of the capillary). In the first image a random distribution
is observed with a beginning of positional ordering in the
lower right corner. The second image shows that the
regular pattern increases from right to left, and in the last
picture the spheres are ordered. It is emphasized th at the
crystal growth is observed in the bulk of the dispersion,
and the orientation of the image plane is arbitrary. The
spots tha t fluorescemore brightly than others are probably
dumbbells, as can be observed in Figure l bas well (denoted
by an arrow). These spheres contain more fluorophore in
the core than average STSI spheres. When the imaging
spot hits a dumbbell, a voxel ( three-dimensional picture
element) is created with a higher intensity, because the
(28) Imhof, A.;
van
Blaaderen, A.; Maret , G.; Mellema, J.;
Dhont,
J.
(29)
Jansen, J. W.; de K ruif, C.
G.;
Vrij,
A.
J.Colloid
Interface
Sci.
K. G.
J.
C h e n . Phys. 1994,100, 2170.
1986, 114
(2) , 481.
7/25/2019 Verhaegh_vanBlaaderen_Langmuir_1994_Dispersions of Rhodamine-Labeled Silica Spheres Synthesis, Characterizat…
http://slidepdf.com/reader/full/verhaeghvanblaaderenlangmuir1994dispersions-of-rhodamine-labeled-silica 9/12
Dispersions of Rhodamine-Labeled Silica Spheres
Langmuir, Vol. 10 No. 5 1994
1435
Figure
6.
CSLM pictures of a homogeneous crystallization in a 7 vol
%
dispersion of STSI in chloroform. Parts a top left), b (top
right), and c bottom left) were recorded respectively 55,75, and 105 s after homogenization bar = 25 pm). This imagewas recorded
at approximately 30 pm below the glass wall
of
the capillary.
number of fluorophores excited is at most twice as large
as in a single sphere. In the ordered phase of Figure
6,
parts a and b, the same configuration of bright and dark
spots can be recognized, indicating that the same cross
section is observed in the three pictures and th at systematic
movements of the cuvette
or
dispersion on a micrometer
scale were absent. Some point defects in the crystal lattice
can also be recognized in the three images. The two large
dark spots in the middle and in the middle lower part of
the micrograph are probably dust particles. These first
measurements clearly show that it is possible to follow
crystallizationdynamics with CSLM. An estimate can be
made for the crystal growth rate
(v)
in this system by
determining the velocity of the crystal/liquid interface in
parts a and b of Figure
6.
This growth rate of a crystal
plane is about
4
pm/s: this value cannot be given with
more accuracy, because the moving boundary shown in
Figure
6
is a projection of a growing crystal plane with
unknown orientation with respect to the imaging plane.
This crystal growth rate can be compared to the theoreti-
cally predicted interface velocity of a molecular system,
which was first proposed by Wilson30 and FrenkePl
Here
uo
s related to kinetic behavior at he crystal surface,
and the term between parentheses is a statistical sticking
factor determined by
( A p / k g T ) ,
in which
Ap
is the
difference in chemical potential between liquid and
crystalline state and
~ B T
s the thermal energy. Since
A p
has an unknown value, and the volume fraction of the
dispersion shown in Figure
6
was chosen because it had
(30) Wilson,
H
A Philos.
Mag.
1900 50 238.
(31) Frenkel, J.
P h y s .
2.
S o w j e t u n i o n
1932, I 498.
the highest crystallization growth rate, the observed rate
is compared with the maximum value as given by eq 2.
Aastuen et aZ.32who also used eq
2
for a colloidal system
proposed to equate 00 to the mean velocity of a Brownian
particle over the mean interparticle distance
40,
o =
(3)
hereDO s the free Stokes diffusion coefficient for a single
particle (hydrodynamic interactions are less important
for charged systems). For the
STSI
system in chloroform
DO s equal to 2.0 X 1Wl2 m2/s (see Figure 3), and the
minimum
{
is assumed to be approximately
850
nm, i.e.
the distance between two spheres in chloroform,
as
will be
discussed later. Therefore, the maximum rate of crystal
growth is predicted to be 10 pm/s, which is of the same
order of magnitude as the observed growth rate. It seems
therefore, th at the dynamics of colloidal crystal growth in
these charged systems are reasonably described by eq
3.
Another point of interest is the coexistence of a
disordered and an ordered phase in the bulk of the
STSI
dispersion in chloroform (approximately
30
pm below the
wall of the capillary) at a somewhat ower volume fraction,
as shown in Figure 7.
It
is emphasized that the studied
dispersion had reached the equilibrium stage, because this
configuration remained stable longer than several hours.
In parts a and b of Figure
7
the same optical sectioning
is displayed, but integrated over respectively two and ten
scans. In the two figures a regular pattern can be seen,
both on the right side and in the upper left corner. These
patterns come from different crystal planes: on the right
side a hexagonal closest packing is recognized. Between
the two crystals a disordered structure is found, which
becomes vague if integrated over a longer period of time.
7/25/2019 Verhaegh_vanBlaaderen_Langmuir_1994_Dispersions of Rhodamine-Labeled Silica Spheres Synthesis, Characterizat…
http://slidepdf.com/reader/full/verhaeghvanblaaderenlangmuir1994dispersions-of-rhodamine-labeled-silica 10/12
1436
Langmuir, Vol. 10, No. 5
1994
Verhaegh and van Blaaderen
analogous to hard spheres which crystallize already at
volume fractions lower than
74%. A
hard sphere system
starts to crystallize at a volume fraction of
49%
and is
fully crystalline a t volume fractions of
55
%
(Kirkwood-
Alder tran~ition~~).nly at
4
= 74%
the spheres are
actually touching each other. Assuming a closest packed
crystal structure for the colloidal crystals in chloroform
(e.g. face centred cubic: fcc) and using a sphere radius
( r )
of 215 nm, the volume fraction 4 of the crystal phase is
calculated as:
4 = (4d
~ / 3 ) 4 r / a ) ~ .
ith an interparticle
distance
(a)
of
846
nm, a volume fraction
4
of
9.7%
is
obtained. This smaller volume fraction compared to
55
%
for hard sphere systems is a clear indication of a charged
system. An explanation for the difference between the
calculated value and the originally prepared volume
fraction of
7 %
might be the fact that not all the particles
have crystallized, analogous o the difference between the
crystallization point at
49
vol
%
and the melting point at
55
vol
%
for hard spheres. Scaling these hard sphere
crystallization and melting volume fractions respectively
to these soft sphere volume fractions can only account for
an increase in volume fraction of approximately 1 .
However, it has been observed before that the liquid-
crystalline coexistence region for soft spheres is larger than
expected from this mapping.28 A t present it is attempted
to obtain the crystallization and melting concentrations
for the STSI dispersion in chloroform more accurately.
Furthermore, light scatter ing data on the colloidal crystal
structure are compared to results obtained with CSLM.
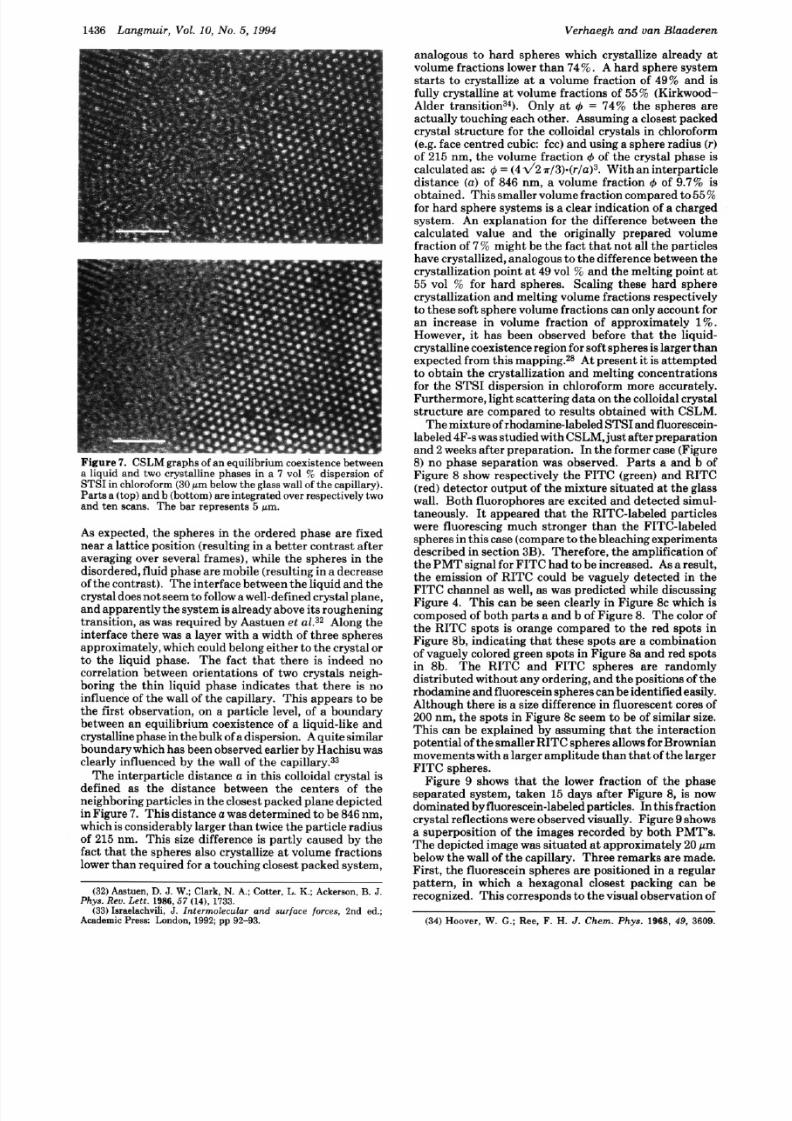
The mixture of rhodamine-labeled STSI and fluorescein-
labeled
4F-s
was studied with CSLM, ust after preparation
and
2
weeks after preparation. In the former case (Figure
8)
no phase separation was observed. Par ts a and b of
Figure
8
show respectively the FITC (green) and RITC
(red) detector output of the mixture situated at the glass
wall. Both fluorophores
are
excited and detected simul-
taneously. I t appeared that the RITC-labeled particles
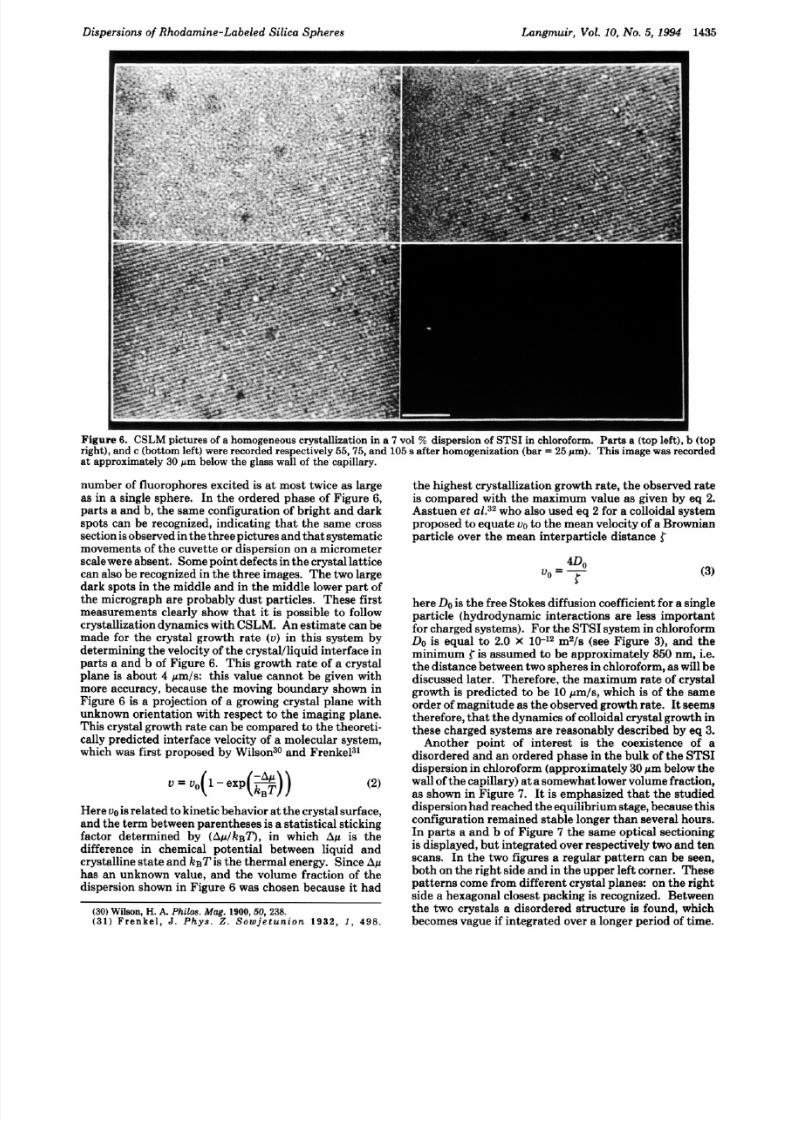
Figure 7. CSLM
graphs
of
an equilibrium coexistence between
a liquid and two crystalline phases in a 7 vol
%
dispersion of
STSI in chloroform
(30
pm below the glass wall ofthe capillary).
Parts
a top) and b bottom)are integrated over respectively two
and ten scans. The bar represents
5
pm.
As expected, the spheres in the ordered phase are fixed
near a lattice position (resulting in a better contrast after
averaging over several frames), while the spheres in the
disordered, fluid phase are mobile (resulting in a decrease
of the contrast). The interface between the liquid and the
crystal does not seem to follow a well-defined crystal plane,
and apparently he system is already above its roughening
transition, as was required by Aastuen
et ~ 1 ~ ~
long the
interface there was a layer with a width of three spheres
approximately,which could belong either to the crystal or
to the liquid phase. The fact tha t there is indeed no
correlation between orientations of two crystals neigh-
boring the thin liquid phase indicates that there is no
influence of the wall of the capillary. This appears to be
the f irst observation, on a particle level, of a boundary
between an equilibrium coexistence of a liquid-like and
crystalline phase in the bulk of a dispersion. A quite similar
boundary which has been observed earlier by Hachisu was
clearly influenced by the wall of the capillary.33
The interparticle distance
a
in this colloidal crystal is
defined as the distance between the centers of the
neighboring particles in the closest packed plane depicted
in Figure
7.
This distance
a
was determined to be
846
nm,
which is considerably larger than twice the particle radius
of
215
nm. This size difference is partly caused by the
fact that the spheres also crystallize at volume fractions
lower than required for a touching closest packed system,
were fluorescing much stronger than the FITC-labeled
spheres in this case (compare o the bleaching experiments
described in section
3B).
Therefore, the amplification of
the PMT signal for FITC had to be increased.
As
a result,
the emission of RITC could be vaguely detected in the
FITC channel as well, as was predicted while discussing
Figure
4.
This can be seen clearly in Figure
8c
which is
composed of both parts a and b of Figure
8.
The color of
the RITC spots is orange compared to the red spots in
Figure 8b, indicating that these spots are a combination
of vaguely colored green spots in Figure 8a and red spots
in 8b. The RITC and FITC spheres are randomly
distributed without any ordering, and the positions of the
rhodamine and fluorescein spheres can be identified easily.
Although there is a size difference in fluorescent cores of
200 nm, the spots in Figure 8c seem to be of similar size.
This can be explained by assuming that the interaction
potential of the smaller RITC spheres allows for Brownian
movements with a larger amplitude than that of the larger
FITC spheres.
Figure 9 shows that the lower fraction of the phase
separated system, taken
15
days after Figure
8,
is now
dominated by fluorescein-labeledparticles. In this fraction
crystal reflections were observed visually. Figure
9
shows
a superposition of the images recorded by both PMT's.
The depicted image was situated a t approximately
20
pm
below the wall of the capillary. Three remarks are made.
First, the fluorescein spheres are positioned in a regular
. I. - -
733) Israelachvili,
J. Intermolecular and surface forces,
2nd ed.;
Academic Press: London, 1992;
pp
92-93.
34)
Hoover, W. G.; Ree,
F.
H.
J . Chem. Phys .
1968,
49,
3609.
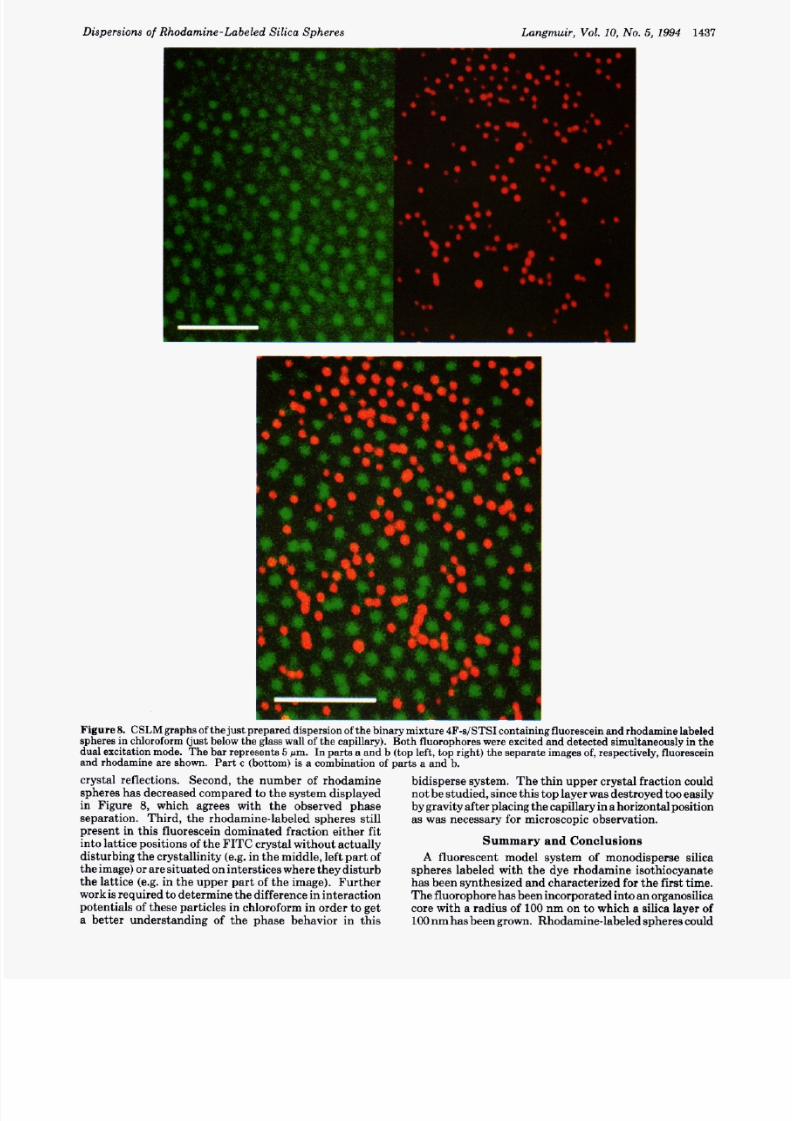
7/25/2019 Verhaegh_vanBlaaderen_Langmuir_1994_Dispersions of Rhodamine-Labeled Silica Spheres Synthesis, Characterizat…
http://slidepdf.com/reader/full/verhaeghvanblaaderenlangmuir1994dispersions-of-rhodamine-labeled-silica 11/12
Dispersions of Rhodamine-Labeled Silica Spheres
Langmuir, Vol. 10 No.
5,
1994
1437
Figure 8. CSLM graphs of the just prepared dispersion of the binary mixture 4F-s/STSIcontaining fluoresceinand rhodamine labeled
spher es in chloroform (just below the glass wall of the capillary). Both fluorophores were excited and detected sim ultaneously in the
dual excitation mode. Th e bar represents
5
m. In parts a and b (to p left, top right) the separate images of, respectively, fluorescein
and rhodamine are shown. Pa rt c (bottom ) is a combination of parts a an d b.
crystal reflections. Second, the number of rhodamine
spheres has decreased compared to the system displayed
in Figure
8,
which agrees with the observed phase
separation.
Third, the rhodamine-labeled spheres still
present in this fluorescein dominated fraction either fit
into lattice positions of the FITC crystal without actually
disturbing the crystallinity (e.g. in the middle, left part of
the image) or are situated on interstices where they disturb
the lattice (e.g. in the upper par t
of
the image). Further
work is required to determine the difference in interaction
potentials of these particles in chloroform in order to get
a better understanding of the phase behavior in this
bidisperse system. The thin upper crystal fraction could
not be studied, since this top layer was destroyed too easily
by gravity after placing the capillary n a horizontal position
as was necessary for microscopic observation.
Summary and Conclusions
A
fluorescent model system of monodisperse silica
spheres labeled with the dye rhodamine isothiocyanate
has been synthesized and characterized for the first time.
The fluorophore has been incorporated into an organosilica
core with a radius of
100
nm on to which a silica layer of
100
nm has been grown. Rhodamine-labeled spheres could
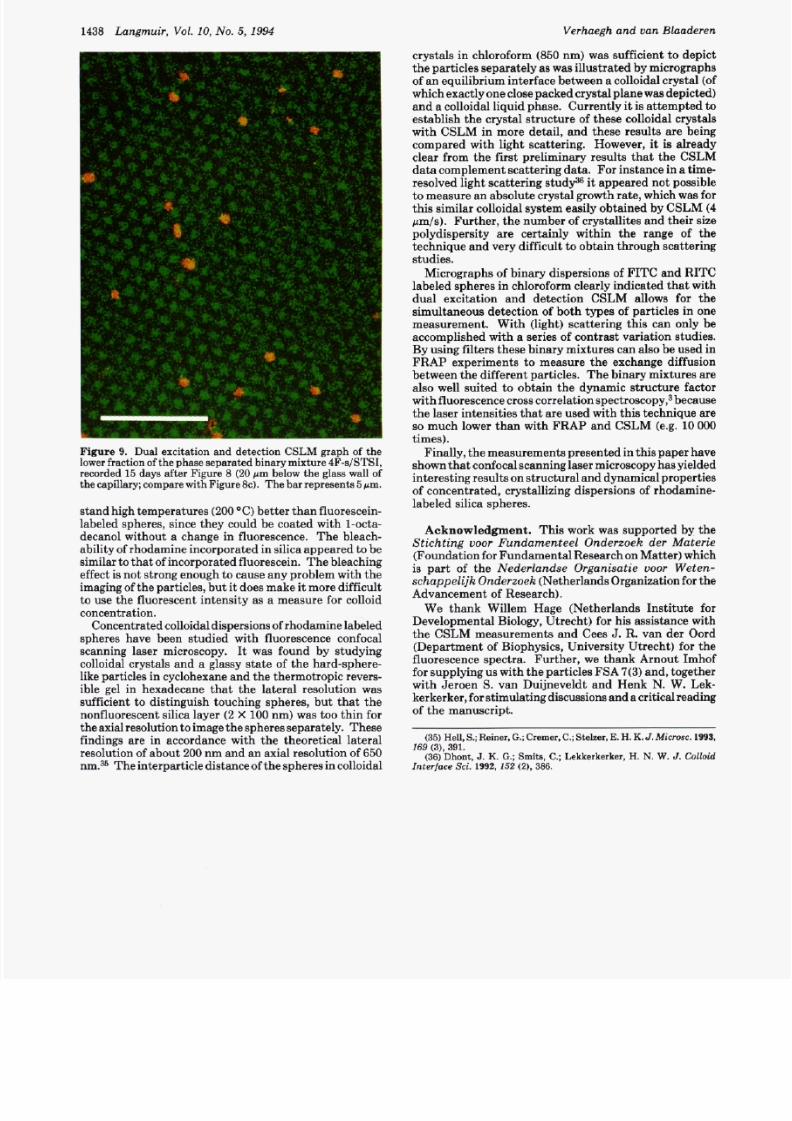
7/25/2019 Verhaegh_vanBlaaderen_Langmuir_1994_Dispersions of Rhodamine-Labeled Silica Spheres Synthesis, Characterizat…
http://slidepdf.com/reader/full/verhaeghvanblaaderenlangmuir1994dispersions-of-rhodamine-labeled-silica 12/12
1438 Langmuir, VoZ.10,
No.
5,1994 Verhaegh and van Blaaderen
:
Figure 9. Dual excitation and detection CSLM graph
of
the
lower fraction of the phase separated binary mixture 4F-s/STSIY
recorded 15 days after Figure 8 20 pm below the glass wall of
the capillary;compare with Figure Bc). The bar represents
5
pm.
stand high temperatures
(200 C)
etter than fluorescein-
labeled spheres, since they could be coated with l-octa-
decanol without a change in fluorescence. The bleach-
ability of rhodamine incorporated in silica appeared to be
similar to that of incorporated fluorescein. The bleaching
effect is not strong enough to cause any problem with the
imaging of the particles, bu t i t does make it more difficult
to use the fluorescent intensity as a measure for colloid
concentration.
Concentrated colloidal dispersions of rhodamine labeled
spheres have been studied with fluorescence confocal
scanning laser microscopy.
It
was found by studying
colloidal crystals and a glassy state of the hard-sphere-
like particles in cyclohexane and the thermotropic revers-
ible gel in hexadecane that the lateral resolution was
sufficient to distinguish touching spheres, but that the
nonfluorescent silica layer
2 X
100 nm) was too thin for
the axial resolution to image the spheres separately. These
findings are in accordance with the theoretical lateral
resolution of about
200
nm and an axial resolution of 650
nm.35 The interparticle distance of the spheres in colloidal
crystals in chloroform
(850
nm) was sufficient to depict
the particles separately as was illustrated by micrographs
of
an
equilibrium interface between a colloidal crystal (of
which exactly one close packed crystal plane was depicted)
and a colloidal liquid phase. Currently i t is attempted to
establish the crystal structure of these colloidal crystals
with CSLM in more detail, and these results are being
compared with light scattering. However, it is already
clear from the first preliminary results that the CSLM
data complement scattering data. For instance in a time-
resolved light scattering study36 i t appeared not possible
to measure an absolute crystal growth rate, which was for
this similar colloidal system easily obtained by CSLM
4
pm/s). Further , the number of crystallites and their size
polydispersity are certainly within the range of the
technique and very difficult to obtain through scattering
studies.
Micrographs of binary dispersions of FITC and RITC
labeled spheres in chloroform clearly indicated that with
dual excitation and detection CSLM allows for the
simultaneous detection of both types
of
particles in one
measurement. With (light) scattering thi s can only be
accomplished with a series of contrast variation studies.
By using filters these binary mixtures can also be used in
FRAP experiments to measure the exchange diffusion
between the different particles. The binary mixtures are
also well suited to obtain the dynamic structure factor
with fluorescence cross correlation sp e~tr osco py ,~ecause
the laser intensities th at are used with this technique are
so
much lower than with FRAP and CSLM (e.g.
10000
times).
Finally, the measurements presented in this paper have
shown that confocal scanning laser microscopy has yielded
interesting results on structural and dynamical properties
of concentrated, crystallizing dispersions of rhodamine-
labeled silica spheres.
Acknowledgment.
This work was supported by the
Stichting uoor Fundamenteel Onderzoek der Materie
(Foundation for Fundamental Research on Matter) which
is part of the
Nederlandse Organisatie uoor Weten-
schappelijk Onderzoek
(Netherlands Organization for the
Advancement of Research).
We thank Willem Hage (Netherlands Institute for
Developmental Biology, Utrecht) for his assistance with
the CSLM measurements and Cees
J.
R. van der Oord
(Department of Biophysics, University Utrecht) for the
fluorescence spectra. Further , we thank Arnout Imhof
for supplying us with the particles FSA 7(3) and, together
with Jeroen
S.
van Duijneveldt and Henk N. W. Lek-
kerkerker, for stimulating discussionsand a critical reading
of the manuscript.
(35)Hell,S.;Reiner,
G.;
Cremer, C.;Stelzer,
E. H. K.
J.
Microsc. 1993,
(36)Dhont, J.
K.G.;
Smits,
C.;
Lekkerkerker,
H. N.
W. J.Colloid
169
3),
391.
Interface Sci. 1992,152 21,
386.
Related Documents