Chemical Physics 107 (1986) 175-184 North-Holland, Amsterdam ABSORPTION BEHAVIOUR OF METHANOLIC RHODAMINE 6G SOLUTIONS AT HIGH CONCENTRATION Y. LU 1 and A. PENZKOFER Naturwissenschaftliche Fakultät II - Physik, Universität Regensburg, 8400 Regensburg, FRG Received 7 March 1986 The optical constants of rhodamine 6G dissolved in methanol and of a solid rhodamine 6G film are determined. The concentration of the solutions is varied between 10 _ 5 and 0.66 mol/Y. Deviations from Beer's law at high concentrations are found. They are thought to be due to the mutual interaction of neighbouring molecules. The absorption behaviour of rhodamine 6G in methanol is compared with the absorption behaviour of rhodamine 6G in water. 1. Introduction In solutions of low concentration dyes dissolve practically completely into monomers. The ab- sorption spectra are determined by the intrinsic absorption of the dye molecules and the dye-solvent interaction. Dye-dye (solute-solute) interaction is negligible because of the large aver- age distance between the dye molecules. The ab- sorption spectra obey the Beer-Lambert law, i.e. the absorption cross sections are independent of concentration. With increasing dye concentration dimers or higher aggregates are formed [1-10]. The absorption spectra contain contributions from the monomers and the aggregates and the absorp- tion cross sections become concentration depen- dent, i.e. deviations from the Beer-Lambert law occur. The strength of dimer (and higher aggre- gate) formation and the solubility are strongly dependent on the solute-solvent combination and on the temperature. For highly soluble dye solu- tions the dye-dye interaction gains importance at high concentrations since the mean distance be- tween the dye molecules becomes small. The dye-dye interaction of neighbouring dye mole- cules contributes to the deviation of the absorp- 1 On leave from Institute of Optics and fine Mechanics, Academia Sinica, Shanghai, Peoples Republic of China. tion spectra from Beer's law at high concentra- tions [1,11-13]. In this paper the concentration dependence of the absorption and refractive index spectra of rhodamine 6G chlorid dissolved in methanol is studied. The dye concentration is varied between 10" 5 and 0.66 mol /*f (solubility limit). Deviations from Beer's law are observed for concentrations C > 0.1 mol/Y. These deviations are thought to be caused mainly by the mutual interaction of statis- tically near neighbouring molecules (closely spaced pairs) [1,11,12]. The absorption spectrum of the mutually interacting rhodamine 6G molecules in methanol is resolved and compared with the dimer spectrum of rhodamine 6G in water. In water deviations from Beer's law are observed already at concentrations as low as 10" 5 mol/Y indicating a strong dimerization tendency. Additionally, the optical spectra of a solid rhodamine 6G film are compared with the solution spectra. 2. Experimental Solutions of rhodamine 6G in methanol are investigated at room temperature (22° C) in the concentration range from 10" 5 mol/*? to 0.66 mol/V (solubility limit). Up to absorption coeffi- cients of a < 4000 c m - 1 transmission measure- ments in cells of known thickness (/ ^ 10 p,m) are 0301-0104/86/$03.50 © Elsevier Science Publishers B.V. (North-Holland Physics Publishing Division)

Welcome message from author
This document is posted to help you gain knowledge. Please leave a comment to let me know what you think about it! Share it to your friends and learn new things together.
Transcript

Chemical Physics 107 (1986) 175-184 North-Holland, Amsterdam
ABSORPTION BEHAVIOUR OF METHANOLIC RHODAMINE 6G SOLUTIONS AT HIGH CONCENTRATION
Y . L U 1 and A . P E N Z K O F E R
Naturwissenschaftliche Fakultät II - Physik, Universität Regensburg, 8400 Regensburg, FRG
Received 7 March 1986
The optical constants of rhodamine 6G dissolved in methanol and of a solid rhodamine 6G film are determined. The concentration of the solutions is varied between 10 _ 5 and 0.66 mol/Y. Deviations from Beer's law at high concentrations are found. They are thought to be due to the mutual interaction of neighbouring molecules. The absorption behaviour of rhodamine 6G in methanol is compared with the absorption behaviour of rhodamine 6G in water.
1. Introduction
In solutions of low concentration dyes dissolve practically completely into monomers. The absorption spectra are determined by the intrinsic absorption of the dye molecules and the dye-solvent interaction. Dye-dye (solute-solute) interaction is negligible because of the large average distance between the dye molecules. The absorption spectra obey the Beer-Lambert law, i.e. the absorption cross sections are independent of concentration. With increasing dye concentration dimers or higher aggregates are formed [1-10]. The absorption spectra contain contributions from the monomers and the aggregates and the absorption cross sections become concentration dependent, i.e. deviations from the Beer-Lambert law occur. The strength of dimer (and higher aggregate) formation and the solubility are strongly dependent on the solute-solvent combination and on the temperature. For highly soluble dye solutions the dye-dye interaction gains importance at high concentrations since the mean distance between the dye molecules becomes small. The dye-dye interaction of neighbouring dye molecules contributes to the deviation of the absorp-
1 On leave from Institute of Optics and fine Mechanics, Academia Sinica, Shanghai, Peoples Republic of China.
tion spectra from Beer's law at high concentrations [1,11-13].
In this paper the concentration dependence of the absorption and refractive index spectra of rhodamine 6 G chlorid dissolved in methanol is studied. The dye concentration is varied between 10" 5 and 0.66 mol / * f (solubility limit). Deviations from Beer's law are observed for concentrations C > 0.1 mol /Y. These deviations are thought to be caused mainly by the mutual interaction of statistically near neighbouring molecules (closely spaced pairs) [1,11,12]. The absorption spectrum of the mutually interacting rhodamine 6 G molecules in methanol is resolved and compared with the dimer spectrum of rhodamine 6 G in water. In water deviations from Beer's law are observed already at concentrations as low as 10" 5 mo l /Y indicating a strong dimerization tendency. Additionally, the optical spectra of a solid rhodamine 6 G film are compared with the solution spectra.
2. Experimental
Solutions of rhodamine 6 G in methanol are investigated at room temperature (22° C) in the concentration range from 10" 5 mol/*? to 0.66 mo l /V (solubility limit). U p to absorption coefficients of a < 4000 c m - 1 transmission measurements in cells of known thickness (/ ^ 10 p,m) are
0301-0104/86/$03.50 © Elsevier Science Publishers B.V. (North-Holland Physics Publishing Division)

carried out with a spectrophotometer. In the range 4000 c m - 1 < a < 10000 c m - 1 the absorption cross sections are determined by spectrophotometer measurements with a thin cell of variable thickness. The cell thickness is determined by transmission measurements in spectral regions of known absorption cross section. Absorption coefficients a > 10000 c m - 1 are determined by measuring the reflectivity of parallel polarized light at the Brewster angle [14]. From these reflectivity measurements both optical constants, n (refractive index) and k (extinction coefficient), are determined (complex refractive index n' = n-ik). The absorption coefficient a (unit: c m - 1 ) is related to the extinction coefficient k by a = 4ir£/c (v wave number in c m - 1 ) . The absorption cross section o (unit: cm 2) is derived from a by a = 1000a/7VAC, where NA = 6.022045 X 10 2 3 mol 1 is Avogadro's number and C is the dye concentration (unit: m o l / / ) . The often used molar decadic absorption coefficient c (unit: / m o l - 1 c m - 1 ) is related to the absorption cross section a by € = a7VA/(1000 In 10). The optical constants of a solid rhodamine 6 G film were also determined by the reflection technique [14,15]. The film was prepared on a 90° prism (methanolic rhodamine 6 G solution was poured on the hypotenuse and the solvent evaporated).
450 500
WAVELENGTH X Inm]
Fig. 1. Parallel reflectivity at Brewster angle RU(4>B) for a solid rhodamine 6G film on a BK7 glass prism and for various rhodamine 6G-methanol solutions.
3. Results
The measured minimum parallel reflectivities Ru(4>B) and the corresponding Brewster angles <£B
are shown in figs. 1 and 2, respectively, for solid rhodamine 6 G and various rhodamine 6G-metha-nol solutions. From the Ru(<j>B) data the optical constants k and n are calculated [14] and the results are shown in figs. 3 and 4. The extinction coefficients for k < 0.04 have been determined by transmission measurements. From the extinction coefficients k the absorption cross sections a have been calculated. The resulting absorption spectra are shown in fig. 5 for 10~ 5 , 0.2, 0.4 and 0.66 m o l / / . The depicted S0-Sl absorption band clearly changes with concentration. Two isobestic points at X = 542.5 and 507.5 nm are formed indicating a concentration dependent equilibrium
between two species. The absorption spectra at various concentrations (10 ~ 5 m o l / / < C < 0.66 m o l / / ) have been measured in the wavelength region between 220 and 700 nm (spectra of the extended region are not shown here, see for example ref. [16]). For A < 380 nm the absorption cross sections were found to be independent of concentration within the experimental accuracy. This fact indicates that the higher singlet state absorption bands (S 0 ->S W , n>2) are not influenced measurably by the solute-solute interaction.
For rhodamine 6 G in methanol there is practically no change in the absorption spectra observable up to concentrations of 0.1 m o l / / . A t this concentration the mean distance d between two
rhodamine 6 G molecules is only d = (NAC)~l/3> = 2.55 nm and the solute-solute interaction is

450 500 550 WAVELENGTH X (nmj
Fig. 2. Brewster angle <J>B versus wavelength. Dotted curve, solid rhodamine 6G film on a BK7 glass prism. Dashed curve, methanol. Solid curves, rhodamine 6G in methanol with the concentrations 0.66 mol/<f (1), 0.4 mol/<f (2), 0.2 mo\/tf (3), and 0.14 m o l / / (4).
thought to become important. The absence of absorption changes up to 0.1 mol /V indicates the weak tendency of dimer formation in rhodamine 6G-methanol solutions (dimer binding energy small compared to thermal energy). The situation is completely different for rhodamine 6 G dissolved in water. In fig. 6a absorption spectra of this solution are shown for 7.9 X 10" 7 , 7.9 X 10~ 5 , 1.48 X 10" 5 and 7.41 X 10~ 4 mol/<f (data taken from ref. [8]). Absorption changes are already observed at concentrations as low as 10 ~ 5 mo l /Y . The results indicate the strong tendency of dimer formation (dimer binding energy UB large compared to thermal energy kT [17]).
1.0
0.8
0.6
n—i—i—i—i—i—i—i—i—i—i I i i r
A ,
solid
C=0.66mol/dm3
450 500 WAVELENGTH X Inml
Fig. 3. Extinction coefficient k versus wavelength for a solid rhodamine 6G film and various rhodamine 6G-methanol solutions. Temperature 22 °C.
2.5
2.0
1.0
-i—|—i—i—r I -i—|—i—i—r
.solid
-I I I I I I L_ 450 500 550
WAVELENGTH X Inml Fig. 4. Absolute refractive indices n versus wavelength. Dotted curve, solid rhodamine 6G film. Dashed curves, methanol (a), and glass BK7 (b). Solid curves, rhodamine 6G in methanol with the concentrations 0.66 mol/<f (1), 0.4 mol/7 (2), 0.2 mol/tf (3), and 0.14 mol/Y (4). Temperature 22° C.

500 WAVELENGTH ( n m )
Fig. 5. Absorption spectra of rhodamine 6G dissolved in methanol. Curve 1 (solid), concentration C = 10~5 mol / / ; curve 2 (dash-dotted), C = 0.2 mole//; curve 3 (dashed), C = 0.4 mol/*?; curve 4 (solid), C = 0.66 mol/ / . Inset gives long wavelength extension.
4. Analysis of the absorption spectra
3x10
2x10
-16 - 1x10
UJ 0 00
in g -16| C 3x10
I 2*10,6!
CD <
ixio'61
1 1 1
u
/ 3
1 1 1 1 T " 1
//^\ ® '
" / //
I l 1 i i i i i
\ ® :
- A )
\ / ^ N
\ / \
\ /°M \ :
— ^
A x
y \ - /
1
\ "
-,. L J _ 1 1 1 480 500 520
WAVELENGTH X [nml 540
Fig. 6. (a) Absorption spectra of aqueous rhodamine 6G solutions (from Selwyn and Steinfeld, ref. [8]). The concentrations are 7 . 9 x l O - 7 mo l / / (1), 7 . 9 X l 0 - 5 mole// (2), 1 .48XlO - 4
m o l / / (3), and 7.41x10"4 mole// (4). (b) Monomer and dimer absorption spectra of rhodamine 6G in water (from ref. [8]).
In general dyes dissolve in monomers, dimers, trimers, etc. At low concentrations monomers dominate. With increasing concentration dimers and higher aggregates may gain importance. Each component (monomer, dimer, etc.) may have a different absorption behaviour. A t high concentration the constituting components (monomers, dimers, trimers, etc.) of the solution come near together (statistical random walk distribution of constitutes) and if two neighbouring components are within an interaction volume Vl [interaction distance dl « {WY/A^)1/3] the mutual solute-solute interaction changes the absorption behaviour.
The apparent absorption cross section o = 1000a/NAC (C total concentration of dye mole
cules), which is obtained by absorption measurements, may be composed of free monomelic, di-meric, trimeric, etc contributions (no dye neighbour within Vx arround component) and of interacting monomer-monomer, monomer-dimer, di-mer-dimer, etc. contributions (components within V{). Restricting to the absorption of free (non-interacting) /-mers (n = 1, 2, 3,...) and to the absorption of /-mer-y-mer pairs in interaction centers the apparent absorption cross section o may be written as
Z,*MV+ E Lx.MV, (i) i=l i= \ y=l
where xt is the mole fraction of free /-mers and Xjj is the mole fraction of interacting /-mer-y-mer pairs (within interaction volume VY). The mole fractions add up to one, i.e. L ^ i * , - + L ^ L ^ x ^ = 1. ot is the absorption cross section of one molecule in the z"-mer (z'-mer absorption cross section divided by i) and atj is the absorption cross section of one molecule in the interacting /-mer-y-mer compound (compound absorption cross section divided by / + j).
It should be mentioned that basic dyes (like rhodamine 6G) and acid dyes may dissociate at high dilutions (C < 1 0 " 4 mol/*f) into cations and anions and the absorption spectra of the neutral molecules may differ from the ions [3,18,19]. Very often the difference in the absorption spectra of dissociated and undissociated molecules is small. In eq. (1) and in the following discussion ionic dissociation effects are neglected.
If the concentration dependent change in the absorption spectra is mainly due to dimer formation eq. (1) reduces to
(2)
: (1 — J C d ) C is the concentration of
a = x,Ao
or
M + •XDAD
(3)
where xM is the mole fraction of monomers (i = 1) and xD the mole fraction of molecules in dimers (/ = 2). a M is the monomer absorption cross section and a D the absorption cross section of a molecule in the dimer. In eq. (3) the relation xM = 1 - x D has been used. a D is obtained by rearrangement of eq. (2):
A D = [ ^ ( 1 - ^ D ) ° M 1 A D - ( 4)
Dimers are formed by the reaction
M + M < p * D . (5)
If other z'-mer formation reactions (i>3) like M 4- D -> T are negligible and the dye concentration is low (average dye molecule distance d large compared to interaction distance dY) then the dimer concentration [D] is given by the law of mass action
[D] = KD[M]\ (6)
[D] = ( x D / 2 ) C is the concentration of dimers,
Ku is the dimerization constant. In-[M] = xMC-monomers. sertion of the expressions for [D] and [M] into eq. (6) leads to
KD = xD/2(l-xu) C
and
= 1 + 1
4K»C 1 +
1 4KDC
- 1 1/2
(7)
(8)
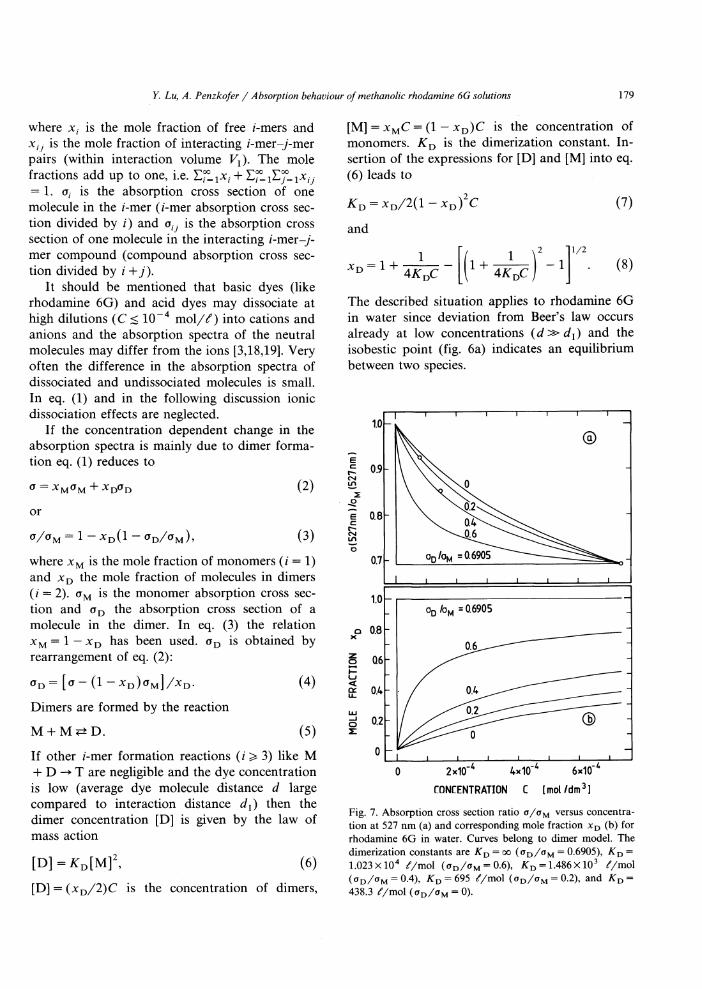
The described situation applies to rhodamine 6 G in water since deviation from Beer's law occurs already at low concentrations (d^dY) and the isobestic point (fig. 6a) indicates an equilibrium between two species.
1.0
£ 0.9h csi in
e 0.8] c r-
<M LT»
0.7
1.0
o 0.8 X
z o 06
< 0.4 u_ 0.4
L U _ i o 0.2 2:
0
I T • i —i r i _
®
^46
° D / o M = 0 .6905^^-— _
i i i i i i
- ° D / o M = 0.6905 -
- 0 6 ^ ^ - ^ ^ " -
- _ -
_ -- ^ 0 -
- i i i i i i —
2x10'* 4x10"
CONCENTRATION C
r4 6x10"
[mol /dm3]
Fig. 7. Absorption cross section ratio a/oM versus concentration at 527 nm (a) and corresponding mole fraction xD (b) for rhodamine 6G in water. Curves belong to dimer model. The dimerization constants are = oo ( a D / a M = 0.6905), KD = 1.023 X10 4 / /mol ( a D / a M = 0.6), KD =1.486 X l O 3 / /mol ( a D / o M = 0.4), tfD = 695 / /mol ( a D / a M = 0.2), and Ku = 438.3 / / m o l ( a D / a M = 0).

180
In fig. 7a the experimental o/oM data points of rhodamine 6 G in water at X = 527 nm are plotted versus concentration [ a M = a(7.9 X 10~ 7 m o l / / ) ] . The depicted curves are calculated by use of eqs. (3) and (8). They are fitted to the highest concentration point. The experimental points fit best to a dimerization constant of 1.5 X 10 3 ̂ /mol [aD(527 nm)/a M (527 nm) = 0.4]. The curves in fig. 7b show the corresponding mole fractions of molecules in dimers.
Using eqs. (4) and (8) together with KD « 1 . 5 X 10 3 tf/mol the dimer absorption spectrum a D ( X ) of rhodamine 6 G in water is resolved from the absorption spectra of fig. 6a. The result is shown in fig. 6b together with the monomer absorption spectrum [8]. The dimer absorption spectrum a D ( X ) reveals a weak long-wavelength absorption and a strong short-wavelength absorption peak within the S0-S1 absorption band. The frequency spacing between the two absorption peaks is approximately 1500 c m - 1 . This spacing agrees within experimental accuracy with the spacing between the absorption peak and the vibronic shoulder of the monomer spectrum. The long-wavelength peak of the dimer spectrum is reduced in height by a factor of 2.3 and shifted about 500 c m - 1 to longer wavelengths compared to the monomer absorption peak. The short wavelength peak of the dimer spectrum is approximately a factor of 3.9 higher than the vibronic shoulder of the monomer spectrum.
If the deviation from Beer's law is caused mainly by the interaction of neighbouring monomer molecules then eq. (1) reduces to
o = xMoM-^xsos, (9)
or
° A M = 1 ~ * s ( l - ^SAM) (10)
and
° S = [ ° - 0 - - X S ) ° M \ / X S > (11)
xs is the mole fraction of molecules in closely spaced pairs. The fraction of molecules in statistically formed binary molecular centers is given by [1,11,12]
x s = l - e x p ( - F I 7 V A C ) , (12)
if other aggregate mole fractions are negligible. The rhodamine 6G-methanol solutions may be described by this situation since deviations from Beer's law occur only at high concentrations (average molecular distance d near to interaction distance dx) and the two isobestic points (fig. 5) indicate the equilibrium between two species.
In fig. 8a the experimental o/oM data points of rhodamine 6G in methanol at X = 530 nm are plotted versus concentration [ a M = a(10~ 5
mol / / ) ] . The various o/aM curves are calculated by use of eqs. (10) and (12) which represent the statistical interaction center model (dimers neglected, Ku = 0). The curves are adjusted to the experimental point at C m a x = 0.66 m o l / / . They
1.0 -iO
nm)
0.9 ®
i n
0.8 -
530n
m:
07 -
o 0.6 o s /<v,= 0.55
05 1.0
i i i i i i 05 1.0 05 1.0 o s /o M = 0.55 , _
CO X
0.8
\CTI
0N
0.6 -
L i - OA -
MOLE
0.2 - ® ; 0 • i i i i i
0 0.2 OA 0.6 CONCENTRATION C [mol/dm3]
Fig. 8. Absorption cross section ratio a/oM at 530 nm (a) and corresponding mole fraction xs (b) versus concentration for rhodamine 6G in methanol. Curves belong to interaction center model. The values for the various curves are = oo (os/oM = 0.55), Vl = 5.79 nm3 ( a s / a M = 0.5), Vx = 3.49 nm3 ( a s / a M = 0.4), Vx = 2.08 nm3 ( a s / a M = 0.2), and K, =1.87 nm3 ( a s / a M
= 0).
are varied between JC S = 1 ( a s is maximal, interaction center volume Vx = oo) and a s = 0 [xs(C) = 1 - a ( C ) / a M , F , = - l n { 0 ( C m a x ) / a M } / i V A C m a x ] . The experimental points fit best to the curve with a s / a M = 0.4 (V{ = 3.49 nm 3 , rf, « 1 nm). In fig. 8b the corresponding mole fractions xs of molecules in the interaction centers are depicted.
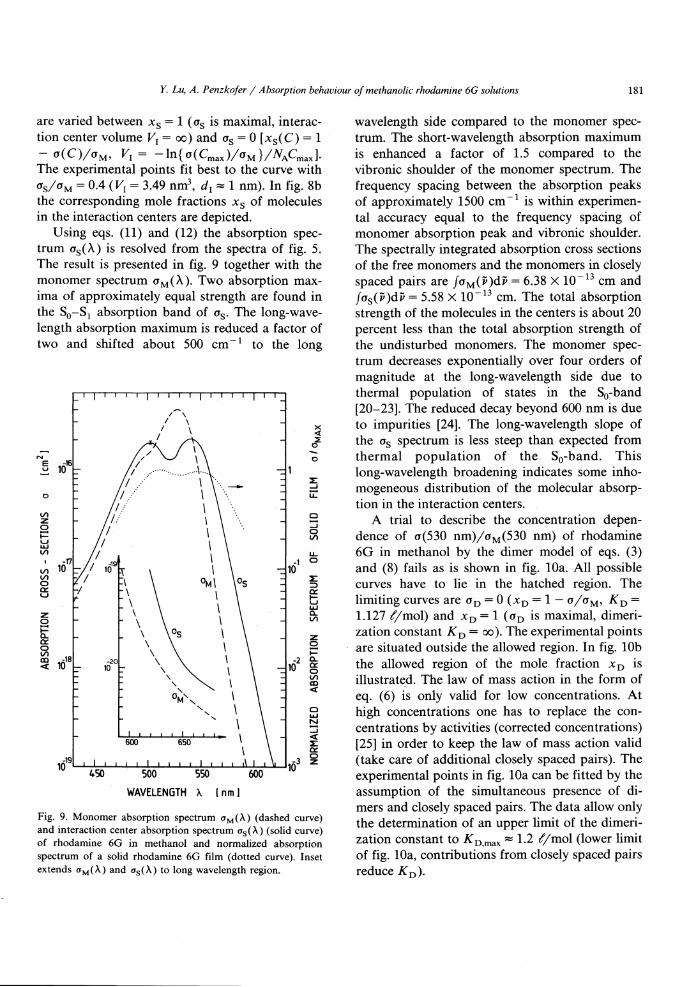
Using eqs. (11) and (12) the absorption spectrum a s (A) is resolved from the spectra of fig. 5. The result is presented in fig. 9 together with the monomer spectrum a M ( A ) . Two absorption maxima of approximately equal strength are found in the S 0 - S 1 absorption band of a s . The long-wavelength absorption maximum is reduced a factor of two and shifted about 500 c m - 1 to the long
i I i i i i I i i i i I i i i i I i i
WAVELENGTH X [nm]
Fig. 9. Monomer absorption spectrum a M (X) (dashed curve) and interaction center absorption spectrum a s(A) (solid curve) of rhodamine 6G in methanol and normalized absorption spectrum of a solid rhodamine 6G film (dotted curve). Inset extends a M (X) and a s(X) to long wavelength region.
wavelength side compared to the monomer spectrum. The short-wavelength absorption maximum is enhanced a factor of 1.5 compared to the vibronic shoulder of the monomer spectrum. The frequency spacing between the absorption peaks of approximately 1500 c m - 1 is within experimental accuracy equal to the frequency spacing of monomer absorption peak and vibronic shoulder. The spectrally integrated absorption cross sections of the free monomers and the monomers in closely spaced pairs are foM(v)dv = 6.38 X 1 0 " 1 3 cm and jos(v)dp = 5.58 X 10~ 1 3 cm. The total absorption strength of the molecules in the centers is about 20 percent less than the total absorption strength of the undisturbed monomers. The monomer spectrum decreases exponentially over four orders of magnitude at the long-wavelength side due to thermal population of states in the S0-band [20-23]. The reduced decay beyond 600 nm is due to impurities [24]. The long-wavelength slope of the a s spectrum is less steep than expected from thermal population of the S 0-band. This long-wavelength broadening indicates some inho-mogeneous distribution of the molecular absorption in the interaction centers.
A trial to describe the concentration dependence of a(530 nm)/a M (530 nm) of rhodamine 6 G in methanol by the dimer model of eqs. (3) and (8) fails as is shown in fig. 10a. A l l possible curves have to lie in the hatched region. The limiting curves are a D = 0 (xD = 1 - a /a M , Ku = 1.127 ^/mol) and x D = 1 ( a D is maximal, dimeri-zation constant Ku = oo). The experimental points are situated outside the allowed region. In fig. 10b the allowed region of the mole fraction x D is illustrated. The law of mass action in the form of eq. (6) is only valid for low concentrations. A t high concentrations one has to replace the concentrations by activities (corrected concentrations) [25] in order to keep the law of mass action valid (take care of additional closely spaced pairs). The experimental points in fig. 10a can be fitted by the assumption of the simultaneous presence of dimers and closely spaced pairs. The data allow only the determination of an upper limit of the dimeri-zation constant to KDmsiX « 1 . 2 £/mo\ (lower limit of fig. 10a, contributions from closely spaced pairs reduce

1.0 _ — ® £ c 0.9 - _ o
0.9 LT»
o 0.8 - -
1 c o 0.7 - -LT»
o 0.6 -/ / / A Ö D / G M = ° - 5 5 /
05 I 1
1.0 1.0 _ / / / / % ! ^ r ^ y /// ~
0.8 - / / / / / / / / / / ~ o
X - ////////// / / -z 0.6 - / / _ o
< 0A u_ - -U J _ _ i 0.2 - -o 2E
0 i i i i
® 1
0 0.2 0.4 0.6
CONCENTRATION C [mol/dm3]
Fig. 10. Absorption cross-section ratio o/oM at 530 nm (a) and corresponding mole fraction x D (b) versus concentration for rhodamine 6G in methanol. Curves belong to dimer model. The dimerization constants of the limiting curves are KD = oo O D A M = 0.55) and KD =1.127 / /mol ( a D / a M = 0).
The influence of closely spaced pairs at high concentrations is illustrated in fig. 11. The solid curve gives the mole fraction of molecules in closely spaced pairs (eq. (12)) for an interaction volume of VY = 3.49 cm 3 in case of KD = 0. The curve describes reasonably well the situation of rhodamine 6G in methanol. The dashed curves belong to KD = 1.5 X 10 3 f/mol (curve 1 situation of rhodamine 6 G in water) and to KD = 1.2 ^/mol (curve 2). The curves are calculated by use of eq. (8). Contributions from closely spaced pairs are neglected (Fj = 0). This neglect is reasonable for the situation of rhodamine 6G in water (dashed curve 1, solubility limit 0.02 m o l / Y ) but cannot be tolerated for rhodamine 6G in methanol (dashed curve 2, solubility limit 0.66 m o l / / ) . In this case the interaction volume cannot be neglected and in
1.0
0.8
x 0.6
^ 0.4
0
1 1 1 1 1 111
/ -
/ /
1 / /
/ /
/ / {_
/ / / - / / / -
/ / / " / 1/2 -
/ /
1 1 I I I 1 1 111 1
// //
M I i i i r —I I 1—1 I I I—U I 1—L_U 1 1—L_U 10"3 10~2 10"1 1
CONCENTRATION C [mol/dm3] Fig. 11. Dependence of mole fractions on concentration. Dashed curve 1: KD = 1.5x10³ <?/mol and V1 = 0, describes situation of rhodamine 6G in water (eq. (6)). Dashed curve 2: KD = 1.2 / /mol and Vx = 0, cannot fit situation of rhodamine 6G in methanol (eq. (6)). Solid curve: KD = 0 and Vx = 3.49 nm3 approximates situation of rhodamine 6G in methanol (eq. (12)). Beyond solubility limits of rhodamine 6G in water and rhodamine 6G in methanol curves are dotted.
eq. (6) the concentrations have to be modified to activities to take care of the increased interaction pair formation at high concentration.
In fig. 9 the normalized absorption spectrum of the solid rhodamine 6G film is included (obtained from fig. 3). Besides a spectral shift the shape is similar to the a s spectrum. In solutions a solvent induced spectral shift is expected [26]. The absolute absorption cross-section values could not be given since the density of the solid film is unknown.
5. Conclusions
The analysis of the concentration dependence of the absorption cross sections of rhodamine 6G in methanol shows that the deviation from Beer's

law at high concentrations (C>0 .1 mol / * f ) is mainly due to the monomer-monomer interaction of neighbouring molecules (average distance < 2.55 nm, rhodamine 6G molecule size « l x l x 0.4 nm 3). In ref. [27] these interacting neighbouring molecules were called quenching centers, since they are mainly responsible for fluorescence quenching at high concentration in rhodamine 6G-methanol solutions.
The concentration dependent absorption behaviour of rhodamine 6 G in methanol is compared with the absorption behaviour of rhodamine 6 G in water (data from ref. [8]). For rhodamine 6 G in water deviation from Beer's law is already observed at concentrations as low as 10" 5 mol / * f (average distance between molecules ~ 55 nm) due to the formation of stable ground state dimers (dimer binding energy > thermal energy [17]). The dimer formation in the solvent water seems to be due to the linking of two dye molecules by two hydrogen bridges of water of the form dye • • • H - O - H • • • dye. In case of rhodamine 6 G in methanol the methanol solvent shell around the dye molecules seems to hinder or lower the probability of dye-dye linkage (in methanol only one H-atom is able of hydrogen bonding).
The dimer absorption spectrum of rhodamine 6 G in water and the absorption spectrum of interacting rhodamine 6 G molecules in methanol are different in shape. Both spectra split into two components. The frequency splitting is within experimental accuracy equal to the frequency of the dominant vibronic breathing mode of rhodamine 6G. The relative heights of the two components are different. The different absorption shapes indicate a different origin of the spectra (stable ground state dimers in water versus mainly closely spaced pairs in methanol). The absorption behaviour of ground state dimers has been extensively studied by exciton theory [28-44]. The exci-ton theory should be extendable to a theoretical description of the high concentration monomer-monomer interaction. A possible explanation of the difference of the dimer spectrum of rhodamine 6 G in water and the interaction center spectrum of rhodamine 6 G in methanol may be found in assuming different S0-S1 Franck-Condon shifts for both species [45-47].
Acknowledgement
The authors are grateful to Professors K . D . Drexhage, W. Kaiser, and M . Maier for helpful information. They thank Th. Ascherl for technical assistance, the Deutsche Forschungsgemeinschaft for financial support, and the Rechenzentrum of the University Regensburg for disposal of computer time.
References
[1] Th. Förster, Fluoreszenz organischer Verbindungen (Vandenhoeck and Ruprecht, Göttingen, 1951).
[2] C A . Parker, Photoluminescence of solutions (Elsevier, Amsterdam, 1968).
[3] K . H . Drexhage, in: Dye lasers, topics in applied physics, Vol. 1, ed. F.P. Schäfer (Springer, Berlin, 1977) p. 144.
[4] E. Rabinowitch and L.F. Epstein, J. Am. Chem. Soc. 63 (1941) 69.
[5] Th. Förster and E. König, Z. Elektrochem. 61 (1957) 345. [6] L.A. Ignat'eva, L.V. Levshin, T.D. Osipova and Yu. M .
Polukhin, Opt. Spectry. 13 (1962) 219. [7] E.G. Baranova, Opt. Spectry. 13 (1962) 452. [8] J.E. Selwyn and J.I. Steinfeld, J. Phys. Chem. 76 (1972)
762. [9] I.L. Arbeloa and P.R. Ojeda, Chem. Phys. Letters 87
(1982) 556. [10] B. Kopainsky and W. Kaiser, Chem. Phys. Letters 88
(1982) 357. [11] M.F. Perrin, C R . Hebd. Seances Acad. Sei. 178 (1924)
1978. [12] A. Boutharic and M . Roy, C R . Hebd. Seances Acad. Sei.
211 (1940) 201. [13] A. Penzkofer, H . Glas and J. Schmailzl, Chem. Phys. 70
(1982) 47. [14] Y. Lu and A. Penzkofer, Appl. Optics 25 (1986) 221. [15] P. Scherer, B. Kopainsky and W. Kaiser, Opt. Commun.
39 (1981) 375. [16] W. Leupacher and A. Penzkofer, Appl. Phys. B36 (1985)
25. [17] L.V. Levshin and LS. Lonskaya, Opt. Spectry. 11 (1962)
148. [18] A.I. Popov and R.E. Humphrey, J. Am. Chem. Soc. 81
(1959) 2043. [19] K . H . Drexhage, Laser Focus 9 (3) (1973) 35. [20] W. Blau, W. Dankesreiter and A. Penzkofer, Chem. Phys.
85 (1984) 473. [21] A. Penzkofer and P. Sperber, Chem. Phys. 88 (1984) 309. [22] F. Wondrazek, A. Seilmeier and W. Kaiser, Chem. Phys.
Letters 104 (1984) 121. [23] A. Seilmeier, P.O.J. Scherer and W. Kaiser, Chem. Phys.
Letters 105 (1984) 140. [24] P. Sperber and A. Penzkofer, to be published.
[25] P.W. Atkins, Physical chemistry (Oxford Univ. Press, Oxford, 1982).
[26] E. Lippert, Z. Elektrochem. 61 (1957) 962. [27] A. Penzkofer and Y. Lu, Chem. Phys. 103 (1986) 399. [28] A.S. Davydov, Theory of molecular excitons (McGraw-
Hill, New York, 1962). [29] M . Kasha, in: Spectroscopy of the excited state, ed. B.
DiBartolo (Plenum Press, New York, 1976) p. 337. [30] W.T. Simpson and D.L. Peterson, J. Chem. Phys. 26
(1957) 588. [31] W. West and S. Pearce, J. Phys. Chem. 69 (1965) 1894. [32] Th. Förster, in: Modern quantum chemistry, part III:
action of light and organic crystals, ed. O. Sinanoglu (Academic Press, New York, 1965) p. 93.
[33] E.G. McRae, Australian J. Chem. 14 (1961) 329, 344, 554. [34] R.L. Fulton and M . Gouterman, J. Chem. Phys. 35 (1961)
1059. [35] R.L. Fulton and M . Gouterman, J. Chem. Phys. 41 (1964)
2280. [36] A.A. Lamola and N.J. Turro, Energy transfer and organic
photochemistry, technique of organic chemistry, Vol. 14, eds. P.A. Leermakers and A. Weissberger (Interscience Publishers, New York, 1969).
[37] R.W. Chambers, T. Kajiwara and D.R. Kearns, J. Phys. Chem. 78 (1974) 380.
[38] R.P. Hemenger, J. Chem. Phys. 66 (1977) 1795. [39] B. Kopainsky, J.K. Hallermeier and W. Kaiser, Chem.
Phys. Letters 87 (1982) 7. [40] E.W. Knapp and S.F. Fischer, Chem. Phys. Letters 103
(1984) 479. [41] P.O.J. Scherer and S.F. Fischer, Chem. Phys. 86 (1984)
269. [42] E.W. Knapp, P.O.J. Scherer and S.F. Fischer, Chem.
Phys. Letters 111 (1984) 481. [43] E.W. Knapp, Chem. Phys. 85 (1984) 73. [44] P.O.J. Scherer, E.W. Knapp and S.F. Fischer, Chem.
Phys. Letters 106 (1984) 191. [45] V. Zanker, M . Held and H. Rammensee, Z. Naturforsch.
14b (1959) 789. [46] E.A. Chandross and J. Ferguson, J. Chem. Phys. 45 (1966)
4532. [47] M . Pope and C.E. Swenberg, Electronic processes in
organic crystals (Clarendon Press, Oxford, 1982).
Related Documents