Table of contents Highlights from the survey 2 Findings, recoveries and expectations 3 Audit program 4 Internal clients 4 Audits, hours and targets 5 Audit methodology 5 The “who” in your department 6 Negotiating a settlement 6 Other audits 7 Conclusion 7 With renewed focus in the industry around cost reduction, EY was asked to undertake a benchmarking exercise focusing on the current strategies companies were following around contract compliance and vendor audit. As part of this benchmarking exercise, we asked 28 questions around current vendor/contract audit and joint venture audit strategies and programs. The respondents to this survey include many energy companies and government agencies. Overall, the survey results indicate that companies are increasing their focus on contract compliance and vendor audit in Alberta. With stronger business knowledge, enhanced methodologies and greater executive support, contract compliance and vendor audit have caught the attention of the executive suite. Cost recoveries appear to be the primary focus for organizations currently performing contract compliance and vendor audits. However, assurance over vendor performance is also gaining prominence now. Currently companies use a mix of both in-house and outsourced staff to complete their annual audit plans. The average number of audits performed by organizations and the cost recoveries identified are directly proportional to the resources allocated. However, there seems to be an overwhelming expectation that the vendor audit department, unlike other types of support functions, is expected to provide a significant return on investment. Respondents to this survey agreed that, at a minimum, vendor audits should be self-sustaining. Vendor audit benchmarking survey Vendor and contract risk 2013

Welcome message from author
This document is posted to help you gain knowledge. Please leave a comment to let me know what you think about it! Share it to your friends and learn new things together.
Transcript

Table of contents
Highlights from the survey 2
Findings, recoveries and expectations 3
Audit program 4
Internal clients 4
Audits, hours and targets 5
Audit methodology 5
The “who” in your department 6
Negotiating a settlement 6
Other audits 7
Conclusion 7
With renewed focus in the industry around cost reduction, EY was asked to undertake a benchmarking exercise focusing on the current strategies companies were following around contract compliance and vendor audit.
As part of this benchmarking exercise, we asked 28 questions around current vendor/contract audit and joint venture audit strategies and programs. The respondents to this survey include many energy companies and government agencies.
Overall, the survey results indicate that companies are increasing their focus on contract compliance and vendor audit in Alberta. With stronger business knowledge, enhanced methodologies and greater executive support, contract compliance and vendor audit have caught the attention of the executive suite.
Cost recoveries appear to be the primary focus for organizations currently performing contract compliance and vendor audits. However, assurance over vendor performance is also gaining prominence now. Currently companies use a mix of both in-house and outsourced staff to complete their annual audit plans.
The average number of audits performed by organizations and the cost recoveries identified are directly proportional to the resources allocated. However, there seems to be an overwhelming expectation that the vendor audit department, unlike other types of support functions, is expected to provide a significant return on investment. Respondents to this survey agreed that, at a minimum, vendor audits should be self-sustaining.
Vendor audit benchmarking survey Vendor and contract risk2013

2 | Vendor audit benchmarking survey
Highlights from the survey
On an average, 17 audits are performed every year. In our survey, 43% of the respondents noted that they completed between 18 and 41 per year.
Approximately 420 hours are spent on every audit, with 57% of the respondents reporting more hours and 43% reporting less hours. The range of hours proved to be quite wide — the fewest hours per audit was 100, while the greatest was 800.
On an average, therespondents indicated that 3% of the contract value audited is identified as non-compliant, while 50% of the identified non-compliance is recovered. Twenty-nine percent indicated that they identify and collect more than 3%.
71% of the respondents indicated that data analytics are used throughout the audit. Of these respondents, 14% use specialized audit tools to perform this function.

3Vendor audit benchmarking survey |
Findings, recoveries and expectationsWho shows you “the money”?
Today, an increasing number of companies are assessing their capital projects to understand what has happened, what is happening and what will happen. An expanded understanding of contract language, audit techniques and data analytics helps mitigate project control risks, provides assurance to management and increases potential recoveries.
According to the respondents, on an average, 3% of contract values audited are identified as non-compliant to contract terms. Further, our respondents indicated that of this
3% non-compliance, actual vendor cash recoveries range from 20% to 100%, with an average of 50%.
To understand the magnitude of these recoveries, in the Alberta oil sands alone this provides for a potential non-compliance of $690m, with a cash recovery average of $345m, based on the most recent CAPP forecast of $23b capital spend in 2013.
It is advantageous for those who complete the audit to be involved in the negotiations — either lead the negotiations or lend their support. Of the respondents involved in negotiations, 50% stated the business unit took the lead, 33% were led by the auditor and 17% were led by supply chain staff.
The respondents have varying expectations of results from their efforts in vendor audits. Depending on the company’s focus, the highlighted results may focus on internal process improvement opportunities to the business and corporate-level feedback, while other companies want to see actual dollar value returns.
Of the respondents, 57% expect a return on investment ratio of between 4:1 and 6:1, while 20% of the respondents expect a return below 4:1. The remaining 43% are looking to provide feedback to the business for future improvements, and cost recovery is not the primary goal.

4 | Vendor audit benchmarking survey
Audit programWhere it is located, who pays for it, and who gets their money back from it?
With a focus on increased efficiency and financial management, companies are seeking to hold onto more of their money. Hence, they’re looking to enhance their cash-retention policies and procedures. They, therefore, need auditors who review contracts, vendor spending and internal operations. The agenda is generally similar across all companies: identify non-compliant charges, decrease future cash leakage and identify process issues.
While respondents felt that the vendor audit program was essential, responses varied as to where in the organization the group should be located.
Fifty-seven percent of the respondent’s vendor audit programs were located in the internal audit (IA) department; 29% were located in finance and not part of IA; and 14% were combined between IA, business units (BU) and the legal department.
The budget for vendor audit comes from multiple areas in each business, again depending on the company reviewed. In contrast to the results above, only 29% of the respondents advised that their budgets were provided through IA. The finance department was the same at 29%, with the remaining 42% split evenly at 14% each between finance, supply chain management, BU and a combination with the legal department. The allocation of identified and realized cost recovery was represented very differently from the above results. According to the respondents, 100% of all refunds derived from vendor audits was provided directly back to the business units.
Internal clientsWho are they and how do companies work with them?
The main focus of respondents’ work in vendor audit is to recover non-compliant charges, provide their internal clients with peace of mind and highlight areas of potential improvement. The mix of internal clients cuts across the entire corporate landscape, beginning with the business units.
In our survey, 100% of the respondents indicated that the business units are their primary internal client. Eighty-six percent indicated that supply chain management is the second major client and 14% regard finance as the third.
Respondents confirmed that internal clients’ involvement in an audit is absolutely necessary to ensure problem areas are addressed, procedures are understood and relationships are maintained. That being said, the respondents also felt that it was imperative to keep a certain level of independence. According to the results, 57% of respondents indicated that their internal clients were heavily involved during the audit processes, while 43% stated that their clients were generally involved, ranging from regular update meetings to vendor selection, contract assistance and input into findings, reports and management actions.
5Vendor audit benchmarking survey |
Audits, hours and targetsWhat happens according to plan?
Simply stated, the more hours expended, the more audits completed. And the more audits completed, the more recoveries realized.
All respondents participate in some form of annual audit planning. This demonstrates they understand the importance of future audit planning in that vendor audit space.
On average, the respondents exceeded plan in terms of number of audits completed in fiscal 2012. The average 2012 audit plan consisted of 16 audits, with the completion average of 17 audits. The counted completions ranged among respondents from 1 to 41 audits during 2012. Further, 43% of the respondents complete between 18 and 41 audits per year.
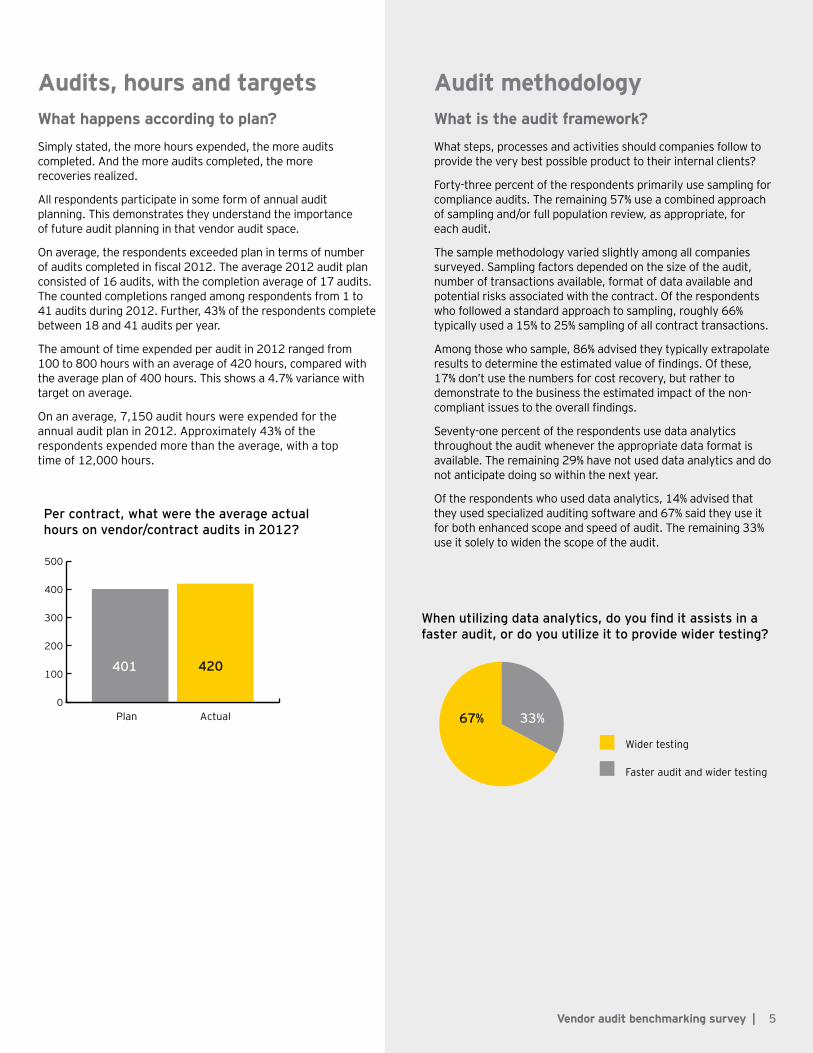
The amount of time expended per audit in 2012 ranged from 100 to 800 hours with an average of 420 hours, compared with the average plan of 400 hours. This shows a 4.7% variance with target on average.
On an average, 7,150 audit hours were expended for the annual audit plan in 2012. Approximately 43% of the respondents expended more than the average, with a top time of 12,000 hours.
Audit methodologyWhat is the audit framework?
What steps, processes and activities should companies follow to provide the very best possible product to their internal clients?
Forty-three percent of the respondents primarily use sampling for compliance audits. The remaining 57% use a combined approach of sampling and/or full population review, as appropriate, for each audit.
The sample methodology varied slightly among all companies surveyed. Sampling factors depended on the size of the audit, number of transactions available, format of data available and potential risks associated with the contract. Of the respondents who followed a standard approach to sampling, roughly 66% typically used a 15% to 25% sampling of all contract transactions.
Among those who sample, 86% advised they typically extrapolate results to determine the estimated value of findings. Of these, 17% don’t use the numbers for cost recovery, but rather to demonstrate to the business the estimated impact of the non-compliant issues to the overall findings.
Seventy-one percent of the respondents use data analytics throughout the audit whenever the appropriate data format is available. The remaining 29% have not used data analytics and do not anticipate doing so within the next year.
Of the respondents who used data analytics, 14% advised that they used specialized auditing software and 67% said they use it for both enhanced scope and speed of audit. The remaining 33% use it solely to widen the scope of the audit.
Per contract, what were the average actual hours on vendor/contract audits in 2012?
0
100
200
300
400
500
420401
Plan Actual
When utilizing data analytics, do you find it assists in a faster audit, or do you utilize it to provide wider testing?
Wider testing
Faster audit and wider testing
67% 33%

6 | Vendor audit benchmarking survey
The “who” in your departmentWho is executing?
While companies employ slightly different methods, ideas and systems in completing their annual audit plans, each plan follows one of four general operating models: vendor auditor lead, internal auditor lead, contractor facilitated, or a hybrid of the three. Regardless of operating model, on average 3.5 full-time employees work in the vendor audit space.
Understanding the “who” behind the audit demonstrates the industry working in multiple directions with vendor and contract compliance. According to our survey, 29% of the respondents used dedicated vendor audit departments, 29% used internal audit departments and 29% used consultants. Thirteen percent of the respondents utilized a mix of both internal resources and consultants.
Consultants are often used during all stages of the vendor audit process.
Fifty percent of the respondents indicated that they have used consultants to complete the entire vendor audit process. An average of 33% of the respondents used consultants primarily during the execution stage of the vendor audits while 17% stated that consultants are used as subject matter experts, focusing on the audit planning and execution of specific portions of the audit, such as contractual terms and construction processes.
Negotiating a settlementWho is working for your money?
When the audit has been finalized internally, the final step of the plan is to realize cost recovery. The negotiations step is as much about strategy as it is about maintaining the relationship.
Half of the respondents (50%) had negotiations run by the business unit, 33% by the audit department and 17% by supply chain. When the audit department was not leading, they lent technical support as required.
However, these results only tell part of the story. In most cases, the audit team support function is used regardless of who is leading the negotiations due to the information reviews that are required when vendors respond to the report.
Vendor responses generally include additional data to either support their position, or to provide clarity on issues raised by the report. When this data is received, analysis is required to confirm its validity and relevance to the reported findings. This review is best completed by the audit group responsible for performing the initial review because they understand the initial data that led to the report.
0 5 10 15 20 25 30
Who performs your vendor/contract audits currently?
29%
13%
29%
29%
Vendor auditors
Internal auditors
External consultants
Combination of all

7
Other auditsWhat is happening with joint venture audit complexities?
There are instances where vendor audits and contract compliance audits have additional complexity.
One instance is joint venture audits. When buying into and operating a joint venture with other companies, the parties need to understand what value their partners are bringing to the table.
Conducting joint venture audits provides the clarity among business partners that is required to operate a profitable business and leverage risk. While 86% of the respondents had joint ventures operating within their companies, only 67% of these undertook joint venture audits of some form.
Of those companies that do conduct these audits, 25% completed them in their respective vendor audit department, while the remaining 75% stated the audits were completed by other departments within their organizations.
Do you also perform joint venture audits? If so, do you have the same personnel performing the vendor/contract audits and the joint venture audits?
JV carried out outside thevendor audit department
JV carried out withinvendor audit department
75%
25%
ConclusionWhat does it all mean?
While cost recovery is still the primary focus of the vendor audit and contract compliance activity, performance assessment and assurance is on the rise.
The survey results highlight the importance of audit planning, execution and negotiation support, and coordination between all key stakeholders in accomplishing successful results.
Though the survey respondents differed in the maturity and focus of their vendor audit and contract compliance activity, all respondents indicated that their companies are increasing focus on cash management, cost reduction and enhanced capital management. They said their work is a critical part of this financial focus, and will likely increase.
Vendor audit benchmarking survey |
EY | Assurance | Tax | Transactions | Advisory
About EYEY is a global leader in assurance, tax, transaction and advisory services. The insights and quality services we deliver help build trust and confidence in the capital markets and in economies the world over. We develop outstanding leaders who team to deliver on our promises to all of our stakeholders. In so doing, we play a critical role in building a better working world for our people, for our clients and for our communities.
EY refers to the global organization and may refer to one or more of the member firms of Ernst & Young Global Limited, each of which is a separate legal entity. Ernst & Young Global Limited, a UK company limited by guarantee, does not provide services to clients.
This news release has been issued by EYGM Limited, a member of the global EY organization that also does not provide any services to clients.
© 2013 Ernst & Young LLP. All Rights Reserved. A member firm of Ernst & Young Global Limited.
1158003SCORE no. FP0019ED 0115
This publication contains information in summary form, current as of the date of publication, and is intended for general guidance only. It should not be regarded as comprehensive or a substitute for professional advice. Before taking any particular course of action, contact Ernst & Young or another professional advisor to discuss these matters in the context of your particular circumstances. We accept no responsibility for any loss or damage occasioned by your reliance on information contained in this publication.
ey.com
Related Documents