Geotechnical Report Vega SES Solar Facility SWC Wixom Road and Drew Road El Centro, California Prepared for: Vega SES Solar, LLC c/o ZGlobal 750 W. Main Street El Centro, CA 92243 Prepared by: Landmark Consultants, Inc. 780 N. 4 th Street El Centro, CA 92243 (760) 337-1100 August 2018 L M AND ARK Geo-Engineers and Geologists

Welcome message from author
This document is posted to help you gain knowledge. Please leave a comment to let me know what you think about it! Share it to your friends and learn new things together.
Transcript

Geotechnical Report
Vega SES Solar Facility SWC Wixom Road and Drew Road El Centro, California Prepared for:
Vega SES Solar, LLC c/o ZGlobal 750 W. Main Street El Centro, CA 92243
Prepared by: Landmark Consultants, Inc. 780 N. 4th Street El Centro, CA 92243 (760) 337-1100 August 2018
L MAND ARKGeo-Engineers and Geologists

780 N. 4th StreetEl Centro, CA 92243(760) 370-3000(760) 337-8900 fax
77-948 Wildcat DrivePalm Desert, CA 92211(760) 360-0665(760) 360-0521 fax
L MAND ARKGeo-Engineers and Geologists
August 3, 2018 Mr. Mike Abatti Vega SES Solar, LLC c/o ZGlobal 750 W. Main Street El Centro, CA 92243
Geotechnical Report Vega SES Solar Facility
SWC Wixom Road and Drew Road El Centro, California
LCI Report No. LE18083 Dear Mr. Abatti: This geotechnical report is provided for design and construction of the proposed development of a 250-MW PV solar power generation facility at the approximately 530-acre site located southwest of the intersection of Wixom Road and Drew Road approximately 7 miles southwest of El Centro, California. The Vega SES Solar Facility includes an electrical substation and an operations and maintenance building. Our geotechnical exploration was conducted in response to your request for our services. The enclosed report describes our soil engineering site evaluation and presents our professional opinions regarding geotechnical conditions at the site to be considered in the design and construction of the project. This executive summary presents selected elements of our findings and professional opinions. This summary may not present all details needed for the proper application of our findings and professional opinions. Our findings, professional opinions, and application options are best related through reading the full report, and are best evaluated with the active participation of the engineer of record who developed them. The findings of this study are summarized below: Depending on the site selected for the O&M building, foundation designs for thin slabs-on-
grade should mitigate expansive soil conditions by one of the following methods: 1. Remove and replace upper 2.0 feet of clay soils with non-expansive sands. 2. Design foundations to resist expansive forces in accordance with the 2016 California
Building Code (CBC) Chapter 18, Section 1808 or the Post-Tensioning Institute, 3rd Edition. This requires grade-beam stiffened of floor slabs (25 feet maximum on center) or post-tensioned floor slabs. Design soil bearing pressure = 1,500 psf. Differential movement of 1.0 to 1.5 inches can be expected for slab on grade foundations placed on clay soils.
3. A combination of the methods described above.


Geotechnical Report of Vega SES Solar Facility SWC Wixom Road and Drew Road LCI Report No. LE18083 TABLE OF CONTENTS Page Section 1.......................................................................................................................................... 1
INTRODUCTION ...................................................................................................................... 1 1.1 Project Description ........................................................................................................... 1 1.2 Purpose and Scope of Work ............................................................................................. 1 1.3 Authorization .................................................................................................................... 3
Section 2.......................................................................................................................................... 4 METHODS OF INVESTIGATION ........................................................................................... 4
2.1 Field Exploration .............................................................................................................. 4 2.2 Laboratory Testing ........................................................................................................... 5 2.3 Electrical Resistivity Testing ............................................................................................ 6
Section 3.......................................................................................................................................... 7 DISCUSSION ............................................................................................................................. 7
3.1 Site Conditions ................................................................................................................. 7 3.2 Geologic Setting ............................................................................................................... 8 3.3 Subsurface Soil ................................................................................................................. 8 3.4 Groundwater ................................................................................................................... 10 3.5 Faulting ........................................................................................................................... 10 3.6 General Ground Motion Analysis .................................................................................. 11 3.7 Seismic and Other Hazards ............................................................................................ 12 3.8 Liquefaction .................................................................................................................... 13
Section 4........................................................................................................................................ 16 DESIGN CRITERIA ................................................................................................................ 16
4.1 Site Preparation (Mass Grading, Inverters, and Tanks) ................................................. 16 4.2 Utility Trench Backfill ................................................................................................... 19 4.3 Foundations and Settlements (Mats, Grade-beam Reinforced Slabs, Drilled Piers, Steel
Posts) ........................................................................................................................... 20 4.4 Slabs-On-Grade .............................................................................................................. 31 4.5 Concrete Mixes and Corrosivity ..................................................................................... 33 4.6 Excavations .................................................................................................................... 34 4.7 Seismic Design ............................................................................................................... 34 4.8 All-Weather Roadways and Construction Laydown Areas ........................................... 35 4.9 Soil Erosion Factors for SWPPP Plans .......................................................................... 35 4.10 Pavements ..................................................................................................................... 35
Section 5........................................................................................................................................ 37 LIMITATIONS AND ADDITIONAL SERVICES ................................................................. 37
5.1 Limitations ...................................................................................................................... 37 5.2 Additional Services ........................................................................................................ 38

Geotechnical Report of Vega SES Solar Facility SWC Wixom Road and Drew Road LCI Report No. LE18083
Appendices APPENDIX A: Vicinity and Site Maps APPENDIX B: Cone Penetration Test (CPT) Logs and Key to CPT Interpretations APPENDIX C: Laboratory Test Results APPENDIX D: Liquefaction Analysis APPENDIX E: Pipe Bedding and Trench Backfill Recommendations APPENDIX F: Electrical Resistivity Testing APPENDIX G: References

Geotechnical Report of Vega SES Solar Facility SWC Wixom Road and Drew Road LCI Report No. LE18083
Landmark Consultants, Inc. Page 1
Section 1 INTRODUCTION
1.1 Project Description
This report presents the findings of our geotechnical exploration and soil testing for the proposed
development of a 250-MW PV solar power generation facility at the approximately 530-acre site
located southwest of the intersection of Wixom Road and Drew Road approximately 7 miles
southwest of El Centro, California (See Vicinity Map, Plate A-1). The solar power generation
facility will consist of installing PV solar panels mounted on steel racks supported by short piers,
shallow driven posts or shallow spread footings. The proposed solar energy facility will have an
operations maintenance/storage (O&M) building and an electrical substation with step-up
transformers and dead-end A-frames for overhead power line connections. The photovoltaic
modules are planned to be ground mounted on single-axis tracker frames or fixed-tilt frames.
The electrical substation, O&M building, and battery storage area are planned to be located at the
southwest corner of the project site (east of Liebert Road) and north of the Westside Main Canal
(see Appendix A, Plate A-2. Footing loads at exterior bearing walls are estimated at 1 to 5 kips
per lineal foot. Column loads are estimated to range from 5 to 30 kips. The O&M building will
consist of slab-on-grade foundation with steel frame and/or wood-frame construction. Site
development will include minimal site grading for the PV panel areas, building pad preparation
for the O&M building and electrical substation, underground utility installation, site paving and
all weather road surfacing.
1.2 Purpose and Scope of Work
The purpose of this geotechnical study was to investigate the upper 50 feet of subsurface soil at
selected locations within the site for evaluation of physical/engineering properties, liquefaction
potential during seismic events, field testing for steel post capacities and soil electrical/thermal
resistivity parameters.
Professional opinions were developed from field and laboratory test data and are provided in this
report regarding geotechnical conditions at this site and the effect on design and construction.

Geotechnical Report of Vega SES Solar Facility SWC Wixom Road and Drew Road LCI Report No. LE18083
Landmark Consultants, Inc. Page 2
The scope of our services consisted of the following:
< Field exploration and in-situ testing of the site soils at selected locations and depths. < Laboratory testing for physical and/or chemical properties of selected samples. < Review of the available literature and publications pertaining to local geology, faulting,
and seismicity. < Installation and testing of galvanized steel posts (lateral and uplift) < Engineering analysis and evaluation of the data collected. < Preparation of this report presenting our findings and professional opinions regarding the
geotechnical aspects of project design and construction.
This report addresses the following geotechnical parameters:
< Subsurface soil and groundwater conditions < Site geology, regional faulting and seismicity, near source factors, and site seismic
accelerations < Liquefaction potential and its mitigation < Expansive soil and methods of mitigation < Aggressive soil conditions to metals and concrete
Professional opinions with regard to the above parameters are provided for the following:
< Site grading and earthwork < Building pad and foundation subgrade preparation < Allowable soil bearing pressures and expected settlements < Capacities for drilled piers and/or driven steel posts < Soil parameters for L-Pile program determined by steel post load tests < Underlayment for tanks (5,000 and 10,000 gallons) < Concrete slabs-on-grade < Concrete walkway sections < Excavation conditions and buried utility installations < Mitigation of the potential effects of salt concentrations in native soil to concrete mixes
and steel reinforcement < Seismic design parameters < SWPPP site criteria < Structural section for unpaved roadways and construction laydown areas < Pavement structural sections

Geotechnical Report of Vega SES Solar Facility SWC Wixom Road and Drew Road LCI Report No. LE18083
Landmark Consultants, Inc. Page 3
Our scope of work for this report did not include an evaluation of the site for the presence of
environmentally hazardous materials or conditions, groundwater mounding, or landscape
suitability of the soil.
1.3 Authorization
Authorization to proceed with our work was provided by signed agreement with Mr. Mike Abatti
on April 18, 2018. We conducted our work according to our written proposal dated June 2, 2017.

Geotechnical Report of Vega SES Solar Facility SWC Wixom Road and Drew Road LCI Report No. LE18083
Landmark Consultants, Inc. Page 4
Section 2 METHODS OF INVESTIGATION
2.1 Field Exploration
Subsurface exploration was performed on June 11, 2018 using Middle Earth Geo-Testing, Inc. of
Orange, California to advance sixteen (16) electric cone penetrometer (CPT) soundings to
approximate depths of 20 to 50 feet below existing ground surface. The soundings were made at
the locations shown on the Site and Exploration Plan Appendix A, (Plate A-2). The approximate
sounding locations were established in the field and plotted on the site map by sighting to
discernible site features.
Shallow (3-foot deep) hand auger borings (3-inch diameter auger) were made adjacent to the CPT
soundings in order to obtain near surface soil samples for laboratory analysis.
CPT soundings provide a continuous profile of the soil stratigraphy with readings every 2.5cm (1
inch) in depth. Direct sampling for visual and physical confirmation of soil properties has been
used by our firm to establish direct correlations with CPT exploration in this geographical region.
The CPT exploration was conducted by hydraulically advancing an instrumented Hogentogler
10cm2 conical probe into the ground at a rate of 2cm per second using a 23-ton truck as a reaction
mass. An electronic data acquisition system recorded a nearly continuous log of the resistance of
the soil against the cone tip (Qc) and soil friction against the cone sleeve (Fs) as the probe was
advanced. Empirical relationships (Robertson and Campanella, 1989) were then applied to the
data to give a continuous profile of the soil stratigraphy. Interpretation of CPT data provides
correlations for SPT blow count, phi () angle (soil friction angle), undrained shear strength (Su)
of clays and over-consolidation ratio (OCR). These correlations may then be used to evaluate
vertical and lateral soil bearing capacities and consolidation characteristics of the subsurface soil.
Interpretive logs of the CPT soundings are presented on Plates B-1 through B-16 in Appendix B.
A key to the interpretation of CPT soundings is presented on Plate B-17. The stratification lines
shown on the subsurface logs represent the approximate boundaries between the various strata.
However, the transition from one stratum to another may be gradual over some range of depth.

Geotechnical Report of Vega SES Solar Facility SWC Wixom Road and Drew Road LCI Report No. LE18083
Landmark Consultants, Inc. Page 5
2.2 Laboratory Testing
Laboratory tests were conducted on selected bulk (auger cuttings) soil samples obtained from the
shallow soil borings to aid in classification and evaluation of selected engineering properties of
the site soils. The tests were conducted in general conformance to the procedures of the American
Society for Testing and Materials (ASTM) or other standardized methods as referenced below.
The laboratory testing program consisted of the following tests:
< Plasticity Index (ASTM D4318) – used for soil classification and expansive soil design criteria
< Particle Size Analyses (ASTM D422) – used for soil classification and liquefaction
evaluation
< Moisture Contents (ASTM D2216) – used for insitu soil parameters < Chemical Analyses (soluble sulfates & chlorides, pH, and resistivity) (Caltrans Methods)
– used for concrete mix proportions and corrosion protection requirements.
The laboratory test results are presented on Plates C-1 through C-8 in Appendix C.
Engineering parameters of soil strength, compressibility and relative density utilized for
developing design criteria provided within this report were either extrapolated from correlations
with the subsurface CPT data or from data obtained from the field and laboratory testing program.

Geotechnical Report of Vega SES Solar Facility SWC Wixom Road and Drew Road LCI Report No. LE18083
Landmark Consultants, Inc. Page 6
2.3 Electrical Resistivity Testing
Wenner 4-pin field resistivity testing was conducted by RF Yeager Engineering of Lakeside,
California on June 20, 2018 at five (5) locations within the project site in accordance with ASTM
G57 standards. The tests were conducted at pin spacings of 2.5, 5, 10, 15, and 20 feet.
Additionally, a near surface soil sample (upper 5 feet) was obtained for laboratory soil corrosivity
testing at the select locations. The results of the electrical resistivity and soil corrosivity testing
are presented in Appendix F.

Geotechnical Report of Vega SES Solar Facility SWC Wixom Road and Drew Road LCI Report No. LE18083
Landmark Consultants, Inc. Page 7
Section 3 DISCUSSION
3.1 Site Conditions
The Vega SES Solar Facility is comprised of eight (8) agricultural fields south of Wixom Road
and west of Drew Road. The western portion of the project area is located adjacent to the Westside
Main Canal. The Westside Main Canal (WSMC) is a major irrigation and raw water supply for
the west side of the Imperial Valley. The WSMC runs north along the west side of the Imperial
Valley from the International Border between the United States and Mexico to Westmorland,
California. The WSMC earthen canal banks are approximately 5 feet higher in elevation than the
adjacent agricultural land.
A majority of the agricultural fields were recently harvested of the wheat crop and the fields were
being prepared for the next crop. The northern field was in sugar beet crop and the southernmost
field was in alfalfa crop. The westernmost field was being watered after recently being planted.
Several rural paved roads cross the project site as well as dirt field roads and Imperial Irrigation
District concrete lined canals and open cut agricultural drains. Adjacent properties are flat-lying
and are approximately at the same elevation of the Vega SES facility, consisting of agricultural
fields.
The Vega SES Solar Facility lies at an elevation of approximately 20 to 30 feet below mean sea
level (MSL) (El. 980 to 970 local datum) in the southwestern region of the Imperial Valley in the
California low desert. The surrounding properties lie on terrain which is flat (planar), part of a
large agricultural valley, which was previously an ancient lake bed covered with fresh water (about
300 years ago) to an elevation of 43± feet above MSL. Annual rainfall in this arid region is less
than 3 inches per year with four months of average summertime temperatures above 100 oF.
Winter temperatures are mild, seldom reaching freezing.

Geotechnical Report of Vega SES Solar Facility SWC Wixom Road and Drew Road LCI Report No. LE18083
Landmark Consultants, Inc. Page 8
3.2 Geologic Setting
The project site is located in the Imperial Valley portion of the Salton Trough physiographic
province. The Salton Trough is a topographic and geologic structural depression resulting from
large scale regional faulting. The trough is bounded on the northeast by the San Andreas Fault
and Chocolate Mountains and the southwest by the Peninsular Range and faults of the San Jacinto
Fault Zone. The Salton Trough represents the northward extension of the Gulf of California,
containing both marine and non-marine sediments deposited since the Miocene Epoch (Morton,
1977). Tectonic activity that formed the trough continues at a high rate as evidenced by deformed
young sedimentary deposits and high levels of seismicity. Figure 1 shows the location of the site
in relation to regional faults and physiographic features.
The Imperial Valley is directly underlain by lacustrine deposits, which consist of interbedded
lenticular and tabular silt, sand, and clay. The Late Pleistocene to Holocene (present) lake deposits
are probably less than 100 feet thick and derived from periodic flooding of the Colorado River
which intermittently formed a fresh water lake (Lake Cahuilla). Older deposits consist of Miocene
to Pleistocene non-marine and marine sediments deposited during intrusions of the Gulf of
California. Basement rock consisting of Mesozoic granite and Paleozoic metamorphic rocks are
estimated to exist at depths between 15,000 - 20,000 feet.
3.3 Subsurface Soil
The U. S. Soil Conservation Service compiled a map of surface soil conditions based on a thirteen-
year study from 1962-1975 (Zimmerman, 1981). The Soil Survey maps were published in 1981
and indicate that surficial deposits at the site and surrounding area consist predominantly of silty
clay and silty clay loams of the Imperial, Glenbar, Meloland, Holtville, Vint, and Indio soil groups
(see Appendix B). These loams are formed in sediment and alluvium of mixed origin (Colorado
River overflows and fresh-water lake-bed sediments).

Geotechnical Report of Vega SES Solar Facility SWC Wixom Road and Drew Road LCI Report No. LE18083
Landmark Consultants, Inc. Page 9
Subsurface soils encountered during the field exploration conducted on June 11, 2018 consist of
predominantly interbedded stiff to very stiff clays (CL-CH) and medium dense to dense silty sand
(SM) soils to a depth of 50 feet below ground surface.
The subsurface soils at the electrical substation and O&M building area located in the westernmost
field are predominately dense sandy silts (ML) and stiff to very stiff leans clays (CL) with
interbedded layers of silty sand (SM) soils at a depth of 21 to 28 feet below ground surface in the
western portion and predominantly silty sand (SM) with interbedded clay (CL) soils at depths of
24 to 32 feet and 43 to 50 feet below ground surface, the maximum depth of exploration. The
subsurface logs (Plates B-1 through B-16) depict the stratigraphic relationships of the various soil
types.
The native surface clays encountered in the near surface soil exhibit low to high swell potential
(Expansion Index, EI = 20 to 110) when correlated to Plasticity Index tests (ASTM D4318)
performed on the native clays. The clay is expansive when wetted and can shrink with moisture
loss (drying). Large shrinkage cracks and blocky fracturing of the clays occur with long periods
of drying or fallowing. The dried clays become very hard. Development of building foundations,
concrete flatwork, and asphaltic concrete pavements should include provisions for mitigating
potential swelling forces and reduction in soil strength, which can occur from saturation of the
soil.
Causes for soil saturation include standing storm water, broken utility lines, or capillary rise in
moisture upon sealing the ground surface to evaporation. Moisture losses can occur with lack of
landscape watering, close proximity of structures to downslopes and root system moisture
extraction from deep rooted shrubs and trees placed near the foundations. Typical measures used
for light industrial projects to remediate expansive soil include:
< Replacement of expansive clays with non-expansive sands or silts. < Moisture conditioning subgrade soils to a minimum of 5% above optimum moisture
(ASTM D1557) within the drying zone of surface soils. < Design of foundations that are resistant to shrink/swell forces of silt/clay soil. < A combination of the methods described above

Geotechnical Report of Vega SES Solar Facility SWC Wixom Road and Drew Road LCI Report No. LE18083
Landmark Consultants, Inc. Page 10
3.4 Groundwater
Groundwater was not noted in the CPT soundings, but is typically encountered at about 6 to 8 feet
below ground surface within the Vega SES Solar Facility project area. There is uncertainty in the
accuracy of short-term water level measurements, particularly in fine-grained soil. Groundwater
levels may fluctuate with precipitation, irrigation of adjacent properties, site landscape watering,
drainage, and site grading. The referenced groundwater level should not be interpreted to represent
an accurate or permanent condition.
3.5 Faulting
The project site is located in the seismically active Imperial Valley of southern California with
numerous mapped faults of the San Andreas Fault System traversing the region. The San Andreas
Fault System is comprised of the San Andreas, San Jacinto, and Elsinore Fault Zones in southern
California. The Imperial fault represents a transition from the more continuous San Andreas fault
to a more nearly echelon pattern characteristic of the faults under the Gulf of California (USGS,
1990). We have performed a computer-aided search of known faults or seismic zones that lie
within a 62 mile (100 kilometer) radius of the project site (Table 1).
A fault map illustrating known active faults relative to the site is presented on Figure 1, Regional
Fault Map. Figure 2 shows the project site in relation to local faults. The criterion for fault
classification adopted by the California Geological Survey defines Earthquake Fault Zones along
active or potentially active faults. An active fault is one that has ruptured during Holocene time
(roughly within the last 11,000 years). A fault that has ruptured during the last 1.8 million years
(Quaternary time), but has not been proven by direct evidence to have not moved within Holocene
time is considered to be potentially active. A fault that has not moved during Quaternary time is
considered to be inactive.
Review of the current Alquist-Priolo Earthquake Fault Zone maps (CGS, 2000a) indicates that the
nearest mapped Earthquake Fault Zone is an unnamed fault located approximately 2.9 miles west
of the project site. Geologic mapping by the USGS (Rymer and others, 2011) of the Imperial
Valley after the April 4, 2010 magnitude 7.2Mw El Mayor-Cucapah Earthquake indicates
movement along several known and unknown faults west of the project site. Surface rupture on
these faults is possible from future seismic events in the area.
Geotechnical Report of Vega SES Solar Facility SWC Wixom Road and Drew Road LCI Report No. LE18083
Landmark Consultants, Inc. Page 11
The nearest mapped Earthquake Fault Zone is the Superstition Hills fault located approximately
8.3 miles north of the project site and the Laguna Salada fault located approximately 10 miles west
of the project site.
3.6 General Ground Motion Analysis
The project site will likely be subjected to moderate to strong ground motion from earthquakes in
the region. Ground motions are dependent primarily on the earthquake magnitude and distance to
the seismogenic (rupture) zone. Acceleration magnitudes also are dependent upon attenuation by
rock and soil deposits, direction of rupture and type of fault; therefore, ground motions may vary
considerably in the same general area.
CBC General Ground Motion Parameters: The 2016 CBC general ground motion parameters are
based on the Risk-Targeted Maximum Considered Earthquake (MCER). The U.S. Geological
Survey “U.S. Seismic Design Maps Web Application” (USGS, 2018) was used to obtain the site
coefficients and adjusted maximum considered earthquake spectral response acceleration
parameters. The site soils have been classified as Site Class D (stiff soil profile).
Design spectral response acceleration parameters are defined as the earthquake ground motions
that are two-thirds (2/3) of the corresponding MCER ground motions. Design earthquake ground
motion parameters are provided in Table 2. A Risk Category II was determined using Table
1604A.5 for the O&M building and the Seismic Design Category is D since S1 is less than
0.75g.
The Maximum Considered Earthquake Geometric Mean (MCEG) peak ground acceleration
(PGAM) value was determined from the “U.S. Seismic Design Maps Web Application” (USGS,
2018) for liquefaction and seismic settlement analysis in accordance with 2016 CBC Section
1803A.5.12 and CGS Note 48 (PGAM = FPGA*PGA). A PGAM value of 0.50g has been
determined for the project site.

Geotechnical Report of Vega SES Solar Facility SWC Wixom Road and Drew Road LCI Report No. LE18083
Landmark Consultants, Inc. Page 12
3.7 Seismic and Other Hazards
< Groundshaking. The primary seismic hazard at the project site is the potential for strong
groundshaking during earthquakes along the Superstition Hills, Imperial and Laguna Salada
faults.
< Surface Rupture. The California Geological Survey (2016) has established Earthquake Fault
Zones in accordance with the 1972 Alquist-Priolo Earthquake Fault Zone Act. The Earthquake
Fault Zones consists of boundary zones surrounding well defined, active faults or fault
segments. The project site does not lie within an A-P Earthquake Fault Zone; therefore, surface
fault rupture is considered to be low at the project site.
< Liquefaction. Liquefaction is a design consideration because of underlying saturated sandy
substrata. The potential for liquefaction is discussed in more detail in Section 3.8.
Other Potential Geologic Hazards.
< Landsliding. The hazard of landsliding is unlikely due to the regional planar topography. No
ancient landslides are shown on geologic maps of the region and no indications of landslides
were observed during our site investigation.
< Volcanic hazards. The site is not located in proximity to any known volcanically active area
and the risk of volcanic hazards is considered very low.
< Tsunamis and seiches. The site is not located near any large bodies of water, so the threat of
tsunami, seiches, or other seismically-induced flooding is unlikely. The project site lies
adjacent to the Westside Main Canal (WSMC), a major irrigation supply canal for the Imperial
Valley. The embankments of the WSMC are elevated approximately 5 feet above the elevation
of the project site. There is a potential for sheet flooding of the project site from breaching of
the canal embankments from lateral spreading during a strong seismic event. No breaching of
WSMC canal embankments has occurred during strong earthquakes.
< Flooding. The project site is located in FEMA Flood Zone X, an area determined to be outside
the 0.2% annual chance floodplain (FIRM Panel 06025C2050C).
< Expansive soil. In general, much of the near surface soils in the Imperial Valley consist of
silty clays and clays which are moderate to highly expansive. The expansive soil conditions
are discussed in more detail in Section 3.3.
Geotechnical Report of Vega SES Solar Facility SWC Wixom Road and Drew Road LCI Report No. LE18083
Landmark Consultants, Inc. Page 13
3.8 Liquefaction
Liquefaction occurs when granular soil below the water table is subjected to vibratory motions,
such as produced by earthquakes. With strong ground shaking, an increase in pore water pressure
develops as the soil tends to reduce in volume. If the increase in pore water pressure is sufficient
to reduce the vertical effective stress (suspending the soil particles in water), the soil strength
decreases and the soil behaves as a liquid (similar to quicksand). Liquefaction can produce
excessive settlement, ground rupture, lateral spreading, or failure of shallow bearing foundations.
Four conditions are generally required for liquefaction to occur:
(1) the soil must be saturated (relatively shallow groundwater);
(2) the soil must be loosely packed (low to medium relative density);
(3) the soil must be relatively cohesionless (not clayey); and
(4) groundshaking of sufficient intensity must occur to function as a trigger
mechanism.
All of these conditions exist to some degree at this site.
Methods of Analysis: Liquefaction potential at the O & M building and electrical substation site
(CPT-6 and CPT-7 locations) was evaluated using the 1997 NCEER Liquefaction Workshop
methods. The 1997 NCEER methods utilize direct SPT blow counts or CPT cone readings from
site exploration and earthquake magnitude/PGA estimates from the seismic hazard analysis. The
resistance to liquefaction is plotted on a chart of cyclic shear stress ratio (CSR) versus a corrected
blow count N1(60) or Qc1N. A PGAM value of 0.50g was used in the analysis with a 6-foot
groundwater depth and a threshold factor of safety (FS) of 1.3.
The computer program CLiq (Version 2.2.0.32, Geologismiki, 2017) was utilized for liquefaction
assessment at the project site. The estimated settlements have been adjusted for transition zones
between layers and the post liquefaction volumetric strain has been weighed with depth
(Robertson, 2014 and Cetin et al., 2009). Computer printouts of the liquefaction analyses are
provided in Appendix D.

Geotechnical Report of Vega SES Solar Facility SWC Wixom Road and Drew Road LCI Report No. LE18083
Landmark Consultants, Inc. Page 14
The fine content of liquefiable sands and silts increases the liquefaction resistance in that more
ground motion cycles are required to fully develop increased pore pressures. The CPT tip
pressures (Qc) were adjusted to an equivalent clean sand pressure (QClNcs) in accordance with
Robertson and Wride (1997).
The soil encountered at the points of exploration included saturated silts and silty sands that could
liquefy during a Maximum Considered Earthquake. Liquefaction can occur within a several
isolated silt and sand layers between depths of 13.5 to 50 feet. The likely triggering mechanism
for liquefaction appears to be strong groundshaking associated with the rupture of the Laguna
Salada fault or other nearby faults. The analysis is summarized in the table below.
Table 3. Summary of Liquefaction Analysis (O&M Building/Substation)
Boring Location Depth To First
Liquefiable Zone (ft)
Potential Induced
Settlement (in)
CPT-6 9.5 ¼
CPT-7 7.0 1¾
Liquefaction Induced Settlements: Based on empirical relationships, total induced settlements
are estimated to be up to about 1¾-inch should liquefaction occur. The magnitude of potential
liquefaction induced differential settlement is estimated at be two-thirds of the total potential
settlement in accordance with California Special Publication 117; therefore, there is a potential for
1¼ inch of liquefaction induced differential settlement at the substation and O & M building site.
The differential settlement based on seismic settlements is estimated at 1 inch over a distance of
100 feet. Foundations should be designed for a maximum deflection of L/720.
Liquefaction Induced Ground Failure: Based on research from Ishihara (1985) and Youd and
Garris (1995) small ground fissure or sand boil formation is possible because of the relatively thin
layer of the overlying unliquefiable soil. Sand boils are conical piles of sand derived from the
upward flow of groundwater caused by excess porewater pressures created during strong ground
shaking. Sand boils are not inherently damaging by themselves, but are an indication that
liquefaction occurred at depth (Jones, 2003).

Geotechnical Report of Vega SES Solar Facility SWC Wixom Road and Drew Road LCI Report No. LE18083
Landmark Consultants, Inc. Page 15
Liquefaction induced lateral spreading is not expected to occur at this site due to the planar
topography. According to Youd (2005), if the liquefiable layer lies at a depth greater that about
twice the height of a free face, lateral spread is not likely to develop. Slopes or free faces occur
only at the open IID drains and large seismic events have typically resulted in small surficial slope
failures within the drain maintenance roads.
Liquefaction related failures and ground fissures were noted along the Westside Main Canal in the
area of the project site after the April 4, 2010 magnitude 7.2Mw El Mayor-Cucapah Earthquake.
McCrink and others (2011) reported several liquefaction related failures to the embankment of the
Westside Main Canal along the southern margin of the project site. Ground fissures and sand boils
were noted along the embankments of the Westside Main Canal.
Mitigation: Because of the potential for differential settlement upon liquefaction, the designer
should consider the structures be either founded on:
1) Foundations that use grade-beam footings to tie floor slabs and isolated columns to continuous footings (conventional or post-tensioned).
2) Structural flat-plate mats, either conventionally reinforced or tied with post-
tensioned tendons.
3) Deep foundations (drilled piers, geopiers, stone columns or piles) founded at a depth of 25 feet.
These alternatives reduce the potential effects of liquefaction-induced settlements by making the
structures more able to withstand differential settlement.

Geotechnical Report of Vega SES Solar Facility SWC Wixom Road and Drew Road LCI Report No. LE18083
Landmark Consultants, Inc. Page 16
Section 4 DESIGN CRITERIA
4.1 Site Preparation (Mass Grading, Inverters, and Tanks)
Clearing and Grubbing: All debris or vegetation including grass, agricultural crops, and weeds on
the site at the time of construction should be removed from the construction area. Root balls of
trees should be completely excavated. Crops should either be removed by harvesting or burning.
Excess crop residue may be disced into the ground or removed by a shallow blade cut (about 0.05
ft. depth). Organic strippings should not be used in structural areas or as engineered fill. All trash,
construction debris, concrete slabs, old pavement, landfill, and buried obstructions such as old
foundations and utility lines exposed during rough grading should be traced to the limits of the
foreign material by the grading contractor and removed under our supervision. Any excavations
resulting from site clearing should be sloped to a bowl shape to the lowest depth of disturbance
and backfilled under the observation of the geotechnical engineer’s representative.
The site may be underlain by subsurface agricultural tile drain lines at a depth of approximately
5.5 to 6.0 feet below ground surface. Tile lines should be cut and plugged at each Imperial
Irrigation District (IID) drain outlet and within 10 feet of any septic system leach fields. The IID
requires an encroachment permit for the tile drain outlet cut-offs. The pipelines are likely full of
water and may temporarily flood excavations if not plugged promptly. Base (collector) tile lines
(8 inch diameter and larger), if under buildings or substations, should be located and crushed in-
place with the backfill compacted to a minimum of 90% of ASTM D1557 maximum density.
Mass Grading for PV Posts Area: Prior to placing any fills, the surface 12 inches of native clay/silt
soils shall be uniformly moisture conditioned to a minimum of 2% over optimum, and recompacted
to at least 90% of ASTM D1557 maximum density. Onsite native clays/silts placed as engineer
fill should be uniformly moisture conditioned by discing and wetting or drying to optimum plus 2
to 8% and compacted to a minimum of 90% relative compaction. Clods shall be reduced by discing
to a maximum dimension of 1.0 inch prior to being placed as fill.

Geotechnical Report of Vega SES Solar Facility SWC Wixom Road and Drew Road LCI Report No. LE18083
Landmark Consultants, Inc. Page 17
Building Support Pad Preparation The soil within the O&M building pad and substation switchgear
areas should be removed to 30 inches below the building pad elevation or existing natural surface
grade (whichever is lower) extending five feet beyond all exterior wall/column lines (including
concreted areas adjacent to the building). Exposed subgrade (silts/sandy silts) should be scarified
to a depth of 8 inches, uniformly moisture conditioned to 2 to 6% above optimum moisture content
and recompacted to 87 to 92% of the maximum density determined in accordance with ASTM
D1557 methods.
Prior to over-excavation of the surface soil, deep moisture penetration may be achieved by
bordering the site and applying multiple floodings or by sprinkler application to allow water to
permeate to a minimum depth of 3.0 feet (16% minimum moisture content) below existing natural
surface. Extended drying periods may be required when utilizing this method of pre-saturation.
The native soil is suitable for use as general fill provided it is free from concentrations of organic
matter or other deleterious material. However, special foundation designs are required when native
clays are used. The fill soil should be uniformly moisture conditioned by discing and watering to
the limits specified above, placed in maximum 8-inch lifts (loose), and compacted to the limits
specified above. Clay soil should not be overcompacted because highly compacted soil will result
in increased swelling. Imported fill soil (for foundations designed for expansive soil conditions)
should have a Plasticity Index less than 10 and sulfates (SO4) less than 500 ppm.
If foundation designs are to be utilized which do not include provisions for expansive soil
conditions, an engineered building support pad consisting of 2.0 feet of non-expansive granular
soil. The non-expansive, granular soil shall meet the USCS classifications of SM, SP-SM, or SW-
SM with a maximum rock size of 3 inches and 5 to 35% passing the No. 200 sieve. The
geotechnical engineer should approve imported fill soil sources before hauling material to the site.
Imported granular fill should be placed in lifts no greater than 8 inches in loose thickness and
compacted to a minimum of 90% of ASTM D1557 maximum dry density at optimum moisture
"2%.

Geotechnical Report of Vega SES Solar Facility SWC Wixom Road and Drew Road LCI Report No. LE18083
Landmark Consultants, Inc. Page 18
In areas other than the building pad which are to receive sidewalks or area concrete slabs, the
ground surface should be presaturated to a minimum depth of 24 inches and then scarified to 8
inches, moisture conditioned to a minimum of 2% over optimum, and recompacted to 85-90% of
ASTM D1557 maximum density just prior to concrete placement.
Subgrade Preparation for Mat Foundations at Inverters: The native clay/silt soil within the mat
foundation excavations should be removed to 12 inches below the bottom of the mat foundations
to 2 feet beyond the edges of the foundation. Exposed subgrade should be scarified to a depth of
12 inches, uniformly moisture conditioned to a minimum of 2% above optimum moisture content,
and recompacted to a minimum of 90% of the maximum density determined in accordance with
ASTM D1557 methods.
A 12 inch layer of Caltrans Class 2 aggregate base, compacted in maximum 6 inch lifts to at least
95% of ASTM D1557 maximum density at 2% below to 4% above optimum moisture, shall be
placed over the compacted subgrade prior to placing mat foundations. Design soil pressure = 2,000
psf.
10,000 Gallon Water Tank Foundation Subgrade Preparation: The native clay/silt soil within the
water tank pad excavations should be removed to 12 inches below the bottom of the mat foundation
to 2 feet beyond the edges of the foundation. Exposed subgrade should be scarified to a depth of
12 inches, uniformly moisture conditioned to a minimum of 2% above optimum moisture content,
and recompacted to a minimum of 90% of the maximum density determined in accordance with
ASTM D1557 methods. The water tank mat foundation should be underlain with a minimum of
12 inches of Class 2 aggregate base, compacted in maximum 6 inch lifts to at least 95% of ASTM
D1557 maximum density at 2% below to 4% above optimum moisture. Design soil pressure =
2,000 psf.
Observation and Density Testing: All site preparation and fill placement should be continuously
observed and tested by a representative of a qualified geotechnical engineering firm. Full-time
observation services during the excavation and scarification process is necessary to detect
undesirable materials or conditions and soft areas that may be encountered in the construction area.

Geotechnical Report of Vega SES Solar Facility SWC Wixom Road and Drew Road LCI Report No. LE18083
Landmark Consultants, Inc. Page 19
The geotechnical firm that provides observation and testing during construction shall assume the
responsibility of "geotechnical engineer of record" and, as such, shall perform additional tests and
investigation as necessary to satisfy themselves as to the site conditions and the geotechnical
parameters for site development.
4.2 Utility Trench Backfill
Utility Trench Backfill: Trench backfill for utilities should conform to San Diego Regional
Standard Drawing S-4 (Appendix F), using either Type A, B or C backfill.
Type A backfill for HDPE pipe (above groundwater) consists of a 4 to 6 inch bed of ¾-inch crushed
rock below the pipe and pipezone backfill (to 12” above top of pipe) consisting of crusher fines
(sand). Sewer pipes (SDR-35), water mains, and stormdrain pipes of other than HDPE pipe may
use crusher fines for bedding. The crusher fines shall be compacted to a minimum of 95% of
ASTM D1557 maximum density. Pipe deflection should be checked to not exceed 2% of pipe
diameter. Native clay/silt soils may be used to backfill the remainder of the trench. Soils used for
trench backfill shall be compacted to a minimum of 90% of ASTM D1557 maximum density.
Type B backfill for HDPE pipe (shallow cover) requires 6 inches of ¾-inch crushed rock as
bedding and to springline of the pipe. Thereafter, sand/cement slurry (3 sack cement factor) should
be used to 12 inches above the top of the pipe. Native clay and silt soils may be used in the
remainder of the trench backfill as specified above.
Type C backfill for HDPE pipe (below or partially below groundwater) shall consist of a geotextile
filter fabric encapsulating ¾-inch crushed rock. The crushed rock thickness shall be 6 inches
below and to the sides of the pipe and shall extend to 12 inches above the top of the pipe. The
filter fabric shall cover the trench bottom, sidewalls and over the top of the crushed rock. Native
clay and silt soils may be used in the remainder of the trench backfill as specified above.
Type C backfill must be used in wet soils and below groundwater for all buried utility
pipelines. When excavations are planned below groundwater, dewatering (by well points) is
required to at least 24 inches below the trench bottom prior to excavation. Type A backfill
may be used in the case of a dewatered trench condition in clay soils only.

Geotechnical Report of Vega SES Solar Facility SWC Wixom Road and Drew Road LCI Report No. LE18083
Landmark Consultants, Inc. Page 20
On-site soil free of debris, vegetation, and other deleterious matter may be suitable for use as utility
trench backfill above pipezone, but may be difficult to uniformly maintain at specified moistures
and compact to the specified densities. Native backfill should only be placed and compacted after
encapsulating buried pipes with suitable bedding and pipe envelope material.
Imported granular material is acceptable for backfill of utility trenches. Granular trench backfill
used in native clay building pad areas should be plugged with a solid (no clods or voids) 2-foot
width of native clay soils at each end of the building foundation to prevent landscape water
migration into the trench below the building.
Backfill soil of utility trenches within paved areas should be uniformly moisture conditioned to a
minimum of 4% above optimum moisture, placed in layers not more than 6 inches in thickness
and mechanically compacted to a minimum of 90% of the ASTM D1557 maximum dry density,
except that the top 12 inches shall be compacted to 95% (if granular trench backfill).
4.3 Foundations and Settlements (Mats, Grade-beam Reinforced Slabs, Drilled Piers, Steel Posts)
Shallow spread footings in clay/silt soils are suitable to support the O&M Building provided they
are structurally tied with grade-beams to continuous perimeter wall footings to resist differential
movement associated with expansive soils. The foundations may be designed using an allowable
soil bearing pressure of 1,500 psf for compacted native clay or silt soil and 2,500 psf when
foundations are supported on imported sands (extending a minimum of 1.5 feet below footings).
The allowable soil pressure may be increased by 20% for each foot of embedment depth of the
footings in excess of 18 inches and by one-third for short term loads induced by winds or seismic
events. The maximum allowable soil pressure at increased embedment depths shall not exceed
3,000 psf (clays).
As an alternative to shallow spread foundations, flat plate structural mats or grade-beam reinforced
foundations may be used to mitigate expansive soil heave related movement.

Geotechnical Report of Vega SES Solar Facility SWC Wixom Road and Drew Road LCI Report No. LE18083
Landmark Consultants, Inc. Page 21
Flat Plate Structural Mats: Structural concrete mat foundations may be designed using an
allowable soil bearing pressure of 2,000 psf when the foundation is supported on 12 inches of
compacted Class 2 aggregate base. The allowable soil pressure may be increased by one-third for
short term loads induced by winds or seismic events. Design criteria for mat foundations are
provided below. The structural mat shall have a double mat of steel and a minimum thickness of
12 inches, except that inverters and 10,000-gallon water tank slabs may be 8 inches thick.
Structural mats may be designed for a modulus of subgrade reaction (Ks) of 150 pci when placed
on 12 inches of compacted Class 2 aggregate base. An allowable friction coefficient of 0.35 may
also be used at the base of the mat to resist lateral sliding.
Resistance to horizontal loads will be developed by passive earth pressure on the sides of footings
and frictional resistance developed along the base of footings. Passive resistance to lateral earth
pressure may be calculated using an equivalent fluid pressure of 250 pcf to resist lateral loadings.
An allowable friction coefficient of 0.35 may also be used at the base of the footings to resist
lateral sliding.
Grade-beam Reinforced Foundations: Specific soil data for building structures with grade-beam
reinforced foundations placed on the native clays (without replacement of the surface clays with
2.0 feet of granular fill) are presented below in accordance with the design method given in CBC
Chapter 18 Section 1808A.6.2 (WRI/CRSI Design of Slab-on-Ground Foundations):
Weighted Plasticity Index (PI) = 10 Slope Coefficient (Cs) = 1.0 Strength Coefficient (Co) = 0.8 Climatic Rating (Cw) = 15 Effective PI = 8 Maximum Grade-beam Spacing = 25 feet
All exterior footings in clay soils should be embedded a minimum of 24 inches (18 inches for silt
and sand sites) below the building support pad or lowest adjacent final grade, whichever is deeper.
Minimum embedment depth of interior should be at least 12 inches into the building support pad
to account for variable environmental conditions.

Geotechnical Report of Vega SES Solar Facility SWC Wixom Road and Drew Road LCI Report No. LE18083
Landmark Consultants, Inc. Page 22
Interior and exterior embedment depths listed herein are minimum depths and greater
depths/widths may be required by the structural engineer/designer and should be sufficient to limit
differential movement to L/480 for center lift and L/720 for edge lift to comply with the current
standards. Continuous wall footings should have a minimum width of 12 inches. Spread footings
should have a minimum dimension of 24 inches and should be structurally tied to perimeter
footings or grade beams. Concrete reinforcement and sizing for all footings should be provided
by the structural engineer.
Resistance to horizontal loads will be developed by passive earth pressure on the sides of footings
and frictional resistance developed along the bases of footings and concrete slabs. Passive
resistance to lateral earth pressure may be calculated using an equivalent fluid pressure of 250 pcf
(300 pcf for imported sands) to resist lateral loadings. The top one foot of embedment should not
be considered in computing passive resistance unless the adjacent area is confined by a slab or
pavement. An allowable friction coefficient of 0.25 (0.35 for imported sands) may also be used at
the base of the footings to resist lateral loading.
Foundation movement under the estimated static (non-seismic) loadings and static site conditions
are estimated to not exceed 1 inch with differential movement of about two-thirds of total
movement for the loading assumptions stated above when the subgrade preparation guidelines
given above are followed. Seismically induced liquefaction settlement of the surrounding land
mass and structure may be on the order of ¾ inch (total) and ½ inch (differential).
Non-Constrained Drilled Pier Foundations: Individual short piers should be adequate to
support the light, security camera poles and other electrical switchyard elements. Embedment
depth for short piers to resist lateral loads where no constraint is provided at ground surface may
be designed using the following formula per 2016 CBC Section 1807.3.2.1:
d = A/2 [1 + (1+4.36h/A)½]
where: A = 2.34P/S1b. b = Pier diameter in feet. d = Embedment depth in feet (not over 12 feet for purpose of computing lateral pressure). h = Distance in feet from ground surface to point of application of “P”. P = Applied lateral force in pounds. S1 = Allowable lateral soil bearing pressure (basic value of 100 psf, (Table 1806.2 for Class 5 soil and Section
1806). Isolated piers such solar panel short piers that are not adversely affected by a 0.5 inch motion at the ground surface due to short-term lateral loads are permitted to be designed using lateral soil bearing pressures equal to two times the basic value.

Geotechnical Report of Vega SES Solar Facility SWC Wixom Road and Drew Road LCI Report No. LE18083
Landmark Consultants, Inc. Page 23
The vertical load capacity of short pier foundations may be designed using an allowable downward
soil bearing pressure of 1,500 psf.
Installation: Excavation for piers should be inspected by the geotechnical consultant. A tremie
pipe should be used to pour concrete from the bottom up and to ensure less than five feet of free
fall. Groundwater is expected to be encountered at approximately 6 to 8 feet below ground surface.
The structural steel and concrete should be placed immediately after drilling. Prior to placing any
structural steel or concrete, loose soil or slough material should be removed from the bottom of
the drilled pier excavation.
Driven Steel Posts: The use of driven steel posts requires special provisions for corrosion protection
due to the corrosive nature of the subsurface soils. Steel posts for PV panel mounting frames have
been preliminary sized as W6x7 (frame and axle supports) or W6x15 steel sections (gearbox
columns). Due to soil stratigraphy encountered during the soil exploration, the site was divided into
two (2) areas for computing the vertical and lateral capacities of W-pile shapes. The area on the
northwest side with surface clay soils is congregated by CPT’s-1, 2, 5, 6, 7 and 9, and the area with
predominant sandy soils is located to the southeast side of the project encompassing CPT’s-3, 4, 8,
10, 11, 12, 13, 14, 15 and 16. The specified tip elevation (5, 6 and 8 feet) and allowable vertical and
lateral capacities for typical driven steel W-pile shapes are provided in Tables 4, 5, 6 and 7.
Vertical Capacity: End bearing and skin friction parameters have been used to determine the
allowable shaft capacity. The allowable capacities include a factor of safety of 2.5. The allowable
vertical compression capacities may be increased by 33 percent to accommodate temporary loads
from wind or seismic forces. The allowable vertical shaft capacities are based on the supporting
capacity of the soil.
Lateral Capacity: The allowable lateral capacity for the preliminary steel sections (W6x7 and
W6x15) at 5, 6 and 8 feet embedment depths are given in Tables 4, 5, 6 and 7. The allowable
lateral capacity is based on a deflection of one-half inch at the top of the steel post section. If
greater deflection can be tolerated, lateral load capacity can be increased directly in proportion to
a maximum of one inch deflection. Axial and lateral loads were applied at 4.0 feet above ground
surface.

Geotechnical Report of Vega SES Solar Facility SWC Wixom Road and Drew Road LCI Report No. LE18083
Landmark Consultants, Inc. Page 24
Table 4: Allowable Capacities of Driven Steel Posts (Frame Supports)
Northwest Area (CPT’s – 1, 2, 5, 6, 7 and 9)
Pile Type: Driven W6x7
Pile Length (ft): 9 feet 10 feet 12 feet
Specified Tip Depth (ft): 5 feet 6 feet 8 feet
Height Above Ground (ft): 4 feet 4 feet 4 feet
Allowable Axial Capacity (kips) – FS=2.5: 3.30 4.12 4.64
Allowable Uplift Capacity (kips) – FS=2.5: 3.28 4.00 4.27
Lateral Load – Free Head Condition (kips): 1.00 1.22 1.36
Top Deflection (in) – Free Head Condition 1.00 1.00 1.00
Maximum Moment from Lateral Load,
Free Head Condition (ft-kips): 4.54 5.95 6.82
Depth of Maximum Moment (from Top of Post),
Free Head (ft): 5.0 5.4 5.5

Geotechnical Report of Vega SES Solar Facility SWC Wixom Road and Drew Road LCI Report No. LE18083
Landmark Consultants, Inc. Page 25
Table 5: Allowable Capacities of Driven Steel Posts (Frame Supports)
Southeast Area (CPT’s – 3, 4, 8, 10, 12, 13, 14, 15 and 16)
Pile Type: Driven W6x7
Pile Length (ft): 9 feet 10 feet 12 feet
Specified Tip Depth (ft): 5 feet 6 feet 8 feet
Height Above Ground (ft): 4 feet 4 feet 4 feet
Allowable Axial Capacity (kips) – FS=2.5: 1.64 2.85 5.57
Allowable Uplift Capacity (kips) – FS=2.5: 1.20 2.20 4.15
Lateral Load – Free Head Condition (kips): 0.60 0.85 1.20
Top Deflection (in) – Free Head Condition 1.00 1.00 1.00
Maximum Moment from Lateral Load,
Free Head Condition (ft-kips): 2.93 4.57 6.66
Depth of Maximum Moment (from Top of Post),
Free Head (ft): 5.5 5.8 6.1

Geotechnical Report of Vega SES Solar Facility SWC Wixom Road and Drew Road LCI Report No. LE18083
Landmark Consultants, Inc. Page 26
Table 6: Allowable Capacities of Driven Steel Posts (Motor Supports)
Northwest Area (CPT’s – 1, 2, 5, 6, 7 and 9)
Pile Type: Driven W6x15
Pile Length (ft): 12 feet
Specified Tip Depth (ft): 8 feet
Height Above Ground (ft): 4 feet
Allowable Axial Capacity (kips) – FS=2.5: 5.21
Allowable Uplift Capacity (kips) – FS=2.5: 4.52
Lateral Load – Free Head Condition (kips): 2.43
Top Deflection (in) – Free Head Condition 1.00
Maximum Moment from Lateral Load,
Free Head Condition (ft-kips): 12.58
Depth of Maximum Moment(from Top of Post),
Free Head (ft): 6.0

Geotechnical Report of Vega SES Solar Facility SWC Wixom Road and Drew Road LCI Report No. LE18083
Landmark Consultants, Inc. Page 27
Table 7: Allowable Capacities of Driven Steel Posts (Motor Supports)
Southeast Area (CPT’s – 3, 4, 8, 10, 12, 13, 14, 15 and 16)
Pile Type: Driven W6x15
Pile Length (ft): 12 feet
Specified Tip Depth (ft): 8 feet
Height Above Ground (ft): 4 feet
Allowable Axial Capacity (kips) – FS=2.5: 6.32
Allowable Uplift Capacity (kips) – FS=2.5: 4.38
Lateral Load – Free Head Condition (kips): 2.1
Top Deflection (in) – Free Head Condition 1.00
Maximum Moment from Lateral Load,
Free Head Condition (ft-kips): 11.83
Depth of Maximum Moment(from Top of Post),
Free Head (ft): 6.4
Design criteria for other steel shapes and sizes can be made available upon request. The top six
inches of post embedment should not be considered in computing axial and lateral design.
Geotechnical Report of Vega SES Solar Facility SWC Wixom Road and Drew Road LCI Report No. LE18083
Landmark Consultants, Inc. Page 28
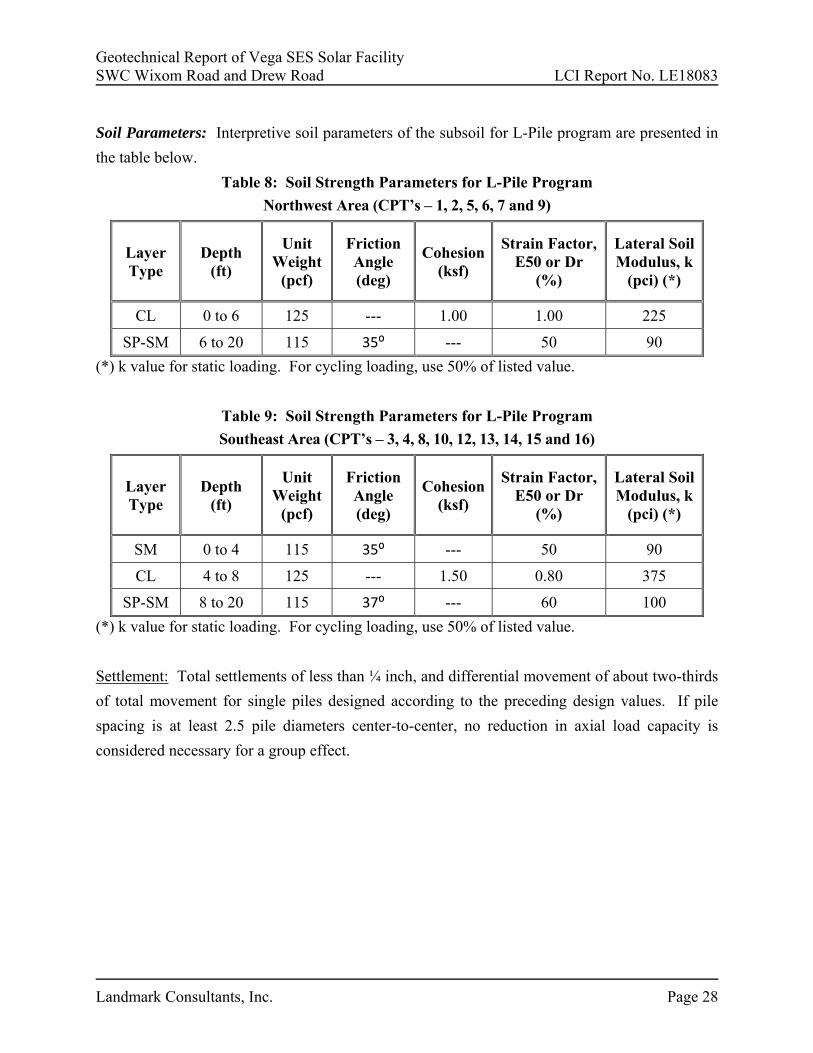
Soil Parameters: Interpretive soil parameters of the subsoil for L-Pile program are presented in
the table below.
Table 8: Soil Strength Parameters for L-Pile Program
Northwest Area (CPT’s – 1, 2, 5, 6, 7 and 9)
Layer Type
Depth (ft)
Unit Weight
(pcf)
Friction Angle (deg)
Cohesion (ksf)
Strain Factor, E50 or Dr
(%)
Lateral Soil Modulus, k
(pci) (*)
CL 0 to 6 125 --- 1.00 1.00 225
SP-SM 6 to 20 115 35⁰ --- 50 90
(*) k value for static loading. For cycling loading, use 50% of listed value.
Table 9: Soil Strength Parameters for L-Pile Program
Southeast Area (CPT’s – 3, 4, 8, 10, 12, 13, 14, 15 and 16)
Layer Type
Depth (ft)
Unit Weight
(pcf)
Friction Angle (deg)
Cohesion (ksf)
Strain Factor, E50 or Dr
(%)
Lateral Soil Modulus, k
(pci) (*)
SM 0 to 4 115 35⁰ --- 50 90
CL 4 to 8 125 --- 1.50 0.80 375
SP-SM 8 to 20 115 37⁰ --- 60 100
(*) k value for static loading. For cycling loading, use 50% of listed value.
Settlement: Total settlements of less than ¼ inch, and differential movement of about two-thirds
of total movement for single piles designed according to the preceding design values. If pile
spacing is at least 2.5 pile diameters center-to-center, no reduction in axial load capacity is
considered necessary for a group effect.

Geotechnical Report of Vega SES Solar Facility SWC Wixom Road and Drew Road LCI Report No. LE18083
Landmark Consultants, Inc. Page 29
Drilled Pier Foundations: The switch stands, bus supports and dead end frames may be
supported on cast-in-place, drilled piers.
Vertical Capacity: Vertical capacity for 18 and 24 inch diameter shafts are presented in Figure 4.
Capacities for other shaft sizes can be determined in direct proportion to shaft diameters. Point
bearing and skin friction parameters have been used to determine the allowable shaft capacity.
The allowable capacities include a factor of safety of 2.5. The allowable vertical compression
capacities may be increased by 33 percent to accommodate temporary loads that result from wind
or seismic forces.
Lateral Capacity: The allowable lateral capacity for 18 and 24 inch diameter shafts are given in
the table shown below. The horizontal deflection at the top of the drilled pier for the lateral loads
indicated is one-half inch (0.50 inch).
Table 10: Lateral Capacities of Drilled Piers
Shaft Diameter (in.) 18 24
Head Condition Free Fixed Free Fixed
Allowable Head Deflection (in.) 0.5 0.5 0.5 0.5
Minimum Length (ft.) 5 5 5 5
Lateral Capacity (kips) 4.7 16.0 5.6 18.5
Maximum Moment (foot-kips) 4.88 -43.6 5.7 -49.8
@Depth from Pier Head (ft.) 2.0 0 2.0 0
Minimum Length (ft.) 10 10 10 10
Lateral Capacity (kips) 11.4 32.5 13.0 45.0
Maximum Moment (foot-kips) 25.2 -168.3 27.9 -255.8
@Depth from Pier Head (ft.) 4.0 0 4.0 0
Minimum Length (ft.) 15 15 15 15
Lateral Capacity (kips) 18.0 35.6 23.0 53.0
Maximum Moment (foot-kips) 59.9 -164.2 81.0 -339.2
@Depth from Pier Head (ft.) 6.2 0 6.8 0
Minimum Length (ft.) 20 20 20 20
Lateral Capacity (kips) 18.7 39.7 29.0 62.0
Maximum Moment (foot-kips) 65.0 -180.0 127.5 -360.8
@Depth from Pier Head (ft.) 6.7 0 8.6 0

Geotechnical Report of Vega SES Solar Facility SWC Wixom Road and Drew Road LCI Report No. LE18083
Landmark Consultants, Inc. Page 30
Settlement: Total static (non-seismic) settlements of less than ¼ inch are anticipated for single
piles designed according to the preceding design values. If pile spacing is a least 2.5 pile diameters
center-to-center, no reduction in axial load capacity is considered necessary for a group effect.
Uplift Capacity: Pier capacity in tension should be taken as 50% of the compression capacity.
Soil Parameters for Drilled Piers: Interpretive soil parameters of the subsurface soil for use with
L-Pile software are provided in the table below:
TABLE 11: Drilled Pier Soil Parameters
Layer Type
Depth (ft)
Unit Weight
(pcf)
Friction Angle (deg)
Cohesion (ksf)
Strain Factor, E50 or Dr
(%)
Lateral Soil Modulus, k
(pci) (*)
CL 0 to 8 125 --- 1.00 1.00 225
ML 8 to 12 120 24⁰ 0.30 0.85 300
CL-CH 12 to 21 125 --- 1.50 0.75 400
SM 21 to 28 115 37° --- 60.0 100
CL-CH 28 to 50 125 --- 1.75 0.65 500
Installation: The drilled piers shall be placed in conformance to ACI 336 guidelines. Excavation
for piers should be inspected by the geotechnical consultant. A tremie pipe should be used to pour
concrete from the bottom up and to ensure less than five feet of free fall. All drilled piers shall be
cased below groundwater depth to prevent caving or lateral deformation. Groundwater is expected
to be encountered at 8 feet below ground surface. The structural steel and concrete should be
placed immediately after drilling. Prior to placing any structural steel or concrete, loose soil or
slough material should be removed from the bottom of the drilled pier excavation.

Geotechnical Report of Vega SES Solar Facility SWC Wixom Road and Drew Road LCI Report No. LE18083
Landmark Consultants, Inc. Page 31
4.4 Slabs-On-Grade
Structural Concrete: Concrete slabs placed over native clay soil should be designed in accordance
with Chapter 18 of the 2016 CBC and shall be a minimum of 5 inches thick due to expansive soil
conditions (minimum 6-inch thick where the slab is subjected to wheel loads). Concrete floor
slabs shall be monolithically placed with the footings (no cold joints) unless placed on 2.0 feet of
granular fill soil.
American Concrete Institute (ACI) guidelines (ACI 302.1R-04 Chapter 3, Section 3.2.3) provide
recommendations regarding the use of moisture barriers beneath concrete slabs. The concrete floor
slabs should be underlain by a 10-mil polyethylene vapor retarder that works as a capillary break
to reduce moisture migration into the slab section. All laps and seams should be overlapped 6-
inches or as recommended by the manufacturer. The vapor retarder should be protected from
puncture.
The joints and penetrations should be sealed with the manufacturer’s recommended adhesive,
pressure-sensitive tape, or both. The vapor retarder should extend a minimum of 12 inches into
the footing excavations. The vapor retarder should be covered by 4 inches of clean sand (Sand
Equivalent SE>30) unless placed on 2.0 feet of granular fill, in which case, the vapor retarder may
lie directly on the granular fill with 2 inches of clean sand cover.
For areas with moisture sensitive flooring materials, ACI recommends that concrete slabs be
placed without a sand cover directly over the vapor retarder, provided that the concrete mix uses a
low-water cement ratio and concrete curing methods are employed to compensate for release of
bleed water through the top of the slab. The vapor retarder should have a minimum thickness of
15-mil (Stego-Wrap or equivalent).
Structural concrete slab reinforcement should consist of chaired rebar slab reinforcement
(minimum of No. 3 bars at 16-inch centers, both horizontal directions) placed at slab mid-height
to resist potential swell forces and cracking. Slab thickness and steel reinforcement are minimums
only and should be verified by the structural engineer/designer knowing the actual project
loadings. All steel components of the foundation system should be protected from corrosion by
maintaining a 3-inch (4-inch near Wixom Road) minimum concrete cover of densely consolidated
concrete at footings (by use of a vibrator).

Geotechnical Report of Vega SES Solar Facility SWC Wixom Road and Drew Road LCI Report No. LE18083
Landmark Consultants, Inc. Page 32
The construction joint between the foundation and any mowstrips/sidewalks placed adjacent to
foundations should be sealed with a polyurethane based non-hardening sealant to prevent moisture
migration between the joint. Epoxy coated embedded steel components (ASTM D3963/A934) or
permanent waterproofing membranes placed at the exterior footing sidewall may also be used to
mitigate the corrosion potential of concrete placed in contact with native soil.
Control joints should be provided in all concrete slabs-on-grade at a maximum spacing (in feet) of
2 to 3 times the slab thickness (in inches) as recommended by American Concrete Institute (ACI)
guidelines. All joints should form approximately square patterns to reduce randomly oriented
contraction cracks. Contraction joints in the slabs should be tooled at the time of the pour or
sawcut (¼ of slab depth) within 6 to 8 hours of concrete placement. Construction (cold) joints in
foundations and area flatwork should either be thickened butt-joints with dowels or a thickened
keyed-joint designed to resist vertical deflection at the joint. All joints in flatwork should be sealed
to prevent moisture, vermin, or foreign material intrusion. Precautions should be taken to prevent
curling of slabs in this arid desert region (refer to ACI guidelines).
Non-structural Concrete: All non-structural independent flatwork (sidewalks and uncovered area
slabs) shall be a minimum of 4 inches thick and should be placed on a minimum of 4 inches of
aggregate base compacted to 90%, dowelled to the perimeter foundations where adjacent to the
building to prevent separation and sloped 2% (sidewalks) or 1 to 2% (housekeeping slabs) away
from the building.
A minimum of 24 inches of moisture conditioned (2% minimum above optimum) and 8 inches of
compacted subgrade (87 to 92%) should underlie all independent flatwork. Flatwork which
contains steel reinforcing (except wire mesh) should be underlain by a 15-mil (minimum)
polyethylene separation sheet and at least 4-inches of Class 2 aggregate base. All flatwork should
be jointed in square patterns and at irregularities in shape at a maximum spacing of 8 feet or the
least width of the sidewalk.

Geotechnical Report of Vega SES Solar Facility SWC Wixom Road and Drew Road LCI Report No. LE18083
Landmark Consultants, Inc. Page 33
4.5 Concrete Mixes and Corrosivity
Selected chemical analyses for corrosivity were conducted on bulk samples of the near surface soil
from the project site (Plates C12 and C-13). The native soils were found to have low to to severe
levels of sulfate ion concentration (550 to 8,550 ppm). Sulfate ions in high concentrations can
attack the cementitious material in concrete, causing weakening of the cement matrix and eventual
deterioration by raveling. The following table provides American Concrete Institute (ACI)
recommended cement types, water-cement ratio and minimum compressive strengths for concrete
in contact with soils:
Table 12. Concrete Mix Design Criteria due to Soluble Sulfate Exposure
Sulfate
Exposure
Water-soluble Sulfate
(SO4) in soil, ppm
Cement
Type
Maximum Water-
Cement Ratio by weight
Minimum
Strength
f’c (psi)
Negligible 0-1,000 – – –
Moderate 1,000-2,000 II 0.50 4,000
Severe 2,000-20,000 V 0.45 4,500
Very Severe Over 20,000 V (plus
Pozzolon) 0.45 4,500
Note: from ACI 318-11 Table 4.2.1
A minimum of 6.0 sacks (6.5 sacks near Wixom Road) per cubic yard of concrete (4,500 psi) of
Type V Portland Cement with a maximum water/cement ratio of 0.45 (by weight) should be used
for concrete placed in contact with native soil on this project (sitework including sidewalks,
housekeeping slabs, and foundations). Admixtures may be required to allow placement of this low
water/cement ratio concrete.
The native soil has low to severe levels of chloride ion concentration (90 to 1,180 ppm). Chloride
ions can cause corrosion of reinforcing steel, anchor bolts and other buried metallic conduits.
Resistivity determinations on the soil indicate very severe potential for metal loss because of
electrochemical corrosion processes. Mitigation of the corrosion of steel can be achieved by using
steel pipes coated with epoxy corrosion inhibitors, asphaltic and epoxy coatings, cathodic
protection or by encapsulating the portion of the pipe lying above groundwater with a minimum
of 3 inches of densely consolidated concrete.

Geotechnical Report of Vega SES Solar Facility SWC Wixom Road and Drew Road LCI Report No. LE18083
Landmark Consultants, Inc. Page 34
Foundation designs shall provide a minimum concrete cover of three (3) inches around steel
reinforcing or embedded components (anchor bolts, etc.) exposed to native soil (4 inch cover near
Wixom Road). If the 3-inch (4-inch near Wixom Road) concrete edge distance cannot be achieved,
all embedded steel components (anchor bolts, etc.) shall be epoxy coated for corrosion protection
(in accordance with ASTM D3963/A934) or a corrosion inhibitor and a permanent waterproofing
membrane shall be placed along the exterior face of the exterior footings. Additionally, the
concrete should be thoroughly vibrated at footings during placement to decrease the permeability
of the concrete.
4.6 Excavations
All site excavations should conform to CalOSHA requirements for Type B soil. The contractor is
solely responsible for the safety of workers entering trenches. Temporary excavations with depths
of 4 feet or less may be no steeper than 1:1 (horizontal:vertical). Sandy soil slopes should be kept
moist, but not saturated, to reduce the potential of raveling or sloughing. Excavations will require
slope inclinations in conformance to CAL/OSHA regulations for Type B soil.
Surcharge loads of stockpiled soil or construction materials should be set back from the top of the
slope a minimum distance equal to the height of the slope. All permanent slopes should not be
steeper than 3:1 to reduce wind and rain erosion. Protected slopes with ground cover may be as
steep as 2:1. However, maintenance with motorized equipment may not be possible at this
inclination.
4.7 Seismic Design
This site is located in the seismically active southern California area and the site structures are
subject to strong ground shaking due to potential fault movements along the Laguna Salada,
Superstition Hills, and Imperial Faults. Engineered design and earthquake-resistant construction
are the common solutions to increase safety and development of seismic areas. Designs should
comply with the latest edition of the CBC for Site Class D using the seismic coefficients given in
Section 3.6 and Table 2 of this report.

Geotechnical Report of Vega SES Solar Facility SWC Wixom Road and Drew Road LCI Report No. LE18083
Landmark Consultants, Inc. Page 35
4.8 All-Weather Roadways and Construction Laydown Areas
All-weather accessways for Emergency Vehicles and construction laydown areas should consist
of 6 inches of Caltrans Class 2 aggregate base (compacted to 90% minimum of ASTM D1557
maximum density) placed over 12 inches of compacted (90% minimum of ASTM D1157 at
minimum of 2% above optimum moisture) native clay subgrade soil.
4.9 Soil Erosion Factors for SWPPP Plans
The site soils near Wixom Road are classified as heavy clays with greater than 50% clay fraction
soil particles (10% sand, 40% silt, and 50% clay) and sandy silts (60% silt and 40% sand) in the
remaining areas of the project site. Groundwater can be expected at a depth of 8 to 10 feet below
ground surface.
4.10 Pavements
Pavements should be designed according to the 2012 Caltrans Highway Design Manual or other
acceptable methods. Traffic indices were not provided by the project engineer or owner; therefore,
we have provided structural sections for several traffic indices for comparative evaluation. The
public agency or design engineer should decide the appropriate traffic index for the site.
Maintenance of proper drainage is necessary to prolong the service life of the pavements.
Based on the current Caltrans method, an R-value of 5 for the clay subgrade soil and an R-value
of 25 for silt subgrade and assumed traffic indices, the following table provides our estimates for
asphaltic concrete (AC) and Portland Cement Concrete (PCC) pavement sections.

Geotechnical Report of Vega SES Solar Facility SWC Wixom Road and Drew Road LCI Report No. LE18083
Landmark Consultants, Inc. Page 36
Table 13. Pavement Structural Sections (clays)
R-Value of Subgrade Soil - 5 (estimated) Design Method - Caltrans 2012
Flexible Pavements Rigid (PCC) Pavements
Traffic Index
(assumed)
Asphaltic Concrete
Thickness (in.)
Aggregate Base
Thickness (in.)
Concrete Thickness (in.)
Aggregate Base
Thickness (in.)
4.0 3.0 6.5 5.0 6.0
5.0 3.0 10.0 5.5 6.0
6.0 4.0 11.5 6.0 8.0
6.5 4.0 14.0 7.0 8.0
8.0 5.0 17.5 8.0 11.0
Table 14. Pavement Structural Sections (silts/sands)
R-Value of Subgrade Soil - 25 (estimated) Design Method - Caltrans 2012
Flexible Pavements Rigid (PCC) Pavements
Traffic Index
(assumed)
Asphaltic Concrete
Thickness (in.)
Aggregate Base
Thickness (in.)
Concrete Thickness (in.)
Aggregate Base
Thickness (in.)
4.0 3.0 6.0 5.0 4.0
5.0 3.0 7.0 5.5 4.0
6.0 3.0 10.0 6.0 6.0
6.5 4.0 10.0 7.0 6.0
8.0 4.0 5.0 8.0 9.0
Notes:
1) Asphaltic concrete shall be Caltrans, Type B, ¾ inch maximum (½ inch maximum for parking areas), medium grading with PG70-10 asphalt cement (PS64-16 for parking lot areas), compacted to a minimum of 95% of the Hveem density (CAL 366).
2) Aggregate base shall conform to Caltrans Class 2 (¾ in. maximum), compacted to a minimum of 95% of ASTM D1557 maximum dry density.
3) Place pavements on 12 inches of moisture conditioned (minimum 4% above optimum if clays) native clay soil compacted to a minimum of 90% of the maximum dry density (ASTM D1557).
4) Portland cement concrete for pavements should have Type V cement, a minimum compressive strength of 4,500 psi at 28 days, and a maximum water-cement ratio of 0.45.
5) Typical Street Classifications (Imperial County). Parking Areas: TI = 4.0 Cul-de-Sacs: TI = 5.0 Local Streets: TI = 6.0 Minor Collectors: TI = 6.5 Major Collectors: TI = 8.0

Geotechnical Report of Vega SES Solar Facility SWC Wixom Road and Drew Road LCI Report No. LE18083
Landmark Consultants, Inc. Page 37
Section 5 LIMITATIONS AND ADDITIONAL SERVICES
5.1 Limitations
The findings and professional opinions within this report are based on current information
regarding the proposed Vega SES photo-voltaic solar power generation facility situated on the
approximately 530-acre site located southwest of the intersection of Wixom Road and Drew Road
approximately 7 miles southwest of El Centro, California. The conclusions and professional
opinions of this report are invalid if:
< Structural loads change from those stated or the structures are relocated. < The Additional Services section of this report is not followed. < This report is used for adjacent or other property. < Changes of grade or groundwater occur between the issuance of this report and
construction other than those anticipated in this report. < Any other change that materially alters the project from that proposed at the time this report
was prepared.
Findings and professional opinions in this report are based on selected points of field exploration,
geologic literature, laboratory testing, and our understanding of the proposed project. Our analysis
of data and professional opinions presented herein are based on the assumption that soil conditions
do not vary significantly from those found at specific exploratory locations. Variations in soil
conditions can exist between and beyond the exploration points or groundwater elevations may
change. If detected, these conditions may require additional studies, consultation, and possible
design revisions.
This report contains information that may be useful in the preparation of contract
specifications. However, the report is not worded is such a manner that we recommend its use
as a construction specification document without proper modification. The use of information
contained in this report for bidding purposes should be done at the contractor’s option and risk.
This report was prepared according to the generally accepted geotechnical engineering standards
of practice that existed in Imperial County at the time the report was prepared. No express or
implied warranties are made in connection with our services.

Geotechnical Report of Vega SES Solar Facility SWC Wixom Road and Drew Road LCI Report No. LE18083
Landmark Consultants, Inc. Page 38
This report should be considered invalid for periods after two years from the report date without a
review of the validity of the findings and professional opinions by our firm, because of potential
changes in the Geotechnical Engineering Standards of Practice.
The client has responsibility to see that all parties to the project including, designer, contractor,
and subcontractor are made aware of this entire report. The use of information contained in this
report for bidding purposes should be done at the contractor's option and risk.
5.2 Additional Services
We recommend that a qualified geotechnical consultant be retained to provide the tests and
observations services during construction. The geotechnical engineering firm providing such tests
and observations shall become the geotechnical engineer of record and assume responsibility for
the project.
The professional opinions presented in this report are based on the assumption that:
< Consultation during development of design and construction documents to check that the geotechnical professional opinions are appropriate for the proposed project and that the geotechnical professional opinions are properly interpreted and incorporated into the documents.
< Landmark Consultants will have the opportunity to review and comment on the plans and specifications for the project prior to the issuance of such for bidding.
< Observation, inspection, and testing by the geotechnical consultant of record during site clearing, grading, excavation, placement of fills, building pad and subgrade preparation, and backfilling of utility trenches.
< Observation of foundation excavations and reinforcing steel before concrete placement. < Other consultation as necessary during design and construction.
We emphasize our review of the project plans and specifications to check for compatibility with
our professional opinions and conclusions. Additional information concerning the scope and cost
of these services can be obtained from our office.

TABLES

Vega SES Solar Project -- El Centro, CA LCI Project No. LE18083
Table 1
Fault NameApproximate
Distance (miles)
Approximate Distance (km)
Maximum Moment
Magnitude (Mw)
Fault Length (km)
Slip Rate (mm/yr)
Unnamed 1* 2.9 4.7
Unnamed 2* 3.4 5.4
Yuha* 4.5 7.2
Shell Beds 8.2 13.1
Superstition Hills 8.3 13.3 6.6 23 ± 2 4 ± 2
Yuha Well * 8.8 14.0
Laguna Salada 10.0 16.0 7 67 ± 7 3.5 ± 1.5
Superstition Mountain 10.7 17.2 6.6 24 ± 2 5 ± 3
Vista de Anza* 11.5 18.4
Borrego (Mexico)* 12.1 19.4
Imperial 13.1 20.9 7 62 ± 6 20 ± 5
Brawley * 14.5 23.2
Painted Gorge Wash* 15.3 24.5
Ocotillo* 16.3 26.1
Rico * 17.6 28.2
Pescadores (Mexico)* 19.7 31.5
Elsinore - Coyote Mountain 20.1 32.1 6.8 39 ± 4 4 ± 2
Cerro Prieto * 20.9 33.4
Cucapah (Mexico)* 22.0 35.2
Elmore Ranch 22.7 36.4 6.6 29 ± 3 1 ± 0.5
San Jacinto - Borrego 26.4 42.2 6.6 29 ± 3 4 ± 2
San Andreas - Coachella 43.0 68.7 7.2 96 ± 10 25 ± 5
* Note: Faults not included in CGS database.
Summary of Characteristics of Closest Known Active Faults

Vega SES Solar Project -- El Centro, CA LCI Project No. LE18083
CBC ReferenceSoil Site Class: D Table 20.3-1
Latitude: 32.7295 NLongitude: -115.6926 W
Risk Category: ISeismic Design Category: D
Maximum Considered Earthquake (MCE) Ground Motion
Mapped MCER Short Period Spectral Response Ss 1.500 g Figure 1613.3.1(1)Mapped MCER 1 second Spectral Response S1 0.600 g Figure 1613.3.1(2)
Short Period (0.2 s) Site Coefficient Fa 1.00 Table 1613.3.3(1)Long Period (1.0 s) Site Coefficient Fv 1.50 Table 1613.3.3(2)
MCER Spectral Response Acceleration Parameter (0.2 s) SMS 1.500 g = Fa * Ss
MCER Spectral Response Acceleration Parameter (1.0 s) SM1 0.900 g = Fv * S1
Design Earthquake Ground Motion
Design Spectral Response Acceleration Parameter (0.2 s) SDS 1.000 g = 2/3*SMS
Design Spectral Response Acceleration Parameter (1.0 s) SD1 0.600 g = 2/3*SM1
Risk Coefficient at Short Periods (less than 0.2 s) CRS 1.124Risk Coefficient at Long Periods (greater than 1.0 s) CR1 1.097
TL 8.00 secTO 0.12 sec =0.2*SD1/SDS
TS 0.60 sec =SD1/SDS
Peak Ground Acceleration PGAM 0.50 g
Period Sa MCER Sa
T (sec) (g) (g)
0.00 0.40 0.60
0.12 1.00 1.50
0.60 1.00 1.50
0.70 0.86 1.29
0.80 0.75 1.13
0.90 0.67 1.00
1.00 0.60 0.90
1.10 0.55 0.82
1.20 0.50 0.75
1.20 0.50 0.75
1.40 0.43 0.64
1.50 0.40 0.60
1.75 0.34 0.51
2.00 0.30 0.45
2.20 0.27 0.41
2.40 0.25 0.38
2.60 0.23 0.35
2.80 0.21 0.32
3.00 0.20 0.30
3.50 0.17 0.26
4.00 0.15 0.23
ASCE Equation 11.8-1
Equation 16-40
ASCE Figure 22-12
Table 22016 California Building Code (CBC) and ASCE 7-10 Seismic Parameters
Equation 16-37Equation 16-38
Equation 16-39
ASCE Figure 22-17ASCE Figure 22-18
0.0
0.2
0.4
0.6
0.8
1.0
1.2
0.0 0.5 1.0 1.5 2.0 2.5 3.0 3.5 4.0
Sp
ectr
al A
ccel
erat
ion
, S
a (g
)
Period (sec)
Generalized Design Response Spectrum(ASCE 7-5 Section 11.4.5)
0.0
0.2
0.4
0.6
0.8
1.0
1.2
1.4
1.6
0.0 0.5 1.0 1.5 2.0 2.5 3.0 3.5 4.0
Sp
ectr
al A
ccel
erat
ion
, S
a (g
)
Period (sec)
MCER Response Spectra Design Response Spectra

FIGURES

Project No.: LE18083Regional Fault Map Figure 1
100 km
Source: California Geological Survey 2010 Fault Activity Map of Californiahttp://www.quake.ca.gov/gmaps/FAM/faultactivitymap.html#

Project No.: LE18083Map of Local Faults Figure 2
Source: California Geological Survey 2010 Fault Activity Map of Californiahttp://www.quake.ca.gov/gmaps/FAM/faultactivitymap.html#
Project Site

EXPLANATION
Fault traces on land are indicated by solid lines where well located, by dashed lines where approximately located or inferred, and by dotted lines where concealed by younger rocks or by lakes or bays. Fault traces are queried where continuation or existence is uncertain. Concealed faults in the Great Valley are based on maps of selected subsurface horizons, so locations shown are approximate and may indicate structural trend only. All offshore faults based on seismic reflection profile records are shown as solid lines where well defined, dashed where inferred, queried where uncertain.
FAULT CLASSIFICATION COLOR CODE(Indicating Recency of Movement)
Fault along which historic (last 200 years) displacement has occurred and is associated with one or more of the following:
(a) a recorded earthquake with surface rupture. (Also included are some well-defined surface breaks caused by ground shaking during earthquakes, e.g. extensive ground breakage, not on the White Wolf fault, caused by the Arvin-Tehachapi earthquake of 1952). The date of the associated earthquake is indicated. Where repeated surface ruptures on the same fault have occurred, only the date of the latest movement may be indicated, especially if earlier reports are not well documented as to location of ground breaks.
(b) fault creep slippage - slow ground displacement usually without accompanying earthquakes.
(c) displaced survey lines.
A triangle to the right or left of the date indicates termination point of observed surface displacement. Solid red triangle indicates known location of rupture termination point. Open black triangle indicates uncertain or estimated location of rupture termination point.
Date bracketed by triangles indicates local fault break.
No triangle by date indicates an intermediate point along fault break.
Fault that exhibits fault creep slippage. Hachures indicate linear extent of fault creep. Annotation (creep with leader) indicates representative locations where fault creep has been observed and recorded.
Square on fault indicates where fault creep slippage has occured that has been triggered by an earthquake on some other fault. Date of causative earthquake indicated. Squares to right and left of date indicate termi-nal points between which triggered creep slippage has occurred (creep either continuous or intermittent between these end points).
Holocene fault displacement (during past 11,700 years) without historic record. Geomorphic evidence for Holocene faulting includes sag ponds, scarps showing little erosion, or the following features in Holocene age deposits: offset stream courses, linear scarps, shutter ridges, and triangular faceted spurs. Recency of faulting offshore is based on the interpreted age of the youngest strata displaced by faulting.
Late Quaternary fault displacement (during past 700,000 years). Geomorphic evidence similar to that described for Holocene faults except features are less distinct. Faulting may be younger, but lack of younger overlying deposits precludes more accurate age classification.
Quaternary fault (age undifferentiated). Most faults of this category show evidence of displacement some-time during the past 1.6 million years; possible exceptions are faults which displace rocks of undifferenti-ated Plio-Pleistocene age. Unnumbered Quaternary faults were based on Fault Map of California, 1975. See Bulletin 201, Appendix D for source data.
Pre-Quaternary fault (older that 1.6 million years) or fault without recognized Quaternarydisplacement. Some faults are shown in this category because the source of mapping used wasof reconnaissnce nature, or was not done with the object of dating fault displacements. Faultsin this category are not necessarily inactive.
ADDITIONAL FAULT SYMBOLS
Bar and ball on downthrown side (relative or apparent).
Arrows along fault indicate relative or apparent direction of lateral movement.
Arrow on fault indicates direction of dip.
Low angle fault (barbs on upper plate). Fault surface generally dips less than 45° but locally may have been subsequently steepened. On offshore faults, barbs simply indicate a reverse fault regardless of steepness of dip.
OTHER SYMBOLS
Numbers refer to annotations listed in the appendices of the accompanying report. Annotations include fault name, age of fault displacement, and pertinent references including Earthquake Fault Zone maps where a fault has been zoned by the Alquist-Priolo Earthquake Fault Zoning Act. This Act requires the State Geolo-gist to delineate zones to encompass faults with Holocene displacement.
Structural discontinuity (offshore) separating differing Neogene structural domains. May indicate disconti-nuities between basement rocks.
Brawley Seismic Zone, a linear zone of seismicity locally up to 10 km wide associated with the releasing step between the Imperial and San Andreas faults.
?
?
?
?
?
?
?
?
?
1906 1906
1951
1992
1838 1838
1969
1968 1968
?
491
CREEP
? ? ?
? ??
GeologicTimeScale
YearsBeforePresent
(Approx.)
FaultSymbol
His
toric
Hol
ocen
ePl
eist
ocen
e
200
11,700
700,000
1,600,000*
4.5 billion(Age of Earth)
Recencyof
Movement ON LAND OFFSHORE
DESCRIPTION
Late
Qua
tern
ary
Earl
y Q
uate
rnar
y
Pre-
Qua
tern
ary
Qua
tern
ary
Displacement during historic time (e.g. San Andreas fault 1906).Includes areas of known fault creep.
Displacement during Holocene time.
Fault offsets seafloor sedimentsor strata of Holocene age.
Faults showing evidence of displacement during late Quaternary time.
Fault cuts strata of Late Pleistocene age.
Undivided Quaternary faults - most faults in this category show evidence of displacement during the last 1,600,000 years; possible exceptions are faults which displace rocks of undifferentiated Plio-Pleistocene age.
Fault cuts strata of Quaternary age.
Faults without recognized Quaternary displacement or showing evidence of no displacement during Quaternary time. Not necessarily inactive.
Fault cuts strata of Pliocene or older age.
* Quaternary now recognized as extending to 2.6 Ma (Walker and Geissman, 2009). Quaternary faults in this map were established using the previous 1.6 Ma criterion.

Notes:1. Compression load capacity are based on skin friction and end-bearing capacity.
The structural capacity of the piers should be checked.
2. The indicated capacities are for sustained (dead plus live) vertical compressionload, and include a factor of safety of at least 3.0
3. For temporary wind or seismic load, the above values may be increased by one-third.
4. Capacities of other pier sizes are in direct proportion to the pier diameter.
Figure
3
Vega SES Solar FacilityEl Centro, California
Project No.: LE18083
Drilled Pier Compression Capacity Chart
0
2
4
6
8
10
12
14
16
18
20
0 5 10 15 20 25 30 35 40 45 50 55 60 65
De
pth
of
Pe
ne
tra
tio
n (
ft.)
Allowable Compression Pier Capacity (Kips)
18 inch Diameter
24 inch Diameter

APPENDIX A

Vicinity Map
Plate
A-1
Project Site
N
Project No.: LE18083

Site and Exploration Map
Plate
A-2
N
CPT-1
CPT-2
CPT-4
CPT-6CPT-7
CPT-9
CPT-10
CPT-11
CPT-14
CPT-15
CPT-16
Project No.: LE18083
Project Site
CPT-13
CPT-12
CPT-3
CPT-5
CPT-8

Soil Survey Map
Plate
A-3
Project Site
Project Site
N
Project No.: LE18083


Topographic Map
Plate
A-4
Project Site
N
Project No.: LE18083

Project No.: LE18083 Regional Geologic Map
PlateA-5
Project Site
N
Site LocationLat N32.7295 Long: W-115.6926

A-P Earthquake Fault Zone Map
Plate
A-6
Project Site
N
Project No.: LE18083

Project No.: 18083LE
Plate
A-7
Reference: Federal Emergency Management Agency ( MA)FEImperial County-Panel Numbers 06025C1770C and 06025C2050C
Flood Insurance Rate Map ( )FIRM
L MAND ARKGeo-Engineers and Geologists
Project Site


APPENDIX B

CLIENT: ZGlobal CONE PENETROMETER: Middle Earth Geotesting Truck Mounted Electric
PROJECT: Vega SES Solar - Calexico, CA Cone with 23 ton reaction weight
LOCATION: See Site and Boring Location Plan DATE: 6/11/2018
DE
PT
H
GROUND ELEVATION +/-
Clayey Silt to Silty Clay ML/CL very stiff
Clay CL/CH stiff
Clay '' '' stiff
Clay '' '' stiff
Sandy Silt to Clayey Silt ML medium dense
Sandy Silt to Clayey Silt '' '' medium dense
Clay CL/CH firm
Clay '' '' stiff
Clay '' '' stiff
Silty Clay to Clay CL very stiff
Clayey Silt to Silty Clay ML/CL very stiff
Clayey Silt to Silty Clay '' '' very stiff
Silty Sand to Sandy Silt SM/ML medium dense
Sandy Silt to Clayey Silt ML medium dense
Clayey Silt to Silty Clay ML/CL very stiff
Clay CL/CH stiff
Silty Clay to Clay CL stiff
Sandy Silt to Clayey Silt ML medium dense
Sandy Silt to Clayey Silt '' '' medium dense
Silty Clay to Clay CL stiff
END OF SOUNDING AT 20 ft.
CONE SOUNDING DATA CPT-1
PLATE
B-1
Project No.
LE18083
0 100 200 300 400
Tip Resistance (tsf)
0 2 4 6 8 10
Sleeve Friction (tsf)
0 2 4 6 8 10
Friction Ratio
10
20
30
40
50
5
15
25
35
45
55
INTERPRETED SOIL PROFILEFrom Robertson and Campanella (1989
L MAND ARKGeo-Engineers and Geologis ts

LANDMARK CONSULTANTS, INC.CONE PENETROMETER INTERPRETATION (based on Robertson & Campanella, 1989, refer to Key to CPT logs)
Project: Project No: LE18083 Date: CONE SOUNDING: CPT-1
Est. GWT (ft): 6 Phi Correlation: 0 0-Schm(78),1-R&C(83),2-PHT(74)
Base Base Avg Avg Est. Est. Rel. Nk: 17Depth Depth Tip Friction Soil Density or Density SPT Norm. % Dens. Phi Su
(m) (ft) Qc, tsf Ratio, % Classification USCS Consistency (pcf) N(60) Qc1n Fines Dr (%) (deg.) (tsf) OCR
0.15 0.5 14.03 1.47 Sandy Silt to Clayey Silt ML dense 115 4 26.5 65 76 390.30 1.0 27.94 3.31 Clayey Silt to Silty Clay ML/CL very stiff 120 11 60 1.64 >100.45 1.5 19.71 5.08 Clay CL/CH very stiff 125 16 85 1.16 >100.60 2.0 14.14 6.04 Clay CL/CH stiff 125 11 100 0.83 >100.75 2.5 12.38 5.38 Clay CL/CH stiff 125 10 100 0.72 >100.93 3.0 10.93 5.24 Clay CL/CH stiff 125 9 100 0.63 >101.08 3.5 11.02 4.77 Clay CL/CH stiff 125 9 100 0.64 >101.23 4.0 12.68 4.70 Clay CL/CH stiff 125 10 100 0.73 >101.38 4.5 21.94 1.58 Sandy Silt to Clayey Silt ML medium dense 115 6 41.5 50 47 351.53 5.0 31.62 0.84 Silty Sand to Sandy Silt SM/ML medium dense 115 7 57.2 30 56 361.68 5.5 22.50 1.68 Sandy Silt to Clayey Silt ML medium dense 115 6 38.8 50 45 341.83 6.0 16.22 2.10 Clayey Silt to Silty Clay ML/CL stiff 120 6 65 0.93 >101.98 6.5 5.68 3.40 Clay CL/CH firm 125 5 100 0.31 5.002.13 7.0 6.27 5.95 Clay CL/CH firm 125 5 100 0.35 5.422.28 7.5 10.48 5.14 Clay CL/CH stiff 125 8 100 0.59 >102.45 8.0 14.62 4.53 Clay CL/CH stiff 125 12 90 0.84 >102.60 8.5 15.13 5.21 Clay CL/CH stiff 125 12 95 0.86 >102.75 9.0 18.86 4.95 Clay CL/CH very stiff 125 15 85 1.08 >102.90 9.5 20.70 4.33 Silty Clay to Clay CL very stiff 125 12 80 1.19 >103.05 10.0 20.52 3.92 Silty Clay to Clay CL very stiff 125 12 75 1.18 >103.20 10.5 14.94 4.30 Clay CL/CH stiff 125 12 90 0.85 >103.35 11.0 34.76 1.86 Sandy Silt to Clayey Silt ML medium dense 115 10 47.7 45 51 353.50 11.5 31.39 2.32 Sandy Silt to Clayey Silt ML medium dense 115 9 42.5 55 47 353.65 12.0 16.05 3.35 Silty Clay to Clay CL stiff 125 9 85 0.91 >103.80 12.5 31.06 2.54 Sandy Silt to Clayey Silt ML medium dense 115 9 40.9 55 46 343.95 13.0 67.31 0.65 Sand to Silty Sand SP/SM medium dense 115 12 87.7 15 69 384.13 13.5 50.22 1.51 Silty Sand to Sandy Silt SM/ML medium dense 115 11 64.7 35 60 364.28 14.0 17.27 3.63 Silty Clay to Clay CL stiff 125 10 85 0.98 >104.43 14.5 19.81 3.28 Clayey Silt to Silty Clay ML/CL very stiff 120 8 80 1.13 >104.58 15.0 20.82 2.44 Clayey Silt to Silty Clay ML/CL very stiff 120 8 70 1.19 >104.73 15.5 13.63 3.64 Silty Clay to Clay CL stiff 125 8 100 0.76 >104.88 16.0 15.09 5.20 Clay CL/CH stiff 125 12 100 0.85 >105.03 16.5 16.07 4.73 Clay CL/CH stiff 125 13 100 0.91 >105.18 17.0 17.23 2.70 Clayey Silt to Silty Clay ML/CL stiff 120 7 85 0.97 >105.33 17.5 15.04 3.46 Silty Clay to Clay CL stiff 125 9 100 0.84 >105.48 18.0 66.60 0.86 Sand to Silty Sand SP/SM medium dense 115 12 77.1 25 65 375.65 18.5 59.78 1.16 Silty Sand to Sandy Silt SM/ML medium dense 115 13 68.6 30 61 375.80 19.0 18.86 3.85 Silty Clay to Clay CL very stiff 125 11 95 1.07 >105.95 19.5 16.10 3.82 Silty Clay to Clay CL stiff 125 9 100 0.90 >106.10 20.0 13.99 4.34 Clay CL/CH stiff 125 11 100 0.78 6.43
6/11/2018Vega SES Solar - Calexico, CA

CLIENT: ZGlobal CONE PENETROMETER: Middle Earth Geotesting Truck Mounted Electric
PROJECT: Vega SES Solar - Calexico, CA Cone with 23 ton reaction weight
LOCATION: See Site and Boring Location Plan DATE: 6/11/2018
DE
PT
H
GROUND ELEVATION +/-
Silty Sand to Sandy Silt SM/ML dense
Sandy Silt to Clayey Silt ML dense
Clay CL/CH stiff
Clay '' '' stiff
Clay '' '' stiff
Sand to Silty Sand SP/SM very dense
Sand SP very dense
Sand '' '' very dense
Sand to Silty Sand SP/SM very dense
Sand SP very dense
Sand to Silty Sand SP/SM dense
Sand to Silty Sand '' '' dense
Silty Sand to Sandy Silt SM/ML dense
Silty Clay to Clay CL very stiff
Silty Clay to Clay '' '' very stiff
Clayey Silt to Silty Clay ML/CL hard
Sand SP very dense
Sand to Silty Sand SP/SM dense
Sand to Silty Sand '' '' medium dense
Silty Sand to Sandy Silt SM/ML medium dense
END OF SOUNDING AT 20 ft.
CONE SOUNDING DATA CPT-2
PLATE
B-2
Project No.
LE18083
0 100 200 300 400
Tip Resistance (tsf)
0 2 4 6 8 10
Sleeve Friction (tsf)
0 2 4 6 8 10
Friction Ratio
10
20
30
40
50
5
15
25
35
45
55
INTERPRETED SOIL PROFILEFrom Robertson and Campanella (1989
L MAND ARKGeo-Engineers and Geologis ts

LANDMARK CONSULTANTS, INC.CONE PENETROMETER INTERPRETATION (based on Robertson & Campanella, 1989, refer to Key to CPT logs)
Project: Project No: LE18083 Date: CONE SOUNDING: CPT-2
Est. GWT (ft): 6 Phi Correlation: 0 0-Schm(78),1-R&C(83),2-PHT(74)
Base Base Avg Avg Est. Est. Rel. Nk: 17Depth Depth Tip Friction Soil Density or Density SPT Norm. % Dens. Phi Su
(m) (ft) Qc, tsf Ratio, % Classification USCS Consistency (pcf) N(60) Qc1n Fines Dr (%) (deg.) (tsf) OCR
0.15 0.5 23.55 0.39 Silty Sand to Sandy Silt SM/ML very dense 115 5 44.5 30 92 410.30 1.0 35.66 0.57 Silty Sand to Sandy Silt SM/ML dense 115 8 67.4 25 88 400.45 1.5 39.57 0.78 Silty Sand to Sandy Silt SM/ML dense 115 9 74.8 25 83 400.60 2.0 23.78 2.73 Clayey Silt to Silty Clay ML/CL very stiff 120 10 60 1.39 >100.75 2.5 13.80 3.97 Clay CL/CH stiff 125 11 90 0.80 >100.93 3.0 12.61 4.92 Clay CL/CH stiff 125 10 100 0.73 >101.08 3.5 12.28 6.12 Clay CL/CH stiff 125 10 100 0.71 >101.23 4.0 12.83 6.13 Clay CL/CH stiff 125 10 100 0.74 >101.38 4.5 12.85 5.59 Clay CL/CH stiff 125 10 100 0.74 >101.53 5.0 15.10 5.36 Clay CL/CH stiff 125 12 95 0.87 >101.68 5.5 105.03 1.55 Sand to Silty Sand SP/SM very dense 115 19 181.0 20 90 411.83 6.0 171.83 0.89 Sand SP very dense 110 26 283.9 10 103 421.98 6.5 182.88 1.05 Sand SP very dense 110 28 297.1 10 105 432.13 7.0 187.20 0.99 Sand SP very dense 110 29 299.2 10 105 432.28 7.5 178.49 1.05 Sand SP very dense 110 27 280.8 10 103 422.45 8.0 183.11 0.94 Sand SP very dense 110 28 283.7 10 103 422.60 8.5 154.11 1.02 Sand SP very dense 110 24 235.2 10 98 422.75 9.0 116.72 0.98 Sand to Silty Sand SP/SM dense 115 21 175.5 15 89 402.90 9.5 144.24 1.04 Sand SP very dense 110 22 213.7 10 95 41 3.05 10.0 130.41 0.94 Sand SP very dense 110 20 190.6 10 92 41 3.20 10.5 126.00 1.10 Sand to Silty Sand SP/SM very dense 115 23 181.6 15 90 413.35 11.0 99.11 1.09 Sand to Silty Sand SP/SM dense 115 18 140.8 15 83 403.50 11.5 77.15 0.72 Sand to Silty Sand SP/SM dense 115 14 108.1 15 75 383.65 12.0 78.11 0.77 Sand to Silty Sand SP/SM dense 115 14 108.0 15 75 383.80 12.5 81.21 1.18 Sand to Silty Sand SP/SM dense 115 15 110.8 20 76 393.95 13.0 55.81 1.62 Silty Sand to Sandy Silt SM/ML medium dense 115 12 75.2 35 64 374.13 13.5 22.20 3.38 Clayey Silt to Silty Clay ML/CL very stiff 120 9 75 1.27 >104.28 14.0 14.81 3.77 Silty Clay to Clay CL stiff 125 8 90 0.84 >104.43 14.5 15.24 3.72 Silty Clay to Clay CL stiff 125 9 90 0.86 >104.58 15.0 20.28 3.99 Silty Clay to Clay CL very stiff 125 12 85 1.16 >104.73 15.5 26.59 4.74 Clay CL/CH very stiff 125 21 80 1.53 >104.88 16.0 73.72 2.76 Sandy Silt to Clayey Silt ML medium dense 115 21 91.7 40 70 385.03 16.5 171.44 1.28 Sand to Silty Sand SP/SM very dense 115 31 211.0 15 95 415.18 17.0 192.75 1.10 Sand SP very dense 110 30 234.8 10 98 425.33 17.5 141.57 1.37 Sand to Silty Sand SP/SM dense 115 26 170.8 20 88 405.48 18.0 82.03 1.31 Sand to Silty Sand SP/SM dense 115 15 98.0 25 72 385.65 18.5 82.62 0.85 Sand to Silty Sand SP/SM dense 115 15 97.7 20 72 385.80 19.0 62.14 0.95 Sand to Silty Sand SP/SM medium dense 115 11 72.8 25 63 375.95 19.5 46.88 2.16 Sandy Silt to Clayey Silt ML medium dense 115 13 54.4 50 55 366.10 20.0 51.13 1.03 Silty Sand to Sandy Silt SM/ML medium dense 115 11 58.8 35 57 36
6/11/2018Vega SES Solar - Calexico, CA

CLIENT: ZGlobal CONE PENETROMETER: Middle Earth Geotesting Truck Mounted Electric
PROJECT: Vega SES Solar - Calexico, CA Cone with 23 ton reaction weight
LOCATION: See Site and Boring Location Plan DATE: 6/11/2018
DE
PT
H
GROUND ELEVATION +/-
Sand to Silty Sand SP/SM very dense
Sand to Silty Sand '' '' dense
Sand to Silty Sand '' '' dense
Sand to Silty Sand '' '' dense
Sand to Silty Sand '' '' dense
Sand to Silty Sand '' '' dense
Sand to Silty Sand '' '' dense
Sand to Silty Sand '' '' dense
Sand to Silty Sand '' '' dense
Clayey Silt to Silty Clay ML/CL very stiff
Clay CL/CH stiff
Clay '' '' stiff
Clay '' '' stiff
Clay '' '' stiff
Clay '' '' very stiff
Clay '' '' stiff
Clay '' '' stiff
Silty Sand to Sandy Silt SM/ML dense
Sand SP very dense
Sand '' '' very dense
END OF SOUNDING AT 20 ft.
CONE SOUNDING DATA CPT-3
PLATE
B-3
Project No.
LE18083
0 100 200 300 400
Tip Resistance (tsf)
0 2 4 6 8 10
Sleeve Friction (tsf)
0 2 4 6 8 10
Friction Ratio
10
20
30
40
50
5
15
25
35
45
55
INTERPRETED SOIL PROFILEFrom Robertson and Campanella (1989
L MAND ARKGeo-Engineers and Geologis ts

LANDMARK CONSULTANTS, INC.CONE PENETROMETER INTERPRETATION (based on Robertson & Campanella, 1989, refer to Key to CPT logs)
Project: Project No: LE18083 Date: CONE SOUNDING: CPT-3
Est. GWT (ft): 6 Phi Correlation: 0 0-Schm(78),1-R&C(83),2-PHT(74)
Base Base Avg Avg Est. Est. Rel. Nk: 17Depth Depth Tip Friction Soil Density or Density SPT Norm. % Dens. Phi Su
(m) (ft) Qc, tsf Ratio, % Classification USCS Consistency (pcf) N(60) Qc1n Fines Dr (%) (deg.) (tsf) OCR
0.15 0.5 33.23 0.82 Silty Sand to Sandy Silt SM/ML very dense 115 7 62.8 30 102 420.30 1.0 58.51 0.53 Sand to Silty Sand SP/SM very dense 115 11 110.6 15 102 420.45 1.5 45.83 0.62 Sand to Silty Sand SP/SM dense 115 8 86.6 20 87 400.60 2.0 46.93 0.65 Sand to Silty Sand SP/SM dense 115 9 88.7 20 83 400.75 2.5 58.59 0.63 Sand to Silty Sand SP/SM dense 115 11 110.8 15 86 400.93 3.0 67.63 0.67 Sand to Silty Sand SP/SM dense 115 12 127.9 15 87 401.08 3.5 68.63 0.69 Sand to Silty Sand SP/SM dense 115 12 129.7 15 85 401.23 4.0 73.76 0.66 Sand to Silty Sand SP/SM dense 115 13 139.4 15 85 401.38 4.5 74.33 0.72 Sand to Silty Sand SP/SM dense 115 14 140.5 15 84 401.53 5.0 65.04 0.87 Sand to Silty Sand SP/SM dense 115 12 121.0 20 78 391.68 5.5 63.78 0.59 Sand to Silty Sand SP/SM dense 115 12 112.8 15 76 391.83 6.0 63.69 0.68 Sand to Silty Sand SP/SM dense 115 12 107.7 15 75 381.98 6.5 69.52 0.79 Sand to Silty Sand SP/SM dense 115 13 115.3 15 77 392.13 7.0 79.20 0.88 Sand to Silty Sand SP/SM dense 115 14 128.9 15 80 392.28 7.5 74.50 0.67 Sand to Silty Sand SP/SM dense 115 14 119.1 15 78 392.45 8.0 119.28 0.76 Sand SP very dense 110 18 187.5 10 91 412.60 8.5 117.06 0.97 Sand to Silty Sand SP/SM very dense 115 21 181.0 15 90 412.75 9.0 79.97 1.96 Silty Sand to Sandy Silt SM/ML dense 115 18 121.7 30 78 392.90 9.5 32.74 3.53 Clayey Silt to Silty Clay ML/CL very stiff 120 13 60 1.90 >103.05 10.0 22.37 3.85 Silty Clay to Clay CL very stiff 125 13 75 1.29 >103.20 10.5 19.88 4.09 Silty Clay to Clay CL very stiff 125 11 80 1.14 >103.35 11.0 14.66 5.43 Clay CL/CH stiff 125 12 100 0.83 >103.50 11.5 16.85 6.02 Clay CL/CH stiff 125 13 100 0.96 >103.65 12.0 15.11 4.60 Clay CL/CH stiff 125 12 95 0.86 >103.80 12.5 12.54 5.27 Clay CL/CH stiff 125 10 100 0.71 >103.95 13.0 15.76 6.35 Clay CL/CH stiff 125 13 100 0.90 >104.13 13.5 14.84 5.14 Clay CL/CH stiff 125 12 100 0.84 >104.28 14.0 14.29 5.11 Clay CL/CH stiff 125 11 100 0.81 >104.43 14.5 17.37 6.28 Clay CL/CH stiff 125 14 100 0.99 >104.58 15.0 18.91 6.11 Clay CL/CH very stiff 125 15 100 1.08 >104.73 15.5 19.88 5.73 Clay CL/CH very stiff 125 16 100 1.13 >104.88 16.0 15.05 5.73 Clay CL/CH stiff 125 12 100 0.85 >105.03 16.5 14.19 4.76 Clay CL/CH stiff 125 11 100 0.80 8.855.18 17.0 16.77 5.12 Clay CL/CH stiff 125 13 100 0.95 >105.33 17.5 45.20 4.19 Clayey Silt to Silty Clay ML/CL hard 120 18 65 2.62 >105.48 18.0 205.19 1.02 Sand SP very dense 110 32 241.1 10 98 425.65 18.5 249.18 1.25 Sand SP very dense 110 38 290.3 10 104 435.80 19.0 228.90 1.06 Sand SP very dense 110 35 264.4 10 101 425.95 19.5 208.76 0.76 Sand SP very dense 110 32 239.2 10 98 426.10 20.0 165.69 0.83 Sand SP very dense 110 25 188.3 10 91 41
6/11/2018Vega SES Solar - Calexico, CA

CLIENT: ZGlobal CONE PENETROMETER: Middle Earth Geotesting Truck Mounted Electric
PROJECT: Vega SES Solar - Calexico, CA Cone with 23 ton reaction weight
LOCATION: See Site and Boring Location Plan DATE: 6/11/2018
DE
PT
H
GROUND ELEVATION +/-
Sand to Silty Sand SP/SM very dense
Silty Sand to Sandy Silt SM/ML dense
Sand to Silty Sand SP/SM very dense
Sand to Silty Sand '' '' dense
Sand to Silty Sand '' '' dense
Sand to Silty Sand '' '' dense
Sand to Silty Sand '' '' dense
Sand to Silty Sand '' '' dense
Silty Sand to Sandy Silt SM/ML dense
Sand to Silty Sand SP/SM medium dense
Clayey Silt to Silty Clay ML/CL very stiff
Clayey Silt to Silty Clay '' '' very stiff
Sand to Silty Sand SP/SM dense
Sand to Silty Sand '' '' dense
Sand to Silty Sand '' '' dense
Sandy Silt to Clayey Silt ML medium dense
Sand SP very dense
Sand '' '' very dense
Sand '' '' dense
Silty Sand to Sandy Silt SM/ML medium dense
END OF SOUNDING AT 20 ft.
CONE SOUNDING DATA CPT-4
PLATE
B-4
Project No.
LE18083
0 100 200 300 400
Tip Resistance (tsf)
0 2 4 6 8 10
Sleeve Friction (tsf)
0 2 4 6 8 10
Friction Ratio
10
20
30
40
50
5
15
25
35
45
55
INTERPRETED SOIL PROFILEFrom Robertson and Campanella (1989
L MAND ARKGeo-Engineers and Geologis ts

LANDMARK CONSULTANTS, INC.CONE PENETROMETER INTERPRETATION (based on Robertson & Campanella, 1989, refer to Key to CPT logs)
Project: Project No: LE18083 Date: CONE SOUNDING: CPT-4
Est. GWT (ft): 6 Phi Correlation: 0 0-Schm(78),1-R&C(83),2-PHT(74)
Base Base Avg Avg Est. Est. Rel. Nk: 17Depth Depth Tip Friction Soil Density or Density SPT Norm. % Dens. Phi Su
(m) (ft) Qc, tsf Ratio, % Classification USCS Consistency (pcf) N(60) Qc1n Fines Dr (%) (deg.) (tsf) OCR
0.15 0.5 70.33 0.29 Sand to Silty Sand SP/SM very dense 115 13 132.9 10 124 450.30 1.0 74.13 0.51 Sand to Silty Sand SP/SM very dense 115 13 140.1 10 109 430.45 1.5 39.71 0.73 Silty Sand to Sandy Silt SM/ML dense 115 9 75.1 25 83 400.60 2.0 50.90 0.70 Sand to Silty Sand SP/SM dense 115 9 96.2 20 86 400.75 2.5 83.33 0.69 Sand to Silty Sand SP/SM very dense 115 15 157.5 15 96 420.93 3.0 79.96 0.87 Sand to Silty Sand SP/SM very dense 115 15 151.2 15 92 411.08 3.5 71.68 0.96 Sand to Silty Sand SP/SM dense 115 13 135.5 20 87 401.23 4.0 87.69 0.82 Sand to Silty Sand SP/SM very dense 115 16 165.8 15 90 411.38 4.5 91.16 0.92 Sand to Silty Sand SP/SM dense 115 17 172.3 15 90 411.53 5.0 81.88 1.08 Sand to Silty Sand SP/SM dense 115 15 152.3 20 85 401.68 5.5 81.13 1.08 Sand to Silty Sand SP/SM dense 115 15 143.6 20 83 401.83 6.0 87.94 1.07 Sand to Silty Sand SP/SM dense 115 16 148.7 20 84 401.98 6.5 102.36 0.95 Sand to Silty Sand SP/SM dense 115 19 169.7 15 88 402.13 7.0 112.12 0.99 Sand to Silty Sand SP/SM very dense 115 20 182.5 15 90 412.28 7.5 116.02 0.88 Sand to Silty Sand SP/SM very dense 115 21 185.4 10 91 412.45 8.0 107.03 1.04 Sand to Silty Sand SP/SM dense 115 19 168.1 15 88 402.60 8.5 77.19 1.14 Sand to Silty Sand SP/SM dense 115 14 119.2 20 78 392.75 9.0 48.35 1.11 Silty Sand to Sandy Silt SM/ML medium dense 115 11 73.4 30 63 372.90 9.5 59.00 0.85 Sand to Silty Sand SP/SM medium dense 115 11 88.2 20 69 38 3.05 10.0 61.61 0.86 Sand to Silty Sand SP/SM medium dense 115 11 90.7 20 70 38 3.20 10.5 31.17 1.83 Sandy Silt to Clayey Silt ML medium dense 115 9 45.2 45 49 353.35 11.0 7.44 3.05 Silty Clay to Clay CL firm 125 4 100 0.41 6.653.50 11.5 4.50 2.97 Clay CL/CH soft 125 4 100 0.24 2.343.65 12.0 35.68 2.54 Sandy Silt to Clayey Silt ML medium dense 115 10 49.4 50 52 353.80 12.5 106.77 0.94 Sand to Silty Sand SP/SM dense 115 19 145.8 15 84 403.95 13.0 97.54 1.27 Sand to Silty Sand SP/SM dense 115 18 131.5 20 81 394.13 13.5 90.09 1.05 Sand to Silty Sand SP/SM dense 115 16 120.0 20 78 394.28 14.0 127.45 0.98 Sand to Silty Sand SP/SM dense 115 23 167.7 15 88 404.43 14.5 122.49 1.01 Sand to Silty Sand SP/SM dense 115 22 159.3 15 86 404.58 15.0 86.77 1.45 Sand to Silty Sand SP/SM dense 115 16 111.5 25 76 394.73 15.5 50.46 2.10 Sandy Silt to Clayey Silt ML medium dense 115 14 64.1 40 59 364.88 16.0 49.73 2.14 Sandy Silt to Clayey Silt ML medium dense 115 14 62.5 45 59 365.03 16.5 193.25 0.70 Sand SP very dense 110 30 240.3 5 98 425.18 17.0 212.86 0.90 Sand SP very dense 110 33 262.2 10 101 425.33 17.5 195.12 0.97 Sand SP very dense 110 30 238.1 10 98 425.48 18.0 175.26 0.97 Sand SP very dense 110 27 211.9 10 95 415.65 18.5 151.44 0.75 Sand SP very dense 110 23 181.4 10 90 415.80 19.0 142.64 0.47 Sand SP dense 110 22 169.3 5 88 405.95 19.5 81.90 0.77 Sand to Silty Sand SP/SM dense 115 15 96.3 20 71 386.10 20.0 34.24 3.15 Clayey Silt to Silty Clay ML/CL very stiff 120 14 65 1.97 >10
6/11/2018Vega SES Solar - Calexico, CA

CLIENT: ZGlobal CONE PENETROMETER: Middle Earth Geotesting Truck Mounted Electric
PROJECT: Vega SES Solar - Calexico, CA Cone with 23 ton reaction weight
LOCATION: See Site and Boring Location Plan DATE: 6/11/2018
DE
PT
H
GROUND ELEVATION +/-
Sand to Silty Sand SP/SM very dense
Silty Sand to Sandy Silt SM/ML very dense
Silty Sand to Sandy Silt '' '' dense
Sandy Silt to Clayey Silt ML medium dense
Clayey Silt to Silty Clay ML/CL stiff
Silty Clay to Clay CL firm
Clay CL/CH firm
Silty Clay to Clay CL stiff
Silty Sand to Sandy Silt SM/ML medium dense
Sand SP very dense
Sand '' '' very dense
Sand '' '' very dense
Sand '' '' very dense
Sand '' '' very dense
Sand '' '' very dense
Sand '' '' very dense
Sand '' '' very dense
Gravelly Sand to Sand SW very dense
Gravelly Sand to Sand '' '' very dense
Sand SP very dense
END OF SOUNDING AT 20 ft.
CONE SOUNDING DATA CPT-5
PLATE
B-5
Project No.
LE18083
0 100 200 300 400
Tip Resistance (tsf)
0 2 4 6 8 10
Sleeve Friction (tsf)
0 2 4 6 8 10
Friction Ratio
10
20
30
40
50
5
15
25
35
45
55
INTERPRETED SOIL PROFILEFrom Robertson and Campanella (1989
L MAND ARKGeo-Engineers and Geologis ts
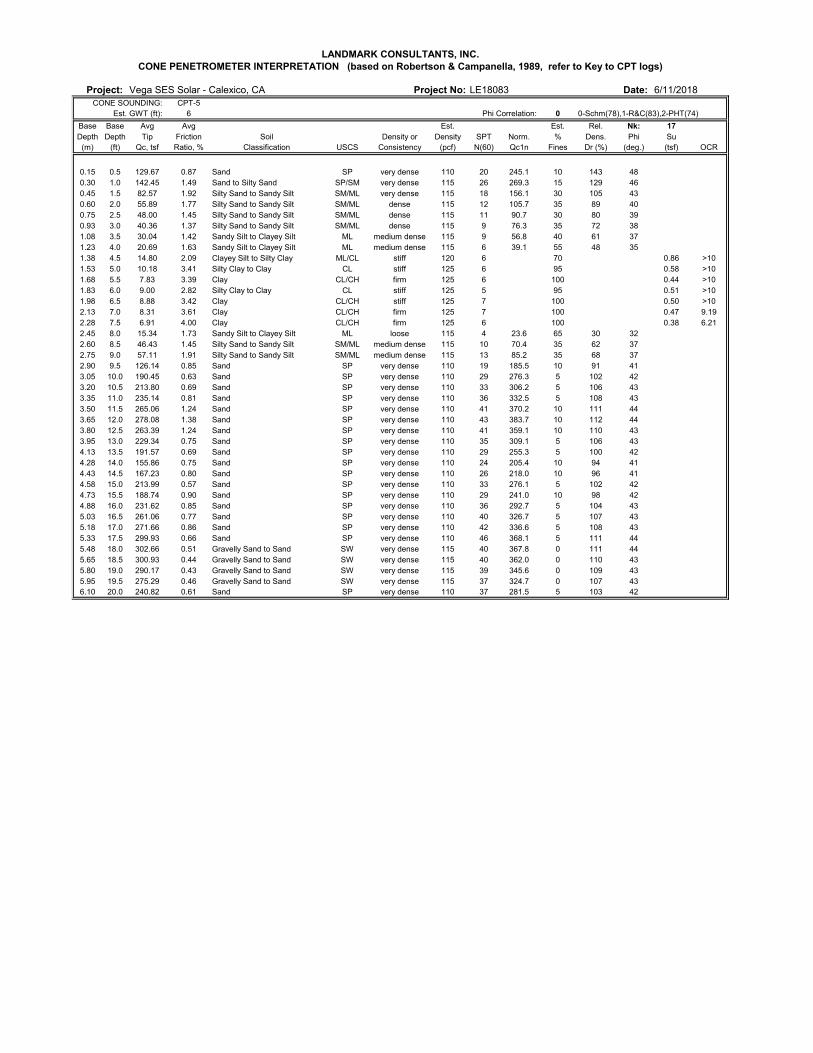
LANDMARK CONSULTANTS, INC.CONE PENETROMETER INTERPRETATION (based on Robertson & Campanella, 1989, refer to Key to CPT logs)
Project: Project No: LE18083 Date: CONE SOUNDING: CPT-5
Est. GWT (ft): 6 Phi Correlation: 0 0-Schm(78),1-R&C(83),2-PHT(74)
Base Base Avg Avg Est. Est. Rel. Nk: 17Depth Depth Tip Friction Soil Density or Density SPT Norm. % Dens. Phi Su
(m) (ft) Qc, tsf Ratio, % Classification USCS Consistency (pcf) N(60) Qc1n Fines Dr (%) (deg.) (tsf) OCR
0.15 0.5 129.67 0.87 Sand SP very dense 110 20 245.1 10 143 480.30 1.0 142.45 1.49 Sand to Silty Sand SP/SM very dense 115 26 269.3 15 129 460.45 1.5 82.57 1.92 Silty Sand to Sandy Silt SM/ML very dense 115 18 156.1 30 105 430.60 2.0 55.89 1.77 Silty Sand to Sandy Silt SM/ML dense 115 12 105.7 35 89 400.75 2.5 48.00 1.45 Silty Sand to Sandy Silt SM/ML dense 115 11 90.7 30 80 390.93 3.0 40.36 1.37 Silty Sand to Sandy Silt SM/ML dense 115 9 76.3 35 72 381.08 3.5 30.04 1.42 Sandy Silt to Clayey Silt ML medium dense 115 9 56.8 40 61 371.23 4.0 20.69 1.63 Sandy Silt to Clayey Silt ML medium dense 115 6 39.1 55 48 351.38 4.5 14.80 2.09 Clayey Silt to Silty Clay ML/CL stiff 120 6 70 0.86 >101.53 5.0 10.18 3.41 Silty Clay to Clay CL stiff 125 6 95 0.58 >101.68 5.5 7.83 3.39 Clay CL/CH firm 125 6 100 0.44 >101.83 6.0 9.00 2.82 Silty Clay to Clay CL stiff 125 5 95 0.51 >101.98 6.5 8.88 3.42 Clay CL/CH stiff 125 7 100 0.50 >102.13 7.0 8.31 3.61 Clay CL/CH firm 125 7 100 0.47 9.192.28 7.5 6.91 4.00 Clay CL/CH firm 125 6 100 0.38 6.212.45 8.0 15.34 1.73 Sandy Silt to Clayey Silt ML loose 115 4 23.6 65 30 322.60 8.5 46.43 1.45 Silty Sand to Sandy Silt SM/ML medium dense 115 10 70.4 35 62 372.75 9.0 57.11 1.91 Silty Sand to Sandy Silt SM/ML medium dense 115 13 85.2 35 68 372.90 9.5 126.14 0.85 Sand SP very dense 110 19 185.5 10 91 41 3.05 10.0 190.45 0.63 Sand SP very dense 110 29 276.3 5 102 42 3.20 10.5 213.80 0.69 Sand SP very dense 110 33 306.2 5 106 433.35 11.0 235.14 0.81 Sand SP very dense 110 36 332.5 5 108 433.50 11.5 265.06 1.24 Sand SP very dense 110 41 370.2 10 111 443.65 12.0 278.08 1.38 Sand SP very dense 110 43 383.7 10 112 443.80 12.5 263.39 1.24 Sand SP very dense 110 41 359.1 10 110 433.95 13.0 229.34 0.75 Sand SP very dense 110 35 309.1 5 106 434.13 13.5 191.57 0.69 Sand SP very dense 110 29 255.3 5 100 424.28 14.0 155.86 0.75 Sand SP very dense 110 24 205.4 10 94 414.43 14.5 167.23 0.80 Sand SP very dense 110 26 218.0 10 96 414.58 15.0 213.99 0.57 Sand SP very dense 110 33 276.1 5 102 424.73 15.5 188.74 0.90 Sand SP very dense 110 29 241.0 10 98 424.88 16.0 231.62 0.85 Sand SP very dense 110 36 292.7 5 104 435.03 16.5 261.06 0.77 Sand SP very dense 110 40 326.7 5 107 435.18 17.0 271.66 0.86 Sand SP very dense 110 42 336.6 5 108 435.33 17.5 299.93 0.66 Sand SP very dense 110 46 368.1 5 111 445.48 18.0 302.66 0.51 Gravelly Sand to Sand SW very dense 115 40 367.8 0 111 445.65 18.5 300.93 0.44 Gravelly Sand to Sand SW very dense 115 40 362.0 0 110 435.80 19.0 290.17 0.43 Gravelly Sand to Sand SW very dense 115 39 345.6 0 109 435.95 19.5 275.29 0.46 Gravelly Sand to Sand SW very dense 115 37 324.7 0 107 436.10 20.0 240.82 0.61 Sand SP very dense 110 37 281.5 5 103 42
6/11/2018Vega SES Solar - Calexico, CA

CLIENT: ZGlobal CONE PENETROMETER: Middle Earth Geotesting Truck Mounted Electric
PROJECT: Vega SES Solar - Calexico, CA Cone with 23 ton reaction weight
LOCATION: See Site and Boring Location Plan DATE: 6/11/2018
DE
PT
H
GROUND ELEVATION +/-
Silty Sand to Sandy Silt SM/ML very dense
Sandy Silt to Clayey Silt ML medium dense
Sandy Silt to Clayey Silt '' '' dense
Sandy Silt to Clayey Silt '' '' medium dense
Sandy Silt to Clayey Silt '' '' medium dense
Silty Sand to Sandy Silt SM/ML medium dense
Silty Clay to Clay CL very stiff
Clay CL/CH stiff
Clay '' '' stiff
Sand to Silty Sand SP/SM dense
Silty Sand to Sandy Silt SM/ML medium dense
Clayey Silt to Silty Clay ML/CL stiff
Clay CL/CH stiff
Clay '' '' stiff
Clay '' '' stiff
Clay '' '' stiff
Clay '' '' stiff
Clay '' '' stiff
Clay '' '' very stiff
Clay '' '' very stiff
Clay '' '' very stiff
Sandy Silt to Clayey Silt ML dense
Silty Sand to Sandy Silt SM/ML dense
Sandy Silt to Clayey Silt ML medium dense
Sand SP very dense
Sand '' '' very dense
Silty Sand to Sandy Silt SM/ML dense
Sandy Silt to Clayey Silt ML dense
Silty Clay to Clay CL very stiff
Clay CL/CH very stiff
Silty Clay to Clay CL very stiff
Clay CL/CH very stiff
Silty Clay to Clay CL very stiff
Silty Clay to Clay '' '' very stiff
Silty Clay to Clay '' '' very stiff
Silty Clay to Clay '' '' very stiff
Clay CL/CH very stiff
Silty Clay to Clay CL very stiff
Clay CL/CH very stiff
Clayey Silt to Silty Clay ML/CL very stiff
Clayey Silt to Silty Clay '' '' hard
Silty Clay to Clay CL hard
Silty Clay to Clay '' '' hard
Silty Clay to Clay '' '' very stiff
Silty Clay to Clay '' '' very stiff
Silty Clay to Clay '' '' very stiff
Silty Clay to Clay '' '' very stiff
Silty Clay to Clay '' '' hard
Silty Clay to Clay '' '' very stiff
Overconsolidated Soil ?? medium dense
END OF SOUNDING AT 50 ft.
CONE SOUNDING DATA CPT-6
PLATE
B-6
Project No.
LE18083
0 100 200 300 400
Tip Resistance (tsf)
0 2 4 6 8 10
Sleeve Friction (tsf)
0 2 4 6 8 10
Friction Ratio
10
20
30
40
50
5
15
25
35
45
55
INTERPRETED SOIL PROFILEFrom Robertson and Campanella (1989
L MAND ARKGeo-Engineers and Geologis ts

LANDMARK CONSULTANTS, INC.CONE PENETROMETER INTERPRETATION (based on Robertson & Campanella, 1989, refer to Key to CPT logs)
Project: Project No: LE18083 Date: CONE SOUNDING: CPT-6
Est. GWT (ft): 6 Phi Correlation: 0 0-Schm(78),1-R&C(83),2-PHT(74)
Base Base Avg Avg Est. Est. Rel. Nk: 17Depth Depth Tip Friction Soil Density or Density SPT Norm. % Dens. Phi Su
(m) (ft) Qc, tsf Ratio, % Classification USCS Consistency (pcf) N(60) Qc1n Fines Dr (%) (deg.) (tsf) OCR
0.15 0.5 69.01 0.88 Sand to Silty Sand SP/SM very dense 115 13 130.4 20 123 450.30 1.0 43.61 1.21 Silty Sand to Sandy Silt SM/ML very dense 115 10 82.4 30 94 410.45 1.5 27.12 1.50 Sandy Silt to Clayey Silt ML dense 115 8 51.3 45 72 380.60 2.0 24.91 1.71 Sandy Silt to Clayey Silt ML medium dense 115 7 47.1 50 65 370.75 2.5 29.61 2.40 Sandy Silt to Clayey Silt ML medium dense 115 8 56.0 55 66 370.93 3.0 43.30 2.53 Sandy Silt to Clayey Silt ML dense 115 12 81.9 45 74 381.08 3.5 40.05 2.45 Sandy Silt to Clayey Silt ML medium dense 115 11 75.7 45 69 381.23 4.0 27.14 2.52 Sandy Silt to Clayey Silt ML medium dense 115 8 51.3 55 56 361.38 4.5 25.76 2.67 Clayey Silt to Silty Clay ML/CL very stiff 120 10 60 1.50 >101.53 5.0 35.79 1.67 Sandy Silt to Clayey Silt ML medium dense 115 10 66.4 40 60 361.68 5.5 49.25 1.29 Silty Sand to Sandy Silt SM/ML medium dense 115 11 87.0 30 68 381.83 6.0 54.82 1.41 Silty Sand to Sandy Silt SM/ML dense 115 12 92.5 30 70 381.98 6.5 24.54 3.30 Clayey Silt to Silty Clay ML/CL very stiff 120 10 65 1.42 >102.13 7.0 14.48 5.43 Clay CL/CH stiff 125 12 100 0.83 >102.28 7.5 15.02 8.10 Clay CL/CH stiff 125 12 100 0.86 >102.45 8.0 17.36 7.19 Clay CL/CH stiff 125 14 100 1.00 >102.60 8.5 15.38 4.92 Clay CL/CH stiff 125 12 95 0.88 >102.75 9.0 10.76 6.18 Clay CL/CH stiff 125 9 100 0.61 >102.90 9.5 56.64 1.71 Silty Sand to Sandy Silt SM/ML medium dense 115 13 83.2 30 67 37 3.05 10.0 78.68 0.42 Sand to Silty Sand SP/SM dense 115 14 113.9 10 76 39 3.20 10.5 47.72 0.90 Silty Sand to Sandy Silt SM/ML medium dense 115 11 68.1 25 61 373.35 11.0 24.32 2.27 Sandy Silt to Clayey Silt ML medium dense 115 7 34.2 55 41 343.50 11.5 15.21 4.54 Clay CL/CH stiff 125 12 90 0.87 >103.65 12.0 19.58 1.75 Sandy Silt to Clayey Silt ML loose 115 6 26.8 60 34 333.80 12.5 14.30 4.91 Clay CL/CH stiff 125 11 100 0.81 >103.95 13.0 19.10 7.32 Clay CL/CH very stiff 125 15 100 1.09 >104.13 13.5 17.38 6.39 Clay CL/CH stiff 125 14 100 0.99 >104.28 14.0 14.55 7.61 Clay CL/CH stiff 125 12 100 0.82 >104.43 14.5 16.19 6.03 Clay CL/CH stiff 125 13 100 0.92 >104.58 15.0 15.01 6.40 Clay CL/CH stiff 125 12 100 0.85 >104.73 15.5 16.24 6.70 Clay CL/CH stiff 125 13 100 0.92 >104.88 16.0 16.63 7.25 Clay CL/CH stiff 125 13 100 0.94 >105.03 16.5 16.27 7.23 Clay CL/CH stiff 125 13 100 0.92 >105.18 17.0 16.40 6.65 Clay CL/CH stiff 125 13 100 0.93 >105.33 17.5 15.99 6.19 Clay CL/CH stiff 125 13 100 0.90 >105.48 18.0 18.16 7.38 Clay CL/CH very stiff 125 15 100 1.03 >105.65 18.5 20.23 6.49 Clay CL/CH very stiff 125 16 100 1.15 >105.80 19.0 22.63 5.49 Clay CL/CH very stiff 125 18 100 1.29 >105.95 19.5 21.86 6.25 Clay CL/CH very stiff 125 17 100 1.24 >106.10 20.0 22.21 6.40 Clay CL/CH very stiff 125 18 100 1.26 >106.25 20.5 22.31 6.33 Clay CL/CH very stiff 125 18 100 1.27 >106.40 21.0 28.20 4.73 Silty Clay to Clay CL very stiff 125 16 90 1.61 >106.55 21.5 26.78 5.56 Clay CL/CH very stiff 125 21 95 1.53 >106.70 22.0 160.98 1.46 Sand to Silty Sand SP/SM dense 115 29 173.2 20 89 406.85 22.5 141.35 1.46 Sand to Silty Sand SP/SM dense 115 26 150.9 25 85 407.00 23.0 46.04 2.25 Sandy Silt to Clayey Silt ML medium dense 115 13 48.8 55 51 357.18 23.5 41.00 2.89 Sandy Silt to Clayey Silt ML medium dense 115 12 43.1 65 48 357.33 24.0 76.11 3.67 Clayey Silt to Silty Clay ML/CL hard 120 30 55 4.43 >107.48 24.5 172.72 1.60 Sand to Silty Sand SP/SM dense 115 31 178.7 25 90 417.63 25.0 338.29 1.08 Sand SP very dense 110 52 347.5 10 109 437.78 25.5 282.04 1.03 Sand SP very dense 110 43 287.8 10 104 437.93 26.0 196.94 1.57 Sand to Silty Sand SP/SM very dense 115 36 199.6 20 93 418.08 26.5 163.45 2.14 Silty Sand to Sandy Silt SM/ML dense 115 36 164.5 30 87 408.23 27.0 155.33 3.01 Silty Sand to Sandy Silt SM/ML dense 115 35 155.2 40 85 408.38 27.5 159.98 2.54 Silty Sand to Sandy Silt SM/ML dense 115 36 158.8 35 86 408.53 28.0 61.30 4.80 Silty Clay to Clay CL hard 125 35 70 3.55 >108.68 28.5 31.35 4.92 Clay CL/CH very stiff 125 25 95 1.79 >108.85 29.0 30.13 4.30 Silty Clay to Clay CL very stiff 125 17 95 1.71 >109.00 29.5 30.20 4.89 Clay CL/CH very stiff 125 24 100 1.72 >109.15 30.0 30.13 5.13 Clay CL/CH very stiff 125 24 100 1.71 >109.30 30.5 28.86 4.75 Silty Clay to Clay CL very stiff 125 16 100 1.64 >109.45 31.0 27.55 4.80 Clay CL/CH very stiff 125 22 100 1.56 >109.60 31.5 28.66 4.80 Clay CL/CH very stiff 125 23 100 1.62 >109.75 32.0 27.32 4.78 Clay CL/CH very stiff 125 22 100 1.54 >109.90 32.5 27.06 4.57 Silty Clay to Clay CL very stiff 125 15 100 1.53 >10
10.05 33.0 30.00 4.39 Silty Clay to Clay CL very stiff 125 17 100 1.70 >1010.20 33.5 28.62 4.84 Clay CL/CH very stiff 125 23 100 1.62 >1010.38 34.0 29.05 3.92 Clayey Silt to Silty Clay ML/CL very stiff 120 12 95 1.64 >1010.53 34.5 28.24 4.38 Silty Clay to Clay CL very stiff 125 16 100 1.59 >1010.68 35.0 27.75 4.25 Silty Clay to Clay CL very stiff 125 16 100 1.56 >1010.83 35.5 27.54 4.64 Silty Clay to Clay CL very stiff 125 16 100 1.55 >1010.98 36.0 31.44 4.91 Clay CL/CH very stiff 125 25 100 1.78 >1011.13 36.5 28.24 5.31 Clay CL/CH very stiff 125 23 100 1.59 9.5911.28 37.0 26.99 5.31 Clay CL/CH very stiff 125 22 100 1.51 8.4111.43 37.5 26.08 4.88 Clay CL/CH very stiff 125 21 100 1.46 7.7011.58 38.0 27.84 4.48 Silty Clay to Clay CL very stiff 125 16 100 1.56 >1011.73 38.5 27.60 4.95 Clay CL/CH very stiff 125 22 100 1.55 8.27
6/11/2018Vega SES Solar - Calexico, CA

LANDMARK CONSULTANTS, INC.CONE PENETROMETER INTERPRETATION (based on Robertson & Campanella, 1989, refer to Key to CPT logs)
Project: Project No: LE18083 Date: CONE SOUNDING: CPT-6
Est. GWT (ft): 6 Phi Correlation: 0 0-Schm(78),1-R&C(83),2-PHT(74)
Base Base Avg Avg Est. Est. Rel. Nk: 17Depth Depth Tip Friction Soil Density or Density SPT Norm. % Dens. Phi Su
(m) (ft) Qc, tsf Ratio, % Classification USCS Consistency (pcf) N(60) Qc1n Fines Dr (%) (deg.) (tsf) OCR
6/11/2018Vega SES Solar - Calexico, CA
11.88 39.0 28.14 5.24 Clay CL/CH very stiff 125 23 100 1.58 8.4112.05 39.5 32.22 4.25 Silty Clay to Clay CL very stiff 125 18 100 1.82 >1012.20 40.0 31.50 3.94 Clayey Silt to Silty Clay ML/CL very stiff 120 13 100 1.77 >1012.35 40.5 53.88 5.09 Silty Clay to Clay CL hard 125 31 90 3.09 >1012.50 41.0 102.67 3.53 Sandy Silt to Clayey Silt ML medium dense 115 29 85.1 60 68 3712.65 41.5 60.97 4.38 Clayey Silt to Silty Clay ML/CL hard 120 24 80 3.50 >1012.80 42.0 40.44 5.26 Clay CL/CH hard 125 32 100 2.30 >1012.95 42.5 39.83 4.83 Silty Clay to Clay CL hard 125 23 100 2.26 >1013.10 43.0 35.04 4.91 Clay CL/CH very stiff 125 28 100 1.98 >1013.25 43.5 32.97 4.65 Silty Clay to Clay CL very stiff 125 19 100 1.85 >1013.40 44.0 33.53 4.70 Silty Clay to Clay CL very stiff 125 19 100 1.89 >1013.58 44.5 29.62 3.73 Clayey Silt to Silty Clay ML/CL very stiff 120 12 100 1.66 >1013.73 45.0 31.65 4.41 Silty Clay to Clay CL very stiff 125 18 100 1.77 >1013.88 45.5 29.72 4.68 Silty Clay to Clay CL very stiff 125 17 100 1.66 9.7914.03 46.0 26.59 3.90 Silty Clay to Clay CL very stiff 125 15 100 1.47 7.7014.18 46.5 28.23 3.98 Silty Clay to Clay CL very stiff 125 16 100 1.57 8.4114.33 47.0 34.66 4.80 Silty Clay to Clay CL very stiff 125 20 100 1.95 >1014.48 47.5 42.75 4.45 Silty Clay to Clay CL hard 125 24 100 2.42 >1014.63 48.0 37.57 4.38 Silty Clay to Clay CL hard 125 21 100 2.12 >1014.78 48.5 41.01 3.62 Clayey Silt to Silty Clay ML/CL hard 120 16 95 2.32 >1014.93 49.0 27.68 4.82 Clay CL/CH very stiff 125 22 100 1.53 5.6515.10 49.5 36.85 6.72 Clay CL/CH hard 125 29 100 2.07 9.1915.25 50.0 96.87 4.30 Overconsolidated Soil ?? medium dense 120 97 73.2 70 63 37

CLIENT: ZGlobal CONE PENETROMETER: Middle Earth Geotesting Truck Mounted Electric
PROJECT: Vega SES Solar - Calexico, CA Cone with 23 ton reaction weight
LOCATION: See Site and Boring Location Plan DATE: 6/11/2018
DE
PT
H
GROUND ELEVATION +/-
Sandy Silt to Clayey Silt ML very dense
Silty Sand to Sandy Silt SM/ML very dense
Clayey Silt to Silty Clay ML/CL very stiff
Clayey Silt to Silty Clay '' '' very stiff
Silty Clay to Clay CL very stiff
Sandy Silt to Clayey Silt ML medium dense
Silty Sand to Sandy Silt SM/ML medium dense
Silty Sand to Sandy Silt '' '' medium dense
Silty Sand to Sandy Silt '' '' medium dense
Sandy Silt to Clayey Silt ML medium dense
Silty Sand to Sandy Silt SM/ML dense
Silty Sand to Sandy Silt '' '' medium dense
Silty Sand to Sandy Silt '' '' medium dense
Silty Sand to Sandy Silt '' '' medium dense
Sand to Silty Sand SP/SM dense
Sand SP very dense
Sand '' '' very dense
Sand '' '' very dense
Sand '' '' very dense
Sand '' '' very dense
Sand to Silty Sand SP/SM dense
Sand to Silty Sand '' '' dense
Sandy Silt to Clayey Silt ML medium dense
Clayey Silt to Silty Clay ML/CL hard
Clay CL/CH very stiff
Clay '' '' very stiff
Clay '' '' very stiff
Clay '' '' very stiff
Clay '' '' very stiff
Clay '' '' very stiff
Silty Clay to Clay CL very stiff
Clay CL/CH very stiff
Clayey Silt to Silty Clay ML/CL very stiff
Silty Clay to Clay CL hard
Clay CL/CH hard
Clayey Silt to Silty Clay ML/CL hard
Silty Sand to Sandy Silt SM/ML dense
Silty Sand to Sandy Silt '' '' dense
Sand SP very dense
Sand to Silty Sand SP/SM very dense
Sand to Silty Sand '' '' dense
Silty Sand to Sandy Silt SM/ML dense
Sandy Silt to Clayey Silt ML dense
Clayey Silt to Silty Clay ML/CL very stiff
Clayey Silt to Silty Clay '' '' very stiff
Silty Clay to Clay CL very stiff
Silty Clay to Clay '' '' very stiff
Silty Clay to Clay '' '' very stiff
Silty Clay to Clay '' '' very stiff
Silty Clay to Clay '' '' very stiff
END OF SOUNDING AT 50 ft.
CONE SOUNDING DATA CPT-7
PLATE
B-7
Project No.
LE18083
0 100 200 300 400
Tip Resistance (tsf)
0 2 4 6 8 10
Sleeve Friction (tsf)
0 2 4 6 8 10
Friction Ratio
10
20
30
40
50
5
15
25
35
45
55
INTERPRETED SOIL PROFILEFrom Robertson and Campanella (1989
L MAND ARKGeo-Engineers and Geologis ts

LANDMARK CONSULTANTS, INC.CONE PENETROMETER INTERPRETATION (based on Robertson & Campanella, 1989, refer to Key to CPT logs)
Project: Project No: LE18083 Date: CONE SOUNDING: CPT-7
Est. GWT (ft): 6 Phi Correlation: 0 0-Schm(78),1-R&C(83),2-PHT(74)
Base Base Avg Avg Est. Est. Rel. Nk: 17Depth Depth Tip Friction Soil Density or Density SPT Norm. % Dens. Phi Su
(m) (ft) Qc, tsf Ratio, % Classification USCS Consistency (pcf) N(60) Qc1n Fines Dr (%) (deg.) (tsf) OCR
0.15 0.5 42.49 3.48 Clayey Silt to Silty Clay ML/CL hard 120 17 55 2.50 >100.30 1.0 106.50 2.15 Silty Sand to Sandy Silt SM/ML very dense 115 24 201.3 25 120 450.45 1.5 100.61 2.21 Silty Sand to Sandy Silt SM/ML very dense 115 22 190.2 30 110 430.60 2.0 67.85 2.20 Silty Sand to Sandy Silt SM/ML very dense 115 15 128.3 35 94 410.75 2.5 35.49 2.79 Sandy Silt to Clayey Silt ML dense 115 10 67.1 50 71 380.93 3.0 23.37 4.57 Clay CL/CH very stiff 125 19 75 1.37 >101.08 3.5 18.22 4.51 Clay CL/CH very stiff 125 15 85 1.06 >101.23 4.0 25.70 1.52 Sandy Silt to Clayey Silt ML medium dense 115 7 48.6 45 54 361.38 4.5 19.52 2.72 Clayey Silt to Silty Clay ML/CL very stiff 120 8 70 1.13 >101.53 5.0 15.92 5.23 Clay CL/CH stiff 125 13 95 0.92 >101.68 5.5 32.59 2.58 Sandy Silt to Clayey Silt ML medium dense 115 9 56.7 50 56 361.83 6.0 37.72 1.85 Sandy Silt to Clayey Silt ML medium dense 115 11 62.8 40 59 361.98 6.5 42.37 1.21 Silty Sand to Sandy Silt SM/ML medium dense 115 9 69.3 30 62 372.13 7.0 46.09 0.87 Silty Sand to Sandy Silt SM/ML medium dense 115 10 74.0 25 64 372.28 7.5 44.11 0.93 Silty Sand to Sandy Silt SM/ML medium dense 115 10 69.6 25 62 372.45 8.0 35.28 0.95 Silty Sand to Sandy Silt SM/ML medium dense 115 8 54.7 30 55 362.60 8.5 32.18 1.08 Silty Sand to Sandy Silt SM/ML medium dense 115 7 49.1 35 51 352.75 9.0 27.46 1.02 Silty Sand to Sandy Silt SM/ML medium dense 115 6 41.2 40 46 342.90 9.5 25.69 1.02 Silty Sand to Sandy Silt SM/ML medium dense 115 6 38.0 40 44 34 3.05 10.0 20.92 2.66 Clayey Silt to Silty Clay ML/CL very stiff 120 8 65 1.20 >103.20 10.5 33.66 2.39 Sandy Silt to Clayey Silt ML medium dense 115 10 48.2 50 51 353.35 11.0 110.36 0.53 Sand SP dense 110 17 156.0 5 86 403.50 11.5 63.83 1.46 Silty Sand to Sandy Silt SM/ML medium dense 115 14 89.1 25 69 383.65 12.0 48.41 1.59 Silty Sand to Sandy Silt SM/ML medium dense 115 11 66.7 35 61 363.80 12.5 72.85 1.06 Sand to Silty Sand SP/SM dense 115 13 99.0 20 72 383.95 13.0 51.25 2.61 Sandy Silt to Clayey Silt ML medium dense 115 15 68.8 45 61 374.13 13.5 49.40 1.87 Silty Sand to Sandy Silt SM/ML medium dense 115 11 65.5 40 60 364.28 14.0 65.37 1.30 Silty Sand to Sandy Silt SM/ML medium dense 115 15 85.6 25 68 384.43 14.5 82.21 1.37 Silty Sand to Sandy Silt SM/ML dense 115 18 106.4 25 74 384.58 15.0 119.03 1.08 Sand to Silty Sand SP/SM dense 115 22 152.3 15 85 404.73 15.5 175.54 0.73 Sand SP very dense 110 27 222.2 5 96 414.88 16.0 174.22 0.65 Sand SP very dense 110 27 218.4 5 96 415.03 16.5 198.75 0.61 Sand SP very dense 110 31 246.7 5 99 425.18 17.0 216.32 0.51 Sand SP very dense 110 33 265.9 5 101 425.33 17.5 206.21 0.45 Sand SP very dense 110 32 251.1 5 100 425.48 18.0 204.79 0.39 Sand SP very dense 110 32 247.1 0 99 425.65 18.5 202.50 0.41 Sand SP very dense 110 31 242.1 0 99 425.80 19.0 190.54 0.40 Sand SP very dense 110 29 225.8 5 97 425.95 19.5 190.19 0.42 Sand SP very dense 110 29 223.4 5 96 416.10 20.0 146.93 0.52 Sand SP dense 110 23 171.1 10 88 406.25 20.5 75.91 1.30 Silty Sand to Sandy Silt SM/ML medium dense 115 17 87.6 30 69 386.40 21.0 93.48 1.20 Sand to Silty Sand SP/SM dense 115 17 106.9 25 74 386.55 21.5 102.65 1.31 Sand to Silty Sand SP/SM dense 115 19 116.3 25 77 396.70 22.0 105.68 1.86 Silty Sand to Sandy Silt SM/ML dense 115 23 118.7 30 78 396.85 22.5 70.79 3.65 Clayey Silt to Silty Clay ML/CL hard 120 28 55 4.12 >107.00 23.0 83.63 2.69 Sandy Silt to Clayey Silt ML dense 115 24 92.3 45 70 387.18 23.5 40.79 3.26 Clayey Silt to Silty Clay ML/CL hard 120 16 65 2.35 >107.33 24.0 30.25 3.76 Clayey Silt to Silty Clay ML/CL very stiff 120 12 80 1.73 >107.48 24.5 27.46 4.83 Clay CL/CH very stiff 125 22 90 1.57 >107.63 25.0 25.59 4.93 Clay CL/CH very stiff 125 20 95 1.46 >107.78 25.5 23.89 5.75 Clay CL/CH very stiff 125 19 100 1.36 >107.93 26.0 26.28 4.68 Clay CL/CH very stiff 125 21 95 1.49 >108.08 26.5 23.58 5.79 Clay CL/CH very stiff 125 19 100 1.33 >108.23 27.0 27.67 5.67 Clay CL/CH very stiff 125 22 100 1.57 >108.38 27.5 26.20 5.81 Clay CL/CH very stiff 125 21 100 1.49 >108.53 28.0 26.76 5.66 Clay CL/CH very stiff 125 21 100 1.52 >108.68 28.5 29.91 4.98 Clay CL/CH very stiff 125 24 95 1.70 >108.85 29.0 30.07 5.33 Clay CL/CH very stiff 125 24 100 1.71 >109.00 29.5 28.25 4.96 Clay CL/CH very stiff 125 23 100 1.60 >109.15 30.0 28.06 4.68 Clay CL/CH very stiff 125 22 100 1.59 >109.30 30.5 27.38 4.56 Silty Clay to Clay CL very stiff 125 16 100 1.55 >109.45 31.0 26.24 4.63 Silty Clay to Clay CL very stiff 125 15 100 1.48 >109.60 31.5 24.97 4.96 Clay CL/CH very stiff 125 20 100 1.41 >109.75 32.0 25.44 5.38 Clay CL/CH very stiff 125 20 100 1.43 >109.90 32.5 31.80 3.86 Clayey Silt to Silty Clay ML/CL very stiff 120 13 90 1.81 >10
10.05 33.0 31.18 3.95 Silty Clay to Clay CL very stiff 125 18 90 1.77 >1010.20 33.5 33.25 4.95 Clay CL/CH very stiff 125 27 95 1.89 >1010.38 34.0 46.54 4.56 Silty Clay to Clay CL hard 125 27 85 2.67 >1010.53 34.5 57.07 4.91 Silty Clay to Clay CL hard 125 33 80 3.29 >1010.68 35.0 52.58 5.68 Clay CL/CH hard 125 42 85 3.03 >1010.83 35.5 115.50 3.68 Sandy Silt to Clayey Silt ML dense 115 33 104.2 50 74 3810.98 36.0 105.11 4.19 Overconsolidated Soil ?? dense 120 105 94.3 60 71 3811.13 36.5 115.71 3.29 Sandy Silt to Clayey Silt ML dense 115 33 103.2 50 73 3811.28 37.0 138.81 2.12 Silty Sand to Sandy Silt SM/ML dense 115 31 123.1 35 79 3911.43 37.5 134.04 3.02 Sandy Silt to Clayey Silt ML dense 115 38 118.2 45 77 3911.58 38.0 204.45 2.15 Silty Sand to Sandy Silt SM/ML dense 115 45 179.3 30 90 4111.73 38.5 376.00 1.54 Sand SP very dense 110 58 328.1 15 108 43
6/11/2018Vega SES Solar - Calexico, CA

LANDMARK CONSULTANTS, INC.CONE PENETROMETER INTERPRETATION (based on Robertson & Campanella, 1989, refer to Key to CPT logs)
Project: Project No: LE18083 Date: CONE SOUNDING: CPT-7
Est. GWT (ft): 6 Phi Correlation: 0 0-Schm(78),1-R&C(83),2-PHT(74)
Base Base Avg Avg Est. Est. Rel. Nk: 17Depth Depth Tip Friction Soil Density or Density SPT Norm. % Dens. Phi Su
(m) (ft) Qc, tsf Ratio, % Classification USCS Consistency (pcf) N(60) Qc1n Fines Dr (%) (deg.) (tsf) OCR
6/11/2018Vega SES Solar - Calexico, CA
11.88 39.0 471.16 1.77 Sand to Silty Sand SP/SM very dense 115 86 409.1 15 114 4412.05 39.5 389.20 2.22 Sand to Silty Sand SP/SM very dense 115 71 336.2 25 108 4312.20 40.0 258.68 2.20 Silty Sand to Sandy Silt SM/ML very dense 115 57 222.3 30 96 4112.35 40.5 224.60 1.64 Sand to Silty Sand SP/SM very dense 115 41 192.0 25 92 4112.50 41.0 165.74 1.88 Sand to Silty Sand SP/SM dense 115 30 141.0 30 83 4012.65 41.5 128.21 3.23 Sandy Silt to Clayey Silt ML dense 115 37 108.5 50 75 3812.80 42.0 218.57 1.76 Sand to Silty Sand SP/SM very dense 115 40 184.1 25 91 4112.95 42.5 186.24 2.56 Silty Sand to Sandy Silt SM/ML dense 115 41 156.1 35 86 4013.10 43.0 54.81 4.28 Clayey Silt to Silty Clay ML/CL hard 120 22 80 3.14 >1013.25 43.5 32.29 3.36 Clayey Silt to Silty Clay ML/CL very stiff 120 13 95 1.82 >1013.40 44.0 30.77 4.31 Silty Clay to Clay CL very stiff 125 18 100 1.73 >1013.58 44.5 31.57 4.22 Silty Clay to Clay CL very stiff 125 18 100 1.77 >1013.73 45.0 32.31 3.36 Clayey Silt to Silty Clay ML/CL very stiff 120 13 95 1.82 >1013.88 45.5 29.72 3.64 Clayey Silt to Silty Clay ML/CL very stiff 120 12 100 1.66 >1014.03 46.0 27.56 4.53 Silty Clay to Clay CL very stiff 125 16 100 1.54 9.0014.18 46.5 28.36 4.61 Silty Clay to Clay CL very stiff 125 16 100 1.58 9.3914.33 47.0 28.55 4.77 Clay CL/CH very stiff 125 23 100 1.59 6.8814.48 47.5 30.01 4.73 Silty Clay to Clay CL very stiff 125 17 100 1.68 >1014.63 48.0 30.66 4.65 Silty Clay to Clay CL very stiff 125 18 100 1.71 >1014.78 48.5 32.71 4.00 Clayey Silt to Silty Clay ML/CL very stiff 120 13 100 1.83 >1014.93 49.0 28.68 4.33 Silty Clay to Clay CL very stiff 125 16 100 1.60 8.7015.10 49.5 29.47 4.33 Silty Clay to Clay CL very stiff 125 17 100 1.64 9.0015.25 50.0 27.24 4.60 Silty Clay to Clay CL very stiff 125 16 100 1.51 7.56

CLIENT: ZGlobal CONE PENETROMETER: Middle Earth Geotesting Truck Mounted Electric
PROJECT: Vega SES Solar - Calexico, CA Cone with 23 ton reaction weight
LOCATION: See Site and Boring Location Plan DATE: 6/11/2018
DE
PT
H
GROUND ELEVATION +/-
Sand SP very dense
Sand to Silty Sand SP/SM very dense
Silty Sand to Sandy Silt SM/ML very dense
Sand to Silty Sand SP/SM very dense
Silty Clay to Clay CL hard
Sandy Silt to Clayey Silt ML dense
Sand to Silty Sand SP/SM very dense
Sand to Silty Sand '' '' very dense
Sand SP very dense
Sand '' '' very dense
Sand '' '' very dense
Sand '' '' very dense
Sand '' '' very dense
Sand '' '' very dense
Sandy Silt to Clayey Silt ML medium dense
Clayey Silt to Silty Clay ML/CL very stiff
Sandy Silt to Clayey Silt ML medium dense
Sandy Silt to Clayey Silt '' '' medium dense
Silty Sand to Sandy Silt SM/ML dense
Clayey Silt to Silty Clay ML/CL hard
END OF SOUNDING AT 20 ft.
CONE SOUNDING DATA CPT-8
PLATE
B-8
Project No.
LE18083
0 100 200 300 400
Tip Resistance (tsf)
0 2 4 6 8 10
Sleeve Friction (tsf)
0 2 4 6 8 10
Friction Ratio
10
20
30
40
50
5
15
25
35
45
55
INTERPRETED SOIL PROFILEFrom Robertson and Campanella (1989
L MAND ARKGeo-Engineers and Geologis ts

LANDMARK CONSULTANTS, INC.CONE PENETROMETER INTERPRETATION (based on Robertson & Campanella, 1989, refer to Key to CPT logs)
Project: Project No: LE18083 Date: CONE SOUNDING: CPT-8
Est. GWT (ft): 6 Phi Correlation: 0 0-Schm(78),1-R&C(83),2-PHT(74)
Base Base Avg Avg Est. Est. Rel. Nk: 17Depth Depth Tip Friction Soil Density or Density SPT Norm. % Dens. Phi Su
(m) (ft) Qc, tsf Ratio, % Classification USCS Consistency (pcf) N(60) Qc1n Fines Dr (%) (deg.) (tsf) OCR
0.15 0.5 88.32 0.78 Sand to Silty Sand SP/SM very dense 115 16 167.0 15 131 460.30 1.0 228.95 0.60 Sand SP very dense 110 35 432.8 0 143 480.45 1.5 138.44 1.43 Sand to Silty Sand SP/SM very dense 115 25 261.7 15 120 450.60 2.0 100.34 1.41 Sand to Silty Sand SP/SM very dense 115 18 189.7 20 106 430.75 2.5 80.23 1.62 Silty Sand to Sandy Silt SM/ML very dense 115 18 151.7 25 95 410.93 3.0 80.88 2.07 Silty Sand to Sandy Silt SM/ML very dense 115 18 152.9 30 93 411.08 3.5 92.34 1.45 Silty Sand to Sandy Silt SM/ML very dense 115 21 174.6 20 94 411.23 4.0 89.86 1.22 Sand to Silty Sand SP/SM very dense 115 16 169.9 20 91 411.38 4.5 51.98 2.75 Sandy Silt to Clayey Silt ML dense 115 15 98.3 45 73 381.53 5.0 19.91 5.91 Clay CL/CH very stiff 125 16 90 1.16 >101.68 5.5 30.61 4.82 Clay CL/CH very stiff 125 24 70 1.78 >101.83 6.0 98.71 1.71 Silty Sand to Sandy Silt SM/ML dense 115 22 166.0 25 87 401.98 6.5 204.31 1.19 Sand SP very dense 110 31 337.2 10 108 432.13 7.0 200.39 1.49 Sand to Silty Sand SP/SM very dense 115 36 325.0 15 107 432.28 7.5 137.95 1.55 Sand to Silty Sand SP/SM very dense 115 25 219.7 20 96 412.45 8.0 147.06 1.07 Sand to Silty Sand SP/SM very dense 115 27 230.2 10 97 422.60 8.5 200.83 1.00 Sand SP very dense 110 31 309.4 10 106 432.75 9.0 191.03 1.09 Sand SP very dense 110 29 290.0 10 104 432.90 9.5 167.79 1.16 Sand to Silty Sand SP/SM very dense 115 31 250.9 10 100 42 3.05 10.0 162.16 1.16 Sand to Silty Sand SP/SM very dense 115 29 238.8 10 98 42 3.20 10.5 177.14 1.07 Sand SP very dense 110 27 257.2 10 100 423.35 11.0 205.55 0.90 Sand SP very dense 110 32 294.6 5 104 433.50 11.5 214.36 0.66 Sand SP very dense 110 33 303.3 5 105 433.65 12.0 169.11 0.62 Sand SP very dense 110 26 236.3 5 98 423.80 12.5 159.29 0.76 Sand SP very dense 110 25 219.9 5 96 413.95 13.0 164.30 0.98 Sand SP very dense 110 25 224.1 10 96 414.13 13.5 174.41 0.81 Sand SP very dense 110 27 235.2 5 98 424.28 14.0 139.65 0.37 Sand SP very dense 110 21 186.2 5 91 414.43 14.5 63.84 1.05 Silty Sand to Sandy Silt SM/ML medium dense 115 14 84.1 25 67 374.58 15.0 14.42 2.70 Clayey Silt to Silty Clay ML/CL stiff 120 6 85 0.82 >104.73 15.5 26.87 2.86 Clayey Silt to Silty Clay ML/CL very stiff 120 11 65 1.55 >104.88 16.0 32.17 3.19 Clayey Silt to Silty Clay ML/CL very stiff 120 13 65 1.86 >105.03 16.5 54.06 2.20 Sandy Silt to Clayey Silt ML medium dense 115 15 67.8 40 61 375.18 17.0 31.10 4.08 Silty Clay to Clay CL very stiff 125 18 75 1.79 >105.33 17.5 44.29 3.40 Clayey Silt to Silty Clay ML/CL hard 120 18 60 2.57 >105.48 18.0 51.06 2.67 Sandy Silt to Clayey Silt ML medium dense 115 15 61.9 50 58 365.65 18.5 90.73 1.60 Silty Sand to Sandy Silt SM/ML dense 115 20 108.8 30 75 385.80 19.0 104.20 2.22 Silty Sand to Sandy Silt SM/ML dense 115 23 123.8 30 79 395.95 19.5 54.69 3.87 Clayey Silt to Silty Clay ML/CL hard 120 22 60 3.18 >106.10 20.0 60.71 3.49 Clayey Silt to Silty Clay ML/CL hard 120 24 55 3.53 >10
6/11/2018Vega SES Solar - Calexico, CA

CLIENT: ZGlobal CONE PENETROMETER: Middle Earth Geotesting Truck Mounted Electric
PROJECT: Vega SES Solar - Calexico, CA Cone with 23 ton reaction weight
LOCATION: See Site and Boring Location Plan DATE: 6/11/2018
DE
PT
H
GROUND ELEVATION +/-
Silty Sand to Sandy Silt SM/ML very dense
Silty Sand to Sandy Silt '' '' very dense
Sandy Silt to Clayey Silt ML dense
Clay CL/CH very stiff
Clay '' '' very stiff
Clay '' '' very stiff
Silty Sand to Sandy Silt SM/ML very dense
Sand SP very dense
Sand '' '' very dense
Sand '' '' very dense
Sand '' '' very dense
Sandy Silt to Clayey Silt ML medium dense
Sand to Silty Sand SP/SM dense
Silty Sand to Sandy Silt SM/ML dense
Sand to Silty Sand SP/SM dense
Sandy Silt to Clayey Silt ML medium dense
Sand to Silty Sand SP/SM dense
Silty Sand to Sandy Silt SM/ML dense
Sand SP very dense
Sand '' '' very dense
END OF SOUNDING AT 20 ft.
CONE SOUNDING DATA CPT-9
PLATE
B-9
Project No.
LE18083
0 100 200 300 400
Tip Resistance (tsf)
0 2 4 6 8 10
Sleeve Friction (tsf)
0 2 4 6 8 10
Friction Ratio
10
20
30
40
50
5
15
25
35
45
55
INTERPRETED SOIL PROFILEFrom Robertson and Campanella (1989
L MAND ARKGeo-Engineers and Geologis ts

LANDMARK CONSULTANTS, INC.CONE PENETROMETER INTERPRETATION (based on Robertson & Campanella, 1989, refer to Key to CPT logs)
Project: Project No: LE18083 Date: CONE SOUNDING: CPT-9
Est. GWT (ft): 6 Phi Correlation: 0 0-Schm(78),1-R&C(83),2-PHT(74)
Base Base Avg Avg Est. Est. Rel. Nk: 17Depth Depth Tip Friction Soil Density or Density SPT Norm. % Dens. Phi Su
(m) (ft) Qc, tsf Ratio, % Classification USCS Consistency (pcf) N(60) Qc1n Fines Dr (%) (deg.) (tsf) OCR
0.15 0.5 126.66 1.46 Sand to Silty Sand SP/SM very dense 115 23 239.4 20 141 480.30 1.0 78.84 1.96 Silty Sand to Sandy Silt SM/ML very dense 115 18 149.0 30 111 440.45 1.5 82.12 1.55 Silty Sand to Sandy Silt SM/ML very dense 115 18 155.2 25 105 430.60 2.0 68.10 1.61 Silty Sand to Sandy Silt SM/ML very dense 115 15 128.7 30 94 410.75 2.5 42.16 1.73 Silty Sand to Sandy Silt SM/ML dense 115 9 79.7 40 76 390.93 3.0 35.20 2.02 Sandy Silt to Clayey Silt ML medium dense 115 10 66.5 45 68 381.08 3.5 25.07 3.64 Clayey Silt to Silty Clay ML/CL very stiff 120 10 70 1.46 >101.23 4.0 17.55 6.44 Clay CL/CH very stiff 125 14 95 1.02 >101.38 4.5 19.75 5.97 Clay CL/CH very stiff 125 16 90 1.15 >101.53 5.0 23.57 6.33 Clay CL/CH very stiff 125 19 85 1.37 >101.68 5.5 26.75 6.87 Clay CL/CH very stiff 125 21 85 1.55 >101.83 6.0 26.16 6.90 Clay CL/CH very stiff 125 21 85 1.52 >101.98 6.5 69.87 3.05 Sandy Silt to Clayey Silt ML dense 115 20 113.6 40 76 392.13 7.0 181.01 0.84 Sand SP very dense 110 28 289.3 5 104 432.28 7.5 194.03 0.90 Sand SP very dense 110 30 305.2 5 105 432.45 8.0 207.21 1.05 Sand SP very dense 110 32 321.0 10 107 432.60 8.5 225.48 1.02 Sand SP very dense 110 35 344.1 5 109 432.75 9.0 234.83 0.91 Sand SP very dense 110 36 353.3 5 110 432.90 9.5 253.71 1.01 Sand SP very dense 110 39 376.3 5 112 44 3.05 10.0 234.20 1.09 Sand SP very dense 110 36 342.7 10 109 43 3.20 10.5 197.66 0.99 Sand SP very dense 110 30 285.4 10 103 423.35 11.0 165.70 0.65 Sand SP very dense 110 25 236.2 5 98 423.50 11.5 80.84 1.80 Silty Sand to Sandy Silt SM/ML dense 115 18 113.7 25 76 393.65 12.0 26.90 3.11 Clayey Silt to Silty Clay ML/CL very stiff 120 11 65 1.55 >103.80 12.5 71.31 1.40 Silty Sand to Sandy Silt SM/ML dense 115 16 97.5 25 72 383.95 13.0 128.33 0.96 Sand to Silty Sand SP/SM dense 115 23 173.3 10 89 404.13 13.5 101.40 1.40 Sand to Silty Sand SP/SM dense 115 18 135.2 20 81 394.28 14.0 73.75 2.03 Silty Sand to Sandy Silt SM/ML dense 115 16 97.1 35 72 384.43 14.5 93.58 0.78 Sand to Silty Sand SP/SM dense 115 17 121.8 15 78 394.58 15.0 64.44 1.34 Silty Sand to Sandy Silt SM/ML medium dense 115 14 82.9 30 67 374.73 15.5 28.75 3.57 Clayey Silt to Silty Clay ML/CL very stiff 120 11 70 1.66 >104.88 16.0 55.74 2.54 Sandy Silt to Clayey Silt ML medium dense 115 16 70.0 45 62 375.03 16.5 109.27 1.28 Sand to Silty Sand SP/SM dense 115 20 135.8 20 82 395.18 17.0 97.88 1.61 Silty Sand to Sandy Silt SM/ML dense 115 22 120.4 25 78 395.33 17.5 79.23 1.45 Silty Sand to Sandy Silt SM/ML dense 115 18 96.4 30 71 385.48 18.0 74.24 2.25 Silty Sand to Sandy Silt SM/ML medium dense 115 16 89.4 40 69 385.65 18.5 197.01 0.58 Sand SP very dense 110 30 235.1 5 98 425.80 19.0 241.76 0.64 Sand SP very dense 110 37 285.9 5 104 425.95 19.5 216.19 0.65 Sand SP very dense 110 33 253.5 5 100 426.10 20.0 213.19 0.61 Sand SP very dense 110 33 247.8 5 99 42
6/11/2018Vega SES Solar - Calexico, CA

CLIENT: ZGlobal CONE PENETROMETER: Middle Earth Geotesting Truck Mounted Electric
PROJECT: Vega SES Solar - Calexico, CA Cone with 23 ton reaction weight
LOCATION: See Site and Boring Location Plan DATE: 6/11/2018
DE
PT
H
GROUND ELEVATION +/-
Sand SP very dense
Sand '' '' very dense
Sand to Silty Sand SP/SM very dense
Sandy Silt to Clayey Silt ML medium dense
Clayey Silt to Silty Clay ML/CL stiff
Silty Sand to Sandy Silt SM/ML medium dense
Sandy Silt to Clayey Silt ML medium dense
Sand SP very dense
Sand '' '' very dense
Sand to Silty Sand SP/SM very dense
Sand SP very dense
Sand '' '' very dense
Sand to Silty Sand SP/SM dense
Sand to Silty Sand '' '' dense
Sand to Silty Sand '' '' dense
Sand to Silty Sand '' '' dense
Sandy Silt to Clayey Silt ML medium dense
Clayey Silt to Silty Clay ML/CL hard
Sandy Silt to Clayey Silt ML medium dense
Sand to Silty Sand SP/SM dense
END OF SOUNDING AT 20 ft.
CONE SOUNDING DATA CPT-10
PLATE
B-10
Project No.
LE18083
0 100 200 300 400
Tip Resistance (tsf)
0 2 4 6 8 10
Sleeve Friction (tsf)
0 2 4 6 8 10
Friction Ratio
10
20
30
40
50
5
15
25
35
45
55
INTERPRETED SOIL PROFILEFrom Robertson and Campanella (1989
L MAND ARKGeo-Engineers and Geologis ts

LANDMARK CONSULTANTS, INC.CONE PENETROMETER INTERPRETATION (based on Robertson & Campanella, 1989, refer to Key to CPT logs)
Project: Project No: LE18083 Date: CONE SOUNDING: CPT-10
Est. GWT (ft): 6 Phi Correlation: 0 0-Schm(78),1-R&C(83),2-PHT(74)
Base Base Avg Avg Est. Est. Rel. Nk: 17Depth Depth Tip Friction Soil Density or Density SPT Norm. % Dens. Phi Su
(m) (ft) Qc, tsf Ratio, % Classification USCS Consistency (pcf) N(60) Qc1n Fines Dr (%) (deg.) (tsf) OCR
0.15 0.5 87.67 0.74 Sand to Silty Sand SP/SM very dense 115 16 165.7 15 130 460.30 1.0 140.80 0.72 Sand SP very dense 110 22 266.2 10 128 460.45 1.5 127.50 0.84 Sand SP very dense 110 20 241.0 10 118 450.60 2.0 131.91 0.88 Sand SP very dense 110 20 249.4 10 114 440.75 2.5 108.28 0.88 Sand to Silty Sand SP/SM very dense 115 20 204.7 15 105 430.93 3.0 77.69 0.98 Sand to Silty Sand SP/SM very dense 115 14 146.9 20 92 411.08 3.5 53.46 1.17 Silty Sand to Sandy Silt SM/ML dense 115 12 101.1 25 78 391.23 4.0 22.29 2.80 Clayey Silt to Silty Clay ML/CL very stiff 120 9 65 1.30 >101.38 4.5 10.41 3.98 Clay CL/CH stiff 125 8 100 0.60 >101.53 5.0 20.29 2.04 Sandy Silt to Clayey Silt ML medium dense 115 6 37.7 60 44 341.68 5.5 28.31 1.40 Sandy Silt to Clayey Silt ML medium dense 115 8 50.1 45 52 351.83 6.0 32.34 1.19 Silty Sand to Sandy Silt SM/ML medium dense 115 7 54.7 35 55 361.98 6.5 17.52 2.99 Clayey Silt to Silty Clay ML/CL very stiff 120 7 75 1.01 >102.13 7.0 62.92 1.59 Silty Sand to Sandy Silt SM/ML dense 115 14 102.2 30 73 382.28 7.5 125.44 0.73 Sand SP very dense 110 19 200.3 10 93 412.45 8.0 134.32 0.83 Sand SP very dense 110 21 211.1 10 95 412.60 8.5 143.52 0.84 Sand SP very dense 110 22 222.2 10 96 412.75 9.0 138.09 1.04 Sand SP very dense 110 21 210.6 10 94 412.90 9.5 113.25 1.49 Sand to Silty Sand SP/SM dense 115 21 170.1 20 88 40 3.05 10.0 138.27 1.16 Sand to Silty Sand SP/SM very dense 115 25 204.5 15 94 41 3.20 10.5 159.11 0.72 Sand SP very dense 110 24 232.0 5 97 423.35 11.0 177.52 0.65 Sand SP very dense 110 27 255.4 5 100 423.50 11.5 158.66 0.65 Sand SP very dense 110 24 225.4 5 96 423.65 12.0 125.49 0.73 Sand SP dense 110 19 176.0 10 89 403.80 12.5 131.00 0.99 Sand to Silty Sand SP/SM very dense 115 24 181.4 10 90 413.95 13.0 115.90 1.31 Sand to Silty Sand SP/SM dense 115 21 158.4 15 86 404.13 13.5 99.88 1.40 Sand to Silty Sand SP/SM dense 115 18 134.8 20 81 394.28 14.0 89.86 1.32 Sand to Silty Sand SP/SM dense 115 16 119.7 20 78 394.43 14.5 93.41 1.25 Sand to Silty Sand SP/SM dense 115 17 123.0 20 79 394.58 15.0 80.03 1.29 Sand to Silty Sand SP/SM dense 115 15 104.1 25 74 384.73 15.5 72.28 1.39 Silty Sand to Sandy Silt SM/ML dense 115 16 92.9 25 70 384.88 16.0 100.44 1.00 Sand to Silty Sand SP/SM dense 115 18 127.7 15 80 395.03 16.5 66.49 1.95 Silty Sand to Sandy Silt SM/ML medium dense 115 15 83.6 35 67 375.18 17.0 33.61 4.00 Clayey Silt to Silty Clay ML/CL very stiff 120 13 70 1.94 >105.33 17.5 37.27 4.04 Clayey Silt to Silty Clay ML/CL hard 120 15 70 2.16 >105.48 18.0 51.03 2.65 Sandy Silt to Clayey Silt ML medium dense 115 15 62.0 50 58 365.65 18.5 80.45 1.53 Silty Sand to Sandy Silt SM/ML dense 115 18 96.8 30 72 385.80 19.0 21.59 3.15 Clayey Silt to Silty Clay ML/CL very stiff 120 9 80 1.23 >105.95 19.5 79.59 1.43 Silty Sand to Sandy Silt SM/ML dense 115 18 93.8 30 71 386.10 20.0 138.07 0.85 Sand SP dense 110 21 161.2 15 87 40
6/11/2018Vega SES Solar - Calexico, CA
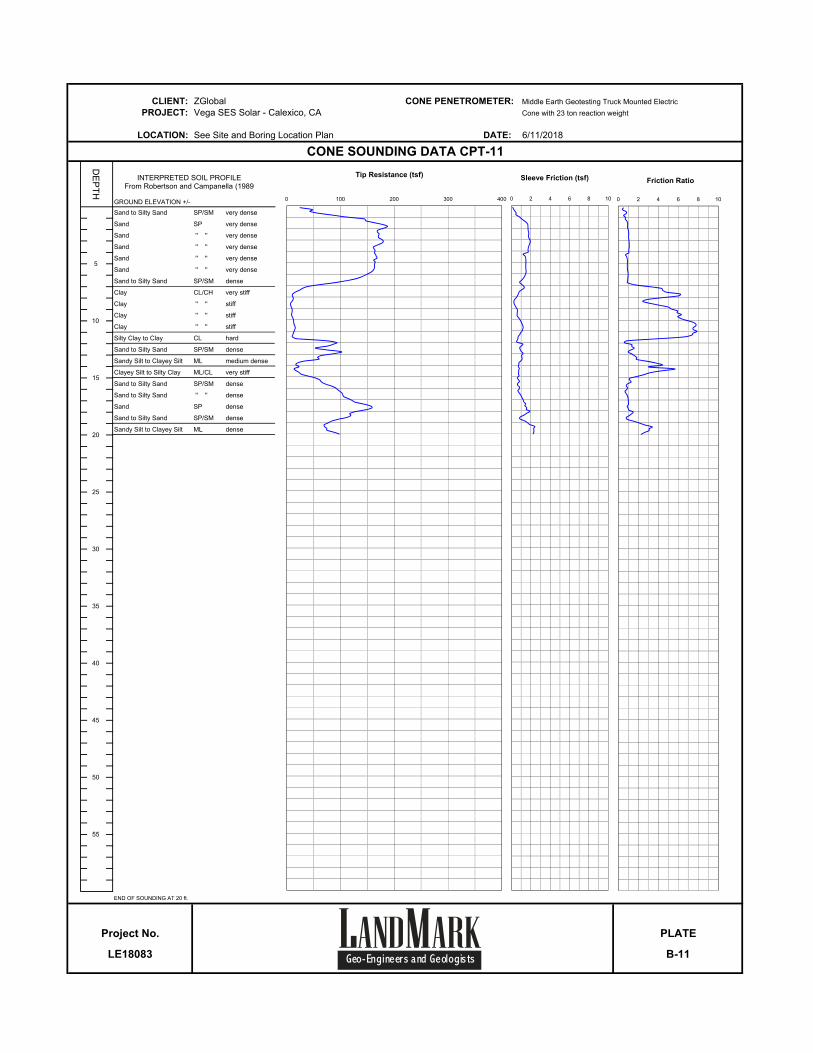
CLIENT: ZGlobal CONE PENETROMETER: Middle Earth Geotesting Truck Mounted Electric
PROJECT: Vega SES Solar - Calexico, CA Cone with 23 ton reaction weight
LOCATION: See Site and Boring Location Plan DATE: 6/11/2018
DE
PT
H
GROUND ELEVATION +/-
Sand to Silty Sand SP/SM very dense
Sand SP very dense
Sand '' '' very dense
Sand '' '' very dense
Sand '' '' very dense
Sand '' '' very dense
Sand to Silty Sand SP/SM dense
Clay CL/CH very stiff
Clay '' '' stiff
Clay '' '' stiff
Clay '' '' stiff
Silty Clay to Clay CL hard
Sand to Silty Sand SP/SM dense
Sandy Silt to Clayey Silt ML medium dense
Clayey Silt to Silty Clay ML/CL very stiff
Sand to Silty Sand SP/SM dense
Sand to Silty Sand '' '' dense
Sand SP dense
Sand to Silty Sand SP/SM dense
Sandy Silt to Clayey Silt ML dense
END OF SOUNDING AT 20 ft.
CONE SOUNDING DATA CPT-11
PLATE
B-11
Project No.
LE18083
0 100 200 300 400
Tip Resistance (tsf)
0 2 4 6 8 10
Sleeve Friction (tsf)
0 2 4 6 8 10
Friction Ratio
10
20
30
40
50
5
15
25
35
45
55
INTERPRETED SOIL PROFILEFrom Robertson and Campanella (1989
L MAND ARKGeo-Engineers and Geologis ts

LANDMARK CONSULTANTS, INC.CONE PENETROMETER INTERPRETATION (based on Robertson & Campanella, 1989, refer to Key to CPT logs)
Project: Project No: LE18083 Date: CONE SOUNDING: CPT-11
Est. GWT (ft): 6 Phi Correlation: 0 0-Schm(78),1-R&C(83),2-PHT(74)
Base Base Avg Avg Est. Est. Rel. Nk: 17Depth Depth Tip Friction Soil Density or Density SPT Norm. % Dens. Phi Su
(m) (ft) Qc, tsf Ratio, % Classification USCS Consistency (pcf) N(60) Qc1n Fines Dr (%) (deg.) (tsf) OCR
0.15 0.5 38.77 0.56 Silty Sand to Sandy Silt SM/ML very dense 115 9 73.3 25 106 430.30 1.0 85.63 0.67 Sand to Silty Sand SP/SM very dense 115 16 161.9 10 113 440.45 1.5 151.28 0.82 Sand SP very dense 110 23 286.0 10 123 450.60 2.0 182.08 0.92 Sand SP very dense 110 28 344.2 10 124 450.75 2.5 170.07 1.03 Sand SP very dense 110 26 321.5 10 118 450.93 3.0 172.91 1.03 Sand SP very dense 110 27 326.9 10 115 441.08 3.5 174.88 1.08 Sand SP very dense 110 27 330.6 10 113 441.23 4.0 162.80 1.06 Sand SP very dense 110 25 307.8 10 109 431.38 4.5 164.97 0.87 Sand SP very dense 110 25 311.8 10 108 431.53 5.0 164.83 0.90 Sand SP very dense 110 25 311.6 10 106 431.68 5.5 163.15 0.90 Sand SP very dense 110 25 293.9 10 104 431.83 6.0 152.95 0.97 Sand SP very dense 110 24 263.4 10 101 421.98 6.5 126.21 0.94 Sand SP very dense 110 19 213.4 10 95 412.13 7.0 65.88 1.81 Silty Sand to Sandy Silt SM/ML dense 115 15 109.3 30 75 392.28 7.5 23.94 4.51 Silty Clay to Clay CL very stiff 125 14 75 1.39 >102.45 8.0 11.45 5.53 Clay CL/CH stiff 125 9 100 0.65 >102.60 8.5 9.95 2.81 Silty Clay to Clay CL stiff 125 6 90 0.56 >102.75 9.0 8.63 4.80 Clay CL/CH firm 125 7 100 0.48 8.272.90 9.5 9.87 6.03 Clay CL/CH stiff 125 8 100 0.56 >103.05 10.0 11.45 6.30 Clay CL/CH stiff 125 9 100 0.65 >103.20 10.5 13.80 7.64 Clay CL/CH stiff 125 11 100 0.79 >103.35 11.0 15.14 7.62 Clay CL/CH stiff 125 12 100 0.86 >103.50 11.5 11.59 7.10 Clay CL/CH stiff 125 9 100 0.65 >103.65 12.0 59.98 1.71 Silty Sand to Sandy Silt SM/ML medium dense 115 13 82.7 30 67 373.80 12.5 71.78 1.42 Silty Sand to Sandy Silt SM/ML dense 115 16 97.7 25 72 383.95 13.0 88.27 1.18 Sand to Silty Sand SP/SM dense 115 16 118.6 20 78 394.13 13.5 60.73 1.76 Silty Sand to Sandy Silt SM/ML medium dense 115 13 80.6 35 66 374.28 14.0 23.22 3.74 Clayey Silt to Silty Clay ML/CL very stiff 120 9 75 1.33 >104.43 14.5 17.99 4.35 Clay CL/CH very stiff 125 14 90 1.03 >104.58 15.0 30.08 2.59 Sandy Silt to Clayey Silt ML medium dense 115 9 38.4 60 44 344.73 15.5 59.75 1.18 Silty Sand to Sandy Silt SM/ML medium dense 115 13 75.4 30 64 374.88 16.0 83.21 0.86 Sand to Silty Sand SP/SM dense 115 15 103.9 20 74 385.03 16.5 101.70 0.76 Sand to Silty Sand SP/SM dense 115 18 125.6 15 79 395.18 17.0 114.08 0.97 Sand to Silty Sand SP/SM dense 115 21 139.5 15 82 405.33 17.5 142.68 0.97 Sand SP dense 110 22 172.7 15 89 405.48 18.0 144.57 1.17 Sand to Silty Sand SP/SM dense 115 26 173.3 15 89 405.65 18.5 116.75 1.07 Sand to Silty Sand SP/SM dense 115 21 138.6 20 82 395.80 19.0 86.30 1.52 Silty Sand to Sandy Silt SM/ML dense 115 19 101.5 30 73 385.95 19.5 71.67 3.04 Sandy Silt to Clayey Silt ML medium dense 115 20 83.5 45 67 376.10 20.0 87.05 2.66 Sandy Silt to Clayey Silt ML dense 115 25 100.4 40 73 38
6/11/2018Vega SES Solar - Calexico, CA

CLIENT: ZGlobal CONE PENETROMETER: Middle Earth Geotesting Truck Mounted Electric
PROJECT: Vega SES Solar - Calexico, CA Cone with 23 ton reaction weight
LOCATION: See Site and Boring Location Plan DATE: 6/11/2018
DE
PT
H
GROUND ELEVATION +/-
Silty Sand to Sandy Silt SM/ML very dense
Sand SP very dense
Sand '' '' very dense
Sand to Silty Sand SP/SM very dense
Sand to Silty Sand '' '' dense
Clayey Silt to Silty Clay ML/CL very stiff
Clay CL/CH stiff
Clay '' '' stiff
Clay '' '' stiff
Clay '' '' stiff
Sand SP very dense
Sand '' '' very dense
Sand '' '' very dense
Silty Sand to Sandy Silt SM/ML medium dense
Clay CL/CH very stiff
Clay '' '' very stiff
Sandy Silt to Clayey Silt ML medium dense
Silty Sand to Sandy Silt SM/ML dense
Sand SP very dense
Sand '' '' very dense
END OF SOUNDING AT 20 ft.
CONE SOUNDING DATA CPT-12
PLATE
B-12
Project No.
LE18083
0 100 200 300 400
Tip Resistance (tsf)
0 2 4 6 8 10
Sleeve Friction (tsf)
0 2 4 6 8 10
Friction Ratio
10
20
30
40
50
5
15
25
35
45
55
INTERPRETED SOIL PROFILEFrom Robertson and Campanella (1989
L MAND ARKGeo-Engineers and Geologis ts

LANDMARK CONSULTANTS, INC.CONE PENETROMETER INTERPRETATION (based on Robertson & Campanella, 1989, refer to Key to CPT logs)
Project: Project No: LE18083 Date: CONE SOUNDING: CPT-12
Est. GWT (ft): 6 Phi Correlation: 0 0-Schm(78),1-R&C(83),2-PHT(74)
Base Base Avg Avg Est. Est. Rel. Nk: 17Depth Depth Tip Friction Soil Density or Density SPT Norm. % Dens. Phi Su
(m) (ft) Qc, tsf Ratio, % Classification USCS Consistency (pcf) N(60) Qc1n Fines Dr (%) (deg.) (tsf) OCR
0.15 0.5 35.07 1.46 Silty Sand to Sandy Silt SM/ML very dense 115 8 66.3 40 103 420.30 1.0 48.88 0.76 Silty Sand to Sandy Silt SM/ML very dense 115 11 92.4 20 97 420.45 1.5 107.21 0.85 Sand to Silty Sand SP/SM very dense 115 19 202.7 10 113 440.60 2.0 122.44 0.88 Sand to Silty Sand SP/SM very dense 115 22 231.4 10 112 440.75 2.5 133.98 0.89 Sand SP very dense 110 21 253.3 10 111 430.93 3.0 131.49 0.94 Sand SP very dense 110 20 248.6 10 107 431.08 3.5 115.31 0.79 Sand SP very dense 110 18 218.0 10 101 421.23 4.0 102.76 0.89 Sand to Silty Sand SP/SM very dense 115 19 194.3 15 95 411.38 4.5 95.22 0.92 Sand to Silty Sand SP/SM very dense 115 17 180.0 15 91 411.53 5.0 82.95 0.93 Sand to Silty Sand SP/SM dense 115 15 155.4 15 85 401.68 5.5 46.49 1.86 Silty Sand to Sandy Silt SM/ML medium dense 115 10 82.8 40 67 371.83 6.0 17.41 4.83 Clay CL/CH very stiff 125 14 90 1.00 >101.98 6.5 13.63 6.56 Clay CL/CH stiff 125 11 100 0.78 >102.13 7.0 14.26 7.33 Clay CL/CH stiff 125 11 100 0.82 >102.28 7.5 10.53 7.10 Clay CL/CH stiff 125 8 100 0.60 >102.45 8.0 9.69 6.15 Clay CL/CH stiff 125 8 100 0.55 >102.60 8.5 8.71 4.43 Clay CL/CH firm 125 7 100 0.49 8.412.75 9.0 9.96 6.08 Clay CL/CH stiff 125 8 100 0.56 >102.90 9.5 12.61 7.66 Clay CL/CH stiff 125 10 100 0.72 >103.05 10.0 17.74 7.22 Clay CL/CH very stiff 125 14 100 1.02 >103.20 10.5 158.28 0.76 Sand SP very dense 110 24 225.2 5 96 423.35 11.0 210.30 0.66 Sand SP very dense 110 32 295.4 5 104 433.50 11.5 208.25 0.79 Sand SP very dense 110 32 289.0 5 104 433.65 12.0 211.83 0.91 Sand SP very dense 110 33 290.4 5 104 433.80 12.5 192.90 0.95 Sand SP very dense 110 30 261.4 10 101 423.95 13.0 164.80 0.88 Sand SP very dense 110 25 220.8 10 96 414.13 13.5 93.42 1.19 Sand to Silty Sand SP/SM dense 115 17 123.7 20 79 394.28 14.0 40.28 2.58 Sandy Silt to Clayey Silt ML medium dense 115 12 52.7 50 54 354.43 14.5 23.35 4.37 Silty Clay to Clay CL very stiff 125 13 80 1.34 >104.58 15.0 22.55 5.75 Clay CL/CH very stiff 125 18 90 1.29 >104.73 15.5 22.81 6.72 Clay CL/CH very stiff 125 18 100 1.31 >104.88 16.0 22.88 6.17 Clay CL/CH very stiff 125 18 95 1.31 >105.03 16.5 72.30 1.51 Silty Sand to Sandy Silt SM/ML medium dense 115 16 88.7 30 69 385.18 17.0 22.87 3.57 Clayey Silt to Silty Clay ML/CL very stiff 120 9 80 1.31 >105.33 17.5 43.52 2.09 Sandy Silt to Clayey Silt ML medium dense 115 12 52.3 50 53 355.48 18.0 113.38 1.24 Sand to Silty Sand SP/SM dense 115 21 134.8 20 81 395.65 18.5 196.22 0.85 Sand SP very dense 110 30 231.1 10 97 425.80 19.0 147.32 0.94 Sand SP dense 110 23 172.0 15 89 405.95 19.5 158.22 0.49 Sand SP very dense 110 24 183.2 5 90 416.10 20.0 183.47 0.65 Sand SP very dense 110 28 210.7 10 94 41
6/11/2018Vega SES Solar - Calexico, CA

CLIENT: ZGlobal CONE PENETROMETER: Middle Earth Geotesting Truck Mounted Electric
PROJECT: Vega SES Solar - Calexico, CA Cone with 23 ton reaction weight
LOCATION: See Site and Boring Location Plan DATE: 6/11/2018
DE
PT
H
GROUND ELEVATION +/-
Sand to Silty Sand SP/SM very dense
Sand to Silty Sand '' '' very dense
Silty Sand to Sandy Silt SM/ML dense
Silty Sand to Sandy Silt '' '' medium dense
Silty Sand to Sandy Silt '' '' dense
Silty Sand to Sandy Silt '' '' dense
Sand to Silty Sand SP/SM dense
Sand to Silty Sand '' '' dense
Silty Sand to Sandy Silt SM/ML medium dense
Clay CL/CH stiff
Sandy Silt to Clayey Silt ML dense
Sand SP very dense
Sand '' '' very dense
Sand '' '' very dense
Sand '' '' dense
Sand to Silty Sand SP/SM dense
Sand to Silty Sand '' '' dense
Sand SP dense
Sand to Silty Sand SP/SM dense
Sand SP very dense
END OF SOUNDING AT 20 ft.
CONE SOUNDING DATA CPT-13
PLATE
B-13
Project No.
LE18083
0 100 200 300 400
Tip Resistance (tsf)
0 2 4 6 8 10
Sleeve Friction (tsf)
0 2 4 6 8 10
Friction Ratio
10
20
30
40
50
5
15
25
35
45
55
INTERPRETED SOIL PROFILEFrom Robertson and Campanella (1989
L MAND ARKGeo-Engineers and Geologis ts

LANDMARK CONSULTANTS, INC.CONE PENETROMETER INTERPRETATION (based on Robertson & Campanella, 1989, refer to Key to CPT logs)
Project: Project No: LE18083 Date: CONE SOUNDING: CPT-13
Est. GWT (ft): 6 Phi Correlation: 0 0-Schm(78),1-R&C(83),2-PHT(74)
Base Base Avg Avg Est. Est. Rel. Nk: 17Depth Depth Tip Friction Soil Density or Density SPT Norm. % Dens. Phi Su
(m) (ft) Qc, tsf Ratio, % Classification USCS Consistency (pcf) N(60) Qc1n Fines Dr (%) (deg.) (tsf) OCR
0.15 0.5 30.48 0.92 Silty Sand to Sandy Silt SM/ML very dense 115 7 57.6 35 99 420.30 1.0 154.19 0.66 Sand SP very dense 110 24 291.5 5 131 460.45 1.5 141.98 1.00 Sand SP very dense 110 22 268.4 10 121 450.60 2.0 92.14 1.15 Sand to Silty Sand SP/SM very dense 115 17 174.2 20 104 420.75 2.5 70.09 0.90 Sand to Silty Sand SP/SM very dense 115 13 132.5 20 92 410.93 3.0 16.64 1.31 Sandy Silt to Clayey Silt ML medium dense 115 5 31.5 55 46 341.08 3.5 30.16 1.30 Silty Sand to Sandy Silt SM/ML medium dense 115 7 57.0 40 61 371.23 4.0 39.94 1.12 Silty Sand to Sandy Silt SM/ML medium dense 115 9 75.5 30 67 371.38 4.5 60.43 0.90 Sand to Silty Sand SP/SM dense 115 11 114.2 20 78 391.53 5.0 58.25 1.12 Silty Sand to Sandy Silt SM/ML dense 115 13 108.9 25 75 381.68 5.5 44.61 1.93 Sandy Silt to Clayey Silt ML medium dense 115 13 79.3 40 66 371.83 6.0 113.88 0.85 Sand to Silty Sand SP/SM very dense 115 21 193.3 10 92 411.98 6.5 133.07 1.01 Sand to Silty Sand SP/SM very dense 115 24 221.4 10 96 412.13 7.0 76.62 1.96 Silty Sand to Sandy Silt SM/ML dense 115 17 125.1 30 79 392.28 7.5 79.66 0.96 Sand to Silty Sand SP/SM dense 115 14 127.7 20 80 392.45 8.0 64.72 1.34 Silty Sand to Sandy Silt SM/ML dense 115 14 102.0 25 73 382.60 8.5 46.14 1.16 Silty Sand to Sandy Silt SM/ML medium dense 115 10 71.5 30 63 372.75 9.0 30.94 1.57 Sandy Silt to Clayey Silt ML medium dense 115 9 47.1 45 50 352.90 9.5 14.79 3.34 Silty Clay to Clay CL stiff 125 8 85 0.85 >103.05 10.0 11.31 5.29 Clay CL/CH stiff 125 9 100 0.64 >103.20 10.5 26.18 4.63 Silty Clay to Clay CL very stiff 125 15 75 1.51 >103.35 11.0 113.79 0.99 Sand to Silty Sand SP/SM dense 115 21 161.9 15 87 403.50 11.5 166.86 0.98 Sand SP very dense 110 26 234.2 10 98 423.65 12.0 175.01 1.11 Sand SP very dense 110 27 242.7 10 99 423.80 12.5 147.72 1.24 Sand to Silty Sand SP/SM very dense 115 27 202.3 15 93 413.95 13.0 165.42 0.88 Sand SP very dense 110 25 223.8 10 96 414.13 13.5 135.03 0.91 Sand SP dense 110 21 180.6 10 90 414.28 14.0 141.67 0.50 Sand SP very dense 110 22 187.4 5 91 414.43 14.5 134.86 0.61 Sand SP dense 110 21 176.4 10 89 404.58 15.0 120.54 0.80 Sand SP dense 110 19 156.0 10 86 404.73 15.5 90.96 1.06 Sand to Silty Sand SP/SM dense 115 17 116.4 20 77 394.88 16.0 104.53 0.91 Sand to Silty Sand SP/SM dense 115 19 132.3 15 81 395.03 16.5 127.58 0.94 Sand SP dense 110 20 159.8 15 86 405.18 17.0 117.50 0.88 Sand to Silty Sand SP/SM dense 115 21 145.7 15 84 405.33 17.5 154.12 0.79 Sand SP very dense 110 24 189.2 10 91 415.48 18.0 122.96 1.25 Sand to Silty Sand SP/SM dense 115 22 149.4 20 84 405.65 18.5 122.80 0.89 Sand to Silty Sand SP/SM dense 115 22 147.7 15 84 405.80 19.0 85.89 1.66 Silty Sand to Sandy Silt SM/ML dense 115 19 102.3 30 73 385.95 19.5 127.48 0.97 Sand to Silty Sand SP/SM dense 115 23 150.4 15 85 406.10 20.0 212.35 0.75 Sand SP very dense 110 33 248.2 5 99 42
6/11/2018Vega SES Solar - Calexico, CA

CLIENT: ZGlobal CONE PENETROMETER: Middle Earth Geotesting Truck Mounted Electric
PROJECT: Vega SES Solar - Calexico, CA Cone with 23 ton reaction weight
LOCATION: See Site and Boring Location Plan DATE: 6/11/2018
DE
PT
H
GROUND ELEVATION +/-
Sand SP very dense
Sand to Silty Sand SP/SM very dense
Sand to Silty Sand '' '' very dense
Sand to Silty Sand '' '' very dense
Sand to Silty Sand '' '' dense
Sand SP very dense
Sand '' '' very dense
Sand '' '' very dense
Sand '' '' very dense
Sand to Silty Sand SP/SM very dense
Sand SP very dense
Sand '' '' very dense
Sand '' '' very dense
Sand to Silty Sand SP/SM dense
Sand to Silty Sand '' '' dense
Sand SP very dense
Sand to Silty Sand SP/SM dense
Sandy Silt to Clayey Silt ML dense
Sand SP very dense
Sand '' '' very dense
END OF SOUNDING AT 20 ft.
CONE SOUNDING DATA CPT-14
PLATE
B-14
Project No.
LE18083
0 100 200 300 400
Tip Resistance (tsf)
0 2 4 6 8 10
Sleeve Friction (tsf)
0 2 4 6 8 10
Friction Ratio
10
20
30
40
50
5
15
25
35
45
55
INTERPRETED SOIL PROFILEFrom Robertson and Campanella (1989
L MAND ARKGeo-Engineers and Geologis ts

LANDMARK CONSULTANTS, INC.CONE PENETROMETER INTERPRETATION (based on Robertson & Campanella, 1989, refer to Key to CPT logs)
Project: Project No: LE18083 Date: CONE SOUNDING: CPT-14
Est. GWT (ft): 6 Phi Correlation: 0 0-Schm(78),1-R&C(83),2-PHT(74)
Base Base Avg Avg Est. Est. Rel. Nk: 17Depth Depth Tip Friction Soil Density or Density SPT Norm. % Dens. Phi Su
(m) (ft) Qc, tsf Ratio, % Classification USCS Consistency (pcf) N(60) Qc1n Fines Dr (%) (deg.) (tsf) OCR
0.15 0.5 165.07 0.23 Sand SP very dense 110 25 312.0 0 150 490.30 1.0 163.13 0.98 Sand SP very dense 110 25 308.4 10 133 470.45 1.5 129.46 1.02 Sand to Silty Sand SP/SM very dense 115 24 244.7 10 119 450.60 2.0 113.34 0.99 Sand to Silty Sand SP/SM very dense 115 21 214.3 15 110 430.75 2.5 105.37 0.92 Sand to Silty Sand SP/SM very dense 115 19 199.2 15 104 430.93 3.0 109.32 0.93 Sand to Silty Sand SP/SM very dense 115 20 206.6 15 102 421.08 3.5 98.62 1.01 Sand to Silty Sand SP/SM very dense 115 18 186.4 15 96 411.23 4.0 77.02 0.95 Sand to Silty Sand SP/SM dense 115 14 145.6 20 87 401.38 4.5 75.42 0.71 Sand to Silty Sand SP/SM dense 115 14 142.6 15 84 401.53 5.0 85.89 0.65 Sand to Silty Sand SP/SM dense 115 16 160.5 10 86 401.68 5.5 109.77 0.63 Sand SP very dense 110 17 195.2 10 92 411.83 6.0 138.57 0.73 Sand SP very dense 110 21 235.9 10 98 421.98 6.5 152.94 0.88 Sand SP very dense 110 24 255.7 10 100 422.13 7.0 158.07 0.94 Sand SP very dense 110 24 259.7 10 101 422.28 7.5 182.82 0.98 Sand SP very dense 110 28 295.4 10 104 432.45 8.0 197.17 1.06 Sand SP very dense 110 30 313.5 10 106 432.60 8.5 190.74 1.03 Sand SP very dense 110 29 298.6 10 105 432.75 9.0 191.41 1.01 Sand SP very dense 110 29 295.1 10 104 432.90 9.5 158.04 1.41 Sand to Silty Sand SP/SM very dense 115 29 239.9 15 98 42 3.05 10.0 113.90 1.57 Sand to Silty Sand SP/SM dense 115 21 170.2 20 88 40 3.20 10.5 175.07 0.84 Sand SP very dense 110 27 257.8 5 100 423.35 11.0 202.52 0.77 Sand SP very dense 110 31 294.2 5 104 433.50 11.5 218.07 1.00 Sand SP very dense 110 34 312.7 5 106 433.65 12.0 220.97 1.01 Sand SP very dense 110 34 312.8 5 106 433.80 12.5 209.84 1.02 Sand SP very dense 110 32 293.4 10 104 433.95 13.0 169.08 0.97 Sand SP very dense 110 26 233.6 10 98 424.13 13.5 124.93 0.89 Sand to Silty Sand SP/SM dense 115 23 170.4 10 88 404.28 14.0 93.18 1.03 Sand to Silty Sand SP/SM dense 115 17 125.5 15 79 394.43 14.5 96.28 1.00 Sand to Silty Sand SP/SM dense 115 18 128.1 15 80 394.58 15.0 137.44 0.94 Sand SP dense 110 21 180.7 10 90 414.73 15.5 175.44 1.13 Sand SP very dense 110 27 228.2 10 97 424.88 16.0 187.92 1.20 Sand SP very dense 110 29 241.9 10 99 425.03 16.5 165.39 1.31 Sand to Silty Sand SP/SM very dense 115 30 210.6 15 94 415.18 17.0 103.46 2.25 Silty Sand to Sandy Silt SM/ML dense 115 23 130.3 30 80 395.33 17.5 63.67 3.74 Clayey Silt to Silty Clay ML/CL hard 120 25 50 3.71 >105.48 18.0 120.39 1.93 Silty Sand to Sandy Silt SM/ML dense 115 27 148.2 25 84 405.65 18.5 200.51 1.15 Sand SP very dense 110 31 244.4 10 99 425.80 19.0 226.22 1.10 Sand SP very dense 110 35 273.2 10 102 425.95 19.5 261.55 0.71 Sand SP very dense 110 40 313.0 5 106 436.10 20.0 261.87 0.75 Sand SP very dense 110 40 310.6 5 106 43
6/11/2018Vega SES Solar - Calexico, CA

CLIENT: ZGlobal CONE PENETROMETER: Middle Earth Geotesting Truck Mounted Electric
PROJECT: Vega SES Solar - Calexico, CA Cone with 23 ton reaction weight
LOCATION: See Site and Boring Location Plan DATE: 6/11/2018
DE
PT
H
GROUND ELEVATION +/-
Silty Sand to Sandy Silt SM/ML very dense
Sand to Silty Sand SP/SM very dense
Sand to Silty Sand '' '' very dense
Silty Sand to Sandy Silt SM/ML medium dense
Clay CL/CH stiff
Clay '' '' very stiff
Clayey Silt to Silty Clay ML/CL stiff
Clay CL/CH stiff
Silty Sand to Sandy Silt SM/ML dense
Sand SP very dense
Sand '' '' very dense
Sand '' '' very dense
Sand '' '' very dense
Sand '' '' very dense
Sand '' '' very dense
Sand '' '' very dense
Sand to Silty Sand SP/SM dense
Clayey Silt to Silty Clay ML/CL very stiff
Clay CL/CH very stiff
Silty Clay to Clay CL hard
END OF SOUNDING AT 20 ft.
CONE SOUNDING DATA CPT-15
PLATE
B-15
Project No.
LE18083
0 100 200 300 400
Tip Resistance (tsf)
0 2 4 6 8 10
Sleeve Friction (tsf)
0 2 4 6 8 10
Friction Ratio
10
20
30
40
50
5
15
25
35
45
55
INTERPRETED SOIL PROFILEFrom Robertson and Campanella (1989
L MAND ARKGeo-Engineers and Geologis ts

LANDMARK CONSULTANTS, INC.CONE PENETROMETER INTERPRETATION (based on Robertson & Campanella, 1989, refer to Key to CPT logs)
Project: Project No: LE18083 Date: CONE SOUNDING: CPT-15
Est. GWT (ft): 6 Phi Correlation: 0 0-Schm(78),1-R&C(83),2-PHT(74)
Base Base Avg Avg Est. Est. Rel. Nk: 17Depth Depth Tip Friction Soil Density or Density SPT Norm. % Dens. Phi Su
(m) (ft) Qc, tsf Ratio, % Classification USCS Consistency (pcf) N(60) Qc1n Fines Dr (%) (deg.) (tsf) OCR
0.15 0.5 68.94 1.84 Silty Sand to Sandy Silt SM/ML very dense 115 15 130.3 30 123 450.30 1.0 62.88 1.43 Silty Sand to Sandy Silt SM/ML very dense 115 14 118.9 25 104 430.45 1.5 103.40 1.05 Sand to Silty Sand SP/SM very dense 115 19 195.5 15 112 440.60 2.0 125.66 1.01 Sand to Silty Sand SP/SM very dense 115 23 237.5 15 112 440.75 2.5 116.55 1.02 Sand to Silty Sand SP/SM very dense 115 21 220.3 15 106 430.93 3.0 71.72 1.16 Silty Sand to Sandy Silt SM/ML dense 115 16 135.6 20 89 401.08 3.5 46.15 1.02 Silty Sand to Sandy Silt SM/ML dense 115 10 87.2 25 74 381.23 4.0 34.01 1.65 Sandy Silt to Clayey Silt ML medium dense 115 10 64.3 40 62 371.38 4.5 13.00 4.31 Clay CL/CH stiff 125 10 95 0.75 >101.53 5.0 10.67 7.01 Clay CL/CH stiff 125 9 100 0.61 >101.68 5.5 12.21 6.15 Clay CL/CH stiff 125 10 100 0.70 >101.83 6.0 25.58 2.66 Clayey Silt to Silty Clay ML/CL very stiff 120 10 60 1.48 >101.98 6.5 20.60 2.59 Clayey Silt to Silty Clay ML/CL very stiff 120 8 65 1.19 >102.13 7.0 8.26 3.48 Clay CL/CH firm 125 7 100 0.46 9.192.28 7.5 13.78 6.16 Clay CL/CH stiff 125 11 100 0.79 >102.45 8.0 14.29 4.99 Clay CL/CH stiff 125 11 95 0.82 >102.60 8.5 22.75 3.77 Silty Clay to Clay CL very stiff 125 13 70 1.31 >102.75 9.0 118.25 0.93 Sand to Silty Sand SP/SM dense 115 22 175.4 10 89 402.90 9.5 192.33 0.78 Sand SP very dense 110 30 281.2 5 103 42 3.05 10.0 213.76 0.59 Sand SP very dense 110 33 308.4 5 106 43 3.20 10.5 219.05 0.57 Sand SP very dense 110 34 312.0 0 106 433.35 11.0 216.49 0.58 Sand SP very dense 110 33 304.5 0 105 433.50 11.5 197.62 0.74 Sand SP very dense 110 30 274.6 5 102 423.65 12.0 173.33 0.97 Sand SP very dense 110 27 237.9 10 98 423.80 12.5 161.01 1.07 Sand SP very dense 110 25 218.5 10 96 413.95 13.0 167.26 0.99 Sand SP very dense 110 26 224.3 10 96 414.13 13.5 190.54 0.74 Sand SP very dense 110 29 252.7 5 100 424.28 14.0 208.45 0.52 Sand SP very dense 110 32 273.5 0 102 424.43 14.5 216.11 0.31 Sand SP very dense 110 33 280.5 0 103 424.58 15.0 202.77 0.34 Sand SP very dense 110 31 260.4 0 101 424.73 15.5 195.39 0.42 Sand SP very dense 110 30 248.4 0 99 424.88 16.0 179.06 0.49 Sand SP very dense 110 28 225.3 5 96 425.03 16.5 133.10 0.62 Sand SP dense 110 20 165.9 10 87 405.18 17.0 73.02 1.61 Silty Sand to Sandy Silt SM/ML medium dense 115 16 90.1 30 69 385.33 17.5 38.96 1.91 Sandy Silt to Clayey Silt ML medium dense 115 11 47.6 50 51 355.48 18.0 16.47 4.50 Clay CL/CH stiff 125 13 100 0.93 >105.65 18.5 17.95 4.83 Clay CL/CH very stiff 125 14 100 1.02 >105.80 19.0 20.54 5.90 Clay CL/CH very stiff 125 16 100 1.17 >105.95 19.5 25.95 6.08 Clay CL/CH very stiff 125 21 95 1.49 >106.10 20.0 56.03 2.66 Sandy Silt to Clayey Silt ML medium dense 115 16 64.6 50 60 36
6/11/2018Vega SES Solar - Calexico, CA

CLIENT: ZGlobal CONE PENETROMETER: Middle Earth Geotesting Truck Mounted Electric
PROJECT: Vega SES Solar - Calexico, CA Cone with 23 ton reaction weight
LOCATION: See Site and Boring Location Plan DATE: 6/11/2018
DE
PT
H
GROUND ELEVATION +/-
Sand to Silty Sand SP/SM very dense
Silty Sand to Sandy Silt SM/ML dense
Silty Sand to Sandy Silt '' '' medium dense
Sandy Silt to Clayey Silt ML medium dense
Sand to Silty Sand SP/SM dense
Sand to Silty Sand '' '' dense
Clayey Silt to Silty Clay ML/CL very stiff
Clayey Silt to Silty Clay '' '' very stiff
Sand to Silty Sand SP/SM dense
Sand to Silty Sand '' '' very dense
Sand to Silty Sand '' '' very dense
Silty Sand to Sandy Silt SM/ML dense
Sand SP very dense
Sand '' '' very dense
Sand '' '' very dense
Sand '' '' very dense
Sand '' '' very dense
Sand to Silty Sand SP/SM dense
Sand to Silty Sand '' '' very dense
Sand to Silty Sand '' '' dense
END OF SOUNDING AT 20 ft.
CONE SOUNDING DATA CPT-16
PLATE
B-16
Project No.
LE18083
0 100 200 300 400
Tip Resistance (tsf)
0 2 4 6 8 10
Sleeve Friction (tsf)
0 2 4 6 8 10
Friction Ratio
10
20
30
40
50
5
15
25
35
45
55
INTERPRETED SOIL PROFILEFrom Robertson and Campanella (1989
L MAND ARKGeo-Engineers and Geologis ts

LANDMARK CONSULTANTS, INC.CONE PENETROMETER INTERPRETATION (based on Robertson & Campanella, 1989, refer to Key to CPT logs)
Project: Project No: LE18083 Date: CONE SOUNDING: CPT-16
Est. GWT (ft): 6 Phi Correlation: 0 0-Schm(78),1-R&C(83),2-PHT(74)
Base Base Avg Avg Est. Est. Rel. Nk: 17Depth Depth Tip Friction Soil Density or Density SPT Norm. % Dens. Phi Su
(m) (ft) Qc, tsf Ratio, % Classification USCS Consistency (pcf) N(60) Qc1n Fines Dr (%) (deg.) (tsf) OCR
0.15 0.5 48.36 0.82 Silty Sand to Sandy Silt SM/ML very dense 115 11 91.4 25 113 440.30 1.0 55.20 0.63 Sand to Silty Sand SP/SM very dense 115 10 104.3 20 101 420.45 1.5 42.48 0.90 Silty Sand to Sandy Silt SM/ML dense 115 9 80.3 25 85 400.60 2.0 30.99 1.46 Sandy Silt to Clayey Silt ML dense 115 9 58.6 40 71 380.75 2.5 31.76 1.15 Silty Sand to Sandy Silt SM/ML medium dense 115 7 60.0 35 68 380.93 3.0 32.29 0.80 Silty Sand to Sandy Silt SM/ML medium dense 115 7 61.0 30 65 371.08 3.5 23.69 1.02 Sandy Silt to Clayey Silt ML medium dense 115 7 44.8 40 54 361.23 4.0 26.67 1.23 Sandy Silt to Clayey Silt ML medium dense 115 8 50.4 40 55 361.38 4.5 60.98 0.58 Sand to Silty Sand SP/SM dense 115 11 115.3 15 78 391.53 5.0 96.30 0.53 Sand SP dense 110 15 179.3 10 90 411.68 5.5 78.74 0.89 Sand to Silty Sand SP/SM dense 115 14 139.6 15 82 401.83 6.0 47.53 1.31 Silty Sand to Sandy Silt SM/ML medium dense 115 11 80.5 30 66 371.98 6.5 25.26 2.61 Clayey Silt to Silty Clay ML/CL very stiff 120 10 60 1.47 >102.13 7.0 12.34 3.84 Clay CL/CH stiff 125 10 95 0.70 >102.28 7.5 17.55 3.79 Silty Clay to Clay CL very stiff 125 10 80 1.01 >102.45 8.0 32.38 2.64 Sandy Silt to Clayey Silt ML medium dense 115 9 50.5 55 52 352.60 8.5 98.05 0.77 Sand to Silty Sand SP/SM dense 115 18 150.5 10 85 402.75 9.0 68.04 1.64 Silty Sand to Sandy Silt SM/ML dense 115 15 102.7 30 73 382.90 9.5 81.16 1.44 Silty Sand to Sandy Silt SM/ML dense 115 18 120.7 25 78 39 3.05 10.0 169.86 0.63 Sand SP very dense 110 26 248.9 5 99 42 3.20 10.5 161.19 0.65 Sand SP very dense 110 25 233.1 5 97 423.35 11.0 92.45 1.66 Silty Sand to Sandy Silt SM/ML dense 115 21 131.9 25 81 393.50 11.5 55.31 2.51 Sandy Silt to Clayey Silt ML medium dense 115 16 77.8 40 65 373.65 12.0 100.22 1.40 Sand to Silty Sand SP/SM dense 115 18 139.1 20 82 403.80 12.5 182.11 0.85 Sand SP very dense 110 28 249.5 5 99 423.95 13.0 186.13 0.91 Sand SP very dense 110 29 252.1 10 100 424.13 13.5 196.88 1.01 Sand SP very dense 110 30 263.6 10 101 424.28 14.0 188.54 0.83 Sand SP very dense 110 29 249.6 5 99 424.43 14.5 210.71 0.84 Sand SP very dense 110 32 276.0 5 102 424.58 15.0 218.84 1.03 Sand SP very dense 110 34 283.6 10 103 424.73 15.5 189.09 1.11 Sand SP very dense 110 29 242.5 10 99 424.88 16.0 157.31 1.07 Sand SP very dense 110 24 199.7 15 93 415.03 16.5 177.55 0.99 Sand SP very dense 110 27 223.1 10 96 415.18 17.0 165.18 1.16 Sand to Silty Sand SP/SM very dense 115 30 205.4 15 94 415.33 17.5 129.36 1.28 Sand to Silty Sand SP/SM dense 115 24 159.2 20 86 405.48 18.0 106.44 1.36 Sand to Silty Sand SP/SM dense 115 19 129.6 20 80 395.65 18.5 159.79 0.97 Sand SP very dense 110 25 192.7 10 92 415.80 19.0 153.33 1.36 Sand to Silty Sand SP/SM very dense 115 28 183.1 20 90 415.95 19.5 86.09 2.14 Silty Sand to Sandy Silt SM/ML dense 115 19 101.8 35 73 386.10 20.0 172.03 1.25 Sand to Silty Sand SP/SM very dense 115 31 201.5 15 93 41
6/11/2018Vega SES Solar - Calexico, CA

Geotechnical Parameters from CPT Data: Equivalent SPT N(60) blow count = Qc/(Qc/N Ratio)
N1(60) = Cn*N(60) Normalized SPT blow count
Cn = 1/(p'o)^0.5 < 1.6 max. from Liao & Whitman (1986)
p'o = effective overburden pressure (tsf) using unit densities
given below and estimated groundwater table.
Dr = Relative density (%) from Jamiolkowski et. al. (1986) relationship
= -98 +68*log(Qc/p'o^0.5) where Qc, p'o in tonne/sqm
Note: 1 tonne/sqm = 0.1024 tsf, 1 bar =1.0443 tsf
Phi = Friction Angle estimated from either:
1. Roberton & Campanella (1983) chart:
Phi = 5.3 + 24*(log(Qc/p'o))+3(log(Qc/p'o))^2
2. Peck, Hansen & Thornburn (1974) N-Phi Correlation
3. Schmertman (1978) chart [Phi = 28+0.14*Dr for fine uniform sands]
Su = undrained shear strength (tsf)
= (Qc-p'o)/Nk where Nk varies from 10 to 22, 17 for OC clays
OCR = Overconsolidation Ratio estimated from Schmertman (1978)
chart using Su/p'o ratio and estimated normal consolidated Su/p'o
Note: Assumed Properties and Adopted Qc/N Ratio based on correlations from Imperial Valley, California soils
Density R&C Adopted Est. Fines D50 Su Zone UCS (pcf) Qc/N Qc/N PI (%) (mm) (tsf) Consistency
1 Sensitive fine grained ML 120 2 2 NP-15 65-100 0.02 0-0.13 very soft
2 Organic Material OL/OH 120 1 1 -- -- -- 0.13-.25 soft
3 Clay CL/CH 125 1 1.25 25-40+ 90-100 0.002 0.25-0.5 firm
4 Silty Clay to Clay CL 125 1.5 2 15-40 90-100 0.01 0.5-1.0 stiff
5 Clayey Silt to Silty Clay ML/CL 120 2 2.75 25-May 90-100 0.02 1.0-2.0 very stiff
6 Sandy Silt to Clayey Silt ML 115 2.5 3.5 NP-10 65-100 0.04 >2.0 hard
7 Silty Sand to Sandy Silt SM/ML 115 3 5 NP 35-75 0.075 Dr (%) Relative Density
8 Sand to Silty Sand SP/SM 115 4 6 NP May-35 0.15 0-15 very loose
9 Sand SP 110 5 6.5 NP 0-5 0.3 15-35 loose
10 Gravelly Sand to Sand SW 115 6 7.5 NP 0-5 0.6 35-65 medium dense
11 Overconsolidated Soil -- 120 1 1 NP 90-100 0.01 65-85 dense
12 Sand to Clayey Sand SP/SC 115 2 2 NP-5 -- --- >85 very dense
Project No: LE18083PlateB-17Key to CPT Interpretation of Logs
Simplified Soil Classification ChartAfter Robertson & Campanella (1989)
Soil
Classification
Table of Soil Types and Assumed Properties
ClaySilty Clay to Clay
Clayey Silt to Silty ClaySandy Silt to Clayey Silt
Silty Sand to Sandy SiltSand to Silty Sand
SandGravelly Sand to Sand
0
1
2
3
4
5
6
7
8
9
10
0.0001 0.001 0.01 0.1 1
Variation of Qc/N Ratio with Grain Size
Robertson & Campanella (1985) Relationship
Adopted relationship for Imperial Valley
All Imperial Valley Sites (Est. D50)
Youd & Bennet )1983) Imperial Valley Sites
Imperial Valley Sites with Lab D50
L MAND ARKGeo-Engineers and Geologis ts

APPENDIX C

CLIENT:PROJECT:
JOB No.:DATE:
Sample Liquid Plastic Plasticity USCSSample Depth Limit Limit Index ClassificationLocation (ft) (LL) (PL) (PI)
CPT-1 0-3 53 19 34 CHCPT-2 0-3 24 13 11 CLCPT-5 0-3 23 16 7 CL-MLCPT-6 0-3 25 16 9 CLCPT-7 0-3 25 16 9 CL
CPT-15 0-3 NL NP MLCPT-6 0-3 26 13 13 CL
Project No.: LE18083
Atterberg LimitsTest Results
C-1
Plate
LANDMARK CONSULTANTS, INC.
ATTERBERG LIMITS (ASTM D4318)
Z Global
Vega SES Solar Site - El Centro, CA
LE18083
06/26/18
0
10
20
30
40
50
60
70
0 10 20 30 40 50 60 70 80 90 100 110 120
Pla
stic
ity
Ind
ex, %
Liquid Limit, %
PLASTICITY CHART
CPT-1 @ 0-3 ft CPT-2 @ 0-3 ft
CPT-5 @ 0-3 ft CPT-6 @ 0-3 ft
CPT-7 @ 0-3 ft CPT-15 @ 0-3 ft
CPT-6 @ 0-3 ft
MH or OH
CH
CL
ML or OLCL-ML

Project No.: Sampled By: Project Name: Date Sampled:
Client Name: Date Tested: Tested By:
Soil LAB WET DRY MOIST.Type NO. WEIGHT WEIGHT (%)
Project No.: LE18083
Selected ChemicalTest Results
PlateC-2
CPT-7
CPT-4
CPT-5
SAMPLE LOCATION
LANDMARK CONSULTANTS, INC.El Centro, California
MOISTURE CONTENT TEST RESULTSASTM D - 2216/CALTRAN 226
CPT-1
LE18083Vega SES Solar SiteZ Global
CPT-2
CPT-3 468.9 7.5
401.4
397.1 28.1
408.5 23.1
508.6
503
504
505.7 26.0
461.9 10.1CPT-8
508.2
503
509.1SC
SC
SM 508.6
CPT-6
CH
CL
SM
SM
SC 422.9
489.9
P. LaBrucherie6/12/20186/13/2018AM
419.1 21.5
18.9
3.7

Project No.: Sampled By: Project Name: Date Sampled:
Client Name: Date Tested: Tested By:
Soil LAB WET DRY MOIST.Type NO. WEIGHT WEIGHT (%)
Project No.: LE18083
Selected ChemicalTest Results
PlateC-3
CPT-15
CPT-12
CPT-13
SAMPLE LOCATION
LANDMARK CONSULTANTS, INC.El Centro, California
MOISTURE CONTENT TEST RESULTSASTM D - 2216/CALTRAN 226
CPT-9
LE18083Vega SES Solar SiteZ Global
CPT-10
CPT-11 487.0 2.9
442.6
454.7 11.7
478.3 6.1
507.8
507.4
501.0
502.9 13.6
439.6 15.7CPT-16
508.4
505.9
502.0SM
SC
SC 508.4
CPT-14
SM
SM
SM
SM
SM 486.7
487.1
P. LaBrucherie6/12/20186/13/2018AM
458.4 9.5
3.9
4.4

CLIENT:PROJECT:
JOB No.:DATE:
Boring: CPT-1 CPT-4 CPT-6 CPT-9 CPT-13 CPT-16 CaltransSample Depth, ft: 0-3 0-3 0-3 0-3 0-3 0-3 Method
pH: 7.6 8.0 7.6 7.9 8.3 7.9 643
Electrical Conductivity (mmhos): 4.9 0.2 0.6 0.4 0.2 0.3 424
Resistivity (ohm-cm): -- -- -- -- -- -- 643
Chloride (Cl), ppm: 2,380 30 130 80 20 60 422
Sulfate (SO4), ppm: 9,273 26 485 397 0 26 417
Material Chemical Range Degree ofAffected Agent of Values Corrosivity
Concrete Soluble 0 - 1,000 LowSulfates 1,000 - 2,000 Moderate(ppm) 2,000 - 20,000 Severe
> 20,000 Very Severe
Normal Soluble 0 - 200 LowGrade Chlorides 200 - 700 ModerateSteel (ppm) 700 - 1,500 Severe
> 1,500 Very Severe
Normal Resistivity 1 - 1,000 Very SevereGrade (ohm-cm) 1,000 - 2,000 SevereSteel 2,000 - 10,000 Moderate
> 10,000 Low
Project No.: LE18083
General Guidelines for Soil Corrosivity
Selected ChemicalTest Results
C-4
Plate
LANDMARK CONSULTANTS, INC.
CHEMICAL ANALYSIS
Z Global
Vega SES Solar Site - El Centro, CA
LE18083
06/26/18

SIEVE ANALYSIS HYDROMETER ANALYSIS
Gravel Sand Silt and Clay Fraction
Coarse Fine Coarse Medium Fine
PlateProject No.: LE18083 Grain Size Analysis C-5
0
10
20
30
40
50
60
70
80
90
100
0.0010.010.1110100
Per
cen
t P
assi
ng
by
Wei
gh
t
Particle Size (mm)
CPT-3 @ 0-3 ft.
L MAND ARKGe o-Enginee rs and Geolog ists
0
10
20
30
40
50
60
70
80
90
0.0010.0100.1001.00010.000100.000
Per
cen
t P
assi
ng
by
Wei
gh
t
Particle Size (mm)
CPT-3 @ 0-3 ft.
CPT-4 @ 0-3 ft.
CPT-8 @ 0-3 ft.
CPT-9 @ 0-3 ft.

SIEVE ANALYSIS HYDROMETER ANALYSIS
Gravel Sand Silt and Clay Fraction
Coarse Fine Coarse Medium Fine
PlateProject No.: LE18083 Grain Size Analysis C-6
0
10
20
30
40
50
60
70
80
90
100
0.0010.010.1110100
Per
cen
t P
assi
ng
by
Wei
gh
t
Particle Size (mm)
CPT-10 @ 0-…
L MAND ARKGe o-Enginee rs and Geolog ists
0
10
20
30
40
50
60
70
80
90
0.0010.0100.1001.00010.000100.000
Per
cen
t P
assi
ng
by
Wei
gh
t
Particle Size (mm)
CPT-10 @ 0-3 ft.
CPT-11 @ 0-3 ft.
CPT-12 @ 0-3 ft.
CPT-13 @ 0-3 ft.
CPT-14 @ 0-3 ft.

SIEVE ANALYSIS HYDROMETER ANALYSIS
Gravel Sand Silt and Clay Fraction
Coarse Fine Coarse Medium Fine
PlateProject No.: LE18083 Grain Size Analysis C-7
0
10
20
30
40
50
60
70
80
90
100
0.0010.010.1110100
Per
cen
t P
assi
ng
by
Wei
gh
t
Particle Size (mm)
CPT-1 @ 0-3 ft.
L MAND ARKGe o-Enginee rs and Geolog ists
0
10
20
30
40
50
60
70
80
90
0.0010.0100.1001.00010.000100.000
Per
cen
t P
assi
ng
by
Wei
gh
t
Particle Size (mm)
CPT-1 @ 0-3 ft.
CPT-2 @ 0-3 ft.
CPT-5 @ 0-3 ft.
CPT-6 @ 0-3 ft.
CPT-7 @ 0-3 ft.

SIEVE ANALYSIS HYDROMETER ANALYSIS
Gravel Sand Silt and Clay Fraction
Coarse Fine Coarse Medium Fine
PlateProject No.: LE18083 Grain Size Analysis C-8
0
10
20
30
40
50
60
70
80
90
100
0.0010.010.1110100
Per
cen
t P
assi
ng
by
Wei
gh
t
Particle Size (mm)
CPT-15 @ 0-…
L MAND ARKGe o-Enginee rs and Geolog ists
0
10
20
30
40
50
60
70
80
90
0.0010.0100.1001.00010.000100.000
Per
cen
t P
assi
ng
by
Wei
gh
t
Particle Size (mm)
CPT-15 @ 0-3 ft.
CPT-16 @ 0-3 ft.

APPENDIX D

L I Q U E F A C T I O N A N A L Y S I S R E P O R T
Input parameters and analysis dataAnalysis method:Fines correction method:Points to test:Earthquake magnitude Mw:Peak ground acceleration:
NCEER (1998)NCEER (1998)Based on Ic value7.000.50
G.W.T. (in-situ):G.W.T. (earthq.):Average results interval:Ic cut-off value:Unit weight calculation:
Project title : Vega SES Solar Location :
Landmark Consultants, Inc.780 N. 4th StreetEl Centro, CA 92243
CPT file : CPT-06
7.00 ft7.00 ft32.60Based on SBT
Use fill:Fill height:Fill weight:Trans. detect. applied:Kσ applied:
NoN/AN/AYesYes
Clay like behaviorapplied:Limit depth applied:Limit depth:MSF method:
Sands onlyNoN/AMethod based
Cone resistance
qt (tsf)300200100
Dept
h (f
t)
50484644424038363432302826242220181614121086420
Cone resistance SBTn Plot
Ic (Robertson 1990)4321
50484644424038363432302826242220181614121086420
SBTn Plot CRR plot
CRR & CSR0.60.40.20
50484644424038363432302826242220181614121086420
CRR plot
During earthq.
Qtn,cs200180160140120100806040200
Cycl
ic S
tres
s Ra
tio*
(CSR
*)
0.8
0.7
0.6
0.5
0.4
0.3
0.2
0.1
0
Liquefaction
No Liquefaction
Normalized friction ratio (%)0.1 1 10
Norm
aliz
ed C
PT p
enet
ratio
n re
sist
ance
1
10
100
1,000
Friction Ratio
Rf (%)1086420
50484644424038363432302826242220181614121086420
Friction Ratio
Mw=71/2, sigma'=1 atm base curve Summary of liquefaction potential
FS Plot
Factor of safety21.510.50
50484644424038363432302826242220181614121086420
FS Plot
During earthq.
Zone A1: Cyclic liquefaction likely depending on size and duration of cyclic loadingZone A2: Cyclic liquefaction and strength loss likely depending on loading and groundgeometryZone B: Liquefaction and post-earthquake strength loss unlikely, check cyclic softeningZone C: Cyclic liquefaction and strength loss possible depending on soil plasticity,brittleness/sensitivity, strain to peak undrained strength and ground geometry
CLiq v.2.2.0.32 - CPT Liquefaction Assessment Software - Report created on: 6/27/2018, 10:07:02 AMProject file:
1

This software is licensed to: Landmark Consultants, Inc CPT name: CPT-06
Cone resistance
qt (tsf)300200100
Dept
h (ft
)
50
48
46
44
42
40
38
36
34
32
30
28
26
24
22
20
18
16
14
12
10
8
6
4
2
0Cone resistance
C P T b a s i c i n t e r p r e t a t i o n p l o t sFriction Ratio
Rf (%)1086420
Dept
h (ft
)
50
48
46
44
42
40
38
36
34
32
30
28
26
24
22
20
18
16
14
12
10
8
6
4
2
0Friction Ratio Pore pressure
u (psi)151050
Dept
h (f
t)
50
48
46
44
42
40
38
36
34
32
30
28
26
24
22
20
18
16
14
12
10
8
6
4
2
0Pore pressure
Insitu
SBT Plot
Ic(SBT)4321
Dept
h (f
t)
50
48
46
44
42
40
38
36
34
32
30
28
26
24
22
20
18
16
14
12
10
8
6
4
2
0SBT Plot Soil Behaviour Type
SBT (Robertson et al. 1986)1817161514131211109876543210
Dept
h (f
t)
50
48
46
44
42
40
38
36
34
32
30
28
26
24
22
20
18
16
14
12
10
8
6
4
2
0Soil Behaviour Type
Sand & silty sand
Clay & silty clay
Clay & silty claySilty sand & sandy siltClay & silty clayClayClay & silty claySilty sand & sandy siltClay & silty clay
Clay
Clay & silty claySilty sand & sandy siltSilty sand & sandy siltSand & silty sand
Silty sand & sandy siltClay & silty clay
Clay
Clay & silty clayClay & silty clayClay & silty clay
Clay
Clay & silty claySilty sand & sandy siltClayClayClayClay
Clay & silty clay
Clay & silty clayClay
CLiq v.2.2.0.32 - CPT Liquefaction Assessment Software - Report created on: 6/27/2018, 10:07:02 AM 2Project file:
Input parameters and analysis dataAnalysis method:Fines correction method:Points to test:Earthquake magnitude Mw:Peak ground acceleration:Depth to water table (insitu):
NCEER (1998)NCEER (1998)Based on Ic value7.000.507.00 ft
Depth to water table (erthq.):Average results interval:Ic cut-off value:Unit weight calculation:Use fill:Fill height:
7.00 ft32.60Based on SBTNoN/A
Fill weight:Transition detect. applied:Kσ applied:Clay like behavior applied:Limit depth applied:Limit depth:
N/AYesYesSands onlyNoN/A
SBT legend1. Sensitive fine grained2. Organic material3. Clay to silty clay
4. Clayey silt to silty5. Silty sand to sandy silt6. Clean sand to silty sand
7. Gravely sand to sand8. Very stiff sand to9. Very stiff fine grained

This software is licensed to: Landmark Consultants, Inc CPT name: CPT-06
Cone resistance
qt (tsf)300200100
Dept
h (f
t)
50
48
46
44
42
40
38
36
34
32
30
28
26
24
22
20
18
16
14
12
10
8
6
4
2
0Cone resistance SBTn Plot
Ic (Robertson 1990)4321
Dept
h (f
t)
50
48
46
44
42
40
38
36
34
32
30
28
26
24
22
20
18
16
14
12
10
8
6
4
2
0SBTn Plot FS Plot
Factor of safety21.510.50
Dept
h (f
t)
50
48
46
44
42
40
38
36
34
32
30
28
26
24
22
20
18
16
14
12
10
8
6
4
2
0FS Plot
During earthq.
Vertical settlements
Settlement (in)0.250.20.150.10.050
Dept
h (f
t)
50
48
46
44
42
40
38
36
34
32
30
28
26
24
22
20
18
16
14
12
10
8
6
4
2
0Vertical settlements
E s t i m a t i o n o f p o s t - e a r t h q u a k e s e t t l e m e n t s
Strain plot
Volumentric strain (%)6543210
Dept
h (f
t)
50
48
46
44
42
40
38
36
34
32
30
28
26
24
22
20
18
16
14
12
10
8
6
4
2
0Strain plot
CLiq v.2.2.0.32 - CPT Liquefaction Assessment Software - Report created on: 6/27/2018, 10:07:02 AM 3Project file:
Abbreviationsqt:Ic:FS:Volumentric strain:
Total cone resistance (cone resistance qc corrected for pore water effects)Soil Behaviour Type IndexCalculated Factor of Safety against liquefactionPost-liquefaction volumentric strain

This software is licensed to: Landmark Consultants, Inc CPT name: CPT-06
:: Post-earthquake settlement due to soil liquefaction ::
Depth(ft)
FSQtn,cs ev (%) Settlement(in)
Depth(ft)
FSQtn,cs ev (%) Settlement(in)
DF DF
7.05 138.10 2.00 0.00 0.000.88 7.22 148.49 2.00 0.00 0.000.887.38 157.96 2.00 0.00 0.000.87 7.55 163.20 2.00 0.00 0.000.877.71 165.08 2.00 0.00 0.000.87 7.87 159.01 2.00 0.00 0.000.878.04 146.93 2.00 0.00 0.000.86 8.20 134.30 2.00 0.00 0.000.868.37 123.39 2.00 0.00 0.000.86 8.53 117.84 2.00 0.00 0.000.868.69 115.12 2.00 0.00 0.000.85 8.86 117.54 2.00 0.00 0.000.859.02 118.46 2.00 0.00 0.000.85 9.19 105.66 2.00 0.00 0.000.849.35 108.91 2.00 0.00 0.000.84 9.51 121.27 2.00 0.00 0.000.849.68 119.80 0.59 1.68 0.030.84 9.84 110.25 0.50 1.80 0.040.8310.01 95.21 2.00 0.00 0.000.83 10.17 93.27 2.00 0.00 0.000.8310.33 93.07 2.00 0.00 0.000.82 10.50 94.63 2.00 0.00 0.000.8210.66 97.42 2.00 0.00 0.000.82 10.83 98.37 2.00 0.00 0.000.8210.99 102.48 2.00 0.00 0.000.81 11.15 111.49 2.00 0.00 0.000.8111.32 116.76 2.00 0.00 0.000.81 11.48 112.13 2.00 0.00 0.000.8111.65 93.66 2.00 0.00 0.000.80 11.81 80.42 2.00 0.00 0.000.8011.98 80.45 2.00 0.00 0.000.80 12.14 98.20 2.00 0.00 0.000.7912.30 120.45 2.00 0.00 0.000.79 12.47 142.03 2.00 0.00 0.000.7912.63 160.07 2.00 0.00 0.000.79 12.80 168.64 2.00 0.00 0.000.7812.96 168.25 2.00 0.00 0.000.78 13.12 158.07 2.00 0.00 0.000.7813.29 149.52 2.00 0.00 0.000.77 13.45 144.96 2.00 0.00 0.000.7713.62 147.59 2.00 0.00 0.000.77 13.78 150.62 2.00 0.00 0.000.7713.94 151.00 2.00 0.00 0.000.76 14.11 147.78 2.00 0.00 0.000.7614.27 140.63 2.00 0.00 0.000.76 14.44 136.21 2.00 0.00 0.000.7614.60 135.78 2.00 0.00 0.000.75 14.76 139.91 2.00 0.00 0.000.7514.93 143.63 2.00 0.00 0.000.75 15.09 146.13 2.00 0.00 0.000.7415.26 148.26 2.00 0.00 0.000.74 15.42 151.72 2.00 0.00 0.000.7415.58 154.42 2.00 0.00 0.000.74 15.75 154.90 2.00 0.00 0.000.7315.91 153.97 2.00 0.00 0.000.73 16.08 152.50 2.00 0.00 0.000.7316.24 152.74 2.00 0.00 0.000.72 16.40 150.86 2.00 0.00 0.000.7216.57 148.59 2.00 0.00 0.000.72 16.73 146.17 2.00 0.00 0.000.7216.90 143.64 2.00 0.00 0.000.71 17.06 140.33 2.00 0.00 0.000.7117.22 135.45 2.00 0.00 0.000.71 17.39 135.66 2.00 0.00 0.000.7117.55 142.19 2.00 0.00 0.000.70 17.72 150.41 2.00 0.00 0.000.7017.88 156.23 2.00 0.00 0.000.70 18.04 157.30 2.00 0.00 0.000.6918.21 155.51 2.00 0.00 0.000.69 18.37 151.60 2.00 0.00 0.000.6918.54 147.41 2.00 0.00 0.000.69 18.70 143.59 2.00 0.00 0.000.6818.86 144.05 2.00 0.00 0.000.68 19.03 146.99 2.00 0.00 0.000.6819.19 150.70 2.00 0.00 0.000.67 19.36 151.34 2.00 0.00 0.000.6719.52 150.79 2.00 0.00 0.000.67 19.69 151.44 2.00 0.00 0.000.6719.85 153.12 2.00 0.00 0.000.66 20.01 154.53 2.00 0.00 0.000.6620.18 153.98 2.00 0.00 0.000.66 20.34 151.26 2.00 0.00 0.000.6620.51 147.81 2.00 0.00 0.000.65 20.67 143.66 2.00 0.00 0.000.6520.83 140.75 2.00 0.00 0.000.65 21.00 140.62 2.00 0.00 0.000.6421.16 143.38 2.00 0.00 0.000.64 21.33 150.21 2.00 0.00 0.000.6421.49 147.40 2.00 0.00 0.000.64 21.65 154.17 2.00 0.00 0.000.6321.82 192.86 2.00 0.00 0.000.63 21.98 218.71 2.00 0.00 0.000.6322.15 208.23 2.00 0.00 0.000.62 22.31 179.56 1.17 0.17 0.000.6222.47 146.53 0.70 0.88 0.020.62 22.64 120.53 0.46 1.24 0.020.62
CLiq v.2.2.0.32 - CPT Liquefaction Assessment Software - Report created on: 6/27/2018, 10:07:02 AM 4Project file:

This software is licensed to: Landmark Consultants, Inc CPT name: CPT-06
:: Post-earthquake settlement due to soil liquefaction :: (continued)
Depth(ft)
FSQtn,cs ev (%) Settlement(in)
Depth(ft)
FSQtn,cs ev (%) Settlement(in)
DF DF
22.80 109.97 0.38 1.33 0.030.61 22.97 107.33 0.37 1.35 0.030.6123.13 108.85 0.37 1.33 0.030.61 23.29 120.66 0.46 1.21 0.020.6123.46 136.04 0.59 1.09 0.020.60 23.62 156.77 2.00 0.00 0.000.6023.79 173.28 2.00 0.00 0.000.60 23.95 180.41 2.00 0.00 0.000.5924.11 187.33 2.00 0.00 0.000.59 24.28 207.72 2.00 0.00 0.000.5924.44 252.11 2.00 0.00 0.000.59 24.61 302.52 2.00 0.00 0.000.5824.77 343.77 2.00 0.00 0.000.58 24.93 347.09 2.00 0.00 0.000.5825.10 320.48 2.00 0.00 0.000.57 25.26 283.63 2.00 0.00 0.000.5725.43 255.38 2.00 0.00 0.000.57 25.59 239.19 2.00 0.00 0.000.5725.75 223.36 2.00 0.00 0.000.56 25.92 216.58 2.00 0.00 0.000.5626.08 219.91 2.00 0.00 0.000.56 26.25 212.16 2.00 0.00 0.000.5626.41 206.90 2.00 0.00 0.000.55 26.57 207.86 2.00 0.00 0.000.5526.74 221.20 2.00 0.00 0.000.55 26.90 231.52 2.00 0.00 0.000.5427.07 227.91 2.00 0.00 0.000.54 27.23 224.98 2.00 0.00 0.000.5427.40 217.58 2.00 0.00 0.000.54 27.56 208.07 2.00 0.00 0.000.5327.72 194.12 2.00 0.00 0.000.53 27.89 178.25 2.00 0.00 0.000.5328.05 158.52 2.00 0.00 0.000.52 28.22 145.04 2.00 0.00 0.000.5228.38 135.57 2.00 0.00 0.000.52 28.54 129.46 2.00 0.00 0.000.5228.71 124.28 2.00 0.00 0.000.51 28.87 123.28 2.00 0.00 0.000.5129.04 126.27 2.00 0.00 0.000.51 29.20 129.12 2.00 0.00 0.000.5129.36 131.42 2.00 0.00 0.000.50 29.53 131.98 2.00 0.00 0.000.5029.69 133.53 2.00 0.00 0.000.50 29.86 133.83 2.00 0.00 0.000.4930.02 133.63 2.00 0.00 0.000.49 30.18 130.16 2.00 0.00 0.000.4930.35 125.48 2.00 0.00 0.000.49 30.51 121.72 2.00 0.00 0.000.4830.68 121.19 2.00 0.00 0.000.48 30.84 122.90 2.00 0.00 0.000.4831.00 124.69 2.00 0.00 0.000.47 31.17 125.14 2.00 0.00 0.000.4731.33 124.36 2.00 0.00 0.000.47 31.50 123.22 2.00 0.00 0.000.4731.66 121.89 2.00 0.00 0.000.46 31.82 120.92 2.00 0.00 0.000.4631.99 119.89 2.00 0.00 0.000.46 32.15 118.85 2.00 0.00 0.000.4632.32 117.01 2.00 0.00 0.000.45 32.48 115.81 2.00 0.00 0.000.4532.64 115.70 2.00 0.00 0.000.45 32.81 119.36 2.00 0.00 0.000.4432.97 122.49 2.00 0.00 0.000.44 33.14 124.82 2.00 0.00 0.000.4433.30 122.28 2.00 0.00 0.000.44 33.46 119.14 2.00 0.00 0.000.4333.63 114.22 2.00 0.00 0.000.43 33.79 110.01 2.00 0.00 0.000.4333.96 107.42 2.00 0.00 0.000.42 34.12 109.30 2.00 0.00 0.000.4234.28 114.27 2.00 0.00 0.000.42 34.45 117.16 2.00 0.00 0.000.4234.61 115.66 2.00 0.00 0.000.41 34.78 111.31 2.00 0.00 0.000.4134.94 107.55 2.00 0.00 0.000.41 35.10 109.34 2.00 0.00 0.000.4135.27 115.50 2.00 0.00 0.000.40 35.43 124.34 2.00 0.00 0.000.4035.60 127.76 2.00 0.00 0.000.40 35.76 125.34 2.00 0.00 0.000.3935.93 119.95 2.00 0.00 0.000.39 36.09 117.76 2.00 0.00 0.000.3936.25 121.26 2.00 0.00 0.000.39 36.42 125.36 2.00 0.00 0.000.3836.58 127.14 2.00 0.00 0.000.38 36.75 124.62 2.00 0.00 0.000.3836.91 119.94 2.00 0.00 0.000.37 37.07 115.91 2.00 0.00 0.000.3737.24 113.88 2.00 0.00 0.000.37 37.40 112.79 2.00 0.00 0.000.3737.57 112.35 2.00 0.00 0.000.36 37.73 111.72 2.00 0.00 0.000.3637.89 110.98 2.00 0.00 0.000.36 38.06 110.37 2.00 0.00 0.000.3538.22 111.46 2.00 0.00 0.000.35 38.39 115.37 2.00 0.00 0.000.35
CLiq v.2.2.0.32 - CPT Liquefaction Assessment Software - Report created on: 6/27/2018, 10:07:02 AM 5Project file:
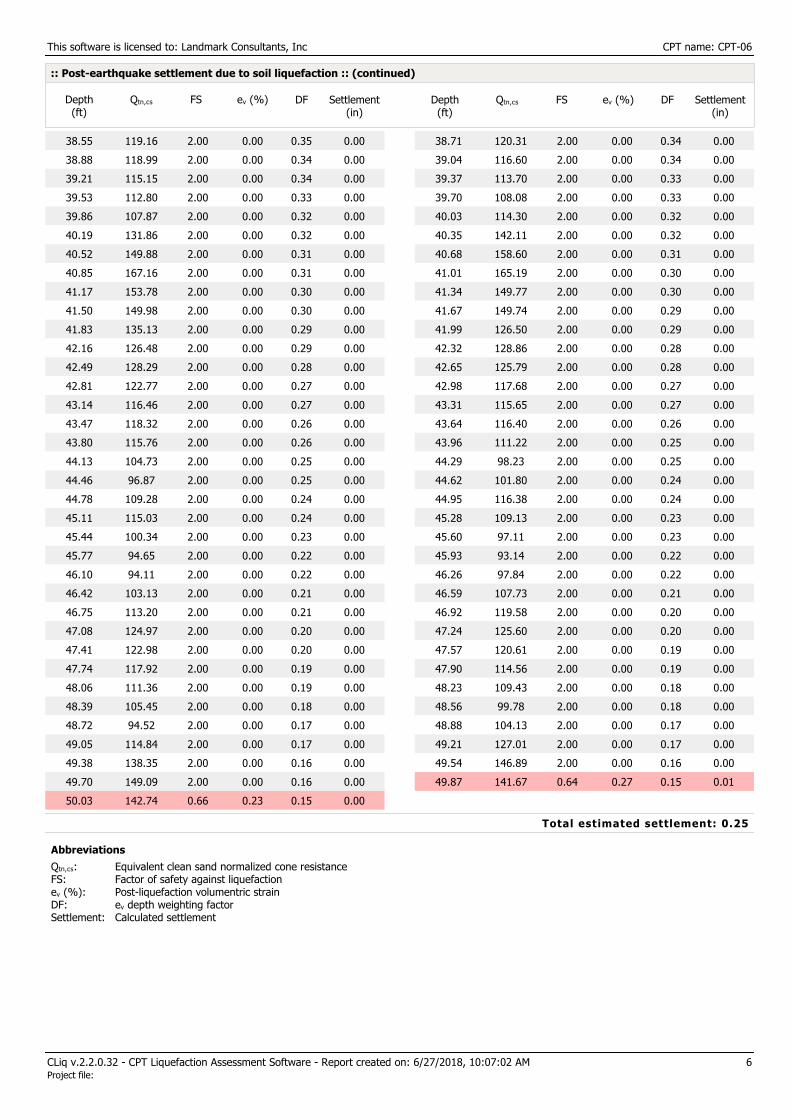
This software is licensed to: Landmark Consultants, Inc CPT name: CPT-06
:: Post-earthquake settlement due to soil liquefaction :: (continued)
Depth(ft)
FSQtn,cs ev (%) Settlement(in)
Depth(ft)
FSQtn,cs ev (%) Settlement(in)
DF DF
38.55 119.16 2.00 0.00 0.000.35 38.71 120.31 2.00 0.00 0.000.3438.88 118.99 2.00 0.00 0.000.34 39.04 116.60 2.00 0.00 0.000.3439.21 115.15 2.00 0.00 0.000.34 39.37 113.70 2.00 0.00 0.000.3339.53 112.80 2.00 0.00 0.000.33 39.70 108.08 2.00 0.00 0.000.3339.86 107.87 2.00 0.00 0.000.32 40.03 114.30 2.00 0.00 0.000.3240.19 131.86 2.00 0.00 0.000.32 40.35 142.11 2.00 0.00 0.000.3240.52 149.88 2.00 0.00 0.000.31 40.68 158.60 2.00 0.00 0.000.3140.85 167.16 2.00 0.00 0.000.31 41.01 165.19 2.00 0.00 0.000.3041.17 153.78 2.00 0.00 0.000.30 41.34 149.77 2.00 0.00 0.000.3041.50 149.98 2.00 0.00 0.000.30 41.67 149.74 2.00 0.00 0.000.2941.83 135.13 2.00 0.00 0.000.29 41.99 126.50 2.00 0.00 0.000.2942.16 126.48 2.00 0.00 0.000.29 42.32 128.86 2.00 0.00 0.000.2842.49 128.29 2.00 0.00 0.000.28 42.65 125.79 2.00 0.00 0.000.2842.81 122.77 2.00 0.00 0.000.27 42.98 117.68 2.00 0.00 0.000.2743.14 116.46 2.00 0.00 0.000.27 43.31 115.65 2.00 0.00 0.000.2743.47 118.32 2.00 0.00 0.000.26 43.64 116.40 2.00 0.00 0.000.2643.80 115.76 2.00 0.00 0.000.26 43.96 111.22 2.00 0.00 0.000.2544.13 104.73 2.00 0.00 0.000.25 44.29 98.23 2.00 0.00 0.000.2544.46 96.87 2.00 0.00 0.000.25 44.62 101.80 2.00 0.00 0.000.2444.78 109.28 2.00 0.00 0.000.24 44.95 116.38 2.00 0.00 0.000.2445.11 115.03 2.00 0.00 0.000.24 45.28 109.13 2.00 0.00 0.000.2345.44 100.34 2.00 0.00 0.000.23 45.60 97.11 2.00 0.00 0.000.2345.77 94.65 2.00 0.00 0.000.22 45.93 93.14 2.00 0.00 0.000.2246.10 94.11 2.00 0.00 0.000.22 46.26 97.84 2.00 0.00 0.000.2246.42 103.13 2.00 0.00 0.000.21 46.59 107.73 2.00 0.00 0.000.2146.75 113.20 2.00 0.00 0.000.21 46.92 119.58 2.00 0.00 0.000.2047.08 124.97 2.00 0.00 0.000.20 47.24 125.60 2.00 0.00 0.000.2047.41 122.98 2.00 0.00 0.000.20 47.57 120.61 2.00 0.00 0.000.1947.74 117.92 2.00 0.00 0.000.19 47.90 114.56 2.00 0.00 0.000.1948.06 111.36 2.00 0.00 0.000.19 48.23 109.43 2.00 0.00 0.000.1848.39 105.45 2.00 0.00 0.000.18 48.56 99.78 2.00 0.00 0.000.1848.72 94.52 2.00 0.00 0.000.17 48.88 104.13 2.00 0.00 0.000.1749.05 114.84 2.00 0.00 0.000.17 49.21 127.01 2.00 0.00 0.000.1749.38 138.35 2.00 0.00 0.000.16 49.54 146.89 2.00 0.00 0.000.1649.70 149.09 2.00 0.00 0.000.16 49.87 141.67 0.64 0.27 0.010.1550.03 142.74 0.66 0.23 0.000.15
Total estimated settlement: 0.25
AbbreviationsQtn,cs:FS:ev (%):DF:Settlement:
Equivalent clean sand normalized cone resistanceFactor of safety against liquefactionPost-liquefaction volumentric strainev depth weighting factorCalculated settlement
CLiq v.2.2.0.32 - CPT Liquefaction Assessment Software - Report created on: 6/27/2018, 10:07:02 AM 6Project file:

L I Q U E F A C T I O N A N A L Y S I S R E P O R T
Input parameters and analysis dataAnalysis method:Fines correction method:Points to test:Earthquake magnitude Mw:Peak ground acceleration:
NCEER (1998)NCEER (1998)Based on Ic value7.000.50
G.W.T. (in-situ):G.W.T. (earthq.):Average results interval:Ic cut-off value:Unit weight calculation:
Project title : Vega SES Solar Location :
Landmark Consultants, Inc.780 N. 4th StreetEl Centro, CA 92243
CPT file : CPT-07
7.00 ft7.00 ft32.60Based on SBT
Use fill:Fill height:Fill weight:Trans. detect. applied:Kσ applied:
NoN/AN/AYesYes
Clay like behaviorapplied:Limit depth applied:Limit depth:MSF method:
Sands onlyNoN/AMethod based
Cone resistance
qt (tsf)400200
Dept
h (f
t)
50484644424038363432302826242220181614121086420
Cone resistance SBTn Plot
Ic (Robertson 1990)4321
50484644424038363432302826242220181614121086420
SBTn Plot CRR plot
CRR & CSR0.60.40.20
50484644424038363432302826242220181614121086420
CRR plot
During earthq.
Qtn,cs200180160140120100806040200
Cycl
ic S
tres
s Ra
tio*
(CSR
*)
0.8
0.7
0.6
0.5
0.4
0.3
0.2
0.1
0
Liquefaction
No Liquefaction
Normalized friction ratio (%)0.1 1 10
Norm
aliz
ed C
PT p
enet
ratio
n re
sist
ance
1
10
100
1,000
Friction Ratio
Rf (%)1086420
50484644424038363432302826242220181614121086420
Friction Ratio
Mw=71/2, sigma'=1 atm base curve Summary of liquefaction potential
FS Plot
Factor of safety21.510.50
50484644424038363432302826242220181614121086420
FS Plot
During earthq.
Zone A1: Cyclic liquefaction likely depending on size and duration of cyclic loadingZone A2: Cyclic liquefaction and strength loss likely depending on loading and groundgeometryZone B: Liquefaction and post-earthquake strength loss unlikely, check cyclic softeningZone C: Cyclic liquefaction and strength loss possible depending on soil plasticity,brittleness/sensitivity, strain to peak undrained strength and ground geometry
CLiq v.2.2.0.32 - CPT Liquefaction Assessment Software - Report created on: 6/27/2018, 10:07:03 AMProject file:
7

This software is licensed to: Landmark Consultants, Inc CPT name: CPT-07
Cone resistance
qt (tsf)400200
Dept
h (ft
)
50
48
46
44
42
40
38
36
34
32
30
28
26
24
22
20
18
16
14
12
10
8
6
4
2
0Cone resistance
C P T b a s i c i n t e r p r e t a t i o n p l o t sFriction Ratio
Rf (%)1086420
Dept
h (ft
)
50
48
46
44
42
40
38
36
34
32
30
28
26
24
22
20
18
16
14
12
10
8
6
4
2
0Friction Ratio Pore pressure
u (psi)151050
Dept
h (f
t)
50
48
46
44
42
40
38
36
34
32
30
28
26
24
22
20
18
16
14
12
10
8
6
4
2
0Pore pressure
Insitu
SBT Plot
Ic(SBT)4321
Dept
h (f
t)
50
48
46
44
42
40
38
36
34
32
30
28
26
24
22
20
18
16
14
12
10
8
6
4
2
0SBT Plot Soil Behaviour Type
SBT (Robertson et al. 1986)1817161514131211109876543210
Dept
h (f
t)
50
48
46
44
42
40
38
36
34
32
30
28
26
24
22
20
18
16
14
12
10
8
6
4
2
0Soil Behaviour Type
Silty sand & sandy siltClay & silty clayClay & silty clayClay
Silty sand & sandy silt
Clay & silty claySand & silty sandSand & silty sandClay & silty clay
Sand & silty sand
Silty sand & sandy siltSilty sand & sandy silt
Clay & silty clay
Clay
Clay & silty clayClayClay & silty clayClay & silty clayClayVery dense/stif f soilSilty sand & sandy siltSand & silty sandVery dense/stif f soilSand & silty sandSilty sand & sandy siltSilty sand & sandy silt
Clay & silty clay
Clay
Clay & silty clayClay & silty clay
CLiq v.2.2.0.32 - CPT Liquefaction Assessment Software - Report created on: 6/27/2018, 10:07:03 AM 8Project file:
Input parameters and analysis dataAnalysis method:Fines correction method:Points to test:Earthquake magnitude Mw:Peak ground acceleration:Depth to water table (insitu):
NCEER (1998)NCEER (1998)Based on Ic value7.000.507.00 ft
Depth to water table (erthq.):Average results interval:Ic cut-off value:Unit weight calculation:Use fill:Fill height:
7.00 ft32.60Based on SBTNoN/A
Fill weight:Transition detect. applied:Kσ applied:Clay like behavior applied:Limit depth applied:Limit depth:
N/AYesYesSands onlyNoN/A
SBT legend1. Sensitive fine grained2. Organic material3. Clay to silty clay
4. Clayey silt to silty5. Silty sand to sandy silt6. Clean sand to silty sand
7. Gravely sand to sand8. Very stiff sand to9. Very stiff fine grained

This software is licensed to: Landmark Consultants, Inc CPT name: CPT-07
Cone resistance
qt (tsf)400300200100
Dept
h (f
t)
50
48
46
44
42
40
38
36
34
32
30
28
26
24
22
20
18
16
14
12
10
8
6
4
2
0Cone resistance SBTn Plot
Ic (Robertson 1990)4321
Dept
h (f
t)
50
48
46
44
42
40
38
36
34
32
30
28
26
24
22
20
18
16
14
12
10
8
6
4
2
0SBTn Plot FS Plot
Factor of safety21.510.50
Dept
h (f
t)
50
48
46
44
42
40
38
36
34
32
30
28
26
24
22
20
18
16
14
12
10
8
6
4
2
0FS Plot
During earthq.
Vertical settlements
Settlement (in)1.510.50
Dept
h (f
t)
50
48
46
44
42
40
38
36
34
32
30
28
26
24
22
20
18
16
14
12
10
8
6
4
2
0Vertical settlements
E s t i m a t i o n o f p o s t - e a r t h q u a k e s e t t l e m e n t s
Strain plot
Volumentric strain (%)6543210
Dept
h (f
t)
50
48
46
44
42
40
38
36
34
32
30
28
26
24
22
20
18
16
14
12
10
8
6
4
2
0Strain plot
CLiq v.2.2.0.32 - CPT Liquefaction Assessment Software - Report created on: 6/27/2018, 10:07:03 AM 9Project file:
Abbreviationsqt:Ic:FS:Volumentric strain:
Total cone resistance (cone resistance qc corrected for pore water effects)Soil Behaviour Type IndexCalculated Factor of Safety against liquefactionPost-liquefaction volumentric strain

This software is licensed to: Landmark Consultants, Inc CPT name: CPT-07
:: Post-earthquake settlement due to soil liquefaction ::
Depth(ft)
FSQtn,cs ev (%) Settlement(in)
Depth(ft)
FSQtn,cs ev (%) Settlement(in)
DF DF
7.05 96.27 0.46 2.12 0.040.88 7.22 95.87 0.46 2.12 0.040.887.38 92.74 0.43 2.17 0.040.87 7.55 87.29 0.39 2.28 0.040.877.71 84.27 0.37 2.34 0.050.87 7.87 81.35 0.35 2.40 0.050.878.04 80.32 0.34 2.42 0.050.86 8.20 80.08 0.34 2.41 0.050.868.37 80.77 0.34 2.39 0.050.86 8.53 80.04 0.33 2.40 0.050.868.69 77.38 0.32 2.46 0.050.85 8.86 73.51 0.30 2.56 0.050.859.02 71.19 0.29 2.62 0.050.85 9.19 70.58 0.28 2.63 0.050.849.35 71.16 2.00 0.00 0.000.84 9.51 76.53 2.00 0.00 0.000.849.68 85.98 2.00 0.00 0.000.84 9.84 100.02 2.00 0.00 0.000.8310.01 107.71 2.00 0.00 0.000.83 10.17 107.83 2.00 0.00 0.000.8310.33 100.95 0.42 1.91 0.040.82 10.50 112.10 0.50 1.75 0.030.8210.66 134.60 0.72 1.32 0.030.82 10.83 149.61 0.92 0.71 0.010.8210.99 143.48 0.82 0.98 0.020.81 11.15 134.85 0.71 1.30 0.030.8111.32 122.72 0.58 1.60 0.030.81 11.48 119.85 0.55 1.62 0.030.8111.65 117.47 0.52 1.64 0.030.80 11.81 111.45 0.47 1.71 0.030.8011.98 108.50 0.45 1.74 0.030.80 12.14 113.28 0.48 1.68 0.030.7912.30 123.36 0.57 1.56 0.030.79 12.47 134.58 0.68 1.27 0.030.7912.63 139.02 0.73 1.21 0.020.79 12.80 141.32 0.75 0.96 0.020.7812.96 136.60 0.69 1.23 0.020.78 13.12 127.50 0.59 1.49 0.030.7813.29 115.58 0.48 1.61 0.030.77 13.45 113.28 0.46 1.63 0.030.7713.62 116.02 0.48 1.59 0.030.77 13.78 118.78 0.51 1.56 0.030.7713.94 122.25 0.53 1.51 0.030.76 14.11 128.30 0.59 1.45 0.030.7614.27 138.45 0.69 1.17 0.020.76 14.44 143.33 0.75 1.11 0.020.7614.60 151.33 0.85 0.84 0.020.75 14.76 165.68 1.05 0.30 0.010.7514.93 186.18 1.42 0.00 0.000.75 15.09 202.83 2.00 0.00 0.000.7415.26 212.78 2.00 0.00 0.000.74 15.42 213.32 2.00 0.00 0.000.7415.58 210.27 2.00 0.00 0.000.74 15.75 208.31 2.00 0.00 0.000.7315.91 207.13 2.00 0.00 0.000.73 16.08 209.37 2.00 0.00 0.000.7316.24 220.10 2.00 0.00 0.000.72 16.40 234.53 2.00 0.00 0.000.7216.57 249.73 2.00 0.00 0.000.72 16.73 253.93 2.00 0.00 0.000.7216.90 252.48 2.00 0.00 0.000.71 17.06 249.18 2.00 0.00 0.000.7117.22 244.22 2.00 0.00 0.000.71 17.39 238.00 2.00 0.00 0.000.7117.55 231.88 2.00 0.00 0.000.70 17.72 231.27 2.00 0.00 0.000.7017.88 233.91 2.00 0.00 0.000.70 18.04 234.80 2.00 0.00 0.000.6918.21 233.04 2.00 0.00 0.000.69 18.37 228.93 2.00 0.00 0.000.6918.54 223.87 2.00 0.00 0.000.69 18.70 217.93 2.00 0.00 0.000.6818.86 213.19 2.00 0.00 0.000.68 19.03 212.23 2.00 0.00 0.000.6819.19 212.78 2.00 0.00 0.000.67 19.36 210.73 2.00 0.00 0.000.6719.52 201.55 2.00 0.00 0.000.67 19.69 185.01 1.30 0.12 0.000.6719.85 160.96 0.91 0.51 0.010.66 20.01 137.28 0.62 1.19 0.020.6620.18 122.31 0.48 1.30 0.030.66 20.34 115.11 0.43 1.36 0.030.6620.51 114.09 0.42 1.37 0.030.65 20.67 120.21 0.47 1.31 0.030.6520.83 128.49 0.53 1.23 0.020.65 21.00 137.03 0.61 1.16 0.020.6421.16 138.79 0.63 1.15 0.020.64 21.33 139.74 0.64 1.13 0.020.6421.49 141.94 0.66 0.95 0.020.64 21.65 149.61 2.00 0.00 0.000.6321.82 157.68 2.00 0.00 0.000.63 21.98 165.92 2.00 0.00 0.000.6322.15 173.81 2.00 0.00 0.000.62 22.31 175.69 2.00 0.00 0.000.6222.47 168.35 0.99 0.34 0.010.62 22.64 161.54 0.90 0.48 0.010.62
CLiq v.2.2.0.32 - CPT Liquefaction Assessment Software - Report created on: 6/27/2018, 10:07:03 AM 10Project file:

This software is licensed to: Landmark Consultants, Inc CPT name: CPT-07
:: Post-earthquake settlement due to soil liquefaction :: (continued)
Depth(ft)
FSQtn,cs ev (%) Settlement(in)
Depth(ft)
FSQtn,cs ev (%) Settlement(in)
DF DF
22.80 159.68 2.00 0.00 0.000.61 22.97 157.13 2.00 0.00 0.000.6123.13 146.07 2.00 0.00 0.000.61 23.29 129.03 2.00 0.00 0.000.6123.46 112.91 0.40 1.27 0.030.60 23.62 113.18 2.00 0.00 0.000.6023.79 120.90 2.00 0.00 0.000.60 23.95 129.35 2.00 0.00 0.000.5924.11 133.60 2.00 0.00 0.000.59 24.28 132.33 2.00 0.00 0.000.5924.44 130.55 2.00 0.00 0.000.59 24.61 128.07 2.00 0.00 0.000.5824.77 129.55 2.00 0.00 0.000.58 24.93 132.72 2.00 0.00 0.000.5825.10 134.43 2.00 0.00 0.000.57 25.26 135.51 2.00 0.00 0.000.5725.43 133.59 2.00 0.00 0.000.57 25.59 130.16 2.00 0.00 0.000.5725.75 126.24 2.00 0.00 0.000.56 25.92 125.10 2.00 0.00 0.000.5626.08 127.38 2.00 0.00 0.000.56 26.25 132.24 2.00 0.00 0.000.5626.41 135.64 2.00 0.00 0.000.55 26.57 138.55 2.00 0.00 0.000.5526.74 139.78 2.00 0.00 0.000.55 26.90 140.90 2.00 0.00 0.000.5427.07 141.39 2.00 0.00 0.000.54 27.23 140.08 2.00 0.00 0.000.5427.40 138.41 2.00 0.00 0.000.54 27.56 136.57 2.00 0.00 0.000.5327.72 136.26 2.00 0.00 0.000.53 27.89 136.85 2.00 0.00 0.000.5328.05 136.01 2.00 0.00 0.000.52 28.22 134.16 2.00 0.00 0.000.5228.38 133.33 2.00 0.00 0.000.52 28.54 134.53 2.00 0.00 0.000.5228.71 137.60 2.00 0.00 0.000.51 28.87 138.10 2.00 0.00 0.000.5129.04 135.87 2.00 0.00 0.000.51 29.20 132.06 2.00 0.00 0.000.5129.36 128.53 2.00 0.00 0.000.50 29.53 126.93 2.00 0.00 0.000.5029.69 125.36 2.00 0.00 0.000.50 29.86 123.41 2.00 0.00 0.000.4930.02 120.65 2.00 0.00 0.000.49 30.18 120.00 2.00 0.00 0.000.4930.35 119.95 2.00 0.00 0.000.49 30.51 120.05 2.00 0.00 0.000.4830.68 118.81 2.00 0.00 0.000.48 30.84 118.19 2.00 0.00 0.000.4831.00 117.49 2.00 0.00 0.000.47 31.17 117.59 2.00 0.00 0.000.4731.33 119.02 2.00 0.00 0.000.47 31.50 122.31 2.00 0.00 0.000.4731.66 124.69 2.00 0.00 0.000.46 31.82 124.31 2.00 0.00 0.000.4631.99 120.85 2.00 0.00 0.000.46 32.15 117.25 2.00 0.00 0.000.4632.32 114.47 2.00 0.00 0.000.45 32.48 115.17 2.00 0.00 0.000.4532.64 115.69 2.00 0.00 0.000.45 32.81 115.05 2.00 0.00 0.000.4432.97 114.62 2.00 0.00 0.000.44 33.14 122.37 2.00 0.00 0.000.4433.30 129.45 2.00 0.00 0.000.44 33.46 131.92 2.00 0.00 0.000.4333.63 131.38 0.52 0.80 0.020.43 33.79 136.56 2.00 0.00 0.000.4333.96 150.06 2.00 0.00 0.000.42 34.12 156.57 2.00 0.00 0.000.4234.28 158.71 2.00 0.00 0.000.42 34.45 155.89 0.77 0.44 0.010.4234.61 159.99 2.00 0.00 0.000.41 34.78 172.79 2.00 0.00 0.000.4134.94 183.95 2.00 0.00 0.000.41 35.10 194.11 2.00 0.00 0.000.4135.27 195.71 2.00 0.00 0.000.40 35.43 199.05 1.45 0.00 0.000.4035.60 198.75 1.45 0.00 0.000.40 35.76 199.59 1.46 0.00 0.000.3935.93 195.69 1.39 0.00 0.000.39 36.09 190.17 2.00 0.00 0.000.3936.25 183.84 2.00 0.00 0.000.39 36.42 177.10 2.00 0.00 0.000.3836.58 167.97 2.00 0.00 0.000.38 36.75 163.22 2.00 0.00 0.000.3836.91 164.66 0.88 0.28 0.010.37 37.07 175.35 1.04 0.19 0.000.3737.24 184.34 1.18 0.10 0.000.37 37.40 187.16 1.23 0.10 0.000.3737.57 189.27 1.27 0.07 0.000.36 37.73 197.58 1.42 0.00 0.000.3637.89 213.57 2.00 0.00 0.000.36 38.06 239.80 2.00 0.00 0.000.3538.22 281.63 2.00 0.00 0.000.35 38.39 325.57 2.00 0.00 0.000.35
CLiq v.2.2.0.32 - CPT Liquefaction Assessment Software - Report created on: 6/27/2018, 10:07:03 AM 11Project file:

This software is licensed to: Landmark Consultants, Inc CPT name: CPT-07
:: Post-earthquake settlement due to soil liquefaction :: (continued)
Depth(ft)
FSQtn,cs ev (%) Settlement(in)
Depth(ft)
FSQtn,cs ev (%) Settlement(in)
DF DF
38.55 361.33 2.00 0.00 0.000.35 38.71 386.80 2.00 0.00 0.000.3438.88 406.11 2.00 0.00 0.000.34 39.04 411.92 2.00 0.00 0.000.3439.21 393.36 2.00 0.00 0.000.34 39.37 357.54 2.00 0.00 0.000.3339.53 314.67 2.00 0.00 0.000.33 39.70 280.11 2.00 0.00 0.000.3339.86 252.88 2.00 0.00 0.000.32 40.03 232.13 2.00 0.00 0.000.3240.19 217.44 2.00 0.00 0.000.32 40.35 208.00 2.00 0.00 0.000.3240.52 196.10 1.40 0.00 0.000.31 40.68 180.28 1.12 0.12 0.000.3140.85 167.19 0.93 0.23 0.000.31 41.01 170.08 0.97 0.16 0.000.3041.17 177.16 1.07 0.11 0.000.30 41.34 176.68 1.07 0.11 0.000.3041.50 175.94 1.06 0.11 0.000.30 41.67 189.00 1.28 0.05 0.000.2941.83 203.32 2.00 0.00 0.000.29 41.99 211.05 2.00 0.00 0.000.2942.16 210.54 2.00 0.00 0.000.29 42.32 199.93 2.00 0.00 0.000.2842.49 182.54 2.00 0.00 0.000.28 42.65 161.96 2.00 0.00 0.000.2842.81 139.01 2.00 0.00 0.000.27 42.98 114.93 2.00 0.00 0.000.2743.14 101.23 2.00 0.00 0.000.27 43.31 96.75 2.00 0.00 0.000.2743.47 99.09 2.00 0.00 0.000.26 43.64 103.12 2.00 0.00 0.000.2643.80 106.25 2.00 0.00 0.000.26 43.96 108.12 2.00 0.00 0.000.2544.13 108.11 2.00 0.00 0.000.25 44.29 106.05 2.00 0.00 0.000.2544.46 102.35 2.00 0.00 0.000.25 44.62 98.55 2.00 0.00 0.000.2444.78 95.89 2.00 0.00 0.000.24 44.95 95.01 2.00 0.00 0.000.2445.11 94.87 2.00 0.00 0.000.24 45.28 95.61 2.00 0.00 0.000.2345.44 97.11 2.00 0.00 0.000.23 45.60 99.03 2.00 0.00 0.000.2345.77 101.68 2.00 0.00 0.000.22 45.93 103.92 2.00 0.00 0.000.2246.10 104.28 2.00 0.00 0.000.22 46.26 103.50 2.00 0.00 0.000.2246.42 101.74 2.00 0.00 0.000.21 46.59 102.29 2.00 0.00 0.000.2146.75 104.14 2.00 0.00 0.000.21 46.92 106.39 2.00 0.00 0.000.2047.08 106.51 2.00 0.00 0.000.20 47.24 106.60 2.00 0.00 0.000.2047.41 106.38 2.00 0.00 0.000.20 47.57 107.08 2.00 0.00 0.000.1947.74 106.57 2.00 0.00 0.000.19 47.90 106.08 2.00 0.00 0.000.1948.06 106.03 2.00 0.00 0.000.19 48.23 104.29 2.00 0.00 0.000.1848.39 101.59 2.00 0.00 0.000.18 48.56 98.24 2.00 0.00 0.000.1848.72 97.91 2.00 0.00 0.000.17 48.88 98.90 2.00 0.00 0.000.1749.05 99.62 2.00 0.00 0.000.17 49.21 99.62 2.00 0.00 0.000.1749.38 99.78 2.00 0.00 0.000.16 49.54 100.03 2.00 0.00 0.000.1649.70 99.46 2.00 0.00 0.000.16 49.87 98.60 2.00 0.00 0.000.1550.03 98.13 2.00 0.00 0.000.15
Total estimated settlement: 1.76
AbbreviationsQtn,cs:FS:ev (%):DF:Settlement:
Equivalent clean sand normalized cone resistanceFactor of safety against liquefactionPost-liquefaction volumentric strainev depth weighting factorCalculated settlement
CLiq v.2.2.0.32 - CPT Liquefaction Assessment Software - Report created on: 6/27/2018, 10:07:03 AM 12Project file:

APPENDIX E

Project No.: 18083LE
Pipe Bedding and Trench BackfillRecommendations
Plate
D-1
From: City of San Diego Standard Drawing SDS-110 (2016)

APPENDIX F

June 30, 2018
Steve WilliamsLandmark Consultants780 N. 4th StreetEl Centro, California 92243
SUBJECT: VEGA SES SOLAR PROJECT - SOIL TESTING SUMMARY REPORT
RFYeager Engineering Project No.: 18111
Dear Steve,
On June 20, 2018, RFYeager Engineering conducted soil resistivity testing at five locations
within the Vega SES Solar project site near El Centro, California. Additionally, five soil
samples were taken from the project site and submitted for chemical analysis. The
objective of this study is to determine the electrical resistivity and corrosivity of the soil at
the test locations within the project site.
The location of the test sites was based upon the site map which was provided by
Landmark (see Figure 1). The resistivity of the soil was determined by using the Wenner
4-pin method. Five readings were recorded for each test site based upon pin spacings of
20, 15, 10, 5, and 2.5 feet.
5
4
1
3
2
LEGEND
- ELECTRICAL RESISTIVITY TEST& SOIL SAMPLE LOCATION
#
N
Figure 1 – Soil Test Locations

Soil Corrosivity Testing – Vega SES Solar ProjectDate: June 30, 2018Page 2 of 4
1016 Broadway - Suite A, El Cajon, CA 92040 Ph: 760.715.2358 Fx:619.561.0031 [email protected]
The soil corrosivity was evaluated based on the results of the field soil resistivity survey
and the chemical analyses of five soil samples, one taken from each test site. The soil
samples were obtained from holes hand augured by RFYeager Engineering the same day
the resistivity testing was conducted. The soil sample depths were approximately 18 to 24
inches.
From the test data, the following conclusions are offered:
1. The results of the field soil resistivity testing are provided in Table 1 below.
Resistivity readings varied between sites. Readings from Site 4 were the lowest
overall, ranging from 517 ohm-cm to 1226 ohm-cm. Readings from Site 1 and 2
were relatively high at the shallower depths of 5 and 2.5 feet.
2. The chemical analysis results are provided in Table 2 below. Site 4 had
significantly higher concentrations of both chlorides and sulfates compared to the
other test sites.
3. The saturated soil resistivity of the Site 4 sample was also considerably lower
than the other soil samples (likely due to the higher soluble salt concentrations).
The pH readings for all 5 soil samples were indicative of relatively neutral soil.
Table 1 - Vega SES Solar Project
Soil Resistivity Test Data
Prepared by: RFYeager Engineering
Test Date: 06.20.2018
Soil Resistivity (Ohm-cm)
Ave. Soil Depth (feet)
Site ID1
20 15 10 5 2.5
Site 1 1341 1637 2011 3361 5391
Site 2 1724 1896 2068 3313 4223
Site 3 1187 1293 1436 2154 2700
Site 4 1226 1178 1053 699 517
Site 5 1455 1925 2202 3102 2758
1 - See Figure 1 for test location relative to project site

Soil Corrosivity Testing – Vega SES Solar ProjectDate: June 30, 2018Page 3 of 4
1016 Broadway - Suite A, El Cajon, CA 92040 Ph: 760.715.2358 Fx:619.561.0031 [email protected]
Table 2 - Imperial Solar Energy Center West Project
Soil Chemical Analysis Data
Prepared by: RFYeager Engineering
Site ID.1
Min. Soil BoxResistivity -CalTest 643(ohm-cm)
ChlorideConcentration -
CalTest 422(ppm)
SulfateConcentration -
CalTest 417(ppm)
pHCalTest
643
Site 1 990 85 240 7.8
Site 2 3700 32 120 8.4
Site 3 3300 140 140 8.5
Site 4 160 1600 1800 7.9
Site 5 3400 43 120 8.7
1 - See Figure 1 for soil sample location relative to project site
4. The data collected from Sites 1, 2, 3, and 5 indicate that the soil in the vicinity of
these sites should be considered as fairly corrosive to buried metallic structures.
This conclusion is based primarily on the moderately high in-situ resistivity
readings, a majority of which are higher than 2,000 ohm-cm. In contrast, the soil
data collected for Site 4 indicates that the soil in the vicinity of this test site should
be considered as very aggressive to buried metallic utilities. This conclusion is
primarily based upon the high soluble salt content and low in-situ and saturated
soil box resistivities.
5. Although there is a wide variance in soil corrosivity, the data from each test site
does indicate that the surrounding soil will support metallic corrosion to some
extent. Accordingly, supplemental corrosion control measures are recommended
for any metallic utilities buried in the vicinity of each test site in order to prevent
premature failure.
DISCUSSION
Soil Resistivity Survey - Soil resistivity (inverse of conductivity) measures the ability of an
electrolyte (soil) to support electrical current flow. The most common method of
measuring soil resistivity is the Wenner 4-Pin Method which uses four pins (electrodes)
that are driven into the earth and equally spaced apart in a straight line. The Wenner 4-pin
Method provides an average resistivity of a hemisphere (essentially) of soil whose radius
is approximately equal to the pin spacing. For example, the resistivity value obtained with
the pins spaced at 5 feet apart is the average resistivity of a hemisphere of soil from the

Soil Corrosivity Testing – Vega SES Solar ProjectDate: June 30, 2018Page 4 of 4
1016 Broadway - Suite A, El Cajon, CA 92040 Ph: 760.715.2358 Fx:619.561.0031 [email protected]
surface to a depth of 5 feet. By taking readings at different pin spacings (or depths),
average soil resistivity conditions can be obtained within areas at, above, and below trench
zones.
Corrosion versus Resistivity - Corrosion is an electrochemical process, whereby the
reaction rate is largely dependent upon the conductivity of the surrounding electrolyte.
Accordingly, the lower the resistivity, then the greater the current flow and the greater the
corrosion rate assuming all other factors are equal.
One common relationship between corrosivity and soil resistivity used by corrosion
engineers is as follows:
Corrosivity Resistivity
Very Corrosive 0-1000 ohm-cm
Corrosive 1001-2000 ohm-cm
Fairly Corrosive 2001-5000 ohm-cm
Moderately Corrosive 5001-12000 ohm-cm
Slightly Corrosive 12001-30000 ohm-cm
Relatively Non-corrosive Greater than 30001 ohm-cm
Thank you for this opportunity to provide our professional services. Please call if youhave any questions.
With best regards,
Randy J. Geving, PERegistered Professional Engineer – Corrosion No.1060

APPENDIX G

REFERENCES
American Concrete Institute (ACI), 2013, ACI Manual of Concrete Practice 302.1R-04
American Society of Civil Engineers (ASCE), 2010, Minimum Design Loads for Buildings and Other Structures: ASCE Standard 7-10.
California Building Standards Commission, 2017, 2016 California Building Code.
California Code of Regulations, Title 24, Part 2, Vol. 2 of 2. Caltrans, 2012, Highway Design Manual. California Division of Mines and Geology (CDMG), 1996, California Fault Parameters:
available at http://www.consrv.ca.gov/dmg/shezp/fltindex.html. California Geological Survey (CGS), 2008, Guidelines for Evaluating and Mitigating
Seismic Hazards in California, Special Publication 117A, 98p. California Geological Survey (CGS), 2018, Fault Activity Map of California
http://www.quake.ca.gov/gmaps/FAM/faultactivitymap.html#. California Geological Survey (CGS), 2018, Alquist-Priolo Earthquake Fault Zone Maps.
http://maps.conservation.ca.gov/cgs/informationwarehouse/index.html?map=regulatorymaps
Cetin, K. O., Seed, R. B., Der Kiureghian, A., Tokimatsu, K., Harder, L. F., Jr., Kayen, R.
E., and Moss, R. E. S., 2004, Standard penetration test-based probabilistic and deterministic assessment of seismic soil liquefaction potential: ASCE JGGE, Vol., 130, No. 12, p. 1314-1340.
Geologismiki, 2017, CLiq Computer Program, www.geologismiki.gr Ishihara, K. (1985), Stability of natural deposits during earthquakes, Proc. 11th Int. Conf.
On Soil Mech. And Found. Engrg., Vol. 1, A. A. Balkema, Rotterdam, The Netherlands, 321-376.
Jones, A. L., 2003, An Analytical Model and Application for Ground Surface Effects from
Liquefaction, PhD. Dissertation, University of Washington, 362 p. McCrink, T. P., Pridmore, C. L., Tinsley, J. C., Sickler, R. R., Brandenberg, S. J., and
Stewart, J. P., 2011, Liquefaction and Other Ground Failures in Imperial County, California, from the April 4, 2010, El Mayor—Cucapah Earthquake, CGS Special Report 220, USGS Open File Report 2011-1071, 84 p.

Morton, P. K., 1977, Geology and mineral resources of Imperial County, California: California Division of Mines and Geology, County Report No. 7, 104 p.
Post-Tensioning Institute (PTI), 2007a, Standard Requirements for Analysis of Shallow
Concrete Foundations on Expansive Soils (3rd Edition). Post-Tensioning Institute (PTI), 2007b, Standard Requirements for Design of Shallow
Post-Tensioned Concrete Foundations on Expansive Soils (2nd Edition). Robertson, P. K., 2014, Seismic liquefaction CPT-based methods: EERI 1st Workshop on
Geotechnical Earthquake Engineering – Liquefaction Evaluation, Mapping, Simulation and Mitigation. UC San Diego Campus, 10/12/2014.
Robertson, P. K. and Wride, C. E., 1997, Cyclic Liquefaction and its Evaluation based on
the SPT and CPT, Proceeding of the NCEER Workshop on Evaluation of Liquefaction Resistance of Soils, NCEER Technical Report 97-0022, p. 41-88.
Rymer, M.J., Treiman, J.A., Kendrick, K.J., Lienkaemper, J.J., Weldon, R.J., Bilham, R.,
Wei, M., Fielding, E.J., Hernandez, J.L., Olson, B.P.E., Irvine, P.J., Knepprath, N., Sickler, R.R., Tong, .X., and Siem, M.E., 2011, Triggered surface slips in southern California associated with the 2010 El Mayor-Cucapah, Baja California, Mexico, earthquake: U.S. Geological Survey Open-File Report 2010-1333 and California Geological Survey Special Report 221, 62 p., available at http://pubs.usgs.gov/of/ 2010/1333/.
U.S. Geological Survey (USGS), 1990, The San Andreas Fault System, California,
Professional Paper 1515. U.S. Geological Survey (USGS), 2017, US Seismic Design Maps Web Application,
available at http://geohazards.usgs.gov/designmaps/us/application.php Wire Reinforcement Institute (WRI/CRSI), 2003, Design of Slab-on-Ground Foundations,
Tech Facts TF 700-R-03, 23 p. Youd, T. L., 2005, Liquefaction-induced flow, lateral spread, and ground oscillation, GSA
Abstracts with Programs, Vol. 37, No. 7, p. 252. Youd, T. L. and Garris, C. T., 1995, Liquefaction induced ground surface disruption:
ASCE Geotechnical Journal, Vol. 121, No. 11. Zimmerman, R. P., 1981, Soil survey of Imperial County, California, Imperial Valley
Area: U.S. Dept. of Agriculture Soil Conservation Service, 112 p.
Related Documents