Variations in Muon Flux: Four Years from Dallas Regionals to SNO Lab Thomas A. Catanach 3 August 2009

Variations in Muon Flux: Four Years from Dallas Regionals to SNO Lab Thomas A. Catanach 3 August 2009.
Dec 27, 2015
Welcome message from author
This document is posted to help you gain knowledge. Please leave a comment to let me know what you think about it! Share it to your friends and learn new things together.
Transcript

Variations in Muon Flux:Four Years from Dallas Regionals to SNO Lab
Thomas A. Catanach
3 August 2009

Introduction
• Cosmic rays, subatomic particles or nuclei, fly through space at close to the speed of light with very high energies and collide with the earth’s atmosphere triggering a cascade of particles which creates muons.
• The flux of muons varies over time due to a variety of environmental and solar factors, many of which exhibit periodicity.
• Over the past four years I have explored these periodic variations beginning with the Dallas Regional Science Fair with a detector made at SMU and continuing with my involvement with Project GRAND and SNO Lab.

Cosmic Rays
• Categories of cosmic rays– Solar cosmic rays– Galactic cosmic rays– Extragalactic cosmic rays.
• Cosmic rays are made of 90% protons (p+), 9% alpha-particles ( α2+), and 1% heaver nuclei or electrons (e-).
• Cosmic rays interact with the magnetic field of the galaxy and the solar system.

Muons• The muon is in the second
generation of the lepton family– Mass: 106 MeV/c2
– Charge: -1– Lifetime at rest: 2.2 µsec
• Cosmic rays hit the atmosphere creating a cascade of particles at about 15km in the atmosphere.
• Underground, muons can be produced by neutrinos
• On average 1 event occurs per cm2 per minute.
0 2
eee
http://livefromcern.web.cern.ch/livefromcern/antimatter/history/historypictures/cosmic-80.jpg
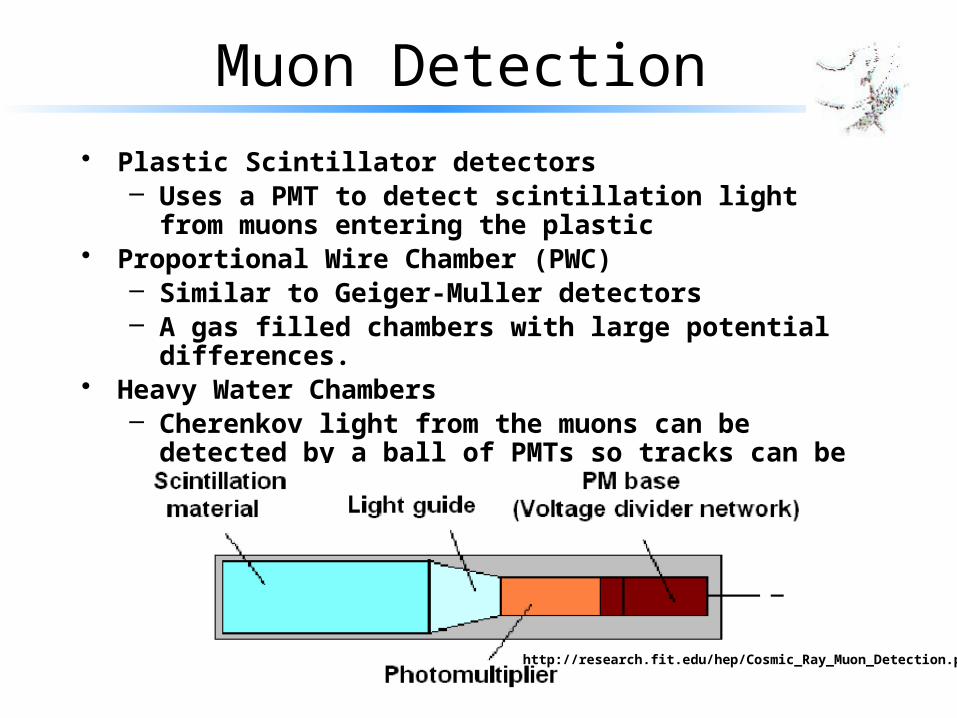
Muon Detection
• Plastic Scintillator detectors– Uses a PMT to detect scintillation light from muons entering
the plastic• Proportional Wire Chamber (PWC)
– Similar to Geiger-Muller detectors– A gas filled chambers with large potential differences.
• Heavy Water Chambers– Cherenkov light from the muons can be detected by a ball of
PMTs so tracks can be constructed through the D2O.
http://research.fit.edu/hep/Cosmic_Ray_Muon_Detection.pdf
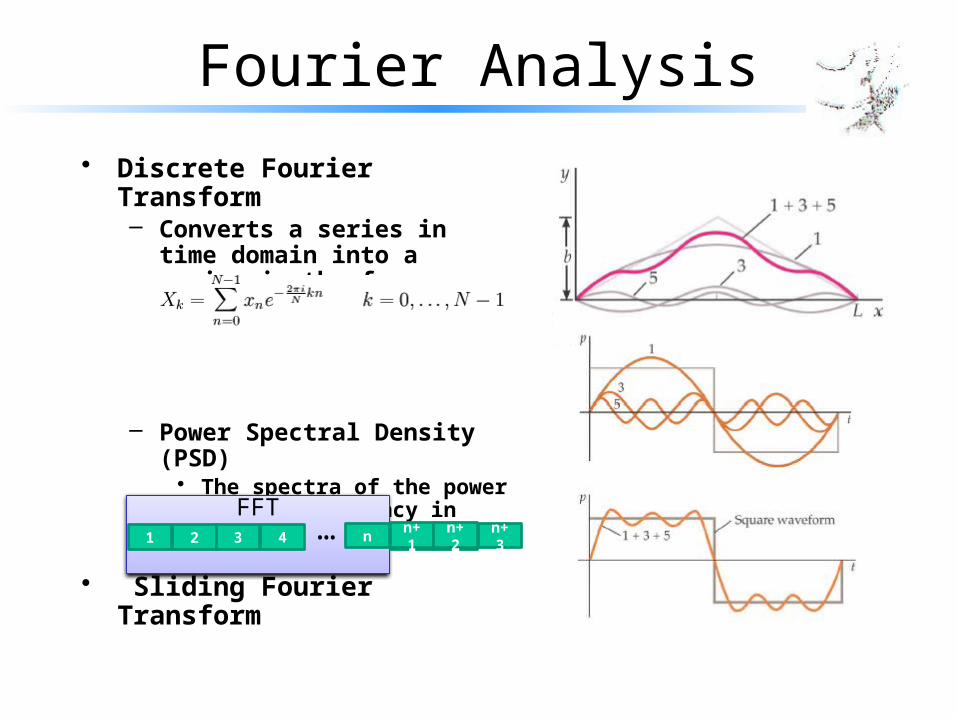
• Discrete Fourier Transform– Converts a series in time domain
into a series in the frequency domain
– Power Spectral Density (PSD)• The spectra of the power at each
frequency in frequency space for the function
• Sliding Fourier Transform
FFT
Fourier Analysis
1 2 3 4 n n+1 n+2 n+3… n+1 n+2
Science Fair
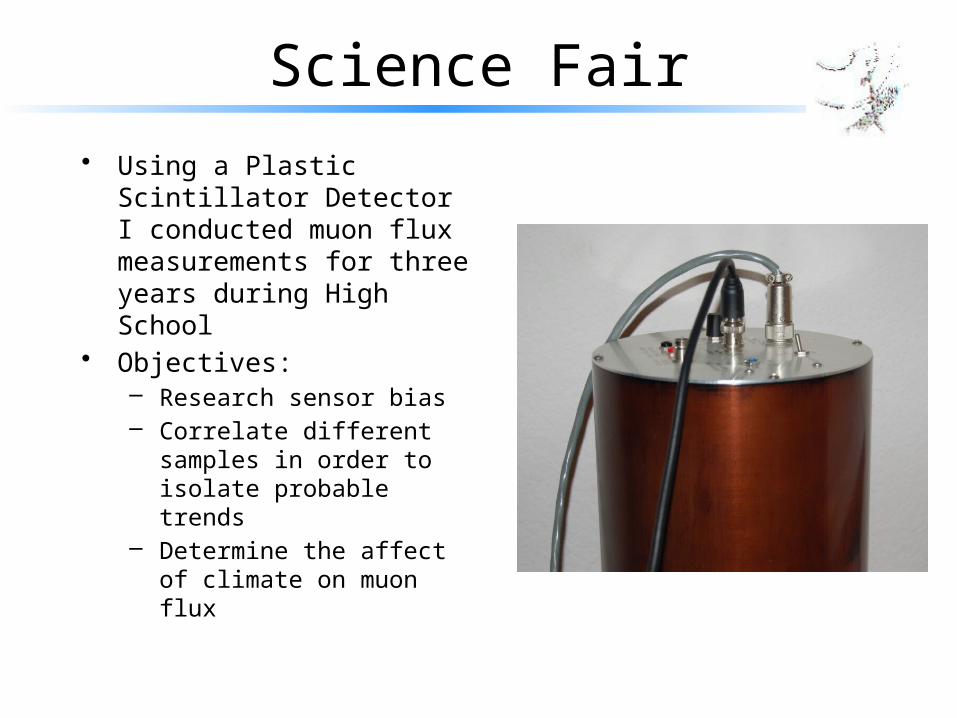
• Using a Plastic Scintillator Detector I conducted muon flux measurements for three years during High School
• Objectives:– Research sensor bias– Correlate different samples in
order to isolate probable trends– Determine the affect of climate
on muon flux
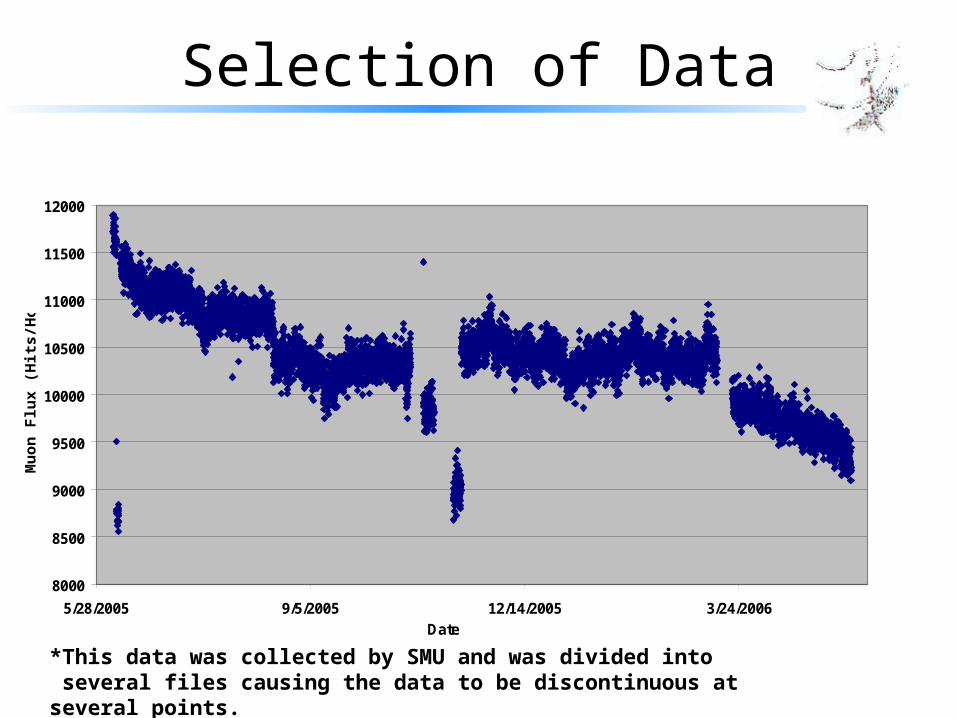
Selection of Data
8000
8500
9000
9500
10000
10500
11000
11500
12000
5/28/2005 9/5/2005 12/14/2005 3/24/2006Date
Mu
on
Flu
x (H
its/H
ou
r)
*This data was collected by SMU and was divided into several files causing the data to be discontinuous at several points.
2000
2100
2200
2300
2400
2500
2600
2700
12/29/06 1/3/07 1/8/07 1/13/07 1/18/07 1/23/07 1/28/07 2/2/07 2/7/07 2/12/07 2/17/07
Time
Muo
n Fl
ux (H
its/1
000
Sec
onds
)
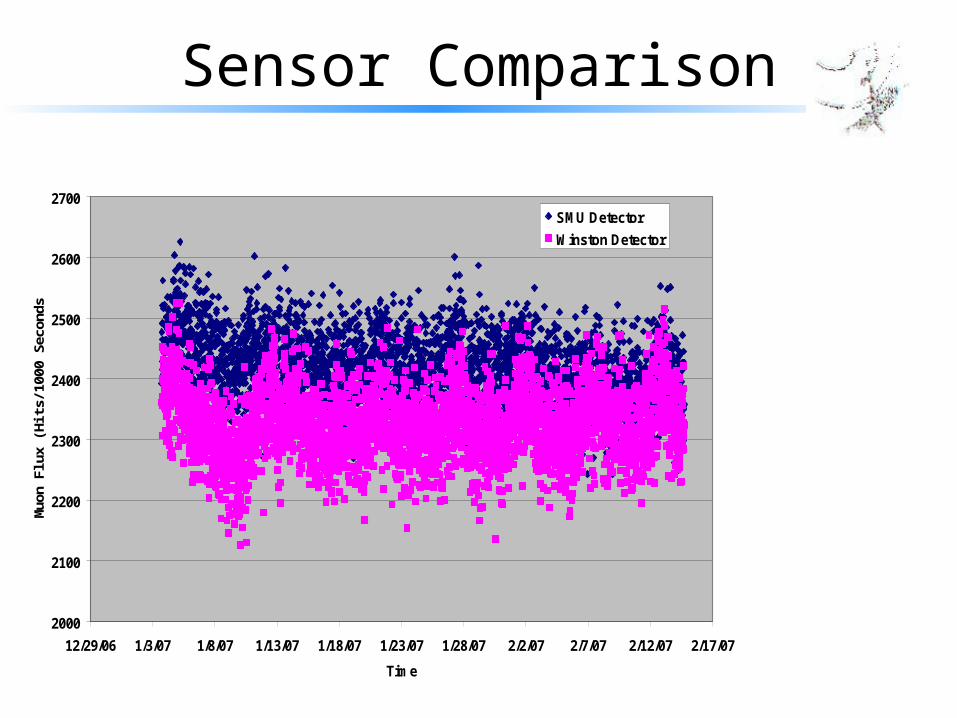
SMU Detector
Winston Detector
Sensor Comparison
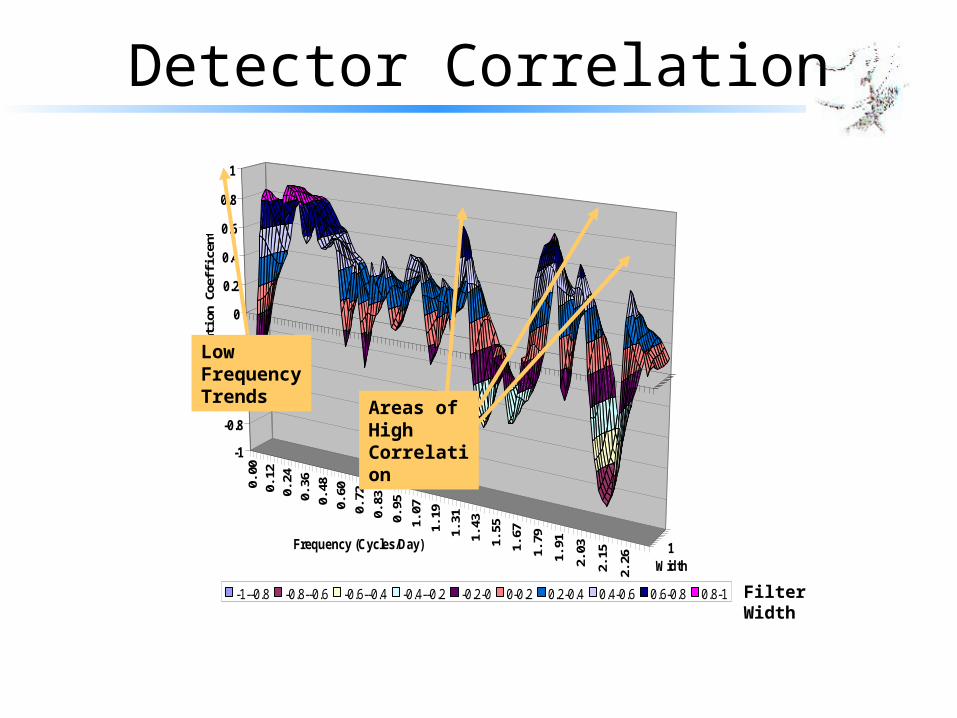
Detector Correlation
0.00
0.12
0.24
0.36
0.48
0.60
0.72
0.83
0.95
1.07
1.19
1.31
1.43
1.55
1.67
1.79
1.91
2.03
2.15
2.26
1
-1
-0.8
-0.6
-0.4
-0.2
0
0.2
0.4
0.6
0.8
1
Cor
rela
tion
Coe
ffice
nt
Frequency (Cycles/Day)
-1--0.8 -0.8--0.6 -0.6--0.4 -0.4--0.2 -0.2-0 0-0.2 0.2-0.4 0.4-0.6 0.6-0.8 0.8-1
Width
Filter Width
Low Frequency Trends
Areas of HighCorrelation

Power Spectral DensityNovember 2005 Data
0
20
40
60
80
100
120
140
0 1 2 3 4
Frequency Cycles/Day
Rel
ativ
e P
ow
er
SMU Spring 2006 Data
0
20
40
60
80
100
120
140
160
0 1 2 3 4
Frequence Cycles/Day
Re
lati
ve P
ow
er
Re
lati
ve
In
ten
sit
y (
dB
)
Re
lati
ve
In
ten
sit
y (
dB
)
2 Cycle Per DayTrend
1 Cycle Per DayTrend
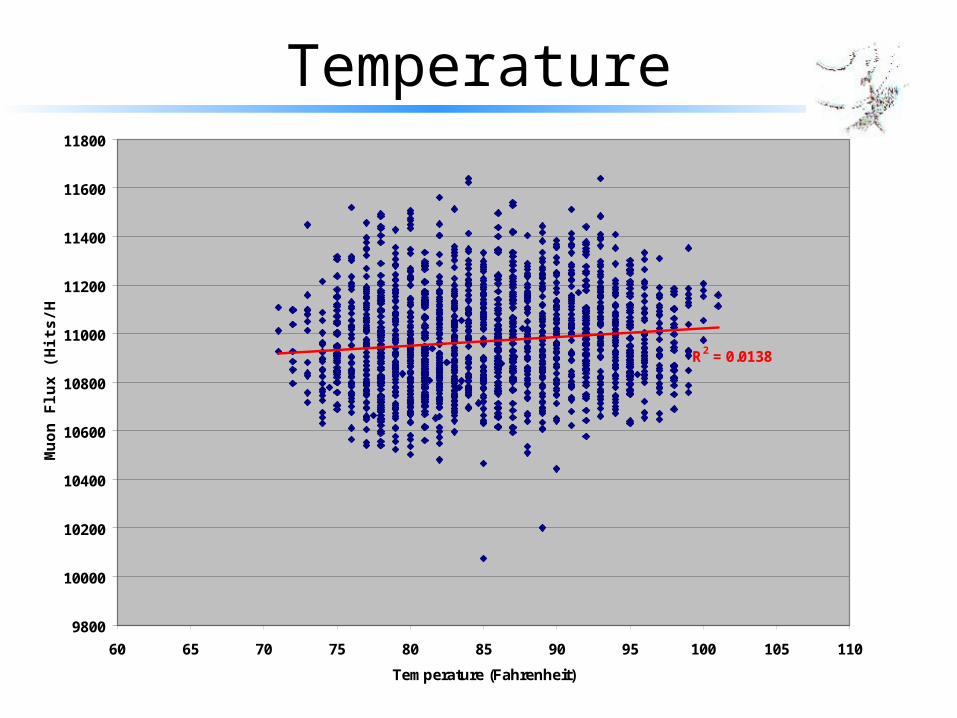
Temperature
R2 = 0.0138
9800
10000
10200
10400
10600
10800
11000
11200
11400
11600
11800
60 65 70 75 80 85 90 95 100 105 110
Temperature (Fahrenheit)
Mu
on
Flu
x (
Hit
s/H
ou
r)
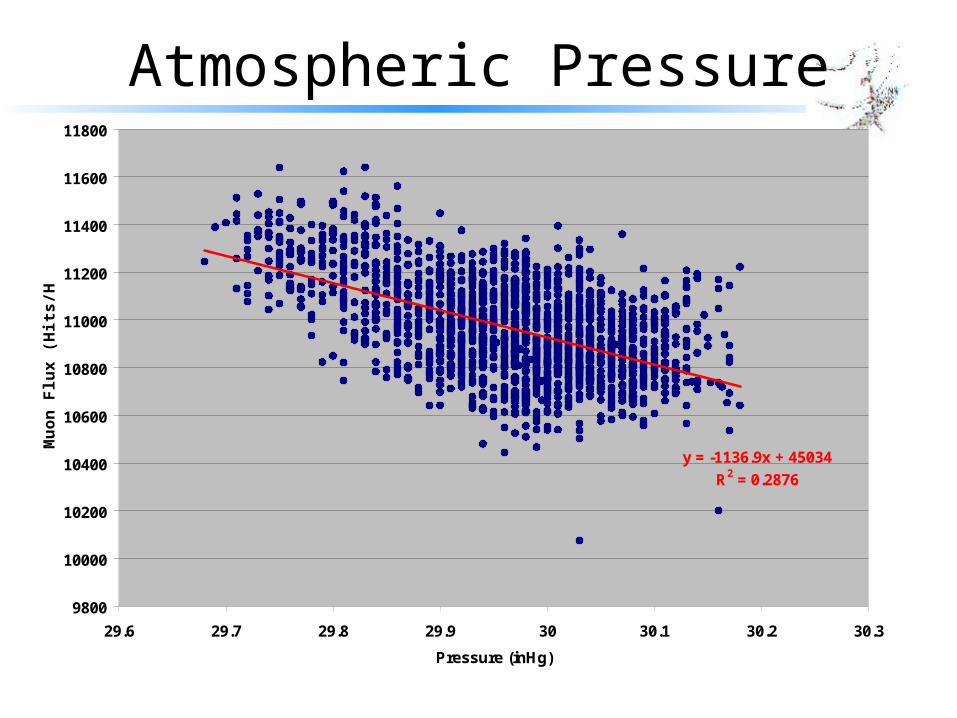
Atmospheric Pressure
y = -1136.9x + 45034
R2 = 0.2876
9800
10000
10200
10400
10600
10800
11000
11200
11400
11600
11800
29.6 29.7 29.8 29.9 30 30.1 30.2 30.3
Pressure (inHg)
Mu
on
Flu
x (
Hit
s/H
ou
r)
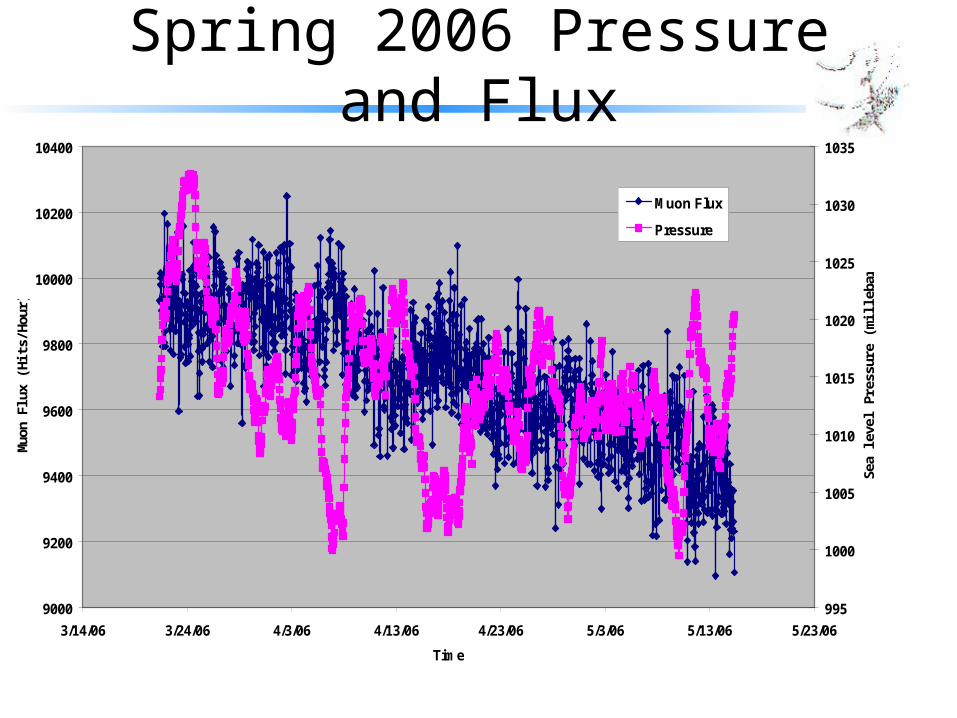
Spring 2006 Pressure and Flux
9000
9200
9400
9600
9800
10000
10200
10400
3/14/06 3/24/06 4/3/06 4/13/06 4/23/06 5/3/06 5/13/06 5/23/06
Time
Mu
on
Flu
x (H
its/
Ho
ur)
995
1000
1005
1010
1015
1020
1025
1030
1035
Sea
leve
l Pre
ssu
re (
mill
ebar
s)
Muon Flux
Pressure
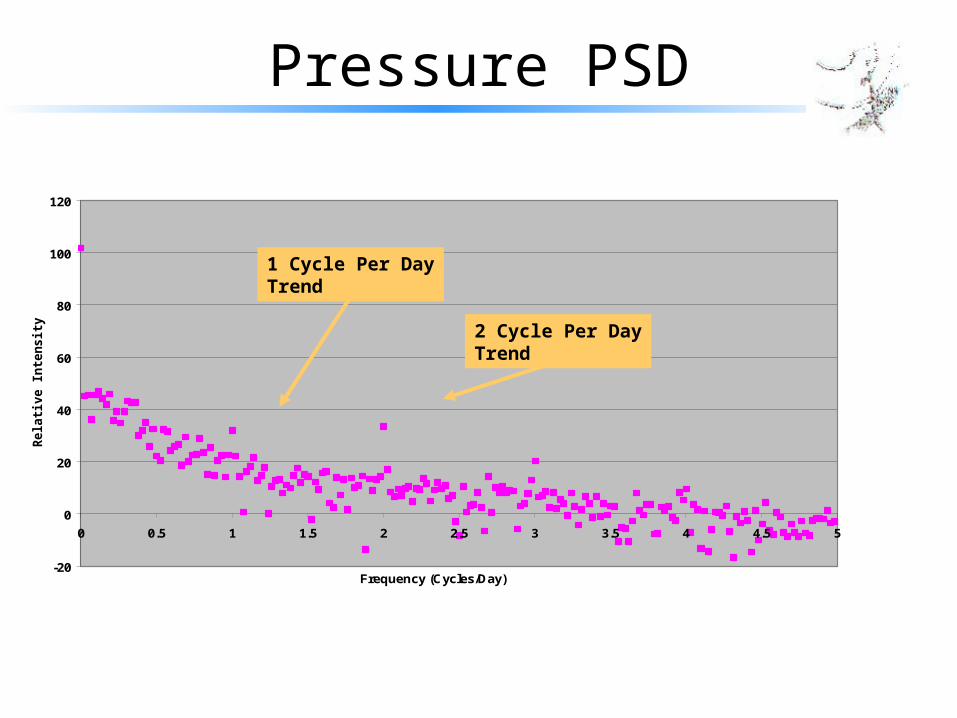
Pressure PSD
-20
0
20
40
60
80
100
120
0 0.5 1 1.5 2 2.5 3 3.5 4 4.5 5
Frequency (Cycles/Day)
Rela
tiv
e I
nte
ns
ity
(d
B)
2 Cycle Per DayTrend
1 Cycle Per DayTrend

Precipitation
Muon Flux vs. Precipitation
2700
2800
2900
3000
3100
1/28/06 0:00 1/28/06 4:48 1/28/06 9:36 1/28/06 14:24 1/28/06 19:12 1/29/06 0:00 1/29/06 4:48
Time
Mu
on
Flu
x H
its
/10 M
in
0
0.1
0.2
0.3
0.4
0.5
Prec
ipit
atio
n in
ch
.
Muons
Precipitation
Poly. (Muons)
2500
2550
2600
2650
2700
2750
2800
2850
5/5/06 0:00 5/5/06 4:48 5/5/06 9:36 5/5/06 14:24 5/5/06 19:12
Time
Mu
on
Flu
x (
Hit
s/ 1
0 M
inu
te
s)
00.20.40.60.811.21.41.61.8
Pre
cip
ita
tio
n in
ch
.
Decrease In FluxBefore Rain
Stabilizes After Rain
Increase In FluxDuring Rain
Discussion
• Observations– Minor sensor bias– Correlations did exist between the samples revealing possible low
frequency trends along with a one and two cycle per day trend– Climatic factors particularly pressure have an appreciable
influence on muon flux• Lessons
– Datasets are never pretty which requires the development of different approaches to tackle the problems
• Understanding sensor bias• Finding methods to fuse data
– Computing skill are essential for any level of research– Mentors and networks were very important to so that I could
discuss my ideas and problems

Project GRAND
• Project GRAND uses proportional wire chambers (PWC) to detect muons to find individual events and showers.
• The flux of muons varies over time due to a variety of environmental and solar factors, many of which exhibit periodicity.
• Through Project GRAND large continuous datasets can be used to isolate these trends
• Objectives:– Analyze the effects of temperature and pressure on muon flux and
identify seasonal trends so that a calibration factor can be determined.
– Research the character of the daily mean variation in muon flux

Project GRAND Experiments• Low Energy Experiment
• 30 – 300 GeV• Single Track Muon Data• Looks for variations in individual
muon flux due to solar phenomena such as a Solar Energetic Proton
• High Energy Experiment• 100-100000 TeV• Shower Data• Analyze high energy cosmic ray
events
• Project Grand Setup• 8x8 array of PWCs with total area
of 83 m2
• Muon threshold of .1 GeV• ±63o cutoff angle from zenith with
±.26o precision
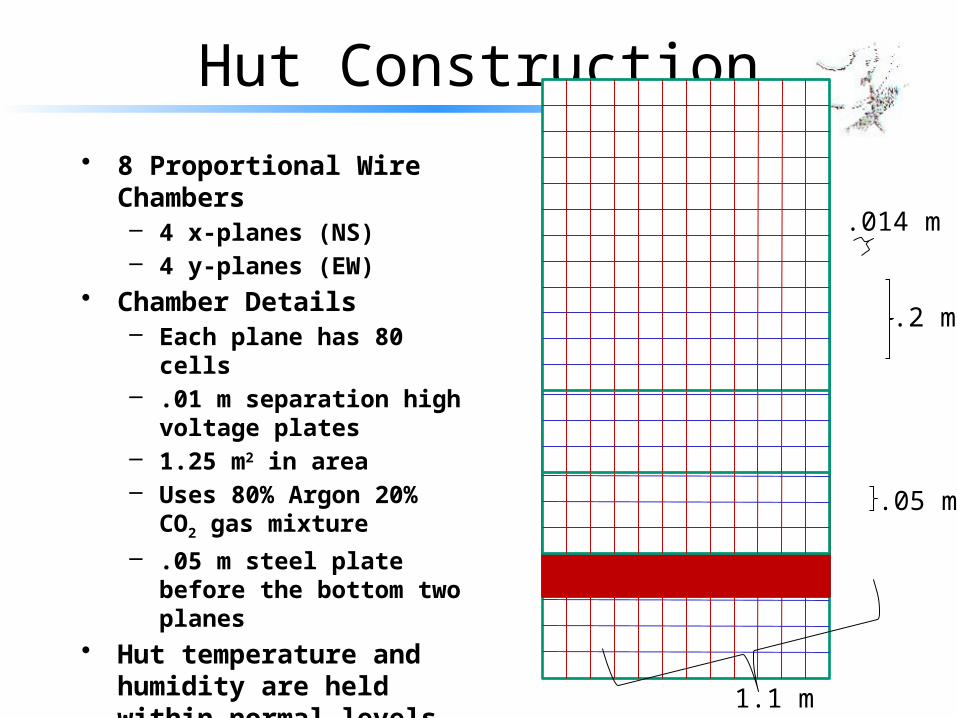
Hut Construction
• 8 Proportional Wire Chambers– 4 x-planes (NS)– 4 y-planes (EW)
• Chamber Details– Each plane has 80 cells– .01 m separation high voltage
plates– 1.25 m2 in area– Uses 80% Argon 20% CO2
gas mixture– .05 m steel plate before the
bottom two planes• Hut temperature and
humidity are held within normal levels
1.1 m
.05 m
.2 m
.014 m
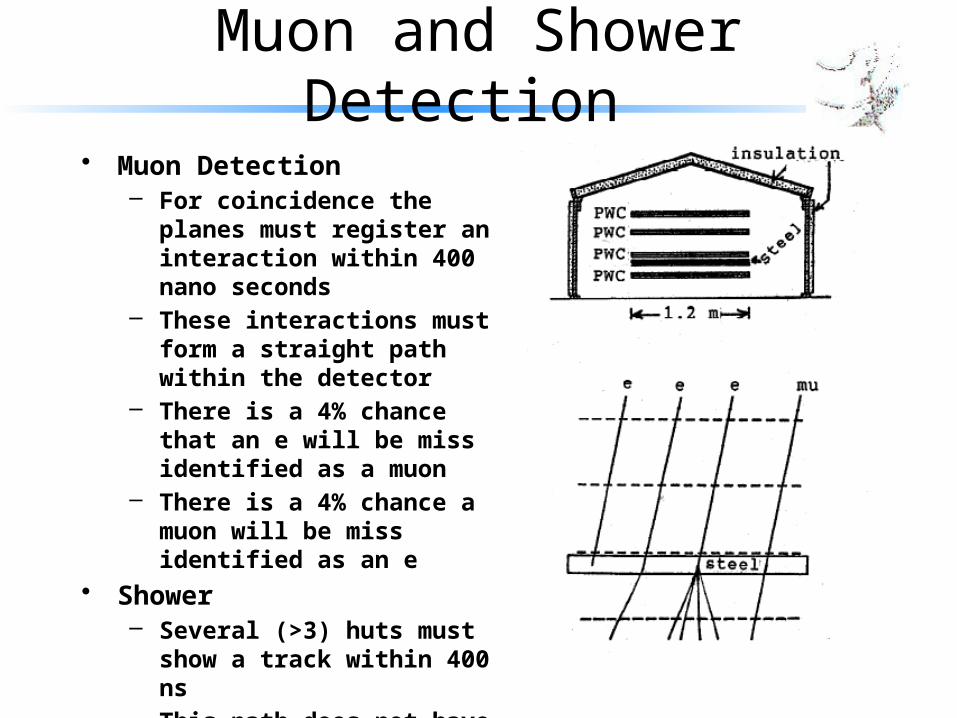
Muon and Shower Detection
• Muon Detection– For coincidence the planes must
register an interaction within 400 nano seconds
– These interactions must form a straight path within the detector
– There is a 4% chance that an e will be miss identified as a muon
– There is a 4% chance a muon will be miss identified as an e
• Shower– Several (>3) huts must show a
track within 400 ns– This path does not have the same
restrictions as a muon path as many more interactive particles could be produced by a shower
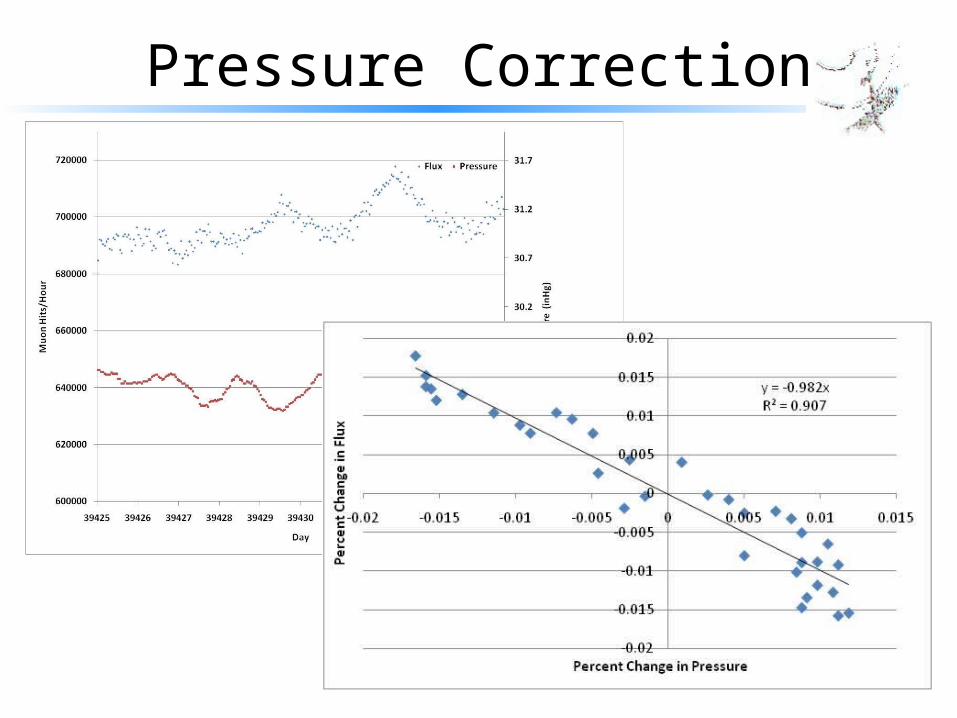
Pressure Correction
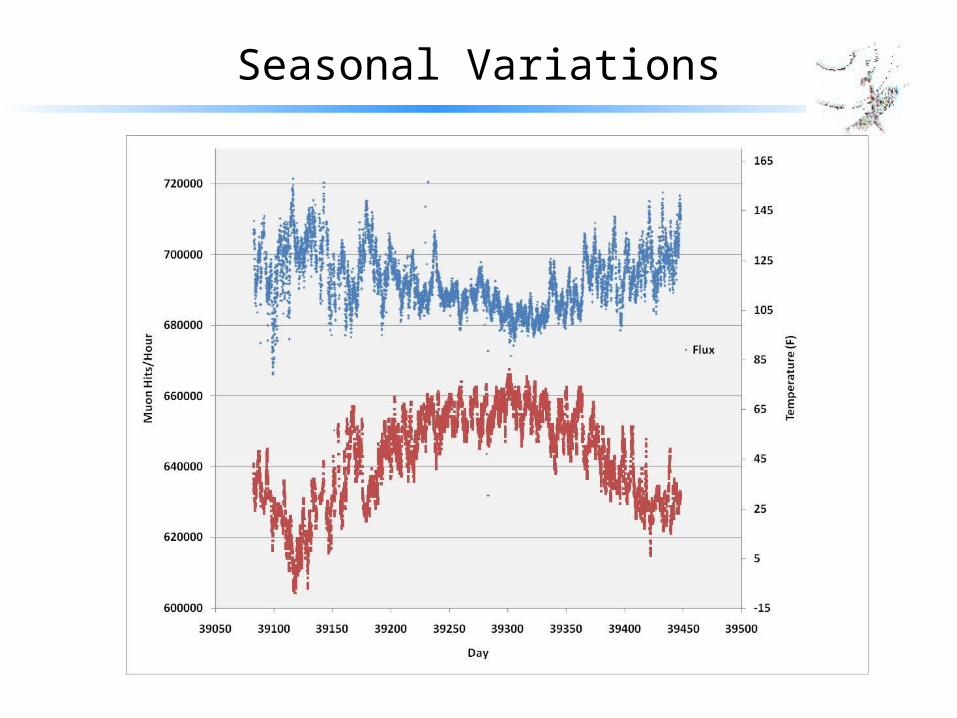
Seasonal Variations
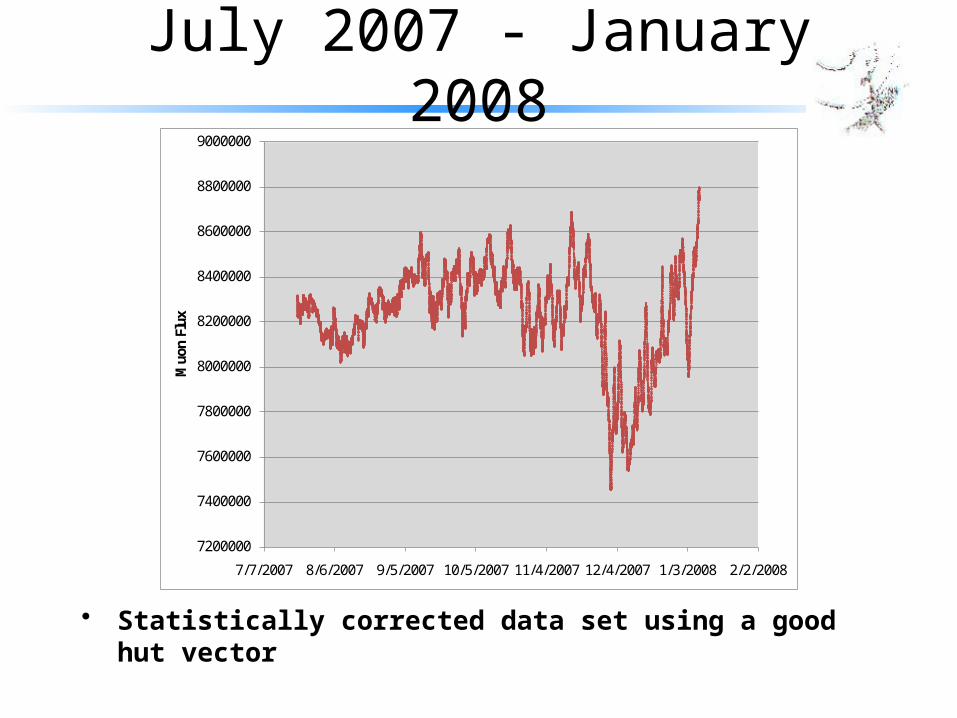
July 2007 - January 2008
• Statistically corrected data set using a good hut vector
7200000
7400000
7600000
7800000
8000000
8200000
8400000
8600000
8800000
9000000
7/7/2007 8/6/2007 9/5/2007 10/5/2007 11/4/2007 12/4/2007 1/3/2008 2/2/2008
Muo
n Fl
ux

Histogram Method
• Binned Muon flux over 170 Days
• Exhibits a 1 and 2 cycle/day component
5 10 15 20
1 .4 109
1 .402 109
1 .404 109
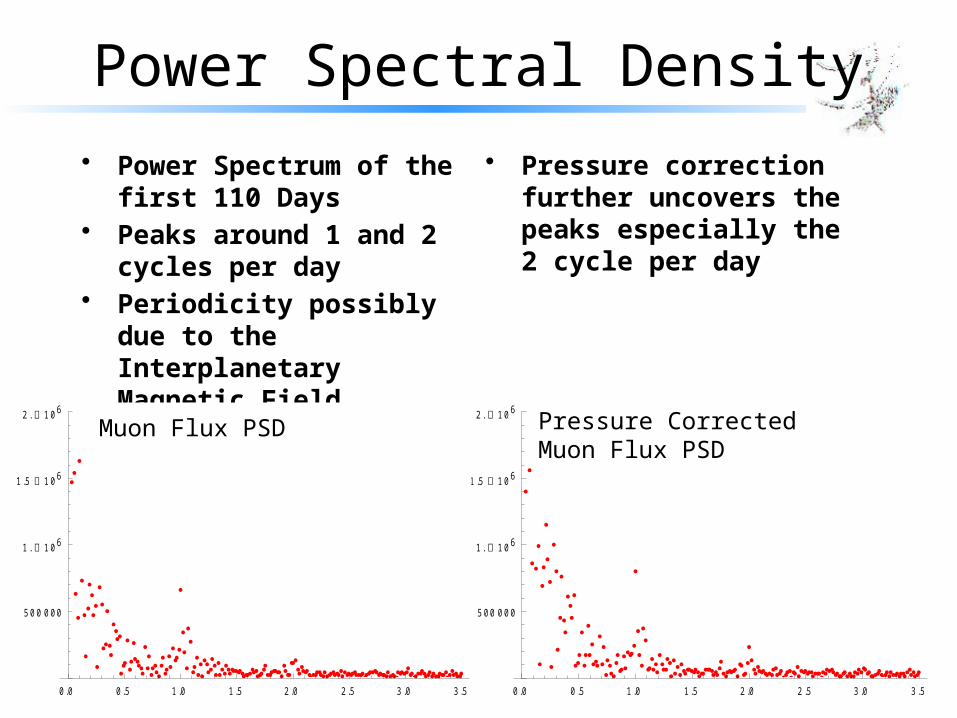
Power Spectral Density
• Power Spectrum of the first 110 Days
• Peaks around 1 and 2 cycles per day
• Periodicity possibly due to the Interplanetary Magnetic Field
0 .0 0 .5 1 .0 1 .5 2 .0 2 .5 3 .0 3 .5
500 000
1 . 106
1 .5 106
2 . 106
0 .0 0 .5 1 .0 1 .5 2 .0 2 .5 3 .0 3 .5
500 000
1 . 106
1 .5 106
2 . 106
Muon Flux PSD Pressure CorrectedMuon Flux PSD
• Pressure correction further uncovers the peaks especially the 2 cycle per day

1 and 2 cycle per day
• A 8192 element Fourier Transform was slid over the 171 day data set
• Significant seasonal variations are observed– 1 cycler per day variation
initially increases plateaus then decrease in mid November
– 2 cycle shows significant increase into December then decreases
0 20 40 60 80 100
100 000
200 000
300 000
400 000
500 000
0 20 40 60 80 100
200 000
400 000
600 000
800 000
1 . 106
1 .2 106
1 .4 106
Days Since September 12
Days Since September12
Discussion
• Observations– Pressure has an observable influence on muon flux and tests yield
a correction factor around 1• Other climatic factors make pinning down this value difficult
– Seasonal variations in flux can be observed– These seasonal variations influence the DMV changing the phase
and amplitude of the 1 and 2 cycle per day trends• Lessons
– Working on a research project reveals all the work that goes into modern science from engineering and physics to manual labor, but this allows you to truly understand the project.
– Developing skills working with data analysis software really helped to advance my research
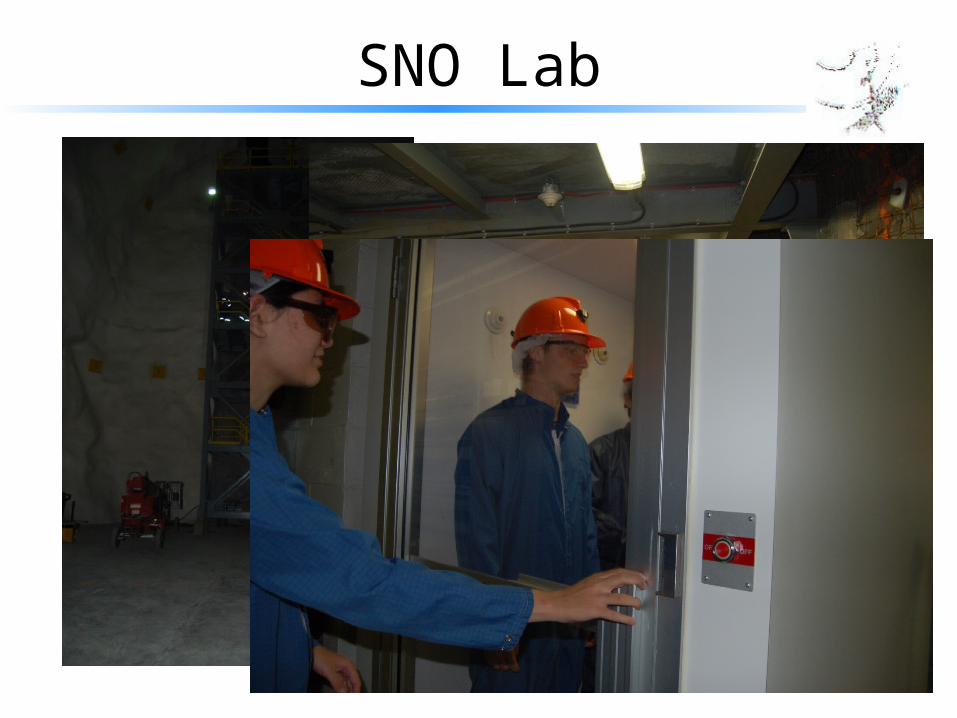
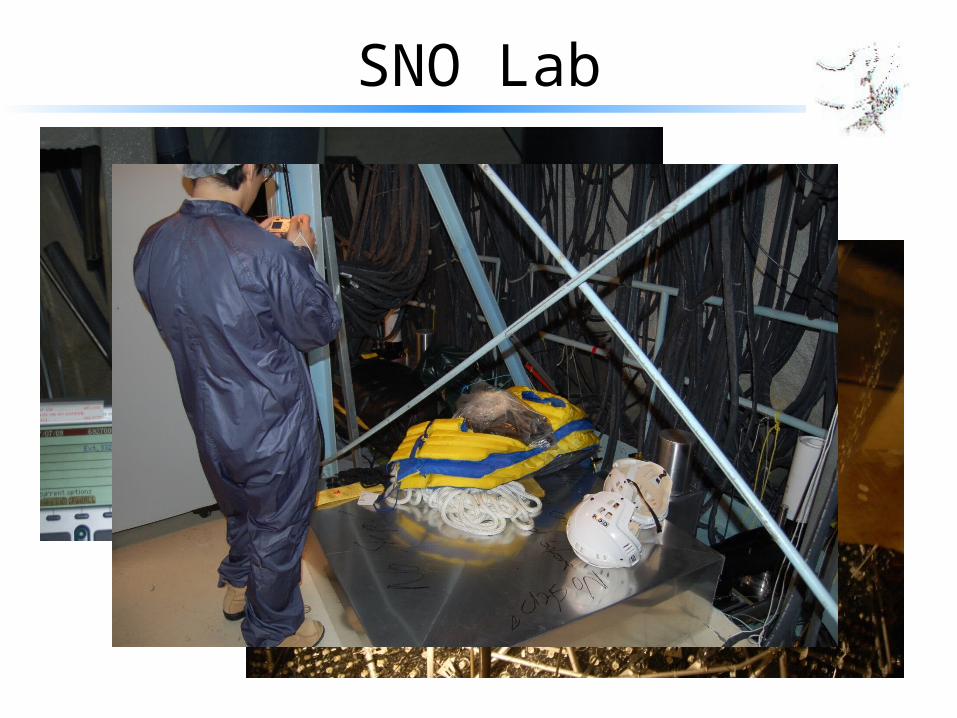
SNO Lab
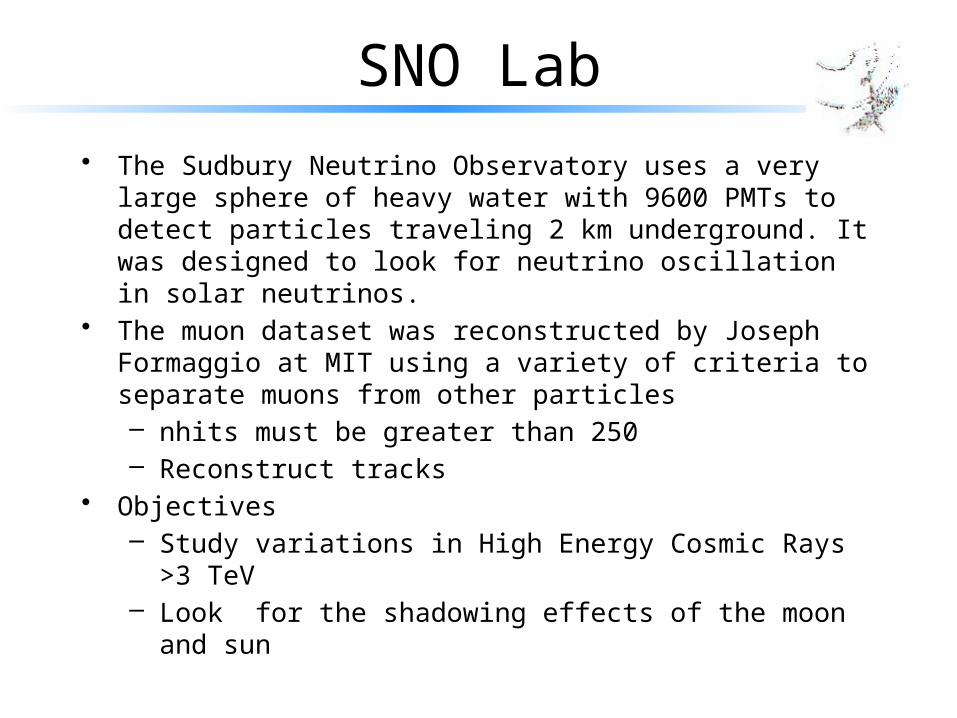
• The Sudbury Neutrino Observatory uses a very large sphere of heavy water with 9600 PMTs to detect particles traveling 2 km underground. It was designed to look for neutrino oscillation in solar neutrinos.
• The muon dataset was reconstructed by Joseph Formaggio at MIT using a variety of criteria to separate muons from other particles– nhits must be greater than 250– Reconstruct tracks
• Objectives– Study variations in High Energy Cosmic Rays >3 TeV– Look for the shadowing effects of the moon and sun

SNOLAB

SNO Lab
SNO Lab
SNO Lab
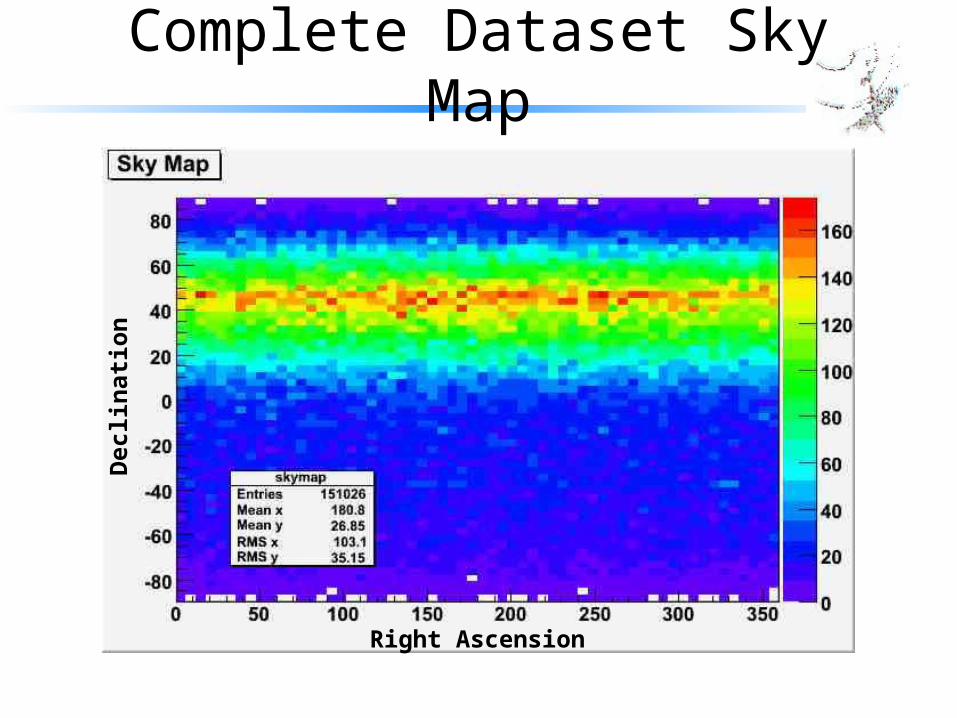
Complete Dataset Sky Map
Right Ascension
Dec
lina
tion

Nhits Distributionseta <.125π .4375 π <eta <.5625π
.625 π <eta <.75π .875 π <eta
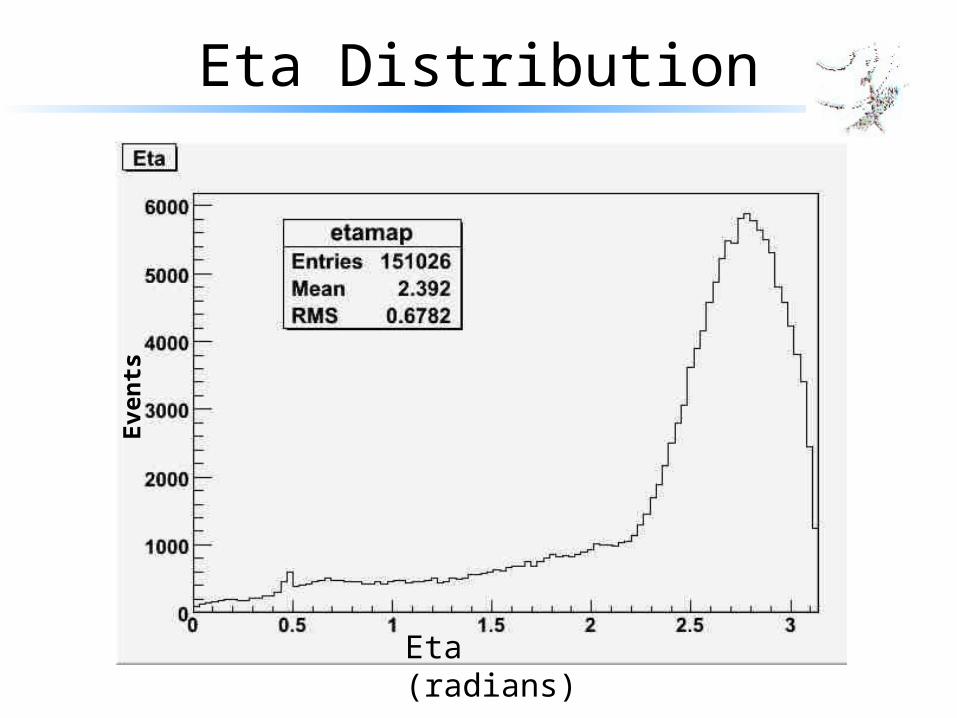
Eta Distribution
Eta (radians)
Eve
nts

Psi Distribution
Psi (radians)
Eve
nts
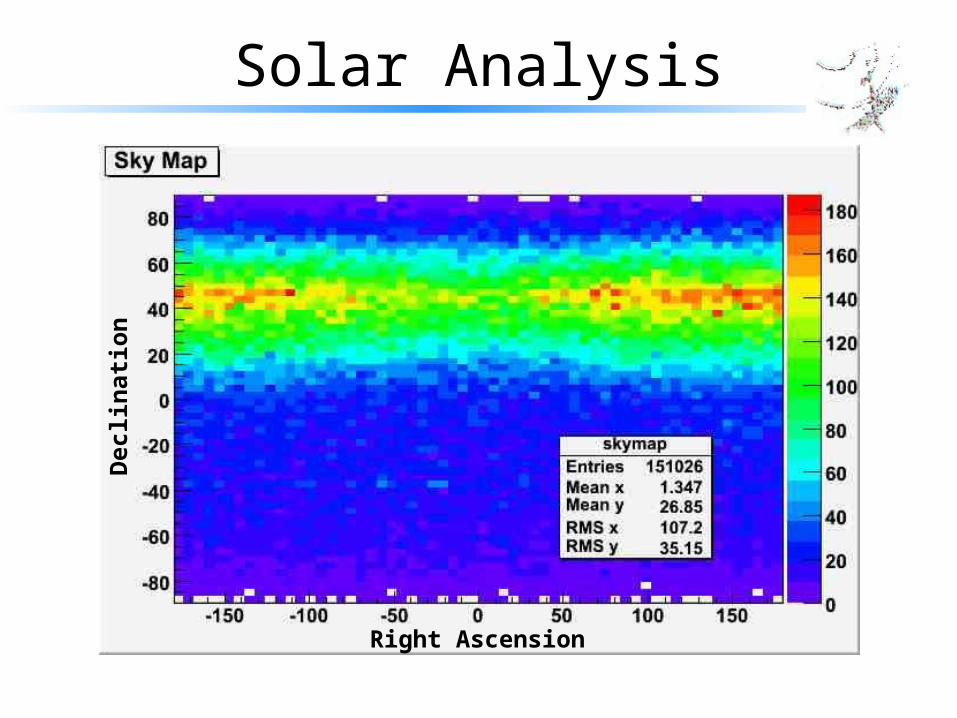
Solar Analysis
Right Ascension
Dec
lina
tion
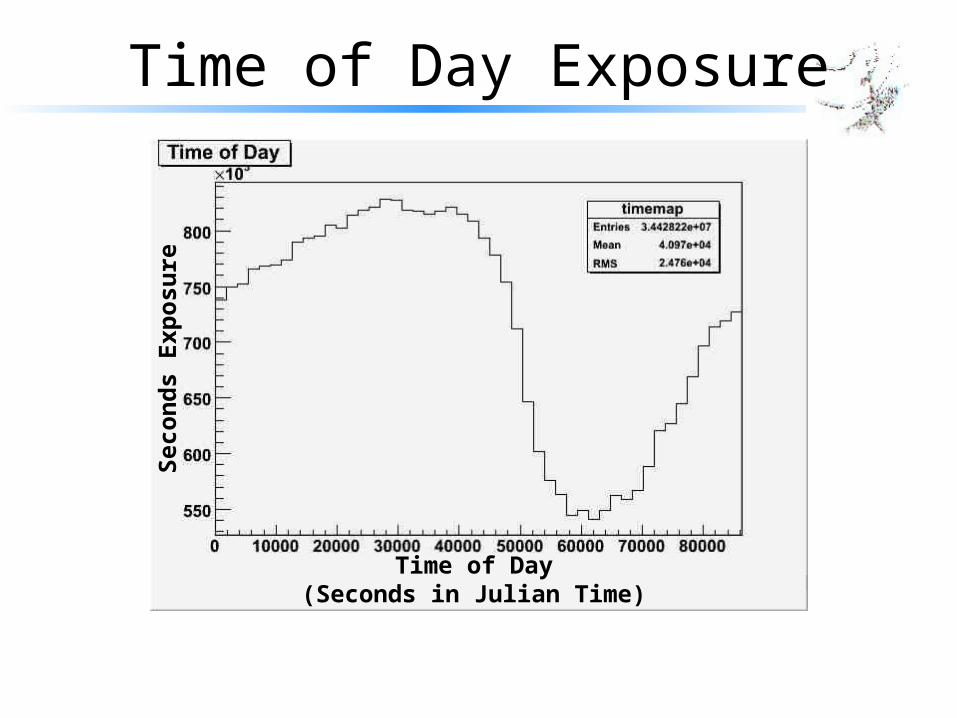
Time of Day Exposure
Seco
nds
Time of Day(Seconds in Julian Time)
Seco
nds
Exp
osur
e

Daily Variation
Time of Day
Nor
mal
ized
Int
ensi
ty

Seasonal Variations:High Energy Muons
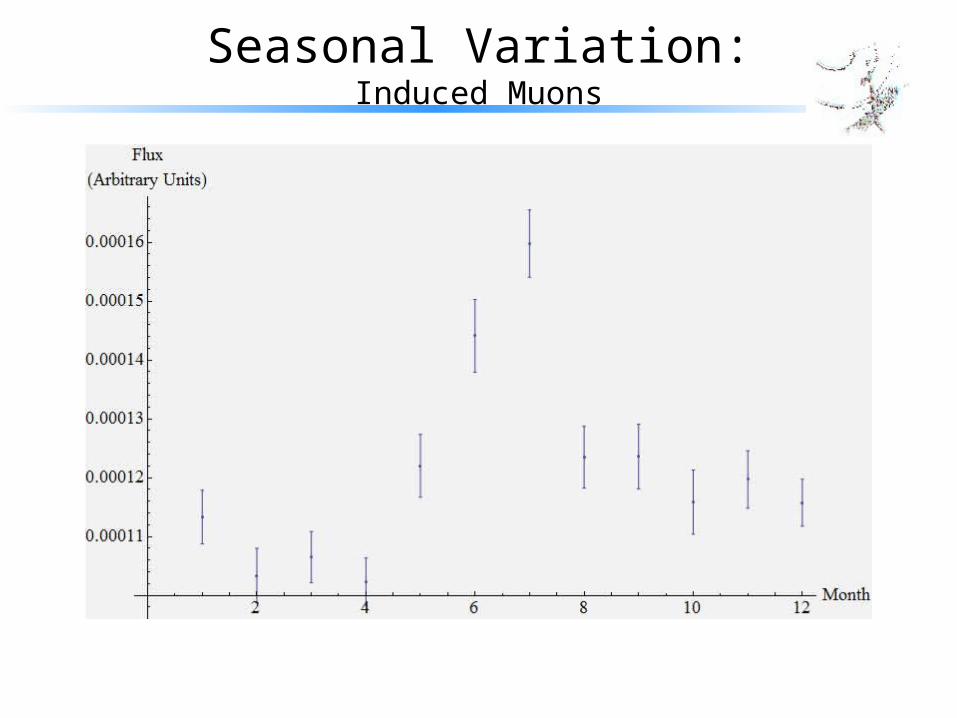
Seasonal Variation:Induced Muons

Discussion
• Observations– Shadowing effects were not able to be observed probably because
of inadequate data– The observed daily variation in muon flux appears significantly
higher than anticipated– Seasonal variations were observed in both the high energy muons
and induced muons• Lessons
– Working on a large collaboration like SNO has provide me an excellent opportunity to grow and experience true physics research
– My research projects have been cumulative allowing me to use my past experiences to help face the unique challenges of each project

Questions?
Related Documents