Semiannual Report June 30, 2017 John Hancock Variable Insurance Trust

Welcome message from author
This document is posted to help you gain knowledge. Please leave a comment to let me know what you think about it! Share it to your friends and learn new things together.
Transcript

Semiannual Report
June 30, 2017
John Hancock
Variable Insurance Trust
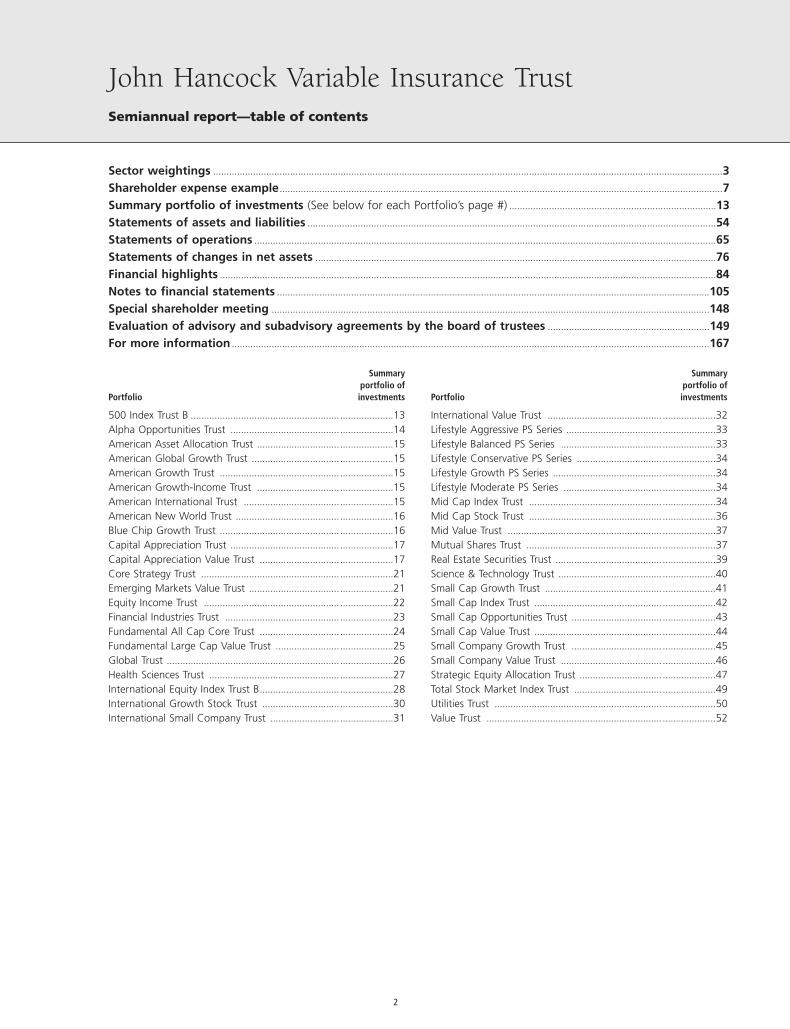
Sector weightings ................................................................................................................................................................................................3Shareholder expense example.......................................................................................................................................................................7Summary portfolio of investments (See below for each Portfolio’s page #) ..............................................................................13Statements of assets and liabilities ..........................................................................................................................................................54Statements of operations ..............................................................................................................................................................................65Statements of changes in net assets .......................................................................................................................................................76Financial highlights ...........................................................................................................................................................................................84Notes to financial statements ...................................................................................................................................................................105Special shareholder meeting .....................................................................................................................................................................148Evaluation of advisory and subadvisory agreements by the board of trustees .............................................................149For more information ....................................................................................................................................................................................167
Portfolio
Summaryportfolio ofinvestments
500 Index Trust B ............................................................................13Alpha Opportunities Trust .............................................................14American Asset Allocation Trust ...................................................15American Global Growth Trust .....................................................15American Growth Trust .................................................................15American Growth-Income Trust ...................................................15American International Trust ........................................................15American New World Trust ...........................................................16Blue Chip Growth Trust .................................................................16Capital Appreciation Trust .............................................................17Capital Appreciation Value Trust ..................................................17Core Strategy Trust ........................................................................21Emerging Markets Value Trust ......................................................21Equity Income Trust .......................................................................22Financial Industries Trust ...............................................................23Fundamental All Cap Core Trust ..................................................24Fundamental Large Cap Value Trust ............................................25Global Trust .....................................................................................26Health Sciences Trust .....................................................................27International Equity Index Trust B..................................................28International Growth Stock Trust .................................................30International Small Company Trust ..............................................31
Portfolio
Summaryportfolio ofinvestments
International Value Trust ...............................................................32Lifestyle Aggressive PS Series ........................................................33Lifestyle Balanced PS Series ..........................................................33Lifestyle Conservative PS Series ....................................................34Lifestyle Growth PS Series .............................................................34Lifestyle Moderate PS Series .........................................................34Mid Cap Index Trust ......................................................................34Mid Cap Stock Trust ......................................................................36Mid Value Trust ..............................................................................37Mutual Shares Trust .......................................................................37Real Estate Securities Trust ............................................................39Science & Technology Trust ...........................................................40Small Cap Growth Trust ................................................................41Small Cap Index Trust ....................................................................42Small Cap Opportunities Trust ......................................................43Small Cap Value Trust ....................................................................44Small Company Growth Trust ......................................................45Small Company Value Trust ..........................................................46Strategic Equity Allocation Trust ...................................................47Total Stock Market Index Trust .....................................................49Utilities Trust ...................................................................................50Value Trust ......................................................................................52
John Hancock Variable Insurance TrustSemiannual report—table of contents
2
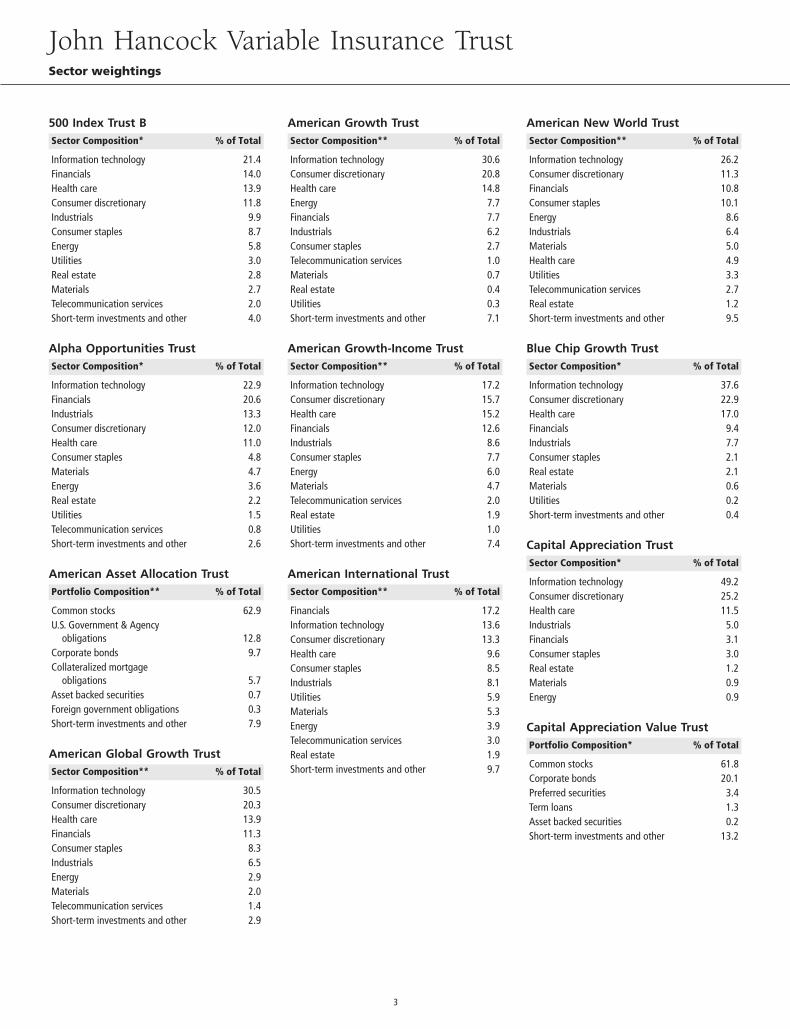
500 Index Trust BSector Composition* % of Total
Information technology 21.4Financials 14.0Health care 13.9Consumer discretionary 11.8Industrials 9.9Consumer staples 8.7Energy 5.8Utilities 3.0Real estate 2.8Materials 2.7Telecommunication services 2.0Short-term investments and other 4.0
Alpha Opportunities TrustSector Composition* % of Total
Information technology 22.9Financials 20.6Industrials 13.3Consumer discretionary 12.0Health care 11.0Consumer staples 4.8Materials 4.7Energy 3.6Real estate 2.2Utilities 1.5Telecommunication services 0.8Short-term investments and other 2.6
American Asset Allocation TrustPortfolio Composition** % of Total
Common stocks 62.9U.S. Government & Agency
obligations 12.8Corporate bonds 9.7Collateralized mortgage
obligations 5.7Asset backed securities 0.7Foreign government obligations 0.3Short-term investments and other 7.9
American Global Growth TrustSector Composition** % of Total
Information technology 30.5Consumer discretionary 20.3Health care 13.9Financials 11.3Consumer staples 8.3Industrials 6.5Energy 2.9Materials 2.0Telecommunication services 1.4Short-term investments and other 2.9
American Growth TrustSector Composition** % of Total
Information technology 30.6Consumer discretionary 20.8Health care 14.8Energy 7.7Financials 7.7Industrials 6.2Consumer staples 2.7Telecommunication services 1.0Materials 0.7Real estate 0.4Utilities 0.3Short-term investments and other 7.1
American Growth-Income TrustSector Composition** % of Total
Information technology 17.2Consumer discretionary 15.7Health care 15.2Financials 12.6Industrials 8.6Consumer staples 7.7Energy 6.0Materials 4.7Telecommunication services 2.0Real estate 1.9Utilities 1.0Short-term investments and other 7.4
American International TrustSector Composition** % of Total
Financials 17.2Information technology 13.6Consumer discretionary 13.3Health care 9.6Consumer staples 8.5Industrials 8.1Utilities 5.9Materials 5.3Energy 3.9Telecommunication services 3.0Real estate 1.9Short-term investments and other 9.7
American New World TrustSector Composition** % of Total
Information technology 26.2Consumer discretionary 11.3Financials 10.8Consumer staples 10.1Energy 8.6Industrials 6.4Materials 5.0Health care 4.9Utilities 3.3Telecommunication services 2.7Real estate 1.2Short-term investments and other 9.5
Blue Chip Growth TrustSector Composition* % of Total
Information technology 37.6Consumer discretionary 22.9Health care 17.0Financials 9.4Industrials 7.7Consumer staples 2.1Real estate 2.1Materials 0.6Utilities 0.2Short-term investments and other 0.4
Capital Appreciation TrustSector Composition* % of Total
Information technology 49.2Consumer discretionary 25.2Health care 11.5Industrials 5.0Financials 3.1Consumer staples 3.0Real estate 1.2Materials 0.9Energy 0.9
Capital Appreciation Value TrustPortfolio Composition* % of Total
Common stocks 61.8Corporate bonds 20.1Preferred securities 3.4Term loans 1.3Asset backed securities 0.2Short-term investments and other 13.2
John Hancock Variable Insurance TrustSector weightings
3
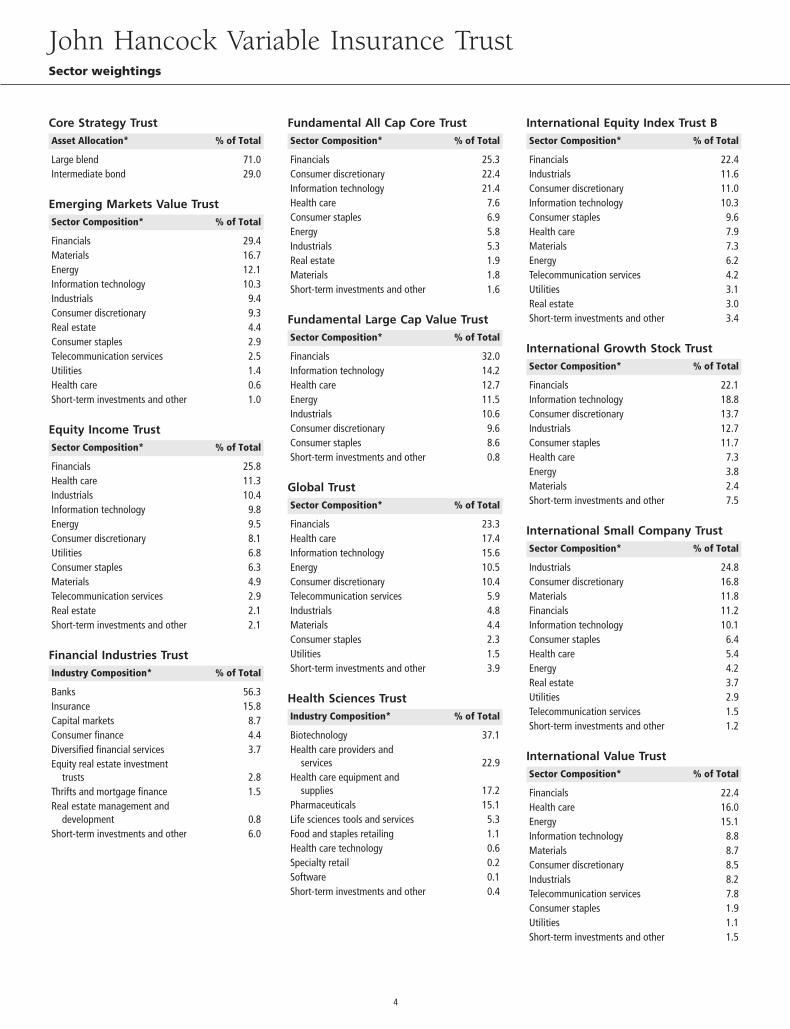
Core Strategy TrustAsset Allocation* % of Total
Large blend 71.0Intermediate bond 29.0
Emerging Markets Value TrustSector Composition* % of Total
Financials 29.4Materials 16.7Energy 12.1Information technology 10.3Industrials 9.4Consumer discretionary 9.3Real estate 4.4Consumer staples 2.9Telecommunication services 2.5Utilities 1.4Health care 0.6Short-term investments and other 1.0
Equity Income TrustSector Composition* % of Total
Financials 25.8Health care 11.3Industrials 10.4Information technology 9.8Energy 9.5Consumer discretionary 8.1Utilities 6.8Consumer staples 6.3Materials 4.9Telecommunication services 2.9Real estate 2.1Short-term investments and other 2.1
Financial Industries TrustIndustry Composition* % of Total
Banks 56.3Insurance 15.8Capital markets 8.7Consumer finance 4.4Diversified financial services 3.7Equity real estate investment
trusts 2.8Thrifts and mortgage finance 1.5Real estate management and
development 0.8Short-term investments and other 6.0
Fundamental All Cap Core TrustSector Composition* % of Total
Financials 25.3Consumer discretionary 22.4Information technology 21.4Health care 7.6Consumer staples 6.9Energy 5.8Industrials 5.3Real estate 1.9Materials 1.8Short-term investments and other 1.6
Fundamental Large Cap Value TrustSector Composition* % of Total
Financials 32.0Information technology 14.2Health care 12.7Energy 11.5Industrials 10.6Consumer discretionary 9.6Consumer staples 8.6Short-term investments and other 0.8
Global TrustSector Composition* % of Total
Financials 23.3Health care 17.4Information technology 15.6Energy 10.5Consumer discretionary 10.4Telecommunication services 5.9Industrials 4.8Materials 4.4Consumer staples 2.3Utilities 1.5Short-term investments and other 3.9
Health Sciences TrustIndustry Composition* % of Total
Biotechnology 37.1Health care providers and
services 22.9Health care equipment and
supplies 17.2Pharmaceuticals 15.1Life sciences tools and services 5.3Food and staples retailing 1.1Health care technology 0.6Specialty retail 0.2Software 0.1Short-term investments and other 0.4
International Equity Index Trust BSector Composition* % of Total
Financials 22.4Industrials 11.6Consumer discretionary 11.0Information technology 10.3Consumer staples 9.6Health care 7.9Materials 7.3Energy 6.2Telecommunication services 4.2Utilities 3.1Real estate 3.0Short-term investments and other 3.4
International Growth Stock TrustSector Composition* % of Total
Financials 22.1Information technology 18.8Consumer discretionary 13.7Industrials 12.7Consumer staples 11.7Health care 7.3Energy 3.8Materials 2.4Short-term investments and other 7.5
International Small Company TrustSector Composition* % of Total
Industrials 24.8Consumer discretionary 16.8Materials 11.8Financials 11.2Information technology 10.1Consumer staples 6.4Health care 5.4Energy 4.2Real estate 3.7Utilities 2.9Telecommunication services 1.5Short-term investments and other 1.2
International Value TrustSector Composition* % of Total
Financials 22.4Health care 16.0Energy 15.1Information technology 8.8Materials 8.7Consumer discretionary 8.5Industrials 8.2Telecommunication services 7.8Consumer staples 1.9Utilities 1.1Short-term investments and other 1.5
John Hancock Variable Insurance TrustSector weightings
4
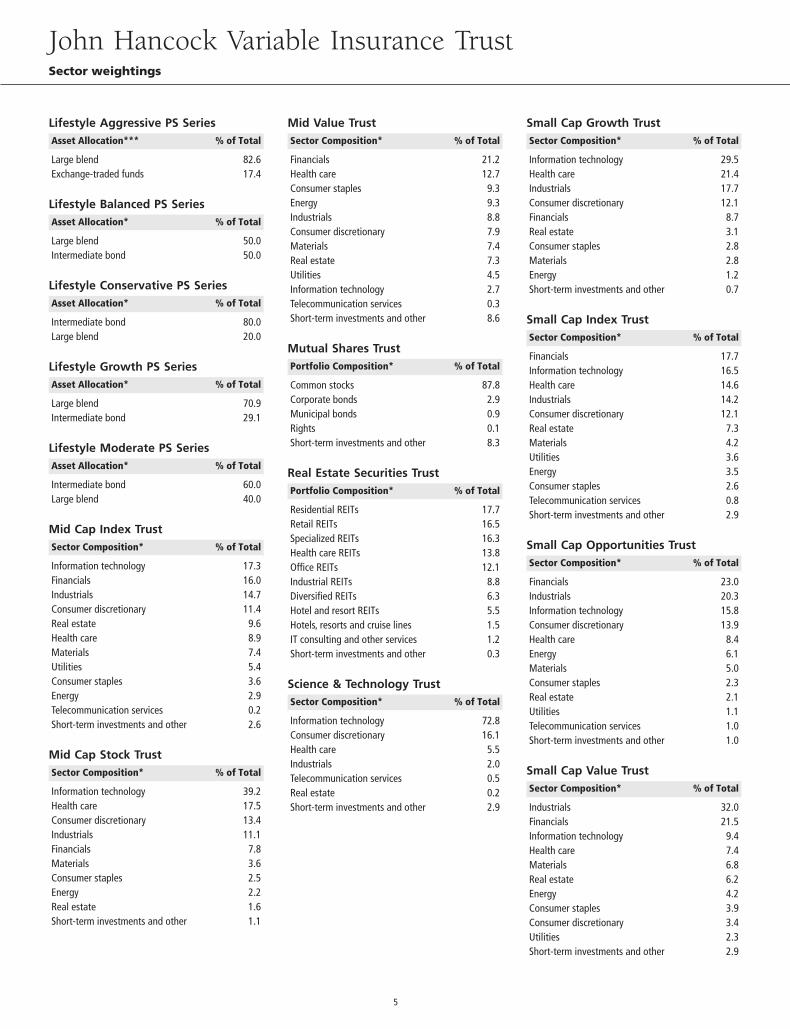
Lifestyle Aggressive PS SeriesAsset Allocation*** % of Total
Large blend 82.6Exchange-traded funds 17.4
Lifestyle Balanced PS SeriesAsset Allocation* % of Total
Large blend 50.0Intermediate bond 50.0
Lifestyle Conservative PS SeriesAsset Allocation* % of Total
Intermediate bond 80.0Large blend 20.0
Lifestyle Growth PS SeriesAsset Allocation* % of Total
Large blend 70.9Intermediate bond 29.1
Lifestyle Moderate PS SeriesAsset Allocation* % of Total
Intermediate bond 60.0Large blend 40.0
Mid Cap Index TrustSector Composition* % of Total
Information technology 17.3Financials 16.0Industrials 14.7Consumer discretionary 11.4Real estate 9.6Health care 8.9Materials 7.4Utilities 5.4Consumer staples 3.6Energy 2.9Telecommunication services 0.2Short-term investments and other 2.6
Mid Cap Stock TrustSector Composition* % of Total
Information technology 39.2Health care 17.5Consumer discretionary 13.4Industrials 11.1Financials 7.8Materials 3.6Consumer staples 2.5Energy 2.2Real estate 1.6Short-term investments and other 1.1
Mid Value TrustSector Composition* % of Total
Financials 21.2Health care 12.7Consumer staples 9.3Energy 9.3Industrials 8.8Consumer discretionary 7.9Materials 7.4Real estate 7.3Utilities 4.5Information technology 2.7Telecommunication services 0.3Short-term investments and other 8.6
Mutual Shares TrustPortfolio Composition* % of Total
Common stocks 87.8Corporate bonds 2.9Municipal bonds 0.9Rights 0.1Short-term investments and other 8.3
Real Estate Securities TrustPortfolio Composition* % of Total
Residential REITs 17.7Retail REITs 16.5Specialized REITs 16.3Health care REITs 13.8Office REITs 12.1Industrial REITs 8.8Diversified REITs 6.3Hotel and resort REITs 5.5Hotels, resorts and cruise lines 1.5IT consulting and other services 1.2Short-term investments and other 0.3
Science & Technology TrustSector Composition* % of Total
Information technology 72.8Consumer discretionary 16.1Health care 5.5Industrials 2.0Telecommunication services 0.5Real estate 0.2Short-term investments and other 2.9
Small Cap Growth TrustSector Composition* % of Total
Information technology 29.5Health care 21.4Industrials 17.7Consumer discretionary 12.1Financials 8.7Real estate 3.1Consumer staples 2.8Materials 2.8Energy 1.2Short-term investments and other 0.7
Small Cap Index TrustSector Composition* % of Total
Financials 17.7Information technology 16.5Health care 14.6Industrials 14.2Consumer discretionary 12.1Real estate 7.3Materials 4.2Utilities 3.6Energy 3.5Consumer staples 2.6Telecommunication services 0.8Short-term investments and other 2.9
Small Cap Opportunities TrustSector Composition* % of Total
Financials 23.0Industrials 20.3Information technology 15.8Consumer discretionary 13.9Health care 8.4Energy 6.1Materials 5.0Consumer staples 2.3Real estate 2.1Utilities 1.1Telecommunication services 1.0Short-term investments and other 1.0
Small Cap Value TrustSector Composition* % of Total
Industrials 32.0Financials 21.5Information technology 9.4Health care 7.4Materials 6.8Real estate 6.2Energy 4.2Consumer staples 3.9Consumer discretionary 3.4Utilities 2.3Short-term investments and other 2.9
John Hancock Variable Insurance TrustSector weightings
5
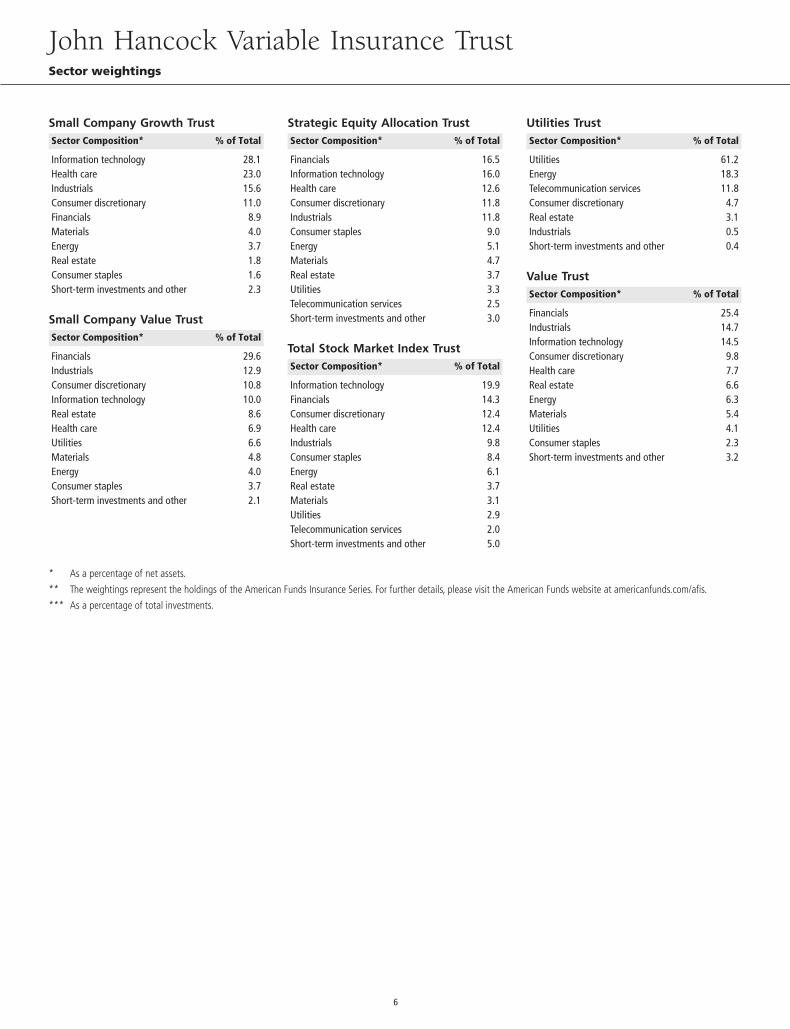
Small Company Growth TrustSector Composition* % of Total
Information technology 28.1Health care 23.0Industrials 15.6Consumer discretionary 11.0Financials 8.9Materials 4.0Energy 3.7Real estate 1.8Consumer staples 1.6Short-term investments and other 2.3
Small Company Value TrustSector Composition* % of Total
Financials 29.6Industrials 12.9Consumer discretionary 10.8Information technology 10.0Real estate 8.6Health care 6.9Utilities 6.6Materials 4.8Energy 4.0Consumer staples 3.7Short-term investments and other 2.1
Strategic Equity Allocation TrustSector Composition* % of Total
Financials 16.5Information technology 16.0Health care 12.6Consumer discretionary 11.8Industrials 11.8Consumer staples 9.0Energy 5.1Materials 4.7Real estate 3.7Utilities 3.3Telecommunication services 2.5Short-term investments and other 3.0
Total Stock Market Index TrustSector Composition* % of Total
Information technology 19.9Financials 14.3Consumer discretionary 12.4Health care 12.4Industrials 9.8Consumer staples 8.4Energy 6.1Real estate 3.7Materials 3.1Utilities 2.9Telecommunication services 2.0Short-term investments and other 5.0
Utilities TrustSector Composition* % of Total
Utilities 61.2Energy 18.3Telecommunication services 11.8Consumer discretionary 4.7Real estate 3.1Industrials 0.5Short-term investments and other 0.4
Value TrustSector Composition* % of Total
Financials 25.4Industrials 14.7Information technology 14.5Consumer discretionary 9.8Health care 7.7Real estate 6.6Energy 6.3Materials 5.4Utilities 4.1Consumer staples 2.3Short-term investments and other 3.2
* As a percentage of net assets.
** The weightings represent the holdings of the American Funds Insurance Series. For further details, please visit the American Funds website at americanfunds.com/afis.
*** As a percentage of total investments.
John Hancock Variable Insurance TrustSector weightings
6
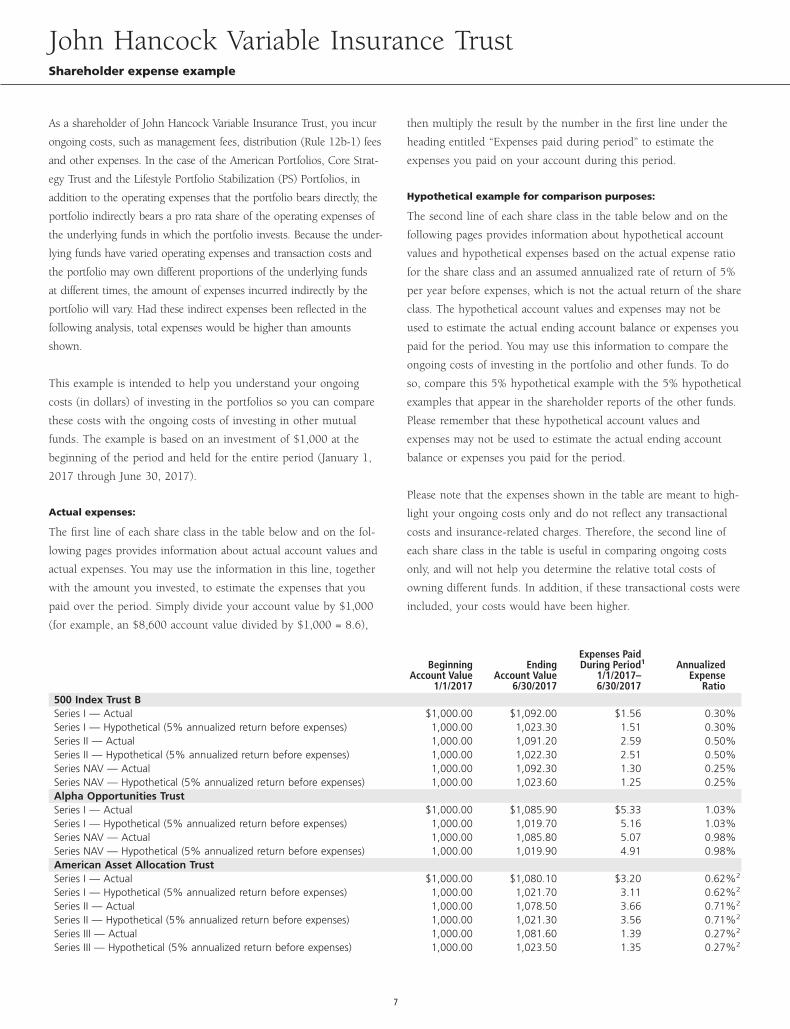
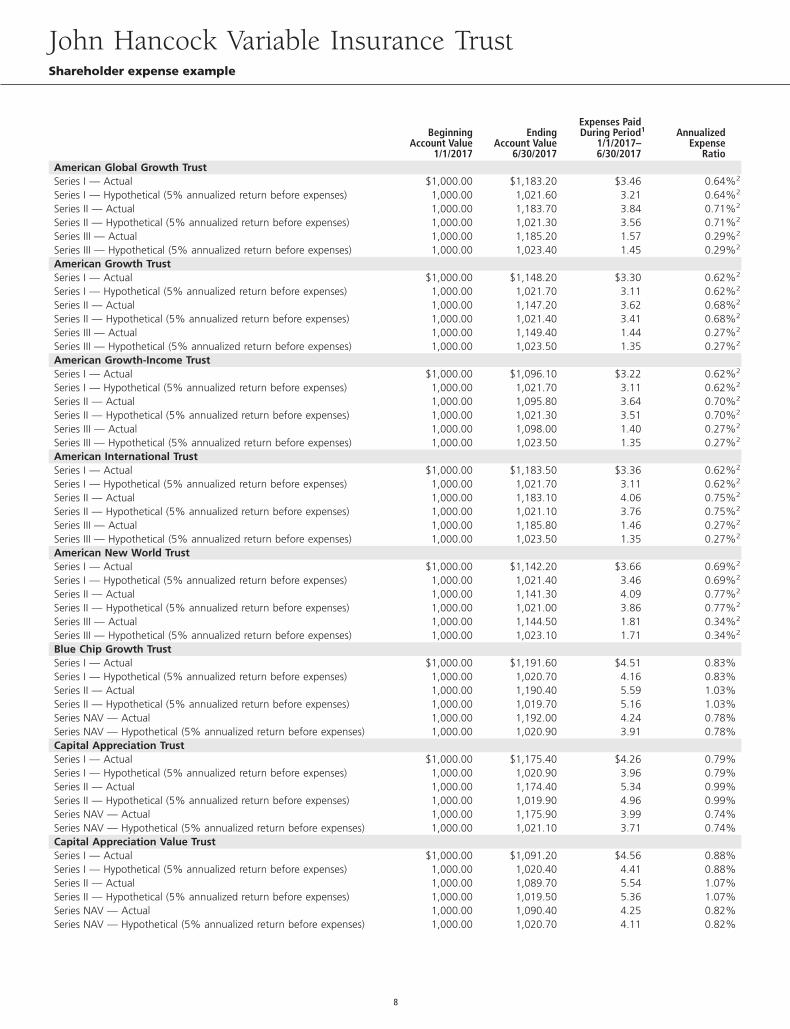
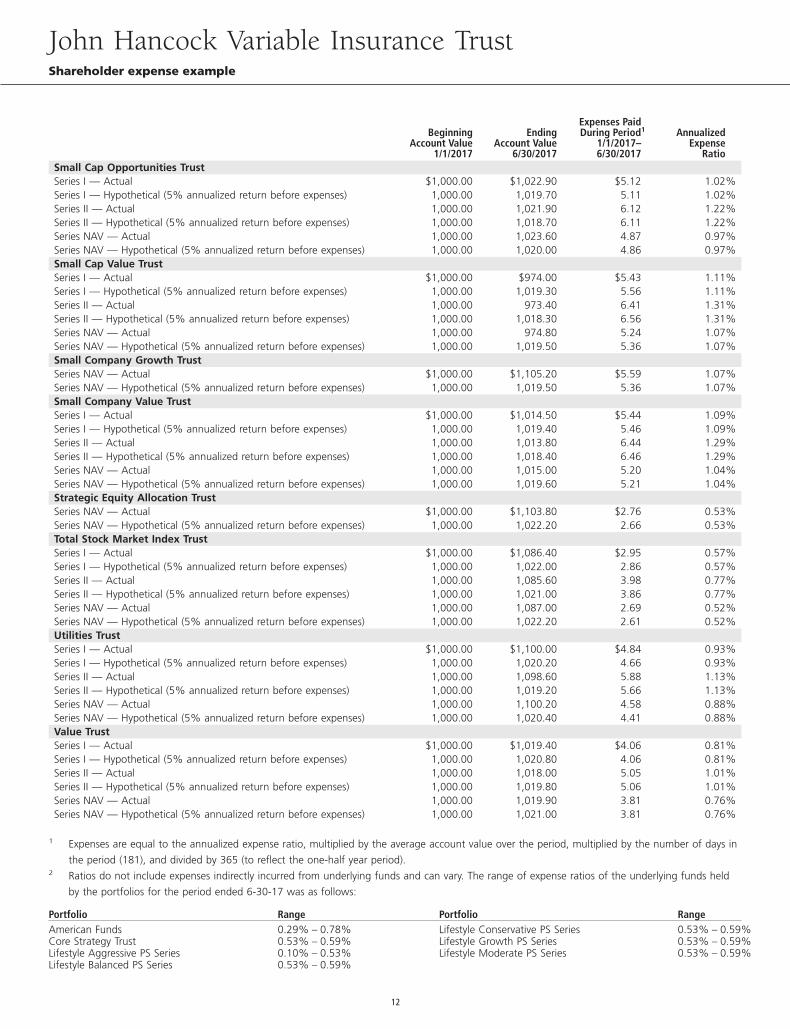
As a shareholder of John Hancock Variable Insurance Trust, you incur
ongoing costs, such as management fees, distribution (Rule 12b-1) fees
and other expenses. In the case of the American Portfolios, Core Strat-
egy Trust and the Lifestyle Portfolio Stabilization (PS) Portfolios, in
addition to the operating expenses that the portfolio bears directly, the
portfolio indirectly bears a pro rata share of the operating expenses of
the underlying funds in which the portfolio invests. Because the under-
lying funds have varied operating expenses and transaction costs and
the portfolio may own different proportions of the underlying funds
at different times, the amount of expenses incurred indirectly by the
portfolio will vary. Had these indirect expenses been reflected in the
following analysis, total expenses would be higher than amounts
shown.
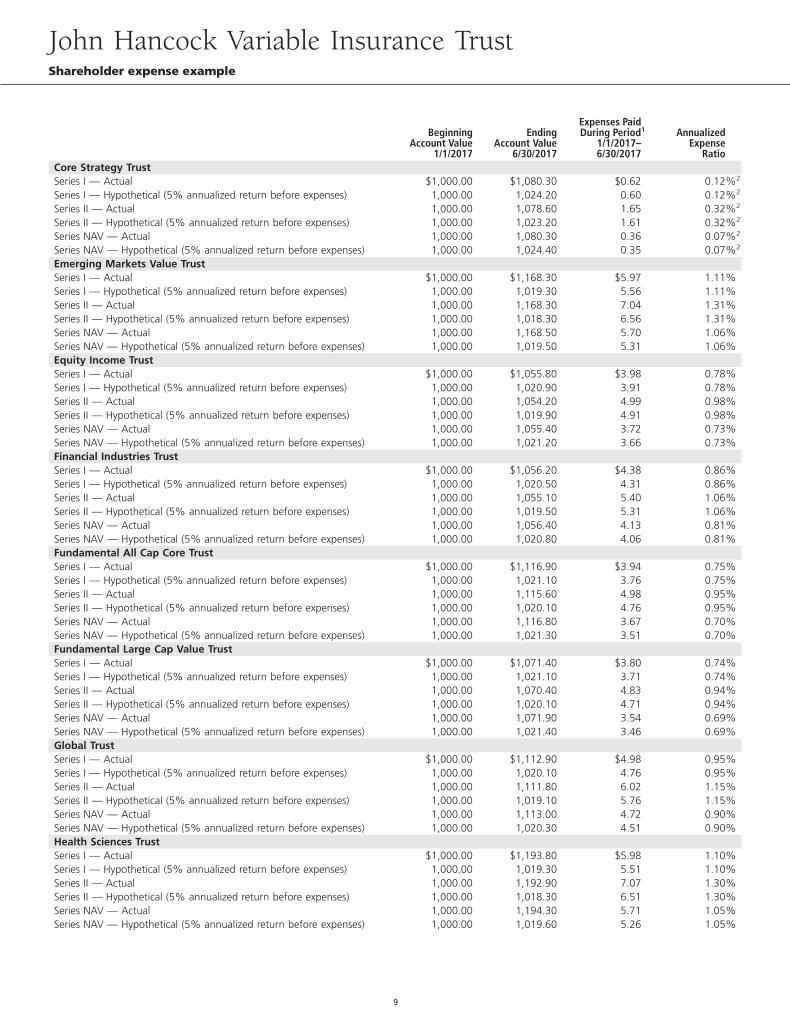
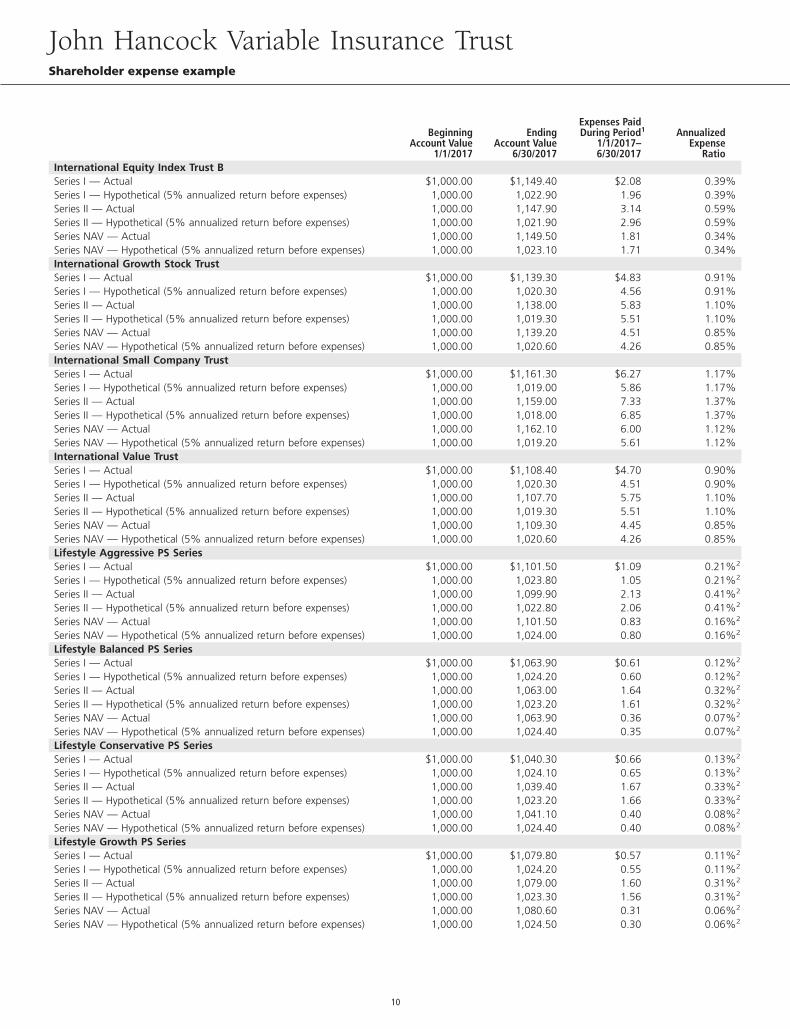
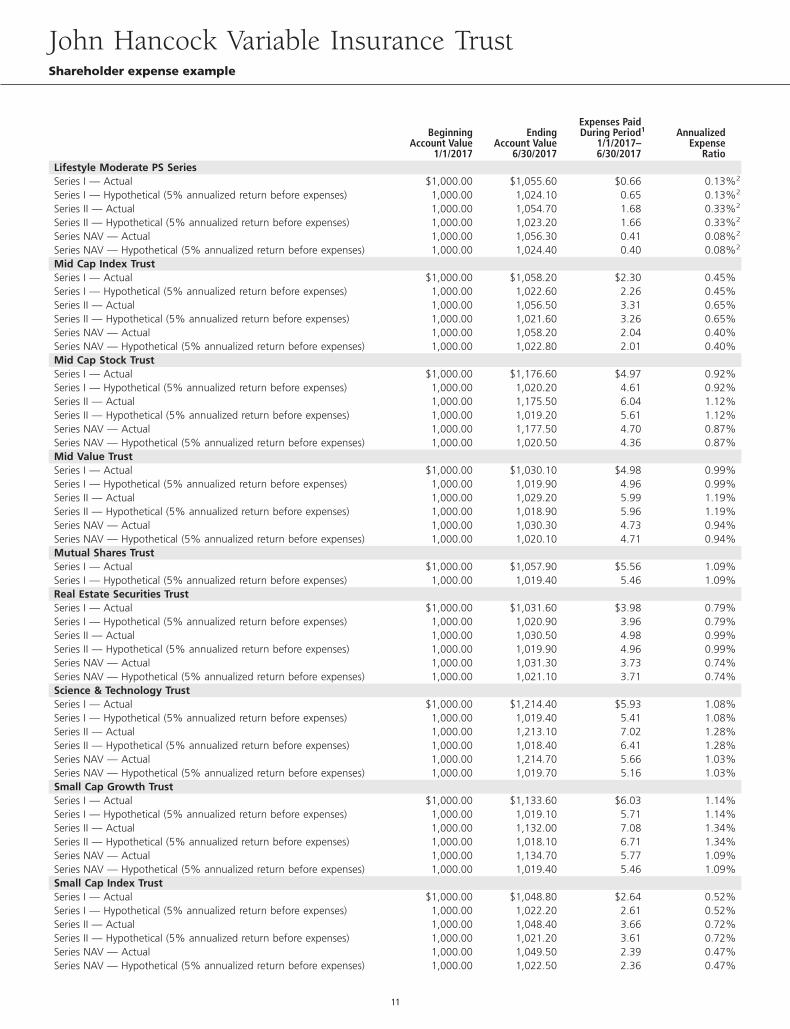
This example is intended to help you understand your ongoing
costs (in dollars) of investing in the portfolios so you can compare
these costs with the ongoing costs of investing in other mutual
funds. The example is based on an investment of $1,000 at the
beginning of the period and held for the entire period (January 1,
2017 through June 30, 2017).
Actual expenses:
The first line of each share class in the table below and on the fol-
lowing pages provides information about actual account values and
actual expenses. You may use the information in this line, together
with the amount you invested, to estimate the expenses that you
paid over the period. Simply divide your account value by $1,000
(for example, an $8,600 account value divided by $1,000 = 8.6),
then multiply the result by the number in the first line under the
heading entitled “Expenses paid during period” to estimate the
expenses you paid on your account during this period.
Hypothetical example for comparison purposes:
The second line of each share class in the table below and on the
following pages provides information about hypothetical account
values and hypothetical expenses based on the actual expense ratio
for the share class and an assumed annualized rate of return of 5%
per year before expenses, which is not the actual return of the share
class. The hypothetical account values and expenses may not be
used to estimate the actual ending account balance or expenses you
paid for the period. You may use this information to compare the
ongoing costs of investing in the portfolio and other funds. To do
so, compare this 5% hypothetical example with the 5% hypothetical
examples that appear in the shareholder reports of the other funds.
Please remember that these hypothetical account values and
expenses may not be used to estimate the actual ending account
balance or expenses you paid for the period.
Please note that the expenses shown in the table are meant to high-
light your ongoing costs only and do not reflect any transactional
costs and insurance-related charges. Therefore, the second line of
each share class in the table is useful in comparing ongoing costs
only, and will not help you determine the relative total costs of
owning different funds. In addition, if these transactional costs were
included, your costs would have been higher.
BeginningAccount Value
1/1/2017
EndingAccount Value
6/30/2017
Expenses PaidDuring Period1
1/1/2017–6/30/2017
AnnualizedExpense
Ratio500 Index Trust BSeries I — Actual $1,000.00 $1,092.00 $1.56 0.30%Series I — Hypothetical (5% annualized return before expenses) 1,000.00 1,023.30 1.51 0.30%Series II — Actual 1,000.00 1,091.20 2.59 0.50%Series II — Hypothetical (5% annualized return before expenses) 1,000.00 1,022.30 2.51 0.50%Series NAV — Actual 1,000.00 1,092.30 1.30 0.25%Series NAV — Hypothetical (5% annualized return before expenses) 1,000.00 1,023.60 1.25 0.25%Alpha Opportunities TrustSeries I — Actual $1,000.00 $1,085.90 $5.33 1.03%Series I — Hypothetical (5% annualized return before expenses) 1,000.00 1,019.70 5.16 1.03%Series NAV — Actual 1,000.00 1,085.80 5.07 0.98%Series NAV — Hypothetical (5% annualized return before expenses) 1,000.00 1,019.90 4.91 0.98%American Asset Allocation TrustSeries I — Actual $1,000.00 $1,080.10 $3.20 0.62%2
Series I — Hypothetical (5% annualized return before expenses) 1,000.00 1,021.70 3.11 0.62%2
Series II — Actual 1,000.00 1,078.50 3.66 0.71%2
Series II — Hypothetical (5% annualized return before expenses) 1,000.00 1,021.30 3.56 0.71%2
Series III — Actual 1,000.00 1,081.60 1.39 0.27%2
Series III — Hypothetical (5% annualized return before expenses) 1,000.00 1,023.50 1.35 0.27%2
John Hancock Variable Insurance TrustShareholder expense example
7
BeginningAccount Value
1/1/2017
EndingAccount Value
6/30/2017
Expenses PaidDuring Period1
1/1/2017–6/30/2017
AnnualizedExpense
RatioAmerican Global Growth TrustSeries I — Actual $1,000.00 $1,183.20 $3.46 0.64%2
Series I — Hypothetical (5% annualized return before expenses) 1,000.00 1,021.60 3.21 0.64%2
Series II — Actual 1,000.00 1,183.70 3.84 0.71%2
Series II — Hypothetical (5% annualized return before expenses) 1,000.00 1,021.30 3.56 0.71%2
Series III — Actual 1,000.00 1,185.20 1.57 0.29%2
Series III — Hypothetical (5% annualized return before expenses) 1,000.00 1,023.40 1.45 0.29%2
American Growth TrustSeries I — Actual $1,000.00 $1,148.20 $3.30 0.62%2
Series I — Hypothetical (5% annualized return before expenses) 1,000.00 1,021.70 3.11 0.62%2
Series II — Actual 1,000.00 1,147.20 3.62 0.68%2
Series II — Hypothetical (5% annualized return before expenses) 1,000.00 1,021.40 3.41 0.68%2
Series III — Actual 1,000.00 1,149.40 1.44 0.27%2
Series III — Hypothetical (5% annualized return before expenses) 1,000.00 1,023.50 1.35 0.27%2
American Growth-Income TrustSeries I — Actual $1,000.00 $1,096.10 $3.22 0.62%2
Series I — Hypothetical (5% annualized return before expenses) 1,000.00 1,021.70 3.11 0.62%2
Series II — Actual 1,000.00 1,095.80 3.64 0.70%2
Series II — Hypothetical (5% annualized return before expenses) 1,000.00 1,021.30 3.51 0.70%2
Series III — Actual 1,000.00 1,098.00 1.40 0.27%2
Series III — Hypothetical (5% annualized return before expenses) 1,000.00 1,023.50 1.35 0.27%2
American International TrustSeries I — Actual $1,000.00 $1,183.50 $3.36 0.62%2
Series I — Hypothetical (5% annualized return before expenses) 1,000.00 1,021.70 3.11 0.62%2
Series II — Actual 1,000.00 1,183.10 4.06 0.75%2
Series II — Hypothetical (5% annualized return before expenses) 1,000.00 1,021.10 3.76 0.75%2
Series III — Actual 1,000.00 1,185.80 1.46 0.27%2
Series III — Hypothetical (5% annualized return before expenses) 1,000.00 1,023.50 1.35 0.27%2
American New World TrustSeries I — Actual $1,000.00 $1,142.20 $3.66 0.69%2
Series I — Hypothetical (5% annualized return before expenses) 1,000.00 1,021.40 3.46 0.69%2
Series II — Actual 1,000.00 1,141.30 4.09 0.77%2
Series II — Hypothetical (5% annualized return before expenses) 1,000.00 1,021.00 3.86 0.77%2
Series III — Actual 1,000.00 1,144.50 1.81 0.34%2
Series III — Hypothetical (5% annualized return before expenses) 1,000.00 1,023.10 1.71 0.34%2
Blue Chip Growth TrustSeries I — Actual $1,000.00 $1,191.60 $4.51 0.83%Series I — Hypothetical (5% annualized return before expenses) 1,000.00 1,020.70 4.16 0.83%Series II — Actual 1,000.00 1,190.40 5.59 1.03%Series II — Hypothetical (5% annualized return before expenses) 1,000.00 1,019.70 5.16 1.03%Series NAV — Actual 1,000.00 1,192.00 4.24 0.78%Series NAV — Hypothetical (5% annualized return before expenses) 1,000.00 1,020.90 3.91 0.78%Capital Appreciation TrustSeries I — Actual $1,000.00 $1,175.40 $4.26 0.79%Series I — Hypothetical (5% annualized return before expenses) 1,000.00 1,020.90 3.96 0.79%Series II — Actual 1,000.00 1,174.40 5.34 0.99%Series II — Hypothetical (5% annualized return before expenses) 1,000.00 1,019.90 4.96 0.99%Series NAV — Actual 1,000.00 1,175.90 3.99 0.74%Series NAV — Hypothetical (5% annualized return before expenses) 1,000.00 1,021.10 3.71 0.74%Capital Appreciation Value TrustSeries I — Actual $1,000.00 $1,091.20 $4.56 0.88%Series I — Hypothetical (5% annualized return before expenses) 1,000.00 1,020.40 4.41 0.88%Series II — Actual 1,000.00 1,089.70 5.54 1.07%Series II — Hypothetical (5% annualized return before expenses) 1,000.00 1,019.50 5.36 1.07%Series NAV — Actual 1,000.00 1,090.40 4.25 0.82%Series NAV — Hypothetical (5% annualized return before expenses) 1,000.00 1,020.70 4.11 0.82%
John Hancock Variable Insurance TrustShareholder expense example
8
BeginningAccount Value
1/1/2017
EndingAccount Value
6/30/2017
Expenses PaidDuring Period1
1/1/2017–6/30/2017
AnnualizedExpense
RatioCore Strategy TrustSeries I — Actual $1,000.00 $1,080.30 $0.62 0.12%2
Series I — Hypothetical (5% annualized return before expenses) 1,000.00 1,024.20 0.60 0.12%2
Series II — Actual 1,000.00 1,078.60 1.65 0.32%2
Series II — Hypothetical (5% annualized return before expenses) 1,000.00 1,023.20 1.61 0.32%2
Series NAV — Actual 1,000.00 1,080.30 0.36 0.07%2
Series NAV — Hypothetical (5% annualized return before expenses) 1,000.00 1,024.40 0.35 0.07%2
Emerging Markets Value TrustSeries I — Actual $1,000.00 $1,168.30 $5.97 1.11%Series I — Hypothetical (5% annualized return before expenses) 1,000.00 1,019.30 5.56 1.11%Series II — Actual 1,000.00 1,168.30 7.04 1.31%Series II — Hypothetical (5% annualized return before expenses) 1,000.00 1,018.30 6.56 1.31%Series NAV — Actual 1,000.00 1,168.50 5.70 1.06%Series NAV — Hypothetical (5% annualized return before expenses) 1,000.00 1,019.50 5.31 1.06%Equity Income TrustSeries I — Actual $1,000.00 $1,055.80 $3.98 0.78%Series I — Hypothetical (5% annualized return before expenses) 1,000.00 1,020.90 3.91 0.78%Series II — Actual 1,000.00 1,054.20 4.99 0.98%Series II — Hypothetical (5% annualized return before expenses) 1,000.00 1,019.90 4.91 0.98%Series NAV — Actual 1,000.00 1,055.40 3.72 0.73%Series NAV — Hypothetical (5% annualized return before expenses) 1,000.00 1,021.20 3.66 0.73%Financial Industries TrustSeries I — Actual $1,000.00 $1,056.20 $4.38 0.86%Series I — Hypothetical (5% annualized return before expenses) 1,000.00 1,020.50 4.31 0.86%Series II — Actual 1,000.00 1,055.10 5.40 1.06%Series II — Hypothetical (5% annualized return before expenses) 1,000.00 1,019.50 5.31 1.06%Series NAV — Actual 1,000.00 1,056.40 4.13 0.81%Series NAV — Hypothetical (5% annualized return before expenses) 1,000.00 1,020.80 4.06 0.81%Fundamental All Cap Core TrustSeries I — Actual $1,000.00 $1,116.90 $3.94 0.75%Series I — Hypothetical (5% annualized return before expenses) 1,000.00 1,021.10 3.76 0.75%Series II — Actual 1,000.00 1,115.60 4.98 0.95%Series II — Hypothetical (5% annualized return before expenses) 1,000.00 1,020.10 4.76 0.95%Series NAV — Actual 1,000.00 1,116.80 3.67 0.70%Series NAV — Hypothetical (5% annualized return before expenses) 1,000.00 1,021.30 3.51 0.70%Fundamental Large Cap Value TrustSeries I — Actual $1,000.00 $1,071.40 $3.80 0.74%Series I — Hypothetical (5% annualized return before expenses) 1,000.00 1,021.10 3.71 0.74%Series II — Actual 1,000.00 1,070.40 4.83 0.94%Series II — Hypothetical (5% annualized return before expenses) 1,000.00 1,020.10 4.71 0.94%Series NAV — Actual 1,000.00 1,071.90 3.54 0.69%Series NAV — Hypothetical (5% annualized return before expenses) 1,000.00 1,021.40 3.46 0.69%Global TrustSeries I — Actual $1,000.00 $1,112.90 $4.98 0.95%Series I — Hypothetical (5% annualized return before expenses) 1,000.00 1,020.10 4.76 0.95%Series II — Actual 1,000.00 1,111.80 6.02 1.15%Series II — Hypothetical (5% annualized return before expenses) 1,000.00 1,019.10 5.76 1.15%Series NAV — Actual 1,000.00 1,113.00 4.72 0.90%Series NAV — Hypothetical (5% annualized return before expenses) 1,000.00 1,020.30 4.51 0.90%Health Sciences TrustSeries I — Actual $1,000.00 $1,193.80 $5.98 1.10%Series I — Hypothetical (5% annualized return before expenses) 1,000.00 1,019.30 5.51 1.10%Series II — Actual 1,000.00 1,192.90 7.07 1.30%Series II — Hypothetical (5% annualized return before expenses) 1,000.00 1,018.30 6.51 1.30%Series NAV — Actual 1,000.00 1,194.30 5.71 1.05%Series NAV — Hypothetical (5% annualized return before expenses) 1,000.00 1,019.60 5.26 1.05%
John Hancock Variable Insurance TrustShareholder expense example
9
BeginningAccount Value
1/1/2017
EndingAccount Value
6/30/2017
Expenses PaidDuring Period1
1/1/2017–6/30/2017
AnnualizedExpense
RatioInternational Equity Index Trust BSeries I — Actual $1,000.00 $1,149.40 $2.08 0.39%Series I — Hypothetical (5% annualized return before expenses) 1,000.00 1,022.90 1.96 0.39%Series II — Actual 1,000.00 1,147.90 3.14 0.59%Series II — Hypothetical (5% annualized return before expenses) 1,000.00 1,021.90 2.96 0.59%Series NAV — Actual 1,000.00 1,149.50 1.81 0.34%Series NAV — Hypothetical (5% annualized return before expenses) 1,000.00 1,023.10 1.71 0.34%International Growth Stock TrustSeries I — Actual $1,000.00 $1,139.30 $4.83 0.91%Series I — Hypothetical (5% annualized return before expenses) 1,000.00 1,020.30 4.56 0.91%Series II — Actual 1,000.00 1,138.00 5.83 1.10%Series II — Hypothetical (5% annualized return before expenses) 1,000.00 1,019.30 5.51 1.10%Series NAV — Actual 1,000.00 1,139.20 4.51 0.85%Series NAV — Hypothetical (5% annualized return before expenses) 1,000.00 1,020.60 4.26 0.85%International Small Company TrustSeries I — Actual $1,000.00 $1,161.30 $6.27 1.17%Series I — Hypothetical (5% annualized return before expenses) 1,000.00 1,019.00 5.86 1.17%Series II — Actual 1,000.00 1,159.00 7.33 1.37%Series II — Hypothetical (5% annualized return before expenses) 1,000.00 1,018.00 6.85 1.37%Series NAV — Actual 1,000.00 1,162.10 6.00 1.12%Series NAV — Hypothetical (5% annualized return before expenses) 1,000.00 1,019.20 5.61 1.12%International Value TrustSeries I — Actual $1,000.00 $1,108.40 $4.70 0.90%Series I — Hypothetical (5% annualized return before expenses) 1,000.00 1,020.30 4.51 0.90%Series II — Actual 1,000.00 1,107.70 5.75 1.10%Series II — Hypothetical (5% annualized return before expenses) 1,000.00 1,019.30 5.51 1.10%Series NAV — Actual 1,000.00 1,109.30 4.45 0.85%Series NAV — Hypothetical (5% annualized return before expenses) 1,000.00 1,020.60 4.26 0.85%Lifestyle Aggressive PS SeriesSeries I — Actual $1,000.00 $1,101.50 $1.09 0.21%2
Series I — Hypothetical (5% annualized return before expenses) 1,000.00 1,023.80 1.05 0.21%2
Series II — Actual 1,000.00 1,099.90 2.13 0.41%2
Series II — Hypothetical (5% annualized return before expenses) 1,000.00 1,022.80 2.06 0.41%2
Series NAV — Actual 1,000.00 1,101.50 0.83 0.16%2
Series NAV — Hypothetical (5% annualized return before expenses) 1,000.00 1,024.00 0.80 0.16%2
Lifestyle Balanced PS SeriesSeries I — Actual $1,000.00 $1,063.90 $0.61 0.12%2
Series I — Hypothetical (5% annualized return before expenses) 1,000.00 1,024.20 0.60 0.12%2
Series II — Actual 1,000.00 1,063.00 1.64 0.32%2
Series II — Hypothetical (5% annualized return before expenses) 1,000.00 1,023.20 1.61 0.32%2
Series NAV — Actual 1,000.00 1,063.90 0.36 0.07%2
Series NAV — Hypothetical (5% annualized return before expenses) 1,000.00 1,024.40 0.35 0.07%2
Lifestyle Conservative PS SeriesSeries I — Actual $1,000.00 $1,040.30 $0.66 0.13%2
Series I — Hypothetical (5% annualized return before expenses) 1,000.00 1,024.10 0.65 0.13%2
Series II — Actual 1,000.00 1,039.40 1.67 0.33%2
Series II — Hypothetical (5% annualized return before expenses) 1,000.00 1,023.20 1.66 0.33%2
Series NAV — Actual 1,000.00 1,041.10 0.40 0.08%2
Series NAV — Hypothetical (5% annualized return before expenses) 1,000.00 1,024.40 0.40 0.08%2
Lifestyle Growth PS SeriesSeries I — Actual $1,000.00 $1,079.80 $0.57 0.11%2
Series I — Hypothetical (5% annualized return before expenses) 1,000.00 1,024.20 0.55 0.11%2
Series II — Actual 1,000.00 1,079.00 1.60 0.31%2
Series II — Hypothetical (5% annualized return before expenses) 1,000.00 1,023.30 1.56 0.31%2
Series NAV — Actual 1,000.00 1,080.60 0.31 0.06%2
Series NAV — Hypothetical (5% annualized return before expenses) 1,000.00 1,024.50 0.30 0.06%2
John Hancock Variable Insurance TrustShareholder expense example
10
BeginningAccount Value
1/1/2017
EndingAccount Value
6/30/2017
Expenses PaidDuring Period1
1/1/2017–6/30/2017
AnnualizedExpense
RatioLifestyle Moderate PS SeriesSeries I — Actual $1,000.00 $1,055.60 $0.66 0.13%2
Series I — Hypothetical (5% annualized return before expenses) 1,000.00 1,024.10 0.65 0.13%2
Series II — Actual 1,000.00 1,054.70 1.68 0.33%2
Series II — Hypothetical (5% annualized return before expenses) 1,000.00 1,023.20 1.66 0.33%2
Series NAV — Actual 1,000.00 1,056.30 0.41 0.08%2
Series NAV — Hypothetical (5% annualized return before expenses) 1,000.00 1,024.40 0.40 0.08%2
Mid Cap Index TrustSeries I — Actual $1,000.00 $1,058.20 $2.30 0.45%Series I — Hypothetical (5% annualized return before expenses) 1,000.00 1,022.60 2.26 0.45%Series II — Actual 1,000.00 1,056.50 3.31 0.65%Series II — Hypothetical (5% annualized return before expenses) 1,000.00 1,021.60 3.26 0.65%Series NAV — Actual 1,000.00 1,058.20 2.04 0.40%Series NAV — Hypothetical (5% annualized return before expenses) 1,000.00 1,022.80 2.01 0.40%Mid Cap Stock TrustSeries I — Actual $1,000.00 $1,176.60 $4.97 0.92%Series I — Hypothetical (5% annualized return before expenses) 1,000.00 1,020.20 4.61 0.92%Series II — Actual 1,000.00 1,175.50 6.04 1.12%Series II — Hypothetical (5% annualized return before expenses) 1,000.00 1,019.20 5.61 1.12%Series NAV — Actual 1,000.00 1,177.50 4.70 0.87%Series NAV — Hypothetical (5% annualized return before expenses) 1,000.00 1,020.50 4.36 0.87%Mid Value TrustSeries I — Actual $1,000.00 $1,030.10 $4.98 0.99%Series I — Hypothetical (5% annualized return before expenses) 1,000.00 1,019.90 4.96 0.99%Series II — Actual 1,000.00 1,029.20 5.99 1.19%Series II — Hypothetical (5% annualized return before expenses) 1,000.00 1,018.90 5.96 1.19%Series NAV — Actual 1,000.00 1,030.30 4.73 0.94%Series NAV — Hypothetical (5% annualized return before expenses) 1,000.00 1,020.10 4.71 0.94%Mutual Shares TrustSeries I — Actual $1,000.00 $1,057.90 $5.56 1.09%Series I — Hypothetical (5% annualized return before expenses) 1,000.00 1,019.40 5.46 1.09%Real Estate Securities TrustSeries I — Actual $1,000.00 $1,031.60 $3.98 0.79%Series I — Hypothetical (5% annualized return before expenses) 1,000.00 1,020.90 3.96 0.79%Series II — Actual 1,000.00 1,030.50 4.98 0.99%Series II — Hypothetical (5% annualized return before expenses) 1,000.00 1,019.90 4.96 0.99%Series NAV — Actual 1,000.00 1,031.30 3.73 0.74%Series NAV — Hypothetical (5% annualized return before expenses) 1,000.00 1,021.10 3.71 0.74%Science & Technology TrustSeries I — Actual $1,000.00 $1,214.40 $5.93 1.08%Series I — Hypothetical (5% annualized return before expenses) 1,000.00 1,019.40 5.41 1.08%Series II — Actual 1,000.00 1,213.10 7.02 1.28%Series II — Hypothetical (5% annualized return before expenses) 1,000.00 1,018.40 6.41 1.28%Series NAV — Actual 1,000.00 1,214.70 5.66 1.03%Series NAV — Hypothetical (5% annualized return before expenses) 1,000.00 1,019.70 5.16 1.03%Small Cap Growth TrustSeries I — Actual $1,000.00 $1,133.60 $6.03 1.14%Series I — Hypothetical (5% annualized return before expenses) 1,000.00 1,019.10 5.71 1.14%Series II — Actual 1,000.00 1,132.00 7.08 1.34%Series II — Hypothetical (5% annualized return before expenses) 1,000.00 1,018.10 6.71 1.34%Series NAV — Actual 1,000.00 1,134.70 5.77 1.09%Series NAV — Hypothetical (5% annualized return before expenses) 1,000.00 1,019.40 5.46 1.09%Small Cap Index TrustSeries I — Actual $1,000.00 $1,048.80 $2.64 0.52%Series I — Hypothetical (5% annualized return before expenses) 1,000.00 1,022.20 2.61 0.52%Series II — Actual 1,000.00 1,048.40 3.66 0.72%Series II — Hypothetical (5% annualized return before expenses) 1,000.00 1,021.20 3.61 0.72%Series NAV — Actual 1,000.00 1,049.50 2.39 0.47%Series NAV — Hypothetical (5% annualized return before expenses) 1,000.00 1,022.50 2.36 0.47%
John Hancock Variable Insurance TrustShareholder expense example
11
BeginningAccount Value
1/1/2017
EndingAccount Value
6/30/2017
Expenses PaidDuring Period1
1/1/2017–6/30/2017
AnnualizedExpense
RatioSmall Cap Opportunities TrustSeries I — Actual $1,000.00 $1,022.90 $5.12 1.02%Series I — Hypothetical (5% annualized return before expenses) 1,000.00 1,019.70 5.11 1.02%Series II — Actual 1,000.00 1,021.90 6.12 1.22%Series II — Hypothetical (5% annualized return before expenses) 1,000.00 1,018.70 6.11 1.22%Series NAV — Actual 1,000.00 1,023.60 4.87 0.97%Series NAV — Hypothetical (5% annualized return before expenses) 1,000.00 1,020.00 4.86 0.97%Small Cap Value TrustSeries I — Actual $1,000.00 $974.00 $5.43 1.11%Series I — Hypothetical (5% annualized return before expenses) 1,000.00 1,019.30 5.56 1.11%Series II — Actual 1,000.00 973.40 6.41 1.31%Series II — Hypothetical (5% annualized return before expenses) 1,000.00 1,018.30 6.56 1.31%Series NAV — Actual 1,000.00 974.80 5.24 1.07%Series NAV — Hypothetical (5% annualized return before expenses) 1,000.00 1,019.50 5.36 1.07%Small Company Growth TrustSeries NAV — Actual $1,000.00 $1,105.20 $5.59 1.07%Series NAV — Hypothetical (5% annualized return before expenses) 1,000.00 1,019.50 5.36 1.07%Small Company Value TrustSeries I — Actual $1,000.00 $1,014.50 $5.44 1.09%Series I — Hypothetical (5% annualized return before expenses) 1,000.00 1,019.40 5.46 1.09%Series II — Actual 1,000.00 1,013.80 6.44 1.29%Series II — Hypothetical (5% annualized return before expenses) 1,000.00 1,018.40 6.46 1.29%Series NAV — Actual 1,000.00 1,015.00 5.20 1.04%Series NAV — Hypothetical (5% annualized return before expenses) 1,000.00 1,019.60 5.21 1.04%Strategic Equity Allocation TrustSeries NAV — Actual $1,000.00 $1,103.80 $2.76 0.53%Series NAV — Hypothetical (5% annualized return before expenses) 1,000.00 1,022.20 2.66 0.53%Total Stock Market Index TrustSeries I — Actual $1,000.00 $1,086.40 $2.95 0.57%Series I — Hypothetical (5% annualized return before expenses) 1,000.00 1,022.00 2.86 0.57%Series II — Actual 1,000.00 1,085.60 3.98 0.77%Series II — Hypothetical (5% annualized return before expenses) 1,000.00 1,021.00 3.86 0.77%Series NAV — Actual 1,000.00 1,087.00 2.69 0.52%Series NAV — Hypothetical (5% annualized return before expenses) 1,000.00 1,022.20 2.61 0.52%Utilities TrustSeries I — Actual $1,000.00 $1,100.00 $4.84 0.93%Series I — Hypothetical (5% annualized return before expenses) 1,000.00 1,020.20 4.66 0.93%Series II — Actual 1,000.00 1,098.60 5.88 1.13%Series II — Hypothetical (5% annualized return before expenses) 1,000.00 1,019.20 5.66 1.13%Series NAV — Actual 1,000.00 1,100.20 4.58 0.88%Series NAV — Hypothetical (5% annualized return before expenses) 1,000.00 1,020.40 4.41 0.88%Value TrustSeries I — Actual $1,000.00 $1,019.40 $4.06 0.81%Series I — Hypothetical (5% annualized return before expenses) 1,000.00 1,020.80 4.06 0.81%Series II — Actual 1,000.00 1,018.00 5.05 1.01%Series II — Hypothetical (5% annualized return before expenses) 1,000.00 1,019.80 5.06 1.01%Series NAV — Actual 1,000.00 1,019.90 3.81 0.76%Series NAV — Hypothetical (5% annualized return before expenses) 1,000.00 1,021.00 3.81 0.76%
1 Expenses are equal to the annualized expense ratio, multiplied by the average account value over the period, multiplied by the number of days in
the period (181), and divided by 365 (to reflect the one-half year period).2 Ratios do not include expenses indirectly incurred from underlying funds and can vary. The range of expense ratios of the underlying funds held
by the portfolios for the period ended 6-30-17 was as follows:
Portfolio Range Portfolio RangeAmerican Funds 0.29% – 0.78% Lifestyle Conservative PS Series 0.53% – 0.59%Core Strategy Trust 0.53% – 0.59% Lifestyle Growth PS Series 0.53% – 0.59%Lifestyle Aggressive PS Series 0.10% – 0.53% Lifestyle Moderate PS Series 0.53% – 0.59%Lifestyle Balanced PS Series 0.53% – 0.59%
John Hancock Variable Insurance TrustShareholder expense example
12
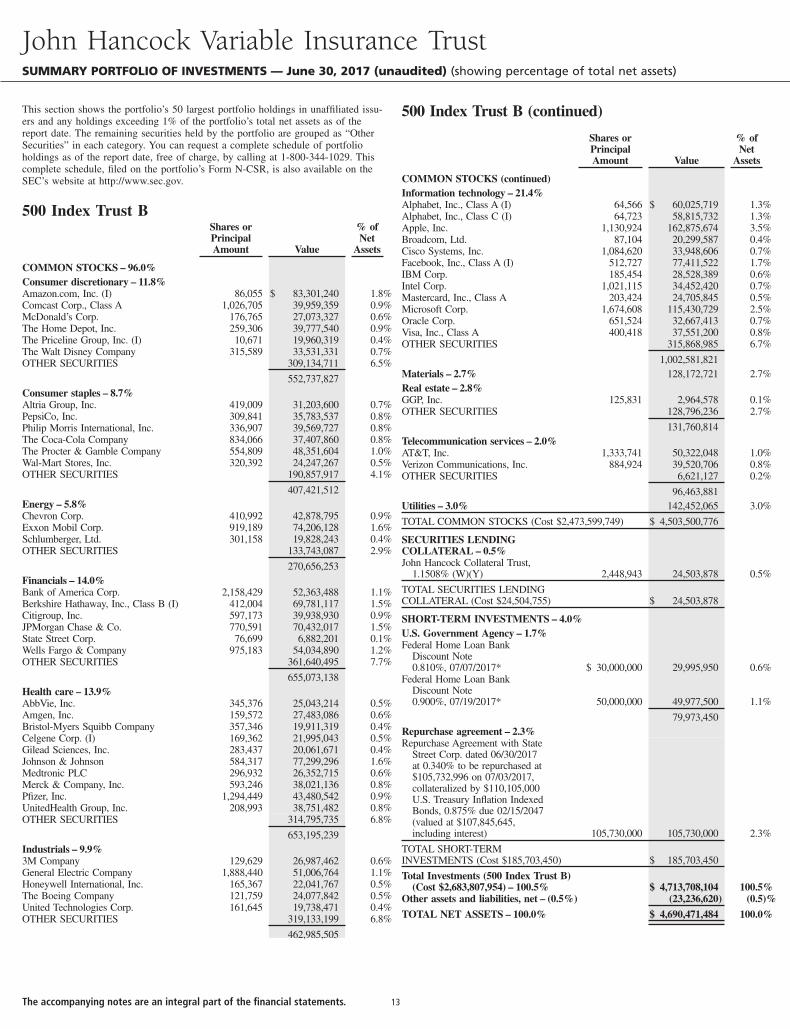
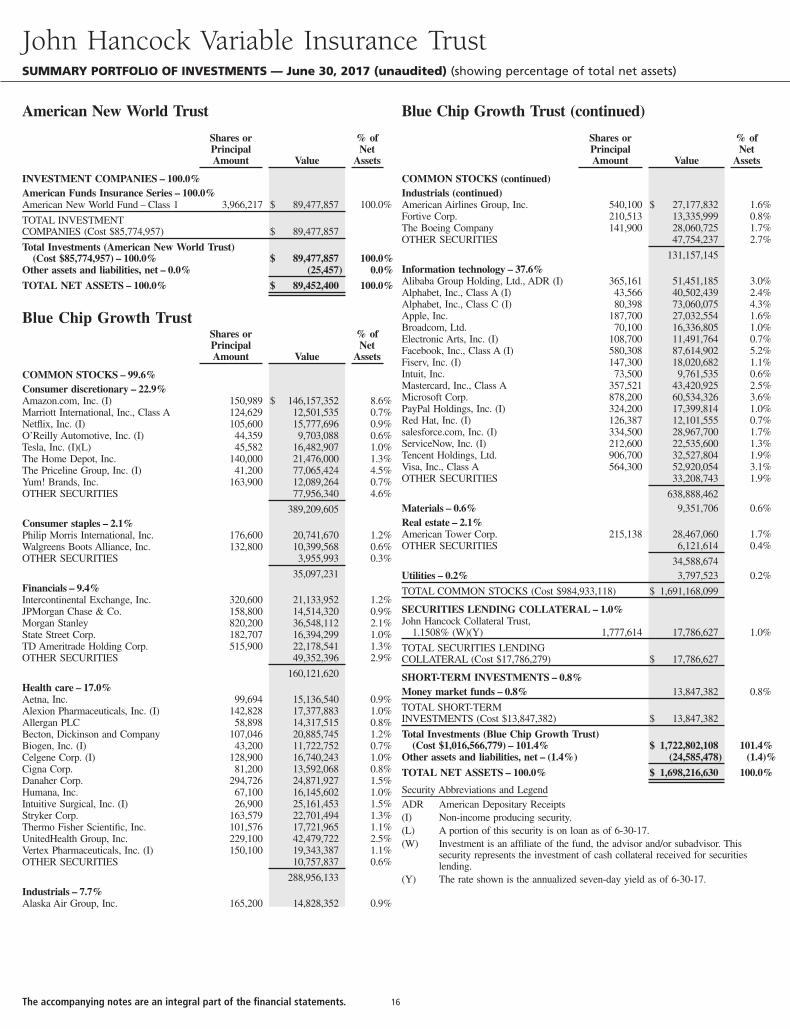
This section shows the portfolio’s 50 largest portfolio holdings in unaffiliated issu-ers and any holdings exceeding 1% of the portfolio’s total net assets as of thereport date. The remaining securities held by the portfolio are grouped as “OtherSecurities” in each category. You can request a complete schedule of portfolioholdings as of the report date, free of charge, by calling at 1-800-344-1029. Thiscomplete schedule, filed on the portfolio’s Form N-CSR, is also available on theSEC’s website at http://www.sec.gov.
500 Index Trust BShares orPrincipalAmount Value
% ofNet
Assets
COMMON STOCKS – 96.0%Consumer discretionary – 11.8%Amazon.com, Inc. (I) 86,055 $ 83,301,240 1.8%Comcast Corp., Class A 1,026,705 39,959,359 0.9%McDonald’s Corp. 176,765 27,073,327 0.6%The Home Depot, Inc. 259,306 39,777,540 0.9%The Priceline Group, Inc. (I) 10,671 19,960,319 0.4%The Walt Disney Company 315,589 33,531,331 0.7%OTHER SECURITIES 309,134,711 6.5%
552,737,827Consumer staples – 8.7%Altria Group, Inc. 419,009 31,203,600 0.7%PepsiCo, Inc. 309,841 35,783,537 0.8%Philip Morris International, Inc. 336,907 39,569,727 0.8%The Coca-Cola Company 834,066 37,407,860 0.8%The Procter & Gamble Company 554,809 48,351,604 1.0%Wal-Mart Stores, Inc. 320,392 24,247,267 0.5%OTHER SECURITIES 190,857,917 4.1%
407,421,512Energy – 5.8%Chevron Corp. 410,992 42,878,795 0.9%Exxon Mobil Corp. 919,189 74,206,128 1.6%Schlumberger, Ltd. 301,158 19,828,243 0.4%OTHER SECURITIES 133,743,087 2.9%
270,656,253Financials – 14.0%Bank of America Corp. 2,158,429 52,363,488 1.1%Berkshire Hathaway, Inc., Class B (I) 412,004 69,781,117 1.5%Citigroup, Inc. 597,173 39,938,930 0.9%JPMorgan Chase & Co. 770,591 70,432,017 1.5%State Street Corp. 76,699 6,882,201 0.1%Wells Fargo & Company 975,183 54,034,890 1.2%OTHER SECURITIES 361,640,495 7.7%
655,073,138Health care – 13.9%AbbVie, Inc. 345,376 25,043,214 0.5%Amgen, Inc. 159,572 27,483,086 0.6%Bristol-Myers Squibb Company 357,346 19,911,319 0.4%Celgene Corp. (I) 169,362 21,995,043 0.5%Gilead Sciences, Inc. 283,437 20,061,671 0.4%Johnson & Johnson 584,317 77,299,296 1.6%Medtronic PLC 296,932 26,352,715 0.6%Merck & Company, Inc. 593,246 38,021,136 0.8%Pfizer, Inc. 1,294,449 43,480,542 0.9%UnitedHealth Group, Inc. 208,993 38,751,482 0.8%OTHER SECURITIES 314,795,735 6.8%
653,195,239Industrials – 9.9%3M Company 129,629 26,987,462 0.6%General Electric Company 1,888,440 51,006,764 1.1%Honeywell International, Inc. 165,367 22,041,767 0.5%The Boeing Company 121,759 24,077,842 0.5%United Technologies Corp. 161,645 19,738,471 0.4%OTHER SECURITIES 319,133,199 6.8%
462,985,505
Shares orPrincipalAmount Value
% ofNet
Assets
COMMON STOCKS (continued)Information technology – 21.4%Alphabet, Inc., Class A (I) 64,566 $ 60,025,719 1.3%Alphabet, Inc., Class C (I) 64,723 58,815,732 1.3%Apple, Inc. 1,130,924 162,875,674 3.5%Broadcom, Ltd. 87,104 20,299,587 0.4%Cisco Systems, Inc. 1,084,620 33,948,606 0.7%Facebook, Inc., Class A (I) 512,727 77,411,522 1.7%IBM Corp. 185,454 28,528,389 0.6%Intel Corp. 1,021,115 34,452,420 0.7%Mastercard, Inc., Class A 203,424 24,705,845 0.5%Microsoft Corp. 1,674,608 115,430,729 2.5%Oracle Corp. 651,524 32,667,413 0.7%Visa, Inc., Class A 400,418 37,551,200 0.8%OTHER SECURITIES 315,868,985 6.7%
1,002,581,821Materials – 2.7% 128,172,721 2.7%Real estate – 2.8%GGP, Inc. 125,831 2,964,578 0.1%OTHER SECURITIES 128,796,236 2.7%
131,760,814Telecommunication services – 2.0%AT&T, Inc. 1,333,741 50,322,048 1.0%Verizon Communications, Inc. 884,924 39,520,706 0.8%OTHER SECURITIES 6,621,127 0.2%
96,463,881Utilities – 3.0% 142,452,065 3.0%
TOTAL COMMON STOCKS (Cost $2,473,599,749) $ 4,503,500,776
SECURITIES LENDINGCOLLATERAL – 0.5%John Hancock Collateral Trust,
1.1508% (W)(Y) 2,448,943 24,503,878 0.5%
TOTAL SECURITIES LENDINGCOLLATERAL (Cost $24,504,755) $ 24,503,878
SHORT-TERM INVESTMENTS – 4.0%U.S. Government Agency – 1.7%Federal Home Loan Bank
Discount Note0.810%, 07/07/2017* $ 30,000,000 29,995,950 0.6%
Federal Home Loan BankDiscount Note0.900%, 07/19/2017* 50,000,000 49,977,500 1.1%
79,973,450Repurchase agreement – 2.3%Repurchase Agreement with State
Street Corp. dated 06/30/2017at 0.340% to be repurchased at$105,732,996 on 07/03/2017,collateralized by $110,105,000U.S. Treasury Inflation IndexedBonds, 0.875% due 02/15/2047(valued at $107,845,645,including interest) 105,730,000 105,730,000 2.3%
TOTAL SHORT-TERMINVESTMENTS (Cost $185,703,450) $ 185,703,450
Total Investments (500 Index Trust B)(Cost $2,683,807,954) – 100.5% $ 4,713,708,104 100.5%
Other assets and liabilities, net – (0.5%) (23,236,620) (0.5)%
TOTAL NET ASSETS – 100.0% $ 4,690,471,484 100.0%
John Hancock Variable Insurance TrustSUMMARY PORTFOLIO OF INVESTMENTS — June 30, 2017 (unaudited) (showing percentage of total net assets)
500 Index Trust B (continued)
The accompanying notes are an integral part of the financial statements. 13
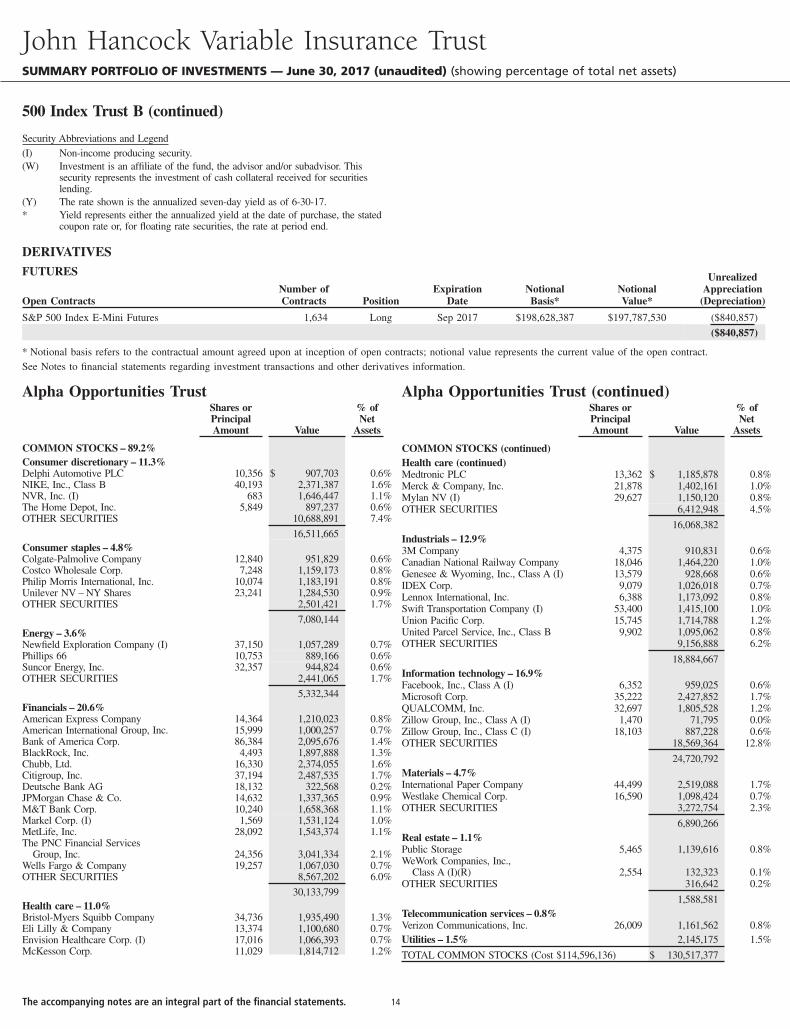
Security Abbreviations and Legend(I) Non-income producing security.(W) Investment is an affiliate of the fund, the advisor and/or subadvisor. This
security represents the investment of cash collateral received for securitieslending.
(Y) The rate shown is the annualized seven-day yield as of 6-30-17.* Yield represents either the annualized yield at the date of purchase, the stated
coupon rate or, for floating rate securities, the rate at period end.
DERIVATIVESFUTURES
Open ContractsNumber ofContracts Position
ExpirationDate
NotionalBasis*
NotionalValue*
UnrealizedAppreciation
(Depreciation)
S&P 500 Index E-Mini Futures 1,634 Long Sep 2017 $198,628,387 $197,787,530 ($840,857)
($840,857)
* Notional basis refers to the contractual amount agreed upon at inception of open contracts; notional value represents the current value of the open contract.See Notes to financial statements regarding investment transactions and other derivatives information.
Alpha Opportunities TrustShares orPrincipalAmount Value
% ofNet
Assets
COMMON STOCKS – 89.2%Consumer discretionary – 11.3%Delphi Automotive PLC 10,356 $ 907,703 0.6%NIKE, Inc., Class B 40,193 2,371,387 1.6%NVR, Inc. (I) 683 1,646,447 1.1%The Home Depot, Inc. 5,849 897,237 0.6%OTHER SECURITIES 10,688,891 7.4%
16,511,665Consumer staples – 4.8%Colgate-Palmolive Company 12,840 951,829 0.6%Costco Wholesale Corp. 7,248 1,159,173 0.8%Philip Morris International, Inc. 10,074 1,183,191 0.8%Unilever NV – NY Shares 23,241 1,284,530 0.9%OTHER SECURITIES 2,501,421 1.7%
7,080,144Energy – 3.6%Newfield Exploration Company (I) 37,150 1,057,289 0.7%Phillips 66 10,753 889,166 0.6%Suncor Energy, Inc. 32,357 944,824 0.6%OTHER SECURITIES 2,441,065 1.7%
5,332,344Financials – 20.6%American Express Company 14,364 1,210,023 0.8%American International Group, Inc. 15,999 1,000,257 0.7%Bank of America Corp. 86,384 2,095,676 1.4%BlackRock, Inc. 4,493 1,897,888 1.3%Chubb, Ltd. 16,330 2,374,055 1.6%Citigroup, Inc. 37,194 2,487,535 1.7%Deutsche Bank AG 18,132 322,568 0.2%JPMorgan Chase & Co. 14,632 1,337,365 0.9%M&T Bank Corp. 10,240 1,658,368 1.1%Markel Corp. (I) 1,569 1,531,124 1.0%MetLife, Inc. 28,092 1,543,374 1.1%The PNC Financial Services
Group, Inc. 24,356 3,041,334 2.1%Wells Fargo & Company 19,257 1,067,030 0.7%OTHER SECURITIES 8,567,202 6.0%
30,133,799Health care – 11.0%Bristol-Myers Squibb Company 34,736 1,935,490 1.3%Eli Lilly & Company 13,374 1,100,680 0.7%Envision Healthcare Corp. (I) 17,016 1,066,393 0.7%McKesson Corp. 11,029 1,814,712 1.2%
Alpha Opportunities Trust (continued)Shares orPrincipalAmount Value
% ofNet
Assets
COMMON STOCKS (continued)Health care (continued)Medtronic PLC 13,362 $ 1,185,878 0.8%Merck & Company, Inc. 21,878 1,402,161 1.0%Mylan NV (I) 29,627 1,150,120 0.8%OTHER SECURITIES 6,412,948 4.5%
16,068,382Industrials – 12.9%3M Company 4,375 910,831 0.6%Canadian National Railway Company 18,046 1,464,220 1.0%Genesee & Wyoming, Inc., Class A (I) 13,579 928,668 0.6%IDEX Corp. 9,079 1,026,018 0.7%Lennox International, Inc. 6,388 1,173,092 0.8%Swift Transportation Company (I) 53,400 1,415,100 1.0%Union Pacific Corp. 15,745 1,714,788 1.2%United Parcel Service, Inc., Class B 9,902 1,095,062 0.8%OTHER SECURITIES 9,156,888 6.2%
18,884,667Information technology – 16.9%Facebook, Inc., Class A (I) 6,352 959,025 0.6%Microsoft Corp. 35,222 2,427,852 1.7%QUALCOMM, Inc. 32,697 1,805,528 1.2%Zillow Group, Inc., Class A (I) 1,470 71,795 0.0%Zillow Group, Inc., Class C (I) 18,103 887,228 0.6%OTHER SECURITIES 18,569,364 12.8%
24,720,792Materials – 4.7%International Paper Company 44,499 2,519,088 1.7%Westlake Chemical Corp. 16,590 1,098,424 0.7%OTHER SECURITIES 3,272,754 2.3%
6,890,266Real estate – 1.1%Public Storage 5,465 1,139,616 0.8%WeWork Companies, Inc.,
Class A (I)(R) 2,554 132,323 0.1%OTHER SECURITIES 316,642 0.2%
1,588,581Telecommunication services – 0.8%Verizon Communications, Inc. 26,009 1,161,562 0.8%Utilities – 1.5% 2,145,175 1.5%
TOTAL COMMON STOCKS (Cost $114,596,136) $ 130,517,377
John Hancock Variable Insurance TrustSUMMARY PORTFOLIO OF INVESTMENTS — June 30, 2017 (unaudited) (showing percentage of total net assets)
500 Index Trust B (continued)
The accompanying notes are an integral part of the financial statements. 14
Shares orPrincipalAmount Value
% ofNet
Assets
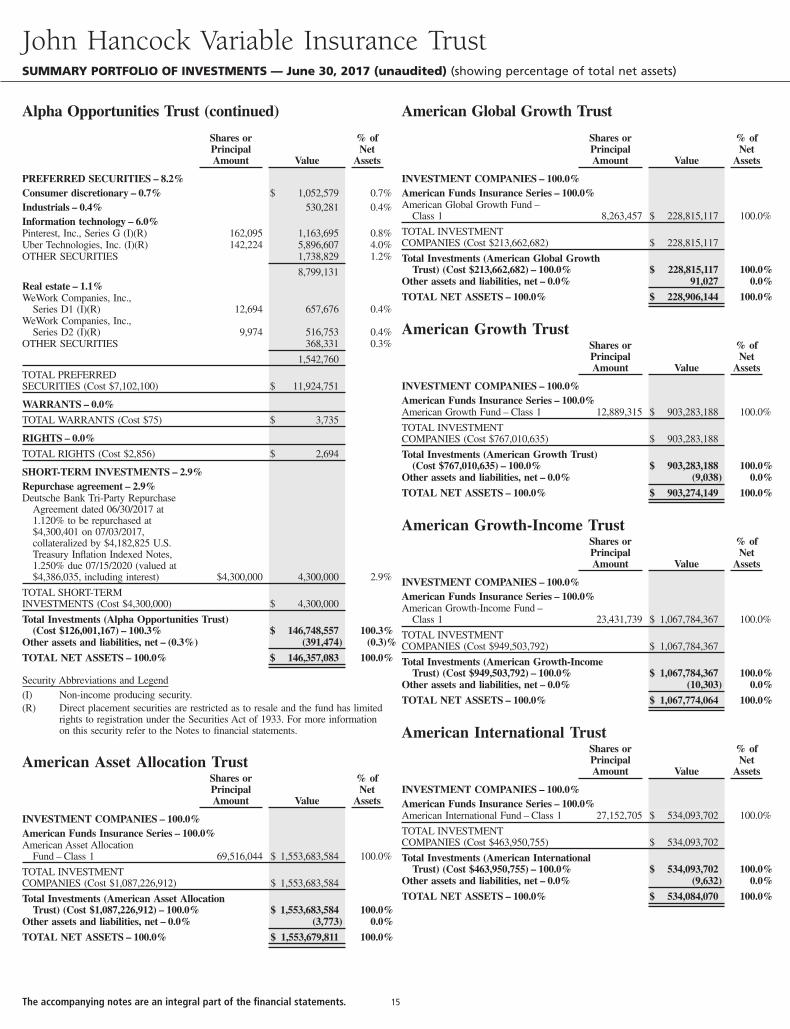
PREFERRED SECURITIES – 8.2%Consumer discretionary – 0.7% $ 1,052,579 0.7%Industrials – 0.4% 530,281 0.4%Information technology – 6.0%Pinterest, Inc., Series G (I)(R) 162,095 1,163,695 0.8%Uber Technologies, Inc. (I)(R) 142,224 5,896,607 4.0%OTHER SECURITIES 1,738,829 1.2%
8,799,131Real estate – 1.1%WeWork Companies, Inc.,
Series D1 (I)(R) 12,694 657,676 0.4%WeWork Companies, Inc.,
Series D2 (I)(R) 9,974 516,753 0.4%OTHER SECURITIES 368,331 0.3%
1,542,760
TOTAL PREFERREDSECURITIES (Cost $7,102,100) $ 11,924,751
WARRANTS – 0.0%
TOTAL WARRANTS (Cost $75) $ 3,735
RIGHTS – 0.0%
TOTAL RIGHTS (Cost $2,856) $ 2,694
SHORT-TERM INVESTMENTS – 2.9%Repurchase agreement – 2.9%Deutsche Bank Tri-Party Repurchase
Agreement dated 06/30/2017 at1.120% to be repurchased at$4,300,401 on 07/03/2017,collateralized by $4,182,825 U.S.Treasury Inflation Indexed Notes,1.250% due 07/15/2020 (valued at$4,386,035, including interest) $4,300,000 4,300,000 2.9%
TOTAL SHORT-TERMINVESTMENTS (Cost $4,300,000) $ 4,300,000
Total Investments (Alpha Opportunities Trust)(Cost $126,001,167) – 100.3% $ 146,748,557 100.3%
Other assets and liabilities, net – (0.3%) (391,474) (0.3)%
TOTAL NET ASSETS – 100.0% $ 146,357,083 100.0%
Security Abbreviations and Legend(I) Non-income producing security.(R) Direct placement securities are restricted as to resale and the fund has limited
rights to registration under the Securities Act of 1933. For more informationon this security refer to the Notes to financial statements.
American Asset Allocation TrustShares orPrincipalAmount Value
% ofNet
Assets
INVESTMENT COMPANIES – 100.0%American Funds Insurance Series – 100.0%American Asset Allocation
Fund – Class 1 69,516,044 $ 1,553,683,584 100.0%
TOTAL INVESTMENTCOMPANIES (Cost $1,087,226,912) $ 1,553,683,584
Total Investments (American Asset AllocationTrust) (Cost $1,087,226,912) – 100.0% $ 1,553,683,584 100.0%
Other assets and liabilities, net – 0.0% (3,773) 0.0%
TOTAL NET ASSETS – 100.0% $ 1,553,679,811 100.0%
Shares orPrincipalAmount Value
% ofNet
Assets
INVESTMENT COMPANIES – 100.0%American Funds Insurance Series – 100.0%American Global Growth Fund –
Class 1 8,263,457 $ 228,815,117 100.0%
TOTAL INVESTMENTCOMPANIES (Cost $213,662,682) $ 228,815,117
Total Investments (American Global GrowthTrust) (Cost $213,662,682) – 100.0% $ 228,815,117 100.0%
Other assets and liabilities, net – 0.0% 91,027 0.0%
TOTAL NET ASSETS – 100.0% $ 228,906,144 100.0%
American Growth TrustShares orPrincipalAmount Value
% ofNet
Assets
INVESTMENT COMPANIES – 100.0%American Funds Insurance Series – 100.0%American Growth Fund – Class 1 12,889,315 $ 903,283,188 100.0%
TOTAL INVESTMENTCOMPANIES (Cost $767,010,635) $ 903,283,188
Total Investments (American Growth Trust)(Cost $767,010,635) – 100.0% $ 903,283,188 100.0%
Other assets and liabilities, net – 0.0% (9,038) 0.0%
TOTAL NET ASSETS – 100.0% $ 903,274,149 100.0%
American Growth-Income TrustShares orPrincipalAmount Value
% ofNet
Assets
INVESTMENT COMPANIES – 100.0%American Funds Insurance Series – 100.0%American Growth-Income Fund –
Class 1 23,431,739 $ 1,067,784,367 100.0%
TOTAL INVESTMENTCOMPANIES (Cost $949,503,792) $ 1,067,784,367
Total Investments (American Growth-IncomeTrust) (Cost $949,503,792) – 100.0% $ 1,067,784,367 100.0%
Other assets and liabilities, net – 0.0% (10,303) 0.0%
TOTAL NET ASSETS – 100.0% $ 1,067,774,064 100.0%
American International TrustShares orPrincipalAmount Value
% ofNet
Assets
INVESTMENT COMPANIES – 100.0%American Funds Insurance Series – 100.0%American International Fund – Class 1 27,152,705 $ 534,093,702 100.0%
TOTAL INVESTMENTCOMPANIES (Cost $463,950,755) $ 534,093,702
Total Investments (American InternationalTrust) (Cost $463,950,755) – 100.0% $ 534,093,702 100.0%
Other assets and liabilities, net – 0.0% (9,632) 0.0%
TOTAL NET ASSETS – 100.0% $ 534,084,070 100.0%
John Hancock Variable Insurance TrustSUMMARY PORTFOLIO OF INVESTMENTS — June 30, 2017 (unaudited) (showing percentage of total net assets)
Alpha Opportunities Trust (continued) American Global Growth Trust
The accompanying notes are an integral part of the financial statements. 15
Shares orPrincipalAmount Value
% ofNet
Assets
INVESTMENT COMPANIES – 100.0%American Funds Insurance Series – 100.0%American New World Fund – Class 1 3,966,217 $ 89,477,857 100.0%
TOTAL INVESTMENTCOMPANIES (Cost $85,774,957) $ 89,477,857
Total Investments (American New World Trust)(Cost $85,774,957) – 100.0% $ 89,477,857 100.0%
Other assets and liabilities, net – 0.0% (25,457) 0.0%
TOTAL NET ASSETS – 100.0% $ 89,452,400 100.0%
Blue Chip Growth TrustShares orPrincipalAmount Value
% ofNet
Assets
COMMON STOCKS – 99.6%Consumer discretionary – 22.9%Amazon.com, Inc. (I) 150,989 $ 146,157,352 8.6%Marriott International, Inc., Class A 124,629 12,501,535 0.7%Netflix, Inc. (I) 105,600 15,777,696 0.9%O’Reilly Automotive, Inc. (I) 44,359 9,703,088 0.6%Tesla, Inc. (I)(L) 45,582 16,482,907 1.0%The Home Depot, Inc. 140,000 21,476,000 1.3%The Priceline Group, Inc. (I) 41,200 77,065,424 4.5%Yum! Brands, Inc. 163,900 12,089,264 0.7%OTHER SECURITIES 77,956,340 4.6%
389,209,605Consumer staples – 2.1%Philip Morris International, Inc. 176,600 20,741,670 1.2%Walgreens Boots Alliance, Inc. 132,800 10,399,568 0.6%OTHER SECURITIES 3,955,993 0.3%
35,097,231Financials – 9.4%Intercontinental Exchange, Inc. 320,600 21,133,952 1.2%JPMorgan Chase & Co. 158,800 14,514,320 0.9%Morgan Stanley 820,200 36,548,112 2.1%State Street Corp. 182,707 16,394,299 1.0%TD Ameritrade Holding Corp. 515,900 22,178,541 1.3%OTHER SECURITIES 49,352,396 2.9%
160,121,620Health care – 17.0%Aetna, Inc. 99,694 15,136,540 0.9%Alexion Pharmaceuticals, Inc. (I) 142,828 17,377,883 1.0%Allergan PLC 58,898 14,317,515 0.8%Becton, Dickinson and Company 107,046 20,885,745 1.2%Biogen, Inc. (I) 43,200 11,722,752 0.7%Celgene Corp. (I) 128,900 16,740,243 1.0%Cigna Corp. 81,200 13,592,068 0.8%Danaher Corp. 294,726 24,871,927 1.5%Humana, Inc. 67,100 16,145,602 1.0%Intuitive Surgical, Inc. (I) 26,900 25,161,453 1.5%Stryker Corp. 163,579 22,701,494 1.3%Thermo Fisher Scientific, Inc. 101,576 17,721,965 1.1%UnitedHealth Group, Inc. 229,100 42,479,722 2.5%Vertex Pharmaceuticals, Inc. (I) 150,100 19,343,387 1.1%OTHER SECURITIES 10,757,837 0.6%
288,956,133Industrials – 7.7%Alaska Air Group, Inc. 165,200 14,828,352 0.9%
Shares orPrincipalAmount Value
% ofNet
Assets
COMMON STOCKS (continued)Industrials (continued)American Airlines Group, Inc. 540,100 $ 27,177,832 1.6%Fortive Corp. 210,513 13,335,999 0.8%The Boeing Company 141,900 28,060,725 1.7%OTHER SECURITIES 47,754,237 2.7%
131,157,145Information technology – 37.6%Alibaba Group Holding, Ltd., ADR (I) 365,161 51,451,185 3.0%Alphabet, Inc., Class A (I) 43,566 40,502,439 2.4%Alphabet, Inc., Class C (I) 80,398 73,060,075 4.3%Apple, Inc. 187,700 27,032,554 1.6%Broadcom, Ltd. 70,100 16,336,805 1.0%Electronic Arts, Inc. (I) 108,700 11,491,764 0.7%Facebook, Inc., Class A (I) 580,308 87,614,902 5.2%Fiserv, Inc. (I) 147,300 18,020,682 1.1%Intuit, Inc. 73,500 9,761,535 0.6%Mastercard, Inc., Class A 357,521 43,420,925 2.5%Microsoft Corp. 878,200 60,534,326 3.6%PayPal Holdings, Inc. (I) 324,200 17,399,814 1.0%Red Hat, Inc. (I) 126,387 12,101,555 0.7%salesforce.com, Inc. (I) 334,500 28,967,700 1.7%ServiceNow, Inc. (I) 212,600 22,535,600 1.3%Tencent Holdings, Ltd. 906,700 32,527,804 1.9%Visa, Inc., Class A 564,300 52,920,054 3.1%OTHER SECURITIES 33,208,743 1.9%
638,888,462Materials – 0.6% 9,351,706 0.6%Real estate – 2.1%American Tower Corp. 215,138 28,467,060 1.7%OTHER SECURITIES 6,121,614 0.4%
34,588,674Utilities – 0.2% 3,797,523 0.2%
TOTAL COMMON STOCKS (Cost $984,933,118) $ 1,691,168,099
SECURITIES LENDING COLLATERAL – 1.0%John Hancock Collateral Trust,
1.1508% (W)(Y) 1,777,614 17,786,627 1.0%
TOTAL SECURITIES LENDINGCOLLATERAL (Cost $17,786,279) $ 17,786,627
SHORT-TERM INVESTMENTS – 0.8%Money market funds – 0.8% 13,847,382 0.8%
TOTAL SHORT-TERMINVESTMENTS (Cost $13,847,382) $ 13,847,382
Total Investments (Blue Chip Growth Trust)(Cost $1,016,566,779) – 101.4% $ 1,722,802,108 101.4%
Other assets and liabilities, net – (1.4%) (24,585,478) (1.4)%
TOTAL NET ASSETS – 100.0% $ 1,698,216,630 100.0%
Security Abbreviations and LegendADR American Depositary Receipts(I) Non-income producing security.(L) A portion of this security is on loan as of 6-30-17.(W) Investment is an affiliate of the fund, the advisor and/or subadvisor. This
security represents the investment of cash collateral received for securitieslending.
(Y) The rate shown is the annualized seven-day yield as of 6-30-17.
John Hancock Variable Insurance TrustSUMMARY PORTFOLIO OF INVESTMENTS — June 30, 2017 (unaudited) (showing percentage of total net assets)
American New World Trust Blue Chip Growth Trust (continued)
The accompanying notes are an integral part of the financial statements. 16
Shares orPrincipalAmount Value
% ofNet
Assets
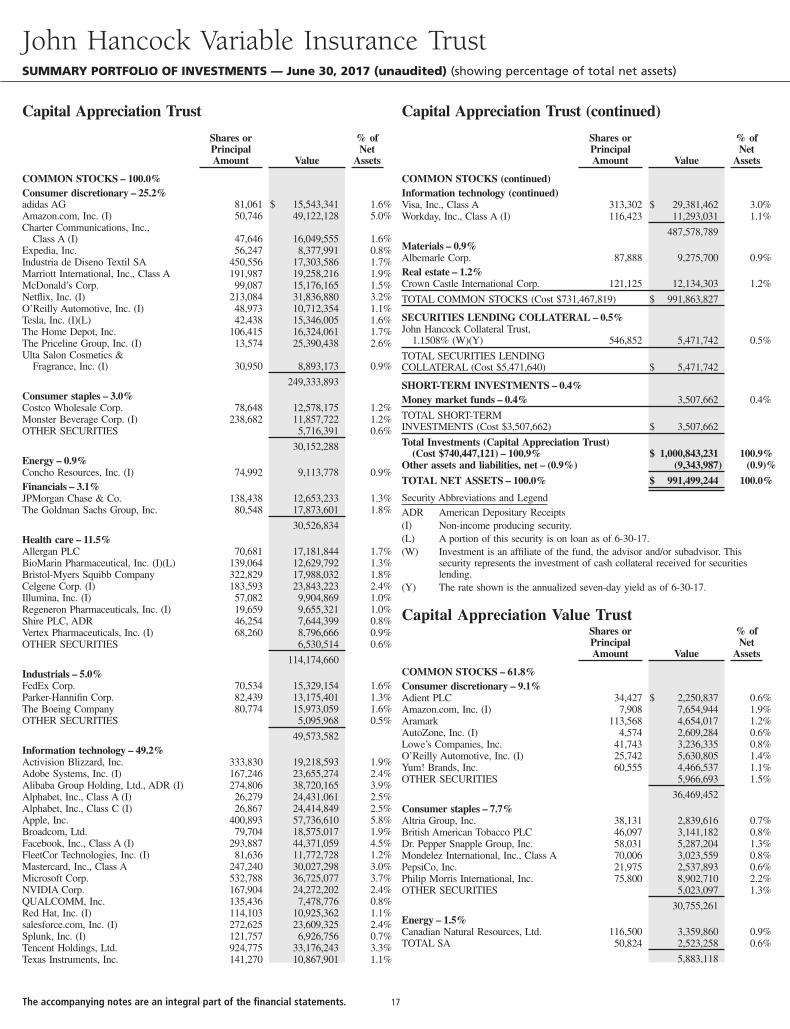
COMMON STOCKS – 100.0%Consumer discretionary – 25.2%adidas AG 81,061 $ 15,543,341 1.6%Amazon.com, Inc. (I) 50,746 49,122,128 5.0%Charter Communications, Inc.,
Class A (I) 47,646 16,049,555 1.6%Expedia, Inc. 56,247 8,377,991 0.8%Industria de Diseno Textil SA 450,556 17,303,586 1.7%Marriott International, Inc., Class A 191,987 19,258,216 1.9%McDonald’s Corp. 99,087 15,176,165 1.5%Netflix, Inc. (I) 213,084 31,836,880 3.2%O’Reilly Automotive, Inc. (I) 48,973 10,712,354 1.1%Tesla, Inc. (I)(L) 42,438 15,346,005 1.6%The Home Depot, Inc. 106,415 16,324,061 1.7%The Priceline Group, Inc. (I) 13,574 25,390,438 2.6%Ulta Salon Cosmetics &
Fragrance, Inc. (I) 30,950 8,893,173 0.9%
249,333,893Consumer staples – 3.0%Costco Wholesale Corp. 78,648 12,578,175 1.2%Monster Beverage Corp. (I) 238,682 11,857,722 1.2%OTHER SECURITIES 5,716,391 0.6%
30,152,288Energy – 0.9%Concho Resources, Inc. (I) 74,992 9,113,778 0.9%Financials – 3.1%JPMorgan Chase & Co. 138,438 12,653,233 1.3%The Goldman Sachs Group, Inc. 80,548 17,873,601 1.8%
30,526,834Health care – 11.5%Allergan PLC 70,681 17,181,844 1.7%BioMarin Pharmaceutical, Inc. (I)(L) 139,064 12,629,792 1.3%Bristol-Myers Squibb Company 322,829 17,988,032 1.8%Celgene Corp. (I) 183,593 23,843,223 2.4%Illumina, Inc. (I) 57,082 9,904,869 1.0%Regeneron Pharmaceuticals, Inc. (I) 19,659 9,655,321 1.0%Shire PLC, ADR 46,254 7,644,399 0.8%Vertex Pharmaceuticals, Inc. (I) 68,260 8,796,666 0.9%OTHER SECURITIES 6,530,514 0.6%
114,174,660Industrials – 5.0%FedEx Corp. 70,534 15,329,154 1.6%Parker-Hannifin Corp. 82,439 13,175,401 1.3%The Boeing Company 80,774 15,973,059 1.6%OTHER SECURITIES 5,095,968 0.5%
49,573,582Information technology – 49.2%Activision Blizzard, Inc. 333,830 19,218,593 1.9%Adobe Systems, Inc. (I) 167,246 23,655,274 2.4%Alibaba Group Holding, Ltd., ADR (I) 274,806 38,720,165 3.9%Alphabet, Inc., Class A (I) 26,279 24,431,061 2.5%Alphabet, Inc., Class C (I) 26,867 24,414,849 2.5%Apple, Inc. 400,893 57,736,610 5.8%Broadcom, Ltd. 79,704 18,575,017 1.9%Facebook, Inc., Class A (I) 293,887 44,371,059 4.5%FleetCor Technologies, Inc. (I) 81,636 11,772,728 1.2%Mastercard, Inc., Class A 247,240 30,027,298 3.0%Microsoft Corp. 532,788 36,725,077 3.7%NVIDIA Corp. 167,904 24,272,202 2.4%QUALCOMM, Inc. 135,436 7,478,776 0.8%Red Hat, Inc. (I) 114,103 10,925,362 1.1%salesforce.com, Inc. (I) 272,625 23,609,325 2.4%Splunk, Inc. (I) 121,757 6,926,756 0.7%Tencent Holdings, Ltd. 924,775 33,176,243 3.3%Texas Instruments, Inc. 141,270 10,867,901 1.1%
Shares orPrincipalAmount Value
% ofNet
Assets
COMMON STOCKS (continued)Information technology (continued)Visa, Inc., Class A 313,302 $ 29,381,462 3.0%Workday, Inc., Class A (I) 116,423 11,293,031 1.1%
487,578,789Materials – 0.9%Albemarle Corp. 87,888 9,275,700 0.9%Real estate – 1.2%Crown Castle International Corp. 121,125 12,134,303 1.2%
TOTAL COMMON STOCKS (Cost $731,467,819) $ 991,863,827
SECURITIES LENDING COLLATERAL – 0.5%John Hancock Collateral Trust,
1.1508% (W)(Y) 546,852 5,471,742 0.5%
TOTAL SECURITIES LENDINGCOLLATERAL (Cost $5,471,640) $ 5,471,742
SHORT-TERM INVESTMENTS – 0.4%Money market funds – 0.4% 3,507,662 0.4%
TOTAL SHORT-TERMINVESTMENTS (Cost $3,507,662) $ 3,507,662
Total Investments (Capital Appreciation Trust)(Cost $740,447,121) – 100.9% $ 1,000,843,231 100.9%
Other assets and liabilities, net – (0.9%) (9,343,987) (0.9)%
TOTAL NET ASSETS – 100.0% $ 991,499,244 100.0%
Security Abbreviations and LegendADR American Depositary Receipts(I) Non-income producing security.(L) A portion of this security is on loan as of 6-30-17.(W) Investment is an affiliate of the fund, the advisor and/or subadvisor. This
security represents the investment of cash collateral received for securitieslending.
(Y) The rate shown is the annualized seven-day yield as of 6-30-17.
Capital Appreciation Value TrustShares orPrincipalAmount Value
% ofNet
Assets
COMMON STOCKS – 61.8%Consumer discretionary – 9.1%Adient PLC 34,427 $ 2,250,837 0.6%Amazon.com, Inc. (I) 7,908 7,654,944 1.9%Aramark 113,568 4,654,017 1.2%AutoZone, Inc. (I) 4,574 2,609,284 0.6%Lowe’s Companies, Inc. 41,743 3,236,335 0.8%O’Reilly Automotive, Inc. (I) 25,742 5,630,805 1.4%Yum! Brands, Inc. 60,555 4,466,537 1.1%OTHER SECURITIES 5,966,693 1.5%
36,469,452Consumer staples – 7.7%Altria Group, Inc. 38,131 2,839,616 0.7%British American Tobacco PLC 46,097 3,141,182 0.8%Dr. Pepper Snapple Group, Inc. 58,031 5,287,204 1.3%Mondelez International, Inc., Class A 70,006 3,023,559 0.8%PepsiCo, Inc. 21,975 2,537,893 0.6%Philip Morris International, Inc. 75,800 8,902,710 2.2%OTHER SECURITIES 5,023,097 1.3%
30,755,261Energy – 1.5%Canadian Natural Resources, Ltd. 116,500 3,359,860 0.9%TOTAL SA 50,824 2,523,258 0.6%
5,883,118
John Hancock Variable Insurance TrustSUMMARY PORTFOLIO OF INVESTMENTS — June 30, 2017 (unaudited) (showing percentage of total net assets)
Capital Appreciation Trust Capital Appreciation Trust (continued)
The accompanying notes are an integral part of the financial statements. 17
Shares orPrincipalAmount Value
% ofNet
Assets
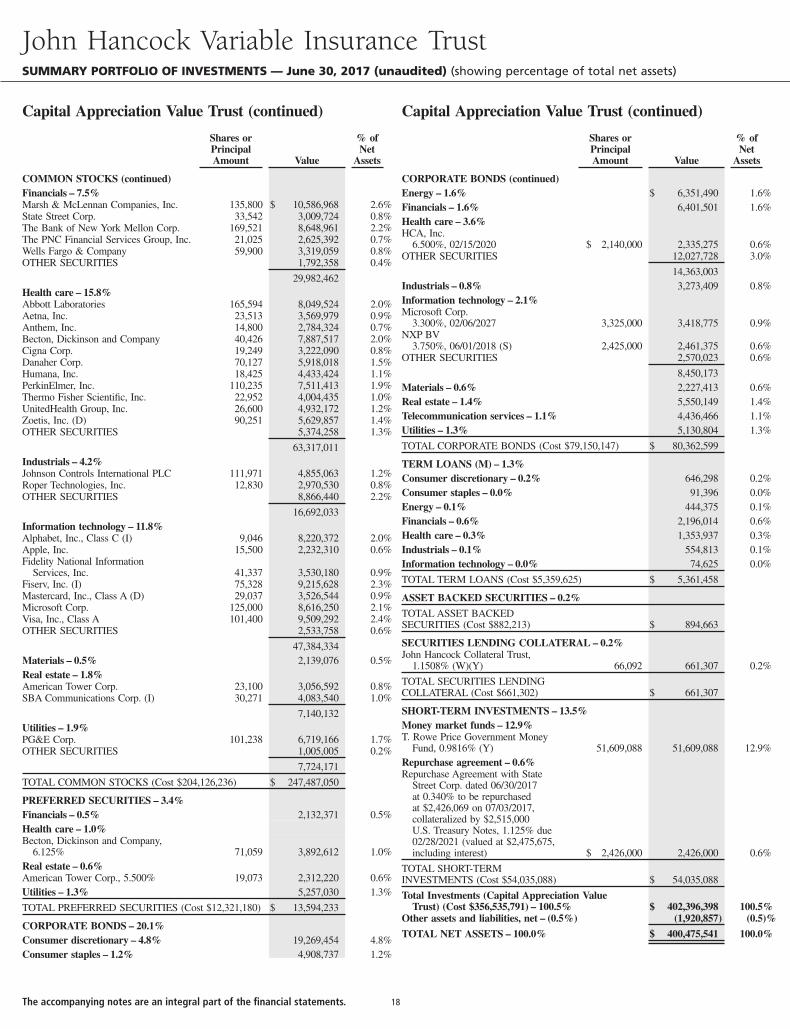
COMMON STOCKS (continued)Financials – 7.5%Marsh & McLennan Companies, Inc. 135,800 $ 10,586,968 2.6%State Street Corp. 33,542 3,009,724 0.8%The Bank of New York Mellon Corp. 169,521 8,648,961 2.2%The PNC Financial Services Group, Inc. 21,025 2,625,392 0.7%Wells Fargo & Company 59,900 3,319,059 0.8%OTHER SECURITIES 1,792,358 0.4%
29,982,462Health care – 15.8%Abbott Laboratories 165,594 8,049,524 2.0%Aetna, Inc. 23,513 3,569,979 0.9%Anthem, Inc. 14,800 2,784,324 0.7%Becton, Dickinson and Company 40,426 7,887,517 2.0%Cigna Corp. 19,249 3,222,090 0.8%Danaher Corp. 70,127 5,918,018 1.5%Humana, Inc. 18,425 4,433,424 1.1%PerkinElmer, Inc. 110,235 7,511,413 1.9%Thermo Fisher Scientific, Inc. 22,952 4,004,435 1.0%UnitedHealth Group, Inc. 26,600 4,932,172 1.2%Zoetis, Inc. (D) 90,251 5,629,857 1.4%OTHER SECURITIES 5,374,258 1.3%
63,317,011Industrials – 4.2%Johnson Controls International PLC 111,971 4,855,063 1.2%Roper Technologies, Inc. 12,830 2,970,530 0.8%OTHER SECURITIES 8,866,440 2.2%
16,692,033Information technology – 11.8%Alphabet, Inc., Class C (I) 9,046 8,220,372 2.0%Apple, Inc. 15,500 2,232,310 0.6%Fidelity National Information
Services, Inc. 41,337 3,530,180 0.9%Fiserv, Inc. (I) 75,328 9,215,628 2.3%Mastercard, Inc., Class A (D) 29,037 3,526,544 0.9%Microsoft Corp. 125,000 8,616,250 2.1%Visa, Inc., Class A 101,400 9,509,292 2.4%OTHER SECURITIES 2,533,758 0.6%
47,384,334Materials – 0.5% 2,139,076 0.5%Real estate – 1.8%American Tower Corp. 23,100 3,056,592 0.8%SBA Communications Corp. (I) 30,271 4,083,540 1.0%
7,140,132Utilities – 1.9%PG&E Corp. 101,238 6,719,166 1.7%OTHER SECURITIES 1,005,005 0.2%
7,724,171
TOTAL COMMON STOCKS (Cost $204,126,236) $ 247,487,050
PREFERRED SECURITIES – 3.4%Financials – 0.5% 2,132,371 0.5%Health care – 1.0%Becton, Dickinson and Company,
6.125% 71,059 3,892,612 1.0%Real estate – 0.6%American Tower Corp., 5.500% 19,073 2,312,220 0.6%Utilities – 1.3% 5,257,030 1.3%
TOTAL PREFERRED SECURITIES (Cost $12,321,180) $ 13,594,233
CORPORATE BONDS – 20.1%Consumer discretionary – 4.8% 19,269,454 4.8%Consumer staples – 1.2% 4,908,737 1.2%
Shares orPrincipalAmount Value
% ofNet
Assets
CORPORATE BONDS (continued)Energy – 1.6% $ 6,351,490 1.6%Financials – 1.6% 6,401,501 1.6%Health care – 3.6%HCA, Inc.
6.500%, 02/15/2020 $ 2,140,000 2,335,275 0.6%OTHER SECURITIES 12,027,728 3.0%
14,363,003Industrials – 0.8% 3,273,409 0.8%Information technology – 2.1%Microsoft Corp.
3.300%, 02/06/2027 3,325,000 3,418,775 0.9%NXP BV
3.750%, 06/01/2018 (S) 2,425,000 2,461,375 0.6%OTHER SECURITIES 2,570,023 0.6%
8,450,173Materials – 0.6% 2,227,413 0.6%Real estate – 1.4% 5,550,149 1.4%Telecommunication services – 1.1% 4,436,466 1.1%Utilities – 1.3% 5,130,804 1.3%
TOTAL CORPORATE BONDS (Cost $79,150,147) $ 80,362,599
TERM LOANS (M) – 1.3%Consumer discretionary – 0.2% 646,298 0.2%Consumer staples – 0.0% 91,396 0.0%Energy – 0.1% 444,375 0.1%Financials – 0.6% 2,196,014 0.6%Health care – 0.3% 1,353,937 0.3%Industrials – 0.1% 554,813 0.1%Information technology – 0.0% 74,625 0.0%
TOTAL TERM LOANS (Cost $5,359,625) $ 5,361,458
ASSET BACKED SECURITIES – 0.2%
TOTAL ASSET BACKEDSECURITIES (Cost $882,213) $ 894,663
SECURITIES LENDING COLLATERAL – 0.2%John Hancock Collateral Trust,
1.1508% (W)(Y) 66,092 661,307 0.2%
TOTAL SECURITIES LENDINGCOLLATERAL (Cost $661,302) $ 661,307
SHORT-TERM INVESTMENTS – 13.5%Money market funds – 12.9%T. Rowe Price Government Money
Fund, 0.9816% (Y) 51,609,088 51,609,088 12.9%Repurchase agreement – 0.6%Repurchase Agreement with State
Street Corp. dated 06/30/2017at 0.340% to be repurchasedat $2,426,069 on 07/03/2017,collateralized by $2,515,000U.S. Treasury Notes, 1.125% due02/28/2021 (valued at $2,475,675,including interest) $ 2,426,000 2,426,000 0.6%
TOTAL SHORT-TERMINVESTMENTS (Cost $54,035,088) $ 54,035,088
Total Investments (Capital Appreciation ValueTrust) (Cost $356,535,791) – 100.5% $ 402,396,398 100.5%
Other assets and liabilities, net – (0.5%) (1,920,857) (0.5)%
TOTAL NET ASSETS – 100.0% $ 400,475,541 100.0%
John Hancock Variable Insurance TrustSUMMARY PORTFOLIO OF INVESTMENTS — June 30, 2017 (unaudited) (showing percentage of total net assets)
Capital Appreciation Value Trust (continued) Capital Appreciation Value Trust (continued)
The accompanying notes are an integral part of the financial statements. 18
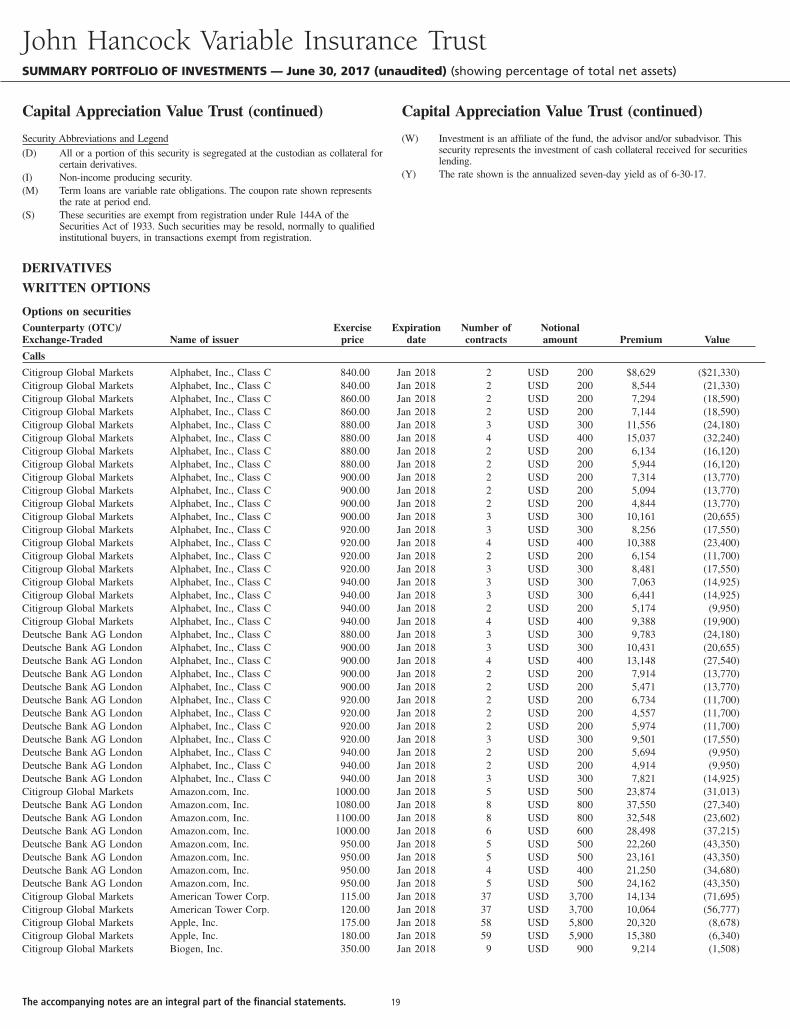
Security Abbreviations and Legend(D) All or a portion of this security is segregated at the custodian as collateral for
certain derivatives.(I) Non-income producing security.(M) Term loans are variable rate obligations. The coupon rate shown represents
the rate at period end.(S) These securities are exempt from registration under Rule 144A of the
Securities Act of 1933. Such securities may be resold, normally to qualifiedinstitutional buyers, in transactions exempt from registration.
(W) Investment is an affiliate of the fund, the advisor and/or subadvisor. Thissecurity represents the investment of cash collateral received for securitieslending.
(Y) The rate shown is the annualized seven-day yield as of 6-30-17.
DERIVATIVES
WRITTEN OPTIONS
Options on securitiesCounterparty (OTC)/Exchange-Traded Name of issuer
Exerciseprice
Expirationdate
Number ofcontracts
Notionalamount Premium Value
Calls
Citigroup Global Markets Alphabet, Inc., Class C 840.00 Jan 2018 2 USD 200 $8,629 ($21,330)Citigroup Global Markets Alphabet, Inc., Class C 840.00 Jan 2018 2 USD 200 8,544 (21,330)Citigroup Global Markets Alphabet, Inc., Class C 860.00 Jan 2018 2 USD 200 7,294 (18,590)Citigroup Global Markets Alphabet, Inc., Class C 860.00 Jan 2018 2 USD 200 7,144 (18,590)Citigroup Global Markets Alphabet, Inc., Class C 880.00 Jan 2018 3 USD 300 11,556 (24,180)Citigroup Global Markets Alphabet, Inc., Class C 880.00 Jan 2018 4 USD 400 15,037 (32,240)Citigroup Global Markets Alphabet, Inc., Class C 880.00 Jan 2018 2 USD 200 6,134 (16,120)Citigroup Global Markets Alphabet, Inc., Class C 880.00 Jan 2018 2 USD 200 5,944 (16,120)Citigroup Global Markets Alphabet, Inc., Class C 900.00 Jan 2018 2 USD 200 7,314 (13,770)Citigroup Global Markets Alphabet, Inc., Class C 900.00 Jan 2018 2 USD 200 5,094 (13,770)Citigroup Global Markets Alphabet, Inc., Class C 900.00 Jan 2018 2 USD 200 4,844 (13,770)Citigroup Global Markets Alphabet, Inc., Class C 900.00 Jan 2018 3 USD 300 10,161 (20,655)Citigroup Global Markets Alphabet, Inc., Class C 920.00 Jan 2018 3 USD 300 8,256 (17,550)Citigroup Global Markets Alphabet, Inc., Class C 920.00 Jan 2018 4 USD 400 10,388 (23,400)Citigroup Global Markets Alphabet, Inc., Class C 920.00 Jan 2018 2 USD 200 6,154 (11,700)Citigroup Global Markets Alphabet, Inc., Class C 920.00 Jan 2018 3 USD 300 8,481 (17,550)Citigroup Global Markets Alphabet, Inc., Class C 940.00 Jan 2018 3 USD 300 7,063 (14,925)Citigroup Global Markets Alphabet, Inc., Class C 940.00 Jan 2018 3 USD 300 6,441 (14,925)Citigroup Global Markets Alphabet, Inc., Class C 940.00 Jan 2018 2 USD 200 5,174 (9,950)Citigroup Global Markets Alphabet, Inc., Class C 940.00 Jan 2018 4 USD 400 9,388 (19,900)Deutsche Bank AG London Alphabet, Inc., Class C 880.00 Jan 2018 3 USD 300 9,783 (24,180)Deutsche Bank AG London Alphabet, Inc., Class C 900.00 Jan 2018 3 USD 300 10,431 (20,655)Deutsche Bank AG London Alphabet, Inc., Class C 900.00 Jan 2018 4 USD 400 13,148 (27,540)Deutsche Bank AG London Alphabet, Inc., Class C 900.00 Jan 2018 2 USD 200 7,914 (13,770)Deutsche Bank AG London Alphabet, Inc., Class C 900.00 Jan 2018 2 USD 200 5,471 (13,770)Deutsche Bank AG London Alphabet, Inc., Class C 920.00 Jan 2018 2 USD 200 6,734 (11,700)Deutsche Bank AG London Alphabet, Inc., Class C 920.00 Jan 2018 2 USD 200 4,557 (11,700)Deutsche Bank AG London Alphabet, Inc., Class C 920.00 Jan 2018 2 USD 200 5,974 (11,700)Deutsche Bank AG London Alphabet, Inc., Class C 920.00 Jan 2018 3 USD 300 9,501 (17,550)Deutsche Bank AG London Alphabet, Inc., Class C 940.00 Jan 2018 2 USD 200 5,694 (9,950)Deutsche Bank AG London Alphabet, Inc., Class C 940.00 Jan 2018 2 USD 200 4,914 (9,950)Deutsche Bank AG London Alphabet, Inc., Class C 940.00 Jan 2018 3 USD 300 7,821 (14,925)Citigroup Global Markets Amazon.com, Inc. 1000.00 Jan 2018 5 USD 500 23,874 (31,013)Deutsche Bank AG London Amazon.com, Inc. 1080.00 Jan 2018 8 USD 800 37,550 (27,340)Deutsche Bank AG London Amazon.com, Inc. 1100.00 Jan 2018 8 USD 800 32,548 (23,602)Deutsche Bank AG London Amazon.com, Inc. 1000.00 Jan 2018 6 USD 600 28,498 (37,215)Deutsche Bank AG London Amazon.com, Inc. 950.00 Jan 2018 5 USD 500 22,260 (43,350)Deutsche Bank AG London Amazon.com, Inc. 950.00 Jan 2018 5 USD 500 23,161 (43,350)Deutsche Bank AG London Amazon.com, Inc. 950.00 Jan 2018 4 USD 400 21,250 (34,680)Deutsche Bank AG London Amazon.com, Inc. 950.00 Jan 2018 5 USD 500 24,162 (43,350)Citigroup Global Markets American Tower Corp. 115.00 Jan 2018 37 USD 3,700 14,134 (71,695)Citigroup Global Markets American Tower Corp. 120.00 Jan 2018 37 USD 3,700 10,064 (56,777)Citigroup Global Markets Apple, Inc. 175.00 Jan 2018 58 USD 5,800 20,320 (8,678)Citigroup Global Markets Apple, Inc. 180.00 Jan 2018 59 USD 5,900 15,380 (6,340)Citigroup Global Markets Biogen, Inc. 350.00 Jan 2018 9 USD 900 9,214 (1,508)
John Hancock Variable Insurance TrustSUMMARY PORTFOLIO OF INVESTMENTS — June 30, 2017 (unaudited) (showing percentage of total net assets)
Capital Appreciation Value Trust (continued) Capital Appreciation Value Trust (continued)
The accompanying notes are an integral part of the financial statements. 19
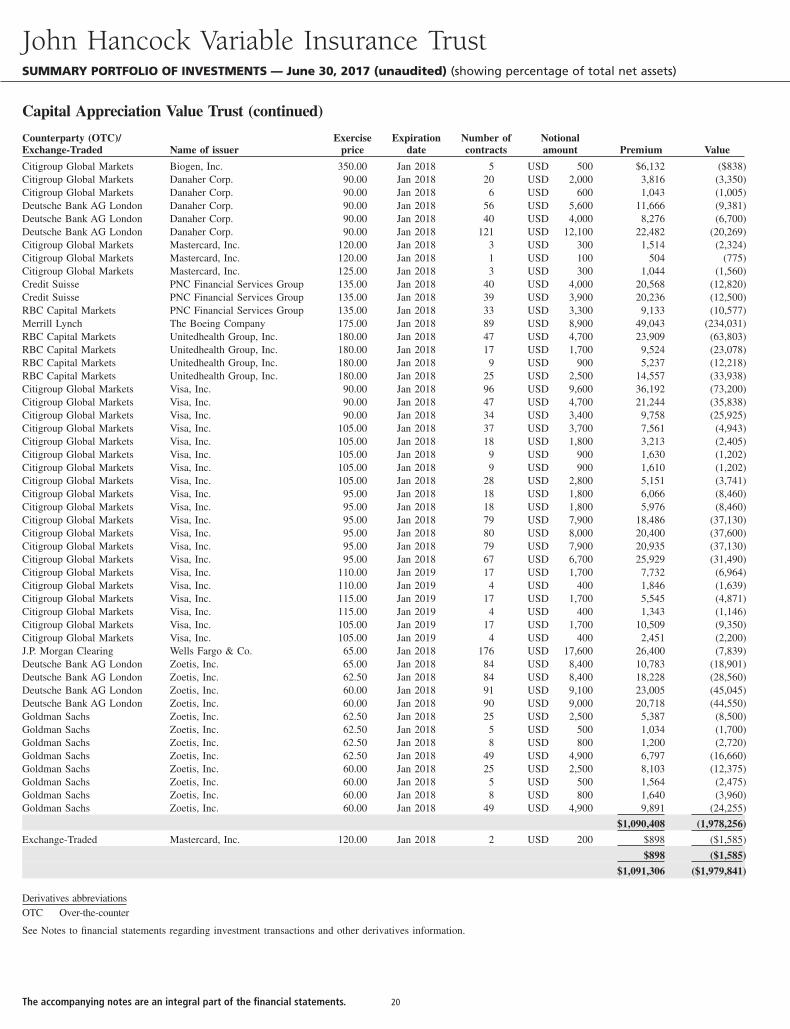
Counterparty (OTC)/Exchange-Traded Name of issuer
Exerciseprice
Expirationdate
Number ofcontracts
Notionalamount Premium Value
Citigroup Global Markets Biogen, Inc. 350.00 Jan 2018 5 USD 500 $6,132 ($838)Citigroup Global Markets Danaher Corp. 90.00 Jan 2018 20 USD 2,000 3,816 (3,350)Citigroup Global Markets Danaher Corp. 90.00 Jan 2018 6 USD 600 1,043 (1,005)Deutsche Bank AG London Danaher Corp. 90.00 Jan 2018 56 USD 5,600 11,666 (9,381)Deutsche Bank AG London Danaher Corp. 90.00 Jan 2018 40 USD 4,000 8,276 (6,700)Deutsche Bank AG London Danaher Corp. 90.00 Jan 2018 121 USD 12,100 22,482 (20,269)Citigroup Global Markets Mastercard, Inc. 120.00 Jan 2018 3 USD 300 1,514 (2,324)Citigroup Global Markets Mastercard, Inc. 120.00 Jan 2018 1 USD 100 504 (775)Citigroup Global Markets Mastercard, Inc. 125.00 Jan 2018 3 USD 300 1,044 (1,560)Credit Suisse PNC Financial Services Group 135.00 Jan 2018 40 USD 4,000 20,568 (12,820)Credit Suisse PNC Financial Services Group 135.00 Jan 2018 39 USD 3,900 20,236 (12,500)RBC Capital Markets PNC Financial Services Group 135.00 Jan 2018 33 USD 3,300 9,133 (10,577)Merrill Lynch The Boeing Company 175.00 Jan 2018 89 USD 8,900 49,043 (234,031)RBC Capital Markets Unitedhealth Group, Inc. 180.00 Jan 2018 47 USD 4,700 23,909 (63,803)RBC Capital Markets Unitedhealth Group, Inc. 180.00 Jan 2018 17 USD 1,700 9,524 (23,078)RBC Capital Markets Unitedhealth Group, Inc. 180.00 Jan 2018 9 USD 900 5,237 (12,218)RBC Capital Markets Unitedhealth Group, Inc. 180.00 Jan 2018 25 USD 2,500 14,557 (33,938)Citigroup Global Markets Visa, Inc. 90.00 Jan 2018 96 USD 9,600 36,192 (73,200)Citigroup Global Markets Visa, Inc. 90.00 Jan 2018 47 USD 4,700 21,244 (35,838)Citigroup Global Markets Visa, Inc. 90.00 Jan 2018 34 USD 3,400 9,758 (25,925)Citigroup Global Markets Visa, Inc. 105.00 Jan 2018 37 USD 3,700 7,561 (4,943)Citigroup Global Markets Visa, Inc. 105.00 Jan 2018 18 USD 1,800 3,213 (2,405)Citigroup Global Markets Visa, Inc. 105.00 Jan 2018 9 USD 900 1,630 (1,202)Citigroup Global Markets Visa, Inc. 105.00 Jan 2018 9 USD 900 1,610 (1,202)Citigroup Global Markets Visa, Inc. 105.00 Jan 2018 28 USD 2,800 5,151 (3,741)Citigroup Global Markets Visa, Inc. 95.00 Jan 2018 18 USD 1,800 6,066 (8,460)Citigroup Global Markets Visa, Inc. 95.00 Jan 2018 18 USD 1,800 5,976 (8,460)Citigroup Global Markets Visa, Inc. 95.00 Jan 2018 79 USD 7,900 18,486 (37,130)Citigroup Global Markets Visa, Inc. 95.00 Jan 2018 80 USD 8,000 20,400 (37,600)Citigroup Global Markets Visa, Inc. 95.00 Jan 2018 79 USD 7,900 20,935 (37,130)Citigroup Global Markets Visa, Inc. 95.00 Jan 2018 67 USD 6,700 25,929 (31,490)Citigroup Global Markets Visa, Inc. 110.00 Jan 2019 17 USD 1,700 7,732 (6,964)Citigroup Global Markets Visa, Inc. 110.00 Jan 2019 4 USD 400 1,846 (1,639)Citigroup Global Markets Visa, Inc. 115.00 Jan 2019 17 USD 1,700 5,545 (4,871)Citigroup Global Markets Visa, Inc. 115.00 Jan 2019 4 USD 400 1,343 (1,146)Citigroup Global Markets Visa, Inc. 105.00 Jan 2019 17 USD 1,700 10,509 (9,350)Citigroup Global Markets Visa, Inc. 105.00 Jan 2019 4 USD 400 2,451 (2,200)J.P. Morgan Clearing Wells Fargo & Co. 65.00 Jan 2018 176 USD 17,600 26,400 (7,839)Deutsche Bank AG London Zoetis, Inc. 65.00 Jan 2018 84 USD 8,400 10,783 (18,901)Deutsche Bank AG London Zoetis, Inc. 62.50 Jan 2018 84 USD 8,400 18,228 (28,560)Deutsche Bank AG London Zoetis, Inc. 60.00 Jan 2018 91 USD 9,100 23,005 (45,045)Deutsche Bank AG London Zoetis, Inc. 60.00 Jan 2018 90 USD 9,000 20,718 (44,550)Goldman Sachs Zoetis, Inc. 62.50 Jan 2018 25 USD 2,500 5,387 (8,500)Goldman Sachs Zoetis, Inc. 62.50 Jan 2018 5 USD 500 1,034 (1,700)Goldman Sachs Zoetis, Inc. 62.50 Jan 2018 8 USD 800 1,200 (2,720)Goldman Sachs Zoetis, Inc. 62.50 Jan 2018 49 USD 4,900 6,797 (16,660)Goldman Sachs Zoetis, Inc. 60.00 Jan 2018 25 USD 2,500 8,103 (12,375)Goldman Sachs Zoetis, Inc. 60.00 Jan 2018 5 USD 500 1,564 (2,475)Goldman Sachs Zoetis, Inc. 60.00 Jan 2018 8 USD 800 1,640 (3,960)Goldman Sachs Zoetis, Inc. 60.00 Jan 2018 49 USD 4,900 9,891 (24,255)
$1,090,408 (1,978,256)
Exchange-Traded Mastercard, Inc. 120.00 Jan 2018 2 USD 200 $898 ($1,585)
$898 ($1,585)
$1,091,306 ($1,979,841)
Derivatives abbreviationsOTC Over-the-counter
See Notes to financial statements regarding investment transactions and other derivatives information.
John Hancock Variable Insurance TrustSUMMARY PORTFOLIO OF INVESTMENTS — June 30, 2017 (unaudited) (showing percentage of total net assets)
Capital Appreciation Value Trust (continued)
The accompanying notes are an integral part of the financial statements. 20
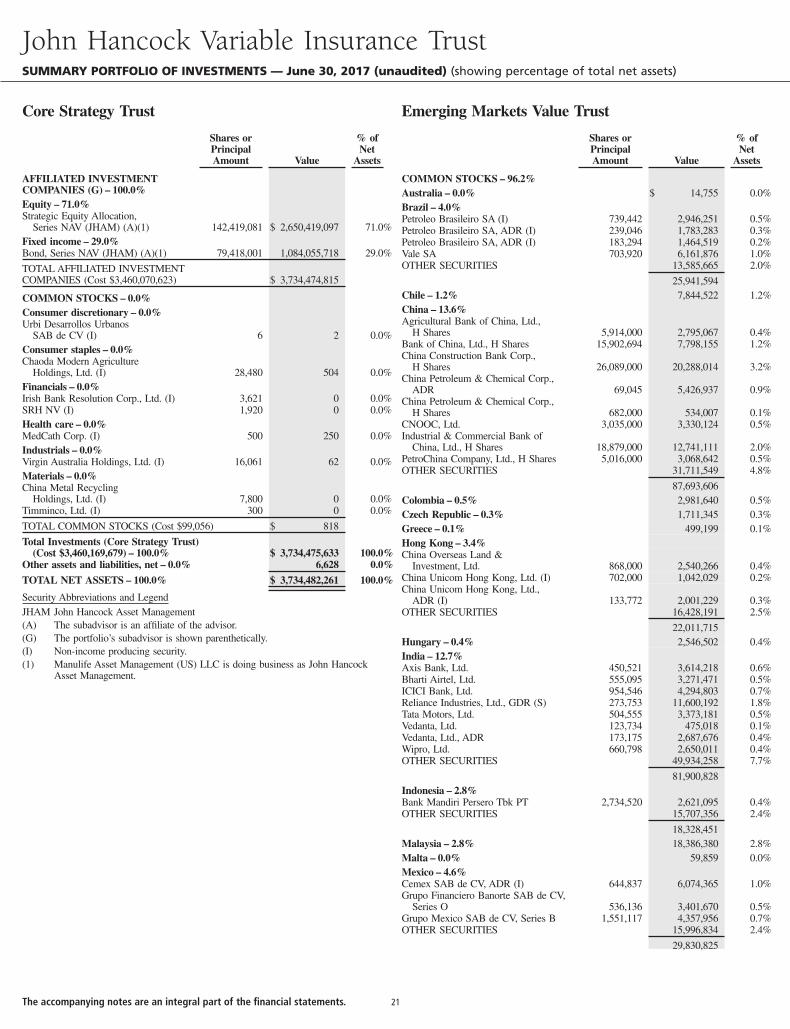
Shares orPrincipalAmount Value
% ofNet
Assets
AFFILIATED INVESTMENTCOMPANIES (G) – 100.0%Equity – 71.0%Strategic Equity Allocation,
Series NAV (JHAM) (A)(1) 142,419,081 $ 2,650,419,097 71.0%Fixed income – 29.0%Bond, Series NAV (JHAM) (A)(1) 79,418,001 1,084,055,718 29.0%
TOTAL AFFILIATED INVESTMENTCOMPANIES (Cost $3,460,070,623) $ 3,734,474,815
COMMON STOCKS – 0.0%Consumer discretionary – 0.0%Urbi Desarrollos Urbanos
SAB de CV (I) 6 2 0.0%Consumer staples – 0.0%Chaoda Modern Agriculture
Holdings, Ltd. (I) 28,480 504 0.0%Financials – 0.0%Irish Bank Resolution Corp., Ltd. (I) 3,621 0 0.0%SRH NV (I) 1,920 0 0.0%Health care – 0.0%MedCath Corp. (I) 500 250 0.0%Industrials – 0.0%Virgin Australia Holdings, Ltd. (I) 16,061 62 0.0%Materials – 0.0%China Metal Recycling
Holdings, Ltd. (I) 7,800 0 0.0%Timminco, Ltd. (I) 300 0 0.0%
TOTAL COMMON STOCKS (Cost $99,056) $ 818
Total Investments (Core Strategy Trust)(Cost $3,460,169,679) – 100.0% $ 3,734,475,633 100.0%
Other assets and liabilities, net – 0.0% 6,628 0.0%
TOTAL NET ASSETS – 100.0% $ 3,734,482,261 100.0%
Security Abbreviations and LegendJHAM John Hancock Asset Management(A) The subadvisor is an affiliate of the advisor.(G) The portfolio’s subadvisor is shown parenthetically.(I) Non-income producing security.(1) Manulife Asset Management (US) LLC is doing business as John Hancock
Asset Management.
Shares orPrincipalAmount Value
% ofNet
Assets
COMMON STOCKS – 96.2%Australia – 0.0% $ 14,755 0.0%Brazil – 4.0%Petroleo Brasileiro SA (I) 739,442 2,946,251 0.5%Petroleo Brasileiro SA, ADR (I) 239,046 1,783,283 0.3%Petroleo Brasileiro SA, ADR (I) 183,294 1,464,519 0.2%Vale SA 703,920 6,161,876 1.0%OTHER SECURITIES 13,585,665 2.0%
25,941,594Chile – 1.2% 7,844,522 1.2%China – 13.6%Agricultural Bank of China, Ltd.,
H Shares 5,914,000 2,795,067 0.4%Bank of China, Ltd., H Shares 15,902,694 7,798,155 1.2%China Construction Bank Corp.,
H Shares 26,089,000 20,288,014 3.2%China Petroleum & Chemical Corp.,
ADR 69,045 5,426,937 0.9%China Petroleum & Chemical Corp.,
H Shares 682,000 534,007 0.1%CNOOC, Ltd. 3,035,000 3,330,124 0.5%Industrial & Commercial Bank of
China, Ltd., H Shares 18,879,000 12,741,111 2.0%PetroChina Company, Ltd., H Shares 5,016,000 3,068,642 0.5%OTHER SECURITIES 31,711,549 4.8%
87,693,606Colombia – 0.5% 2,981,640 0.5%Czech Republic – 0.3% 1,711,345 0.3%Greece – 0.1% 499,199 0.1%Hong Kong – 3.4%China Overseas Land &
Investment, Ltd. 868,000 2,540,266 0.4%China Unicom Hong Kong, Ltd. (I) 702,000 1,042,029 0.2%China Unicom Hong Kong, Ltd.,
ADR (I) 133,772 2,001,229 0.3%OTHER SECURITIES 16,428,191 2.5%
22,011,715Hungary – 0.4% 2,546,502 0.4%India – 12.7%Axis Bank, Ltd. 450,521 3,614,218 0.6%Bharti Airtel, Ltd. 555,095 3,271,471 0.5%ICICI Bank, Ltd. 954,546 4,294,803 0.7%Reliance Industries, Ltd., GDR (S) 273,753 11,600,192 1.8%Tata Motors, Ltd. 504,555 3,373,181 0.5%Vedanta, Ltd. 123,734 475,018 0.1%Vedanta, Ltd., ADR 173,175 2,687,676 0.4%Wipro, Ltd. 660,798 2,650,011 0.4%OTHER SECURITIES 49,934,258 7.7%
81,900,828Indonesia – 2.8%Bank Mandiri Persero Tbk PT 2,734,520 2,621,095 0.4%OTHER SECURITIES 15,707,356 2.4%
18,328,451Malaysia – 2.8% 18,386,380 2.8%Malta – 0.0% 59,859 0.0%Mexico – 4.6%Cemex SAB de CV, ADR (I) 644,837 6,074,365 1.0%Grupo Financiero Banorte SAB de CV,
Series O 536,136 3,401,670 0.5%Grupo Mexico SAB de CV, Series B 1,551,117 4,357,956 0.7%OTHER SECURITIES 15,996,834 2.4%
29,830,825
John Hancock Variable Insurance TrustSUMMARY PORTFOLIO OF INVESTMENTS — June 30, 2017 (unaudited) (showing percentage of total net assets)
Core Strategy Trust Emerging Markets Value Trust
The accompanying notes are an integral part of the financial statements. 21
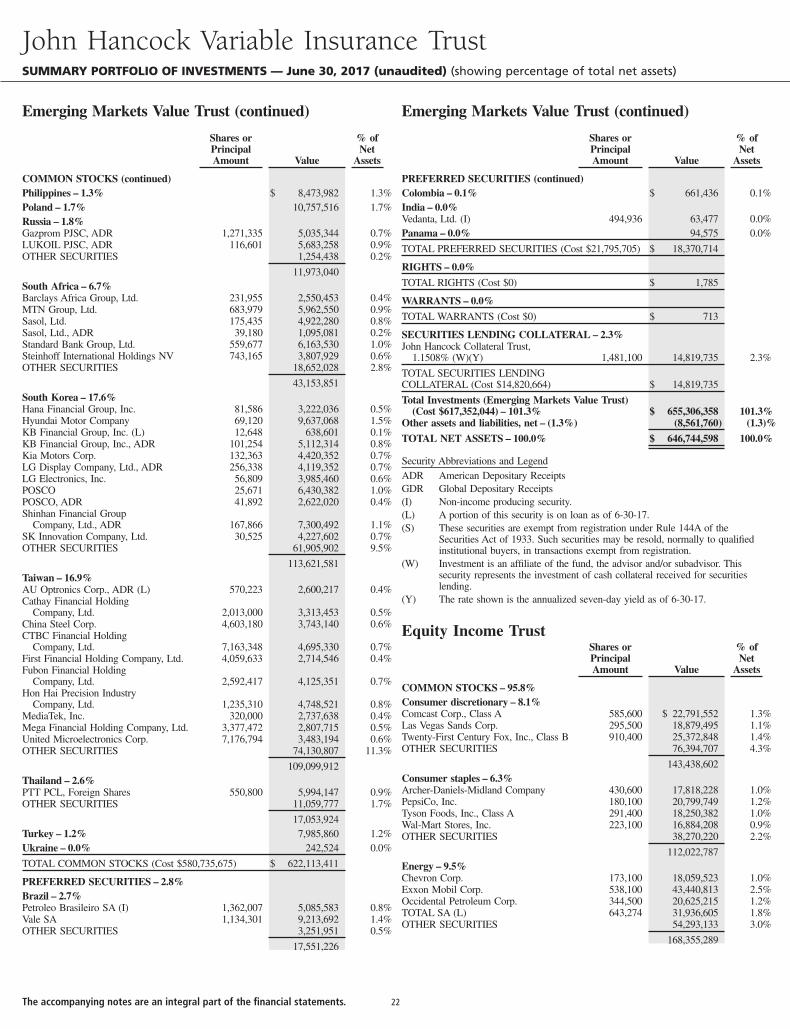
Shares orPrincipalAmount Value
% ofNet
Assets
COMMON STOCKS (continued)Philippines – 1.3% $ 8,473,982 1.3%Poland – 1.7% 10,757,516 1.7%Russia – 1.8%Gazprom PJSC, ADR 1,271,335 5,035,344 0.7%LUKOIL PJSC, ADR 116,601 5,683,258 0.9%OTHER SECURITIES 1,254,438 0.2%
11,973,040South Africa – 6.7%Barclays Africa Group, Ltd. 231,955 2,550,453 0.4%MTN Group, Ltd. 683,979 5,962,550 0.9%Sasol, Ltd. 175,435 4,922,280 0.8%Sasol, Ltd., ADR 39,180 1,095,081 0.2%Standard Bank Group, Ltd. 559,677 6,163,530 1.0%Steinhoff International Holdings NV 743,165 3,807,929 0.6%OTHER SECURITIES 18,652,028 2.8%
43,153,851South Korea – 17.6%Hana Financial Group, Inc. 81,586 3,222,036 0.5%Hyundai Motor Company 69,120 9,637,068 1.5%KB Financial Group, Inc. (L) 12,648 638,601 0.1%KB Financial Group, Inc., ADR 101,254 5,112,314 0.8%Kia Motors Corp. 132,363 4,420,352 0.7%LG Display Company, Ltd., ADR 256,338 4,119,352 0.7%LG Electronics, Inc. 56,809 3,985,460 0.6%POSCO 25,671 6,430,382 1.0%POSCO, ADR 41,892 2,622,020 0.4%Shinhan Financial Group
Company, Ltd., ADR 167,866 7,300,492 1.1%SK Innovation Company, Ltd. 30,525 4,227,602 0.7%OTHER SECURITIES 61,905,902 9.5%
113,621,581Taiwan – 16.9%AU Optronics Corp., ADR (L) 570,223 2,600,217 0.4%Cathay Financial Holding
Company, Ltd. 2,013,000 3,313,453 0.5%China Steel Corp. 4,603,180 3,743,140 0.6%CTBC Financial Holding
Company, Ltd. 7,163,348 4,695,330 0.7%First Financial Holding Company, Ltd. 4,059,633 2,714,546 0.4%Fubon Financial Holding
Company, Ltd. 2,592,417 4,125,351 0.7%Hon Hai Precision Industry
Company, Ltd. 1,235,310 4,748,521 0.8%MediaTek, Inc. 320,000 2,737,638 0.4%Mega Financial Holding Company, Ltd. 3,377,472 2,807,715 0.5%United Microelectronics Corp. 7,176,794 3,483,194 0.6%OTHER SECURITIES 74,130,807 11.3%
109,099,912Thailand – 2.6%PTT PCL, Foreign Shares 550,800 5,994,147 0.9%OTHER SECURITIES 11,059,777 1.7%
17,053,924Turkey – 1.2% 7,985,860 1.2%Ukraine – 0.0% 242,524 0.0%
TOTAL COMMON STOCKS (Cost $580,735,675) $ 622,113,411
PREFERRED SECURITIES – 2.8%Brazil – 2.7%Petroleo Brasileiro SA (I) 1,362,007 5,085,583 0.8%Vale SA 1,134,301 9,213,692 1.4%OTHER SECURITIES 3,251,951 0.5%
17,551,226
Shares orPrincipalAmount Value
% ofNet
Assets
PREFERRED SECURITIES (continued)Colombia – 0.1% $ 661,436 0.1%India – 0.0%Vedanta, Ltd. (I) 494,936 63,477 0.0%Panama – 0.0% 94,575 0.0%
TOTAL PREFERRED SECURITIES (Cost $21,795,705) $ 18,370,714
RIGHTS – 0.0%
TOTAL RIGHTS (Cost $0) $ 1,785
WARRANTS – 0.0%
TOTAL WARRANTS (Cost $0) $ 713
SECURITIES LENDING COLLATERAL – 2.3%John Hancock Collateral Trust,
1.1508% (W)(Y) 1,481,100 14,819,735 2.3%
TOTAL SECURITIES LENDINGCOLLATERAL (Cost $14,820,664) $ 14,819,735
Total Investments (Emerging Markets Value Trust)(Cost $617,352,044) – 101.3% $ 655,306,358 101.3%
Other assets and liabilities, net – (1.3%) (8,561,760) (1.3)%
TOTAL NET ASSETS – 100.0% $ 646,744,598 100.0%
Security Abbreviations and LegendADR American Depositary ReceiptsGDR Global Depositary Receipts(I) Non-income producing security.(L) A portion of this security is on loan as of 6-30-17.(S) These securities are exempt from registration under Rule 144A of the
Securities Act of 1933. Such securities may be resold, normally to qualifiedinstitutional buyers, in transactions exempt from registration.
(W) Investment is an affiliate of the fund, the advisor and/or subadvisor. Thissecurity represents the investment of cash collateral received for securitieslending.
(Y) The rate shown is the annualized seven-day yield as of 6-30-17.
Equity Income TrustShares orPrincipalAmount Value
% ofNet
Assets
COMMON STOCKS – 95.8%Consumer discretionary – 8.1%Comcast Corp., Class A 585,600 $ 22,791,552 1.3%Las Vegas Sands Corp. 295,500 18,879,495 1.1%Twenty-First Century Fox, Inc., Class B 910,400 25,372,848 1.4%OTHER SECURITIES 76,394,707 4.3%
143,438,602Consumer staples – 6.3%Archer-Daniels-Midland Company 430,600 17,818,228 1.0%PepsiCo, Inc. 180,100 20,799,749 1.2%Tyson Foods, Inc., Class A 291,400 18,250,382 1.0%Wal-Mart Stores, Inc. 223,100 16,884,208 0.9%OTHER SECURITIES 38,270,220 2.2%
112,022,787Energy – 9.5%Chevron Corp. 173,100 18,059,523 1.0%Exxon Mobil Corp. 538,100 43,440,813 2.5%Occidental Petroleum Corp. 344,500 20,625,215 1.2%TOTAL SA (L) 643,274 31,936,605 1.8%OTHER SECURITIES 54,293,133 3.0%
168,355,289
John Hancock Variable Insurance TrustSUMMARY PORTFOLIO OF INVESTMENTS — June 30, 2017 (unaudited) (showing percentage of total net assets)
Emerging Markets Value Trust (continued) Emerging Markets Value Trust (continued)
The accompanying notes are an integral part of the financial statements. 22
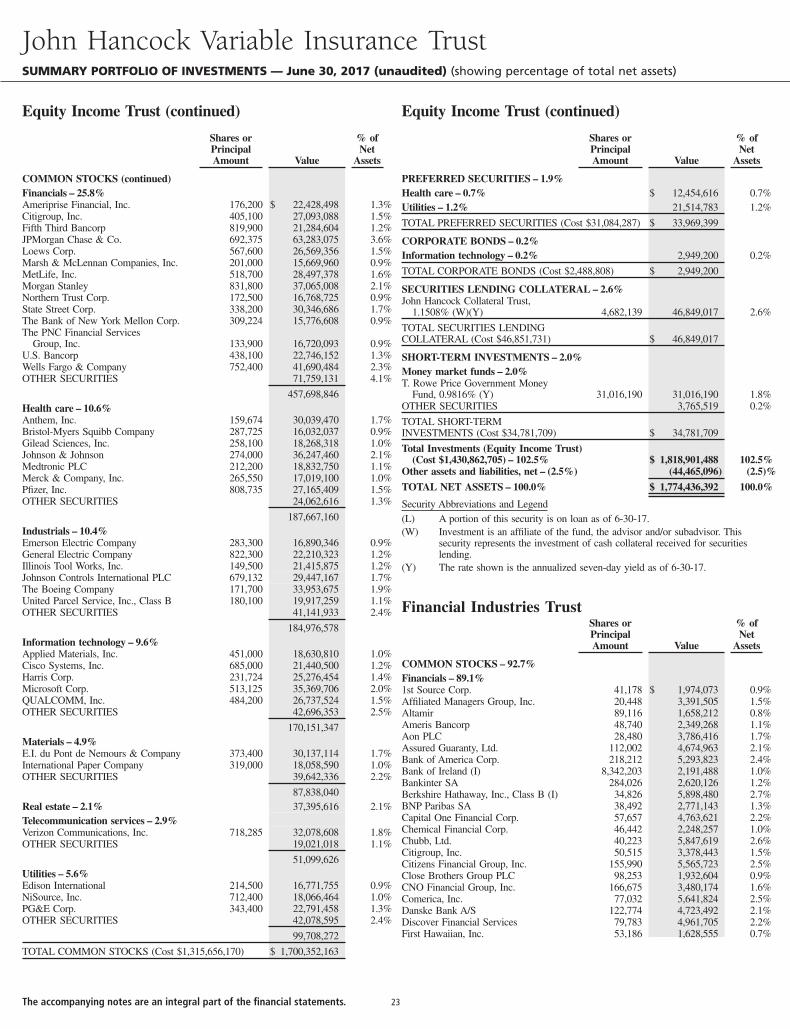
Shares orPrincipalAmount Value
% ofNet
Assets
COMMON STOCKS (continued)Financials – 25.8%Ameriprise Financial, Inc. 176,200 $ 22,428,498 1.3%Citigroup, Inc. 405,100 27,093,088 1.5%Fifth Third Bancorp 819,900 21,284,604 1.2%JPMorgan Chase & Co. 692,375 63,283,075 3.6%Loews Corp. 567,600 26,569,356 1.5%Marsh & McLennan Companies, Inc. 201,000 15,669,960 0.9%MetLife, Inc. 518,700 28,497,378 1.6%Morgan Stanley 831,800 37,065,008 2.1%Northern Trust Corp. 172,500 16,768,725 0.9%State Street Corp. 338,200 30,346,686 1.7%The Bank of New York Mellon Corp. 309,224 15,776,608 0.9%The PNC Financial Services
Group, Inc. 133,900 16,720,093 0.9%U.S. Bancorp 438,100 22,746,152 1.3%Wells Fargo & Company 752,400 41,690,484 2.3%OTHER SECURITIES 71,759,131 4.1%
457,698,846Health care – 10.6%Anthem, Inc. 159,674 30,039,470 1.7%Bristol-Myers Squibb Company 287,725 16,032,037 0.9%Gilead Sciences, Inc. 258,100 18,268,318 1.0%Johnson & Johnson 274,000 36,247,460 2.1%Medtronic PLC 212,200 18,832,750 1.1%Merck & Company, Inc. 265,550 17,019,100 1.0%Pfizer, Inc. 808,735 27,165,409 1.5%OTHER SECURITIES 24,062,616 1.3%
187,667,160Industrials – 10.4%Emerson Electric Company 283,300 16,890,346 0.9%General Electric Company 822,300 22,210,323 1.2%Illinois Tool Works, Inc. 149,500 21,415,875 1.2%Johnson Controls International PLC 679,132 29,447,167 1.7%The Boeing Company 171,700 33,953,675 1.9%United Parcel Service, Inc., Class B 180,100 19,917,259 1.1%OTHER SECURITIES 41,141,933 2.4%
184,976,578Information technology – 9.6%Applied Materials, Inc. 451,000 18,630,810 1.0%Cisco Systems, Inc. 685,000 21,440,500 1.2%Harris Corp. 231,724 25,276,454 1.4%Microsoft Corp. 513,125 35,369,706 2.0%QUALCOMM, Inc. 484,200 26,737,524 1.5%OTHER SECURITIES 42,696,353 2.5%
170,151,347Materials – 4.9%E.I. du Pont de Nemours & Company 373,400 30,137,114 1.7%International Paper Company 319,000 18,058,590 1.0%OTHER SECURITIES 39,642,336 2.2%
87,838,040Real estate – 2.1% 37,395,616 2.1%Telecommunication services – 2.9%Verizon Communications, Inc. 718,285 32,078,608 1.8%OTHER SECURITIES 19,021,018 1.1%
51,099,626Utilities – 5.6%Edison International 214,500 16,771,755 0.9%NiSource, Inc. 712,400 18,066,464 1.0%PG&E Corp. 343,400 22,791,458 1.3%OTHER SECURITIES 42,078,595 2.4%
99,708,272
TOTAL COMMON STOCKS (Cost $1,315,656,170) $ 1,700,352,163
Shares orPrincipalAmount Value
% ofNet
Assets
PREFERRED SECURITIES – 1.9%Health care – 0.7% $ 12,454,616 0.7%Utilities – 1.2% 21,514,783 1.2%
TOTAL PREFERRED SECURITIES (Cost $31,084,287) $ 33,969,399
CORPORATE BONDS – 0.2%Information technology – 0.2% 2,949,200 0.2%
TOTAL CORPORATE BONDS (Cost $2,488,808) $ 2,949,200
SECURITIES LENDING COLLATERAL – 2.6%John Hancock Collateral Trust,
1.1508% (W)(Y) 4,682,139 46,849,017 2.6%
TOTAL SECURITIES LENDINGCOLLATERAL (Cost $46,851,731) $ 46,849,017
SHORT-TERM INVESTMENTS – 2.0%Money market funds – 2.0%T. Rowe Price Government Money
Fund, 0.9816% (Y) 31,016,190 31,016,190 1.8%OTHER SECURITIES 3,765,519 0.2%
TOTAL SHORT-TERMINVESTMENTS (Cost $34,781,709) $ 34,781,709
Total Investments (Equity Income Trust)(Cost $1,430,862,705) – 102.5% $ 1,818,901,488 102.5%
Other assets and liabilities, net – (2.5%) (44,465,096) (2.5)%
TOTAL NET ASSETS – 100.0% $ 1,774,436,392 100.0%
Security Abbreviations and Legend(L) A portion of this security is on loan as of 6-30-17.(W) Investment is an affiliate of the fund, the advisor and/or subadvisor. This
security represents the investment of cash collateral received for securitieslending.
(Y) The rate shown is the annualized seven-day yield as of 6-30-17.
Financial Industries TrustShares orPrincipalAmount Value
% ofNet
Assets
COMMON STOCKS – 92.7%Financials – 89.1%1st Source Corp. 41,178 $ 1,974,073 0.9%Affiliated Managers Group, Inc. 20,448 3,391,505 1.5%Altamir 89,116 1,658,212 0.8%Ameris Bancorp 48,740 2,349,268 1.1%Aon PLC 28,480 3,786,416 1.7%Assured Guaranty, Ltd. 112,002 4,674,963 2.1%Bank of America Corp. 218,212 5,293,823 2.4%Bank of Ireland (I) 8,342,203 2,191,488 1.0%Bankinter SA 284,026 2,620,126 1.2%Berkshire Hathaway, Inc., Class B (I) 34,826 5,898,480 2.7%BNP Paribas SA 38,492 2,771,143 1.3%Capital One Financial Corp. 57,657 4,763,621 2.2%Chemical Financial Corp. 46,442 2,248,257 1.0%Chubb, Ltd. 40,223 5,847,619 2.6%Citigroup, Inc. 50,515 3,378,443 1.5%Citizens Financial Group, Inc. 155,990 5,565,723 2.5%Close Brothers Group PLC 98,253 1,932,604 0.9%CNO Financial Group, Inc. 166,675 3,480,174 1.6%Comerica, Inc. 77,032 5,641,824 2.5%Danske Bank A/S 122,774 4,723,492 2.1%Discover Financial Services 79,783 4,961,705 2.2%First Hawaiian, Inc. 53,186 1,628,555 0.7%
John Hancock Variable Insurance TrustSUMMARY PORTFOLIO OF INVESTMENTS — June 30, 2017 (unaudited) (showing percentage of total net assets)
Equity Income Trust (continued) Equity Income Trust (continued)
The accompanying notes are an integral part of the financial statements. 23
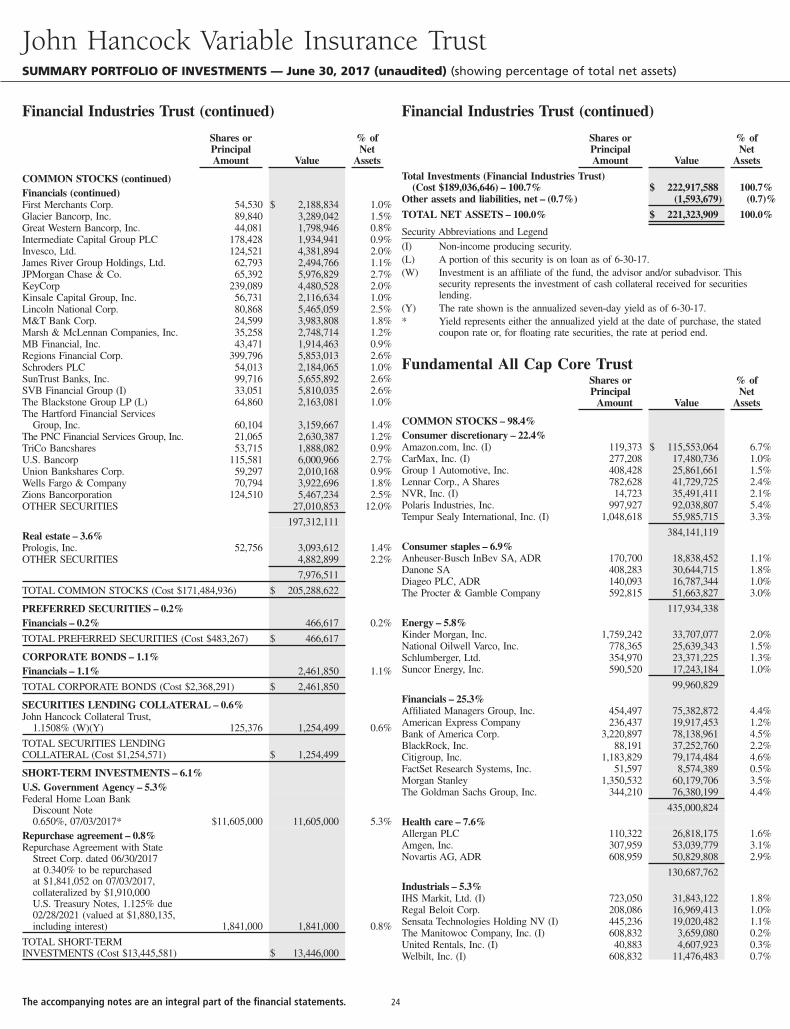
Shares orPrincipalAmount Value
% ofNet
Assets
COMMON STOCKS (continued)Financials (continued)First Merchants Corp. 54,530 $ 2,188,834 1.0%Glacier Bancorp, Inc. 89,840 3,289,042 1.5%Great Western Bancorp, Inc. 44,081 1,798,946 0.8%Intermediate Capital Group PLC 178,428 1,934,941 0.9%Invesco, Ltd. 124,521 4,381,894 2.0%James River Group Holdings, Ltd. 62,793 2,494,766 1.1%JPMorgan Chase & Co. 65,392 5,976,829 2.7%KeyCorp 239,089 4,480,528 2.0%Kinsale Capital Group, Inc. 56,731 2,116,634 1.0%Lincoln National Corp. 80,868 5,465,059 2.5%M&T Bank Corp. 24,599 3,983,808 1.8%Marsh & McLennan Companies, Inc. 35,258 2,748,714 1.2%MB Financial, Inc. 43,471 1,914,463 0.9%Regions Financial Corp. 399,796 5,853,013 2.6%Schroders PLC 54,013 2,184,065 1.0%SunTrust Banks, Inc. 99,716 5,655,892 2.6%SVB Financial Group (I) 33,051 5,810,035 2.6%The Blackstone Group LP (L) 64,860 2,163,081 1.0%The Hartford Financial Services
Group, Inc. 60,104 3,159,667 1.4%The PNC Financial Services Group, Inc. 21,065 2,630,387 1.2%TriCo Bancshares 53,715 1,888,082 0.9%U.S. Bancorp 115,581 6,000,966 2.7%Union Bankshares Corp. 59,297 2,010,168 0.9%Wells Fargo & Company 70,794 3,922,696 1.8%Zions Bancorporation 124,510 5,467,234 2.5%OTHER SECURITIES 27,010,853 12.0%
197,312,111Real estate – 3.6%Prologis, Inc. 52,756 3,093,612 1.4%OTHER SECURITIES 4,882,899 2.2%
7,976,511
TOTAL COMMON STOCKS (Cost $171,484,936) $ 205,288,622
PREFERRED SECURITIES – 0.2%Financials – 0.2% 466,617 0.2%
TOTAL PREFERRED SECURITIES (Cost $483,267) $ 466,617
CORPORATE BONDS – 1.1%Financials – 1.1% 2,461,850 1.1%
TOTAL CORPORATE BONDS (Cost $2,368,291) $ 2,461,850
SECURITIES LENDING COLLATERAL – 0.6%John Hancock Collateral Trust,
1.1508% (W)(Y) 125,376 1,254,499 0.6%
TOTAL SECURITIES LENDINGCOLLATERAL (Cost $1,254,571) $ 1,254,499
SHORT-TERM INVESTMENTS – 6.1%U.S. Government Agency – 5.3%Federal Home Loan Bank
Discount Note0.650%, 07/03/2017* $11,605,000 11,605,000 5.3%
Repurchase agreement – 0.8%Repurchase Agreement with State
Street Corp. dated 06/30/2017at 0.340% to be repurchasedat $1,841,052 on 07/03/2017,collateralized by $1,910,000U.S. Treasury Notes, 1.125% due02/28/2021 (valued at $1,880,135,including interest) 1,841,000 1,841,000 0.8%
TOTAL SHORT-TERMINVESTMENTS (Cost $13,445,581) $ 13,446,000
Shares orPrincipalAmount Value
% ofNet
Assets
Total Investments (Financial Industries Trust)(Cost $189,036,646) – 100.7% $ 222,917,588 100.7%
Other assets and liabilities, net – (0.7%) (1,593,679) (0.7)%
TOTAL NET ASSETS – 100.0% $ 221,323,909 100.0%
Security Abbreviations and Legend(I) Non-income producing security.(L) A portion of this security is on loan as of 6-30-17.(W) Investment is an affiliate of the fund, the advisor and/or subadvisor. This
security represents the investment of cash collateral received for securitieslending.
(Y) The rate shown is the annualized seven-day yield as of 6-30-17.* Yield represents either the annualized yield at the date of purchase, the stated
coupon rate or, for floating rate securities, the rate at period end.
Fundamental All Cap Core TrustShares orPrincipal
Amount Value
% ofNet
Assets
COMMON STOCKS – 98.4%Consumer discretionary – 22.4%Amazon.com, Inc. (I) 119,373 $ 115,553,064 6.7%CarMax, Inc. (I) 277,208 17,480,736 1.0%Group 1 Automotive, Inc. 408,428 25,861,661 1.5%Lennar Corp., A Shares 782,628 41,729,725 2.4%NVR, Inc. (I) 14,723 35,491,411 2.1%Polaris Industries, Inc. 997,927 92,038,807 5.4%Tempur Sealy International, Inc. (I) 1,048,618 55,985,715 3.3%
384,141,119Consumer staples – 6.9%Anheuser-Busch InBev SA, ADR 170,700 18,838,452 1.1%Danone SA 408,283 30,644,715 1.8%Diageo PLC, ADR 140,093 16,787,344 1.0%The Procter & Gamble Company 592,815 51,663,827 3.0%
117,934,338Energy – 5.8%Kinder Morgan, Inc. 1,759,242 33,707,077 2.0%National Oilwell Varco, Inc. 778,365 25,639,343 1.5%Schlumberger, Ltd. 354,970 23,371,225 1.3%Suncor Energy, Inc. 590,520 17,243,184 1.0%
99,960,829Financials – 25.3%Affiliated Managers Group, Inc. 454,497 75,382,872 4.4%American Express Company 236,437 19,917,453 1.2%Bank of America Corp. 3,220,897 78,138,961 4.5%BlackRock, Inc. 88,191 37,252,760 2.2%Citigroup, Inc. 1,183,829 79,174,484 4.6%FactSet Research Systems, Inc. 51,597 8,574,389 0.5%Morgan Stanley 1,350,532 60,179,706 3.5%The Goldman Sachs Group, Inc. 344,210 76,380,199 4.4%
435,000,824Health care – 7.6%Allergan PLC 110,322 26,818,175 1.6%Amgen, Inc. 307,959 53,039,779 3.1%Novartis AG, ADR 608,959 50,829,808 2.9%
130,687,762Industrials – 5.3%IHS Markit, Ltd. (I) 723,050 31,843,122 1.8%Regal Beloit Corp. 208,086 16,969,413 1.0%Sensata Technologies Holding NV (I) 445,236 19,020,482 1.1%The Manitowoc Company, Inc. (I) 608,832 3,659,080 0.2%United Rentals, Inc. (I) 40,883 4,607,923 0.3%Welbilt, Inc. (I) 608,832 11,476,483 0.7%
John Hancock Variable Insurance TrustSUMMARY PORTFOLIO OF INVESTMENTS — June 30, 2017 (unaudited) (showing percentage of total net assets)
Financial Industries Trust (continued) Financial Industries Trust (continued)
The accompanying notes are an integral part of the financial statements. 24
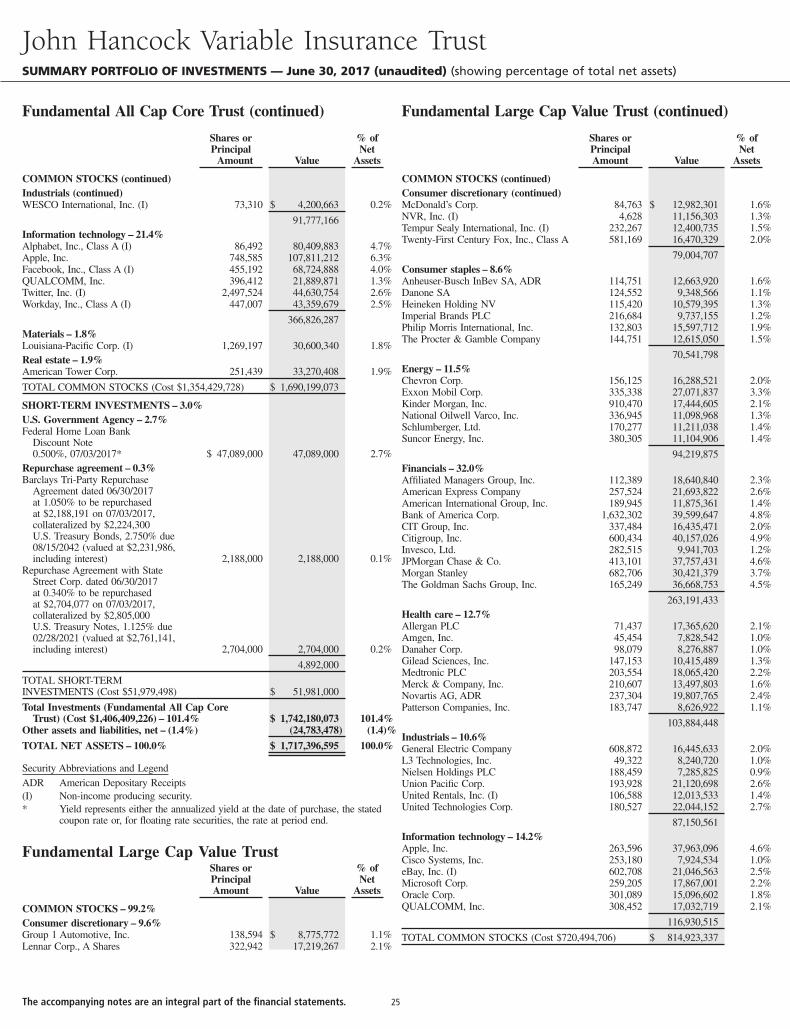
Shares orPrincipal
Amount Value
% ofNet
Assets
COMMON STOCKS (continued)Industrials (continued)WESCO International, Inc. (I) 73,310 $ 4,200,663 0.2%
91,777,166Information technology – 21.4%Alphabet, Inc., Class A (I) 86,492 80,409,883 4.7%Apple, Inc. 748,585 107,811,212 6.3%Facebook, Inc., Class A (I) 455,192 68,724,888 4.0%QUALCOMM, Inc. 396,412 21,889,871 1.3%Twitter, Inc. (I) 2,497,524 44,630,754 2.6%Workday, Inc., Class A (I) 447,007 43,359,679 2.5%
366,826,287Materials – 1.8%Louisiana-Pacific Corp. (I) 1,269,197 30,600,340 1.8%Real estate – 1.9%American Tower Corp. 251,439 33,270,408 1.9%
TOTAL COMMON STOCKS (Cost $1,354,429,728) $ 1,690,199,073
SHORT-TERM INVESTMENTS – 3.0%U.S. Government Agency – 2.7%Federal Home Loan Bank
Discount Note0.500%, 07/03/2017* $ 47,089,000 47,089,000 2.7%
Repurchase agreement – 0.3%Barclays Tri-Party Repurchase
Agreement dated 06/30/2017at 1.050% to be repurchasedat $2,188,191 on 07/03/2017,collateralized by $2,224,300U.S. Treasury Bonds, 2.750% due08/15/2042 (valued at $2,231,986,including interest) 2,188,000 2,188,000 0.1%
Repurchase Agreement with StateStreet Corp. dated 06/30/2017at 0.340% to be repurchasedat $2,704,077 on 07/03/2017,collateralized by $2,805,000U.S. Treasury Notes, 1.125% due02/28/2021 (valued at $2,761,141,including interest) 2,704,000 2,704,000 0.2%
4,892,000
TOTAL SHORT-TERMINVESTMENTS (Cost $51,979,498) $ 51,981,000
Total Investments (Fundamental All Cap CoreTrust) (Cost $1,406,409,226) – 101.4% $ 1,742,180,073 101.4%
Other assets and liabilities, net – (1.4%) (24,783,478) (1.4)%
TOTAL NET ASSETS – 100.0% $ 1,717,396,595 100.0%
Security Abbreviations and LegendADR American Depositary Receipts(I) Non-income producing security.* Yield represents either the annualized yield at the date of purchase, the stated
coupon rate or, for floating rate securities, the rate at period end.
Fundamental Large Cap Value TrustShares orPrincipalAmount Value
% ofNet
Assets
COMMON STOCKS – 99.2%Consumer discretionary – 9.6%Group 1 Automotive, Inc. 138,594 $ 8,775,772 1.1%Lennar Corp., A Shares 322,942 17,219,267 2.1%
Shares orPrincipalAmount Value
% ofNet
Assets
COMMON STOCKS (continued)Consumer discretionary (continued)McDonald’s Corp. 84,763 $ 12,982,301 1.6%NVR, Inc. (I) 4,628 11,156,303 1.3%Tempur Sealy International, Inc. (I) 232,267 12,400,735 1.5%Twenty-First Century Fox, Inc., Class A 581,169 16,470,329 2.0%
79,004,707Consumer staples – 8.6%Anheuser-Busch InBev SA, ADR 114,751 12,663,920 1.6%Danone SA 124,552 9,348,566 1.1%Heineken Holding NV 115,420 10,579,395 1.3%Imperial Brands PLC 216,684 9,737,155 1.2%Philip Morris International, Inc. 132,803 15,597,712 1.9%The Procter & Gamble Company 144,751 12,615,050 1.5%
70,541,798Energy – 11.5%Chevron Corp. 156,125 16,288,521 2.0%Exxon Mobil Corp. 335,338 27,071,837 3.3%Kinder Morgan, Inc. 910,470 17,444,605 2.1%National Oilwell Varco, Inc. 336,945 11,098,968 1.3%Schlumberger, Ltd. 170,277 11,211,038 1.4%Suncor Energy, Inc. 380,305 11,104,906 1.4%
94,219,875Financials – 32.0%Affiliated Managers Group, Inc. 112,389 18,640,840 2.3%American Express Company 257,524 21,693,822 2.6%American International Group, Inc. 189,945 11,875,361 1.4%Bank of America Corp. 1,632,302 39,599,647 4.8%CIT Group, Inc. 337,484 16,435,471 2.0%Citigroup, Inc. 600,434 40,157,026 4.9%Invesco, Ltd. 282,515 9,941,703 1.2%JPMorgan Chase & Co. 413,101 37,757,431 4.6%Morgan Stanley 682,706 30,421,379 3.7%The Goldman Sachs Group, Inc. 165,249 36,668,753 4.5%
263,191,433Health care – 12.7%Allergan PLC 71,437 17,365,620 2.1%Amgen, Inc. 45,454 7,828,542 1.0%Danaher Corp. 98,079 8,276,887 1.0%Gilead Sciences, Inc. 147,153 10,415,489 1.3%Medtronic PLC 203,554 18,065,420 2.2%Merck & Company, Inc. 210,607 13,497,803 1.6%Novartis AG, ADR 237,304 19,807,765 2.4%Patterson Companies, Inc. 183,747 8,626,922 1.1%
103,884,448Industrials – 10.6%General Electric Company 608,872 16,445,633 2.0%L3 Technologies, Inc. 49,322 8,240,720 1.0%Nielsen Holdings PLC 188,459 7,285,825 0.9%Union Pacific Corp. 193,928 21,120,698 2.6%United Rentals, Inc. (I) 106,588 12,013,533 1.4%United Technologies Corp. 180,527 22,044,152 2.7%
87,150,561Information technology – 14.2%Apple, Inc. 263,596 37,963,096 4.6%Cisco Systems, Inc. 253,180 7,924,534 1.0%eBay, Inc. (I) 602,708 21,046,563 2.5%Microsoft Corp. 259,205 17,867,001 2.2%Oracle Corp. 301,089 15,096,602 1.8%QUALCOMM, Inc. 308,452 17,032,719 2.1%
116,930,515
TOTAL COMMON STOCKS (Cost $720,494,706) $ 814,923,337
John Hancock Variable Insurance TrustSUMMARY PORTFOLIO OF INVESTMENTS — June 30, 2017 (unaudited) (showing percentage of total net assets)
Fundamental All Cap Core Trust (continued) Fundamental Large Cap Value Trust (continued)
The accompanying notes are an integral part of the financial statements. 25
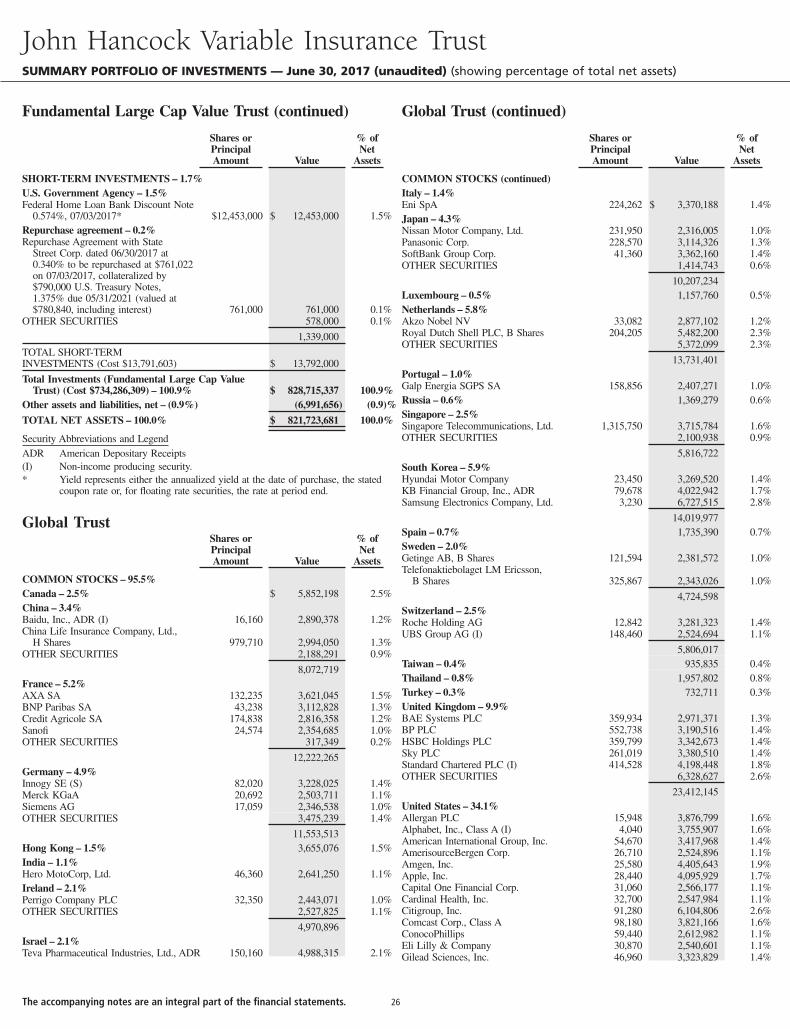
Shares orPrincipalAmount Value
% ofNet
Assets
SHORT-TERM INVESTMENTS – 1.7%U.S. Government Agency – 1.5%Federal Home Loan Bank Discount Note
0.574%, 07/03/2017* $12,453,000 $ 12,453,000 1.5%Repurchase agreement – 0.2%Repurchase Agreement with State
Street Corp. dated 06/30/2017 at0.340% to be repurchased at $761,022on 07/03/2017, collateralized by$790,000 U.S. Treasury Notes,1.375% due 05/31/2021 (valued at$780,840, including interest) 761,000 761,000 0.1%
OTHER SECURITIES 578,000 0.1%
1,339,000
TOTAL SHORT-TERMINVESTMENTS (Cost $13,791,603) $ 13,792,000
Total Investments (Fundamental Large Cap ValueTrust) (Cost $734,286,309) – 100.9% $ 828,715,337 100.9%
Other assets and liabilities, net – (0.9%) (6,991,656) (0.9)%
TOTAL NET ASSETS – 100.0% $ 821,723,681 100.0%
Security Abbreviations and LegendADR American Depositary Receipts(I) Non-income producing security.* Yield represents either the annualized yield at the date of purchase, the stated
coupon rate or, for floating rate securities, the rate at period end.
Global TrustShares orPrincipalAmount Value
% ofNet
Assets
COMMON STOCKS – 95.5%Canada – 2.5% $ 5,852,198 2.5%China – 3.4%Baidu, Inc., ADR (I) 16,160 2,890,378 1.2%China Life Insurance Company, Ltd.,
H Shares 979,710 2,994,050 1.3%OTHER SECURITIES 2,188,291 0.9%
8,072,719France – 5.2%AXA SA 132,235 3,621,045 1.5%BNP Paribas SA 43,238 3,112,828 1.3%Credit Agricole SA 174,838 2,816,358 1.2%Sanofi 24,574 2,354,685 1.0%OTHER SECURITIES 317,349 0.2%
12,222,265Germany – 4.9%Innogy SE (S) 82,020 3,228,025 1.4%Merck KGaA 20,692 2,503,711 1.1%Siemens AG 17,059 2,346,538 1.0%OTHER SECURITIES 3,475,239 1.4%
11,553,513Hong Kong – 1.5% 3,655,076 1.5%India – 1.1%Hero MotoCorp, Ltd. 46,360 2,641,250 1.1%Ireland – 2.1%Perrigo Company PLC 32,350 2,443,071 1.0%OTHER SECURITIES 2,527,825 1.1%
4,970,896Israel – 2.1%Teva Pharmaceutical Industries, Ltd., ADR 150,160 4,988,315 2.1%
Shares orPrincipalAmount Value
% ofNet
Assets
COMMON STOCKS (continued)Italy – 1.4%Eni SpA 224,262 $ 3,370,188 1.4%Japan – 4.3%Nissan Motor Company, Ltd. 231,950 2,316,005 1.0%Panasonic Corp. 228,570 3,114,326 1.3%SoftBank Group Corp. 41,360 3,362,160 1.4%OTHER SECURITIES 1,414,743 0.6%
10,207,234Luxembourg – 0.5% 1,157,760 0.5%Netherlands – 5.8%Akzo Nobel NV 33,082 2,877,102 1.2%Royal Dutch Shell PLC, B Shares 204,205 5,482,200 2.3%OTHER SECURITIES 5,372,099 2.3%
13,731,401Portugal – 1.0%Galp Energia SGPS SA 158,856 2,407,271 1.0%Russia – 0.6% 1,369,279 0.6%Singapore – 2.5%Singapore Telecommunications, Ltd. 1,315,750 3,715,784 1.6%OTHER SECURITIES 2,100,938 0.9%
5,816,722South Korea – 5.9%Hyundai Motor Company 23,450 3,269,520 1.4%KB Financial Group, Inc., ADR 79,678 4,022,942 1.7%Samsung Electronics Company, Ltd. 3,230 6,727,515 2.8%
14,019,977Spain – 0.7% 1,735,390 0.7%Sweden – 2.0%Getinge AB, B Shares 121,594 2,381,572 1.0%Telefonaktiebolaget LM Ericsson,
B Shares 325,867 2,343,026 1.0%
4,724,598Switzerland – 2.5%Roche Holding AG 12,842 3,281,323 1.4%UBS Group AG (I) 148,460 2,524,694 1.1%
5,806,017Taiwan – 0.4% 935,835 0.4%Thailand – 0.8% 1,957,802 0.8%Turkey – 0.3% 732,711 0.3%United Kingdom – 9.9%BAE Systems PLC 359,934 2,971,371 1.3%BP PLC 552,738 3,190,516 1.4%HSBC Holdings PLC 359,799 3,342,673 1.4%Sky PLC 261,019 3,380,510 1.4%Standard Chartered PLC (I) 414,528 4,198,448 1.8%OTHER SECURITIES 6,328,627 2.6%
23,412,145United States – 34.1%Allergan PLC 15,948 3,876,799 1.6%Alphabet, Inc., Class A (I) 4,040 3,755,907 1.6%American International Group, Inc. 54,670 3,417,968 1.4%AmerisourceBergen Corp. 26,710 2,524,896 1.1%Amgen, Inc. 25,580 4,405,643 1.9%Apple, Inc. 28,440 4,095,929 1.7%Capital One Financial Corp. 31,060 2,566,177 1.1%Cardinal Health, Inc. 32,700 2,547,984 1.1%Citigroup, Inc. 91,280 6,104,806 2.6%Comcast Corp., Class A 98,180 3,821,166 1.6%ConocoPhillips 59,440 2,612,982 1.1%Eli Lilly & Company 30,870 2,540,601 1.1%Gilead Sciences, Inc. 46,960 3,323,829 1.4%
John Hancock Variable Insurance TrustSUMMARY PORTFOLIO OF INVESTMENTS — June 30, 2017 (unaudited) (showing percentage of total net assets)
Fundamental Large Cap Value Trust (continued) Global Trust (continued)
The accompanying notes are an integral part of the financial statements. 26
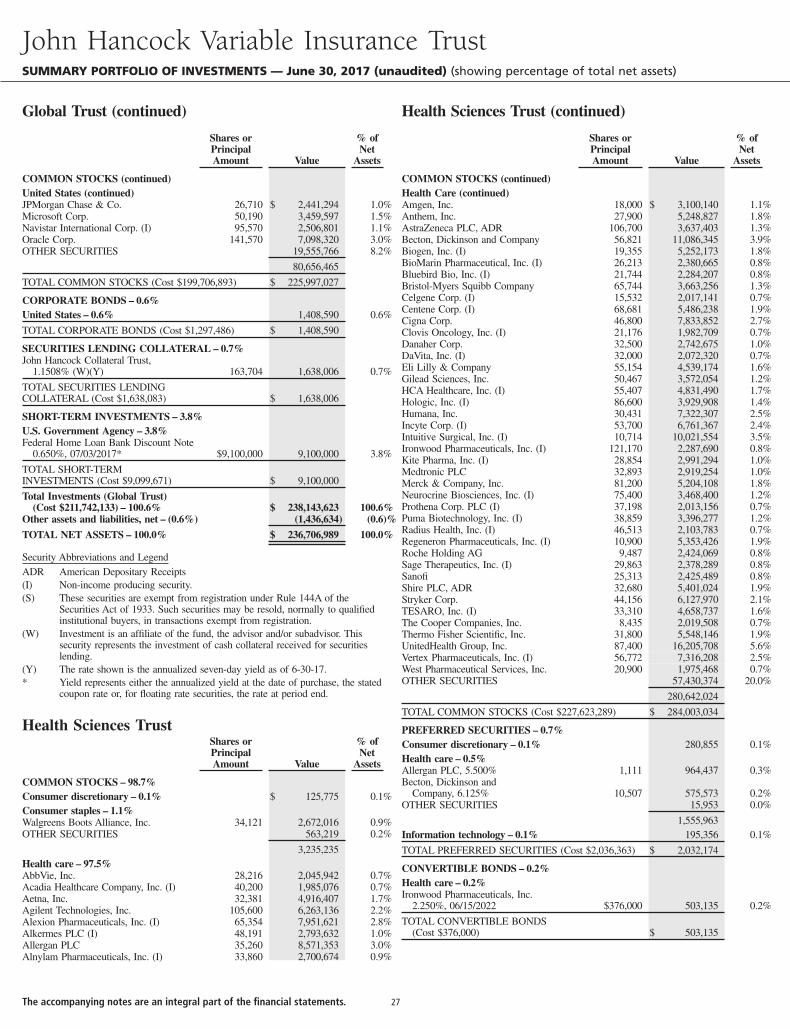
Shares orPrincipalAmount Value
% ofNet
Assets
COMMON STOCKS (continued)United States (continued)JPMorgan Chase & Co. 26,710 $ 2,441,294 1.0%Microsoft Corp. 50,190 3,459,597 1.5%Navistar International Corp. (I) 95,570 2,506,801 1.1%Oracle Corp. 141,570 7,098,320 3.0%OTHER SECURITIES 19,555,766 8.2%
80,656,465
TOTAL COMMON STOCKS (Cost $199,706,893) $ 225,997,027
CORPORATE BONDS – 0.6%United States – 0.6% 1,408,590 0.6%
TOTAL CORPORATE BONDS (Cost $1,297,486) $ 1,408,590
SECURITIES LENDING COLLATERAL – 0.7%John Hancock Collateral Trust,
1.1508% (W)(Y) 163,704 1,638,006 0.7%
TOTAL SECURITIES LENDINGCOLLATERAL (Cost $1,638,083) $ 1,638,006
SHORT-TERM INVESTMENTS – 3.8%U.S. Government Agency – 3.8%Federal Home Loan Bank Discount Note
0.650%, 07/03/2017* $9,100,000 9,100,000 3.8%
TOTAL SHORT-TERMINVESTMENTS (Cost $9,099,671) $ 9,100,000
Total Investments (Global Trust)(Cost $211,742,133) – 100.6% $ 238,143,623 100.6%
Other assets and liabilities, net – (0.6%) (1,436,634) (0.6)%
TOTAL NET ASSETS – 100.0% $ 236,706,989 100.0%
Security Abbreviations and LegendADR American Depositary Receipts(I) Non-income producing security.(S) These securities are exempt from registration under Rule 144A of the
Securities Act of 1933. Such securities may be resold, normally to qualifiedinstitutional buyers, in transactions exempt from registration.
(W) Investment is an affiliate of the fund, the advisor and/or subadvisor. Thissecurity represents the investment of cash collateral received for securitieslending.
(Y) The rate shown is the annualized seven-day yield as of 6-30-17.* Yield represents either the annualized yield at the date of purchase, the stated
coupon rate or, for floating rate securities, the rate at period end.
Health Sciences TrustShares orPrincipalAmount Value
% ofNet
Assets
COMMON STOCKS – 98.7%Consumer discretionary – 0.1% $ 125,775 0.1%Consumer staples – 1.1%Walgreens Boots Alliance, Inc. 34,121 2,672,016 0.9%OTHER SECURITIES 563,219 0.2%
3,235,235Health care – 97.5%AbbVie, Inc. 28,216 2,045,942 0.7%Acadia Healthcare Company, Inc. (I) 40,200 1,985,076 0.7%Aetna, Inc. 32,381 4,916,407 1.7%Agilent Technologies, Inc. 105,600 6,263,136 2.2%Alexion Pharmaceuticals, Inc. (I) 65,354 7,951,621 2.8%Alkermes PLC (I) 48,191 2,793,632 1.0%Allergan PLC 35,260 8,571,353 3.0%Alnylam Pharmaceuticals, Inc. (I) 33,860 2,700,674 0.9%
Shares orPrincipalAmount Value
% ofNet
Assets
COMMON STOCKS (continued)Health Care (continued)Amgen, Inc. 18,000 $ 3,100,140 1.1%Anthem, Inc. 27,900 5,248,827 1.8%AstraZeneca PLC, ADR 106,700 3,637,403 1.3%Becton, Dickinson and Company 56,821 11,086,345 3.9%Biogen, Inc. (I) 19,355 5,252,173 1.8%BioMarin Pharmaceutical, Inc. (I) 26,213 2,380,665 0.8%Bluebird Bio, Inc. (I) 21,744 2,284,207 0.8%Bristol-Myers Squibb Company 65,744 3,663,256 1.3%Celgene Corp. (I) 15,532 2,017,141 0.7%Centene Corp. (I) 68,681 5,486,238 1.9%Cigna Corp. 46,800 7,833,852 2.7%Clovis Oncology, Inc. (I) 21,176 1,982,709 0.7%Danaher Corp. 32,500 2,742,675 1.0%DaVita, Inc. (I) 32,000 2,072,320 0.7%Eli Lilly & Company 55,154 4,539,174 1.6%Gilead Sciences, Inc. 50,467 3,572,054 1.2%HCA Healthcare, Inc. (I) 55,407 4,831,490 1.7%Hologic, Inc. (I) 86,600 3,929,908 1.4%Humana, Inc. 30,431 7,322,307 2.5%Incyte Corp. (I) 53,700 6,761,367 2.4%Intuitive Surgical, Inc. (I) 10,714 10,021,554 3.5%Ironwood Pharmaceuticals, Inc. (I) 121,170 2,287,690 0.8%Kite Pharma, Inc. (I) 28,854 2,991,294 1.0%Medtronic PLC 32,893 2,919,254 1.0%Merck & Company, Inc. 81,200 5,204,108 1.8%Neurocrine Biosciences, Inc. (I) 75,400 3,468,400 1.2%Prothena Corp. PLC (I) 37,198 2,013,156 0.7%Puma Biotechnology, Inc. (I) 38,859 3,396,277 1.2%Radius Health, Inc. (I) 46,513 2,103,783 0.7%Regeneron Pharmaceuticals, Inc. (I) 10,900 5,353,426 1.9%Roche Holding AG 9,487 2,424,069 0.8%Sage Therapeutics, Inc. (I) 29,863 2,378,289 0.8%Sanofi 25,313 2,425,489 0.8%Shire PLC, ADR 32,680 5,401,024 1.9%Stryker Corp. 44,156 6,127,970 2.1%TESARO, Inc. (I) 33,310 4,658,737 1.6%The Cooper Companies, Inc. 8,435 2,019,508 0.7%Thermo Fisher Scientific, Inc. 31,800 5,548,146 1.9%UnitedHealth Group, Inc. 87,400 16,205,708 5.6%Vertex Pharmaceuticals, Inc. (I) 56,772 7,316,208 2.5%West Pharmaceutical Services, Inc. 20,900 1,975,468 0.7%OTHER SECURITIES 57,430,374 20.0%
280,642,024
TOTAL COMMON STOCKS (Cost $227,623,289) $ 284,003,034
PREFERRED SECURITIES – 0.7%Consumer discretionary – 0.1% 280,855 0.1%Health care – 0.5%Allergan PLC, 5.500% 1,111 964,437 0.3%Becton, Dickinson and
Company, 6.125% 10,507 575,573 0.2%OTHER SECURITIES 15,953 0.0%
1,555,963Information technology – 0.1% 195,356 0.1%
TOTAL PREFERRED SECURITIES (Cost $2,036,363) $ 2,032,174
CONVERTIBLE BONDS – 0.2%Health care – 0.2%Ironwood Pharmaceuticals, Inc.
2.250%, 06/15/2022 $376,000 503,135 0.2%
TOTAL CONVERTIBLE BONDS(Cost $376,000) $ 503,135
John Hancock Variable Insurance TrustSUMMARY PORTFOLIO OF INVESTMENTS — June 30, 2017 (unaudited) (showing percentage of total net assets)
Global Trust (continued) Health Sciences Trust (continued)
The accompanying notes are an integral part of the financial statements. 27
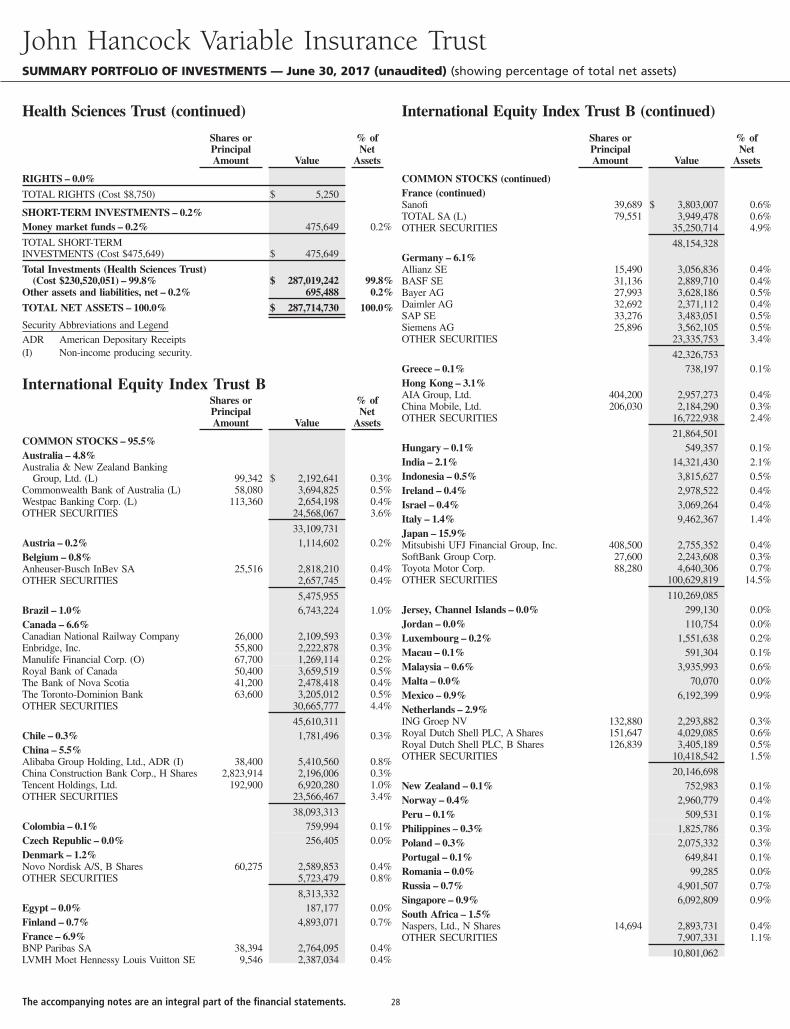
Shares orPrincipalAmount Value
% ofNet
Assets
RIGHTS – 0.0%
TOTAL RIGHTS (Cost $8,750) $ 5,250
SHORT-TERM INVESTMENTS – 0.2%Money market funds – 0.2% 475,649 0.2%
TOTAL SHORT-TERMINVESTMENTS (Cost $475,649) $ 475,649
Total Investments (Health Sciences Trust)(Cost $230,520,051) – 99.8% $ 287,019,242 99.8%
Other assets and liabilities, net – 0.2% 695,488 0.2%
TOTAL NET ASSETS – 100.0% $ 287,714,730 100.0%
Security Abbreviations and LegendADR American Depositary Receipts(I) Non-income producing security.
International Equity Index Trust BShares orPrincipalAmount Value
% ofNet
Assets
COMMON STOCKS – 95.5%Australia – 4.8%Australia & New Zealand Banking
Group, Ltd. (L) 99,342 $ 2,192,641 0.3%Commonwealth Bank of Australia (L) 58,080 3,694,825 0.5%Westpac Banking Corp. (L) 113,360 2,654,198 0.4%OTHER SECURITIES 24,568,067 3.6%
33,109,731Austria – 0.2% 1,114,602 0.2%Belgium – 0.8%Anheuser-Busch InBev SA 25,516 2,818,210 0.4%OTHER SECURITIES 2,657,745 0.4%
5,475,955Brazil – 1.0% 6,743,224 1.0%Canada – 6.6%Canadian National Railway Company 26,000 2,109,593 0.3%Enbridge, Inc. 55,800 2,222,878 0.3%Manulife Financial Corp. (O) 67,700 1,269,114 0.2%Royal Bank of Canada 50,400 3,659,519 0.5%The Bank of Nova Scotia 41,200 2,478,418 0.4%The Toronto-Dominion Bank 63,600 3,205,012 0.5%OTHER SECURITIES 30,665,777 4.4%
45,610,311Chile – 0.3% 1,781,496 0.3%China – 5.5%Alibaba Group Holding, Ltd., ADR (I) 38,400 5,410,560 0.8%China Construction Bank Corp., H Shares 2,823,914 2,196,006 0.3%Tencent Holdings, Ltd. 192,900 6,920,280 1.0%OTHER SECURITIES 23,566,467 3.4%
38,093,313Colombia – 0.1% 759,994 0.1%Czech Republic – 0.0% 256,405 0.0%Denmark – 1.2%Novo Nordisk A/S, B Shares 60,275 2,589,853 0.4%OTHER SECURITIES 5,723,479 0.8%
8,313,332Egypt – 0.0% 187,177 0.0%Finland – 0.7% 4,893,071 0.7%France – 6.9%BNP Paribas SA 38,394 2,764,095 0.4%LVMH Moet Hennessy Louis Vuitton SE 9,546 2,387,034 0.4%
Shares orPrincipalAmount Value
% ofNet
Assets
COMMON STOCKS (continued)France (continued)Sanofi 39,689 $ 3,803,007 0.6%TOTAL SA (L) 79,551 3,949,478 0.6%OTHER SECURITIES 35,250,714 4.9%
48,154,328Germany – 6.1%Allianz SE 15,490 3,056,836 0.4%BASF SE 31,136 2,889,710 0.4%Bayer AG 27,993 3,628,186 0.5%Daimler AG 32,692 2,371,112 0.4%SAP SE 33,276 3,483,051 0.5%Siemens AG 25,896 3,562,105 0.5%OTHER SECURITIES 23,335,753 3.4%
42,326,753Greece – 0.1% 738,197 0.1%Hong Kong – 3.1%AIA Group, Ltd. 404,200 2,957,273 0.4%China Mobile, Ltd. 206,030 2,184,290 0.3%OTHER SECURITIES 16,722,938 2.4%
21,864,501Hungary – 0.1% 549,357 0.1%India – 2.1% 14,321,430 2.1%Indonesia – 0.5% 3,815,627 0.5%Ireland – 0.4% 2,978,522 0.4%Israel – 0.4% 3,069,264 0.4%Italy – 1.4% 9,462,367 1.4%Japan – 15.9%Mitsubishi UFJ Financial Group, Inc. 408,500 2,755,352 0.4%SoftBank Group Corp. 27,600 2,243,608 0.3%Toyota Motor Corp. 88,280 4,640,306 0.7%OTHER SECURITIES 100,629,819 14.5%
110,269,085Jersey, Channel Islands – 0.0% 299,130 0.0%Jordan – 0.0% 110,754 0.0%Luxembourg – 0.2% 1,551,638 0.2%Macau – 0.1% 591,304 0.1%Malaysia – 0.6% 3,935,993 0.6%Malta – 0.0% 70,070 0.0%Mexico – 0.9% 6,192,399 0.9%Netherlands – 2.9%ING Groep NV 132,880 2,293,882 0.3%Royal Dutch Shell PLC, A Shares 151,647 4,029,085 0.6%Royal Dutch Shell PLC, B Shares 126,839 3,405,189 0.5%OTHER SECURITIES 10,418,542 1.5%
20,146,698New Zealand – 0.1% 752,983 0.1%Norway – 0.4% 2,960,779 0.4%Peru – 0.1% 509,531 0.1%Philippines – 0.3% 1,825,786 0.3%Poland – 0.3% 2,075,332 0.3%Portugal – 0.1% 649,841 0.1%Romania – 0.0% 99,285 0.0%Russia – 0.7% 4,901,507 0.7%Singapore – 0.9% 6,092,809 0.9%South Africa – 1.5%Naspers, Ltd., N Shares 14,694 2,893,731 0.4%OTHER SECURITIES 7,907,331 1.1%
10,801,062
John Hancock Variable Insurance TrustSUMMARY PORTFOLIO OF INVESTMENTS — June 30, 2017 (unaudited) (showing percentage of total net assets)
Health Sciences Trust (continued) International Equity Index Trust B (continued)
The accompanying notes are an integral part of the financial statements. 28
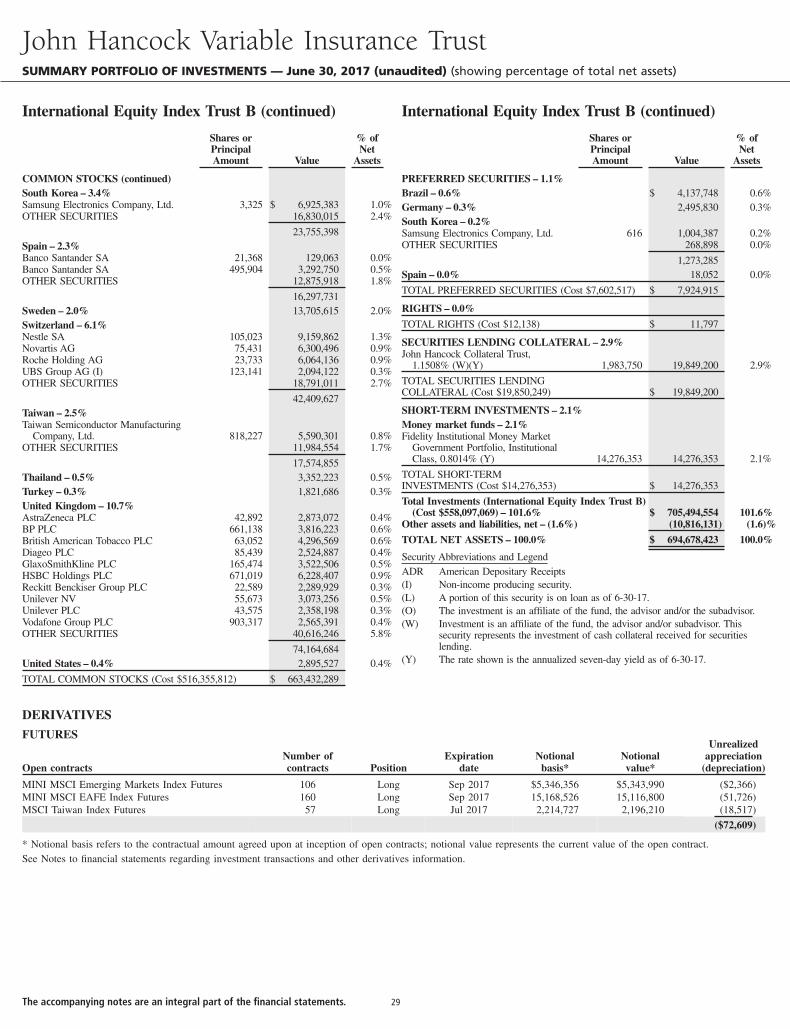
Shares orPrincipalAmount Value
% ofNet
Assets
COMMON STOCKS (continued)South Korea – 3.4%Samsung Electronics Company, Ltd. 3,325 $ 6,925,383 1.0%OTHER SECURITIES 16,830,015 2.4%
23,755,398Spain – 2.3%Banco Santander SA 21,368 129,063 0.0%Banco Santander SA 495,904 3,292,750 0.5%OTHER SECURITIES 12,875,918 1.8%
16,297,731Sweden – 2.0% 13,705,615 2.0%Switzerland – 6.1%Nestle SA 105,023 9,159,862 1.3%Novartis AG 75,431 6,300,496 0.9%Roche Holding AG 23,733 6,064,136 0.9%UBS Group AG (I) 123,141 2,094,122 0.3%OTHER SECURITIES 18,791,011 2.7%
42,409,627Taiwan – 2.5%Taiwan Semiconductor Manufacturing
Company, Ltd. 818,227 5,590,301 0.8%OTHER SECURITIES 11,984,554 1.7%
17,574,855Thailand – 0.5% 3,352,223 0.5%Turkey – 0.3% 1,821,686 0.3%United Kingdom – 10.7%AstraZeneca PLC 42,892 2,873,072 0.4%BP PLC 661,138 3,816,223 0.6%British American Tobacco PLC 63,052 4,296,569 0.6%Diageo PLC 85,439 2,524,887 0.4%GlaxoSmithKline PLC 165,474 3,522,506 0.5%HSBC Holdings PLC 671,019 6,228,407 0.9%Reckitt Benckiser Group PLC 22,589 2,289,929 0.3%Unilever NV 55,673 3,073,256 0.5%Unilever PLC 43,575 2,358,198 0.3%Vodafone Group PLC 903,317 2,565,391 0.4%OTHER SECURITIES 40,616,246 5.8%
74,164,684United States – 0.4% 2,895,527 0.4%
TOTAL COMMON STOCKS (Cost $516,355,812) $ 663,432,289
Shares orPrincipalAmount Value
% ofNet
Assets
PREFERRED SECURITIES – 1.1%Brazil – 0.6% $ 4,137,748 0.6%Germany – 0.3% 2,495,830 0.3%South Korea – 0.2%Samsung Electronics Company, Ltd. 616 1,004,387 0.2%OTHER SECURITIES 268,898 0.0%
1,273,285Spain – 0.0% 18,052 0.0%
TOTAL PREFERRED SECURITIES (Cost $7,602,517) $ 7,924,915
RIGHTS – 0.0%
TOTAL RIGHTS (Cost $12,138) $ 11,797
SECURITIES LENDING COLLATERAL – 2.9%John Hancock Collateral Trust,
1.1508% (W)(Y) 1,983,750 19,849,200 2.9%
TOTAL SECURITIES LENDINGCOLLATERAL (Cost $19,850,249) $ 19,849,200
SHORT-TERM INVESTMENTS – 2.1%Money market funds – 2.1%Fidelity Institutional Money Market
Government Portfolio, InstitutionalClass, 0.8014% (Y) 14,276,353 14,276,353 2.1%
TOTAL SHORT-TERMINVESTMENTS (Cost $14,276,353) $ 14,276,353
Total Investments (International Equity Index Trust B)(Cost $558,097,069) – 101.6% $ 705,494,554 101.6%
Other assets and liabilities, net – (1.6%) (10,816,131) (1.6)%
TOTAL NET ASSETS – 100.0% $ 694,678,423 100.0%
Security Abbreviations and LegendADR American Depositary Receipts(I) Non-income producing security.(L) A portion of this security is on loan as of 6-30-17.(O) The investment is an affiliate of the fund, the advisor and/or the subadvisor.(W) Investment is an affiliate of the fund, the advisor and/or subadvisor. This
security represents the investment of cash collateral received for securitieslending.
(Y) The rate shown is the annualized seven-day yield as of 6-30-17.
DERIVATIVESFUTURES
Open contractsNumber ofcontracts Position
Expirationdate
Notionalbasis*
Notionalvalue*
Unrealizedappreciation
(depreciation)
MINI MSCI Emerging Markets Index Futures 106 Long Sep 2017 $5,346,356 $5,343,990 ($2,366)MINI MSCI EAFE Index Futures 160 Long Sep 2017 15,168,526 15,116,800 (51,726)MSCI Taiwan Index Futures 57 Long Jul 2017 2,214,727 2,196,210 (18,517)
($72,609)
* Notional basis refers to the contractual amount agreed upon at inception of open contracts; notional value represents the current value of the open contract.See Notes to financial statements regarding investment transactions and other derivatives information.
John Hancock Variable Insurance TrustSUMMARY PORTFOLIO OF INVESTMENTS — June 30, 2017 (unaudited) (showing percentage of total net assets)
International Equity Index Trust B (continued) International Equity Index Trust B (continued)
The accompanying notes are an integral part of the financial statements. 29
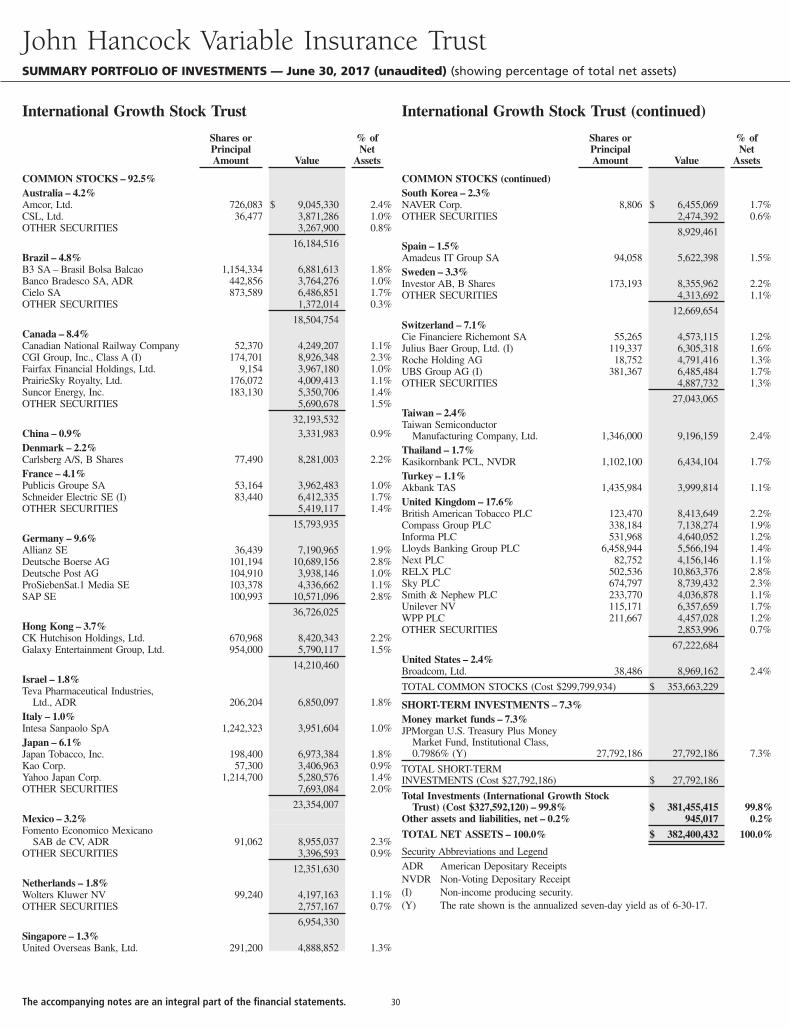
Shares orPrincipalAmount Value
% ofNet
Assets
COMMON STOCKS – 92.5%Australia – 4.2%Amcor, Ltd. 726,083 $ 9,045,330 2.4%CSL, Ltd. 36,477 3,871,286 1.0%OTHER SECURITIES 3,267,900 0.8%
16,184,516Brazil – 4.8%B3 SA – Brasil Bolsa Balcao 1,154,334 6,881,613 1.8%Banco Bradesco SA, ADR 442,856 3,764,276 1.0%Cielo SA 873,589 6,486,851 1.7%OTHER SECURITIES 1,372,014 0.3%
18,504,754Canada – 8.4%Canadian National Railway Company 52,370 4,249,207 1.1%CGI Group, Inc., Class A (I) 174,701 8,926,348 2.3%Fairfax Financial Holdings, Ltd. 9,154 3,967,180 1.0%PrairieSky Royalty, Ltd. 176,072 4,009,413 1.1%Suncor Energy, Inc. 183,130 5,350,706 1.4%OTHER SECURITIES 5,690,678 1.5%
32,193,532China – 0.9% 3,331,983 0.9%Denmark – 2.2%Carlsberg A/S, B Shares 77,490 8,281,003 2.2%France – 4.1%Publicis Groupe SA 53,164 3,962,483 1.0%Schneider Electric SE (I) 83,440 6,412,335 1.7%OTHER SECURITIES 5,419,117 1.4%
15,793,935Germany – 9.6%Allianz SE 36,439 7,190,965 1.9%Deutsche Boerse AG 101,194 10,689,156 2.8%Deutsche Post AG 104,910 3,938,146 1.0%ProSiebenSat.1 Media SE 103,378 4,336,662 1.1%SAP SE 100,993 10,571,096 2.8%
36,726,025Hong Kong – 3.7%CK Hutchison Holdings, Ltd. 670,968 8,420,343 2.2%Galaxy Entertainment Group, Ltd. 954,000 5,790,117 1.5%
14,210,460Israel – 1.8%Teva Pharmaceutical Industries,
Ltd., ADR 206,204 6,850,097 1.8%Italy – 1.0%Intesa Sanpaolo SpA 1,242,323 3,951,604 1.0%Japan – 6.1%Japan Tobacco, Inc. 198,400 6,973,384 1.8%Kao Corp. 57,300 3,406,963 0.9%Yahoo Japan Corp. 1,214,700 5,280,576 1.4%OTHER SECURITIES 7,693,084 2.0%
23,354,007Mexico – 3.2%Fomento Economico Mexicano
SAB de CV, ADR 91,062 8,955,037 2.3%OTHER SECURITIES 3,396,593 0.9%
12,351,630Netherlands – 1.8%Wolters Kluwer NV 99,240 4,197,163 1.1%OTHER SECURITIES 2,757,167 0.7%
6,954,330Singapore – 1.3%United Overseas Bank, Ltd. 291,200 4,888,852 1.3%
Shares orPrincipalAmount Value
% ofNet
Assets
COMMON STOCKS (continued)South Korea – 2.3%NAVER Corp. 8,806 $ 6,455,069 1.7%OTHER SECURITIES 2,474,392 0.6%
8,929,461Spain – 1.5%Amadeus IT Group SA 94,058 5,622,398 1.5%Sweden – 3.3%Investor AB, B Shares 173,193 8,355,962 2.2%OTHER SECURITIES 4,313,692 1.1%
12,669,654Switzerland – 7.1%Cie Financiere Richemont SA 55,265 4,573,115 1.2%Julius Baer Group, Ltd. (I) 119,337 6,305,318 1.6%Roche Holding AG 18,752 4,791,416 1.3%UBS Group AG (I) 381,367 6,485,484 1.7%OTHER SECURITIES 4,887,732 1.3%
27,043,065Taiwan – 2.4%Taiwan Semiconductor
Manufacturing Company, Ltd. 1,346,000 9,196,159 2.4%Thailand – 1.7%Kasikornbank PCL, NVDR 1,102,100 6,434,104 1.7%Turkey – 1.1%Akbank TAS 1,435,984 3,999,814 1.1%United Kingdom – 17.6%British American Tobacco PLC 123,470 8,413,649 2.2%Compass Group PLC 338,184 7,138,274 1.9%Informa PLC 531,968 4,640,052 1.2%Lloyds Banking Group PLC 6,458,944 5,566,194 1.4%Next PLC 82,752 4,156,146 1.1%RELX PLC 502,536 10,863,376 2.8%Sky PLC 674,797 8,739,432 2.3%Smith & Nephew PLC 233,770 4,036,878 1.1%Unilever NV 115,171 6,357,659 1.7%WPP PLC 211,667 4,457,028 1.2%OTHER SECURITIES 2,853,996 0.7%
67,222,684United States – 2.4%Broadcom, Ltd. 38,486 8,969,162 2.4%
TOTAL COMMON STOCKS (Cost $299,799,934) $ 353,663,229
SHORT-TERM INVESTMENTS – 7.3%Money market funds – 7.3%JPMorgan U.S. Treasury Plus Money
Market Fund, Institutional Class,0.7986% (Y) 27,792,186 27,792,186 7.3%
TOTAL SHORT-TERMINVESTMENTS (Cost $27,792,186) $ 27,792,186
Total Investments (International Growth StockTrust) (Cost $327,592,120) – 99.8% $ 381,455,415 99.8%
Other assets and liabilities, net – 0.2% 945,017 0.2%
TOTAL NET ASSETS – 100.0% $ 382,400,432 100.0%
Security Abbreviations and LegendADR American Depositary ReceiptsNVDR Non-Voting Depositary Receipt(I) Non-income producing security.(Y) The rate shown is the annualized seven-day yield as of 6-30-17.
John Hancock Variable Insurance TrustSUMMARY PORTFOLIO OF INVESTMENTS — June 30, 2017 (unaudited) (showing percentage of total net assets)
International Growth Stock Trust International Growth Stock Trust (continued)
The accompanying notes are an integral part of the financial statements. 30
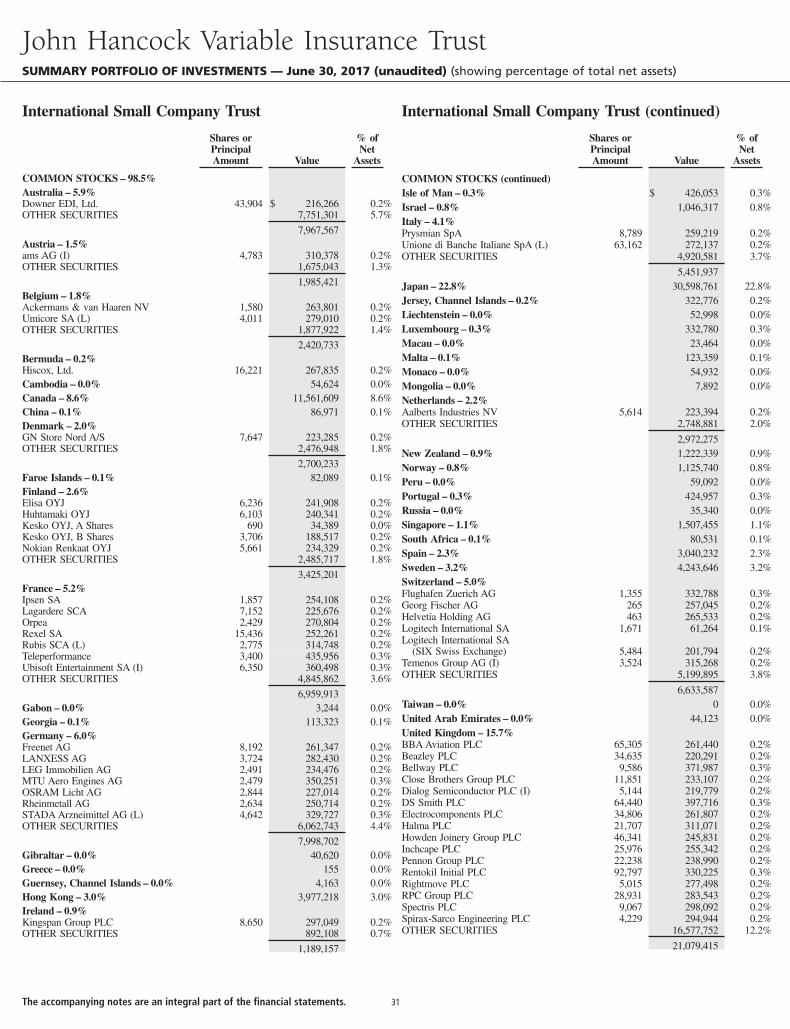
Shares orPrincipalAmount Value
% ofNet
Assets
COMMON STOCKS – 98.5%Australia – 5.9%Downer EDI, Ltd. 43,904 $ 216,266 0.2%OTHER SECURITIES 7,751,301 5.7%
7,967,567Austria – 1.5%ams AG (I) 4,783 310,378 0.2%OTHER SECURITIES 1,675,043 1.3%
1,985,421Belgium – 1.8%Ackermans & van Haaren NV 1,580 263,801 0.2%Umicore SA (L) 4,011 279,010 0.2%OTHER SECURITIES 1,877,922 1.4%
2,420,733Bermuda – 0.2%Hiscox, Ltd. 16,221 267,835 0.2%Cambodia – 0.0% 54,624 0.0%Canada – 8.6% 11,561,609 8.6%China – 0.1% 86,971 0.1%Denmark – 2.0%GN Store Nord A/S 7,647 223,285 0.2%OTHER SECURITIES 2,476,948 1.8%
2,700,233Faroe Islands – 0.1% 82,089 0.1%Finland – 2.6%Elisa OYJ 6,236 241,908 0.2%Huhtamaki OYJ 6,103 240,341 0.2%Kesko OYJ, A Shares 690 34,389 0.0%Kesko OYJ, B Shares 3,706 188,517 0.2%Nokian Renkaat OYJ 5,661 234,329 0.2%OTHER SECURITIES 2,485,717 1.8%
3,425,201France – 5.2%Ipsen SA 1,857 254,108 0.2%Lagardere SCA 7,152 225,676 0.2%Orpea 2,429 270,804 0.2%Rexel SA 15,436 252,261 0.2%Rubis SCA (L) 2,775 314,748 0.2%Teleperformance 3,400 435,956 0.3%Ubisoft Entertainment SA (I) 6,350 360,498 0.3%OTHER SECURITIES 4,845,862 3.6%
6,959,913Gabon – 0.0% 3,244 0.0%Georgia – 0.1% 113,323 0.1%Germany – 6.0%Freenet AG 8,192 261,347 0.2%LANXESS AG 3,724 282,430 0.2%LEG Immobilien AG 2,491 234,476 0.2%MTU Aero Engines AG 2,479 350,251 0.3%OSRAM Licht AG 2,844 227,014 0.2%Rheinmetall AG 2,634 250,714 0.2%STADA Arzneimittel AG (L) 4,642 329,727 0.3%OTHER SECURITIES 6,062,743 4.4%
7,998,702Gibraltar – 0.0% 40,620 0.0%Greece – 0.0% 155 0.0%Guernsey, Channel Islands – 0.0% 4,163 0.0%Hong Kong – 3.0% 3,977,218 3.0%Ireland – 0.9%Kingspan Group PLC 8,650 297,049 0.2%OTHER SECURITIES 892,108 0.7%
1,189,157
Shares orPrincipalAmount Value
% ofNet
Assets
COMMON STOCKS (continued)Isle of Man – 0.3% $ 426,053 0.3%Israel – 0.8% 1,046,317 0.8%Italy – 4.1%Prysmian SpA 8,789 259,219 0.2%Unione di Banche Italiane SpA (L) 63,162 272,137 0.2%OTHER SECURITIES 4,920,581 3.7%
5,451,937Japan – 22.8% 30,598,761 22.8%Jersey, Channel Islands – 0.2% 322,776 0.2%Liechtenstein – 0.0% 52,998 0.0%Luxembourg – 0.3% 332,780 0.3%Macau – 0.0% 23,464 0.0%Malta – 0.1% 123,359 0.1%Monaco – 0.0% 54,932 0.0%Mongolia – 0.0% 7,892 0.0%Netherlands – 2.2%Aalberts Industries NV 5,614 223,394 0.2%OTHER SECURITIES 2,748,881 2.0%
2,972,275New Zealand – 0.9% 1,222,339 0.9%Norway – 0.8% 1,125,740 0.8%Peru – 0.0% 59,092 0.0%Portugal – 0.3% 424,957 0.3%Russia – 0.0% 35,340 0.0%Singapore – 1.1% 1,507,455 1.1%South Africa – 0.1% 80,531 0.1%Spain – 2.3% 3,040,232 2.3%Sweden – 3.2% 4,243,646 3.2%Switzerland – 5.0%Flughafen Zuerich AG 1,355 332,788 0.3%Georg Fischer AG 265 257,045 0.2%Helvetia Holding AG 463 265,533 0.2%Logitech International SA 1,671 61,264 0.1%Logitech International SA
(SIX Swiss Exchange) 5,484 201,794 0.2%Temenos Group AG (I) 3,524 315,268 0.2%OTHER SECURITIES 5,199,895 3.8%
6,633,587Taiwan – 0.0% 0 0.0%United Arab Emirates – 0.0% 44,123 0.0%United Kingdom – 15.7%BBA Aviation PLC 65,305 261,440 0.2%Beazley PLC 34,635 220,291 0.2%Bellway PLC 9,586 371,987 0.3%Close Brothers Group PLC 11,851 233,107 0.2%Dialog Semiconductor PLC (I) 5,144 219,779 0.2%DS Smith PLC 64,440 397,716 0.3%Electrocomponents PLC 34,806 261,807 0.2%Halma PLC 21,707 311,071 0.2%Howden Joinery Group PLC 46,341 245,831 0.2%Inchcape PLC 25,976 255,342 0.2%Pennon Group PLC 22,238 238,990 0.2%Rentokil Initial PLC 92,797 330,225 0.3%Rightmove PLC 5,015 277,498 0.2%RPC Group PLC 28,931 283,543 0.2%Spectris PLC 9,067 298,092 0.2%Spirax-Sarco Engineering PLC 4,229 294,944 0.2%OTHER SECURITIES 16,577,752 12.2%
21,079,415
John Hancock Variable Insurance TrustSUMMARY PORTFOLIO OF INVESTMENTS — June 30, 2017 (unaudited) (showing percentage of total net assets)
International Small Company Trust International Small Company Trust (continued)
The accompanying notes are an integral part of the financial statements. 31
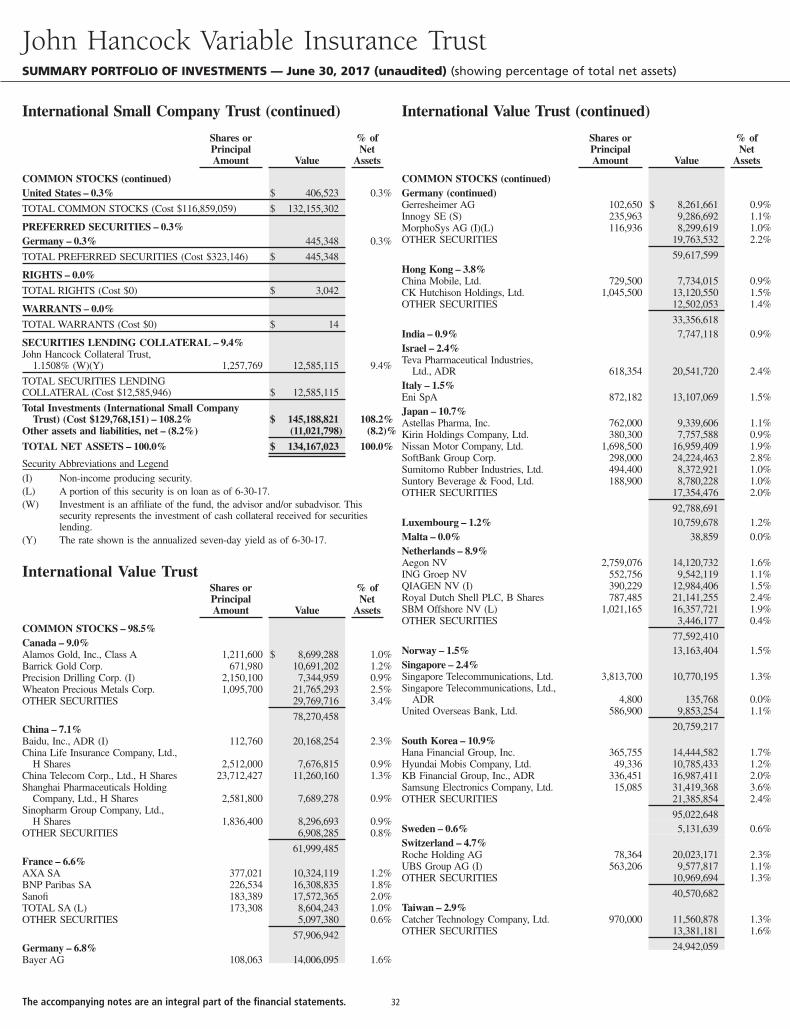
Shares orPrincipalAmount Value
% ofNet
Assets
COMMON STOCKS (continued)United States – 0.3% $ 406,523 0.3%
TOTAL COMMON STOCKS (Cost $116,859,059) $ 132,155,302
PREFERRED SECURITIES – 0.3%Germany – 0.3% 445,348 0.3%
TOTAL PREFERRED SECURITIES (Cost $323,146) $ 445,348
RIGHTS – 0.0%
TOTAL RIGHTS (Cost $0) $ 3,042
WARRANTS – 0.0%
TOTAL WARRANTS (Cost $0) $ 14
SECURITIES LENDING COLLATERAL – 9.4%John Hancock Collateral Trust,
1.1508% (W)(Y) 1,257,769 12,585,115 9.4%
TOTAL SECURITIES LENDINGCOLLATERAL (Cost $12,585,946) $ 12,585,115
Total Investments (International Small CompanyTrust) (Cost $129,768,151) – 108.2% $ 145,188,821 108.2%
Other assets and liabilities, net – (8.2%) (11,021,798) (8.2)%
TOTAL NET ASSETS – 100.0% $ 134,167,023 100.0%
Security Abbreviations and Legend(I) Non-income producing security.(L) A portion of this security is on loan as of 6-30-17.(W) Investment is an affiliate of the fund, the advisor and/or subadvisor. This
security represents the investment of cash collateral received for securitieslending.
(Y) The rate shown is the annualized seven-day yield as of 6-30-17.
International Value TrustShares orPrincipalAmount Value
% ofNet
Assets
COMMON STOCKS – 98.5%Canada – 9.0%Alamos Gold, Inc., Class A 1,211,600 $ 8,699,288 1.0%Barrick Gold Corp. 671,980 10,691,202 1.2%Precision Drilling Corp. (I) 2,150,100 7,344,959 0.9%Wheaton Precious Metals Corp. 1,095,700 21,765,293 2.5%OTHER SECURITIES 29,769,716 3.4%
78,270,458China – 7.1%Baidu, Inc., ADR (I) 112,760 20,168,254 2.3%China Life Insurance Company, Ltd.,
H Shares 2,512,000 7,676,815 0.9%China Telecom Corp., Ltd., H Shares 23,712,427 11,260,160 1.3%Shanghai Pharmaceuticals Holding
Company, Ltd., H Shares 2,581,800 7,689,278 0.9%Sinopharm Group Company, Ltd.,
H Shares 1,836,400 8,296,693 0.9%OTHER SECURITIES 6,908,285 0.8%
61,999,485France – 6.6%AXA SA 377,021 10,324,119 1.2%BNP Paribas SA 226,534 16,308,835 1.8%Sanofi 183,389 17,572,365 2.0%TOTAL SA (L) 173,308 8,604,243 1.0%OTHER SECURITIES 5,097,380 0.6%
57,906,942Germany – 6.8%Bayer AG 108,063 14,006,095 1.6%
Shares orPrincipalAmount Value
% ofNet
Assets
COMMON STOCKS (continued)Germany (continued)Gerresheimer AG 102,650 $ 8,261,661 0.9%Innogy SE (S) 235,963 9,286,692 1.1%MorphoSys AG (I)(L) 116,936 8,299,619 1.0%OTHER SECURITIES 19,763,532 2.2%
59,617,599Hong Kong – 3.8%China Mobile, Ltd. 729,500 7,734,015 0.9%CK Hutchison Holdings, Ltd. 1,045,500 13,120,550 1.5%OTHER SECURITIES 12,502,053 1.4%
33,356,618India – 0.9% 7,747,118 0.9%Israel – 2.4%Teva Pharmaceutical Industries,
Ltd., ADR 618,354 20,541,720 2.4%Italy – 1.5%Eni SpA 872,182 13,107,069 1.5%Japan – 10.7%Astellas Pharma, Inc. 762,000 9,339,606 1.1%Kirin Holdings Company, Ltd. 380,300 7,757,588 0.9%Nissan Motor Company, Ltd. 1,698,500 16,959,409 1.9%SoftBank Group Corp. 298,000 24,224,463 2.8%Sumitomo Rubber Industries, Ltd. 494,400 8,372,921 1.0%Suntory Beverage & Food, Ltd. 188,900 8,780,228 1.0%OTHER SECURITIES 17,354,476 2.0%
92,788,691Luxembourg – 1.2% 10,759,678 1.2%Malta – 0.0% 38,859 0.0%Netherlands – 8.9%Aegon NV 2,759,076 14,120,732 1.6%ING Groep NV 552,756 9,542,119 1.1%QIAGEN NV (I) 390,229 12,984,406 1.5%Royal Dutch Shell PLC, B Shares 787,485 21,141,255 2.4%SBM Offshore NV (L) 1,021,165 16,357,721 1.9%OTHER SECURITIES 3,446,177 0.4%
77,592,410Norway – 1.5% 13,163,404 1.5%Singapore – 2.4%Singapore Telecommunications, Ltd. 3,813,700 10,770,195 1.3%Singapore Telecommunications, Ltd.,
ADR 4,800 135,768 0.0%United Overseas Bank, Ltd. 586,900 9,853,254 1.1%
20,759,217South Korea – 10.9%Hana Financial Group, Inc. 365,755 14,444,582 1.7%Hyundai Mobis Company, Ltd. 49,336 10,785,433 1.2%KB Financial Group, Inc., ADR 336,451 16,987,411 2.0%Samsung Electronics Company, Ltd. 15,085 31,419,368 3.6%OTHER SECURITIES 21,385,854 2.4%
95,022,648Sweden – 0.6% 5,131,639 0.6%Switzerland – 4.7%Roche Holding AG 78,364 20,023,171 2.3%UBS Group AG (I) 563,206 9,577,817 1.1%OTHER SECURITIES 10,969,694 1.3%
40,570,682Taiwan – 2.9%Catcher Technology Company, Ltd. 970,000 11,560,878 1.3%OTHER SECURITIES 13,381,181 1.6%
24,942,059
John Hancock Variable Insurance TrustSUMMARY PORTFOLIO OF INVESTMENTS — June 30, 2017 (unaudited) (showing percentage of total net assets)
International Small Company Trust (continued) International Value Trust (continued)
The accompanying notes are an integral part of the financial statements. 32
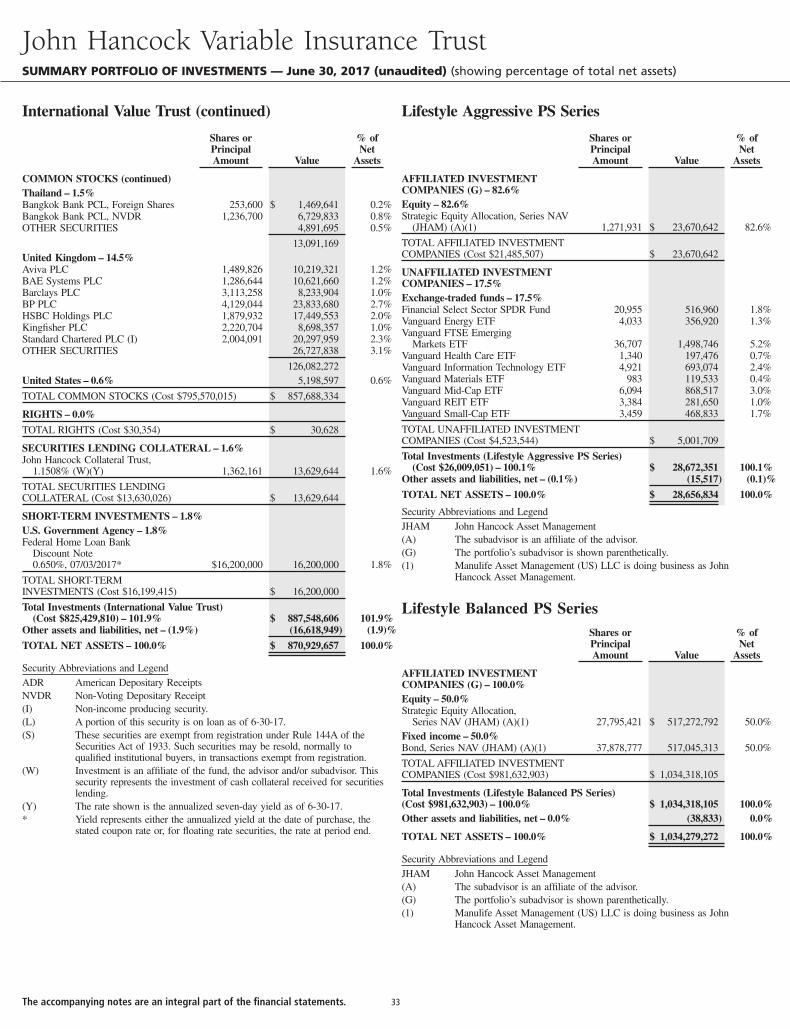
Shares orPrincipalAmount Value
% ofNet
Assets
COMMON STOCKS (continued)Thailand – 1.5%Bangkok Bank PCL, Foreign Shares 253,600 $ 1,469,641 0.2%Bangkok Bank PCL, NVDR 1,236,700 6,729,833 0.8%OTHER SECURITIES 4,891,695 0.5%
13,091,169United Kingdom – 14.5%Aviva PLC 1,489,826 10,219,321 1.2%BAE Systems PLC 1,286,644 10,621,660 1.2%Barclays PLC 3,113,258 8,233,904 1.0%BP PLC 4,129,044 23,833,680 2.7%HSBC Holdings PLC 1,879,932 17,449,553 2.0%Kingfisher PLC 2,220,704 8,698,357 1.0%Standard Chartered PLC (I) 2,004,091 20,297,959 2.3%OTHER SECURITIES 26,727,838 3.1%
126,082,272United States – 0.6% 5,198,597 0.6%
TOTAL COMMON STOCKS (Cost $795,570,015) $ 857,688,334
RIGHTS – 0.0%
TOTAL RIGHTS (Cost $30,354) $ 30,628
SECURITIES LENDING COLLATERAL – 1.6%John Hancock Collateral Trust,
1.1508% (W)(Y) 1,362,161 13,629,644 1.6%
TOTAL SECURITIES LENDINGCOLLATERAL (Cost $13,630,026) $ 13,629,644
SHORT-TERM INVESTMENTS – 1.8%U.S. Government Agency – 1.8%Federal Home Loan Bank
Discount Note0.650%, 07/03/2017* $16,200,000 16,200,000 1.8%
TOTAL SHORT-TERMINVESTMENTS (Cost $16,199,415) $ 16,200,000
Total Investments (International Value Trust)(Cost $825,429,810) – 101.9% $ 887,548,606 101.9%
Other assets and liabilities, net – (1.9%) (16,618,949) (1.9)%
TOTAL NET ASSETS – 100.0% $ 870,929,657 100.0%
Security Abbreviations and LegendADR American Depositary ReceiptsNVDR Non-Voting Depositary Receipt(I) Non-income producing security.(L) A portion of this security is on loan as of 6-30-17.(S) These securities are exempt from registration under Rule 144A of the
Securities Act of 1933. Such securities may be resold, normally toqualified institutional buyers, in transactions exempt from registration.
(W) Investment is an affiliate of the fund, the advisor and/or subadvisor. Thissecurity represents the investment of cash collateral received for securitieslending.
(Y) The rate shown is the annualized seven-day yield as of 6-30-17.* Yield represents either the annualized yield at the date of purchase, the
stated coupon rate or, for floating rate securities, the rate at period end.
Shares orPrincipalAmount Value
% ofNet
Assets
AFFILIATED INVESTMENTCOMPANIES (G) – 82.6%Equity – 82.6%Strategic Equity Allocation, Series NAV
(JHAM) (A)(1) 1,271,931 $ 23,670,642 82.6%
TOTAL AFFILIATED INVESTMENTCOMPANIES (Cost $21,485,507) $ 23,670,642
UNAFFILIATED INVESTMENTCOMPANIES – 17.5%Exchange-traded funds – 17.5%Financial Select Sector SPDR Fund 20,955 516,960 1.8%Vanguard Energy ETF 4,033 356,920 1.3%Vanguard FTSE Emerging
Markets ETF 36,707 1,498,746 5.2%Vanguard Health Care ETF 1,340 197,476 0.7%Vanguard Information Technology ETF 4,921 693,074 2.4%Vanguard Materials ETF 983 119,533 0.4%Vanguard Mid-Cap ETF 6,094 868,517 3.0%Vanguard REIT ETF 3,384 281,650 1.0%Vanguard Small-Cap ETF 3,459 468,833 1.7%
TOTAL UNAFFILIATED INVESTMENTCOMPANIES (Cost $4,523,544) $ 5,001,709
Total Investments (Lifestyle Aggressive PS Series)(Cost $26,009,051) – 100.1% $ 28,672,351 100.1%
Other assets and liabilities, net – (0.1%) (15,517) (0.1)%
TOTAL NET ASSETS – 100.0% $ 28,656,834 100.0%
Security Abbreviations and LegendJHAM John Hancock Asset Management(A) The subadvisor is an affiliate of the advisor.(G) The portfolio’s subadvisor is shown parenthetically.(1) Manulife Asset Management (US) LLC is doing business as John
Hancock Asset Management.
Lifestyle Balanced PS SeriesShares orPrincipalAmount Value
% ofNet
Assets
AFFILIATED INVESTMENTCOMPANIES (G) – 100.0%Equity – 50.0%Strategic Equity Allocation,
Series NAV (JHAM) (A)(1) 27,795,421 $ 517,272,792 50.0%Fixed income – 50.0%Bond, Series NAV (JHAM) (A)(1) 37,878,777 517,045,313 50.0%
TOTAL AFFILIATED INVESTMENTCOMPANIES (Cost $981,632,903) $ 1,034,318,105
Total Investments (Lifestyle Balanced PS Series)(Cost $981,632,903) – 100.0% $ 1,034,318,105 100.0%Other assets and liabilities, net – 0.0% (38,833) 0.0%
TOTAL NET ASSETS – 100.0% $ 1,034,279,272 100.0%
Security Abbreviations and LegendJHAM John Hancock Asset Management(A) The subadvisor is an affiliate of the advisor.(G) The portfolio’s subadvisor is shown parenthetically.(1) Manulife Asset Management (US) LLC is doing business as John
Hancock Asset Management.
John Hancock Variable Insurance TrustSUMMARY PORTFOLIO OF INVESTMENTS — June 30, 2017 (unaudited) (showing percentage of total net assets)
International Value Trust (continued) Lifestyle Aggressive PS Series
The accompanying notes are an integral part of the financial statements. 33
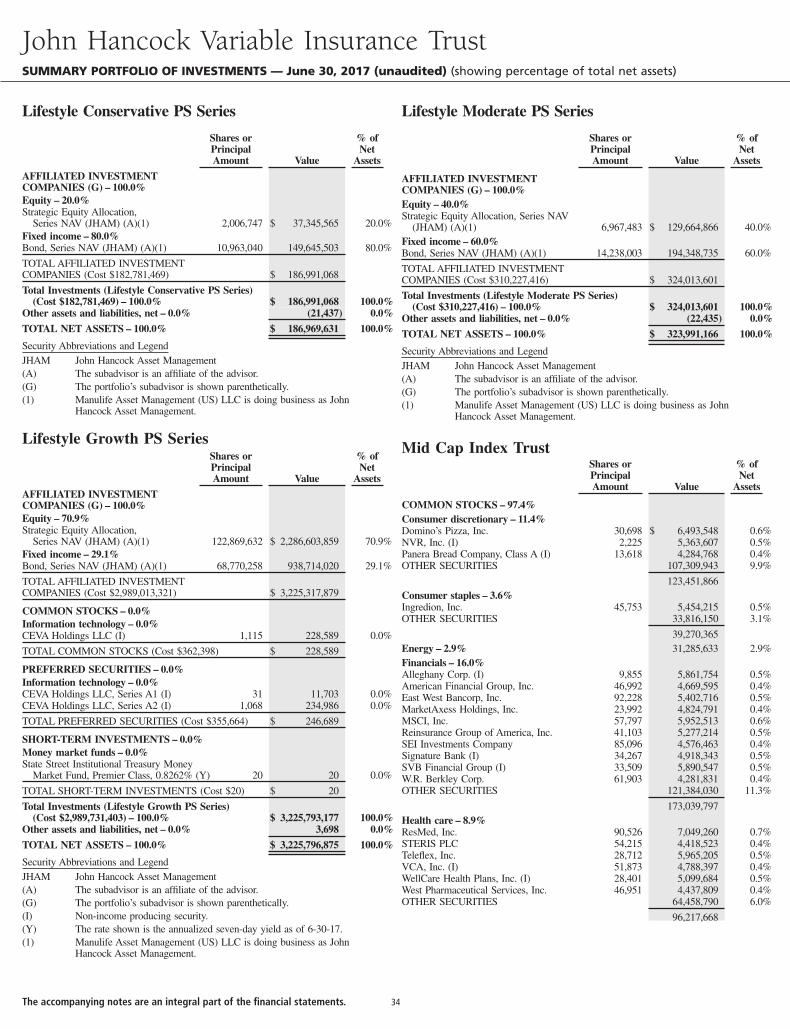
Shares orPrincipalAmount Value
% ofNet
Assets
AFFILIATED INVESTMENTCOMPANIES (G) – 100.0%Equity – 20.0%Strategic Equity Allocation,
Series NAV (JHAM) (A)(1) 2,006,747 $ 37,345,565 20.0%Fixed income – 80.0%Bond, Series NAV (JHAM) (A)(1) 10,963,040 149,645,503 80.0%
TOTAL AFFILIATED INVESTMENTCOMPANIES (Cost $182,781,469) $ 186,991,068
Total Investments (Lifestyle Conservative PS Series)(Cost $182,781,469) – 100.0% $ 186,991,068 100.0%
Other assets and liabilities, net – 0.0% (21,437) 0.0%
TOTAL NET ASSETS – 100.0% $ 186,969,631 100.0%
Security Abbreviations and LegendJHAM John Hancock Asset Management(A) The subadvisor is an affiliate of the advisor.(G) The portfolio’s subadvisor is shown parenthetically.(1) Manulife Asset Management (US) LLC is doing business as John
Hancock Asset Management.
Lifestyle Growth PS SeriesShares orPrincipalAmount Value
% ofNet
Assets
AFFILIATED INVESTMENTCOMPANIES (G) – 100.0%Equity – 70.9%Strategic Equity Allocation,
Series NAV (JHAM) (A)(1) 122,869,632 $ 2,286,603,859 70.9%Fixed income – 29.1%Bond, Series NAV (JHAM) (A)(1) 68,770,258 938,714,020 29.1%
TOTAL AFFILIATED INVESTMENTCOMPANIES (Cost $2,989,013,321) $ 3,225,317,879
COMMON STOCKS – 0.0%Information technology – 0.0%CEVA Holdings LLC (I) 1,115 228,589 0.0%
TOTAL COMMON STOCKS (Cost $362,398) $ 228,589
PREFERRED SECURITIES – 0.0%Information technology – 0.0%CEVA Holdings LLC, Series A1 (I) 31 11,703 0.0%CEVA Holdings LLC, Series A2 (I) 1,068 234,986 0.0%
TOTAL PREFERRED SECURITIES (Cost $355,664) $ 246,689
SHORT-TERM INVESTMENTS – 0.0%Money market funds – 0.0%State Street Institutional Treasury Money
Market Fund, Premier Class, 0.8262% (Y) 20 20 0.0%
TOTAL SHORT-TERM INVESTMENTS (Cost $20) $ 20
Total Investments (Lifestyle Growth PS Series)(Cost $2,989,731,403) – 100.0% $ 3,225,793,177 100.0%
Other assets and liabilities, net – 0.0% 3,698 0.0%
TOTAL NET ASSETS – 100.0% $ 3,225,796,875 100.0%
Security Abbreviations and LegendJHAM John Hancock Asset Management(A) The subadvisor is an affiliate of the advisor.(G) The portfolio’s subadvisor is shown parenthetically.(I) Non-income producing security.(Y) The rate shown is the annualized seven-day yield as of 6-30-17.(1) Manulife Asset Management (US) LLC is doing business as John
Hancock Asset Management.
Shares orPrincipalAmount Value
% ofNet
Assets
AFFILIATED INVESTMENTCOMPANIES (G) – 100.0%Equity – 40.0%Strategic Equity Allocation, Series NAV
(JHAM) (A)(1) 6,967,483 $ 129,664,866 40.0%Fixed income – 60.0%Bond, Series NAV (JHAM) (A)(1) 14,238,003 194,348,735 60.0%
TOTAL AFFILIATED INVESTMENTCOMPANIES (Cost $310,227,416) $ 324,013,601
Total Investments (Lifestyle Moderate PS Series)(Cost $310,227,416) – 100.0% $ 324,013,601 100.0%
Other assets and liabilities, net – 0.0% (22,435) 0.0%
TOTAL NET ASSETS – 100.0% $ 323,991,166 100.0%
Security Abbreviations and LegendJHAM John Hancock Asset Management(A) The subadvisor is an affiliate of the advisor.(G) The portfolio’s subadvisor is shown parenthetically.(1) Manulife Asset Management (US) LLC is doing business as John
Hancock Asset Management.
Mid Cap Index TrustShares orPrincipalAmount Value
% ofNet
Assets
COMMON STOCKS – 97.4%Consumer discretionary – 11.4%Domino’s Pizza, Inc. 30,698 $ 6,493,548 0.6%NVR, Inc. (I) 2,225 5,363,607 0.5%Panera Bread Company, Class A (I) 13,618 4,284,768 0.4%OTHER SECURITIES 107,309,943 9.9%
123,451,866Consumer staples – 3.6%Ingredion, Inc. 45,753 5,454,215 0.5%OTHER SECURITIES 33,816,150 3.1%
39,270,365Energy – 2.9% 31,285,633 2.9%Financials – 16.0%Alleghany Corp. (I) 9,855 5,861,754 0.5%American Financial Group, Inc. 46,992 4,669,595 0.4%East West Bancorp, Inc. 92,228 5,402,716 0.5%MarketAxess Holdings, Inc. 23,992 4,824,791 0.4%MSCI, Inc. 57,797 5,952,513 0.6%Reinsurance Group of America, Inc. 41,103 5,277,214 0.5%SEI Investments Company 85,096 4,576,463 0.4%Signature Bank (I) 34,267 4,918,343 0.5%SVB Financial Group (I) 33,509 5,890,547 0.5%W.R. Berkley Corp. 61,903 4,281,831 0.4%OTHER SECURITIES 121,384,030 11.3%
173,039,797Health care – 8.9%ResMed, Inc. 90,526 7,049,260 0.7%STERIS PLC 54,215 4,418,523 0.4%Teleflex, Inc. 28,712 5,965,205 0.5%VCA, Inc. (I) 51,873 4,788,397 0.4%WellCare Health Plans, Inc. (I) 28,401 5,099,684 0.5%West Pharmaceutical Services, Inc. 46,951 4,437,809 0.4%OTHER SECURITIES 64,458,790 6.0%
96,217,668
John Hancock Variable Insurance TrustSUMMARY PORTFOLIO OF INVESTMENTS — June 30, 2017 (unaudited) (showing percentage of total net assets)
Lifestyle Conservative PS Series Lifestyle Moderate PS Series
The accompanying notes are an integral part of the financial statements. 34
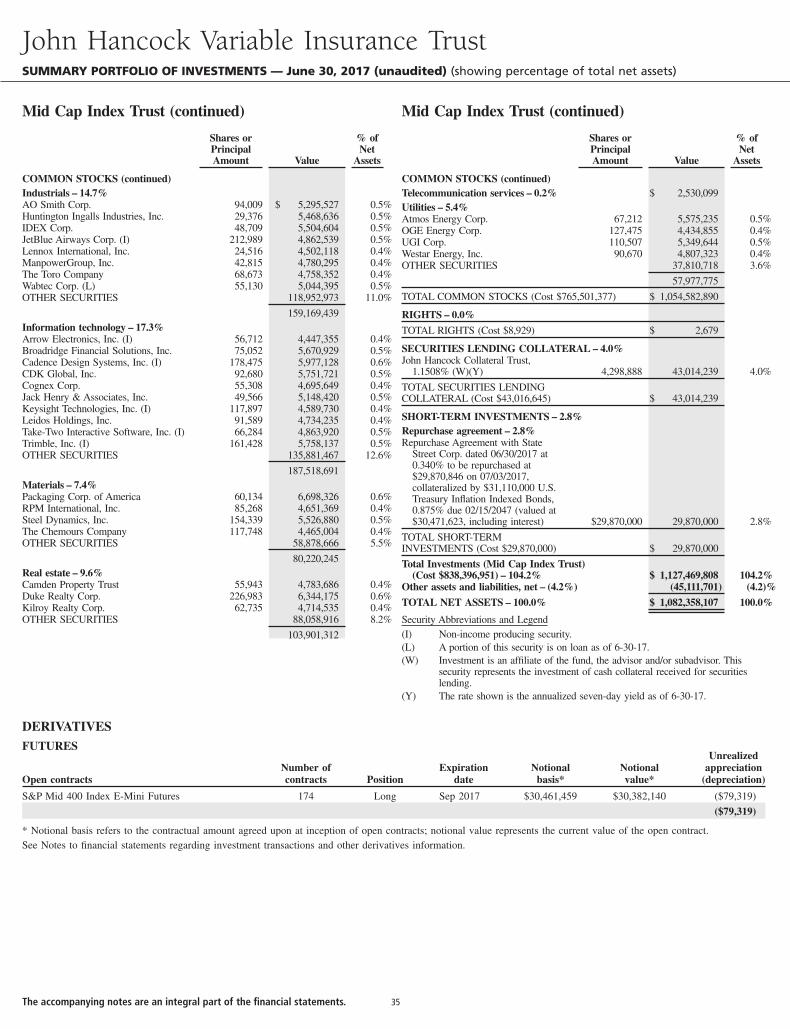
Shares orPrincipalAmount Value
% ofNet
Assets
COMMON STOCKS (continued)Industrials – 14.7%AO Smith Corp. 94,009 $ 5,295,527 0.5%Huntington Ingalls Industries, Inc. 29,376 5,468,636 0.5%IDEX Corp. 48,709 5,504,604 0.5%JetBlue Airways Corp. (I) 212,989 4,862,539 0.5%Lennox International, Inc. 24,516 4,502,118 0.4%ManpowerGroup, Inc. 42,815 4,780,295 0.4%The Toro Company 68,673 4,758,352 0.4%Wabtec Corp. (L) 55,130 5,044,395 0.5%OTHER SECURITIES 118,952,973 11.0%
159,169,439Information technology – 17.3%Arrow Electronics, Inc. (I) 56,712 4,447,355 0.4%Broadridge Financial Solutions, Inc. 75,052 5,670,929 0.5%Cadence Design Systems, Inc. (I) 178,475 5,977,128 0.6%CDK Global, Inc. 92,680 5,751,721 0.5%Cognex Corp. 55,308 4,695,649 0.4%Jack Henry & Associates, Inc. 49,566 5,148,420 0.5%Keysight Technologies, Inc. (I) 117,897 4,589,730 0.4%Leidos Holdings, Inc. 91,589 4,734,235 0.4%Take-Two Interactive Software, Inc. (I) 66,284 4,863,920 0.5%Trimble, Inc. (I) 161,428 5,758,137 0.5%OTHER SECURITIES 135,881,467 12.6%
187,518,691Materials – 7.4%Packaging Corp. of America 60,134 6,698,326 0.6%RPM International, Inc. 85,268 4,651,369 0.4%Steel Dynamics, Inc. 154,339 5,526,880 0.5%The Chemours Company 117,748 4,465,004 0.4%OTHER SECURITIES 58,878,666 5.5%
80,220,245Real estate – 9.6%Camden Property Trust 55,943 4,783,686 0.4%Duke Realty Corp. 226,983 6,344,175 0.6%Kilroy Realty Corp. 62,735 4,714,535 0.4%OTHER SECURITIES 88,058,916 8.2%
103,901,312
Shares orPrincipalAmount Value
% ofNet
Assets
COMMON STOCKS (continued)Telecommunication services – 0.2% $ 2,530,099Utilities – 5.4%Atmos Energy Corp. 67,212 5,575,235 0.5%OGE Energy Corp. 127,475 4,434,855 0.4%UGI Corp. 110,507 5,349,644 0.5%Westar Energy, Inc. 90,670 4,807,323 0.4%OTHER SECURITIES 37,810,718 3.6%
57,977,775
TOTAL COMMON STOCKS (Cost $765,501,377) $ 1,054,582,890
RIGHTS – 0.0%
TOTAL RIGHTS (Cost $8,929) $ 2,679
SECURITIES LENDING COLLATERAL – 4.0%John Hancock Collateral Trust,
1.1508% (W)(Y) 4,298,888 43,014,239 4.0%
TOTAL SECURITIES LENDINGCOLLATERAL (Cost $43,016,645) $ 43,014,239
SHORT-TERM INVESTMENTS – 2.8%Repurchase agreement – 2.8%Repurchase Agreement with State
Street Corp. dated 06/30/2017 at0.340% to be repurchased at$29,870,846 on 07/03/2017,collateralized by $31,110,000 U.S.Treasury Inflation Indexed Bonds,0.875% due 02/15/2047 (valued at$30,471,623, including interest) $29,870,000 29,870,000 2.8%
TOTAL SHORT-TERMINVESTMENTS (Cost $29,870,000) $ 29,870,000
Total Investments (Mid Cap Index Trust)(Cost $838,396,951) – 104.2% $ 1,127,469,808 104.2%
Other assets and liabilities, net – (4.2%) (45,111,701) (4.2)%
TOTAL NET ASSETS – 100.0% $ 1,082,358,107 100.0%
Security Abbreviations and Legend(I) Non-income producing security.(L) A portion of this security is on loan as of 6-30-17.(W) Investment is an affiliate of the fund, the advisor and/or subadvisor. This
security represents the investment of cash collateral received for securitieslending.
(Y) The rate shown is the annualized seven-day yield as of 6-30-17.
DERIVATIVESFUTURES
Open contractsNumber ofcontracts Position
Expirationdate
Notionalbasis*
Notionalvalue*
Unrealizedappreciation
(depreciation)
S&P Mid 400 Index E-Mini Futures 174 Long Sep 2017 $30,461,459 $30,382,140 ($79,319)
($79,319)
* Notional basis refers to the contractual amount agreed upon at inception of open contracts; notional value represents the current value of the open contract.See Notes to financial statements regarding investment transactions and other derivatives information.
John Hancock Variable Insurance TrustSUMMARY PORTFOLIO OF INVESTMENTS — June 30, 2017 (unaudited) (showing percentage of total net assets)
Mid Cap Index Trust (continued) Mid Cap Index Trust (continued)
The accompanying notes are an integral part of the financial statements. 35
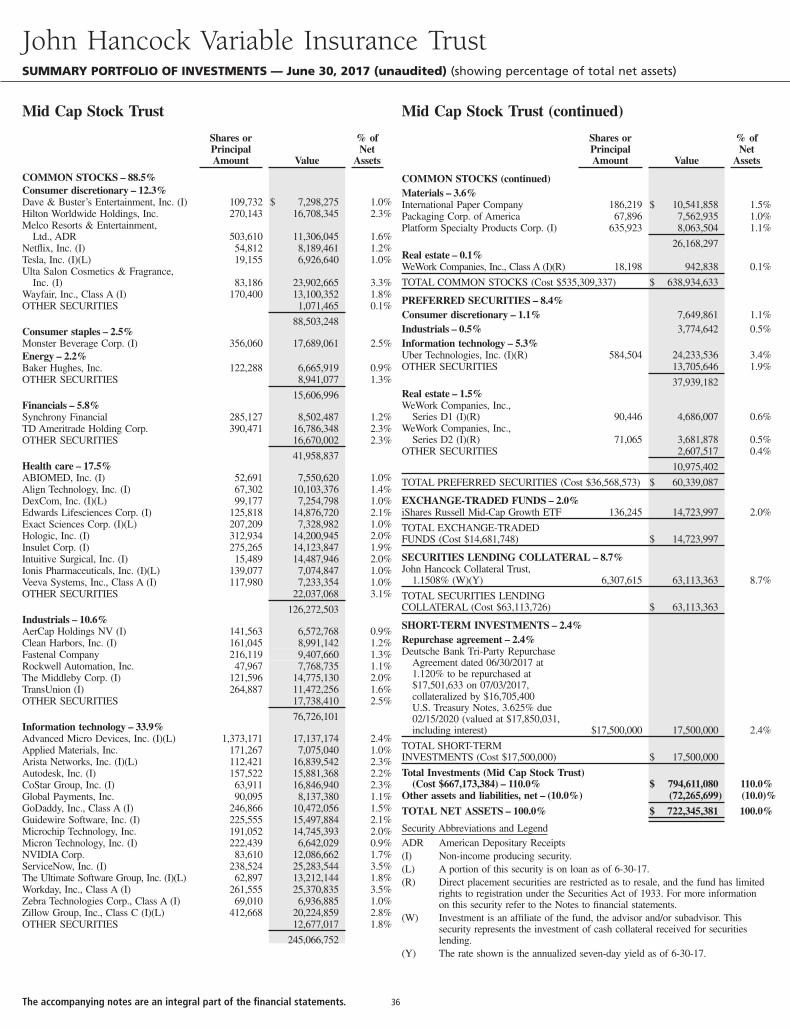
Shares orPrincipalAmount Value
% ofNet
Assets
COMMON STOCKS – 88.5%Consumer discretionary – 12.3%Dave & Buster’s Entertainment, Inc. (I) 109,732 $ 7,298,275 1.0%Hilton Worldwide Holdings, Inc. 270,143 16,708,345 2.3%Melco Resorts & Entertainment,
Ltd., ADR 503,610 11,306,045 1.6%Netflix, Inc. (I) 54,812 8,189,461 1.2%Tesla, Inc. (I)(L) 19,155 6,926,640 1.0%Ulta Salon Cosmetics & Fragrance,
Inc. (I) 83,186 23,902,665 3.3%Wayfair, Inc., Class A (I) 170,400 13,100,352 1.8%OTHER SECURITIES 1,071,465 0.1%
88,503,248Consumer staples – 2.5%Monster Beverage Corp. (I) 356,060 17,689,061 2.5%Energy – 2.2%Baker Hughes, Inc. 122,288 6,665,919 0.9%OTHER SECURITIES 8,941,077 1.3%
15,606,996Financials – 5.8%Synchrony Financial 285,127 8,502,487 1.2%TD Ameritrade Holding Corp. 390,471 16,786,348 2.3%OTHER SECURITIES 16,670,002 2.3%
41,958,837Health care – 17.5%ABIOMED, Inc. (I) 52,691 7,550,620 1.0%Align Technology, Inc. (I) 67,302 10,103,376 1.4%DexCom, Inc. (I)(L) 99,177 7,254,798 1.0%Edwards Lifesciences Corp. (I) 125,818 14,876,720 2.1%Exact Sciences Corp. (I)(L) 207,209 7,328,982 1.0%Hologic, Inc. (I) 312,934 14,200,945 2.0%Insulet Corp. (I) 275,265 14,123,847 1.9%Intuitive Surgical, Inc. (I) 15,489 14,487,946 2.0%Ionis Pharmaceuticals, Inc. (I)(L) 139,077 7,074,847 1.0%Veeva Systems, Inc., Class A (I) 117,980 7,233,354 1.0%OTHER SECURITIES 22,037,068 3.1%
126,272,503Industrials – 10.6%AerCap Holdings NV (I) 141,563 6,572,768 0.9%Clean Harbors, Inc. (I) 161,045 8,991,142 1.2%Fastenal Company 216,119 9,407,660 1.3%Rockwell Automation, Inc. 47,967 7,768,735 1.1%The Middleby Corp. (I) 121,596 14,775,130 2.0%TransUnion (I) 264,887 11,472,256 1.6%OTHER SECURITIES 17,738,410 2.5%
76,726,101Information technology – 33.9%Advanced Micro Devices, Inc. (I)(L) 1,373,171 17,137,174 2.4%Applied Materials, Inc. 171,267 7,075,040 1.0%Arista Networks, Inc. (I)(L) 112,421 16,839,542 2.3%Autodesk, Inc. (I) 157,522 15,881,368 2.2%CoStar Group, Inc. (I) 63,911 16,846,940 2.3%Global Payments, Inc. 90,095 8,137,380 1.1%GoDaddy, Inc., Class A (I) 246,866 10,472,056 1.5%Guidewire Software, Inc. (I) 225,555 15,497,884 2.1%Microchip Technology, Inc. 191,052 14,745,393 2.0%Micron Technology, Inc. (I) 222,439 6,642,029 0.9%NVIDIA Corp. 83,610 12,086,662 1.7%ServiceNow, Inc. (I) 238,524 25,283,544 3.5%The Ultimate Software Group, Inc. (I)(L) 62,897 13,212,144 1.8%Workday, Inc., Class A (I) 261,555 25,370,835 3.5%Zebra Technologies Corp., Class A (I) 69,010 6,936,885 1.0%Zillow Group, Inc., Class C (I)(L) 412,668 20,224,859 2.8%OTHER SECURITIES 12,677,017 1.8%
245,066,752
Shares orPrincipalAmount Value
% ofNet
Assets
COMMON STOCKS (continued)Materials – 3.6%International Paper Company 186,219 $ 10,541,858 1.5%Packaging Corp. of America 67,896 7,562,935 1.0%Platform Specialty Products Corp. (I) 635,923 8,063,504 1.1%
26,168,297Real estate – 0.1%WeWork Companies, Inc., Class A (I)(R) 18,198 942,838 0.1%
TOTAL COMMON STOCKS (Cost $535,309,337) $ 638,934,633
PREFERRED SECURITIES – 8.4%Consumer discretionary – 1.1% 7,649,861 1.1%Industrials – 0.5% 3,774,642 0.5%Information technology – 5.3%Uber Technologies, Inc. (I)(R) 584,504 24,233,536 3.4%OTHER SECURITIES 13,705,646 1.9%
37,939,182Real estate – 1.5%WeWork Companies, Inc.,
Series D1 (I)(R) 90,446 4,686,007 0.6%WeWork Companies, Inc.,
Series D2 (I)(R) 71,065 3,681,878 0.5%OTHER SECURITIES 2,607,517 0.4%
10,975,402
TOTAL PREFERRED SECURITIES (Cost $36,568,573) $ 60,339,087
EXCHANGE-TRADED FUNDS – 2.0%iShares Russell Mid-Cap Growth ETF 136,245 14,723,997 2.0%
TOTAL EXCHANGE-TRADEDFUNDS (Cost $14,681,748) $ 14,723,997
SECURITIES LENDING COLLATERAL – 8.7%John Hancock Collateral Trust,
1.1508% (W)(Y) 6,307,615 63,113,363 8.7%
TOTAL SECURITIES LENDINGCOLLATERAL (Cost $63,113,726) $ 63,113,363
SHORT-TERM INVESTMENTS – 2.4%Repurchase agreement – 2.4%Deutsche Bank Tri-Party Repurchase
Agreement dated 06/30/2017 at1.120% to be repurchased at$17,501,633 on 07/03/2017,collateralized by $16,705,400U.S. Treasury Notes, 3.625% due02/15/2020 (valued at $17,850,031,including interest) $17,500,000 17,500,000 2.4%
TOTAL SHORT-TERMINVESTMENTS (Cost $17,500,000) $ 17,500,000
Total Investments (Mid Cap Stock Trust)(Cost $667,173,384) – 110.0% $ 794,611,080 110.0%
Other assets and liabilities, net – (10.0%) (72,265,699) (10.0)%
TOTAL NET ASSETS – 100.0% $ 722,345,381 100.0%
Security Abbreviations and LegendADR American Depositary Receipts(I) Non-income producing security.(L) A portion of this security is on loan as of 6-30-17.(R) Direct placement securities are restricted as to resale, and the fund has limited
rights to registration under the Securities Act of 1933. For more informationon this security refer to the Notes to financial statements.
(W) Investment is an affiliate of the fund, the advisor and/or subadvisor. Thissecurity represents the investment of cash collateral received for securitieslending.
(Y) The rate shown is the annualized seven-day yield as of 6-30-17.
John Hancock Variable Insurance TrustSUMMARY PORTFOLIO OF INVESTMENTS — June 30, 2017 (unaudited) (showing percentage of total net assets)
Mid Cap Stock Trust Mid Cap Stock Trust (continued)
The accompanying notes are an integral part of the financial statements. 36
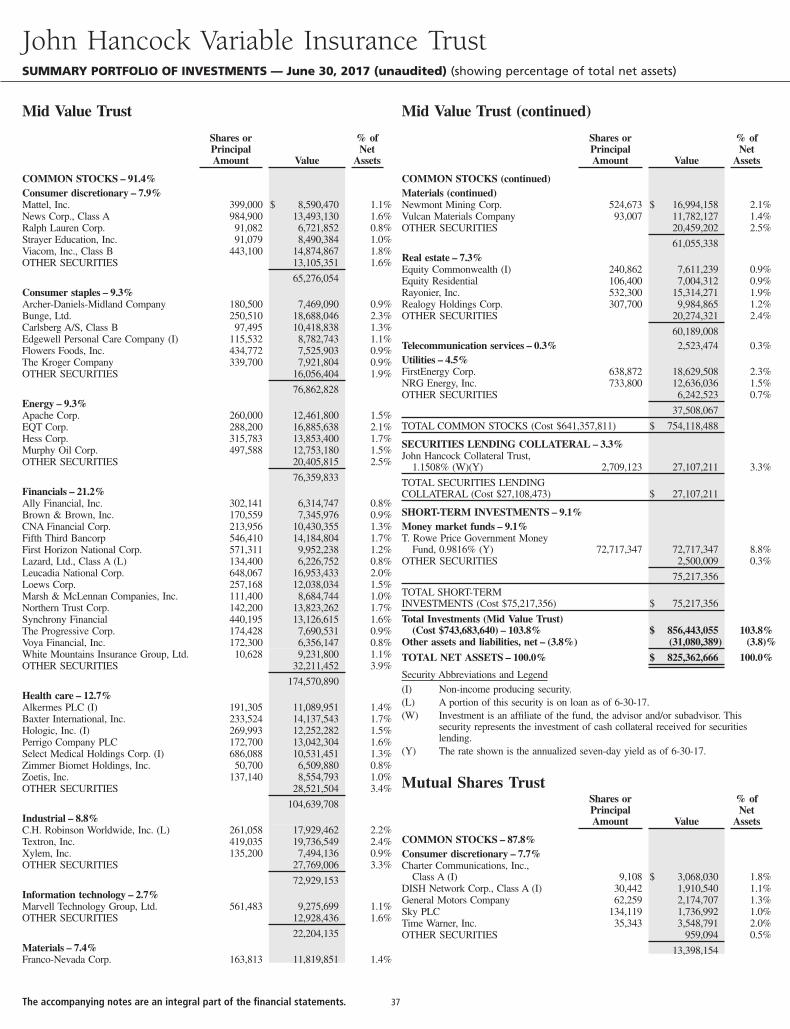
Shares orPrincipalAmount Value
% ofNet
Assets
COMMON STOCKS – 91.4%Consumer discretionary – 7.9%Mattel, Inc. 399,000 $ 8,590,470 1.1%News Corp., Class A 984,900 13,493,130 1.6%Ralph Lauren Corp. 91,082 6,721,852 0.8%Strayer Education, Inc. 91,079 8,490,384 1.0%Viacom, Inc., Class B 443,100 14,874,867 1.8%OTHER SECURITIES 13,105,351 1.6%
65,276,054Consumer staples – 9.3%Archer-Daniels-Midland Company 180,500 7,469,090 0.9%Bunge, Ltd. 250,510 18,688,046 2.3%Carlsberg A/S, Class B 97,495 10,418,838 1.3%Edgewell Personal Care Company (I) 115,532 8,782,743 1.1%Flowers Foods, Inc. 434,772 7,525,903 0.9%The Kroger Company 339,700 7,921,804 0.9%OTHER SECURITIES 16,056,404 1.9%
76,862,828Energy – 9.3%Apache Corp. 260,000 12,461,800 1.5%EQT Corp. 288,200 16,885,638 2.1%Hess Corp. 315,783 13,853,400 1.7%Murphy Oil Corp. 497,588 12,753,180 1.5%OTHER SECURITIES 20,405,815 2.5%
76,359,833Financials – 21.2%Ally Financial, Inc. 302,141 6,314,747 0.8%Brown & Brown, Inc. 170,559 7,345,976 0.9%CNA Financial Corp. 213,956 10,430,355 1.3%Fifth Third Bancorp 546,410 14,184,804 1.7%First Horizon National Corp. 571,311 9,952,238 1.2%Lazard, Ltd., Class A (L) 134,400 6,226,752 0.8%Leucadia National Corp. 648,067 16,953,433 2.0%Loews Corp. 257,168 12,038,034 1.5%Marsh & McLennan Companies, Inc. 111,400 8,684,744 1.0%Northern Trust Corp. 142,200 13,823,262 1.7%Synchrony Financial 440,195 13,126,615 1.6%The Progressive Corp. 174,428 7,690,531 0.9%Voya Financial, Inc. 172,300 6,356,147 0.8%White Mountains Insurance Group, Ltd. 10,628 9,231,800 1.1%OTHER SECURITIES 32,211,452 3.9%
174,570,890Health care – 12.7%Alkermes PLC (I) 191,305 11,089,951 1.4%Baxter International, Inc. 233,524 14,137,543 1.7%Hologic, Inc. (I) 269,993 12,252,282 1.5%Perrigo Company PLC 172,700 13,042,304 1.6%Select Medical Holdings Corp. (I) 686,088 10,531,451 1.3%Zimmer Biomet Holdings, Inc. 50,700 6,509,880 0.8%Zoetis, Inc. 137,140 8,554,793 1.0%OTHER SECURITIES 28,521,504 3.4%
104,639,708Industrial – 8.8%C.H. Robinson Worldwide, Inc. (L) 261,058 17,929,462 2.2%Textron, Inc. 419,035 19,736,549 2.4%Xylem, Inc. 135,200 7,494,136 0.9%OTHER SECURITIES 27,769,006 3.3%
72,929,153Information technology – 2.7%Marvell Technology Group, Ltd. 561,483 9,275,699 1.1%OTHER SECURITIES 12,928,436 1.6%
22,204,135Materials – 7.4%Franco-Nevada Corp. 163,813 11,819,851 1.4%
Shares orPrincipalAmount Value
% ofNet
Assets
COMMON STOCKS (continued)Materials (continued)Newmont Mining Corp. 524,673 $ 16,994,158 2.1%Vulcan Materials Company 93,007 11,782,127 1.4%OTHER SECURITIES 20,459,202 2.5%
61,055,338Real estate – 7.3%Equity Commonwealth (I) 240,862 7,611,239 0.9%Equity Residential 106,400 7,004,312 0.9%Rayonier, Inc. 532,300 15,314,271 1.9%Realogy Holdings Corp. 307,700 9,984,865 1.2%OTHER SECURITIES 20,274,321 2.4%
60,189,008Telecommunication services – 0.3% 2,523,474 0.3%Utilities – 4.5%FirstEnergy Corp. 638,872 18,629,508 2.3%NRG Energy, Inc. 733,800 12,636,036 1.5%OTHER SECURITIES 6,242,523 0.7%
37,508,067
TOTAL COMMON STOCKS (Cost $641,357,811) $ 754,118,488
SECURITIES LENDING COLLATERAL – 3.3%John Hancock Collateral Trust,
1.1508% (W)(Y) 2,709,123 27,107,211 3.3%
TOTAL SECURITIES LENDINGCOLLATERAL (Cost $27,108,473) $ 27,107,211
SHORT-TERM INVESTMENTS – 9.1%Money market funds – 9.1%T. Rowe Price Government Money
Fund, 0.9816% (Y) 72,717,347 72,717,347 8.8%OTHER SECURITIES 2,500,009 0.3%
75,217,356
TOTAL SHORT-TERMINVESTMENTS (Cost $75,217,356) $ 75,217,356
Total Investments (Mid Value Trust)(Cost $743,683,640) – 103.8% $ 856,443,055 103.8%
Other assets and liabilities, net – (3.8%) (31,080,389) (3.8)%
TOTAL NET ASSETS – 100.0% $ 825,362,666 100.0%
Security Abbreviations and Legend(I) Non-income producing security.(L) A portion of this security is on loan as of 6-30-17.(W) Investment is an affiliate of the fund, the advisor and/or subadvisor. This
security represents the investment of cash collateral received for securitieslending.
(Y) The rate shown is the annualized seven-day yield as of 6-30-17.
Mutual Shares TrustShares orPrincipalAmount Value
% ofNet
Assets
COMMON STOCKS – 87.8%Consumer discretionary – 7.7%Charter Communications, Inc.,
Class A (I) 9,108 $ 3,068,030 1.8%DISH Network Corp., Class A (I) 30,442 1,910,540 1.1%General Motors Company 62,259 2,174,707 1.3%Sky PLC 134,119 1,736,992 1.0%Time Warner, Inc. 35,343 3,548,791 2.0%OTHER SECURITIES 959,094 0.5%
13,398,154
John Hancock Variable Insurance TrustSUMMARY PORTFOLIO OF INVESTMENTS — June 30, 2017 (unaudited) (showing percentage of total net assets)
Mid Value Trust Mid Value Trust (continued)
The accompanying notes are an integral part of the financial statements. 37
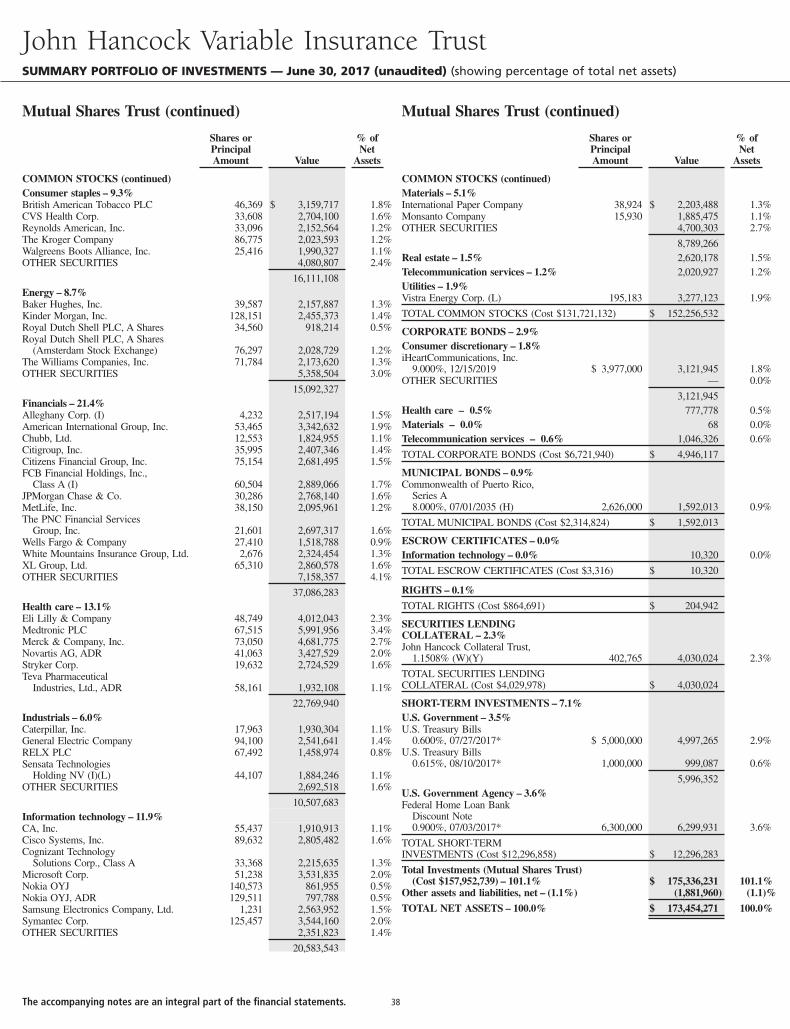
Shares orPrincipalAmount Value
% ofNet
Assets
COMMON STOCKS (continued)Consumer staples – 9.3%British American Tobacco PLC 46,369 $ 3,159,717 1.8%CVS Health Corp. 33,608 2,704,100 1.6%Reynolds American, Inc. 33,096 2,152,564 1.2%The Kroger Company 86,775 2,023,593 1.2%Walgreens Boots Alliance, Inc. 25,416 1,990,327 1.1%OTHER SECURITIES 4,080,807 2.4%
16,111,108Energy – 8.7%Baker Hughes, Inc. 39,587 2,157,887 1.3%Kinder Morgan, Inc. 128,151 2,455,373 1.4%Royal Dutch Shell PLC, A Shares 34,560 918,214 0.5%Royal Dutch Shell PLC, A Shares
(Amsterdam Stock Exchange) 76,297 2,028,729 1.2%The Williams Companies, Inc. 71,784 2,173,620 1.3%OTHER SECURITIES 5,358,504 3.0%
15,092,327Financials – 21.4%Alleghany Corp. (I) 4,232 2,517,194 1.5%American International Group, Inc. 53,465 3,342,632 1.9%Chubb, Ltd. 12,553 1,824,955 1.1%Citigroup, Inc. 35,995 2,407,346 1.4%Citizens Financial Group, Inc. 75,154 2,681,495 1.5%FCB Financial Holdings, Inc.,
Class A (I) 60,504 2,889,066 1.7%JPMorgan Chase & Co. 30,286 2,768,140 1.6%MetLife, Inc. 38,150 2,095,961 1.2%The PNC Financial Services
Group, Inc. 21,601 2,697,317 1.6%Wells Fargo & Company 27,410 1,518,788 0.9%White Mountains Insurance Group, Ltd. 2,676 2,324,454 1.3%XL Group, Ltd. 65,310 2,860,578 1.6%OTHER SECURITIES 7,158,357 4.1%
37,086,283Health care – 13.1%Eli Lilly & Company 48,749 4,012,043 2.3%Medtronic PLC 67,515 5,991,956 3.4%Merck & Company, Inc. 73,050 4,681,775 2.7%Novartis AG, ADR 41,063 3,427,529 2.0%Stryker Corp. 19,632 2,724,529 1.6%Teva Pharmaceutical
Industries, Ltd., ADR 58,161 1,932,108 1.1%
22,769,940Industrials – 6.0%Caterpillar, Inc. 17,963 1,930,304 1.1%General Electric Company 94,100 2,541,641 1.4%RELX PLC 67,492 1,458,974 0.8%Sensata Technologies
Holding NV (I)(L) 44,107 1,884,246 1.1%OTHER SECURITIES 2,692,518 1.6%
10,507,683Information technology – 11.9%CA, Inc. 55,437 1,910,913 1.1%Cisco Systems, Inc. 89,632 2,805,482 1.6%Cognizant Technology
Solutions Corp., Class A 33,368 2,215,635 1.3%Microsoft Corp. 51,238 3,531,835 2.0%Nokia OYJ 140,573 861,955 0.5%Nokia OYJ, ADR 129,511 797,788 0.5%Samsung Electronics Company, Ltd. 1,231 2,563,952 1.5%Symantec Corp. 125,457 3,544,160 2.0%OTHER SECURITIES 2,351,823 1.4%
20,583,543
Shares orPrincipalAmount Value
% ofNet
Assets
COMMON STOCKS (continued)Materials – 5.1%International Paper Company 38,924 $ 2,203,488 1.3%Monsanto Company 15,930 1,885,475 1.1%OTHER SECURITIES 4,700,303 2.7%
8,789,266Real estate – 1.5% 2,620,178 1.5%Telecommunication services – 1.2% 2,020,927 1.2%Utilities – 1.9%Vistra Energy Corp. (L) 195,183 3,277,123 1.9%
TOTAL COMMON STOCKS (Cost $131,721,132) $ 152,256,532
CORPORATE BONDS – 2.9%Consumer discretionary – 1.8%iHeartCommunications, Inc.
9.000%, 12/15/2019 $ 3,977,000 3,121,945 1.8%OTHER SECURITIES — 0.0%
3,121,945Health care – 0.5% 777,778 0.5%Materials – 0.0% 68 0.0%Telecommunication services – 0.6% 1,046,326 0.6%
TOTAL CORPORATE BONDS (Cost $6,721,940) $ 4,946,117
MUNICIPAL BONDS – 0.9%Commonwealth of Puerto Rico,
Series A8.000%, 07/01/2035 (H) 2,626,000 1,592,013 0.9%
TOTAL MUNICIPAL BONDS (Cost $2,314,824) $ 1,592,013
ESCROW CERTIFICATES – 0.0%Information technology – 0.0% 10,320 0.0%
TOTAL ESCROW CERTIFICATES (Cost $3,316) $ 10,320
RIGHTS – 0.1%
TOTAL RIGHTS (Cost $864,691) $ 204,942
SECURITIES LENDINGCOLLATERAL – 2.3%John Hancock Collateral Trust,
1.1508% (W)(Y) 402,765 4,030,024 2.3%
TOTAL SECURITIES LENDINGCOLLATERAL (Cost $4,029,978) $ 4,030,024
SHORT-TERM INVESTMENTS – 7.1%U.S. Government – 3.5%U.S. Treasury Bills
0.600%, 07/27/2017* $ 5,000,000 4,997,265 2.9%U.S. Treasury Bills
0.615%, 08/10/2017* 1,000,000 999,087 0.6%
5,996,352U.S. Government Agency – 3.6%Federal Home Loan Bank
Discount Note0.900%, 07/03/2017* 6,300,000 6,299,931 3.6%
TOTAL SHORT-TERMINVESTMENTS (Cost $12,296,858) $ 12,296,283
Total Investments (Mutual Shares Trust)(Cost $157,952,739) – 101.1% $ 175,336,231 101.1%
Other assets and liabilities, net – (1.1%) (1,881,960) (1.1)%
TOTAL NET ASSETS – 100.0% $ 173,454,271 100.0%
John Hancock Variable Insurance TrustSUMMARY PORTFOLIO OF INVESTMENTS — June 30, 2017 (unaudited) (showing percentage of total net assets)
Mutual Shares Trust (continued) Mutual Shares Trust (continued)
The accompanying notes are an integral part of the financial statements. 38
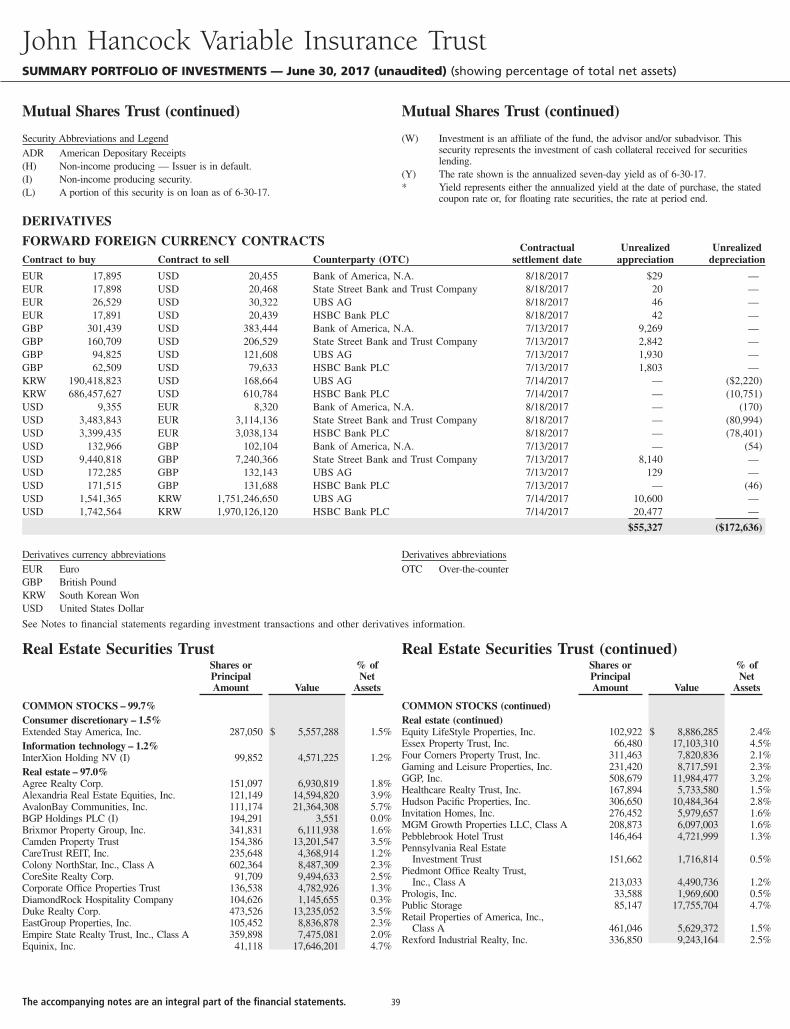
Security Abbreviations and LegendADR American Depositary Receipts(H) Non-income producing — Issuer is in default.(I) Non-income producing security.(L) A portion of this security is on loan as of 6-30-17.
(W) Investment is an affiliate of the fund, the advisor and/or subadvisor. Thissecurity represents the investment of cash collateral received for securitieslending.
(Y) The rate shown is the annualized seven-day yield as of 6-30-17.* Yield represents either the annualized yield at the date of purchase, the stated
coupon rate or, for floating rate securities, the rate at period end.
DERIVATIVES
FORWARD FOREIGN CURRENCY CONTRACTSContract to buy Contract to sell Counterparty (OTC)
Contractualsettlement date
Unrealizedappreciation
Unrealizeddepreciation
EUR 17,895 USD 20,455 Bank of America, N.A. 8/18/2017 $29 —EUR 17,898 USD 20,468 State Street Bank and Trust Company 8/18/2017 20 —EUR 26,529 USD 30,322 UBS AG 8/18/2017 46 —EUR 17,891 USD 20,439 HSBC Bank PLC 8/18/2017 42 —GBP 301,439 USD 383,444 Bank of America, N.A. 7/13/2017 9,269 —GBP 160,709 USD 206,529 State Street Bank and Trust Company 7/13/2017 2,842 —GBP 94,825 USD 121,608 UBS AG 7/13/2017 1,930 —GBP 62,509 USD 79,633 HSBC Bank PLC 7/13/2017 1,803 —KRW 190,418,823 USD 168,664 UBS AG 7/14/2017 — ($2,220)KRW 686,457,627 USD 610,784 HSBC Bank PLC 7/14/2017 — (10,751)USD 9,355 EUR 8,320 Bank of America, N.A. 8/18/2017 — (170)USD 3,483,843 EUR 3,114,136 State Street Bank and Trust Company 8/18/2017 — (80,994)USD 3,399,435 EUR 3,038,134 HSBC Bank PLC 8/18/2017 — (78,401)USD 132,966 GBP 102,104 Bank of America, N.A. 7/13/2017 — (54)USD 9,440,818 GBP 7,240,366 State Street Bank and Trust Company 7/13/2017 8,140 —USD 172,285 GBP 132,143 UBS AG 7/13/2017 129 —USD 171,515 GBP 131,688 HSBC Bank PLC 7/13/2017 — (46)USD 1,541,365 KRW 1,751,246,650 UBS AG 7/14/2017 10,600 —USD 1,742,564 KRW 1,970,126,120 HSBC Bank PLC 7/14/2017 20,477 —
$55,327 ($172,636)
Derivatives currency abbreviationsEUR EuroGBP British PoundKRW South Korean WonUSD United States Dollar
Derivatives abbreviationsOTC Over-the-counter
See Notes to financial statements regarding investment transactions and other derivatives information.
Real Estate Securities TrustShares orPrincipalAmount Value
% ofNet
Assets
COMMON STOCKS – 99.7%Consumer discretionary – 1.5%Extended Stay America, Inc. 287,050 $ 5,557,288 1.5%Information technology – 1.2%InterXion Holding NV (I) 99,852 4,571,225 1.2%Real estate – 97.0%Agree Realty Corp. 151,097 6,930,819 1.8%Alexandria Real Estate Equities, Inc. 121,149 14,594,820 3.9%AvalonBay Communities, Inc. 111,174 21,364,308 5.7%BGP Holdings PLC (I) 194,291 3,551 0.0%Brixmor Property Group, Inc. 341,831 6,111,938 1.6%Camden Property Trust 154,386 13,201,547 3.5%CareTrust REIT, Inc. 235,648 4,368,914 1.2%Colony NorthStar, Inc., Class A 602,364 8,487,309 2.3%CoreSite Realty Corp. 91,709 9,494,633 2.5%Corporate Office Properties Trust 136,538 4,782,926 1.3%DiamondRock Hospitality Company 104,626 1,145,655 0.3%Duke Realty Corp. 473,526 13,235,052 3.5%EastGroup Properties, Inc. 105,452 8,836,878 2.3%Empire State Realty Trust, Inc., Class A 359,898 7,475,081 2.0%Equinix, Inc. 41,118 17,646,201 4.7%
Real Estate Securities Trust (continued)Shares orPrincipalAmount Value
% ofNet
Assets
COMMON STOCKS (continued)Real estate (continued)Equity LifeStyle Properties, Inc. 102,922 $ 8,886,285 2.4%Essex Property Trust, Inc. 66,480 17,103,310 4.5%Four Corners Property Trust, Inc. 311,463 7,820,836 2.1%Gaming and Leisure Properties, Inc. 231,420 8,717,591 2.3%GGP, Inc. 508,679 11,984,477 3.2%Healthcare Realty Trust, Inc. 167,894 5,733,580 1.5%Hudson Pacific Properties, Inc. 306,650 10,484,364 2.8%Invitation Homes, Inc. 276,452 5,979,657 1.6%MGM Growth Properties LLC, Class A 208,873 6,097,003 1.6%Pebblebrook Hotel Trust 146,464 4,721,999 1.3%Pennsylvania Real Estate
Investment Trust 151,662 1,716,814 0.5%Piedmont Office Realty Trust,
Inc., Class A 213,033 4,490,736 1.2%Prologis, Inc. 33,588 1,969,600 0.5%Public Storage 85,147 17,755,704 4.7%Retail Properties of America, Inc.,
Class A 461,046 5,629,372 1.5%Rexford Industrial Realty, Inc. 336,850 9,243,164 2.5%
John Hancock Variable Insurance TrustSUMMARY PORTFOLIO OF INVESTMENTS — June 30, 2017 (unaudited) (showing percentage of total net assets)
Mutual Shares Trust (continued) Mutual Shares Trust (continued)
The accompanying notes are an integral part of the financial statements. 39
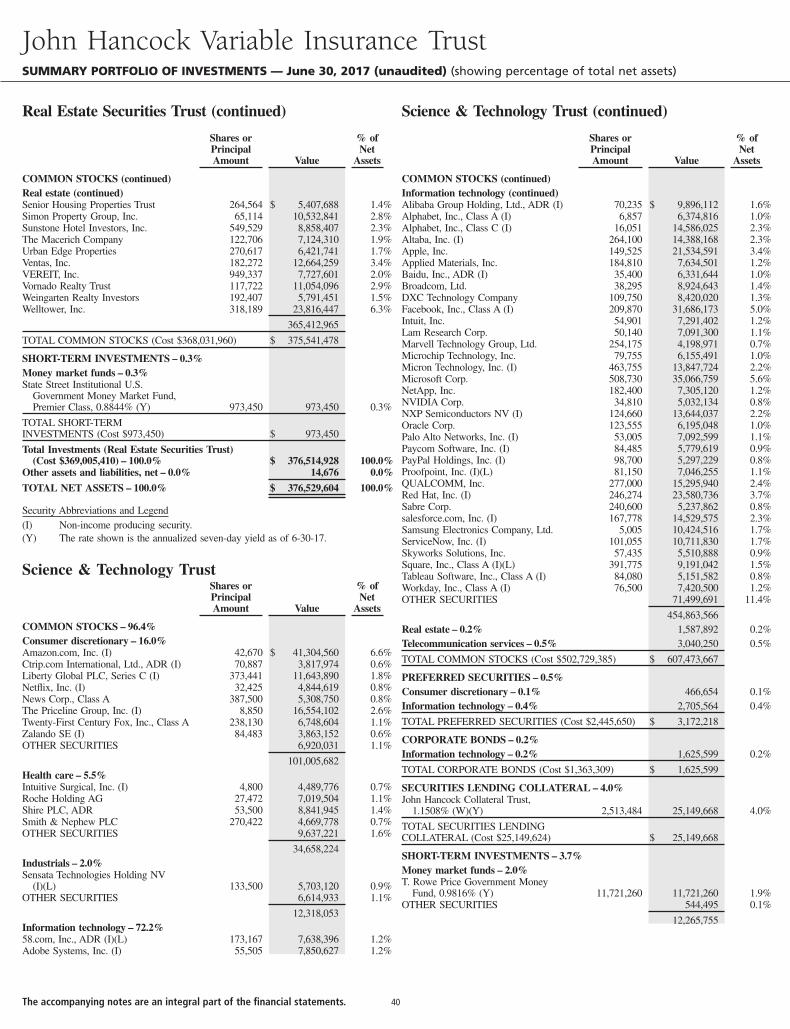
Shares orPrincipalAmount Value
% ofNet
Assets
COMMON STOCKS (continued)Real estate (continued)Senior Housing Properties Trust 264,564 $ 5,407,688 1.4%Simon Property Group, Inc. 65,114 10,532,841 2.8%Sunstone Hotel Investors, Inc. 549,529 8,858,407 2.3%The Macerich Company 122,706 7,124,310 1.9%Urban Edge Properties 270,617 6,421,741 1.7%Ventas, Inc. 182,272 12,664,259 3.4%VEREIT, Inc. 949,337 7,727,601 2.0%Vornado Realty Trust 117,722 11,054,096 2.9%Weingarten Realty Investors 192,407 5,791,451 1.5%Welltower, Inc. 318,189 23,816,447 6.3%
365,412,965
TOTAL COMMON STOCKS (Cost $368,031,960) $ 375,541,478
SHORT-TERM INVESTMENTS – 0.3%Money market funds – 0.3%State Street Institutional U.S.
Government Money Market Fund,Premier Class, 0.8844% (Y) 973,450 973,450 0.3%
TOTAL SHORT-TERMINVESTMENTS (Cost $973,450) $ 973,450
Total Investments (Real Estate Securities Trust)(Cost $369,005,410) – 100.0% $ 376,514,928 100.0%
Other assets and liabilities, net – 0.0% 14,676 0.0%
TOTAL NET ASSETS – 100.0% $ 376,529,604 100.0%
Security Abbreviations and Legend(I) Non-income producing security.(Y) The rate shown is the annualized seven-day yield as of 6-30-17.
Science & Technology TrustShares orPrincipalAmount Value
% ofNet
Assets
COMMON STOCKS – 96.4%Consumer discretionary – 16.0%Amazon.com, Inc. (I) 42,670 $ 41,304,560 6.6%Ctrip.com International, Ltd., ADR (I) 70,887 3,817,974 0.6%Liberty Global PLC, Series C (I) 373,441 11,643,890 1.8%Netflix, Inc. (I) 32,425 4,844,619 0.8%News Corp., Class A 387,500 5,308,750 0.8%The Priceline Group, Inc. (I) 8,850 16,554,102 2.6%Twenty-First Century Fox, Inc., Class A 238,130 6,748,604 1.1%Zalando SE (I) 84,483 3,863,152 0.6%OTHER SECURITIES 6,920,031 1.1%
101,005,682Health care – 5.5%Intuitive Surgical, Inc. (I) 4,800 4,489,776 0.7%Roche Holding AG 27,472 7,019,504 1.1%Shire PLC, ADR 53,500 8,841,945 1.4%Smith & Nephew PLC 270,422 4,669,778 0.7%OTHER SECURITIES 9,637,221 1.6%
34,658,224Industrials – 2.0%Sensata Technologies Holding NV
(I)(L) 133,500 5,703,120 0.9%OTHER SECURITIES 6,614,933 1.1%
12,318,053Information technology – 72.2%58.com, Inc., ADR (I)(L) 173,167 7,638,396 1.2%Adobe Systems, Inc. (I) 55,505 7,850,627 1.2%
Shares orPrincipalAmount Value
% ofNet
Assets
COMMON STOCKS (continued)Information technology (continued)Alibaba Group Holding, Ltd., ADR (I) 70,235 $ 9,896,112 1.6%Alphabet, Inc., Class A (I) 6,857 6,374,816 1.0%Alphabet, Inc., Class C (I) 16,051 14,586,025 2.3%Altaba, Inc. (I) 264,100 14,388,168 2.3%Apple, Inc. 149,525 21,534,591 3.4%Applied Materials, Inc. 184,810 7,634,501 1.2%Baidu, Inc., ADR (I) 35,400 6,331,644 1.0%Broadcom, Ltd. 38,295 8,924,643 1.4%DXC Technology Company 109,750 8,420,020 1.3%Facebook, Inc., Class A (I) 209,870 31,686,173 5.0%Intuit, Inc. 54,901 7,291,402 1.2%Lam Research Corp. 50,140 7,091,300 1.1%Marvell Technology Group, Ltd. 254,175 4,198,971 0.7%Microchip Technology, Inc. 79,755 6,155,491 1.0%Micron Technology, Inc. (I) 463,755 13,847,724 2.2%Microsoft Corp. 508,730 35,066,759 5.6%NetApp, Inc. 182,400 7,305,120 1.2%NVIDIA Corp. 34,810 5,032,134 0.8%NXP Semiconductors NV (I) 124,660 13,644,037 2.2%Oracle Corp. 123,555 6,195,048 1.0%Palo Alto Networks, Inc. (I) 53,005 7,092,599 1.1%Paycom Software, Inc. (I) 84,485 5,779,619 0.9%PayPal Holdings, Inc. (I) 98,700 5,297,229 0.8%Proofpoint, Inc. (I)(L) 81,150 7,046,255 1.1%QUALCOMM, Inc. 277,000 15,295,940 2.4%Red Hat, Inc. (I) 246,274 23,580,736 3.7%Sabre Corp. 240,600 5,237,862 0.8%salesforce.com, Inc. (I) 167,778 14,529,575 2.3%Samsung Electronics Company, Ltd. 5,005 10,424,516 1.7%ServiceNow, Inc. (I) 101,055 10,711,830 1.7%Skyworks Solutions, Inc. 57,435 5,510,888 0.9%Square, Inc., Class A (I)(L) 391,775 9,191,042 1.5%Tableau Software, Inc., Class A (I) 84,080 5,151,582 0.8%Workday, Inc., Class A (I) 76,500 7,420,500 1.2%OTHER SECURITIES 71,499,691 11.4%
454,863,566Real estate – 0.2% 1,587,892 0.2%Telecommunication services – 0.5% 3,040,250 0.5%
TOTAL COMMON STOCKS (Cost $502,729,385) $ 607,473,667
PREFERRED SECURITIES – 0.5%Consumer discretionary – 0.1% 466,654 0.1%Information technology – 0.4% 2,705,564 0.4%
TOTAL PREFERRED SECURITIES (Cost $2,445,650) $ 3,172,218
CORPORATE BONDS – 0.2%Information technology – 0.2% 1,625,599 0.2%
TOTAL CORPORATE BONDS (Cost $1,363,309) $ 1,625,599
SECURITIES LENDING COLLATERAL – 4.0%John Hancock Collateral Trust,
1.1508% (W)(Y) 2,513,484 25,149,668 4.0%
TOTAL SECURITIES LENDINGCOLLATERAL (Cost $25,149,624) $ 25,149,668
SHORT-TERM INVESTMENTS – 3.7%Money market funds – 2.0%T. Rowe Price Government Money
Fund, 0.9816% (Y) 11,721,260 11,721,260 1.9%OTHER SECURITIES 544,495 0.1%
12,265,755
John Hancock Variable Insurance TrustSUMMARY PORTFOLIO OF INVESTMENTS — June 30, 2017 (unaudited) (showing percentage of total net assets)
Real Estate Securities Trust (continued) Science & Technology Trust (continued)
The accompanying notes are an integral part of the financial statements. 40
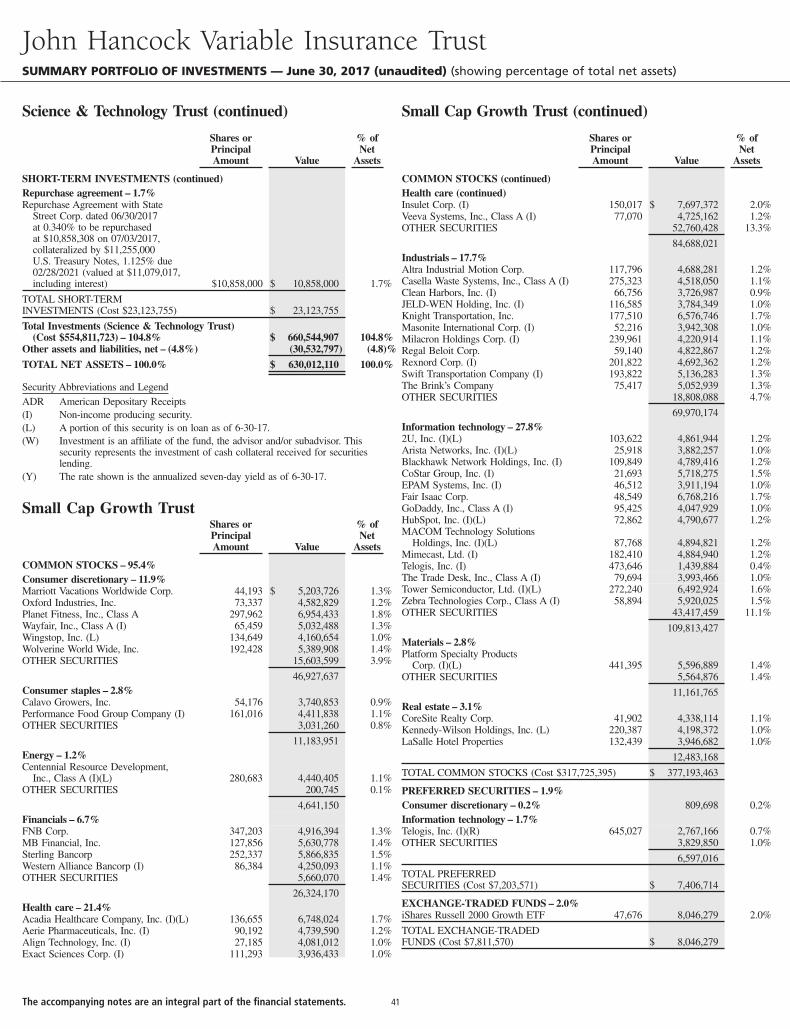
Shares orPrincipalAmount Value
% ofNet
Assets
SHORT-TERM INVESTMENTS (continued)Repurchase agreement – 1.7%Repurchase Agreement with State
Street Corp. dated 06/30/2017at 0.340% to be repurchasedat $10,858,308 on 07/03/2017,collateralized by $11,255,000U.S. Treasury Notes, 1.125% due02/28/2021 (valued at $11,079,017,including interest) $10,858,000 $ 10,858,000 1.7%
TOTAL SHORT-TERMINVESTMENTS (Cost $23,123,755) $ 23,123,755
Total Investments (Science & Technology Trust)(Cost $554,811,723) – 104.8% $ 660,544,907 104.8%
Other assets and liabilities, net – (4.8%) (30,532,797) (4.8)%
TOTAL NET ASSETS – 100.0% $ 630,012,110 100.0%
Security Abbreviations and LegendADR American Depositary Receipts(I) Non-income producing security.(L) A portion of this security is on loan as of 6-30-17.(W) Investment is an affiliate of the fund, the advisor and/or subadvisor. This
security represents the investment of cash collateral received for securitieslending.
(Y) The rate shown is the annualized seven-day yield as of 6-30-17.
Small Cap Growth TrustShares orPrincipalAmount Value
% ofNet
Assets
COMMON STOCKS – 95.4%Consumer discretionary – 11.9%Marriott Vacations Worldwide Corp. 44,193 $ 5,203,726 1.3%Oxford Industries, Inc. 73,337 4,582,829 1.2%Planet Fitness, Inc., Class A 297,962 6,954,433 1.8%Wayfair, Inc., Class A (I) 65,459 5,032,488 1.3%Wingstop, Inc. (L) 134,649 4,160,654 1.0%Wolverine World Wide, Inc. 192,428 5,389,908 1.4%OTHER SECURITIES 15,603,599 3.9%
46,927,637Consumer staples – 2.8%Calavo Growers, Inc. 54,176 3,740,853 0.9%Performance Food Group Company (I) 161,016 4,411,838 1.1%OTHER SECURITIES 3,031,260 0.8%
11,183,951Energy – 1.2%Centennial Resource Development,
Inc., Class A (I)(L) 280,683 4,440,405 1.1%OTHER SECURITIES 200,745 0.1%
4,641,150Financials – 6.7%FNB Corp. 347,203 4,916,394 1.3%MB Financial, Inc. 127,856 5,630,778 1.4%Sterling Bancorp 252,337 5,866,835 1.5%Western Alliance Bancorp (I) 86,384 4,250,093 1.1%OTHER SECURITIES 5,660,070 1.4%
26,324,170Health care – 21.4%Acadia Healthcare Company, Inc. (I)(L) 136,655 6,748,024 1.7%Aerie Pharmaceuticals, Inc. (I) 90,192 4,739,590 1.2%Align Technology, Inc. (I) 27,185 4,081,012 1.0%Exact Sciences Corp. (I) 111,293 3,936,433 1.0%
Shares orPrincipalAmount Value
% ofNet
Assets
COMMON STOCKS (continued)Health care (continued)Insulet Corp. (I) 150,017 $ 7,697,372 2.0%Veeva Systems, Inc., Class A (I) 77,070 4,725,162 1.2%OTHER SECURITIES 52,760,428 13.3%
84,688,021Industrials – 17.7%Altra Industrial Motion Corp. 117,796 4,688,281 1.2%Casella Waste Systems, Inc., Class A (I) 275,323 4,518,050 1.1%Clean Harbors, Inc. (I) 66,756 3,726,987 0.9%JELD-WEN Holding, Inc. (I) 116,585 3,784,349 1.0%Knight Transportation, Inc. 177,510 6,576,746 1.7%Masonite International Corp. (I) 52,216 3,942,308 1.0%Milacron Holdings Corp. (I) 239,961 4,220,914 1.1%Regal Beloit Corp. 59,140 4,822,867 1.2%Rexnord Corp. (I) 201,822 4,692,362 1.2%Swift Transportation Company (I) 193,822 5,136,283 1.3%The Brink’s Company 75,417 5,052,939 1.3%OTHER SECURITIES 18,808,088 4.7%
69,970,174Information technology – 27.8%2U, Inc. (I)(L) 103,622 4,861,944 1.2%Arista Networks, Inc. (I)(L) 25,918 3,882,257 1.0%Blackhawk Network Holdings, Inc. (I) 109,849 4,789,416 1.2%CoStar Group, Inc. (I) 21,693 5,718,275 1.5%EPAM Systems, Inc. (I) 46,512 3,911,194 1.0%Fair Isaac Corp. 48,549 6,768,216 1.7%GoDaddy, Inc., Class A (I) 95,425 4,047,929 1.0%HubSpot, Inc. (I)(L) 72,862 4,790,677 1.2%MACOM Technology Solutions
Holdings, Inc. (I)(L) 87,768 4,894,821 1.2%Mimecast, Ltd. (I) 182,410 4,884,940 1.2%Telogis, Inc. (I) 473,646 1,439,884 0.4%The Trade Desk, Inc., Class A (I) 79,694 3,993,466 1.0%Tower Semiconductor, Ltd. (I)(L) 272,240 6,492,924 1.6%Zebra Technologies Corp., Class A (I) 58,894 5,920,025 1.5%OTHER SECURITIES 43,417,459 11.1%
109,813,427Materials – 2.8%Platform Specialty Products
Corp. (I)(L) 441,395 5,596,889 1.4%OTHER SECURITIES 5,564,876 1.4%
11,161,765Real estate – 3.1%CoreSite Realty Corp. 41,902 4,338,114 1.1%Kennedy-Wilson Holdings, Inc. (L) 220,387 4,198,372 1.0%LaSalle Hotel Properties 132,439 3,946,682 1.0%
12,483,168
TOTAL COMMON STOCKS (Cost $317,725,395) $ 377,193,463
PREFERRED SECURITIES – 1.9%Consumer discretionary – 0.2% 809,698 0.2%Information technology – 1.7%Telogis, Inc. (I)(R) 645,027 2,767,166 0.7%OTHER SECURITIES 3,829,850 1.0%
6,597,016
TOTAL PREFERREDSECURITIES (Cost $7,203,571) $ 7,406,714
EXCHANGE-TRADED FUNDS – 2.0%iShares Russell 2000 Growth ETF 47,676 8,046,279 2.0%
TOTAL EXCHANGE-TRADEDFUNDS (Cost $7,811,570) $ 8,046,279
John Hancock Variable Insurance TrustSUMMARY PORTFOLIO OF INVESTMENTS — June 30, 2017 (unaudited) (showing percentage of total net assets)
Science & Technology Trust (continued) Small Cap Growth Trust (continued)
The accompanying notes are an integral part of the financial statements. 41
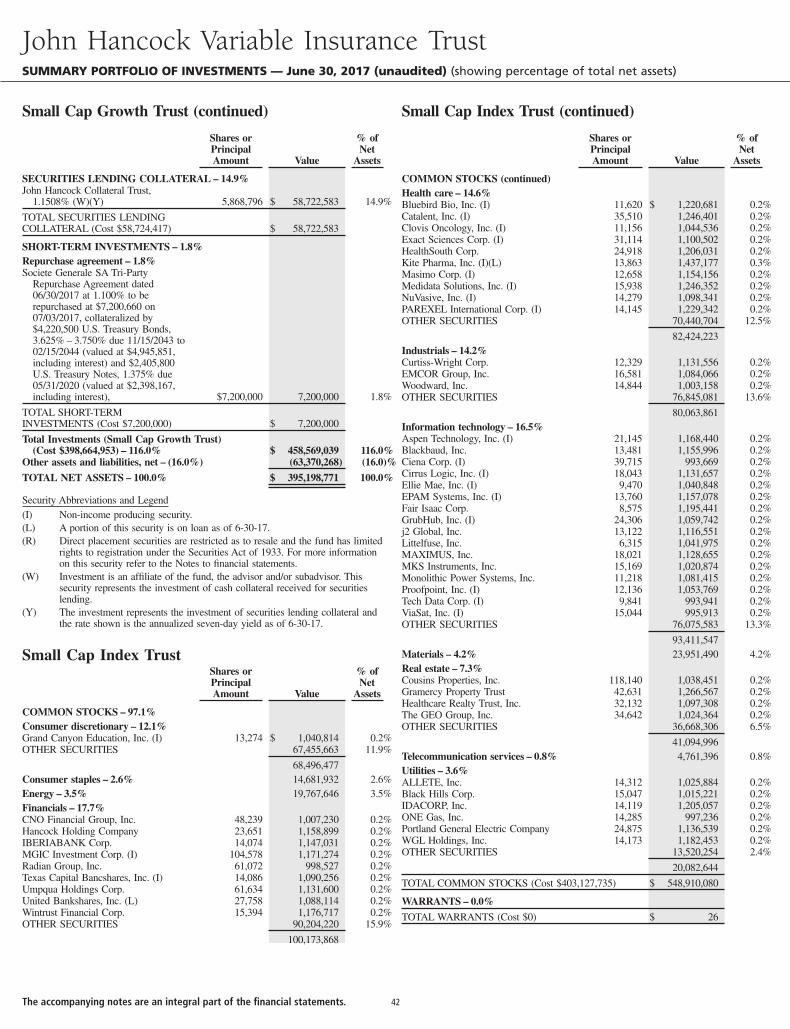
Shares orPrincipalAmount Value
% ofNet
Assets
SECURITIES LENDING COLLATERAL – 14.9%John Hancock Collateral Trust,
1.1508% (W)(Y) 5,868,796 $ 58,722,583 14.9%
TOTAL SECURITIES LENDINGCOLLATERAL (Cost $58,724,417) $ 58,722,583
SHORT-TERM INVESTMENTS – 1.8%Repurchase agreement – 1.8%Societe Generale SA Tri-Party
Repurchase Agreement dated06/30/2017 at 1.100% to berepurchased at $7,200,660 on07/03/2017, collateralized by$4,220,500 U.S. Treasury Bonds,3.625% – 3.750% due 11/15/2043 to02/15/2044 (valued at $4,945,851,including interest) and $2,405,800U.S. Treasury Notes, 1.375% due05/31/2020 (valued at $2,398,167,including interest), $7,200,000 7,200,000 1.8%
TOTAL SHORT-TERMINVESTMENTS (Cost $7,200,000) $ 7,200,000
Total Investments (Small Cap Growth Trust)(Cost $398,664,953) – 116.0% $ 458,569,039 116.0%
Other assets and liabilities, net – (16.0%) (63,370,268) (16.0)%
TOTAL NET ASSETS – 100.0% $ 395,198,771 100.0%
Security Abbreviations and Legend(I) Non-income producing security.(L) A portion of this security is on loan as of 6-30-17.(R) Direct placement securities are restricted as to resale and the fund has limited
rights to registration under the Securities Act of 1933. For more informationon this security refer to the Notes to financial statements.
(W) Investment is an affiliate of the fund, the advisor and/or subadvisor. Thissecurity represents the investment of cash collateral received for securitieslending.
(Y) The investment represents the investment of securities lending collateral andthe rate shown is the annualized seven-day yield as of 6-30-17.
Small Cap Index TrustShares orPrincipalAmount Value
% ofNet
Assets
COMMON STOCKS – 97.1%Consumer discretionary – 12.1%Grand Canyon Education, Inc. (I) 13,274 $ 1,040,814 0.2%OTHER SECURITIES 67,455,663 11.9%
68,496,477Consumer staples – 2.6% 14,681,932 2.6%Energy – 3.5% 19,767,646 3.5%Financials – 17.7%CNO Financial Group, Inc. 48,239 1,007,230 0.2%Hancock Holding Company 23,651 1,158,899 0.2%IBERIABANK Corp. 14,074 1,147,031 0.2%MGIC Investment Corp. (I) 104,578 1,171,274 0.2%Radian Group, Inc. 61,072 998,527 0.2%Texas Capital Bancshares, Inc. (I) 14,086 1,090,256 0.2%Umpqua Holdings Corp. 61,634 1,131,600 0.2%United Bankshares, Inc. (L) 27,758 1,088,114 0.2%Wintrust Financial Corp. 15,394 1,176,717 0.2%OTHER SECURITIES 90,204,220 15.9%
100,173,868
Shares orPrincipalAmount Value
% ofNet
Assets
COMMON STOCKS (continued)Health care – 14.6%Bluebird Bio, Inc. (I) 11,620 $ 1,220,681 0.2%Catalent, Inc. (I) 35,510 1,246,401 0.2%Clovis Oncology, Inc. (I) 11,156 1,044,536 0.2%Exact Sciences Corp. (I) 31,114 1,100,502 0.2%HealthSouth Corp. 24,918 1,206,031 0.2%Kite Pharma, Inc. (I)(L) 13,863 1,437,177 0.3%Masimo Corp. (I) 12,658 1,154,156 0.2%Medidata Solutions, Inc. (I) 15,938 1,246,352 0.2%NuVasive, Inc. (I) 14,279 1,098,341 0.2%PAREXEL International Corp. (I) 14,145 1,229,342 0.2%OTHER SECURITIES 70,440,704 12.5%
82,424,223Industrials – 14.2%Curtiss-Wright Corp. 12,329 1,131,556 0.2%EMCOR Group, Inc. 16,581 1,084,066 0.2%Woodward, Inc. 14,844 1,003,158 0.2%OTHER SECURITIES 76,845,081 13.6%
80,063,861Information technology – 16.5%Aspen Technology, Inc. (I) 21,145 1,168,440 0.2%Blackbaud, Inc. 13,481 1,155,996 0.2%Ciena Corp. (I) 39,715 993,669 0.2%Cirrus Logic, Inc. (I) 18,043 1,131,657 0.2%Ellie Mae, Inc. (I) 9,470 1,040,848 0.2%EPAM Systems, Inc. (I) 13,760 1,157,078 0.2%Fair Isaac Corp. 8,575 1,195,441 0.2%GrubHub, Inc. (I) 24,306 1,059,742 0.2%j2 Global, Inc. 13,122 1,116,551 0.2%Littelfuse, Inc. 6,315 1,041,975 0.2%MAXIMUS, Inc. 18,021 1,128,655 0.2%MKS Instruments, Inc. 15,169 1,020,874 0.2%Monolithic Power Systems, Inc. 11,218 1,081,415 0.2%Proofpoint, Inc. (I) 12,136 1,053,769 0.2%Tech Data Corp. (I) 9,841 993,941 0.2%ViaSat, Inc. (I) 15,044 995,913 0.2%OTHER SECURITIES 76,075,583 13.3%
93,411,547Materials – 4.2% 23,951,490 4.2%Real estate – 7.3%Cousins Properties, Inc. 118,140 1,038,451 0.2%Gramercy Property Trust 42,631 1,266,567 0.2%Healthcare Realty Trust, Inc. 32,132 1,097,308 0.2%The GEO Group, Inc. 34,642 1,024,364 0.2%OTHER SECURITIES 36,668,306 6.5%
41,094,996Telecommunication services – 0.8% 4,761,396 0.8%Utilities – 3.6%ALLETE, Inc. 14,312 1,025,884 0.2%Black Hills Corp. 15,047 1,015,221 0.2%IDACORP, Inc. 14,119 1,205,057 0.2%ONE Gas, Inc. 14,285 997,236 0.2%Portland General Electric Company 24,875 1,136,539 0.2%WGL Holdings, Inc. 14,173 1,182,453 0.2%OTHER SECURITIES 13,520,254 2.4%
20,082,644
TOTAL COMMON STOCKS (Cost $403,127,735) $ 548,910,080
WARRANTS – 0.0%
TOTAL WARRANTS (Cost $0) $ 26
John Hancock Variable Insurance TrustSUMMARY PORTFOLIO OF INVESTMENTS — June 30, 2017 (unaudited) (showing percentage of total net assets)
Small Cap Growth Trust (continued) Small Cap Index Trust (continued)
The accompanying notes are an integral part of the financial statements. 42
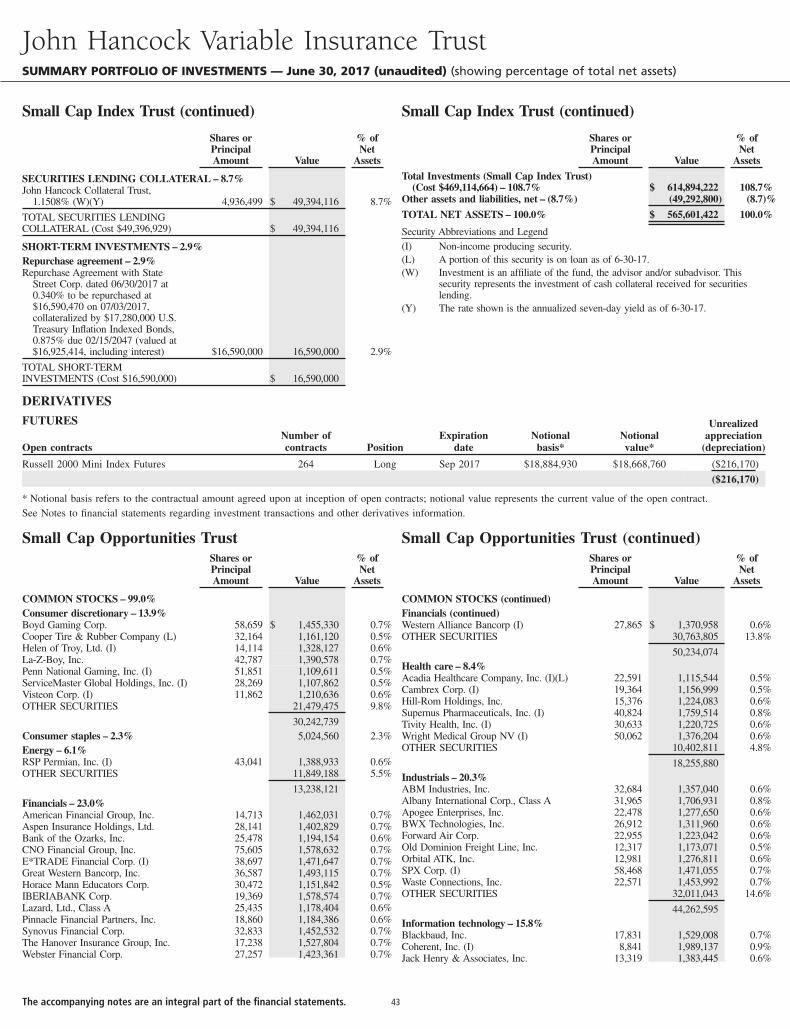
Shares orPrincipalAmount Value
% ofNet
Assets
SECURITIES LENDING COLLATERAL – 8.7%John Hancock Collateral Trust,
1.1508% (W)(Y) 4,936,499 $ 49,394,116 8.7%
TOTAL SECURITIES LENDINGCOLLATERAL (Cost $49,396,929) $ 49,394,116
SHORT-TERM INVESTMENTS – 2.9%Repurchase agreement – 2.9%Repurchase Agreement with State
Street Corp. dated 06/30/2017 at0.340% to be repurchased at$16,590,470 on 07/03/2017,collateralized by $17,280,000 U.S.Treasury Inflation Indexed Bonds,0.875% due 02/15/2047 (valued at$16,925,414, including interest) $16,590,000 16,590,000 2.9%
TOTAL SHORT-TERMINVESTMENTS (Cost $16,590,000) $ 16,590,000
Shares orPrincipalAmount Value
% ofNet
Assets
Total Investments (Small Cap Index Trust)(Cost $469,114,664) – 108.7% $ 614,894,222 108.7%
Other assets and liabilities, net – (8.7%) (49,292,800) (8.7)%
TOTAL NET ASSETS – 100.0% $ 565,601,422 100.0%
Security Abbreviations and Legend(I) Non-income producing security.(L) A portion of this security is on loan as of 6-30-17.(W) Investment is an affiliate of the fund, the advisor and/or subadvisor. This
security represents the investment of cash collateral received for securitieslending.
(Y) The rate shown is the annualized seven-day yield as of 6-30-17.
DERIVATIVESFUTURES
Open contractsNumber ofcontracts Position
Expirationdate
Notionalbasis*
Notionalvalue*
Unrealizedappreciation
(depreciation)
Russell 2000 Mini Index Futures 264 Long Sep 2017 $18,884,930 $18,668,760 ($216,170)
($216,170)
* Notional basis refers to the contractual amount agreed upon at inception of open contracts; notional value represents the current value of the open contract.See Notes to financial statements regarding investment transactions and other derivatives information.
Small Cap Opportunities TrustShares orPrincipalAmount Value
% ofNet
Assets
COMMON STOCKS – 99.0%Consumer discretionary – 13.9%Boyd Gaming Corp. 58,659 $ 1,455,330 0.7%Cooper Tire & Rubber Company (L) 32,164 1,161,120 0.5%Helen of Troy, Ltd. (I) 14,114 1,328,127 0.6%La-Z-Boy, Inc. 42,787 1,390,578 0.7%Penn National Gaming, Inc. (I) 51,851 1,109,611 0.5%ServiceMaster Global Holdings, Inc. (I) 28,269 1,107,862 0.5%Visteon Corp. (I) 11,862 1,210,636 0.6%OTHER SECURITIES 21,479,475 9.8%
30,242,739Consumer staples – 2.3% 5,024,560 2.3%Energy – 6.1%RSP Permian, Inc. (I) 43,041 1,388,933 0.6%OTHER SECURITIES 11,849,188 5.5%
13,238,121Financials – 23.0%American Financial Group, Inc. 14,713 1,462,031 0.7%Aspen Insurance Holdings, Ltd. 28,141 1,402,829 0.7%Bank of the Ozarks, Inc. 25,478 1,194,154 0.6%CNO Financial Group, Inc. 75,605 1,578,632 0.7%E*TRADE Financial Corp. (I) 38,697 1,471,647 0.7%Great Western Bancorp, Inc. 36,587 1,493,115 0.7%Horace Mann Educators Corp. 30,472 1,151,842 0.5%IBERIABANK Corp. 19,369 1,578,574 0.7%Lazard, Ltd., Class A 25,435 1,178,404 0.6%Pinnacle Financial Partners, Inc. 18,860 1,184,386 0.6%Synovus Financial Corp. 32,833 1,452,532 0.7%The Hanover Insurance Group, Inc. 17,238 1,527,804 0.7%Webster Financial Corp. 27,257 1,423,361 0.7%
Small Cap Opportunities Trust (continued)Shares orPrincipalAmount Value
% ofNet
Assets
COMMON STOCKS (continued)Financials (continued)Western Alliance Bancorp (I) 27,865 $ 1,370,958 0.6%OTHER SECURITIES 30,763,805 13.8%
50,234,074Health care – 8.4%Acadia Healthcare Company, Inc. (I)(L) 22,591 1,115,544 0.5%Cambrex Corp. (I) 19,364 1,156,999 0.5%Hill-Rom Holdings, Inc. 15,376 1,224,083 0.6%Supernus Pharmaceuticals, Inc. (I) 40,824 1,759,514 0.8%Tivity Health, Inc. (I) 30,633 1,220,725 0.6%Wright Medical Group NV (I) 50,062 1,376,204 0.6%OTHER SECURITIES 10,402,811 4.8%
18,255,880Industrials – 20.3%ABM Industries, Inc. 32,684 1,357,040 0.6%Albany International Corp., Class A 31,965 1,706,931 0.8%Apogee Enterprises, Inc. 22,478 1,277,650 0.6%BWX Technologies, Inc. 26,912 1,311,960 0.6%Forward Air Corp. 22,955 1,223,042 0.6%Old Dominion Freight Line, Inc. 12,317 1,173,071 0.5%Orbital ATK, Inc. 12,981 1,276,811 0.6%SPX Corp. (I) 58,468 1,471,055 0.7%Waste Connections, Inc. 22,571 1,453,992 0.7%OTHER SECURITIES 32,011,043 14.6%
44,262,595Information technology – 15.8%Blackbaud, Inc. 17,831 1,529,008 0.7%Coherent, Inc. (I) 8,841 1,989,137 0.9%Jack Henry & Associates, Inc. 13,319 1,383,445 0.6%
John Hancock Variable Insurance TrustSUMMARY PORTFOLIO OF INVESTMENTS — June 30, 2017 (unaudited) (showing percentage of total net assets)
Small Cap Index Trust (continued) Small Cap Index Trust (continued)
The accompanying notes are an integral part of the financial statements. 43
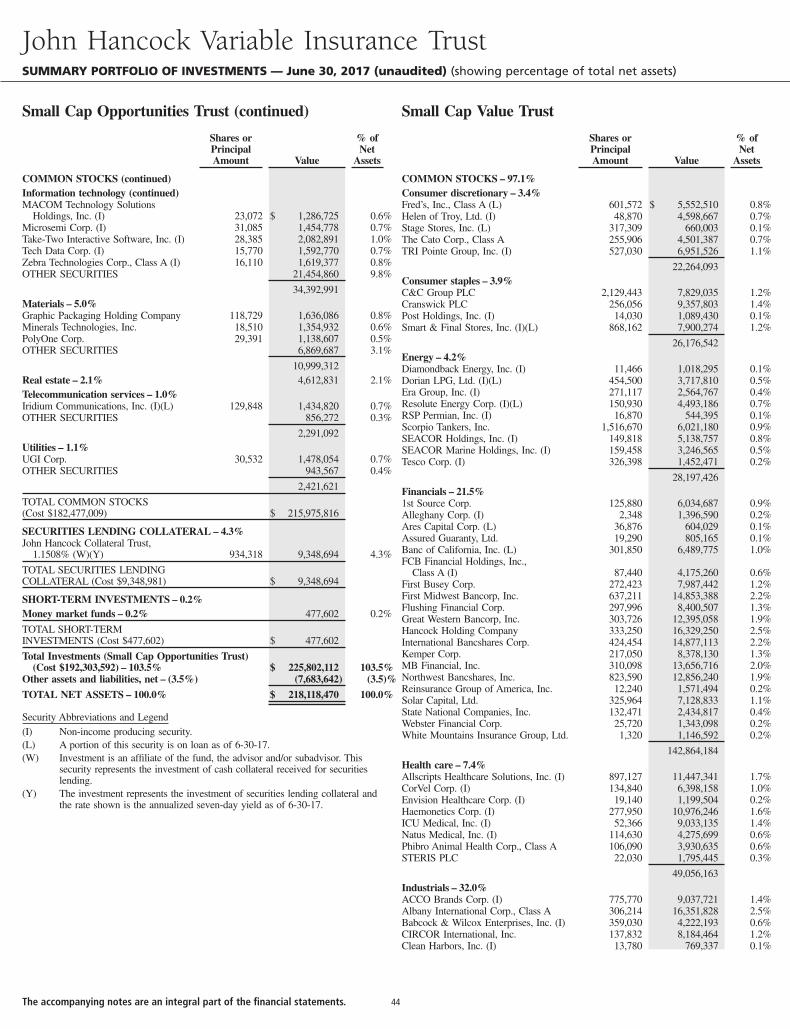
Shares orPrincipalAmount Value
% ofNet
Assets
COMMON STOCKS (continued)Information technology (continued)MACOM Technology Solutions
Holdings, Inc. (I) 23,072 $ 1,286,725 0.6%Microsemi Corp. (I) 31,085 1,454,778 0.7%Take-Two Interactive Software, Inc. (I) 28,385 2,082,891 1.0%Tech Data Corp. (I) 15,770 1,592,770 0.7%Zebra Technologies Corp., Class A (I) 16,110 1,619,377 0.8%OTHER SECURITIES 21,454,860 9.8%
34,392,991Materials – 5.0%Graphic Packaging Holding Company 118,729 1,636,086 0.8%Minerals Technologies, Inc. 18,510 1,354,932 0.6%PolyOne Corp. 29,391 1,138,607 0.5%OTHER SECURITIES 6,869,687 3.1%
10,999,312Real estate – 2.1% 4,612,831 2.1%Telecommunication services – 1.0%Iridium Communications, Inc. (I)(L) 129,848 1,434,820 0.7%OTHER SECURITIES 856,272 0.3%
2,291,092Utilities – 1.1%UGI Corp. 30,532 1,478,054 0.7%OTHER SECURITIES 943,567 0.4%
2,421,621
TOTAL COMMON STOCKS(Cost $182,477,009) $ 215,975,816
SECURITIES LENDING COLLATERAL – 4.3%John Hancock Collateral Trust,
1.1508% (W)(Y) 934,318 9,348,694 4.3%
TOTAL SECURITIES LENDINGCOLLATERAL (Cost $9,348,981) $ 9,348,694
SHORT-TERM INVESTMENTS – 0.2%Money market funds – 0.2% 477,602 0.2%
TOTAL SHORT-TERMINVESTMENTS (Cost $477,602) $ 477,602
Total Investments (Small Cap Opportunities Trust)(Cost $192,303,592) – 103.5% $ 225,802,112 103.5%
Other assets and liabilities, net – (3.5%) (7,683,642) (3.5)%
TOTAL NET ASSETS – 100.0% $ 218,118,470 100.0%
Security Abbreviations and Legend(I) Non-income producing security.(L) A portion of this security is on loan as of 6-30-17.(W) Investment is an affiliate of the fund, the advisor and/or subadvisor. This
security represents the investment of cash collateral received for securitieslending.
(Y) The investment represents the investment of securities lending collateral andthe rate shown is the annualized seven-day yield as of 6-30-17.
Shares orPrincipalAmount Value
% ofNet
Assets
COMMON STOCKS – 97.1%Consumer discretionary – 3.4%Fred’s, Inc., Class A (L) 601,572 $ 5,552,510 0.8%Helen of Troy, Ltd. (I) 48,870 4,598,667 0.7%Stage Stores, Inc. (L) 317,309 660,003 0.1%The Cato Corp., Class A 255,906 4,501,387 0.7%TRI Pointe Group, Inc. (I) 527,030 6,951,526 1.1%
22,264,093Consumer staples – 3.9%C&C Group PLC 2,129,443 7,829,035 1.2%Cranswick PLC 256,056 9,357,803 1.4%Post Holdings, Inc. (I) 14,030 1,089,430 0.1%Smart & Final Stores, Inc. (I)(L) 868,162 7,900,274 1.2%
26,176,542Energy – 4.2%Diamondback Energy, Inc. (I) 11,466 1,018,295 0.1%Dorian LPG, Ltd. (I)(L) 454,500 3,717,810 0.5%Era Group, Inc. (I) 271,117 2,564,767 0.4%Resolute Energy Corp. (I)(L) 150,930 4,493,186 0.7%RSP Permian, Inc. (I) 16,870 544,395 0.1%Scorpio Tankers, Inc. 1,516,670 6,021,180 0.9%SEACOR Holdings, Inc. (I) 149,818 5,138,757 0.8%SEACOR Marine Holdings, Inc. (I) 159,458 3,246,565 0.5%Tesco Corp. (I) 326,398 1,452,471 0.2%
28,197,426Financials – 21.5%1st Source Corp. 125,880 6,034,687 0.9%Alleghany Corp. (I) 2,348 1,396,590 0.2%Ares Capital Corp. (L) 36,876 604,029 0.1%Assured Guaranty, Ltd. 19,290 805,165 0.1%Banc of California, Inc. (L) 301,850 6,489,775 1.0%FCB Financial Holdings, Inc.,
Class A (I) 87,440 4,175,260 0.6%First Busey Corp. 272,423 7,987,442 1.2%First Midwest Bancorp, Inc. 637,211 14,853,388 2.2%Flushing Financial Corp. 297,996 8,400,507 1.3%Great Western Bancorp, Inc. 303,726 12,395,058 1.9%Hancock Holding Company 333,250 16,329,250 2.5%International Bancshares Corp. 424,454 14,877,113 2.2%Kemper Corp. 217,050 8,378,130 1.3%MB Financial, Inc. 310,098 13,656,716 2.0%Northwest Bancshares, Inc. 823,590 12,856,240 1.9%Reinsurance Group of America, Inc. 12,240 1,571,494 0.2%Solar Capital, Ltd. 325,964 7,128,833 1.1%State National Companies, Inc. 132,471 2,434,817 0.4%Webster Financial Corp. 25,720 1,343,098 0.2%White Mountains Insurance Group, Ltd. 1,320 1,146,592 0.2%
142,864,184Health care – 7.4%Allscripts Healthcare Solutions, Inc. (I) 897,127 11,447,341 1.7%CorVel Corp. (I) 134,840 6,398,158 1.0%Envision Healthcare Corp. (I) 19,140 1,199,504 0.2%Haemonetics Corp. (I) 277,950 10,976,246 1.6%ICU Medical, Inc. (I) 52,366 9,033,135 1.4%Natus Medical, Inc. (I) 114,630 4,275,699 0.6%Phibro Animal Health Corp., Class A 106,090 3,930,635 0.6%STERIS PLC 22,030 1,795,445 0.3%
49,056,163Industrials – 32.0%ACCO Brands Corp. (I) 775,770 9,037,721 1.4%Albany International Corp., Class A 306,214 16,351,828 2.5%Babcock & Wilcox Enterprises, Inc. (I) 359,030 4,222,193 0.6%CIRCOR International, Inc. 137,832 8,184,464 1.2%Clean Harbors, Inc. (I) 13,780 769,337 0.1%
John Hancock Variable Insurance TrustSUMMARY PORTFOLIO OF INVESTMENTS — June 30, 2017 (unaudited) (showing percentage of total net assets)
Small Cap Opportunities Trust (continued) Small Cap Value Trust
The accompanying notes are an integral part of the financial statements. 44
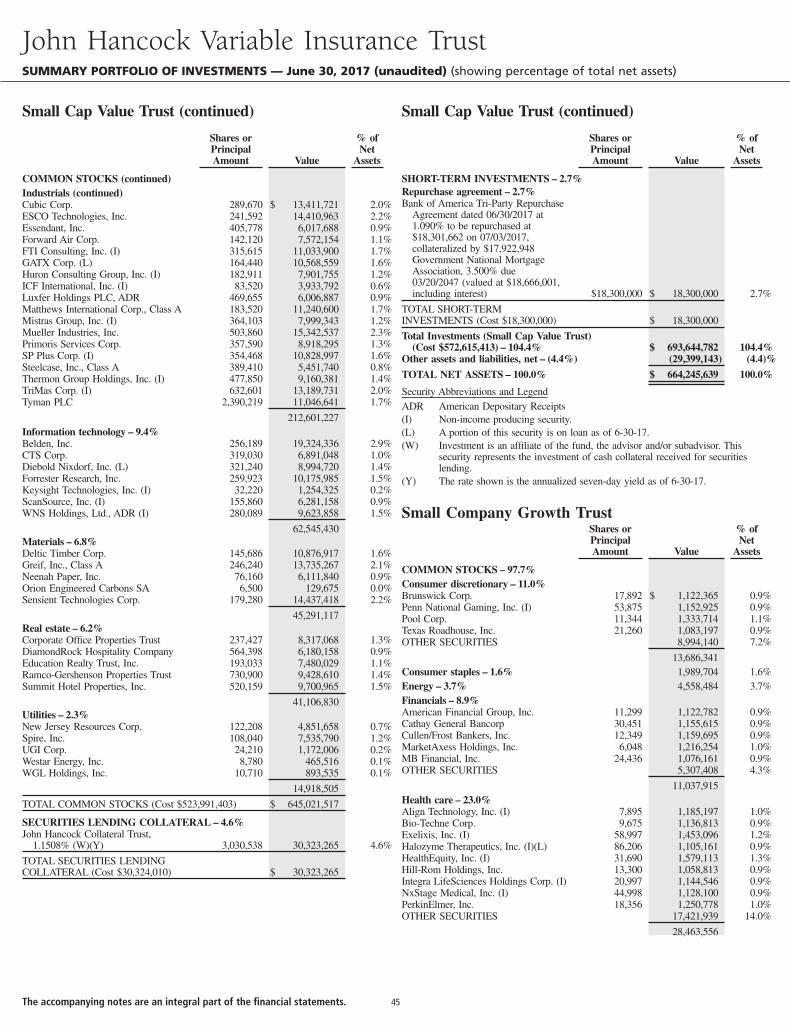
Shares orPrincipalAmount Value
% ofNet
Assets
COMMON STOCKS (continued)Industrials (continued)Cubic Corp. 289,670 $ 13,411,721 2.0%ESCO Technologies, Inc. 241,592 14,410,963 2.2%Essendant, Inc. 405,778 6,017,688 0.9%Forward Air Corp. 142,120 7,572,154 1.1%FTI Consulting, Inc. (I) 315,615 11,033,900 1.7%GATX Corp. (L) 164,440 10,568,559 1.6%Huron Consulting Group, Inc. (I) 182,911 7,901,755 1.2%ICF International, Inc. (I) 83,520 3,933,792 0.6%Luxfer Holdings PLC, ADR 469,655 6,006,887 0.9%Matthews International Corp., Class A 183,520 11,240,600 1.7%Mistras Group, Inc. (I) 364,103 7,999,343 1.2%Mueller Industries, Inc. 503,860 15,342,537 2.3%Primoris Services Corp. 357,590 8,918,295 1.3%SP Plus Corp. (I) 354,468 10,828,997 1.6%Steelcase, Inc., Class A 389,410 5,451,740 0.8%Thermon Group Holdings, Inc. (I) 477,850 9,160,381 1.4%TriMas Corp. (I) 632,601 13,189,731 2.0%Tyman PLC 2,390,219 11,046,641 1.7%
212,601,227Information technology – 9.4%Belden, Inc. 256,189 19,324,336 2.9%CTS Corp. 319,030 6,891,048 1.0%Diebold Nixdorf, Inc. (L) 321,240 8,994,720 1.4%Forrester Research, Inc. 259,923 10,175,985 1.5%Keysight Technologies, Inc. (I) 32,220 1,254,325 0.2%ScanSource, Inc. (I) 155,860 6,281,158 0.9%WNS Holdings, Ltd., ADR (I) 280,089 9,623,858 1.5%
62,545,430Materials – 6.8%Deltic Timber Corp. 145,686 10,876,917 1.6%Greif, Inc., Class A 246,240 13,735,267 2.1%Neenah Paper, Inc. 76,160 6,111,840 0.9%Orion Engineered Carbons SA 6,500 129,675 0.0%Sensient Technologies Corp. 179,280 14,437,418 2.2%
45,291,117Real estate – 6.2%Corporate Office Properties Trust 237,427 8,317,068 1.3%DiamondRock Hospitality Company 564,398 6,180,158 0.9%Education Realty Trust, Inc. 193,033 7,480,029 1.1%Ramco-Gershenson Properties Trust 730,900 9,428,610 1.4%Summit Hotel Properties, Inc. 520,159 9,700,965 1.5%
41,106,830Utilities – 2.3%New Jersey Resources Corp. 122,208 4,851,658 0.7%Spire, Inc. 108,040 7,535,790 1.2%UGI Corp. 24,210 1,172,006 0.2%Westar Energy, Inc. 8,780 465,516 0.1%WGL Holdings, Inc. 10,710 893,535 0.1%
14,918,505
TOTAL COMMON STOCKS (Cost $523,991,403) $ 645,021,517
SECURITIES LENDING COLLATERAL – 4.6%John Hancock Collateral Trust,
1.1508% (W)(Y) 3,030,538 30,323,265 4.6%
TOTAL SECURITIES LENDINGCOLLATERAL (Cost $30,324,010) $ 30,323,265
Shares orPrincipalAmount Value
% ofNet
Assets
SHORT-TERM INVESTMENTS – 2.7%Repurchase agreement – 2.7%Bank of America Tri-Party Repurchase
Agreement dated 06/30/2017 at1.090% to be repurchased at$18,301,662 on 07/03/2017,collateralized by $17,922,948Government National MortgageAssociation, 3.500% due03/20/2047 (valued at $18,666,001,including interest) $18,300,000 $ 18,300,000 2.7%
TOTAL SHORT-TERMINVESTMENTS (Cost $18,300,000) $ 18,300,000
Total Investments (Small Cap Value Trust)(Cost $572,615,413) – 104.4% $ 693,644,782 104.4%
Other assets and liabilities, net – (4.4%) (29,399,143) (4.4)%
TOTAL NET ASSETS – 100.0% $ 664,245,639 100.0%
Security Abbreviations and LegendADR American Depositary Receipts(I) Non-income producing security.(L) A portion of this security is on loan as of 6-30-17.(W) Investment is an affiliate of the fund, the advisor and/or subadvisor. This
security represents the investment of cash collateral received for securitieslending.
(Y) The rate shown is the annualized seven-day yield as of 6-30-17.
Small Company Growth TrustShares orPrincipalAmount Value
% ofNet
Assets
COMMON STOCKS – 97.7%Consumer discretionary – 11.0%Brunswick Corp. 17,892 $ 1,122,365 0.9%Penn National Gaming, Inc. (I) 53,875 1,152,925 0.9%Pool Corp. 11,344 1,333,714 1.1%Texas Roadhouse, Inc. 21,260 1,083,197 0.9%OTHER SECURITIES 8,994,140 7.2%
13,686,341Consumer staples – 1.6% 1,989,704 1.6%Energy – 3.7% 4,558,484 3.7%Financials – 8.9%American Financial Group, Inc. 11,299 1,122,782 0.9%Cathay General Bancorp 30,451 1,155,615 0.9%Cullen/Frost Bankers, Inc. 12,349 1,159,695 0.9%MarketAxess Holdings, Inc. 6,048 1,216,254 1.0%MB Financial, Inc. 24,436 1,076,161 0.9%OTHER SECURITIES 5,307,408 4.3%
11,037,915Health care – 23.0%Align Technology, Inc. (I) 7,895 1,185,197 1.0%Bio-Techne Corp. 9,675 1,136,813 0.9%Exelixis, Inc. (I) 58,997 1,453,096 1.2%Halozyme Therapeutics, Inc. (I)(L) 86,206 1,105,161 0.9%HealthEquity, Inc. (I) 31,690 1,579,113 1.3%Hill-Rom Holdings, Inc. 13,300 1,058,813 0.9%Integra LifeSciences Holdings Corp. (I) 20,997 1,144,546 0.9%NxStage Medical, Inc. (I) 44,998 1,128,100 0.9%PerkinElmer, Inc. 18,356 1,250,778 1.0%OTHER SECURITIES 17,421,939 14.0%
28,463,556
John Hancock Variable Insurance TrustSUMMARY PORTFOLIO OF INVESTMENTS — June 30, 2017 (unaudited) (showing percentage of total net assets)
Small Cap Value Trust (continued) Small Cap Value Trust (continued)
The accompanying notes are an integral part of the financial statements. 45
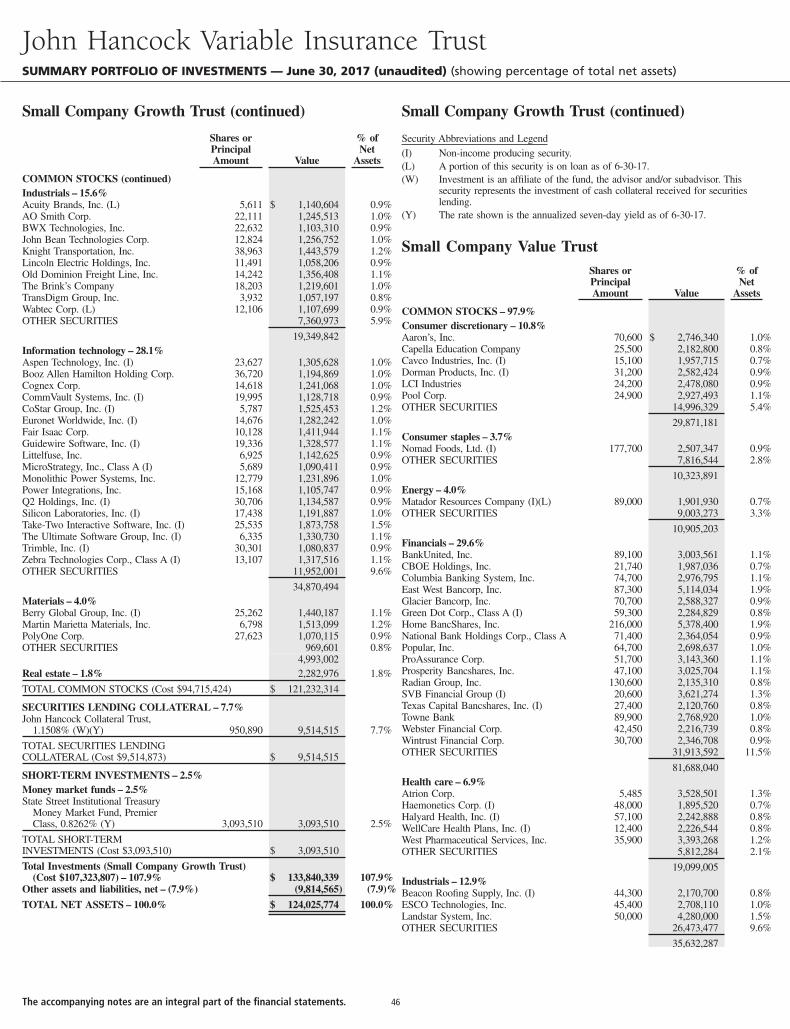
Shares orPrincipalAmount Value
% ofNet
Assets
COMMON STOCKS (continued)Industrials – 15.6%Acuity Brands, Inc. (L) 5,611 $ 1,140,604 0.9%AO Smith Corp. 22,111 1,245,513 1.0%BWX Technologies, Inc. 22,632 1,103,310 0.9%John Bean Technologies Corp. 12,824 1,256,752 1.0%Knight Transportation, Inc. 38,963 1,443,579 1.2%Lincoln Electric Holdings, Inc. 11,491 1,058,206 0.9%Old Dominion Freight Line, Inc. 14,242 1,356,408 1.1%The Brink’s Company 18,203 1,219,601 1.0%TransDigm Group, Inc. 3,932 1,057,197 0.8%Wabtec Corp. (L) 12,106 1,107,699 0.9%OTHER SECURITIES 7,360,973 5.9%
19,349,842Information technology – 28.1%Aspen Technology, Inc. (I) 23,627 1,305,628 1.0%Booz Allen Hamilton Holding Corp. 36,720 1,194,869 1.0%Cognex Corp. 14,618 1,241,068 1.0%CommVault Systems, Inc. (I) 19,995 1,128,718 0.9%CoStar Group, Inc. (I) 5,787 1,525,453 1.2%Euronet Worldwide, Inc. (I) 14,676 1,282,242 1.0%Fair Isaac Corp. 10,128 1,411,944 1.1%Guidewire Software, Inc. (I) 19,336 1,328,577 1.1%Littelfuse, Inc. 6,925 1,142,625 0.9%MicroStrategy, Inc., Class A (I) 5,689 1,090,411 0.9%Monolithic Power Systems, Inc. 12,779 1,231,896 1.0%Power Integrations, Inc. 15,168 1,105,747 0.9%Q2 Holdings, Inc. (I) 30,706 1,134,587 0.9%Silicon Laboratories, Inc. (I) 17,438 1,191,887 1.0%Take-Two Interactive Software, Inc. (I) 25,535 1,873,758 1.5%The Ultimate Software Group, Inc. (I) 6,335 1,330,730 1.1%Trimble, Inc. (I) 30,301 1,080,837 0.9%Zebra Technologies Corp., Class A (I) 13,107 1,317,516 1.1%OTHER SECURITIES 11,952,001 9.6%
34,870,494Materials – 4.0%Berry Global Group, Inc. (I) 25,262 1,440,187 1.1%Martin Marietta Materials, Inc. 6,798 1,513,099 1.2%PolyOne Corp. 27,623 1,070,115 0.9%OTHER SECURITIES 969,601 0.8%
4,993,002Real estate – 1.8% 2,282,976 1.8%
TOTAL COMMON STOCKS (Cost $94,715,424) $ 121,232,314
SECURITIES LENDING COLLATERAL – 7.7%John Hancock Collateral Trust,
1.1508% (W)(Y) 950,890 9,514,515 7.7%
TOTAL SECURITIES LENDINGCOLLATERAL (Cost $9,514,873) $ 9,514,515
SHORT-TERM INVESTMENTS – 2.5%Money market funds – 2.5%State Street Institutional Treasury
Money Market Fund, PremierClass, 0.8262% (Y) 3,093,510 3,093,510 2.5%
TOTAL SHORT-TERMINVESTMENTS (Cost $3,093,510) $ 3,093,510
Total Investments (Small Company Growth Trust)(Cost $107,323,807) – 107.9% $ 133,840,339 107.9%
Other assets and liabilities, net – (7.9%) (9,814,565) (7.9)%
TOTAL NET ASSETS – 100.0% $ 124,025,774 100.0%
Security Abbreviations and Legend(I) Non-income producing security.(L) A portion of this security is on loan as of 6-30-17.(W) Investment is an affiliate of the fund, the advisor and/or subadvisor. This
security represents the investment of cash collateral received for securitieslending.
(Y) The rate shown is the annualized seven-day yield as of 6-30-17.
Small Company Value TrustShares orPrincipalAmount Value
% ofNet
Assets
COMMON STOCKS – 97.9%Consumer discretionary – 10.8%Aaron’s, Inc. 70,600 $ 2,746,340 1.0%Capella Education Company 25,500 2,182,800 0.8%Cavco Industries, Inc. (I) 15,100 1,957,715 0.7%Dorman Products, Inc. (I) 31,200 2,582,424 0.9%LCI Industries 24,200 2,478,080 0.9%Pool Corp. 24,900 2,927,493 1.1%OTHER SECURITIES 14,996,329 5.4%
29,871,181Consumer staples – 3.7%Nomad Foods, Ltd. (I) 177,700 2,507,347 0.9%OTHER SECURITIES 7,816,544 2.8%
10,323,891Energy – 4.0%Matador Resources Company (I)(L) 89,000 1,901,930 0.7%OTHER SECURITIES 9,003,273 3.3%
10,905,203Financials – 29.6%BankUnited, Inc. 89,100 3,003,561 1.1%CBOE Holdings, Inc. 21,740 1,987,036 0.7%Columbia Banking System, Inc. 74,700 2,976,795 1.1%East West Bancorp, Inc. 87,300 5,114,034 1.9%Glacier Bancorp, Inc. 70,700 2,588,327 0.9%Green Dot Corp., Class A (I) 59,300 2,284,829 0.8%Home BancShares, Inc. 216,000 5,378,400 1.9%National Bank Holdings Corp., Class A 71,400 2,364,054 0.9%Popular, Inc. 64,700 2,698,637 1.0%ProAssurance Corp. 51,700 3,143,360 1.1%Prosperity Bancshares, Inc. 47,100 3,025,704 1.1%Radian Group, Inc. 130,600 2,135,310 0.8%SVB Financial Group (I) 20,600 3,621,274 1.3%Texas Capital Bancshares, Inc. (I) 27,400 2,120,760 0.8%Towne Bank 89,900 2,768,920 1.0%Webster Financial Corp. 42,450 2,216,739 0.8%Wintrust Financial Corp. 30,700 2,346,708 0.9%OTHER SECURITIES 31,913,592 11.5%
81,688,040Health care – 6.9%Atrion Corp. 5,485 3,528,501 1.3%Haemonetics Corp. (I) 48,000 1,895,520 0.7%Halyard Health, Inc. (I) 57,100 2,242,888 0.8%WellCare Health Plans, Inc. (I) 12,400 2,226,544 0.8%West Pharmaceutical Services, Inc. 35,900 3,393,268 1.2%OTHER SECURITIES 5,812,284 2.1%
19,099,005Industrials – 12.9%Beacon Roofing Supply, Inc. (I) 44,300 2,170,700 0.8%ESCO Technologies, Inc. 45,400 2,708,110 1.0%Landstar System, Inc. 50,000 4,280,000 1.5%OTHER SECURITIES 26,473,477 9.6%
35,632,287
John Hancock Variable Insurance TrustSUMMARY PORTFOLIO OF INVESTMENTS — June 30, 2017 (unaudited) (showing percentage of total net assets)
Small Company Growth Trust (continued) Small Company Growth Trust (continued)
The accompanying notes are an integral part of the financial statements. 46
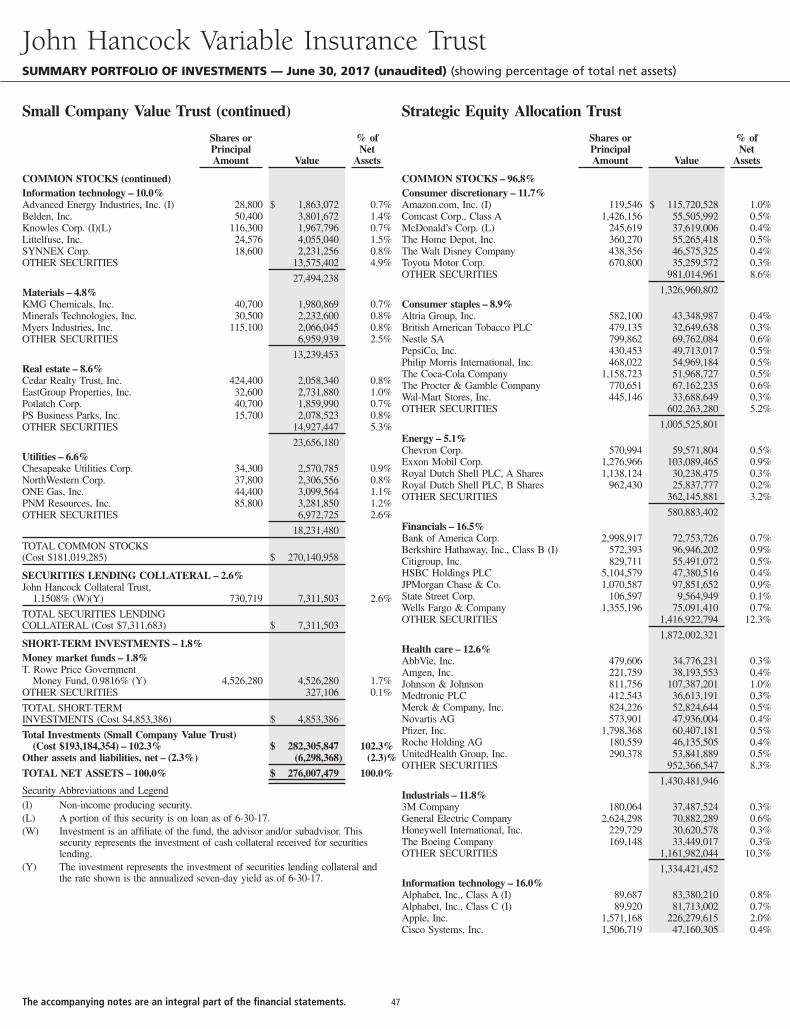
Shares orPrincipalAmount Value
% ofNet
Assets
COMMON STOCKS (continued)Information technology – 10.0%Advanced Energy Industries, Inc. (I) 28,800 $ 1,863,072 0.7%Belden, Inc. 50,400 3,801,672 1.4%Knowles Corp. (I)(L) 116,300 1,967,796 0.7%Littelfuse, Inc. 24,576 4,055,040 1.5%SYNNEX Corp. 18,600 2,231,256 0.8%OTHER SECURITIES 13,575,402 4.9%
27,494,238Materials – 4.8%KMG Chemicals, Inc. 40,700 1,980,869 0.7%Minerals Technologies, Inc. 30,500 2,232,600 0.8%Myers Industries, Inc. 115,100 2,066,045 0.8%OTHER SECURITIES 6,959,939 2.5%
13,239,453Real estate – 8.6%Cedar Realty Trust, Inc. 424,400 2,058,340 0.8%EastGroup Properties, Inc. 32,600 2,731,880 1.0%Potlatch Corp. 40,700 1,859,990 0.7%PS Business Parks, Inc. 15,700 2,078,523 0.8%OTHER SECURITIES 14,927,447 5.3%
23,656,180Utilities – 6.6%Chesapeake Utilities Corp. 34,300 2,570,785 0.9%NorthWestern Corp. 37,800 2,306,556 0.8%ONE Gas, Inc. 44,400 3,099,564 1.1%PNM Resources, Inc. 85,800 3,281,850 1.2%OTHER SECURITIES 6,972,725 2.6%
18,231,480
TOTAL COMMON STOCKS(Cost $181,019,285) $ 270,140,958
SECURITIES LENDING COLLATERAL – 2.6%John Hancock Collateral Trust,
1.1508% (W)(Y) 730,719 7,311,503 2.6%
TOTAL SECURITIES LENDINGCOLLATERAL (Cost $7,311,683) $ 7,311,503
SHORT-TERM INVESTMENTS – 1.8%Money market funds – 1.8%T. Rowe Price Government
Money Fund, 0.9816% (Y) 4,526,280 4,526,280 1.7%OTHER SECURITIES 327,106 0.1%
TOTAL SHORT-TERMINVESTMENTS (Cost $4,853,386) $ 4,853,386
Total Investments (Small Company Value Trust)(Cost $193,184,354) – 102.3% $ 282,305,847 102.3%
Other assets and liabilities, net – (2.3%) (6,298,368) (2.3)%
TOTAL NET ASSETS – 100.0% $ 276,007,479 100.0%
Security Abbreviations and Legend(I) Non-income producing security.(L) A portion of this security is on loan as of 6-30-17.(W) Investment is an affiliate of the fund, the advisor and/or subadvisor. This
security represents the investment of cash collateral received for securitieslending.
(Y) The investment represents the investment of securities lending collateral andthe rate shown is the annualized seven-day yield as of 6-30-17.
Shares orPrincipalAmount Value
% ofNet
Assets
COMMON STOCKS – 96.8%Consumer discretionary – 11.7%Amazon.com, Inc. (I) 119,546 $ 115,720,528 1.0%Comcast Corp., Class A 1,426,156 55,505,992 0.5%McDonald’s Corp. (L) 245,619 37,619,006 0.4%The Home Depot, Inc. 360,270 55,265,418 0.5%The Walt Disney Company 438,356 46,575,325 0.4%Toyota Motor Corp. 670,800 35,259,572 0.3%OTHER SECURITIES 981,014,961 8.6%
1,326,960,802Consumer staples – 8.9%Altria Group, Inc. 582,100 43,348,987 0.4%British American Tobacco PLC 479,135 32,649,638 0.3%Nestle SA 799,862 69,762,084 0.6%PepsiCo, Inc. 430,453 49,713,017 0.5%Philip Morris International, Inc. 468,022 54,969,184 0.5%The Coca-Cola Company 1,158,723 51,968,727 0.5%The Procter & Gamble Company 770,651 67,162,235 0.6%Wal-Mart Stores, Inc. 445,146 33,688,649 0.3%OTHER SECURITIES 602,263,280 5.2%
1,005,525,801Energy – 5.1%Chevron Corp. 570,994 59,571,804 0.5%Exxon Mobil Corp. 1,276,966 103,089,465 0.9%Royal Dutch Shell PLC, A Shares 1,138,124 30,238,475 0.3%Royal Dutch Shell PLC, B Shares 962,430 25,837,777 0.2%OTHER SECURITIES 362,145,881 3.2%
580,883,402Financials – 16.5%Bank of America Corp. 2,998,917 72,753,726 0.7%Berkshire Hathaway, Inc., Class B (I) 572,393 96,946,202 0.9%Citigroup, Inc. 829,711 55,491,072 0.5%HSBC Holdings PLC 5,104,579 47,380,516 0.4%JPMorgan Chase & Co. 1,070,587 97,851,652 0.9%State Street Corp. 106,597 9,564,949 0.1%Wells Fargo & Company 1,355,196 75,091,410 0.7%OTHER SECURITIES 1,416,922,794 12.3%
1,872,002,321Health care – 12.6%AbbVie, Inc. 479,606 34,776,231 0.3%Amgen, Inc. 221,759 38,193,553 0.4%Johnson & Johnson 811,756 107,387,201 1.0%Medtronic PLC 412,543 36,613,191 0.3%Merck & Company, Inc. 824,226 52,824,644 0.5%Novartis AG 573,901 47,936,004 0.4%Pfizer, Inc. 1,798,368 60,407,181 0.5%Roche Holding AG 180,559 46,135,505 0.4%UnitedHealth Group, Inc. 290,378 53,841,889 0.5%OTHER SECURITIES 952,366,547 8.3%
1,430,481,946Industrials – 11.8%3M Company 180,064 37,487,524 0.3%General Electric Company 2,624,298 70,882,289 0.6%Honeywell International, Inc. 229,729 30,620,578 0.3%The Boeing Company 169,148 33,449,017 0.3%OTHER SECURITIES 1,161,982,044 10.3%
1,334,421,452Information technology – 16.0%Alphabet, Inc., Class A (I) 89,687 83,380,210 0.8%Alphabet, Inc., Class C (I) 89,920 81,713,002 0.7%Apple, Inc. 1,571,168 226,279,615 2.0%Cisco Systems, Inc. 1,506,719 47,160,305 0.4%
John Hancock Variable Insurance TrustSUMMARY PORTFOLIO OF INVESTMENTS — June 30, 2017 (unaudited) (showing percentage of total net assets)
Small Company Value Trust (continued) Strategic Equity Allocation Trust
The accompanying notes are an integral part of the financial statements. 47
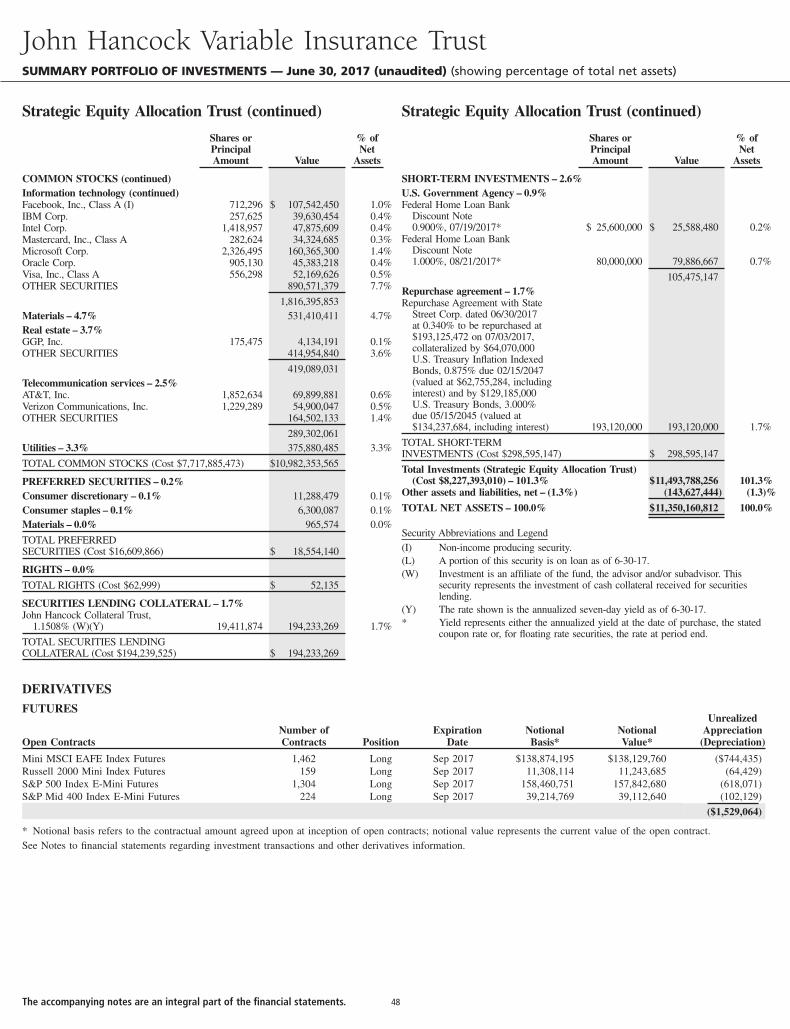
Shares orPrincipalAmount Value
% ofNet
Assets
COMMON STOCKS (continued)Information technology (continued)Facebook, Inc., Class A (I) 712,296 $ 107,542,450 1.0%IBM Corp. 257,625 39,630,454 0.4%Intel Corp. 1,418,957 47,875,609 0.4%Mastercard, Inc., Class A 282,624 34,324,685 0.3%Microsoft Corp. 2,326,495 160,365,300 1.4%Oracle Corp. 905,130 45,383,218 0.4%Visa, Inc., Class A 556,298 52,169,626 0.5%OTHER SECURITIES 890,571,379 7.7%
1,816,395,853Materials – 4.7% 531,410,411 4.7%Real estate – 3.7%GGP, Inc. 175,475 4,134,191 0.1%OTHER SECURITIES 414,954,840 3.6%
419,089,031Telecommunication services – 2.5%AT&T, Inc. 1,852,634 69,899,881 0.6%Verizon Communications, Inc. 1,229,289 54,900,047 0.5%OTHER SECURITIES 164,502,133 1.4%
289,302,061Utilities – 3.3% 375,880,485 3.3%
TOTAL COMMON STOCKS (Cost $7,717,885,473) $10,982,353,565
PREFERRED SECURITIES – 0.2%Consumer discretionary – 0.1% 11,288,479 0.1%Consumer staples – 0.1% 6,300,087 0.1%Materials – 0.0% 965,574 0.0%
TOTAL PREFERREDSECURITIES (Cost $16,609,866) $ 18,554,140
RIGHTS – 0.0%
TOTAL RIGHTS (Cost $62,999) $ 52,135
SECURITIES LENDING COLLATERAL – 1.7%John Hancock Collateral Trust,
1.1508% (W)(Y) 19,411,874 194,233,269 1.7%
TOTAL SECURITIES LENDINGCOLLATERAL (Cost $194,239,525) $ 194,233,269
Shares orPrincipalAmount Value
% ofNet
Assets
SHORT-TERM INVESTMENTS – 2.6%U.S. Government Agency – 0.9%Federal Home Loan Bank
Discount Note0.900%, 07/19/2017* $ 25,600,000 $ 25,588,480 0.2%
Federal Home Loan BankDiscount Note1.000%, 08/21/2017* 80,000,000 79,886,667 0.7%
105,475,147Repurchase agreement – 1.7%Repurchase Agreement with State
Street Corp. dated 06/30/2017at 0.340% to be repurchased at$193,125,472 on 07/03/2017,collateralized by $64,070,000U.S. Treasury Inflation IndexedBonds, 0.875% due 02/15/2047(valued at $62,755,284, includinginterest) and by $129,185,000U.S. Treasury Bonds, 3.000%due 05/15/2045 (valued at$134,237,684, including interest) 193,120,000 193,120,000 1.7%
TOTAL SHORT-TERMINVESTMENTS (Cost $298,595,147) $ 298,595,147
Total Investments (Strategic Equity Allocation Trust)(Cost $8,227,393,010) – 101.3% $11,493,788,256 101.3%
Other assets and liabilities, net – (1.3%) (143,627,444) (1.3)%
TOTAL NET ASSETS – 100.0% $11,350,160,812 100.0%
Security Abbreviations and Legend(I) Non-income producing security.(L) A portion of this security is on loan as of 6-30-17.(W) Investment is an affiliate of the fund, the advisor and/or subadvisor. This
security represents the investment of cash collateral received for securitieslending.
(Y) The rate shown is the annualized seven-day yield as of 6-30-17.* Yield represents either the annualized yield at the date of purchase, the stated
coupon rate or, for floating rate securities, the rate at period end.
DERIVATIVESFUTURES
Open ContractsNumber ofContracts Position
ExpirationDate
NotionalBasis*
NotionalValue*
UnrealizedAppreciation
(Depreciation)
Mini MSCI EAFE Index Futures 1,462 Long Sep 2017 $138,874,195 $138,129,760 ($744,435)Russell 2000 Mini Index Futures 159 Long Sep 2017 11,308,114 11,243,685 (64,429)S&P 500 Index E-Mini Futures 1,304 Long Sep 2017 158,460,751 157,842,680 (618,071)S&P Mid 400 Index E-Mini Futures 224 Long Sep 2017 39,214,769 39,112,640 (102,129)
($1,529,064)
* Notional basis refers to the contractual amount agreed upon at inception of open contracts; notional value represents the current value of the open contract.See Notes to financial statements regarding investment transactions and other derivatives information.
John Hancock Variable Insurance TrustSUMMARY PORTFOLIO OF INVESTMENTS — June 30, 2017 (unaudited) (showing percentage of total net assets)
Strategic Equity Allocation Trust (continued) Strategic Equity Allocation Trust (continued)
The accompanying notes are an integral part of the financial statements. 48
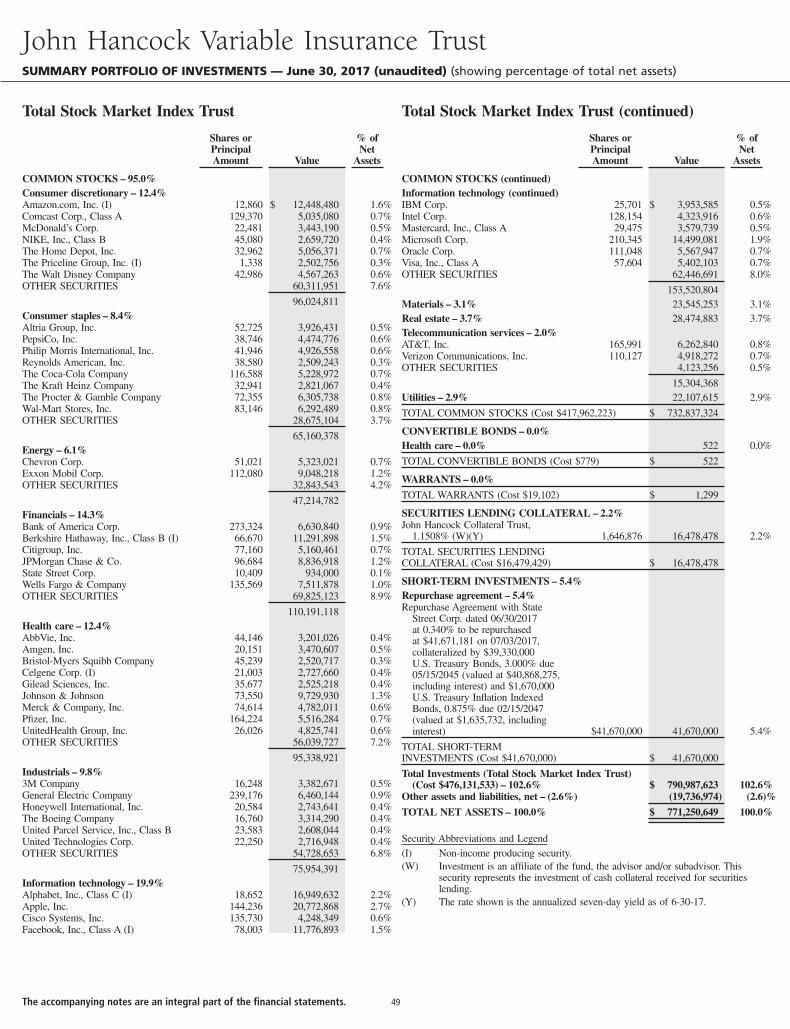
Shares orPrincipalAmount Value
% ofNet
Assets
COMMON STOCKS – 95.0%Consumer discretionary – 12.4%Amazon.com, Inc. (I) 12,860 $ 12,448,480 1.6%Comcast Corp., Class A 129,370 5,035,080 0.7%McDonald’s Corp. 22,481 3,443,190 0.5%NIKE, Inc., Class B 45,080 2,659,720 0.4%The Home Depot, Inc. 32,962 5,056,371 0.7%The Priceline Group, Inc. (I) 1,338 2,502,756 0.3%The Walt Disney Company 42,986 4,567,263 0.6%OTHER SECURITIES 60,311,951 7.6%
96,024,811Consumer staples – 8.4%Altria Group, Inc. 52,725 3,926,431 0.5%PepsiCo, Inc. 38,746 4,474,776 0.6%Philip Morris International, Inc. 41,946 4,926,558 0.6%Reynolds American, Inc. 38,580 2,509,243 0.3%The Coca-Cola Company 116,588 5,228,972 0.7%The Kraft Heinz Company 32,941 2,821,067 0.4%The Procter & Gamble Company 72,355 6,305,738 0.8%Wal-Mart Stores, Inc. 83,146 6,292,489 0.8%OTHER SECURITIES 28,675,104 3.7%
65,160,378Energy – 6.1%Chevron Corp. 51,021 5,323,021 0.7%Exxon Mobil Corp. 112,080 9,048,218 1.2%OTHER SECURITIES 32,843,543 4.2%
47,214,782Financials – 14.3%Bank of America Corp. 273,324 6,630,840 0.9%Berkshire Hathaway, Inc., Class B (I) 66,670 11,291,898 1.5%Citigroup, Inc. 77,160 5,160,461 0.7%JPMorgan Chase & Co. 96,684 8,836,918 1.2%State Street Corp. 10,409 934,000 0.1%Wells Fargo & Company 135,569 7,511,878 1.0%OTHER SECURITIES 69,825,123 8.9%
110,191,118Health care – 12.4%AbbVie, Inc. 44,146 3,201,026 0.4%Amgen, Inc. 20,151 3,470,607 0.5%Bristol-Myers Squibb Company 45,239 2,520,717 0.3%Celgene Corp. (I) 21,003 2,727,660 0.4%Gilead Sciences, Inc. 35,677 2,525,218 0.4%Johnson & Johnson 73,550 9,729,930 1.3%Merck & Company, Inc. 74,614 4,782,011 0.6%Pfizer, Inc. 164,224 5,516,284 0.7%UnitedHealth Group, Inc. 26,026 4,825,741 0.6%OTHER SECURITIES 56,039,727 7.2%
95,338,921Industrials – 9.8%3M Company 16,248 3,382,671 0.5%General Electric Company 239,176 6,460,144 0.9%Honeywell International, Inc. 20,584 2,743,641 0.4%The Boeing Company 16,760 3,314,290 0.4%United Parcel Service, Inc., Class B 23,583 2,608,044 0.4%United Technologies Corp. 22,250 2,716,948 0.4%OTHER SECURITIES 54,728,653 6.8%
75,954,391Information technology – 19.9%Alphabet, Inc., Class C (I) 18,652 16,949,632 2.2%Apple, Inc. 144,236 20,772,868 2.7%Cisco Systems, Inc. 135,730 4,248,349 0.6%Facebook, Inc., Class A (I) 78,003 11,776,893 1.5%
Shares orPrincipalAmount Value
% ofNet
Assets
COMMON STOCKS (continued)Information technology (continued)IBM Corp. 25,701 $ 3,953,585 0.5%Intel Corp. 128,154 4,323,916 0.6%Mastercard, Inc., Class A 29,475 3,579,739 0.5%Microsoft Corp. 210,345 14,499,081 1.9%Oracle Corp. 111,048 5,567,947 0.7%Visa, Inc., Class A 57,604 5,402,103 0.7%OTHER SECURITIES 62,446,691 8.0%
153,520,804Materials – 3.1% 23,545,253 3.1%Real estate – 3.7% 28,474,883 3.7%Telecommunication services – 2.0%AT&T, Inc. 165,991 6,262,840 0.8%Verizon Communications, Inc. 110,127 4,918,272 0.7%OTHER SECURITIES 4,123,256 0.5%
15,304,368Utilities – 2.9% 22,107,615 2.9%
TOTAL COMMON STOCKS (Cost $417,962,223) $ 732,837,324
CONVERTIBLE BONDS – 0.0%Health care – 0.0% 522 0.0%
TOTAL CONVERTIBLE BONDS (Cost $779) $ 522
WARRANTS – 0.0%
TOTAL WARRANTS (Cost $19,102) $ 1,299
SECURITIES LENDING COLLATERAL – 2.2%John Hancock Collateral Trust,
1.1508% (W)(Y) 1,646,876 16,478,478 2.2%
TOTAL SECURITIES LENDINGCOLLATERAL (Cost $16,479,429) $ 16,478,478
SHORT-TERM INVESTMENTS – 5.4%Repurchase agreement – 5.4%Repurchase Agreement with State
Street Corp. dated 06/30/2017at 0.340% to be repurchasedat $41,671,181 on 07/03/2017,collateralized by $39,330,000U.S. Treasury Bonds, 3.000% due05/15/2045 (valued at $40,868,275,including interest) and $1,670,000U.S. Treasury Inflation IndexedBonds, 0.875% due 02/15/2047(valued at $1,635,732, includinginterest) $41,670,000 41,670,000 5.4%
TOTAL SHORT-TERMINVESTMENTS (Cost $41,670,000) $ 41,670,000
Total Investments (Total Stock Market Index Trust)(Cost $476,131,533) – 102.6% $ 790,987,623 102.6%
Other assets and liabilities, net – (2.6%) (19,736,974) (2.6)%
TOTAL NET ASSETS – 100.0% $ 771,250,649 100.0%
Security Abbreviations and Legend(I) Non-income producing security.(W) Investment is an affiliate of the fund, the advisor and/or subadvisor. This
security represents the investment of cash collateral received for securitieslending.
(Y) The rate shown is the annualized seven-day yield as of 6-30-17.
John Hancock Variable Insurance TrustSUMMARY PORTFOLIO OF INVESTMENTS — June 30, 2017 (unaudited) (showing percentage of total net assets)
Total Stock Market Index Trust Total Stock Market Index Trust (continued)
The accompanying notes are an integral part of the financial statements. 49
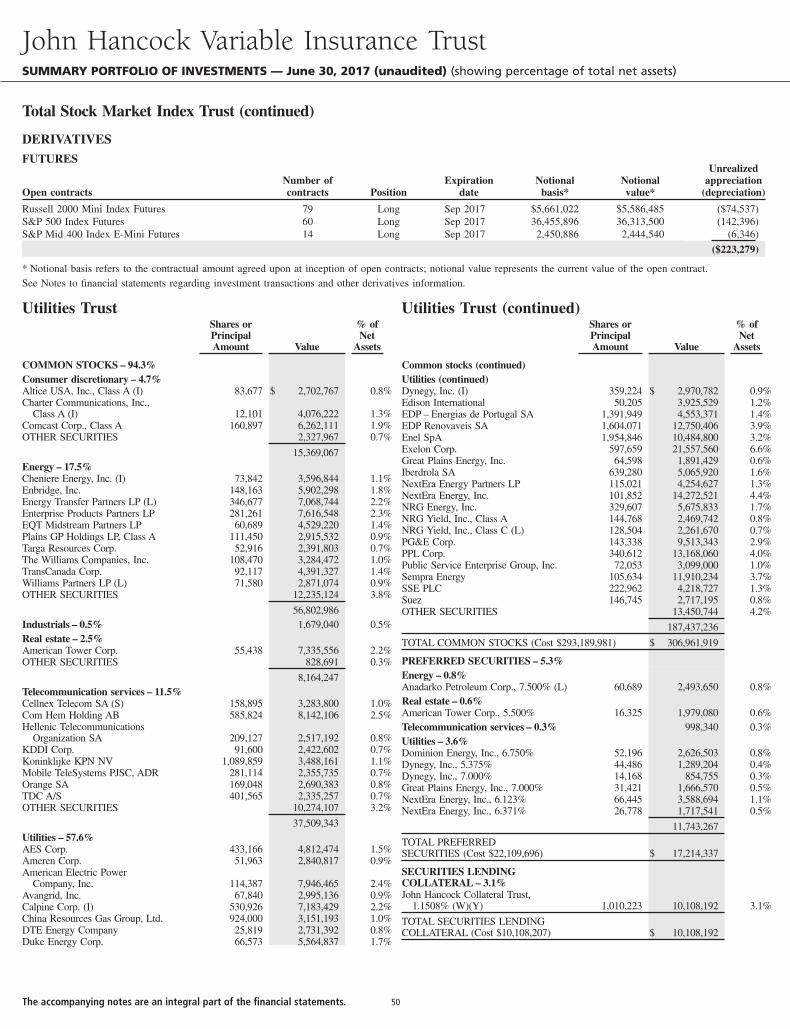
DERIVATIVESFUTURES
Open contractsNumber ofcontracts Position
Expirationdate
Notionalbasis*
Notionalvalue*
Unrealizedappreciation
(depreciation)
Russell 2000 Mini Index Futures 79 Long Sep 2017 $5,661,022 $5,586,485 ($74,537)S&P 500 Index Futures 60 Long Sep 2017 36,455,896 36,313,500 (142,396)S&P Mid 400 Index E-Mini Futures 14 Long Sep 2017 2,450,886 2,444,540 (6,346)
($223,279)
* Notional basis refers to the contractual amount agreed upon at inception of open contracts; notional value represents the current value of the open contract.See Notes to financial statements regarding investment transactions and other derivatives information.
Utilities TrustShares orPrincipalAmount Value
% ofNet
Assets
COMMON STOCKS – 94.3%Consumer discretionary – 4.7%Altice USA, Inc., Class A (I) 83,677 $ 2,702,767 0.8%Charter Communications, Inc.,
Class A (I) 12,101 4,076,222 1.3%Comcast Corp., Class A 160,897 6,262,111 1.9%OTHER SECURITIES 2,327,967 0.7%
15,369,067Energy – 17.5%Cheniere Energy, Inc. (I) 73,842 3,596,844 1.1%Enbridge, Inc. 148,163 5,902,298 1.8%Energy Transfer Partners LP (L) 346,677 7,068,744 2.2%Enterprise Products Partners LP 281,261 7,616,548 2.3%EQT Midstream Partners LP 60,689 4,529,220 1.4%Plains GP Holdings LP, Class A 111,450 2,915,532 0.9%Targa Resources Corp. 52,916 2,391,803 0.7%The Williams Companies, Inc. 108,470 3,284,472 1.0%TransCanada Corp. 92,117 4,391,327 1.4%Williams Partners LP (L) 71,580 2,871,074 0.9%OTHER SECURITIES 12,235,124 3.8%
56,802,986Industrials – 0.5% 1,679,040 0.5%Real estate – 2.5%American Tower Corp. 55,438 7,335,556 2.2%OTHER SECURITIES 828,691 0.3%
8,164,247Telecommunication services – 11.5%Cellnex Telecom SA (S) 158,895 3,283,800 1.0%Com Hem Holding AB 585,824 8,142,106 2.5%Hellenic Telecommunications
Organization SA 209,127 2,517,192 0.8%KDDI Corp. 91,600 2,422,602 0.7%Koninklijke KPN NV 1,089,859 3,488,161 1.1%Mobile TeleSystems PJSC, ADR 281,114 2,355,735 0.7%Orange SA 169,048 2,690,383 0.8%TDC A/S 401,565 2,335,257 0.7%OTHER SECURITIES 10,274,107 3.2%
37,509,343Utilities – 57.6%AES Corp. 433,166 4,812,474 1.5%Ameren Corp. 51,963 2,840,817 0.9%American Electric Power
Company, Inc. 114,387 7,946,465 2.4%Avangrid, Inc. 67,840 2,995,136 0.9%Calpine Corp. (I) 530,926 7,183,429 2.2%China Resources Gas Group, Ltd. 924,000 3,151,193 1.0%DTE Energy Company 25,819 2,731,392 0.8%Duke Energy Corp. 66,573 5,564,837 1.7%
Utilities Trust (continued)Shares orPrincipalAmount Value
% ofNet
Assets
Common stocks (continued)Utilities (continued)Dynegy, Inc. (I) 359,224 $ 2,970,782 0.9%Edison International 50,205 3,925,529 1.2%EDP – Energias de Portugal SA 1,391,949 4,553,371 1.4%EDP Renovaveis SA 1,604,071 12,750,406 3.9%Enel SpA 1,954,846 10,484,800 3.2%Exelon Corp. 597,659 21,557,560 6.6%Great Plains Energy, Inc. 64,598 1,891,429 0.6%Iberdrola SA 639,280 5,065,920 1.6%NextEra Energy Partners LP 115,021 4,254,627 1.3%NextEra Energy, Inc. 101,852 14,272,521 4.4%NRG Energy, Inc. 329,607 5,675,833 1.7%NRG Yield, Inc., Class A 144,768 2,469,742 0.8%NRG Yield, Inc., Class C (L) 128,504 2,261,670 0.7%PG&E Corp. 143,338 9,513,343 2.9%PPL Corp. 340,612 13,168,060 4.0%Public Service Enterprise Group, Inc. 72,053 3,099,000 1.0%Sempra Energy 105,634 11,910,234 3.7%SSE PLC 222,962 4,218,727 1.3%Suez 146,745 2,717,195 0.8%OTHER SECURITIES 13,450,744 4.2%
187,437,236
TOTAL COMMON STOCKS (Cost $293,189,981) $ 306,961,919
PREFERRED SECURITIES – 5.3%Energy – 0.8%Anadarko Petroleum Corp., 7.500% (L) 60,689 2,493,650 0.8%Real estate – 0.6%American Tower Corp., 5.500% 16,325 1,979,080 0.6%Telecommunication services – 0.3% 998,340 0.3%Utilities – 3.6%Dominion Energy, Inc., 6.750% 52,196 2,626,503 0.8%Dynegy, Inc., 5.375% 44,486 1,289,204 0.4%Dynegy, Inc., 7.000% 14,168 854,755 0.3%Great Plains Energy, Inc., 7.000% 31,421 1,666,570 0.5%NextEra Energy, Inc., 6.123% 66,445 3,588,694 1.1%NextEra Energy, Inc., 6.371% 26,778 1,717,541 0.5%
11,743,267
TOTAL PREFERREDSECURITIES (Cost $22,109,696) $ 17,214,337
SECURITIES LENDINGCOLLATERAL – 3.1%John Hancock Collateral Trust,
1.1508% (W)(Y) 1,010,223 10,108,192 3.1%
TOTAL SECURITIES LENDINGCOLLATERAL (Cost $10,108,207) $ 10,108,192
John Hancock Variable Insurance TrustSUMMARY PORTFOLIO OF INVESTMENTS — June 30, 2017 (unaudited) (showing percentage of total net assets)
Total Stock Market Index Trust (continued)
The accompanying notes are an integral part of the financial statements. 50
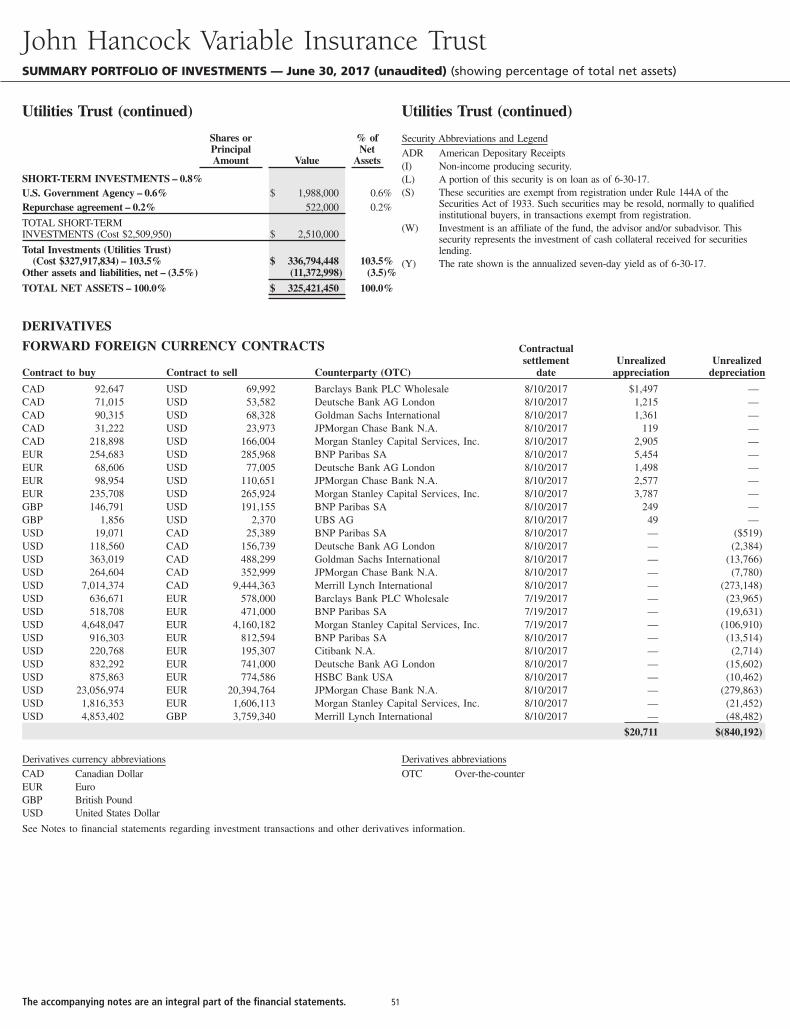
Shares orPrincipalAmount Value
% ofNet
Assets
SHORT-TERM INVESTMENTS – 0.8%U.S. Government Agency – 0.6% $ 1,988,000 0.6%Repurchase agreement – 0.2% 522,000 0.2%
TOTAL SHORT-TERMINVESTMENTS (Cost $2,509,950) $ 2,510,000
Total Investments (Utilities Trust)(Cost $327,917,834) – 103.5% $ 336,794,448 103.5%
Other assets and liabilities, net – (3.5%) (11,372,998) (3.5)%
TOTAL NET ASSETS – 100.0% $ 325,421,450 100.0%
Security Abbreviations and LegendADR American Depositary Receipts(I) Non-income producing security.(L) A portion of this security is on loan as of 6-30-17.(S) These securities are exempt from registration under Rule 144A of the
Securities Act of 1933. Such securities may be resold, normally to qualifiedinstitutional buyers, in transactions exempt from registration.
(W) Investment is an affiliate of the fund, the advisor and/or subadvisor. Thissecurity represents the investment of cash collateral received for securitieslending.
(Y) The rate shown is the annualized seven-day yield as of 6-30-17.
DERIVATIVES
FORWARD FOREIGN CURRENCY CONTRACTS
Contract to buy Contract to sell Counterparty (OTC)
Contractualsettlement
dateUnrealized
appreciationUnrealized
depreciation
CAD 92,647 USD 69,992 Barclays Bank PLC Wholesale 8/10/2017 $1,497 —CAD 71,015 USD 53,582 Deutsche Bank AG London 8/10/2017 1,215 —CAD 90,315 USD 68,328 Goldman Sachs International 8/10/2017 1,361 —CAD 31,222 USD 23,973 JPMorgan Chase Bank N.A. 8/10/2017 119 —CAD 218,898 USD 166,004 Morgan Stanley Capital Services, Inc. 8/10/2017 2,905 —EUR 254,683 USD 285,968 BNP Paribas SA 8/10/2017 5,454 —EUR 68,606 USD 77,005 Deutsche Bank AG London 8/10/2017 1,498 —EUR 98,954 USD 110,651 JPMorgan Chase Bank N.A. 8/10/2017 2,577 —EUR 235,708 USD 265,924 Morgan Stanley Capital Services, Inc. 8/10/2017 3,787 —GBP 146,791 USD 191,155 BNP Paribas SA 8/10/2017 249 —GBP 1,856 USD 2,370 UBS AG 8/10/2017 49 —USD 19,071 CAD 25,389 BNP Paribas SA 8/10/2017 — ($519)USD 118,560 CAD 156,739 Deutsche Bank AG London 8/10/2017 — (2,384)USD 363,019 CAD 488,299 Goldman Sachs International 8/10/2017 — (13,766)USD 264,604 CAD 352,999 JPMorgan Chase Bank N.A. 8/10/2017 — (7,780)USD 7,014,374 CAD 9,444,363 Merrill Lynch International 8/10/2017 — (273,148)USD 636,671 EUR 578,000 Barclays Bank PLC Wholesale 7/19/2017 — (23,965)USD 518,708 EUR 471,000 BNP Paribas SA 7/19/2017 — (19,631)USD 4,648,047 EUR 4,160,182 Morgan Stanley Capital Services, Inc. 7/19/2017 — (106,910)USD 916,303 EUR 812,594 BNP Paribas SA 8/10/2017 — (13,514)USD 220,768 EUR 195,307 Citibank N.A. 8/10/2017 — (2,714)USD 832,292 EUR 741,000 Deutsche Bank AG London 8/10/2017 — (15,602)USD 875,863 EUR 774,586 HSBC Bank USA 8/10/2017 — (10,462)USD 23,056,974 EUR 20,394,764 JPMorgan Chase Bank N.A. 8/10/2017 — (279,863)USD 1,816,353 EUR 1,606,113 Morgan Stanley Capital Services, Inc. 8/10/2017 — (21,452)USD 4,853,402 GBP 3,759,340 Merrill Lynch International 8/10/2017 — (48,482)
$20,711 $(840,192)
Derivatives currency abbreviationsCAD Canadian DollarEUR EuroGBP British PoundUSD United States Dollar
Derivatives abbreviationsOTC Over-the-counter
See Notes to financial statements regarding investment transactions and other derivatives information.
John Hancock Variable Insurance TrustSUMMARY PORTFOLIO OF INVESTMENTS — June 30, 2017 (unaudited) (showing percentage of total net assets)
Utilities Trust (continued) Utilities Trust (continued)
The accompanying notes are an integral part of the financial statements. 51
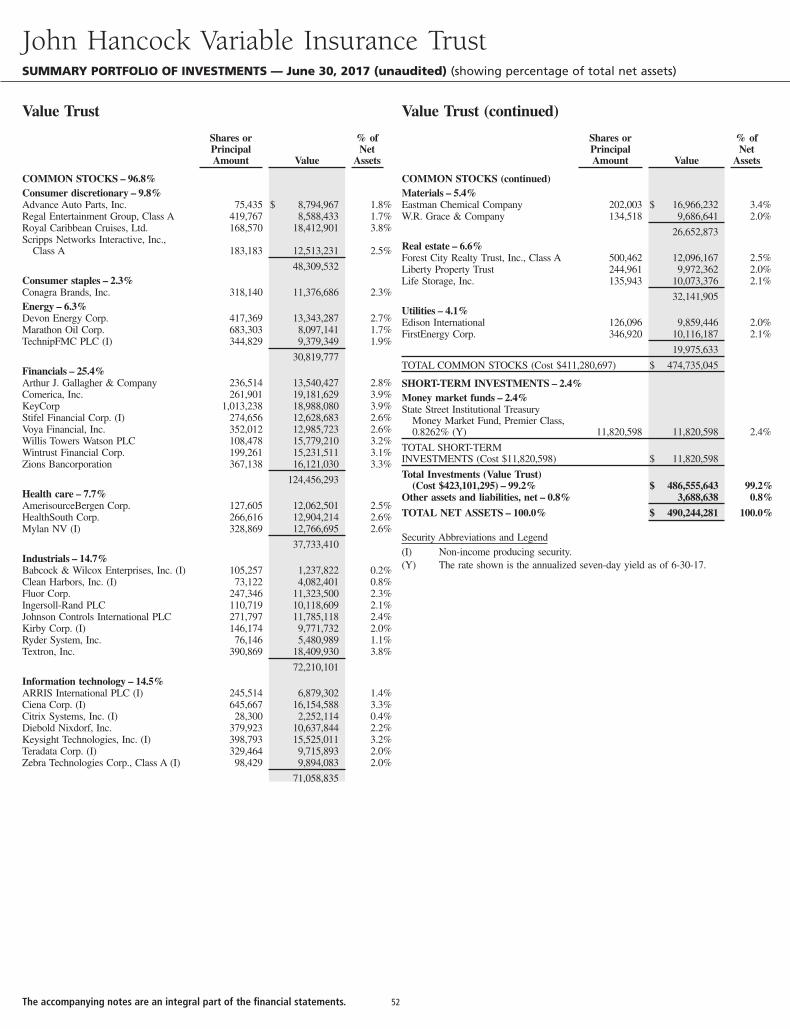
Shares orPrincipalAmount Value
% ofNet
Assets
COMMON STOCKS – 96.8%Consumer discretionary – 9.8%Advance Auto Parts, Inc. 75,435 $ 8,794,967 1.8%Regal Entertainment Group, Class A 419,767 8,588,433 1.7%Royal Caribbean Cruises, Ltd. 168,570 18,412,901 3.8%Scripps Networks Interactive, Inc.,
Class A 183,183 12,513,231 2.5%
48,309,532Consumer staples – 2.3%Conagra Brands, Inc. 318,140 11,376,686 2.3%Energy – 6.3%Devon Energy Corp. 417,369 13,343,287 2.7%Marathon Oil Corp. 683,303 8,097,141 1.7%TechnipFMC PLC (I) 344,829 9,379,349 1.9%
30,819,777Financials – 25.4%Arthur J. Gallagher & Company 236,514 13,540,427 2.8%Comerica, Inc. 261,901 19,181,629 3.9%KeyCorp 1,013,238 18,988,080 3.9%Stifel Financial Corp. (I) 274,656 12,628,683 2.6%Voya Financial, Inc. 352,012 12,985,723 2.6%Willis Towers Watson PLC 108,478 15,779,210 3.2%Wintrust Financial Corp. 199,261 15,231,511 3.1%Zions Bancorporation 367,138 16,121,030 3.3%
124,456,293Health care – 7.7%AmerisourceBergen Corp. 127,605 12,062,501 2.5%HealthSouth Corp. 266,616 12,904,214 2.6%Mylan NV (I) 328,869 12,766,695 2.6%
37,733,410Industrials – 14.7%Babcock & Wilcox Enterprises, Inc. (I) 105,257 1,237,822 0.2%Clean Harbors, Inc. (I) 73,122 4,082,401 0.8%Fluor Corp. 247,346 11,323,500 2.3%Ingersoll-Rand PLC 110,719 10,118,609 2.1%Johnson Controls International PLC 271,797 11,785,118 2.4%Kirby Corp. (I) 146,174 9,771,732 2.0%Ryder System, Inc. 76,146 5,480,989 1.1%Textron, Inc. 390,869 18,409,930 3.8%
72,210,101Information technology – 14.5%ARRIS International PLC (I) 245,514 6,879,302 1.4%Ciena Corp. (I) 645,667 16,154,588 3.3%Citrix Systems, Inc. (I) 28,300 2,252,114 0.4%Diebold Nixdorf, Inc. 379,923 10,637,844 2.2%Keysight Technologies, Inc. (I) 398,793 15,525,011 3.2%Teradata Corp. (I) 329,464 9,715,893 2.0%Zebra Technologies Corp., Class A (I) 98,429 9,894,083 2.0%
71,058,835
Shares orPrincipalAmount Value
% ofNet
Assets
COMMON STOCKS (continued)Materials – 5.4%Eastman Chemical Company 202,003 $ 16,966,232 3.4%W.R. Grace & Company 134,518 9,686,641 2.0%
26,652,873Real estate – 6.6%Forest City Realty Trust, Inc., Class A 500,462 12,096,167 2.5%Liberty Property Trust 244,961 9,972,362 2.0%Life Storage, Inc. 135,943 10,073,376 2.1%
32,141,905Utilities – 4.1%Edison International 126,096 9,859,446 2.0%FirstEnergy Corp. 346,920 10,116,187 2.1%
19,975,633
TOTAL COMMON STOCKS (Cost $411,280,697) $ 474,735,045
SHORT-TERM INVESTMENTS – 2.4%Money market funds – 2.4%State Street Institutional Treasury
Money Market Fund, Premier Class,0.8262% (Y) 11,820,598 11,820,598 2.4%
TOTAL SHORT-TERMINVESTMENTS (Cost $11,820,598) $ 11,820,598
Total Investments (Value Trust)(Cost $423,101,295) – 99.2% $ 486,555,643 99.2%
Other assets and liabilities, net – 0.8% 3,688,638 0.8%
TOTAL NET ASSETS – 100.0% $ 490,244,281 100.0%
Security Abbreviations and Legend(I) Non-income producing security.(Y) The rate shown is the annualized seven-day yield as of 6-30-17.
John Hancock Variable Insurance TrustSUMMARY PORTFOLIO OF INVESTMENTS — June 30, 2017 (unaudited) (showing percentage of total net assets)
Value Trust Value Trust (continued)
The accompanying notes are an integral part of the financial statements. 52
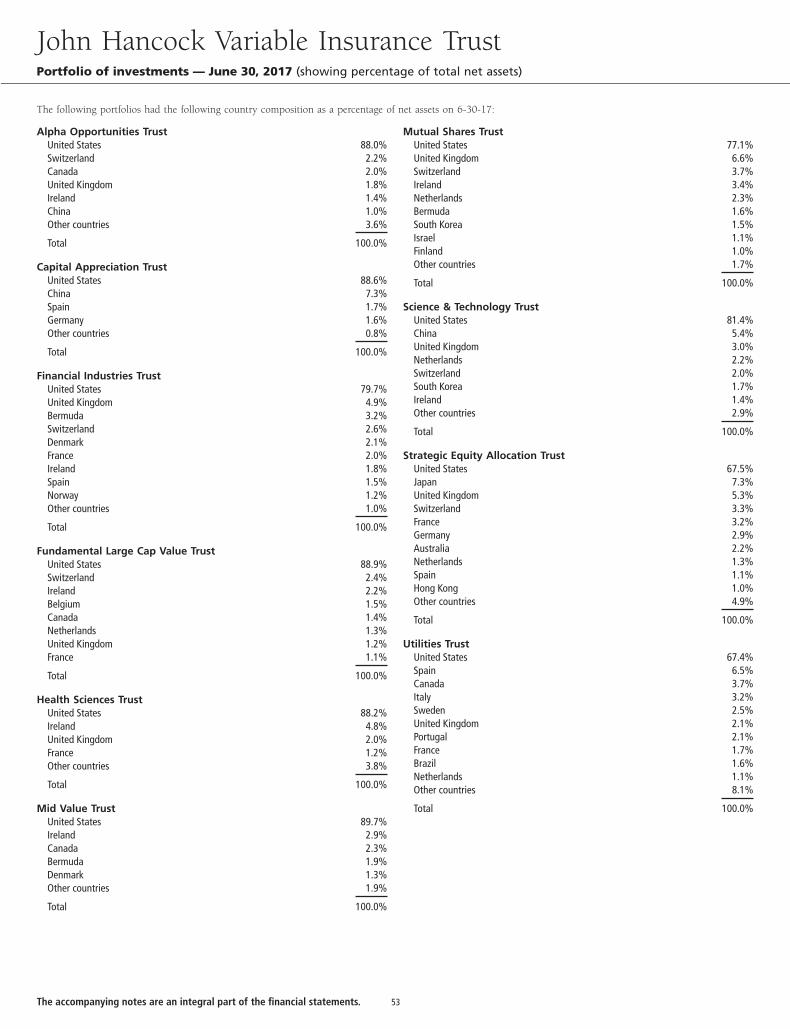
The following portfolios had the following country composition as a percentage of net assets on 6-30-17:
Alpha Opportunities TrustUnited States 88.0%Switzerland 2.2%Canada 2.0%United Kingdom 1.8%Ireland 1.4%China 1.0%Other countries 3.6%
Total 100.0%
Capital Appreciation TrustUnited States 88.6%China 7.3%Spain 1.7%Germany 1.6%Other countries 0.8%
Total 100.0%
Financial Industries TrustUnited States 79.7%United Kingdom 4.9%Bermuda 3.2%Switzerland 2.6%Denmark 2.1%France 2.0%Ireland 1.8%Spain 1.5%Norway 1.2%Other countries 1.0%
Total 100.0%
Fundamental Large Cap Value TrustUnited States 88.9%Switzerland 2.4%Ireland 2.2%Belgium 1.5%Canada 1.4%Netherlands 1.3%United Kingdom 1.2%France 1.1%
Total 100.0%
Health Sciences TrustUnited States 88.2%Ireland 4.8%United Kingdom 2.0%France 1.2%Other countries 3.8%
Total 100.0%
Mid Value TrustUnited States 89.7%Ireland 2.9%Canada 2.3%Bermuda 1.9%Denmark 1.3%Other countries 1.9%
Total 100.0%
Mutual Shares TrustUnited States 77.1%United Kingdom 6.6%Switzerland 3.7%Ireland 3.4%Netherlands 2.3%Bermuda 1.6%South Korea 1.5%Israel 1.1%Finland 1.0%Other countries 1.7%
Total 100.0%
Science & Technology TrustUnited States 81.4%China 5.4%United Kingdom 3.0%Netherlands 2.2%Switzerland 2.0%South Korea 1.7%Ireland 1.4%Other countries 2.9%
Total 100.0%
Strategic Equity Allocation TrustUnited States 67.5%Japan 7.3%United Kingdom 5.3%Switzerland 3.3%France 3.2%Germany 2.9%Australia 2.2%Netherlands 1.3%Spain 1.1%Hong Kong 1.0%Other countries 4.9%
Total 100.0%
Utilities TrustUnited States 67.4%Spain 6.5%Canada 3.7%Italy 3.2%Sweden 2.5%United Kingdom 2.1%Portugal 2.1%France 1.7%Brazil 1.6%Netherlands 1.1%Other countries 8.1%
Total 100.0%
John Hancock Variable Insurance TrustPortfolio of investments — June 30, 2017 (showing percentage of total net assets)
The accompanying notes are an integral part of the financial statements. 53
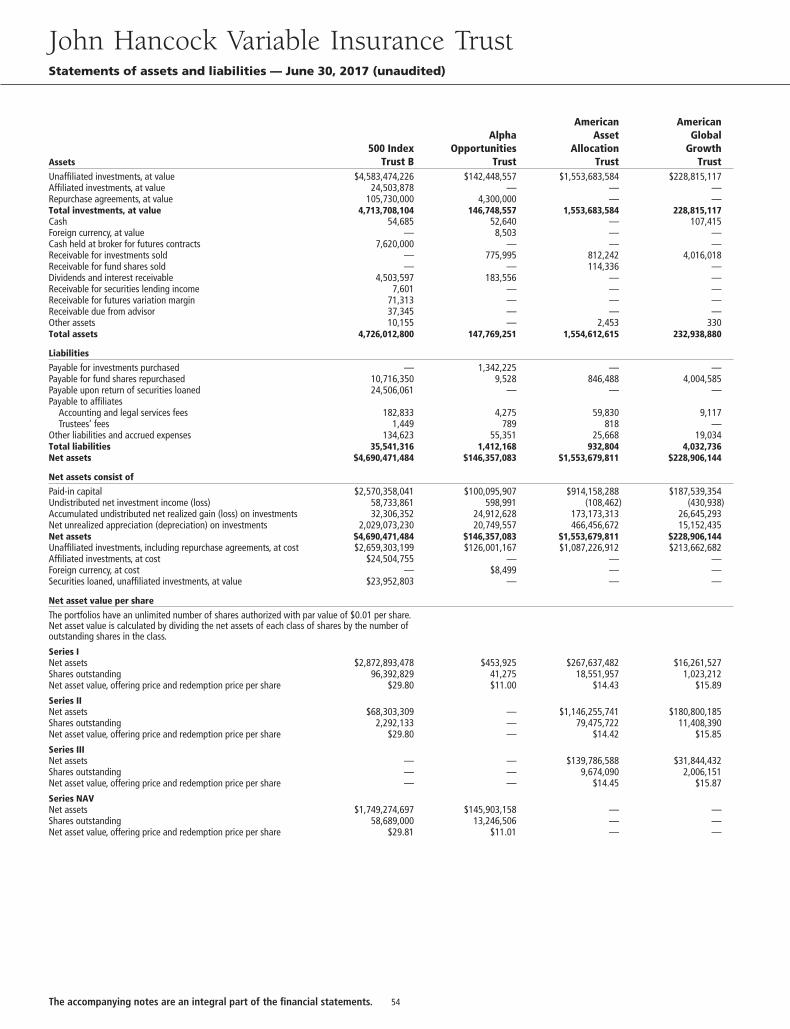
Assets500 Index
Trust B
AlphaOpportunities
Trust
AmericanAsset
AllocationTrust
AmericanGlobal
GrowthTrust
Unaffiliated investments, at value $4,583,474,226 $142,448,557 $1,553,683,584 $228,815,117Affiliated investments, at value 24,503,878 — — —Repurchase agreements, at value 105,730,000 4,300,000 — —Total investments, at value 4,713,708,104 146,748,557 1,553,683,584 228,815,117Cash 54,685 52,640 — 107,415Foreign currency, at value — 8,503 — —Cash held at broker for futures contracts 7,620,000 — — —Receivable for investments sold — 775,995 812,242 4,016,018Receivable for fund shares sold — — 114,336 —Dividends and interest receivable 4,503,597 183,556 — —Receivable for securities lending income 7,601 — — —Receivable for futures variation margin 71,313 — — —Receivable due from advisor 37,345 — — —Other assets 10,155 — 2,453 330Total assets 4,726,012,800 147,769,251 1,554,612,615 232,938,880
Liabilities
Payable for investments purchased — 1,342,225 — —Payable for fund shares repurchased 10,716,350 9,528 846,488 4,004,585Payable upon return of securities loaned 24,506,061 — — —Payable to affiliates
Accounting and legal services fees 182,833 4,275 59,830 9,117Trustees’ fees 1,449 789 818 —
Other liabilities and accrued expenses 134,623 55,351 25,668 19,034Total liabilities 35,541,316 1,412,168 932,804 4,032,736Net assets $4,690,471,484 $146,357,083 $1,553,679,811 $228,906,144
Net assets consist of
Paid-in capital $2,570,358,041 $100,095,907 $914,158,288 $187,539,354Undistributed net investment income (loss) 58,733,861 598,991 (108,462) (430,938)Accumulated undistributed net realized gain (loss) on investments 32,306,352 24,912,628 173,173,313 26,645,293Net unrealized appreciation (depreciation) on investments 2,029,073,230 20,749,557 466,456,672 15,152,435Net assets $4,690,471,484 $146,357,083 $1,553,679,811 $228,906,144Unaffiliated investments, including repurchase agreements, at cost $2,659,303,199 $126,001,167 $1,087,226,912 $213,662,682Affiliated investments, at cost $24,504,755 — — —Foreign currency, at cost — $8,499 — —Securities loaned, unaffiliated investments, at value $23,952,803 — — —
Net asset value per share
The portfolios have an unlimited number of shares authorized with par value of $0.01 per share.Net asset value is calculated by dividing the net assets of each class of shares by the number ofoutstanding shares in the class.
Series INet assets $2,872,893,478 $453,925 $267,637,482 $16,261,527Shares outstanding 96,392,829 41,275 18,551,957 1,023,212Net asset value, offering price and redemption price per share $29.80 $11.00 $14.43 $15.89
Series IINet assets $68,303,309 — $1,146,255,741 $180,800,185Shares outstanding 2,292,133 — 79,475,722 11,408,390Net asset value, offering price and redemption price per share $29.80 — $14.42 $15.85
Series IIINet assets — — $139,786,588 $31,844,432Shares outstanding — — 9,674,090 2,006,151Net asset value, offering price and redemption price per share — — $14.45 $15.87
Series NAVNet assets $1,749,274,697 $145,903,158 — —Shares outstanding 58,689,000 13,246,506 — —Net asset value, offering price and redemption price per share $29.81 $11.01 — —
John Hancock Variable Insurance TrustStatements of assets and liabilities — June 30, 2017 (unaudited)
54The accompanying notes are an integral part of the financial statements.
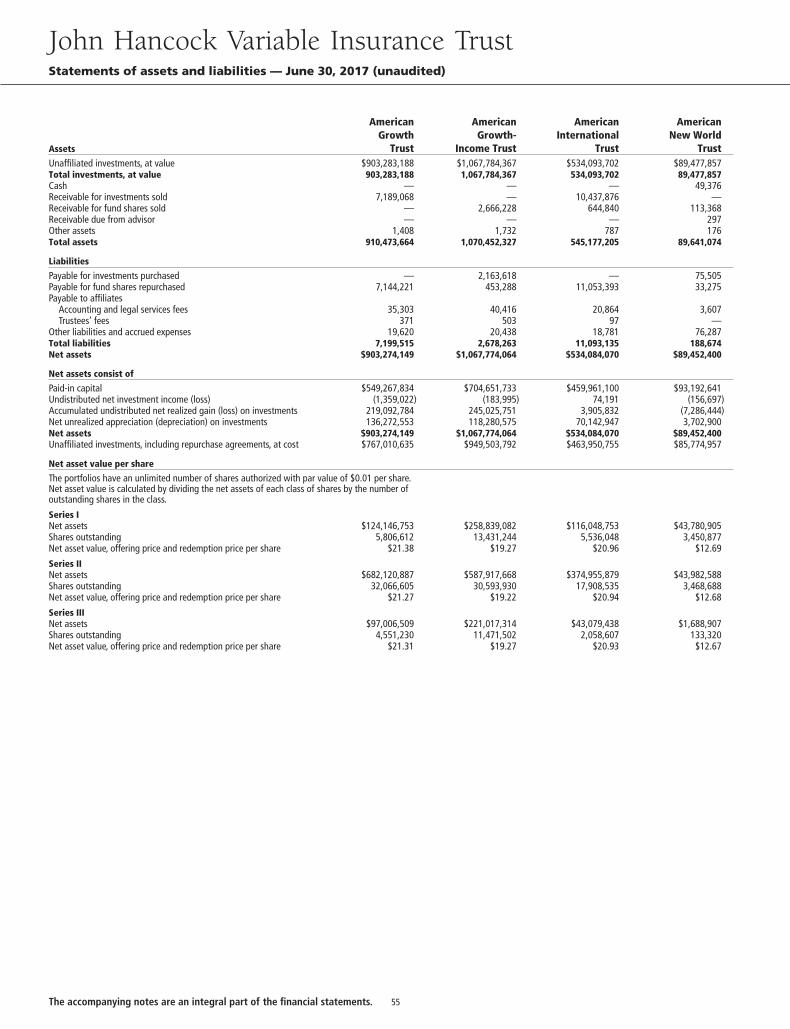
Assets
AmericanGrowth
Trust
AmericanGrowth-
Income Trust
AmericanInternational
Trust
AmericanNew World
TrustUnaffiliated investments, at value $903,283,188 $1,067,784,367 $534,093,702 $89,477,857Total investments, at value 903,283,188 1,067,784,367 534,093,702 89,477,857Cash — — — 49,376Receivable for investments sold 7,189,068 — 10,437,876 —Receivable for fund shares sold — 2,666,228 644,840 113,368Receivable due from advisor — — — 297Other assets 1,408 1,732 787 176Total assets 910,473,664 1,070,452,327 545,177,205 89,641,074
Liabilities
Payable for investments purchased — 2,163,618 — 75,505Payable for fund shares repurchased 7,144,221 453,288 11,053,393 33,275Payable to affiliates
Accounting and legal services fees 35,303 40,416 20,864 3,607Trustees’ fees 371 503 97 —
Other liabilities and accrued expenses 19,620 20,438 18,781 76,287Total liabilities 7,199,515 2,678,263 11,093,135 188,674Net assets $903,274,149 $1,067,774,064 $534,084,070 $89,452,400
Net assets consist of
Paid-in capital $549,267,834 $704,651,733 $459,961,100 $93,192,641Undistributed net investment income (loss) (1,359,022) (183,995) 74,191 (156,697)Accumulated undistributed net realized gain (loss) on investments 219,092,784 245,025,751 3,905,832 (7,286,444)Net unrealized appreciation (depreciation) on investments 136,272,553 118,280,575 70,142,947 3,702,900Net assets $903,274,149 $1,067,774,064 $534,084,070 $89,452,400Unaffiliated investments, including repurchase agreements, at cost $767,010,635 $949,503,792 $463,950,755 $85,774,957
Net asset value per share
The portfolios have an unlimited number of shares authorized with par value of $0.01 per share.Net asset value is calculated by dividing the net assets of each class of shares by the number ofoutstanding shares in the class.
Series INet assets $124,146,753 $258,839,082 $116,048,753 $43,780,905Shares outstanding 5,806,612 13,431,244 5,536,048 3,450,877Net asset value, offering price and redemption price per share $21.38 $19.27 $20.96 $12.69
Series IINet assets $682,120,887 $587,917,668 $374,955,879 $43,982,588Shares outstanding 32,066,605 30,593,930 17,908,535 3,468,688Net asset value, offering price and redemption price per share $21.27 $19.22 $20.94 $12.68
Series IIINet assets $97,006,509 $221,017,314 $43,079,438 $1,688,907Shares outstanding 4,551,230 11,471,502 2,058,607 133,320Net asset value, offering price and redemption price per share $21.31 $19.27 $20.93 $12.67
John Hancock Variable Insurance TrustStatements of assets and liabilities — June 30, 2017 (unaudited)
55The accompanying notes are an integral part of the financial statements.
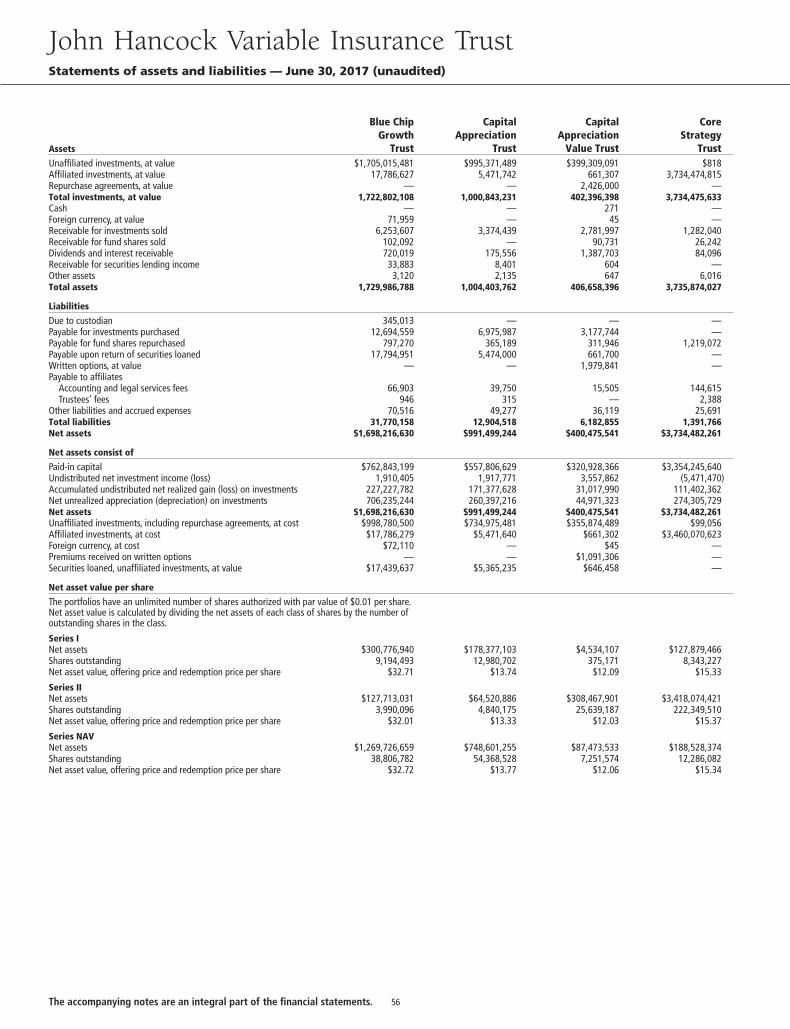
Assets
Blue ChipGrowth
Trust
CapitalAppreciation
Trust
CapitalAppreciation
Value Trust
CoreStrategy
TrustUnaffiliated investments, at value $1,705,015,481 $995,371,489 $399,309,091 $818Affiliated investments, at value 17,786,627 5,471,742 661,307 3,734,474,815Repurchase agreements, at value — — 2,426,000 —Total investments, at value 1,722,802,108 1,000,843,231 402,396,398 3,734,475,633Cash — — 271 —Foreign currency, at value 71,959 — 45 —Receivable for investments sold 6,253,607 3,374,439 2,781,997 1,282,040Receivable for fund shares sold 102,092 — 90,731 26,242Dividends and interest receivable 720,019 175,556 1,387,703 84,096Receivable for securities lending income 33,883 8,401 604 —Other assets 3,120 2,135 647 6,016Total assets 1,729,986,788 1,004,403,762 406,658,396 3,735,874,027
Liabilities
Due to custodian 345,013 — — —Payable for investments purchased 12,694,559 6,975,987 3,177,744 —Payable for fund shares repurchased 797,270 365,189 311,946 1,219,072Payable upon return of securities loaned 17,794,951 5,474,000 661,700 —Written options, at value — — 1,979,841 —Payable to affiliates
Accounting and legal services fees 66,903 39,750 15,505 144,615Trustees’ fees 946 315 — 2,388
Other liabilities and accrued expenses 70,516 49,277 36,119 25,691Total liabilities 31,770,158 12,904,518 6,182,855 1,391,766Net assets $1,698,216,630 $991,499,244 $400,475,541 $3,734,482,261
Net assets consist of
Paid-in capital $762,843,199 $557,806,629 $320,928,366 $3,354,245,640Undistributed net investment income (loss) 1,910,405 1,917,771 3,557,862 (5,471,470)Accumulated undistributed net realized gain (loss) on investments 227,227,782 171,377,628 31,017,990 111,402,362Net unrealized appreciation (depreciation) on investments 706,235,244 260,397,216 44,971,323 274,305,729Net assets $1,698,216,630 $991,499,244 $400,475,541 $3,734,482,261Unaffiliated investments, including repurchase agreements, at cost $998,780,500 $734,975,481 $355,874,489 $99,056Affiliated investments, at cost $17,786,279 $5,471,640 $661,302 $3,460,070,623Foreign currency, at cost $72,110 — $45 —Premiums received on written options — — $1,091,306 —Securities loaned, unaffiliated investments, at value $17,439,637 $5,365,235 $646,458 —
Net asset value per share
The portfolios have an unlimited number of shares authorized with par value of $0.01 per share.Net asset value is calculated by dividing the net assets of each class of shares by the number ofoutstanding shares in the class.
Series INet assets $300,776,940 $178,377,103 $4,534,107 $127,879,466Shares outstanding 9,194,493 12,980,702 375,171 8,343,227Net asset value, offering price and redemption price per share $32.71 $13.74 $12.09 $15.33
Series IINet assets $127,713,031 $64,520,886 $308,467,901 $3,418,074,421Shares outstanding 3,990,096 4,840,175 25,639,187 222,349,510Net asset value, offering price and redemption price per share $32.01 $13.33 $12.03 $15.37
Series NAVNet assets $1,269,726,659 $748,601,255 $87,473,533 $188,528,374Shares outstanding 38,806,782 54,368,528 7,251,574 12,286,082Net asset value, offering price and redemption price per share $32.72 $13.77 $12.06 $15.34
John Hancock Variable Insurance TrustStatements of assets and liabilities — June 30, 2017 (unaudited)
56The accompanying notes are an integral part of the financial statements.
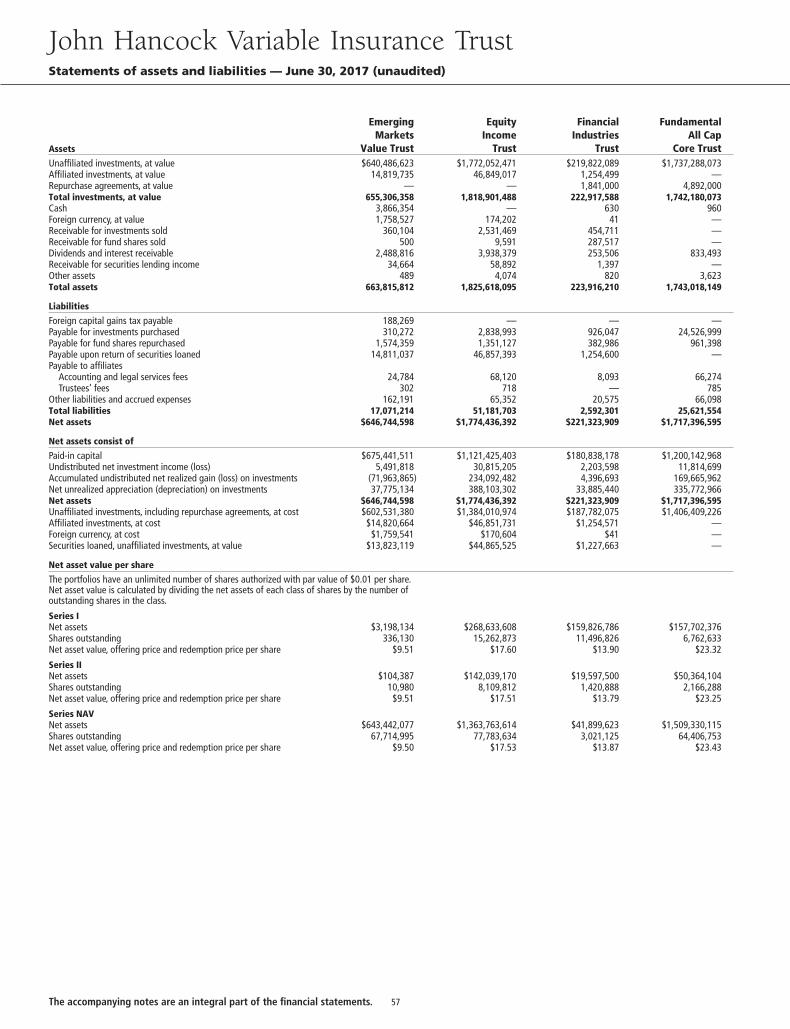
Assets
EmergingMarkets
Value Trust
EquityIncome
Trust
FinancialIndustries
Trust
FundamentalAll Cap
Core TrustUnaffiliated investments, at value $640,486,623 $1,772,052,471 $219,822,089 $1,737,288,073Affiliated investments, at value 14,819,735 46,849,017 1,254,499 —Repurchase agreements, at value — — 1,841,000 4,892,000Total investments, at value 655,306,358 1,818,901,488 222,917,588 1,742,180,073Cash 3,866,354 — 630 960Foreign currency, at value 1,758,527 174,202 41 —Receivable for investments sold 360,104 2,531,469 454,711 —Receivable for fund shares sold 500 9,591 287,517 —Dividends and interest receivable 2,488,816 3,938,379 253,506 833,493Receivable for securities lending income 34,664 58,892 1,397 —Other assets 489 4,074 820 3,623Total assets 663,815,812 1,825,618,095 223,916,210 1,743,018,149
Liabilities
Foreign capital gains tax payable 188,269 — — —Payable for investments purchased 310,272 2,838,993 926,047 24,526,999Payable for fund shares repurchased 1,574,359 1,351,127 382,986 961,398Payable upon return of securities loaned 14,811,037 46,857,393 1,254,600 —Payable to affiliates
Accounting and legal services fees 24,784 68,120 8,093 66,274Trustees’ fees 302 718 — 785
Other liabilities and accrued expenses 162,191 65,352 20,575 66,098Total liabilities 17,071,214 51,181,703 2,592,301 25,621,554Net assets $646,744,598 $1,774,436,392 $221,323,909 $1,717,396,595
Net assets consist of
Paid-in capital $675,441,511 $1,121,425,403 $180,838,178 $1,200,142,968Undistributed net investment income (loss) 5,491,818 30,815,205 2,203,598 11,814,699Accumulated undistributed net realized gain (loss) on investments (71,963,865) 234,092,482 4,396,693 169,665,962Net unrealized appreciation (depreciation) on investments 37,775,134 388,103,302 33,885,440 335,772,966Net assets $646,744,598 $1,774,436,392 $221,323,909 $1,717,396,595Unaffiliated investments, including repurchase agreements, at cost $602,531,380 $1,384,010,974 $187,782,075 $1,406,409,226Affiliated investments, at cost $14,820,664 $46,851,731 $1,254,571 —Foreign currency, at cost $1,759,541 $170,604 $41 —Securities loaned, unaffiliated investments, at value $13,823,119 $44,865,525 $1,227,663 —
Net asset value per share
The portfolios have an unlimited number of shares authorized with par value of $0.01 per share.Net asset value is calculated by dividing the net assets of each class of shares by the number ofoutstanding shares in the class.
Series INet assets $3,198,134 $268,633,608 $159,826,786 $157,702,376Shares outstanding 336,130 15,262,873 11,496,826 6,762,633Net asset value, offering price and redemption price per share $9.51 $17.60 $13.90 $23.32
Series IINet assets $104,387 $142,039,170 $19,597,500 $50,364,104Shares outstanding 10,980 8,109,812 1,420,888 2,166,288Net asset value, offering price and redemption price per share $9.51 $17.51 $13.79 $23.25
Series NAVNet assets $643,442,077 $1,363,763,614 $41,899,623 $1,509,330,115Shares outstanding 67,714,995 77,783,634 3,021,125 64,406,753Net asset value, offering price and redemption price per share $9.50 $17.53 $13.87 $23.43
John Hancock Variable Insurance TrustStatements of assets and liabilities — June 30, 2017 (unaudited)
57The accompanying notes are an integral part of the financial statements.
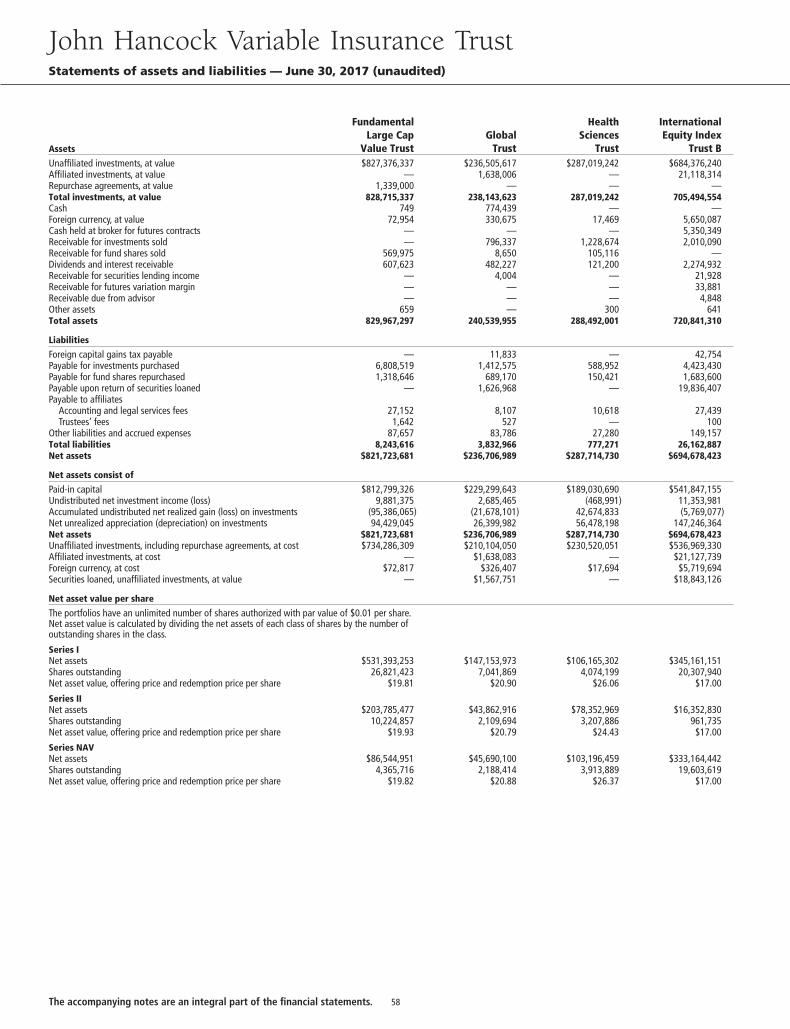
Assets
FundamentalLarge Cap
Value TrustGlobal
Trust
HealthSciences
Trust
InternationalEquity Index
Trust BUnaffiliated investments, at value $827,376,337 $236,505,617 $287,019,242 $684,376,240Affiliated investments, at value — 1,638,006 — 21,118,314Repurchase agreements, at value 1,339,000 — — —Total investments, at value 828,715,337 238,143,623 287,019,242 705,494,554Cash 749 774,439 — —Foreign currency, at value 72,954 330,675 17,469 5,650,087Cash held at broker for futures contracts — — — 5,350,349Receivable for investments sold — 796,337 1,228,674 2,010,090Receivable for fund shares sold 569,975 8,650 105,116 —Dividends and interest receivable 607,623 482,227 121,200 2,274,932Receivable for securities lending income — 4,004 — 21,928Receivable for futures variation margin — — — 33,881Receivable due from advisor — — — 4,848Other assets 659 — 300 641Total assets 829,967,297 240,539,955 288,492,001 720,841,310
Liabilities
Foreign capital gains tax payable — 11,833 — 42,754Payable for investments purchased 6,808,519 1,412,575 588,952 4,423,430Payable for fund shares repurchased 1,318,646 689,170 150,421 1,683,600Payable upon return of securities loaned — 1,626,968 — 19,836,407Payable to affiliates
Accounting and legal services fees 27,152 8,107 10,618 27,439Trustees’ fees 1,642 527 — 100
Other liabilities and accrued expenses 87,657 83,786 27,280 149,157Total liabilities 8,243,616 3,832,966 777,271 26,162,887Net assets $821,723,681 $236,706,989 $287,714,730 $694,678,423
Net assets consist of
Paid-in capital $812,799,326 $229,299,643 $189,030,690 $541,847,155Undistributed net investment income (loss) 9,881,375 2,685,465 (468,991) 11,353,981Accumulated undistributed net realized gain (loss) on investments (95,386,065) (21,678,101) 42,674,833 (5,769,077)Net unrealized appreciation (depreciation) on investments 94,429,045 26,399,982 56,478,198 147,246,364Net assets $821,723,681 $236,706,989 $287,714,730 $694,678,423Unaffiliated investments, including repurchase agreements, at cost $734,286,309 $210,104,050 $230,520,051 $536,969,330Affiliated investments, at cost — $1,638,083 — $21,127,739Foreign currency, at cost $72,817 $326,407 $17,694 $5,719,694Securities loaned, unaffiliated investments, at value — $1,567,751 — $18,843,126
Net asset value per share
The portfolios have an unlimited number of shares authorized with par value of $0.01 per share.Net asset value is calculated by dividing the net assets of each class of shares by the number ofoutstanding shares in the class.
Series INet assets $531,393,253 $147,153,973 $106,165,302 $345,161,151Shares outstanding 26,821,423 7,041,869 4,074,199 20,307,940Net asset value, offering price and redemption price per share $19.81 $20.90 $26.06 $17.00
Series IINet assets $203,785,477 $43,862,916 $78,352,969 $16,352,830Shares outstanding 10,224,857 2,109,694 3,207,886 961,735Net asset value, offering price and redemption price per share $19.93 $20.79 $24.43 $17.00
Series NAVNet assets $86,544,951 $45,690,100 $103,196,459 $333,164,442Shares outstanding 4,365,716 2,188,414 3,913,889 19,603,619Net asset value, offering price and redemption price per share $19.82 $20.88 $26.37 $17.00
John Hancock Variable Insurance TrustStatements of assets and liabilities — June 30, 2017 (unaudited)
58The accompanying notes are an integral part of the financial statements.
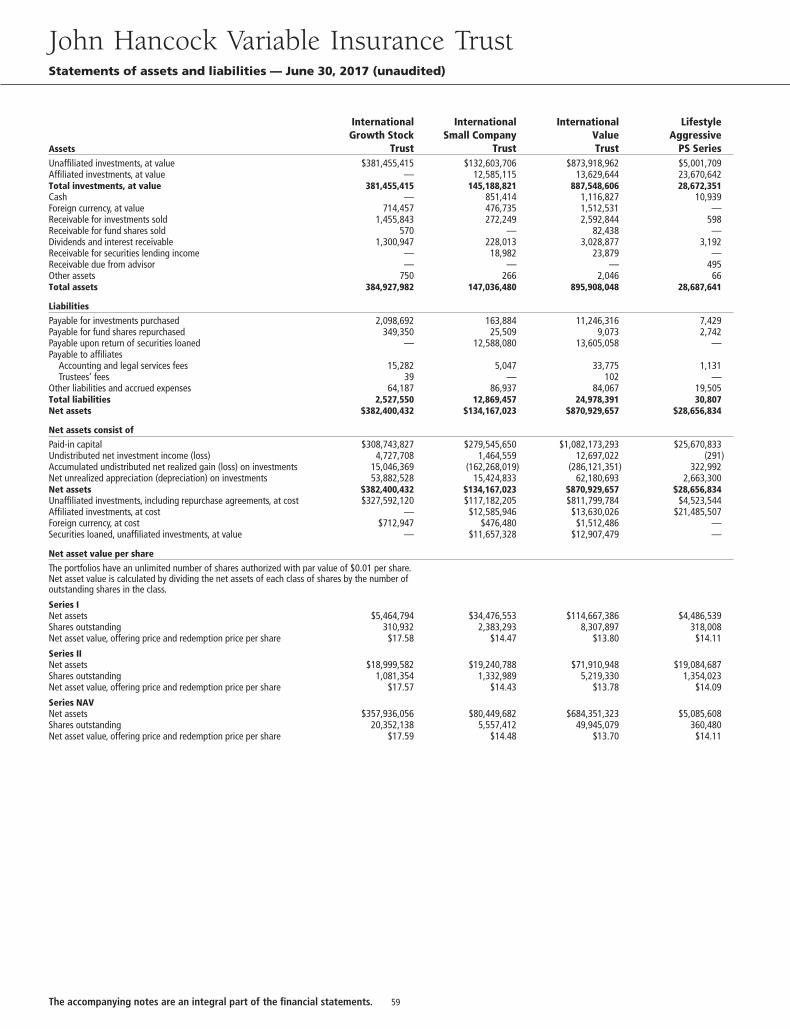
Assets
InternationalGrowth Stock
Trust
InternationalSmall Company
Trust
InternationalValueTrust
LifestyleAggressive
PS SeriesUnaffiliated investments, at value $381,455,415 $132,603,706 $873,918,962 $5,001,709Affiliated investments, at value — 12,585,115 13,629,644 23,670,642Total investments, at value 381,455,415 145,188,821 887,548,606 28,672,351Cash — 851,414 1,116,827 10,939Foreign currency, at value 714,457 476,735 1,512,531 —Receivable for investments sold 1,455,843 272,249 2,592,844 598Receivable for fund shares sold 570 — 82,438 —Dividends and interest receivable 1,300,947 228,013 3,028,877 3,192Receivable for securities lending income — 18,982 23,879 —Receivable due from advisor — — — 495Other assets 750 266 2,046 66Total assets 384,927,982 147,036,480 895,908,048 28,687,641
Liabilities
Payable for investments purchased 2,098,692 163,884 11,246,316 7,429Payable for fund shares repurchased 349,350 25,509 9,073 2,742Payable upon return of securities loaned — 12,588,080 13,605,058 —Payable to affiliates
Accounting and legal services fees 15,282 5,047 33,775 1,131Trustees’ fees 39 — 102 —
Other liabilities and accrued expenses 64,187 86,937 84,067 19,505Total liabilities 2,527,550 12,869,457 24,978,391 30,807Net assets $382,400,432 $134,167,023 $870,929,657 $28,656,834
Net assets consist of
Paid-in capital $308,743,827 $279,545,650 $1,082,173,293 $25,670,833Undistributed net investment income (loss) 4,727,708 1,464,559 12,697,022 (291)Accumulated undistributed net realized gain (loss) on investments 15,046,369 (162,268,019) (286,121,351) 322,992Net unrealized appreciation (depreciation) on investments 53,882,528 15,424,833 62,180,693 2,663,300Net assets $382,400,432 $134,167,023 $870,929,657 $28,656,834Unaffiliated investments, including repurchase agreements, at cost $327,592,120 $117,182,205 $811,799,784 $4,523,544Affiliated investments, at cost — $12,585,946 $13,630,026 $21,485,507Foreign currency, at cost $712,947 $476,480 $1,512,486 —Securities loaned, unaffiliated investments, at value — $11,657,328 $12,907,479 —
Net asset value per share
The portfolios have an unlimited number of shares authorized with par value of $0.01 per share.Net asset value is calculated by dividing the net assets of each class of shares by the number ofoutstanding shares in the class.
Series INet assets $5,464,794 $34,476,553 $114,667,386 $4,486,539Shares outstanding 310,932 2,383,293 8,307,897 318,008Net asset value, offering price and redemption price per share $17.58 $14.47 $13.80 $14.11
Series IINet assets $18,999,582 $19,240,788 $71,910,948 $19,084,687Shares outstanding 1,081,354 1,332,989 5,219,330 1,354,023Net asset value, offering price and redemption price per share $17.57 $14.43 $13.78 $14.09
Series NAVNet assets $357,936,056 $80,449,682 $684,351,323 $5,085,608Shares outstanding 20,352,138 5,557,412 49,945,079 360,480Net asset value, offering price and redemption price per share $17.59 $14.48 $13.70 $14.11
John Hancock Variable Insurance TrustStatements of assets and liabilities — June 30, 2017 (unaudited)
59The accompanying notes are an integral part of the financial statements.
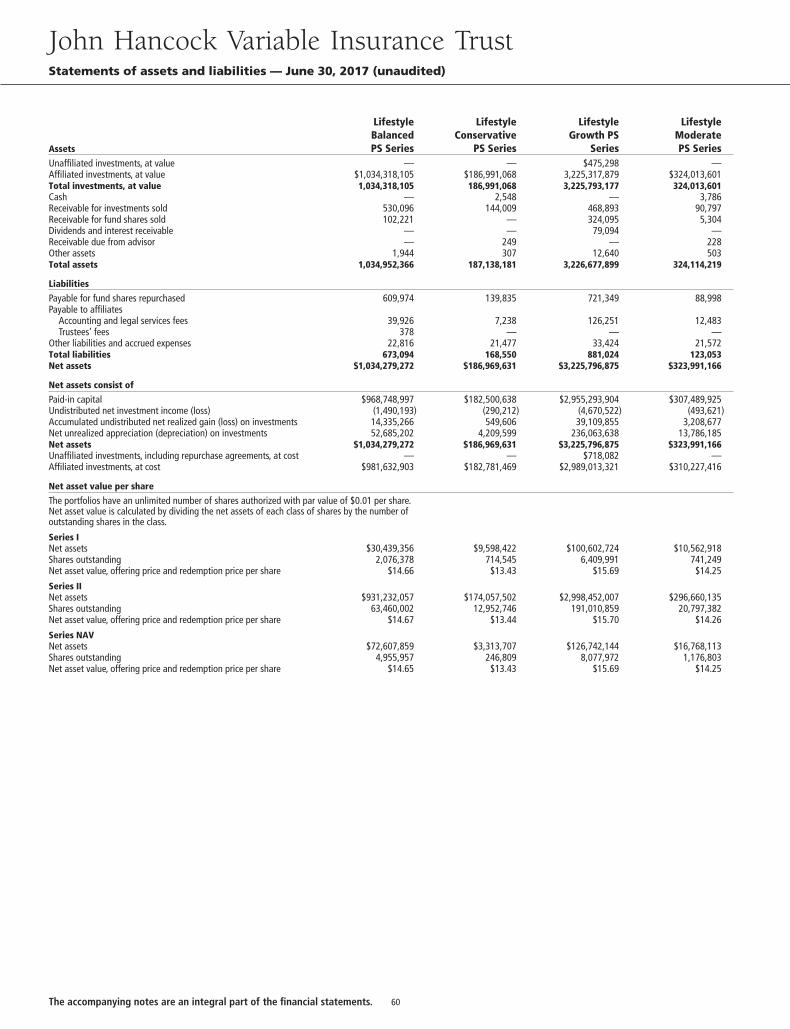
Assets
LifestyleBalancedPS Series
LifestyleConservative
PS Series
LifestyleGrowth PS
Series
LifestyleModeratePS Series
Unaffiliated investments, at value — — $475,298 —Affiliated investments, at value $1,034,318,105 $186,991,068 3,225,317,879 $324,013,601Total investments, at value 1,034,318,105 186,991,068 3,225,793,177 324,013,601Cash — 2,548 — 3,786Receivable for investments sold 530,096 144,009 468,893 90,797Receivable for fund shares sold 102,221 — 324,095 5,304Dividends and interest receivable — — 79,094 —Receivable due from advisor — 249 — 228Other assets 1,944 307 12,640 503Total assets 1,034,952,366 187,138,181 3,226,677,899 324,114,219
Liabilities
Payable for fund shares repurchased 609,974 139,835 721,349 88,998Payable to affiliates
Accounting and legal services fees 39,926 7,238 126,251 12,483Trustees’ fees 378 — — —
Other liabilities and accrued expenses 22,816 21,477 33,424 21,572Total liabilities 673,094 168,550 881,024 123,053Net assets $1,034,279,272 $186,969,631 $3,225,796,875 $323,991,166
Net assets consist of
Paid-in capital $968,748,997 $182,500,638 $2,955,293,904 $307,489,925Undistributed net investment income (loss) (1,490,193) (290,212) (4,670,522) (493,621)Accumulated undistributed net realized gain (loss) on investments 14,335,266 549,606 39,109,855 3,208,677Net unrealized appreciation (depreciation) on investments 52,685,202 4,209,599 236,063,638 13,786,185Net assets $1,034,279,272 $186,969,631 $3,225,796,875 $323,991,166Unaffiliated investments, including repurchase agreements, at cost — — $718,082 —Affiliated investments, at cost $981,632,903 $182,781,469 $2,989,013,321 $310,227,416
Net asset value per share
The portfolios have an unlimited number of shares authorized with par value of $0.01 per share.Net asset value is calculated by dividing the net assets of each class of shares by the number ofoutstanding shares in the class.
Series INet assets $30,439,356 $9,598,422 $100,602,724 $10,562,918Shares outstanding 2,076,378 714,545 6,409,991 741,249Net asset value, offering price and redemption price per share $14.66 $13.43 $15.69 $14.25
Series IINet assets $931,232,057 $174,057,502 $2,998,452,007 $296,660,135Shares outstanding 63,460,002 12,952,746 191,010,859 20,797,382Net asset value, offering price and redemption price per share $14.67 $13.44 $15.70 $14.26
Series NAVNet assets $72,607,859 $3,313,707 $126,742,144 $16,768,113Shares outstanding 4,955,957 246,809 8,077,972 1,176,803Net asset value, offering price and redemption price per share $14.65 $13.43 $15.69 $14.25
John Hancock Variable Insurance TrustStatements of assets and liabilities — June 30, 2017 (unaudited)
60The accompanying notes are an integral part of the financial statements.
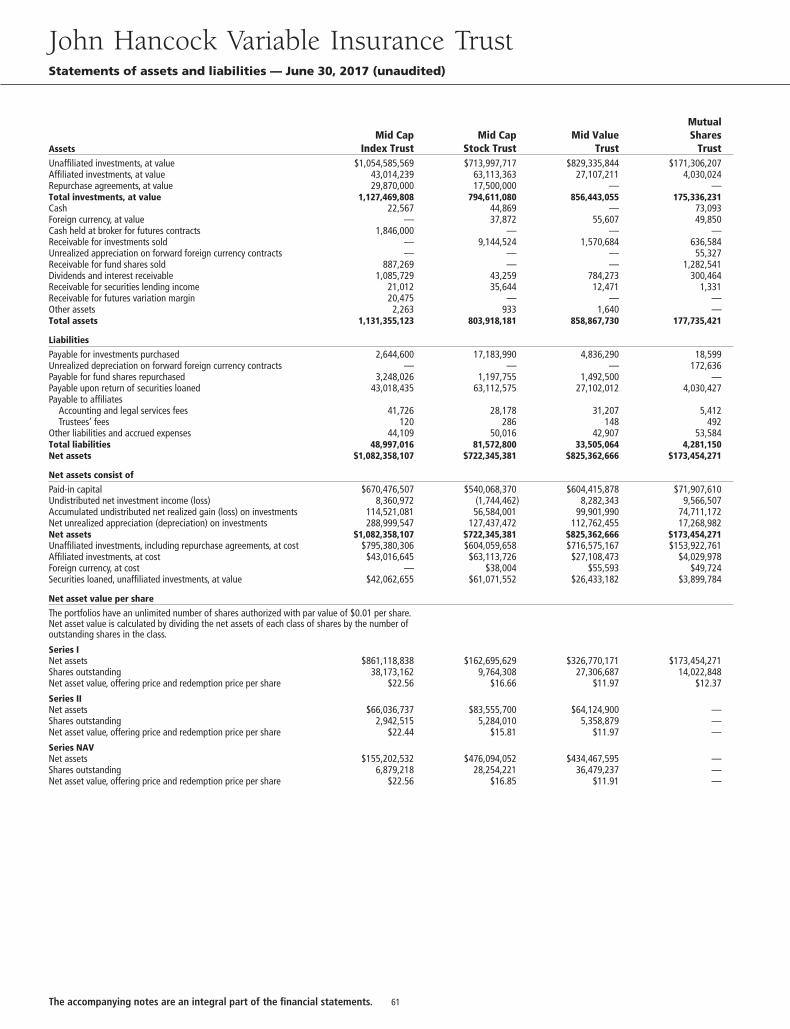
AssetsMid Cap
Index TrustMid Cap
Stock TrustMid Value
Trust
MutualShares
TrustUnaffiliated investments, at value $1,054,585,569 $713,997,717 $829,335,844 $171,306,207Affiliated investments, at value 43,014,239 63,113,363 27,107,211 4,030,024Repurchase agreements, at value 29,870,000 17,500,000 — —Total investments, at value 1,127,469,808 794,611,080 856,443,055 175,336,231Cash 22,567 44,869 — 73,093Foreign currency, at value — 37,872 55,607 49,850Cash held at broker for futures contracts 1,846,000 — — —Receivable for investments sold — 9,144,524 1,570,684 636,584Unrealized appreciation on forward foreign currency contracts — — — 55,327Receivable for fund shares sold 887,269 — — 1,282,541Dividends and interest receivable 1,085,729 43,259 784,273 300,464Receivable for securities lending income 21,012 35,644 12,471 1,331Receivable for futures variation margin 20,475 — — —Other assets 2,263 933 1,640 —Total assets 1,131,355,123 803,918,181 858,867,730 177,735,421
Liabilities
Payable for investments purchased 2,644,600 17,183,990 4,836,290 18,599Unrealized depreciation on forward foreign currency contracts — — — 172,636Payable for fund shares repurchased 3,248,026 1,197,755 1,492,500 —Payable upon return of securities loaned 43,018,435 63,112,575 27,102,012 4,030,427Payable to affiliates
Accounting and legal services fees 41,726 28,178 31,207 5,412Trustees’ fees 120 286 148 492
Other liabilities and accrued expenses 44,109 50,016 42,907 53,584Total liabilities 48,997,016 81,572,800 33,505,064 4,281,150Net assets $1,082,358,107 $722,345,381 $825,362,666 $173,454,271
Net assets consist of
Paid-in capital $670,476,507 $540,068,370 $604,415,878 $71,907,610Undistributed net investment income (loss) 8,360,972 (1,744,462) 8,282,343 9,566,507Accumulated undistributed net realized gain (loss) on investments 114,521,081 56,584,001 99,901,990 74,711,172Net unrealized appreciation (depreciation) on investments 288,999,547 127,437,472 112,762,455 17,268,982Net assets $1,082,358,107 $722,345,381 $825,362,666 $173,454,271Unaffiliated investments, including repurchase agreements, at cost $795,380,306 $604,059,658 $716,575,167 $153,922,761Affiliated investments, at cost $43,016,645 $63,113,726 $27,108,473 $4,029,978Foreign currency, at cost — $38,004 $55,593 $49,724Securities loaned, unaffiliated investments, at value $42,062,655 $61,071,552 $26,433,182 $3,899,784
Net asset value per share
The portfolios have an unlimited number of shares authorized with par value of $0.01 per share.Net asset value is calculated by dividing the net assets of each class of shares by the number ofoutstanding shares in the class.
Series INet assets $861,118,838 $162,695,629 $326,770,171 $173,454,271Shares outstanding 38,173,162 9,764,308 27,306,687 14,022,848Net asset value, offering price and redemption price per share $22.56 $16.66 $11.97 $12.37
Series IINet assets $66,036,737 $83,555,700 $64,124,900 —Shares outstanding 2,942,515 5,284,010 5,358,879 —Net asset value, offering price and redemption price per share $22.44 $15.81 $11.97 —
Series NAVNet assets $155,202,532 $476,094,052 $434,467,595 —Shares outstanding 6,879,218 28,254,221 36,479,237 —Net asset value, offering price and redemption price per share $22.56 $16.85 $11.91 —
John Hancock Variable Insurance TrustStatements of assets and liabilities — June 30, 2017 (unaudited)
61The accompanying notes are an integral part of the financial statements.
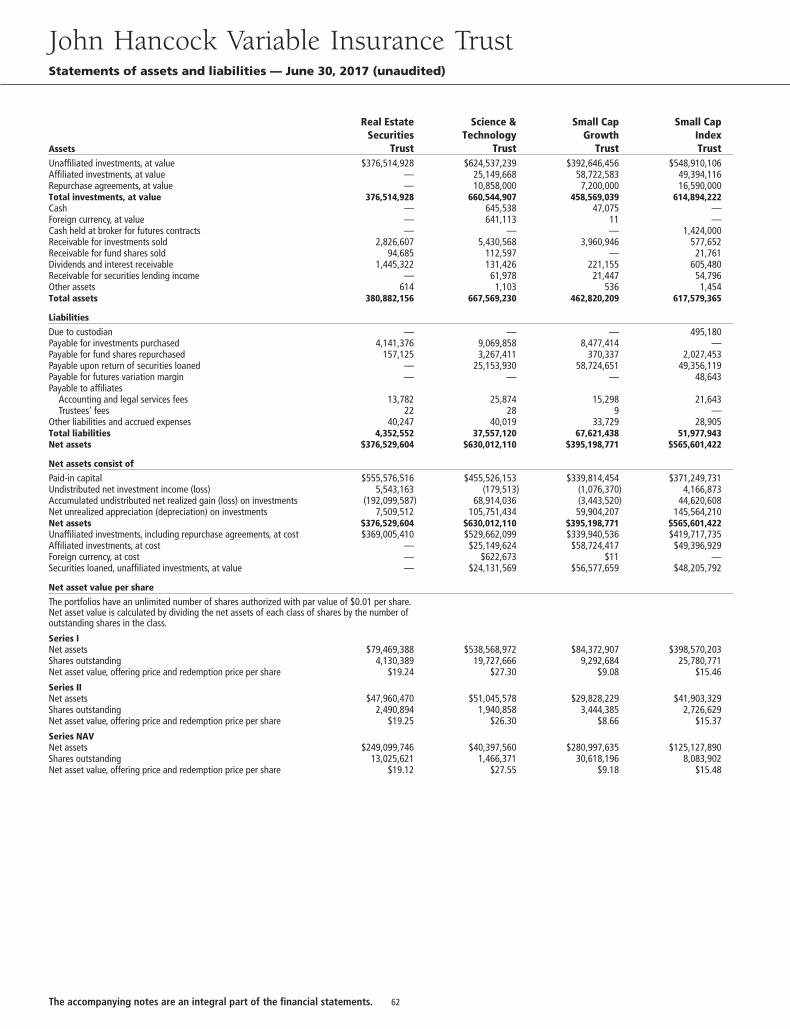
Assets
Real EstateSecurities
Trust
Science &Technology
Trust
Small CapGrowth
Trust
Small CapIndexTrust
Unaffiliated investments, at value $376,514,928 $624,537,239 $392,646,456 $548,910,106Affiliated investments, at value — 25,149,668 58,722,583 49,394,116Repurchase agreements, at value — 10,858,000 7,200,000 16,590,000Total investments, at value 376,514,928 660,544,907 458,569,039 614,894,222Cash — 645,538 47,075 —Foreign currency, at value — 641,113 11 —Cash held at broker for futures contracts — — — 1,424,000Receivable for investments sold 2,826,607 5,430,568 3,960,946 577,652Receivable for fund shares sold 94,685 112,597 — 21,761Dividends and interest receivable 1,445,322 131,426 221,155 605,480Receivable for securities lending income — 61,978 21,447 54,796Other assets 614 1,103 536 1,454Total assets 380,882,156 667,569,230 462,820,209 617,579,365
Liabilities
Due to custodian — — — 495,180Payable for investments purchased 4,141,376 9,069,858 8,477,414 —Payable for fund shares repurchased 157,125 3,267,411 370,337 2,027,453Payable upon return of securities loaned — 25,153,930 58,724,651 49,356,119Payable for futures variation margin — — — 48,643Payable to affiliates
Accounting and legal services fees 13,782 25,874 15,298 21,643Trustees’ fees 22 28 9 —
Other liabilities and accrued expenses 40,247 40,019 33,729 28,905Total liabilities 4,352,552 37,557,120 67,621,438 51,977,943Net assets $376,529,604 $630,012,110 $395,198,771 $565,601,422
Net assets consist of
Paid-in capital $555,576,516 $455,526,153 $339,814,454 $371,249,731Undistributed net investment income (loss) 5,543,163 (179,513) (1,076,370) 4,166,873Accumulated undistributed net realized gain (loss) on investments (192,099,587) 68,914,036 (3,443,520) 44,620,608Net unrealized appreciation (depreciation) on investments 7,509,512 105,751,434 59,904,207 145,564,210Net assets $376,529,604 $630,012,110 $395,198,771 $565,601,422Unaffiliated investments, including repurchase agreements, at cost $369,005,410 $529,662,099 $339,940,536 $419,717,735Affiliated investments, at cost — $25,149,624 $58,724,417 $49,396,929Foreign currency, at cost — $622,673 $11 —Securities loaned, unaffiliated investments, at value — $24,131,569 $56,577,659 $48,205,792
Net asset value per share
The portfolios have an unlimited number of shares authorized with par value of $0.01 per share.Net asset value is calculated by dividing the net assets of each class of shares by the number ofoutstanding shares in the class.
Series INet assets $79,469,388 $538,568,972 $84,372,907 $398,570,203Shares outstanding 4,130,389 19,727,666 9,292,684 25,780,771Net asset value, offering price and redemption price per share $19.24 $27.30 $9.08 $15.46
Series IINet assets $47,960,470 $51,045,578 $29,828,229 $41,903,329Shares outstanding 2,490,894 1,940,858 3,444,385 2,726,629Net asset value, offering price and redemption price per share $19.25 $26.30 $8.66 $15.37
Series NAVNet assets $249,099,746 $40,397,560 $280,997,635 $125,127,890Shares outstanding 13,025,621 1,466,371 30,618,196 8,083,902Net asset value, offering price and redemption price per share $19.12 $27.55 $9.18 $15.48
John Hancock Variable Insurance TrustStatements of assets and liabilities — June 30, 2017 (unaudited)
62The accompanying notes are an integral part of the financial statements.
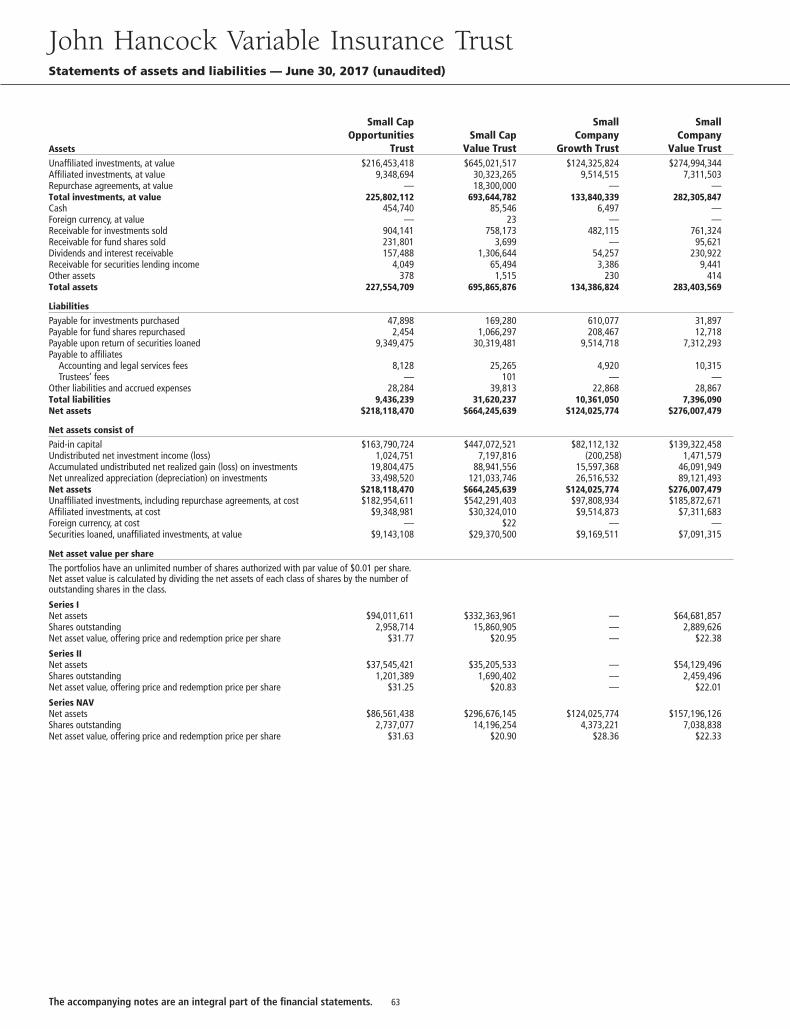
Assets
Small CapOpportunities
TrustSmall Cap
Value Trust
SmallCompany
Growth Trust
SmallCompany
Value TrustUnaffiliated investments, at value $216,453,418 $645,021,517 $124,325,824 $274,994,344Affiliated investments, at value 9,348,694 30,323,265 9,514,515 7,311,503Repurchase agreements, at value — 18,300,000 — —Total investments, at value 225,802,112 693,644,782 133,840,339 282,305,847Cash 454,740 85,546 6,497 —Foreign currency, at value — 23 — —Receivable for investments sold 904,141 758,173 482,115 761,324Receivable for fund shares sold 231,801 3,699 — 95,621Dividends and interest receivable 157,488 1,306,644 54,257 230,922Receivable for securities lending income 4,049 65,494 3,386 9,441Other assets 378 1,515 230 414Total assets 227,554,709 695,865,876 134,386,824 283,403,569
Liabilities
Payable for investments purchased 47,898 169,280 610,077 31,897Payable for fund shares repurchased 2,454 1,066,297 208,467 12,718Payable upon return of securities loaned 9,349,475 30,319,481 9,514,718 7,312,293Payable to affiliates
Accounting and legal services fees 8,128 25,265 4,920 10,315Trustees’ fees — 101 — —
Other liabilities and accrued expenses 28,284 39,813 22,868 28,867Total liabilities 9,436,239 31,620,237 10,361,050 7,396,090Net assets $218,118,470 $664,245,639 $124,025,774 $276,007,479
Net assets consist of
Paid-in capital $163,790,724 $447,072,521 $82,112,132 $139,322,458Undistributed net investment income (loss) 1,024,751 7,197,816 (200,258) 1,471,579Accumulated undistributed net realized gain (loss) on investments 19,804,475 88,941,556 15,597,368 46,091,949Net unrealized appreciation (depreciation) on investments 33,498,520 121,033,746 26,516,532 89,121,493Net assets $218,118,470 $664,245,639 $124,025,774 $276,007,479Unaffiliated investments, including repurchase agreements, at cost $182,954,611 $542,291,403 $97,808,934 $185,872,671Affiliated investments, at cost $9,348,981 $30,324,010 $9,514,873 $7,311,683Foreign currency, at cost — $22 — —Securities loaned, unaffiliated investments, at value $9,143,108 $29,370,500 $9,169,511 $7,091,315
Net asset value per share
The portfolios have an unlimited number of shares authorized with par value of $0.01 per share.Net asset value is calculated by dividing the net assets of each class of shares by the number ofoutstanding shares in the class.
Series INet assets $94,011,611 $332,363,961 — $64,681,857Shares outstanding 2,958,714 15,860,905 — 2,889,626Net asset value, offering price and redemption price per share $31.77 $20.95 — $22.38
Series IINet assets $37,545,421 $35,205,533 — $54,129,496Shares outstanding 1,201,389 1,690,402 — 2,459,496Net asset value, offering price and redemption price per share $31.25 $20.83 — $22.01
Series NAVNet assets $86,561,438 $296,676,145 $124,025,774 $157,196,126Shares outstanding 2,737,077 14,196,254 4,373,221 7,038,838Net asset value, offering price and redemption price per share $31.63 $20.90 $28.36 $22.33
John Hancock Variable Insurance TrustStatements of assets and liabilities — June 30, 2017 (unaudited)
63The accompanying notes are an integral part of the financial statements.
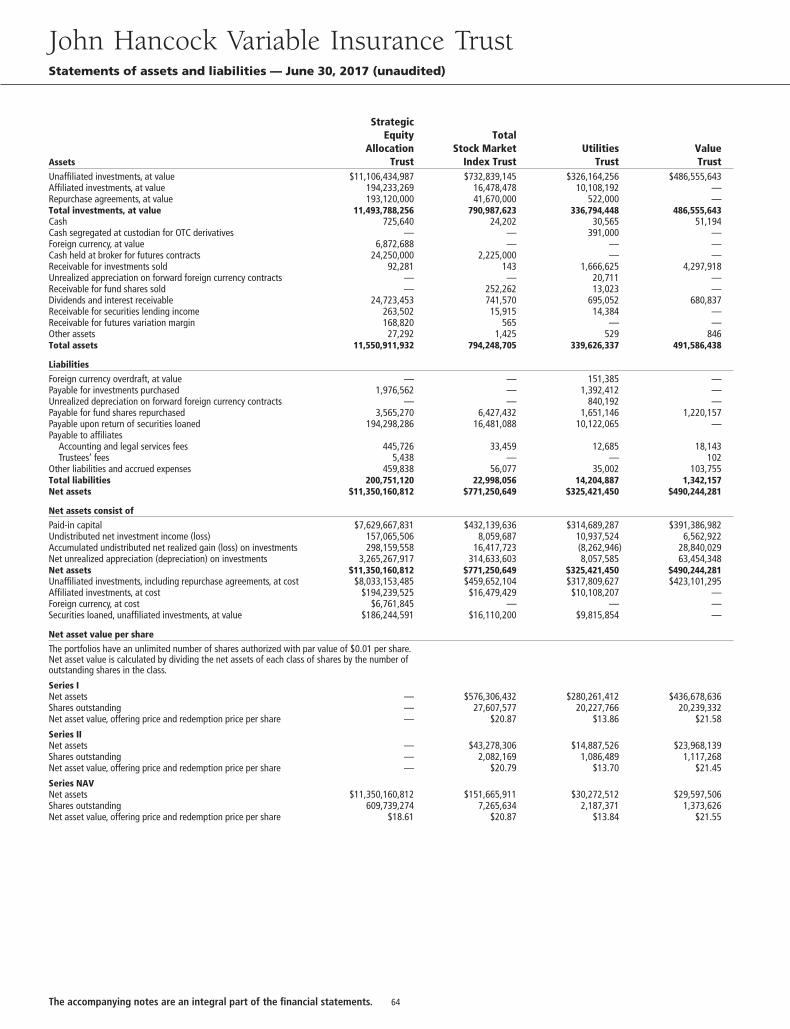
Assets
StrategicEquity
AllocationTrust
TotalStock Market
Index TrustUtilities
TrustValueTrust
Unaffiliated investments, at value $11,106,434,987 $732,839,145 $326,164,256 $486,555,643Affiliated investments, at value 194,233,269 16,478,478 10,108,192 —Repurchase agreements, at value 193,120,000 41,670,000 522,000 —Total investments, at value 11,493,788,256 790,987,623 336,794,448 486,555,643Cash 725,640 24,202 30,565 51,194Cash segregated at custodian for OTC derivatives — — 391,000 —Foreign currency, at value 6,872,688 — — —Cash held at broker for futures contracts 24,250,000 2,225,000 — —Receivable for investments sold 92,281 143 1,666,625 4,297,918Unrealized appreciation on forward foreign currency contracts — — 20,711 —Receivable for fund shares sold — 252,262 13,023 —Dividends and interest receivable 24,723,453 741,570 695,052 680,837Receivable for securities lending income 263,502 15,915 14,384 —Receivable for futures variation margin 168,820 565 — —Other assets 27,292 1,425 529 846Total assets 11,550,911,932 794,248,705 339,626,337 491,586,438
Liabilities
Foreign currency overdraft, at value — — 151,385 —Payable for investments purchased 1,976,562 — 1,392,412 —Unrealized depreciation on forward foreign currency contracts — — 840,192 —Payable for fund shares repurchased 3,565,270 6,427,432 1,651,146 1,220,157Payable upon return of securities loaned 194,298,286 16,481,088 10,122,065 —Payable to affiliates
Accounting and legal services fees 445,726 33,459 12,685 18,143Trustees’ fees 5,438 — — 102
Other liabilities and accrued expenses 459,838 56,077 35,002 103,755Total liabilities 200,751,120 22,998,056 14,204,887 1,342,157Net assets $11,350,160,812 $771,250,649 $325,421,450 $490,244,281
Net assets consist of
Paid-in capital $7,629,667,831 $432,139,636 $314,689,287 $391,386,982Undistributed net investment income (loss) 157,065,506 8,059,687 10,937,524 6,562,922Accumulated undistributed net realized gain (loss) on investments 298,159,558 16,417,723 (8,262,946) 28,840,029Net unrealized appreciation (depreciation) on investments 3,265,267,917 314,633,603 8,057,585 63,454,348Net assets $11,350,160,812 $771,250,649 $325,421,450 $490,244,281Unaffiliated investments, including repurchase agreements, at cost $8,033,153,485 $459,652,104 $317,809,627 $423,101,295Affiliated investments, at cost $194,239,525 $16,479,429 $10,108,207 —Foreign currency, at cost $6,761,845 — — —Securities loaned, unaffiliated investments, at value $186,244,591 $16,110,200 $9,815,854 —
Net asset value per share
The portfolios have an unlimited number of shares authorized with par value of $0.01 per share.Net asset value is calculated by dividing the net assets of each class of shares by the number ofoutstanding shares in the class.
Series INet assets — $576,306,432 $280,261,412 $436,678,636Shares outstanding — 27,607,577 20,227,766 20,239,332Net asset value, offering price and redemption price per share — $20.87 $13.86 $21.58
Series IINet assets — $43,278,306 $14,887,526 $23,968,139Shares outstanding — 2,082,169 1,086,489 1,117,268Net asset value, offering price and redemption price per share — $20.79 $13.70 $21.45
Series NAVNet assets $11,350,160,812 $151,665,911 $30,272,512 $29,597,506Shares outstanding 609,739,274 7,265,634 2,187,371 1,373,626Net asset value, offering price and redemption price per share $18.61 $20.87 $13.84 $21.55
John Hancock Variable Insurance TrustStatements of assets and liabilities — June 30, 2017 (unaudited)
64The accompanying notes are an integral part of the financial statements.
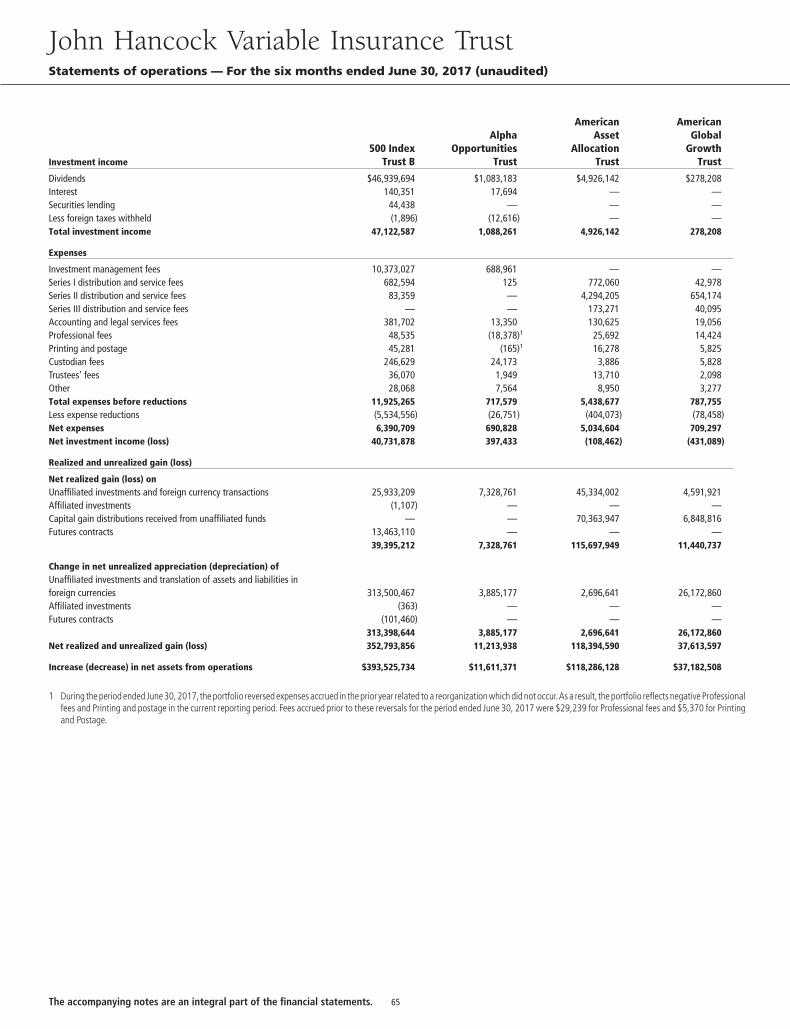
Investment income500 Index
Trust B
AlphaOpportunities
Trust
AmericanAsset
AllocationTrust
AmericanGlobal
GrowthTrust
Dividends $46,939,694 $1,083,183 $4,926,142 $278,208Interest 140,351 17,694 — —Securities lending 44,438 — — —Less foreign taxes withheld (1,896) (12,616) — —Total investment income 47,122,587 1,088,261 4,926,142 278,208
Expenses
Investment management fees 10,373,027 688,961 — —Series I distribution and service fees 682,594 125 772,060 42,978Series II distribution and service fees 83,359 — 4,294,205 654,174Series III distribution and service fees — — 173,271 40,095Accounting and legal services fees 381,702 13,350 130,625 19,056Professional fees 48,535 (18,378)1 25,692 14,424Printing and postage 45,281 (165)1 16,278 5,825Custodian fees 246,629 24,173 3,886 5,828Trustees’ fees 36,070 1,949 13,710 2,098Other 28,068 7,564 8,950 3,277Total expenses before reductions 11,925,265 717,579 5,438,677 787,755Less expense reductions (5,534,556) (26,751) (404,073) (78,458)Net expenses 6,390,709 690,828 5,034,604 709,297Net investment income (loss) 40,731,878 397,433 (108,462) (431,089)
Realized and unrealized gain (loss)
Net realized gain (loss) onUnaffiliated investments and foreign currency transactions 25,933,209 7,328,761 45,334,002 4,591,921Affiliated investments (1,107) — — —Capital gain distributions received from unaffiliated funds — — 70,363,947 6,848,816Futures contracts 13,463,110 — — —
39,395,212 7,328,761 115,697,949 11,440,737
Change in net unrealized appreciation (depreciation) ofUnaffiliated investments and translation of assets and liabilities inforeign currencies 313,500,467 3,885,177 2,696,641 26,172,860Affiliated investments (363) — — —Futures contracts (101,460) — — —
313,398,644 3,885,177 2,696,641 26,172,860Net realized and unrealized gain (loss) 352,793,856 11,213,938 118,394,590 37,613,597
Increase (decrease) in net assets from operations $393,525,734 $11,611,371 $118,286,128 $37,182,508
1 During the period ended June 30, 2017,the portfolio reversed expenses accrued in the prior year related to a reorganization which did not occur.As a result, the portfolio reflects negative Professionalfees and Printing and postage in the current reporting period. Fees accrued prior to these reversals for the period ended June 30, 2017 were $29,239 for Professional fees and $5,370 for Printingand Postage.
John Hancock Variable Insurance TrustStatements of operations — For the six months ended June 30, 2017 (unaudited)
65The accompanying notes are an integral part of the financial statements.
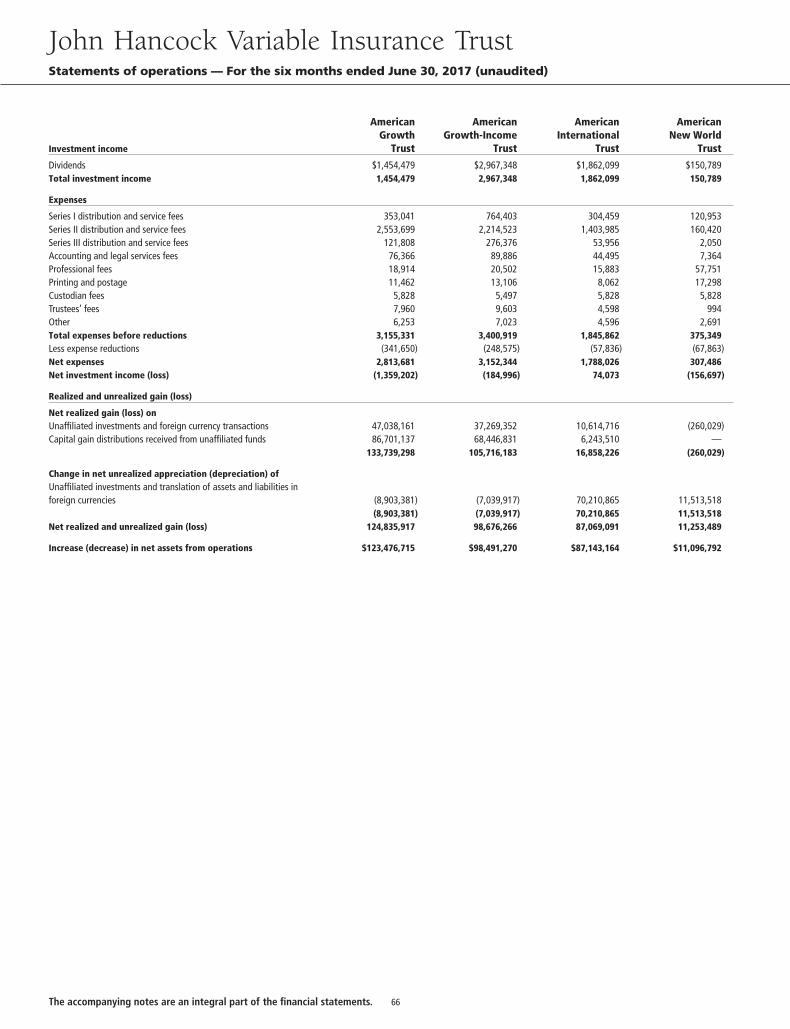
Investment income
AmericanGrowth
Trust
AmericanGrowth-Income
Trust
AmericanInternational
Trust
AmericanNew World
Trust
Dividends $1,454,479 $2,967,348 $1,862,099 $150,789Total investment income 1,454,479 2,967,348 1,862,099 150,789
Expenses
Series I distribution and service fees 353,041 764,403 304,459 120,953Series II distribution and service fees 2,553,699 2,214,523 1,403,985 160,420Series III distribution and service fees 121,808 276,376 53,956 2,050Accounting and legal services fees 76,366 89,886 44,495 7,364Professional fees 18,914 20,502 15,883 57,751Printing and postage 11,462 13,106 8,062 17,298Custodian fees 5,828 5,497 5,828 5,828Trustees’ fees 7,960 9,603 4,598 994Other 6,253 7,023 4,596 2,691Total expenses before reductions 3,155,331 3,400,919 1,845,862 375,349Less expense reductions (341,650) (248,575) (57,836) (67,863)Net expenses 2,813,681 3,152,344 1,788,026 307,486Net investment income (loss) (1,359,202) (184,996) 74,073 (156,697)
Realized and unrealized gain (loss)
Net realized gain (loss) onUnaffiliated investments and foreign currency transactions 47,038,161 37,269,352 10,614,716 (260,029)Capital gain distributions received from unaffiliated funds 86,701,137 68,446,831 6,243,510 —
133,739,298 105,716,183 16,858,226 (260,029)
Change in net unrealized appreciation (depreciation) ofUnaffiliated investments and translation of assets and liabilities inforeign currencies (8,903,381) (7,039,917) 70,210,865 11,513,518
(8,903,381) (7,039,917) 70,210,865 11,513,518Net realized and unrealized gain (loss) 124,835,917 98,676,266 87,069,091 11,253,489
Increase (decrease) in net assets from operations $123,476,715 $98,491,270 $87,143,164 $11,096,792
John Hancock Variable Insurance TrustStatements of operations — For the six months ended June 30, 2017 (unaudited)
66The accompanying notes are an integral part of the financial statements.
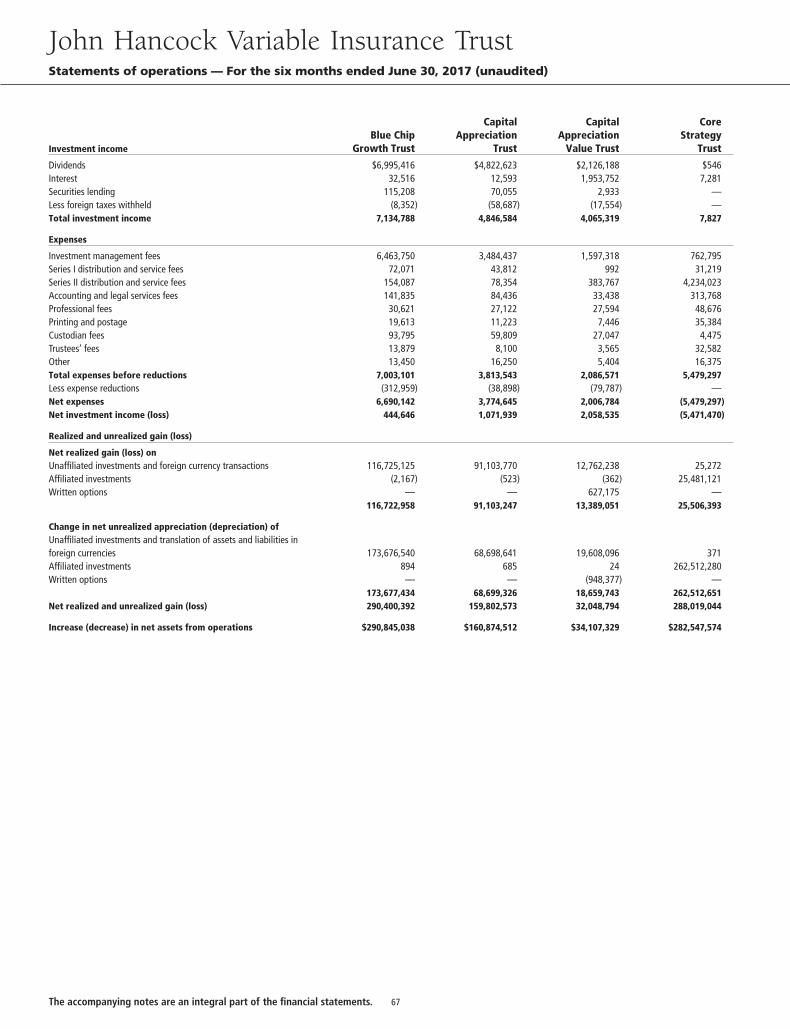
Investment incomeBlue Chip
Growth Trust
CapitalAppreciation
Trust
CapitalAppreciation
Value Trust
CoreStrategy
Trust
Dividends $6,995,416 $4,822,623 $2,126,188 $546Interest 32,516 12,593 1,953,752 7,281Securities lending 115,208 70,055 2,933 —Less foreign taxes withheld (8,352) (58,687) (17,554) —Total investment income 7,134,788 4,846,584 4,065,319 7,827
Expenses
Investment management fees 6,463,750 3,484,437 1,597,318 762,795Series I distribution and service fees 72,071 43,812 992 31,219Series II distribution and service fees 154,087 78,354 383,767 4,234,023Accounting and legal services fees 141,835 84,436 33,438 313,768Professional fees 30,621 27,122 27,594 48,676Printing and postage 19,613 11,223 7,446 35,384Custodian fees 93,795 59,809 27,047 4,475Trustees’ fees 13,879 8,100 3,565 32,582Other 13,450 16,250 5,404 16,375Total expenses before reductions 7,003,101 3,813,543 2,086,571 5,479,297Less expense reductions (312,959) (38,898) (79,787) —Net expenses 6,690,142 3,774,645 2,006,784 (5,479,297)Net investment income (loss) 444,646 1,071,939 2,058,535 (5,471,470)
Realized and unrealized gain (loss)
Net realized gain (loss) onUnaffiliated investments and foreign currency transactions 116,725,125 91,103,770 12,762,238 25,272Affiliated investments (2,167) (523) (362) 25,481,121Written options — — 627,175 —
116,722,958 91,103,247 13,389,051 25,506,393
Change in net unrealized appreciation (depreciation) ofUnaffiliated investments and translation of assets and liabilities inforeign currencies 173,676,540 68,698,641 19,608,096 371Affiliated investments 894 685 24 262,512,280Written options — — (948,377) —
173,677,434 68,699,326 18,659,743 262,512,651Net realized and unrealized gain (loss) 290,400,392 159,802,573 32,048,794 288,019,044
Increase (decrease) in net assets from operations $290,845,038 $160,874,512 $34,107,329 $282,547,574
John Hancock Variable Insurance TrustStatements of operations — For the six months ended June 30, 2017 (unaudited)
67The accompanying notes are an integral part of the financial statements.
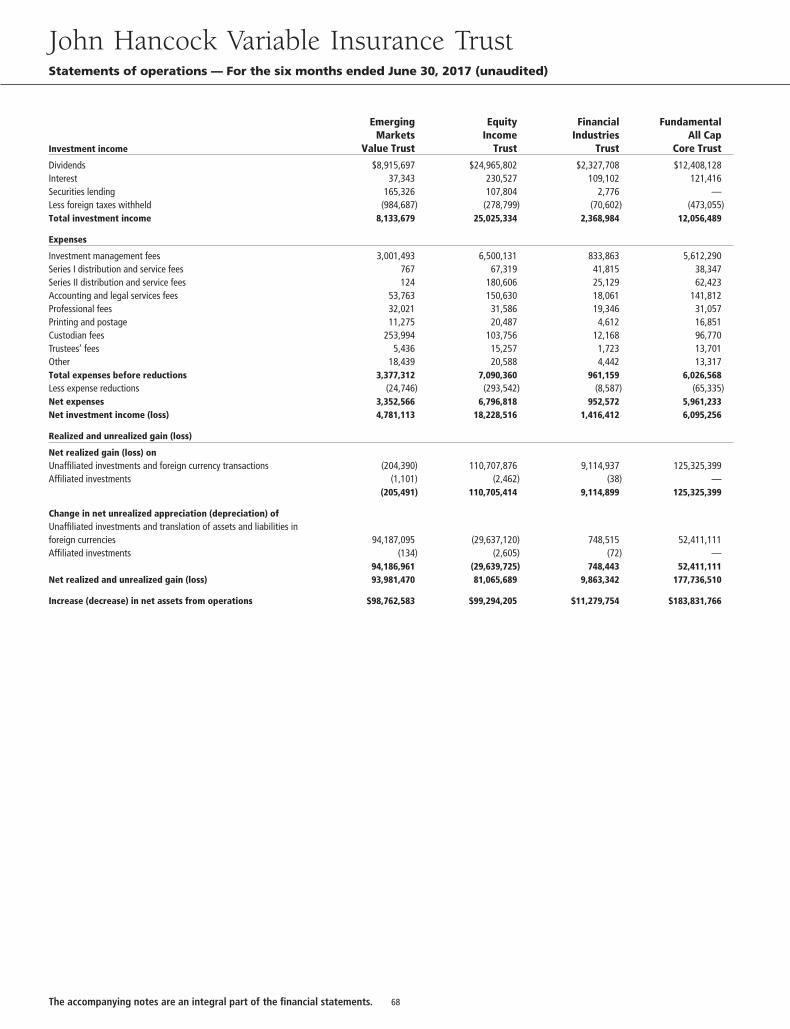
Investment income
EmergingMarkets
Value Trust
EquityIncome
Trust
FinancialIndustries
Trust
FundamentalAll Cap
Core Trust
Dividends $8,915,697 $24,965,802 $2,327,708 $12,408,128Interest 37,343 230,527 109,102 121,416Securities lending 165,326 107,804 2,776 —Less foreign taxes withheld (984,687) (278,799) (70,602) (473,055)Total investment income 8,133,679 25,025,334 2,368,984 12,056,489
Expenses
Investment management fees 3,001,493 6,500,131 833,863 5,612,290Series I distribution and service fees 767 67,319 41,815 38,347Series II distribution and service fees 124 180,606 25,129 62,423Accounting and legal services fees 53,763 150,630 18,061 141,812Professional fees 32,021 31,586 19,346 31,057Printing and postage 11,275 20,487 4,612 16,851Custodian fees 253,994 103,756 12,168 96,770Trustees’ fees 5,436 15,257 1,723 13,701Other 18,439 20,588 4,442 13,317Total expenses before reductions 3,377,312 7,090,360 961,159 6,026,568Less expense reductions (24,746) (293,542) (8,587) (65,335)Net expenses 3,352,566 6,796,818 952,572 5,961,233Net investment income (loss) 4,781,113 18,228,516 1,416,412 6,095,256
Realized and unrealized gain (loss)
Net realized gain (loss) onUnaffiliated investments and foreign currency transactions (204,390) 110,707,876 9,114,937 125,325,399Affiliated investments (1,101) (2,462) (38) —
(205,491) 110,705,414 9,114,899 125,325,399
Change in net unrealized appreciation (depreciation) ofUnaffiliated investments and translation of assets and liabilities inforeign currencies 94,187,095 (29,637,120) 748,515 52,411,111Affiliated investments (134) (2,605) (72) —
94,186,961 (29,639,725) 748,443 52,411,111Net realized and unrealized gain (loss) 93,981,470 81,065,689 9,863,342 177,736,510
Increase (decrease) in net assets from operations $98,762,583 $99,294,205 $11,279,754 $183,831,766
John Hancock Variable Insurance TrustStatements of operations — For the six months ended June 30, 2017 (unaudited)
68The accompanying notes are an integral part of the financial statements.
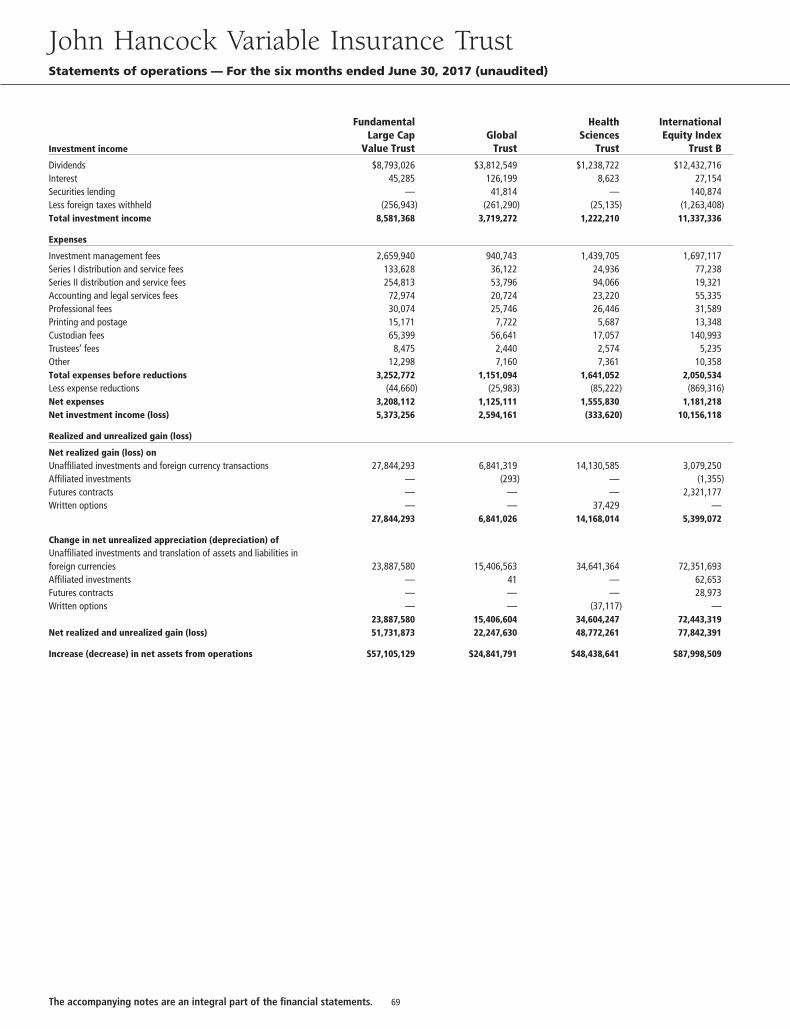
Investment income
FundamentalLarge Cap
Value TrustGlobal
Trust
HealthSciences
Trust
InternationalEquity Index
Trust B
Dividends $8,793,026 $3,812,549 $1,238,722 $12,432,716Interest 45,285 126,199 8,623 27,154Securities lending — 41,814 — 140,874Less foreign taxes withheld (256,943) (261,290) (25,135) (1,263,408)Total investment income 8,581,368 3,719,272 1,222,210 11,337,336
Expenses
Investment management fees 2,659,940 940,743 1,439,705 1,697,117Series I distribution and service fees 133,628 36,122 24,936 77,238Series II distribution and service fees 254,813 53,796 94,066 19,321Accounting and legal services fees 72,974 20,724 23,220 55,335Professional fees 30,074 25,746 26,446 31,589Printing and postage 15,171 7,722 5,687 13,348Custodian fees 65,399 56,641 17,057 140,993Trustees’ fees 8,475 2,440 2,574 5,235Other 12,298 7,160 7,361 10,358Total expenses before reductions 3,252,772 1,151,094 1,641,052 2,050,534Less expense reductions (44,660) (25,983) (85,222) (869,316)Net expenses 3,208,112 1,125,111 1,555,830 1,181,218Net investment income (loss) 5,373,256 2,594,161 (333,620) 10,156,118
Realized and unrealized gain (loss)
Net realized gain (loss) onUnaffiliated investments and foreign currency transactions 27,844,293 6,841,319 14,130,585 3,079,250Affiliated investments — (293) — (1,355)Futures contracts — — — 2,321,177Written options — — 37,429 —
27,844,293 6,841,026 14,168,014 5,399,072
Change in net unrealized appreciation (depreciation) ofUnaffiliated investments and translation of assets and liabilities inforeign currencies 23,887,580 15,406,563 34,641,364 72,351,693Affiliated investments — 41 — 62,653Futures contracts — — — 28,973Written options — — (37,117) —
23,887,580 15,406,604 34,604,247 72,443,319Net realized and unrealized gain (loss) 51,731,873 22,247,630 48,772,261 77,842,391
Increase (decrease) in net assets from operations $57,105,129 $24,841,791 $48,438,641 $87,998,509
John Hancock Variable Insurance TrustStatements of operations — For the six months ended June 30, 2017 (unaudited)
69The accompanying notes are an integral part of the financial statements.
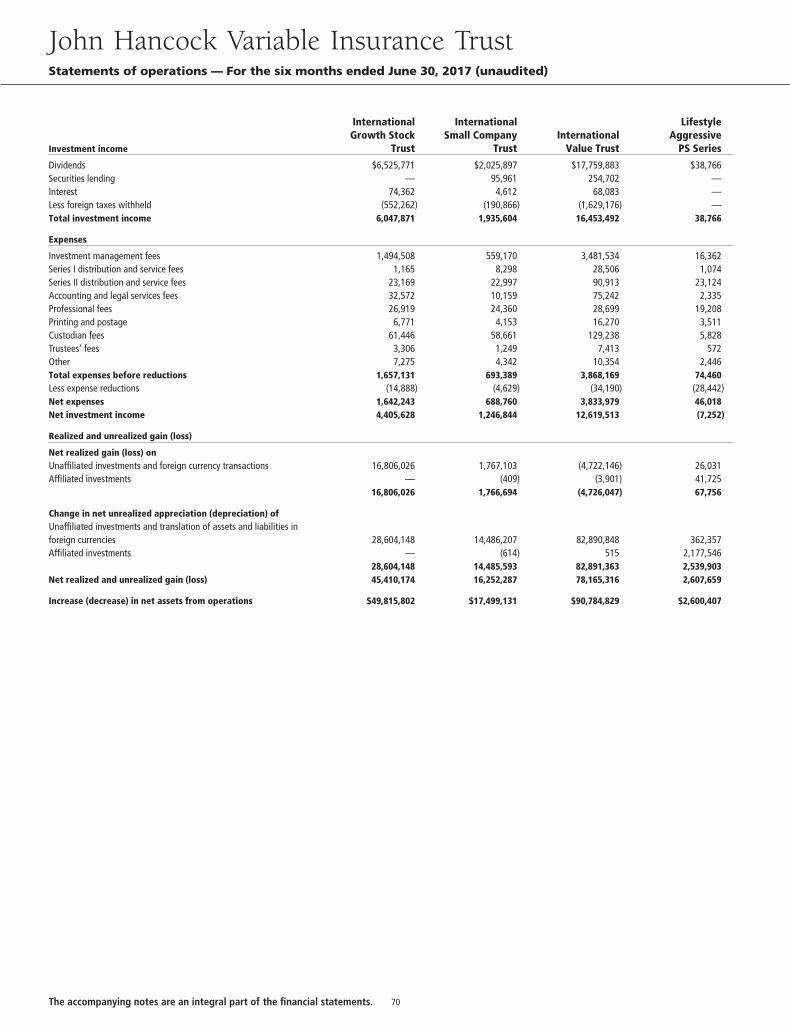
Investment income
InternationalGrowth Stock
Trust
InternationalSmall Company
TrustInternational
Value Trust
LifestyleAggressive
PS Series
Dividends $6,525,771 $2,025,897 $17,759,883 $38,766Securities lending — 95,961 254,702 —Interest 74,362 4,612 68,083 —Less foreign taxes withheld (552,262) (190,866) (1,629,176) —Total investment income 6,047,871 1,935,604 16,453,492 38,766
Expenses
Investment management fees 1,494,508 559,170 3,481,534 16,362Series I distribution and service fees 1,165 8,298 28,506 1,074Series II distribution and service fees 23,169 22,997 90,913 23,124Accounting and legal services fees 32,572 10,159 75,242 2,335Professional fees 26,919 24,360 28,699 19,208Printing and postage 6,771 4,153 16,270 3,511Custodian fees 61,446 58,661 129,238 5,828Trustees’ fees 3,306 1,249 7,413 572Other 7,275 4,342 10,354 2,446Total expenses before reductions 1,657,131 693,389 3,868,169 74,460Less expense reductions (14,888) (4,629) (34,190) (28,442)Net expenses 1,642,243 688,760 3,833,979 46,018Net investment income 4,405,628 1,246,844 12,619,513 (7,252)
Realized and unrealized gain (loss)
Net realized gain (loss) onUnaffiliated investments and foreign currency transactions 16,806,026 1,767,103 (4,722,146) 26,031Affiliated investments — (409) (3,901) 41,725
16,806,026 1,766,694 (4,726,047) 67,756
Change in net unrealized appreciation (depreciation) ofUnaffiliated investments and translation of assets and liabilities inforeign currencies 28,604,148 14,486,207 82,890,848 362,357Affiliated investments — (614) 515 2,177,546
28,604,148 14,485,593 82,891,363 2,539,903Net realized and unrealized gain (loss) 45,410,174 16,252,287 78,165,316 2,607,659
Increase (decrease) in net assets from operations $49,815,802 $17,499,131 $90,784,829 $2,600,407
John Hancock Variable Insurance TrustStatements of operations — For the six months ended June 30, 2017 (unaudited)
70The accompanying notes are an integral part of the financial statements.
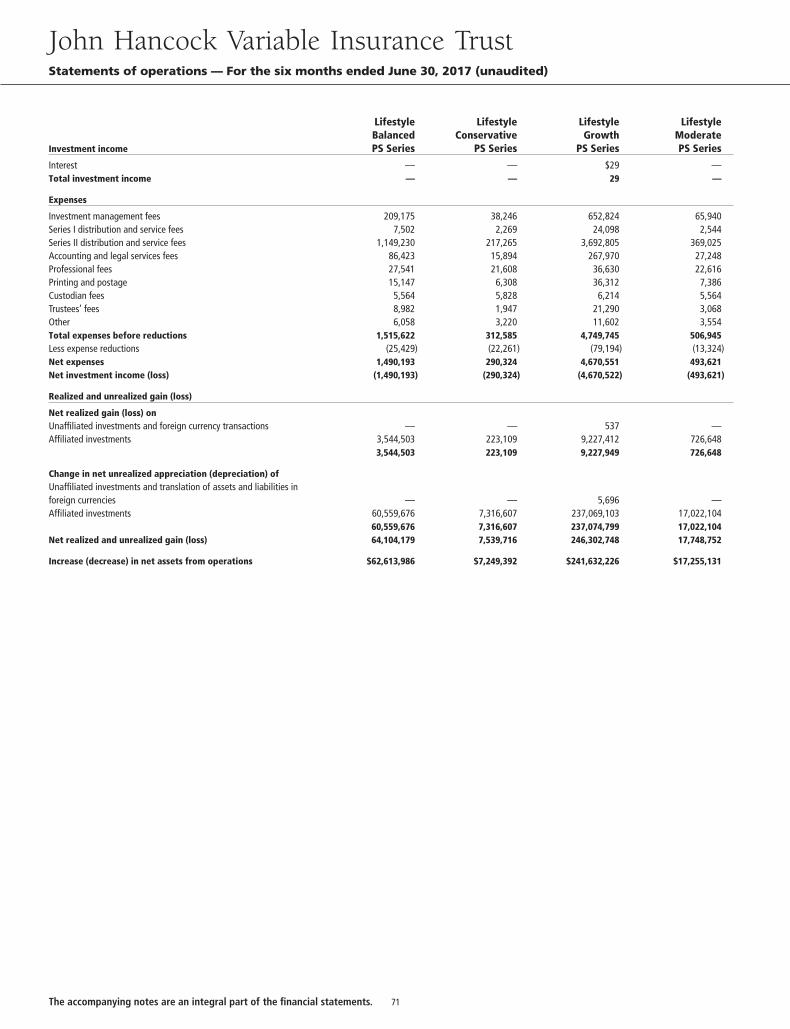
Investment income
LifestyleBalancedPS Series
LifestyleConservative
PS Series
LifestyleGrowth
PS Series
LifestyleModeratePS Series
Interest — — $29 —Total investment income — — 29 —
Expenses
Investment management fees 209,175 38,246 652,824 65,940Series I distribution and service fees 7,502 2,269 24,098 2,544Series II distribution and service fees 1,149,230 217,265 3,692,805 369,025Accounting and legal services fees 86,423 15,894 267,970 27,248Professional fees 27,541 21,608 36,630 22,616Printing and postage 15,147 6,308 36,312 7,386Custodian fees 5,564 5,828 6,214 5,564Trustees’ fees 8,982 1,947 21,290 3,068Other 6,058 3,220 11,602 3,554Total expenses before reductions 1,515,622 312,585 4,749,745 506,945Less expense reductions (25,429) (22,261) (79,194) (13,324)Net expenses 1,490,193 290,324 4,670,551 493,621Net investment income (loss) (1,490,193) (290,324) (4,670,522) (493,621)
Realized and unrealized gain (loss)
Net realized gain (loss) onUnaffiliated investments and foreign currency transactions — — 537 —Affiliated investments 3,544,503 223,109 9,227,412 726,648
3,544,503 223,109 9,227,949 726,648
Change in net unrealized appreciation (depreciation) ofUnaffiliated investments and translation of assets and liabilities inforeign currencies — — 5,696 —Affiliated investments 60,559,676 7,316,607 237,069,103 17,022,104
60,559,676 7,316,607 237,074,799 17,022,104Net realized and unrealized gain (loss) 64,104,179 7,539,716 246,302,748 17,748,752
Increase (decrease) in net assets from operations $62,613,986 $7,249,392 $241,632,226 $17,255,131
John Hancock Variable Insurance TrustStatements of operations — For the six months ended June 30, 2017 (unaudited)
71The accompanying notes are an integral part of the financial statements.
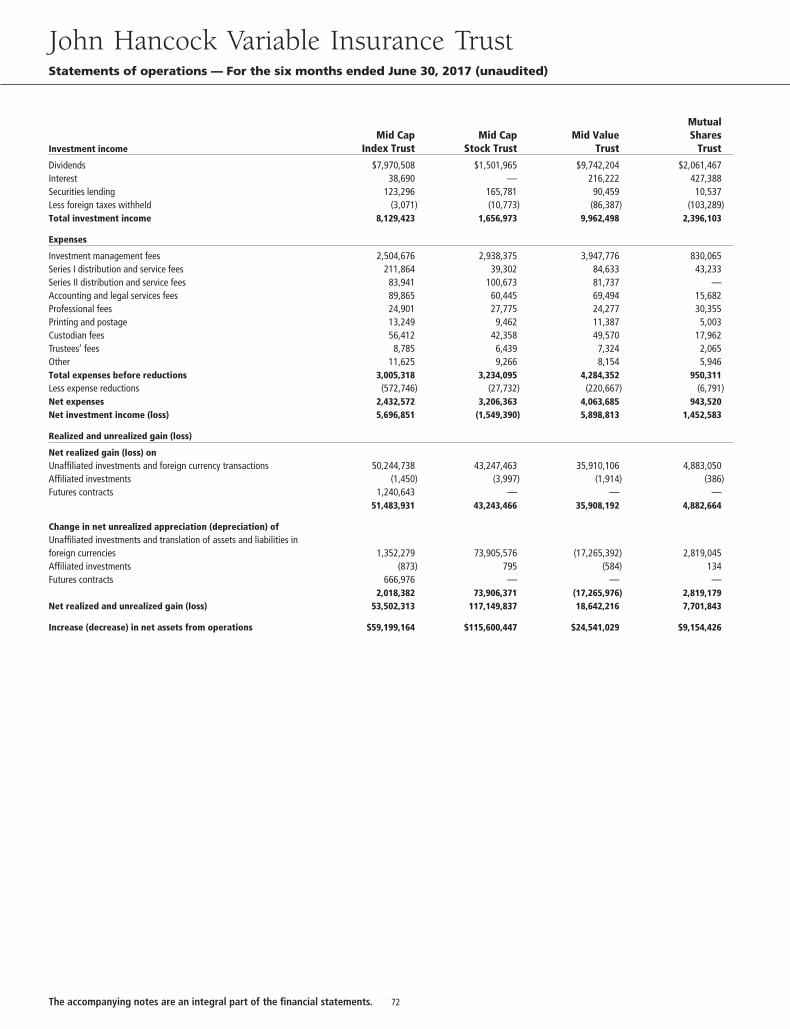
Investment incomeMid Cap
Index TrustMid Cap
Stock TrustMid Value
Trust
MutualShares
Trust
Dividends $7,970,508 $1,501,965 $9,742,204 $2,061,467Interest 38,690 — 216,222 427,388Securities lending 123,296 165,781 90,459 10,537Less foreign taxes withheld (3,071) (10,773) (86,387) (103,289)Total investment income 8,129,423 1,656,973 9,962,498 2,396,103
Expenses
Investment management fees 2,504,676 2,938,375 3,947,776 830,065Series I distribution and service fees 211,864 39,302 84,633 43,233Series II distribution and service fees 83,941 100,673 81,737 —Accounting and legal services fees 89,865 60,445 69,494 15,682Professional fees 24,901 27,775 24,277 30,355Printing and postage 13,249 9,462 11,387 5,003Custodian fees 56,412 42,358 49,570 17,962Trustees’ fees 8,785 6,439 7,324 2,065Other 11,625 9,266 8,154 5,946Total expenses before reductions 3,005,318 3,234,095 4,284,352 950,311Less expense reductions (572,746) (27,732) (220,667) (6,791)Net expenses 2,432,572 3,206,363 4,063,685 943,520Net investment income (loss) 5,696,851 (1,549,390) 5,898,813 1,452,583
Realized and unrealized gain (loss)
Net realized gain (loss) onUnaffiliated investments and foreign currency transactions 50,244,738 43,247,463 35,910,106 4,883,050Affiliated investments (1,450) (3,997) (1,914) (386)Futures contracts 1,240,643 — — —
51,483,931 43,243,466 35,908,192 4,882,664
Change in net unrealized appreciation (depreciation) ofUnaffiliated investments and translation of assets and liabilities inforeign currencies 1,352,279 73,905,576 (17,265,392) 2,819,045Affiliated investments (873) 795 (584) 134Futures contracts 666,976 — — —
2,018,382 73,906,371 (17,265,976) 2,819,179Net realized and unrealized gain (loss) 53,502,313 117,149,837 18,642,216 7,701,843
Increase (decrease) in net assets from operations $59,199,164 $115,600,447 $24,541,029 $9,154,426
John Hancock Variable Insurance TrustStatements of operations — For the six months ended June 30, 2017 (unaudited)
72The accompanying notes are an integral part of the financial statements.
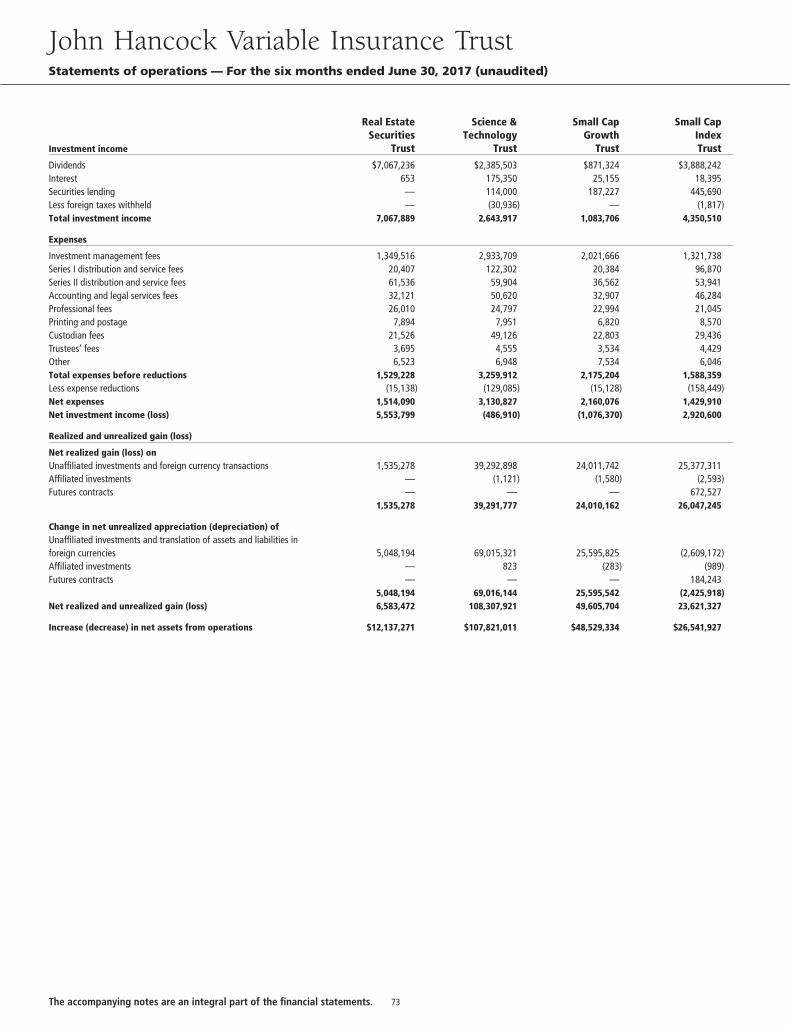
Investment income
Real EstateSecurities
Trust
Science &Technology
Trust
Small CapGrowth
Trust
Small CapIndexTrust
Dividends $7,067,236 $2,385,503 $871,324 $3,888,242Interest 653 175,350 25,155 18,395Securities lending — 114,000 187,227 445,690Less foreign taxes withheld — (30,936) — (1,817)Total investment income 7,067,889 2,643,917 1,083,706 4,350,510
Expenses
Investment management fees 1,349,516 2,933,709 2,021,666 1,321,738Series I distribution and service fees 20,407 122,302 20,384 96,870Series II distribution and service fees 61,536 59,904 36,562 53,941Accounting and legal services fees 32,121 50,620 32,907 46,284Professional fees 26,010 24,797 22,994 21,045Printing and postage 7,894 7,951 6,820 8,570Custodian fees 21,526 49,126 22,803 29,436Trustees’ fees 3,695 4,555 3,534 4,429Other 6,523 6,948 7,534 6,046Total expenses before reductions 1,529,228 3,259,912 2,175,204 1,588,359Less expense reductions (15,138) (129,085) (15,128) (158,449)Net expenses 1,514,090 3,130,827 2,160,076 1,429,910Net investment income (loss) 5,553,799 (486,910) (1,076,370) 2,920,600
Realized and unrealized gain (loss)
Net realized gain (loss) onUnaffiliated investments and foreign currency transactions 1,535,278 39,292,898 24,011,742 25,377,311Affiliated investments — (1,121) (1,580) (2,593)Futures contracts — — — 672,527
1,535,278 39,291,777 24,010,162 26,047,245
Change in net unrealized appreciation (depreciation) ofUnaffiliated investments and translation of assets and liabilities inforeign currencies 5,048,194 69,015,321 25,595,825 (2,609,172)Affiliated investments — 823 (283) (989)Futures contracts — — — 184,243
5,048,194 69,016,144 25,595,542 (2,425,918)Net realized and unrealized gain (loss) 6,583,472 108,307,921 49,605,704 23,621,327
Increase (decrease) in net assets from operations $12,137,271 $107,821,011 $48,529,334 $26,541,927
John Hancock Variable Insurance TrustStatements of operations — For the six months ended June 30, 2017 (unaudited)
73The accompanying notes are an integral part of the financial statements.
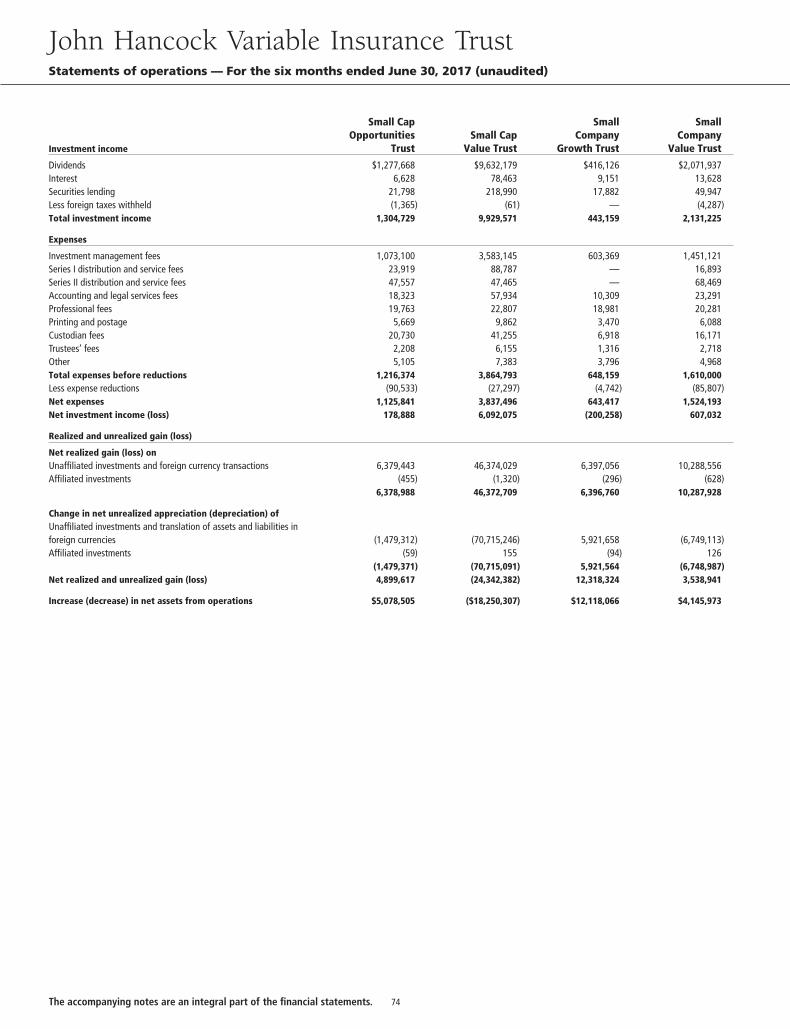
Investment income
Small CapOpportunities
TrustSmall Cap
Value Trust
SmallCompany
Growth Trust
SmallCompany
Value Trust
Dividends $1,277,668 $9,632,179 $416,126 $2,071,937Interest 6,628 78,463 9,151 13,628Securities lending 21,798 218,990 17,882 49,947Less foreign taxes withheld (1,365) (61) — (4,287)Total investment income 1,304,729 9,929,571 443,159 2,131,225
Expenses
Investment management fees 1,073,100 3,583,145 603,369 1,451,121Series I distribution and service fees 23,919 88,787 — 16,893Series II distribution and service fees 47,557 47,465 — 68,469Accounting and legal services fees 18,323 57,934 10,309 23,291Professional fees 19,763 22,807 18,981 20,281Printing and postage 5,669 9,862 3,470 6,088Custodian fees 20,730 41,255 6,918 16,171Trustees’ fees 2,208 6,155 1,316 2,718Other 5,105 7,383 3,796 4,968Total expenses before reductions 1,216,374 3,864,793 648,159 1,610,000Less expense reductions (90,533) (27,297) (4,742) (85,807)Net expenses 1,125,841 3,837,496 643,417 1,524,193Net investment income (loss) 178,888 6,092,075 (200,258) 607,032
Realized and unrealized gain (loss)
Net realized gain (loss) onUnaffiliated investments and foreign currency transactions 6,379,443 46,374,029 6,397,056 10,288,556Affiliated investments (455) (1,320) (296) (628)
6,378,988 46,372,709 6,396,760 10,287,928
Change in net unrealized appreciation (depreciation) ofUnaffiliated investments and translation of assets and liabilities inforeign currencies (1,479,312) (70,715,246) 5,921,658 (6,749,113)Affiliated investments (59) 155 (94) 126
(1,479,371) (70,715,091) 5,921,564 (6,748,987)Net realized and unrealized gain (loss) 4,899,617 (24,342,382) 12,318,324 3,538,941
Increase (decrease) in net assets from operations $5,078,505 ($18,250,307) $12,118,066 $4,145,973
John Hancock Variable Insurance TrustStatements of operations — For the six months ended June 30, 2017 (unaudited)
74The accompanying notes are an integral part of the financial statements.
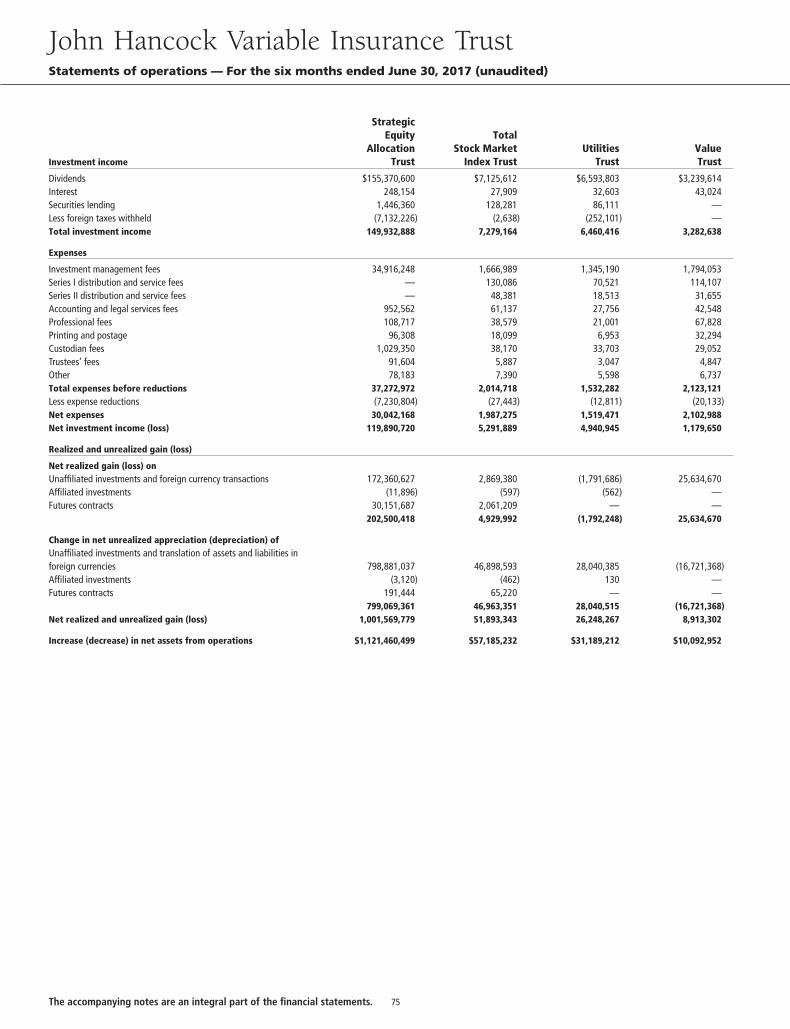
Investment income
StrategicEquity
AllocationTrust
TotalStock Market
Index TrustUtilities
TrustValueTrust
Dividends $155,370,600 $7,125,612 $6,593,803 $3,239,614Interest 248,154 27,909 32,603 43,024Securities lending 1,446,360 128,281 86,111 —Less foreign taxes withheld (7,132,226) (2,638) (252,101) —Total investment income 149,932,888 7,279,164 6,460,416 3,282,638
Expenses
Investment management fees 34,916,248 1,666,989 1,345,190 1,794,053Series I distribution and service fees — 130,086 70,521 114,107Series II distribution and service fees — 48,381 18,513 31,655Accounting and legal services fees 952,562 61,137 27,756 42,548Professional fees 108,717 38,579 21,001 67,828Printing and postage 96,308 18,099 6,953 32,294Custodian fees 1,029,350 38,170 33,703 29,052Trustees’ fees 91,604 5,887 3,047 4,847Other 78,183 7,390 5,598 6,737Total expenses before reductions 37,272,972 2,014,718 1,532,282 2,123,121Less expense reductions (7,230,804) (27,443) (12,811) (20,133)Net expenses 30,042,168 1,987,275 1,519,471 2,102,988Net investment income (loss) 119,890,720 5,291,889 4,940,945 1,179,650
Realized and unrealized gain (loss)
Net realized gain (loss) onUnaffiliated investments and foreign currency transactions 172,360,627 2,869,380 (1,791,686) 25,634,670Affiliated investments (11,896) (597) (562) —Futures contracts 30,151,687 2,061,209 — —
202,500,418 4,929,992 (1,792,248) 25,634,670
Change in net unrealized appreciation (depreciation) ofUnaffiliated investments and translation of assets and liabilities inforeign currencies 798,881,037 46,898,593 28,040,385 (16,721,368)Affiliated investments (3,120) (462) 130 —Futures contracts 191,444 65,220 — —
799,069,361 46,963,351 28,040,515 (16,721,368)Net realized and unrealized gain (loss) 1,001,569,779 51,893,343 26,248,267 8,913,302
Increase (decrease) in net assets from operations $1,121,460,499 $57,185,232 $31,189,212 $10,092,952
John Hancock Variable Insurance TrustStatements of operations — For the six months ended June 30, 2017 (unaudited)
75The accompanying notes are an integral part of the financial statements.
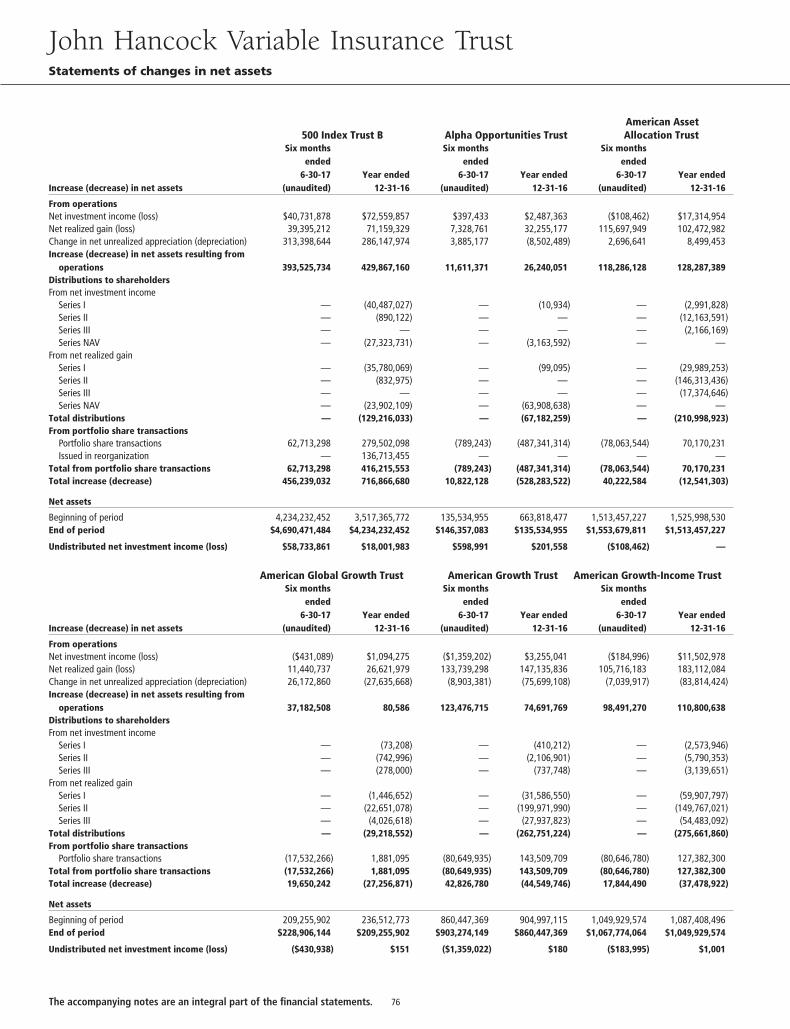
500 Index Trust B Alpha Opportunities TrustAmerican AssetAllocation Trust
Increase (decrease) in net assets
Six monthsended
6-30-17(unaudited)
Year ended12-31-16
Six monthsended
6-30-17(unaudited)
Year ended12-31-16
Six monthsended
6-30-17(unaudited)
Year ended12-31-16
From operationsNet investment income (loss) $40,731,878 $72,559,857 $397,433 $2,487,363 ($108,462) $17,314,954Net realized gain (loss) 39,395,212 71,159,329 7,328,761 32,255,177 115,697,949 102,472,982Change in net unrealized appreciation (depreciation) 313,398,644 286,147,974 3,885,177 (8,502,489) 2,696,641 8,499,453Increase (decrease) in net assets resulting from
operations 393,525,734 429,867,160 11,611,371 26,240,051 118,286,128 128,287,389Distributions to shareholdersFrom net investment income
Series I — (40,487,027) — (10,934) — (2,991,828)Series II — (890,122) — — — (12,163,591)Series III — — — — — (2,166,169)Series NAV — (27,323,731) — (3,163,592) — —
From net realized gainSeries I — (35,780,069) — (99,095) — (29,989,253)Series II — (832,975) — — — (146,313,436)Series III — — — — — (17,374,646)Series NAV — (23,902,109) — (63,908,638) — —
Total distributions — (129,216,033) — (67,182,259) — (210,998,923)From portfolio share transactions
Portfolio share transactions 62,713,298 279,502,098 (789,243) (487,341,314) (78,063,544) 70,170,231Issued in reorganization — 136,713,455 — — — —
Total from portfolio share transactions 62,713,298 416,215,553 (789,243) (487,341,314) (78,063,544) 70,170,231Total increase (decrease) 456,239,032 716,866,680 10,822,128 (528,283,522) 40,222,584 (12,541,303)
Net assets
Beginning of period 4,234,232,452 3,517,365,772 135,534,955 663,818,477 1,513,457,227 1,525,998,530End of period $4,690,471,484 $4,234,232,452 $146,357,083 $135,534,955 $1,553,679,811 $1,513,457,227
Undistributed net investment income (loss) $58,733,861 $18,001,983 $598,991 $201,558 ($108,462) —
American Global Growth Trust American Growth Trust American Growth-Income Trust
Increase (decrease) in net assets
Six monthsended
6-30-17(unaudited)
Year ended12-31-16
Six monthsended
6-30-17(unaudited)
Year ended12-31-16
Six monthsended
6-30-17(unaudited)
Year ended12-31-16
From operationsNet investment income (loss) ($431,089) $1,094,275 ($1,359,202) $3,255,041 ($184,996) $11,502,978Net realized gain (loss) 11,440,737 26,621,979 133,739,298 147,135,836 105,716,183 183,112,084Change in net unrealized appreciation (depreciation) 26,172,860 (27,635,668) (8,903,381) (75,699,108) (7,039,917) (83,814,424)Increase (decrease) in net assets resulting from
operations 37,182,508 80,586 123,476,715 74,691,769 98,491,270 110,800,638Distributions to shareholdersFrom net investment income
Series I — (73,208) — (410,212) — (2,573,946)Series II — (742,996) — (2,106,901) — (5,790,353)Series III — (278,000) — (737,748) — (3,139,651)
From net realized gainSeries I — (1,446,652) — (31,586,550) — (59,907,797)Series II — (22,651,078) — (199,971,990) — (149,767,021)Series III — (4,026,618) — (27,937,823) — (54,483,092)
Total distributions — (29,218,552) — (262,751,224) — (275,661,860)From portfolio share transactions
Portfolio share transactions (17,532,266) 1,881,095 (80,649,935) 143,509,709 (80,646,780) 127,382,300Total from portfolio share transactions (17,532,266) 1,881,095 (80,649,935) 143,509,709 (80,646,780) 127,382,300Total increase (decrease) 19,650,242 (27,256,871) 42,826,780 (44,549,746) 17,844,490 (37,478,922)
Net assets
Beginning of period 209,255,902 236,512,773 860,447,369 904,997,115 1,049,929,574 1,087,408,496End of period $228,906,144 $209,255,902 $903,274,149 $860,447,369 $1,067,774,064 $1,049,929,574
Undistributed net investment income (loss) ($430,938) $151 ($1,359,022) $180 ($183,995) $1,001
John Hancock Variable Insurance TrustStatements of changes in net assets
76The accompanying notes are an integral part of the financial statements.
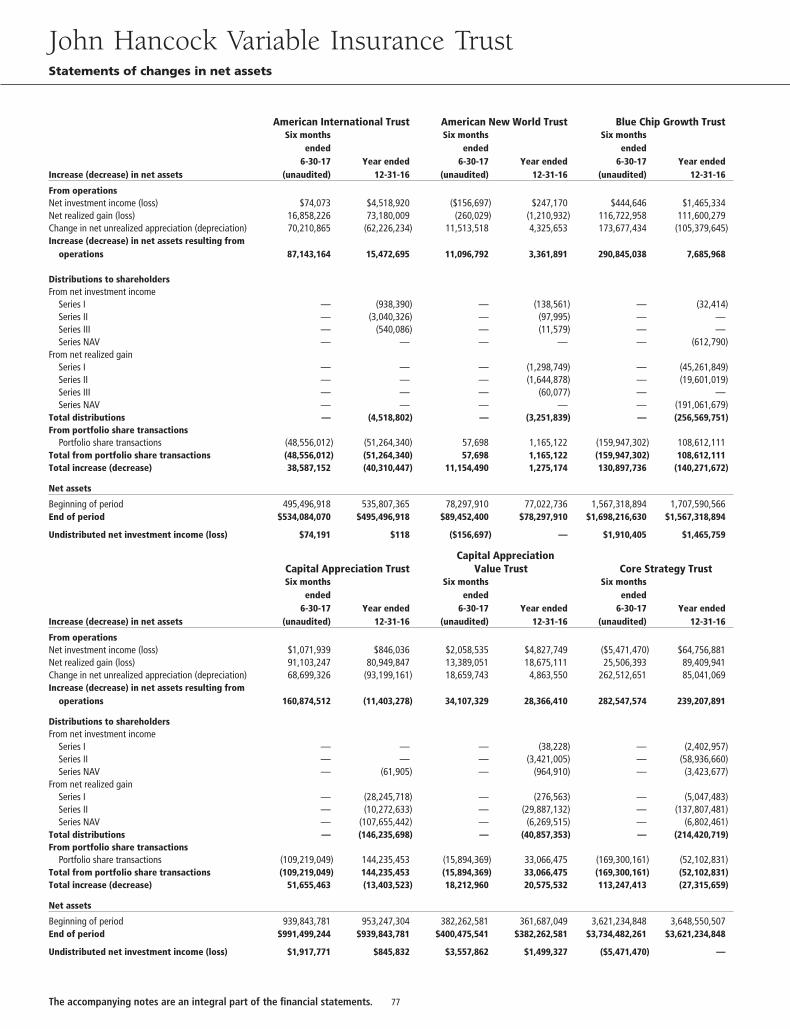
American International Trust American New World Trust Blue Chip Growth Trust
Increase (decrease) in net assets
Six monthsended
6-30-17(unaudited)
Year ended12-31-16
Six monthsended
6-30-17(unaudited)
Year ended12-31-16
Six monthsended
6-30-17(unaudited)
Year ended12-31-16
From operationsNet investment income (loss) $74,073 $4,518,920 ($156,697) $247,170 $444,646 $1,465,334Net realized gain (loss) 16,858,226 73,180,009 (260,029) (1,210,932) 116,722,958 111,600,279Change in net unrealized appreciation (depreciation) 70,210,865 (62,226,234) 11,513,518 4,325,653 173,677,434 (105,379,645)Increase (decrease) in net assets resulting from
operations 87,143,164 15,472,695 11,096,792 3,361,891 290,845,038 7,685,968
Distributions to shareholdersFrom net investment income
Series I — (938,390) — (138,561) — (32,414)Series II — (3,040,326) — (97,995) — —Series III — (540,086) — (11,579) — —Series NAV — — — — — (612,790)
From net realized gainSeries I — — — (1,298,749) — (45,261,849)Series II — — — (1,644,878) — (19,601,019)Series III — — — (60,077) — —Series NAV — — — — — (191,061,679)
Total distributions — (4,518,802) — (3,251,839) — (256,569,751)From portfolio share transactions
Portfolio share transactions (48,556,012) (51,264,340) 57,698 1,165,122 (159,947,302) 108,612,111Total from portfolio share transactions (48,556,012) (51,264,340) 57,698 1,165,122 (159,947,302) 108,612,111Total increase (decrease) 38,587,152 (40,310,447) 11,154,490 1,275,174 130,897,736 (140,271,672)
Net assets
Beginning of period 495,496,918 535,807,365 78,297,910 77,022,736 1,567,318,894 1,707,590,566End of period $534,084,070 $495,496,918 $89,452,400 $78,297,910 $1,698,216,630 $1,567,318,894
Undistributed net investment income (loss) $74,191 $118 ($156,697) — $1,910,405 $1,465,759
Capital Appreciation TrustCapital Appreciation
Value Trust Core Strategy Trust
Increase (decrease) in net assets
Six monthsended
6-30-17(unaudited)
Year ended12-31-16
Six monthsended
6-30-17(unaudited)
Year ended12-31-16
Six monthsended
6-30-17(unaudited)
Year ended12-31-16
From operationsNet investment income (loss) $1,071,939 $846,036 $2,058,535 $4,827,749 ($5,471,470) $64,756,881Net realized gain (loss) 91,103,247 80,949,847 13,389,051 18,675,111 25,506,393 89,409,941Change in net unrealized appreciation (depreciation) 68,699,326 (93,199,161) 18,659,743 4,863,550 262,512,651 85,041,069Increase (decrease) in net assets resulting from
operations 160,874,512 (11,403,278) 34,107,329 28,366,410 282,547,574 239,207,891
Distributions to shareholdersFrom net investment income
Series I — — — (38,228) — (2,402,957)Series II — — — (3,421,005) — (58,936,660)Series NAV — (61,905) — (964,910) — (3,423,677)
From net realized gainSeries I — (28,245,718) — (276,563) — (5,047,483)Series II — (10,272,633) — (29,887,132) — (137,807,481)Series NAV — (107,655,442) — (6,269,515) — (6,802,461)
Total distributions — (146,235,698) — (40,857,353) — (214,420,719)From portfolio share transactions
Portfolio share transactions (109,219,049) 144,235,453 (15,894,369) 33,066,475 (169,300,161) (52,102,831)Total from portfolio share transactions (109,219,049) 144,235,453 (15,894,369) 33,066,475 (169,300,161) (52,102,831)Total increase (decrease) 51,655,463 (13,403,523) 18,212,960 20,575,532 113,247,413 (27,315,659)
Net assets
Beginning of period 939,843,781 953,247,304 382,262,581 361,687,049 3,621,234,848 3,648,550,507End of period $991,499,244 $939,843,781 $400,475,541 $382,262,581 $3,734,482,261 $3,621,234,848
Undistributed net investment income (loss) $1,917,771 $845,832 $3,557,862 $1,499,327 ($5,471,470) —
John Hancock Variable Insurance TrustStatements of changes in net assets
77The accompanying notes are an integral part of the financial statements.
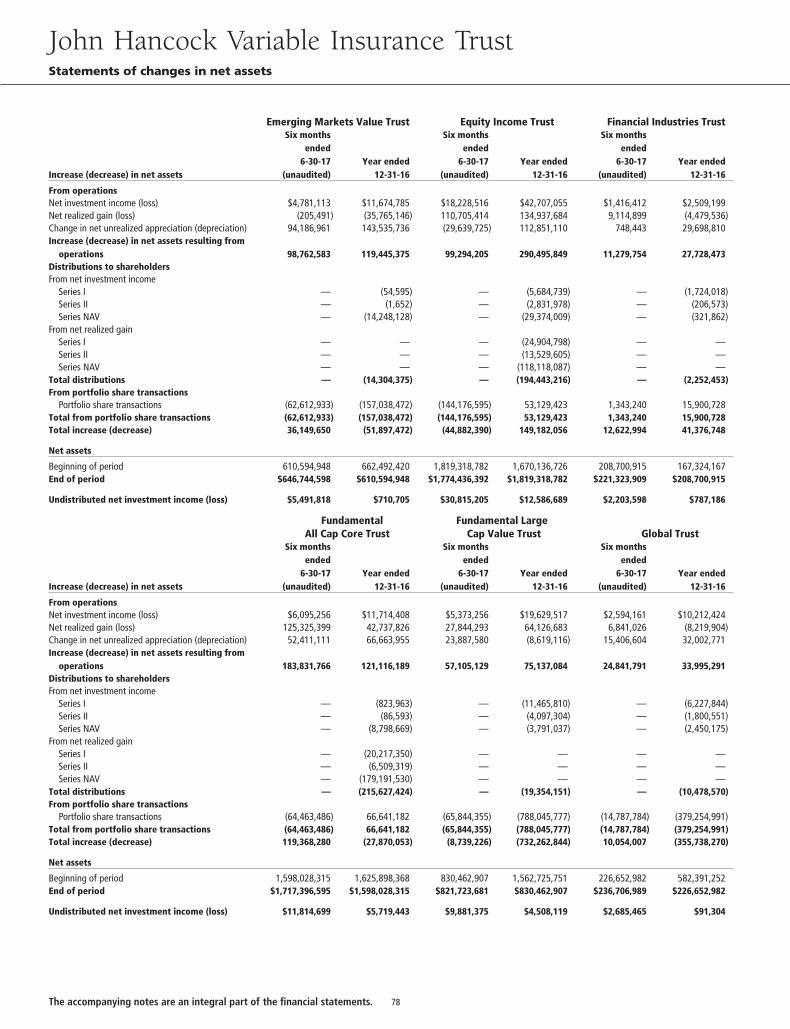
Emerging Markets Value Trust Equity Income Trust Financial Industries Trust
Increase (decrease) in net assets
Six monthsended
6-30-17(unaudited)
Year ended12-31-16
Six monthsended
6-30-17(unaudited)
Year ended12-31-16
Six monthsended
6-30-17(unaudited)
Year ended12-31-16
From operationsNet investment income (loss) $4,781,113 $11,674,785 $18,228,516 $42,707,055 $1,416,412 $2,509,199Net realized gain (loss) (205,491) (35,765,146) 110,705,414 134,937,684 9,114,899 (4,479,536)Change in net unrealized appreciation (depreciation) 94,186,961 143,535,736 (29,639,725) 112,851,110 748,443 29,698,810Increase (decrease) in net assets resulting from
operations 98,762,583 119,445,375 99,294,205 290,495,849 11,279,754 27,728,473Distributions to shareholdersFrom net investment income
Series I — (54,595) — (5,684,739) — (1,724,018)Series II — (1,652) — (2,831,978) — (206,573)Series NAV — (14,248,128) — (29,374,009) — (321,862)
From net realized gainSeries I — — — (24,904,798) — —Series II — — — (13,529,605) — —Series NAV — — — (118,118,087) — —
Total distributions — (14,304,375) — (194,443,216) — (2,252,453)From portfolio share transactions
Portfolio share transactions (62,612,933) (157,038,472) (144,176,595) 53,129,423 1,343,240 15,900,728Total from portfolio share transactions (62,612,933) (157,038,472) (144,176,595) 53,129,423 1,343,240 15,900,728Total increase (decrease) 36,149,650 (51,897,472) (44,882,390) 149,182,056 12,622,994 41,376,748
Net assets
Beginning of period 610,594,948 662,492,420 1,819,318,782 1,670,136,726 208,700,915 167,324,167End of period $646,744,598 $610,594,948 $1,774,436,392 $1,819,318,782 $221,323,909 $208,700,915
Undistributed net investment income (loss) $5,491,818 $710,705 $30,815,205 $12,586,689 $2,203,598 $787,186
FundamentalAll Cap Core Trust
Fundamental LargeCap Value Trust Global Trust
Increase (decrease) in net assets
Six monthsended
6-30-17(unaudited)
Year ended12-31-16
Six monthsended
6-30-17(unaudited)
Year ended12-31-16
Six monthsended
6-30-17(unaudited)
Year ended12-31-16
From operationsNet investment income (loss) $6,095,256 $11,714,408 $5,373,256 $19,629,517 $2,594,161 $10,212,424Net realized gain (loss) 125,325,399 42,737,826 27,844,293 64,126,683 6,841,026 (8,219,904)Change in net unrealized appreciation (depreciation) 52,411,111 66,663,955 23,887,580 (8,619,116) 15,406,604 32,002,771Increase (decrease) in net assets resulting from
operations 183,831,766 121,116,189 57,105,129 75,137,084 24,841,791 33,995,291Distributions to shareholdersFrom net investment income
Series I — (823,963) — (11,465,810) — (6,227,844)Series II — (86,593) — (4,097,304) — (1,800,551)Series NAV — (8,798,669) — (3,791,037) — (2,450,175)
From net realized gainSeries I — (20,217,350) — — — —Series II — (6,509,319) — — — —Series NAV — (179,191,530) — — — —
Total distributions — (215,627,424) — (19,354,151) — (10,478,570)From portfolio share transactions
Portfolio share transactions (64,463,486) 66,641,182 (65,844,355) (788,045,777) (14,787,784) (379,254,991)Total from portfolio share transactions (64,463,486) 66,641,182 (65,844,355) (788,045,777) (14,787,784) (379,254,991)Total increase (decrease) 119,368,280 (27,870,053) (8,739,226) (732,262,844) 10,054,007 (355,738,270)
Net assets
Beginning of period 1,598,028,315 1,625,898,368 830,462,907 1,562,725,751 226,652,982 582,391,252End of period $1,717,396,595 $1,598,028,315 $821,723,681 $830,462,907 $236,706,989 $226,652,982
Undistributed net investment income (loss) $11,814,699 $5,719,443 $9,881,375 $4,508,119 $2,685,465 $91,304
John Hancock Variable Insurance TrustStatements of changes in net assets
78The accompanying notes are an integral part of the financial statements.
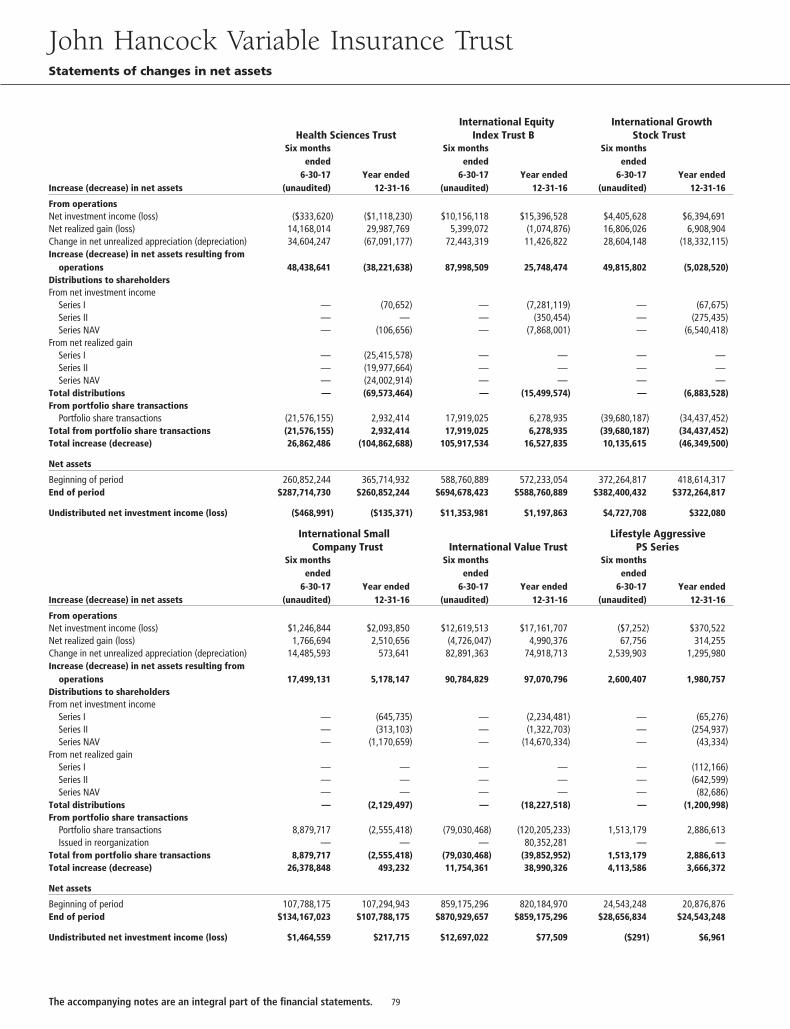
Health Sciences TrustInternational Equity
Index Trust BInternational Growth
Stock Trust
Increase (decrease) in net assets
Six monthsended
6-30-17(unaudited)
Year ended12-31-16
Six monthsended
6-30-17(unaudited)
Year ended12-31-16
Six monthsended
6-30-17(unaudited)
Year ended12-31-16
From operationsNet investment income (loss) ($333,620) ($1,118,230) $10,156,118 $15,396,528 $4,405,628 $6,394,691Net realized gain (loss) 14,168,014 29,987,769 5,399,072 (1,074,876) 16,806,026 6,908,904Change in net unrealized appreciation (depreciation) 34,604,247 (67,091,177) 72,443,319 11,426,822 28,604,148 (18,332,115)Increase (decrease) in net assets resulting from
operations 48,438,641 (38,221,638) 87,998,509 25,748,474 49,815,802 (5,028,520)Distributions to shareholdersFrom net investment income
Series I — (70,652) — (7,281,119) — (67,675)Series II — — — (350,454) — (275,435)Series NAV — (106,656) — (7,868,001) — (6,540,418)
From net realized gainSeries I — (25,415,578) — — — —Series II — (19,977,664) — — — —Series NAV — (24,002,914) — — — —
Total distributions — (69,573,464) — (15,499,574) — (6,883,528)From portfolio share transactions
Portfolio share transactions (21,576,155) 2,932,414 17,919,025 6,278,935 (39,680,187) (34,437,452)Total from portfolio share transactions (21,576,155) 2,932,414 17,919,025 6,278,935 (39,680,187) (34,437,452)Total increase (decrease) 26,862,486 (104,862,688) 105,917,534 16,527,835 10,135,615 (46,349,500)
Net assets
Beginning of period 260,852,244 365,714,932 588,760,889 572,233,054 372,264,817 418,614,317End of period $287,714,730 $260,852,244 $694,678,423 $588,760,889 $382,400,432 $372,264,817
Undistributed net investment income (loss) ($468,991) ($135,371) $11,353,981 $1,197,863 $4,727,708 $322,080
International SmallCompany Trust International Value Trust
Lifestyle AggressivePS Series
Increase (decrease) in net assets
Six monthsended
6-30-17(unaudited)
Year ended12-31-16
Six monthsended
6-30-17(unaudited)
Year ended12-31-16
Six monthsended
6-30-17(unaudited)
Year ended12-31-16
From operationsNet investment income (loss) $1,246,844 $2,093,850 $12,619,513 $17,161,707 ($7,252) $370,522Net realized gain (loss) 1,766,694 2,510,656 (4,726,047) 4,990,376 67,756 314,255Change in net unrealized appreciation (depreciation) 14,485,593 573,641 82,891,363 74,918,713 2,539,903 1,295,980Increase (decrease) in net assets resulting from
operations 17,499,131 5,178,147 90,784,829 97,070,796 2,600,407 1,980,757Distributions to shareholdersFrom net investment income
Series I — (645,735) — (2,234,481) — (65,276)Series II — (313,103) — (1,322,703) — (254,937)Series NAV — (1,170,659) — (14,670,334) — (43,334)
From net realized gainSeries I — — — — — (112,166)Series II — — — — — (642,599)Series NAV — — — — — (82,686)
Total distributions — (2,129,497) — (18,227,518) — (1,200,998)From portfolio share transactions
Portfolio share transactions 8,879,717 (2,555,418) (79,030,468) (120,205,233) 1,513,179 2,886,613Issued in reorganization — — — 80,352,281 — —
Total from portfolio share transactions 8,879,717 (2,555,418) (79,030,468) (39,852,952) 1,513,179 2,886,613Total increase (decrease) 26,378,848 493,232 11,754,361 38,990,326 4,113,586 3,666,372
Net assets
Beginning of period 107,788,175 107,294,943 859,175,296 820,184,970 24,543,248 20,876,876End of period $134,167,023 $107,788,175 $870,929,657 $859,175,296 $28,656,834 $24,543,248
Undistributed net investment income (loss) $1,464,559 $217,715 $12,697,022 $77,509 ($291) $6,961
John Hancock Variable Insurance TrustStatements of changes in net assets
79The accompanying notes are an integral part of the financial statements.
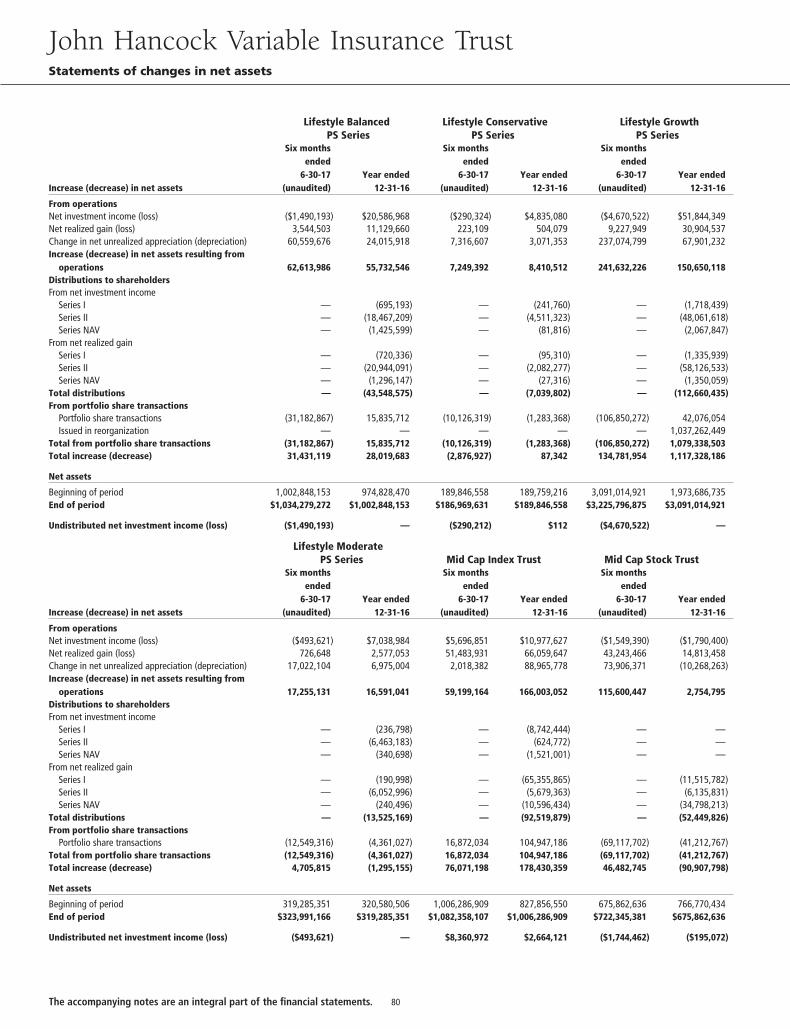
Lifestyle BalancedPS Series
Lifestyle ConservativePS Series
Lifestyle GrowthPS Series
Increase (decrease) in net assets
Six monthsended
6-30-17(unaudited)
Year ended12-31-16
Six monthsended
6-30-17(unaudited)
Year ended12-31-16
Six monthsended
6-30-17(unaudited)
Year ended12-31-16
From operationsNet investment income (loss) ($1,490,193) $20,586,968 ($290,324) $4,835,080 ($4,670,522) $51,844,349Net realized gain (loss) 3,544,503 11,129,660 223,109 504,079 9,227,949 30,904,537Change in net unrealized appreciation (depreciation) 60,559,676 24,015,918 7,316,607 3,071,353 237,074,799 67,901,232Increase (decrease) in net assets resulting from
operations 62,613,986 55,732,546 7,249,392 8,410,512 241,632,226 150,650,118Distributions to shareholdersFrom net investment income
Series I — (695,193) — (241,760) — (1,718,439)Series II — (18,467,209) — (4,511,323) — (48,061,618)Series NAV — (1,425,599) — (81,816) — (2,067,847)
From net realized gainSeries I — (720,336) — (95,310) — (1,335,939)Series II — (20,944,091) — (2,082,277) — (58,126,533)Series NAV — (1,296,147) — (27,316) — (1,350,059)
Total distributions — (43,548,575) — (7,039,802) — (112,660,435)From portfolio share transactions
Portfolio share transactions (31,182,867) 15,835,712 (10,126,319) (1,283,368) (106,850,272) 42,076,054Issued in reorganization — — — — — 1,037,262,449
Total from portfolio share transactions (31,182,867) 15,835,712 (10,126,319) (1,283,368) (106,850,272) 1,079,338,503Total increase (decrease) 31,431,119 28,019,683 (2,876,927) 87,342 134,781,954 1,117,328,186
Net assets
Beginning of period 1,002,848,153 974,828,470 189,846,558 189,759,216 3,091,014,921 1,973,686,735End of period $1,034,279,272 $1,002,848,153 $186,969,631 $189,846,558 $3,225,796,875 $3,091,014,921
Undistributed net investment income (loss) ($1,490,193) — ($290,212) $112 ($4,670,522) —
Lifestyle ModeratePS Series Mid Cap Index Trust Mid Cap Stock Trust
Increase (decrease) in net assets
Six monthsended
6-30-17(unaudited)
Year ended12-31-16
Six monthsended
6-30-17(unaudited)
Year ended12-31-16
Six monthsended
6-30-17(unaudited)
Year ended12-31-16
From operationsNet investment income (loss) ($493,621) $7,038,984 $5,696,851 $10,977,627 ($1,549,390) ($1,790,400)Net realized gain (loss) 726,648 2,577,053 51,483,931 66,059,647 43,243,466 14,813,458Change in net unrealized appreciation (depreciation) 17,022,104 6,975,004 2,018,382 88,965,778 73,906,371 (10,268,263)Increase (decrease) in net assets resulting from
operations 17,255,131 16,591,041 59,199,164 166,003,052 115,600,447 2,754,795Distributions to shareholdersFrom net investment income
Series I — (236,798) — (8,742,444) — —Series II — (6,463,183) — (624,772) — —Series NAV — (340,698) — (1,521,001) — —
From net realized gainSeries I — (190,998) — (65,355,865) — (11,515,782)Series II — (6,052,996) — (5,679,363) — (6,135,831)Series NAV — (240,496) — (10,596,434) — (34,798,213)
Total distributions — (13,525,169) — (92,519,879) — (52,449,826)From portfolio share transactions
Portfolio share transactions (12,549,316) (4,361,027) 16,872,034 104,947,186 (69,117,702) (41,212,767)Total from portfolio share transactions (12,549,316) (4,361,027) 16,872,034 104,947,186 (69,117,702) (41,212,767)Total increase (decrease) 4,705,815 (1,295,155) 76,071,198 178,430,359 46,482,745 (90,907,798)
Net assets
Beginning of period 319,285,351 320,580,506 1,006,286,909 827,856,550 675,862,636 766,770,434End of period $323,991,166 $319,285,351 $1,082,358,107 $1,006,286,909 $722,345,381 $675,862,636
Undistributed net investment income (loss) ($493,621) — $8,360,972 $2,664,121 ($1,744,462) ($195,072)
John Hancock Variable Insurance TrustStatements of changes in net assets
80The accompanying notes are an integral part of the financial statements.
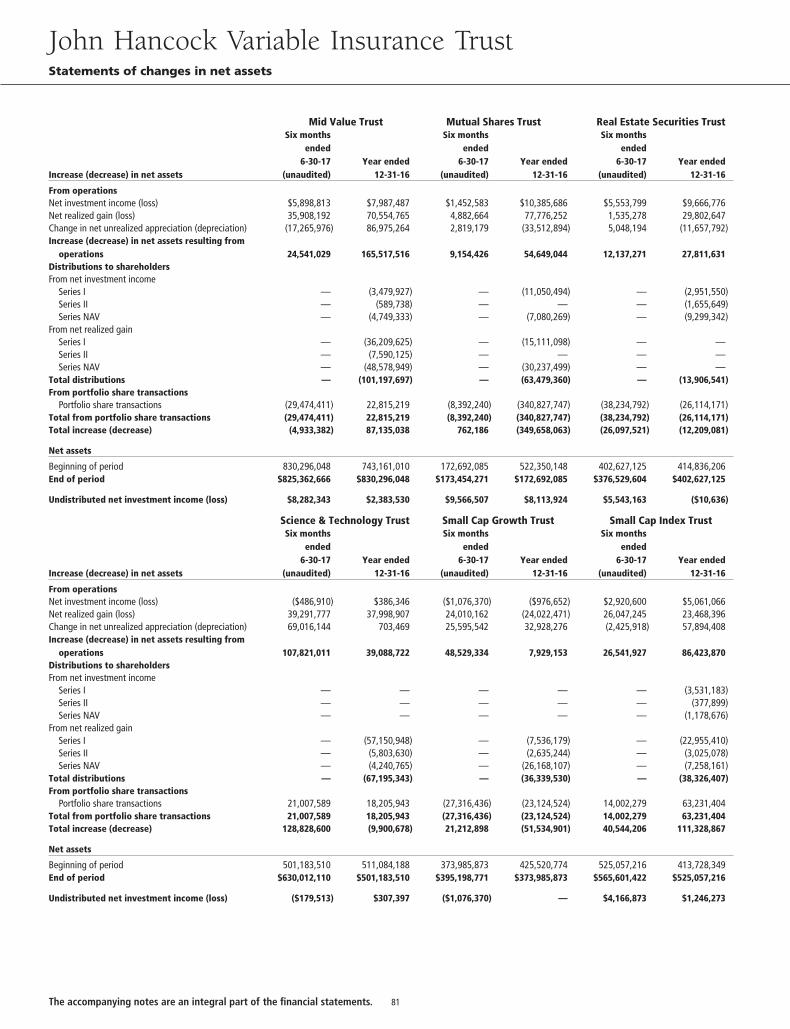
Mid Value Trust Mutual Shares Trust Real Estate Securities Trust
Increase (decrease) in net assets
Six monthsended
6-30-17(unaudited)
Year ended12-31-16
Six monthsended
6-30-17(unaudited)
Year ended12-31-16
Six monthsended
6-30-17(unaudited)
Year ended12-31-16
From operationsNet investment income (loss) $5,898,813 $7,987,487 $1,452,583 $10,385,686 $5,553,799 $9,666,776Net realized gain (loss) 35,908,192 70,554,765 4,882,664 77,776,252 1,535,278 29,802,647Change in net unrealized appreciation (depreciation) (17,265,976) 86,975,264 2,819,179 (33,512,894) 5,048,194 (11,657,792)Increase (decrease) in net assets resulting from
operations 24,541,029 165,517,516 9,154,426 54,649,044 12,137,271 27,811,631Distributions to shareholdersFrom net investment income
Series I — (3,479,927) — (11,050,494) — (2,951,550)Series II — (589,738) — — — (1,655,649)Series NAV — (4,749,333) — (7,080,269) — (9,299,342)
From net realized gainSeries I — (36,209,625) — (15,111,098) — —Series II — (7,590,125) — — — —Series NAV — (48,578,949) — (30,237,499) — —
Total distributions — (101,197,697) — (63,479,360) — (13,906,541)From portfolio share transactions
Portfolio share transactions (29,474,411) 22,815,219 (8,392,240) (340,827,747) (38,234,792) (26,114,171)Total from portfolio share transactions (29,474,411) 22,815,219 (8,392,240) (340,827,747) (38,234,792) (26,114,171)Total increase (decrease) (4,933,382) 87,135,038 762,186 (349,658,063) (26,097,521) (12,209,081)
Net assets
Beginning of period 830,296,048 743,161,010 172,692,085 522,350,148 402,627,125 414,836,206End of period $825,362,666 $830,296,048 $173,454,271 $172,692,085 $376,529,604 $402,627,125
Undistributed net investment income (loss) $8,282,343 $2,383,530 $9,566,507 $8,113,924 $5,543,163 ($10,636)
Science & Technology Trust Small Cap Growth Trust Small Cap Index Trust
Increase (decrease) in net assets
Six monthsended
6-30-17(unaudited)
Year ended12-31-16
Six monthsended
6-30-17(unaudited)
Year ended12-31-16
Six monthsended
6-30-17(unaudited)
Year ended12-31-16
From operationsNet investment income (loss) ($486,910) $386,346 ($1,076,370) ($976,652) $2,920,600 $5,061,066Net realized gain (loss) 39,291,777 37,998,907 24,010,162 (24,022,471) 26,047,245 23,468,396Change in net unrealized appreciation (depreciation) 69,016,144 703,469 25,595,542 32,928,276 (2,425,918) 57,894,408Increase (decrease) in net assets resulting from
operations 107,821,011 39,088,722 48,529,334 7,929,153 26,541,927 86,423,870Distributions to shareholdersFrom net investment income
Series I — — — — — (3,531,183)Series II — — — — — (377,899)Series NAV — — — — — (1,178,676)
From net realized gainSeries I — (57,150,948) — (7,536,179) — (22,955,410)Series II — (5,803,630) — (2,635,244) — (3,025,078)Series NAV — (4,240,765) — (26,168,107) — (7,258,161)
Total distributions — (67,195,343) — (36,339,530) — (38,326,407)From portfolio share transactions
Portfolio share transactions 21,007,589 18,205,943 (27,316,436) (23,124,524) 14,002,279 63,231,404Total from portfolio share transactions 21,007,589 18,205,943 (27,316,436) (23,124,524) 14,002,279 63,231,404Total increase (decrease) 128,828,600 (9,900,678) 21,212,898 (51,534,901) 40,544,206 111,328,867
Net assets
Beginning of period 501,183,510 511,084,188 373,985,873 425,520,774 525,057,216 413,728,349End of period $630,012,110 $501,183,510 $395,198,771 $373,985,873 $565,601,422 $525,057,216
Undistributed net investment income (loss) ($179,513) $307,397 ($1,076,370) — $4,166,873 $1,246,273
John Hancock Variable Insurance TrustStatements of changes in net assets
81The accompanying notes are an integral part of the financial statements.
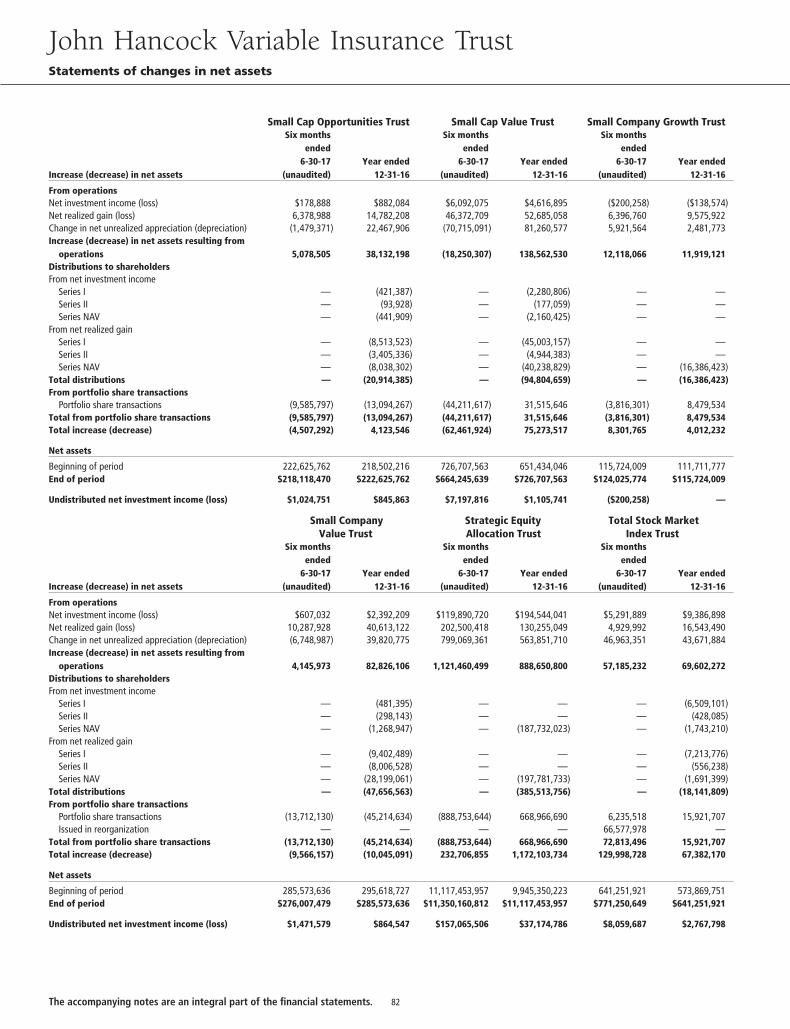
Small Cap Opportunities Trust Small Cap Value Trust Small Company Growth Trust
Increase (decrease) in net assets
Six monthsended
6-30-17(unaudited)
Year ended12-31-16
Six monthsended
6-30-17(unaudited)
Year ended12-31-16
Six monthsended
6-30-17(unaudited)
Year ended12-31-16
From operationsNet investment income (loss) $178,888 $882,084 $6,092,075 $4,616,895 ($200,258) ($138,574)Net realized gain (loss) 6,378,988 14,782,208 46,372,709 52,685,058 6,396,760 9,575,922Change in net unrealized appreciation (depreciation) (1,479,371) 22,467,906 (70,715,091) 81,260,577 5,921,564 2,481,773Increase (decrease) in net assets resulting from
operations 5,078,505 38,132,198 (18,250,307) 138,562,530 12,118,066 11,919,121Distributions to shareholdersFrom net investment income
Series I — (421,387) — (2,280,806) — —Series II — (93,928) — (177,059) — —Series NAV — (441,909) — (2,160,425) — —
From net realized gainSeries I — (8,513,523) — (45,003,157) — —Series II — (3,405,336) — (4,944,383) — —Series NAV — (8,038,302) — (40,238,829) — (16,386,423)
Total distributions — (20,914,385) — (94,804,659) — (16,386,423)From portfolio share transactions
Portfolio share transactions (9,585,797) (13,094,267) (44,211,617) 31,515,646 (3,816,301) 8,479,534Total from portfolio share transactions (9,585,797) (13,094,267) (44,211,617) 31,515,646 (3,816,301) 8,479,534Total increase (decrease) (4,507,292) 4,123,546 (62,461,924) 75,273,517 8,301,765 4,012,232
Net assets
Beginning of period 222,625,762 218,502,216 726,707,563 651,434,046 115,724,009 111,711,777End of period $218,118,470 $222,625,762 $664,245,639 $726,707,563 $124,025,774 $115,724,009
Undistributed net investment income (loss) $1,024,751 $845,863 $7,197,816 $1,105,741 ($200,258) —
Small CompanyValue Trust
Strategic EquityAllocation Trust
Total Stock MarketIndex Trust
Increase (decrease) in net assets
Six monthsended
6-30-17(unaudited)
Year ended12-31-16
Six monthsended
6-30-17(unaudited)
Year ended12-31-16
Six monthsended
6-30-17(unaudited)
Year ended12-31-16
From operationsNet investment income (loss) $607,032 $2,392,209 $119,890,720 $194,544,041 $5,291,889 $9,386,898Net realized gain (loss) 10,287,928 40,613,122 202,500,418 130,255,049 4,929,992 16,543,490Change in net unrealized appreciation (depreciation) (6,748,987) 39,820,775 799,069,361 563,851,710 46,963,351 43,671,884Increase (decrease) in net assets resulting from
operations 4,145,973 82,826,106 1,121,460,499 888,650,800 57,185,232 69,602,272Distributions to shareholdersFrom net investment income
Series I — (481,395) — — — (6,509,101)Series II — (298,143) — — — (428,085)Series NAV — (1,268,947) — (187,732,023) — (1,743,210)
From net realized gainSeries I — (9,402,489) — — — (7,213,776)Series II — (8,006,528) — — — (556,238)Series NAV — (28,199,061) — (197,781,733) — (1,691,399)
Total distributions — (47,656,563) — (385,513,756) — (18,141,809)From portfolio share transactions
Portfolio share transactions (13,712,130) (45,214,634) (888,753,644) 668,966,690 6,235,518 15,921,707Issued in reorganization — — — — 66,577,978 —
Total from portfolio share transactions (13,712,130) (45,214,634) (888,753,644) 668,966,690 72,813,496 15,921,707Total increase (decrease) (9,566,157) (10,045,091) 232,706,855 1,172,103,734 129,998,728 67,382,170
Net assets
Beginning of period 285,573,636 295,618,727 11,117,453,957 9,945,350,223 641,251,921 573,869,751End of period $276,007,479 $285,573,636 $11,350,160,812 $11,117,453,957 $771,250,649 $641,251,921
Undistributed net investment income (loss) $1,471,579 $864,547 $157,065,506 $37,174,786 $8,059,687 $2,767,798
John Hancock Variable Insurance TrustStatements of changes in net assets
82The accompanying notes are an integral part of the financial statements.
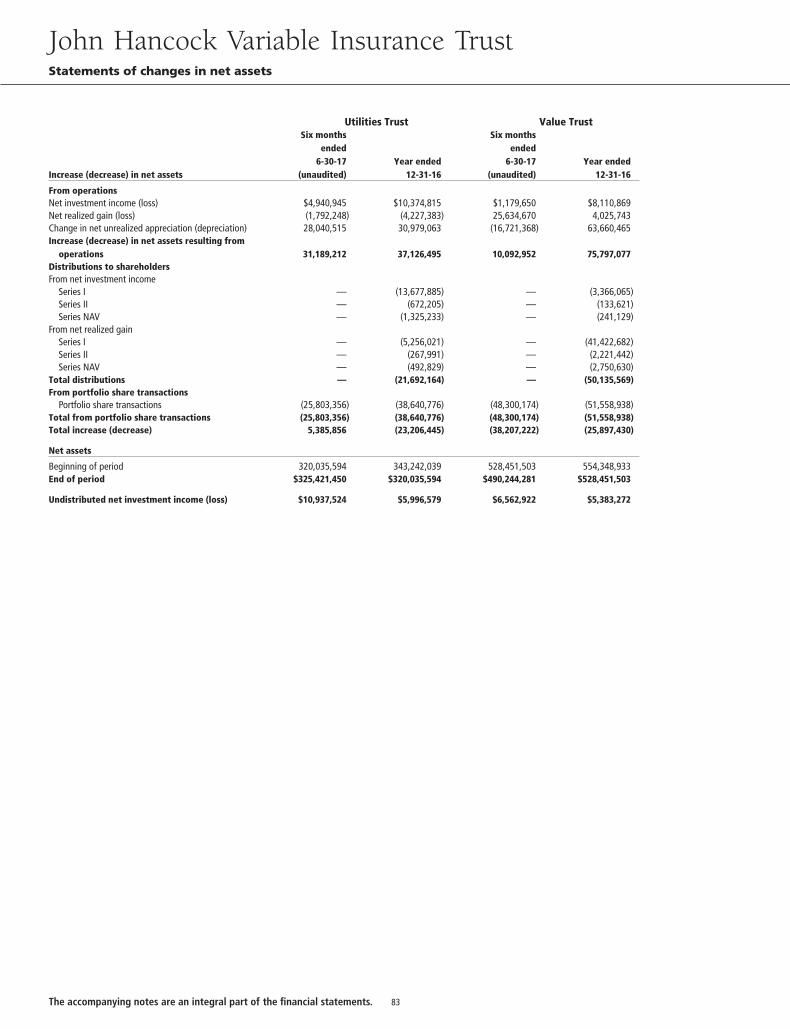
Utilities Trust Value Trust
Increase (decrease) in net assets
Six monthsended
6-30-17(unaudited)
Year ended12-31-16
Six monthsended
6-30-17(unaudited)
Year ended12-31-16
From operationsNet investment income (loss) $4,940,945 $10,374,815 $1,179,650 $8,110,869Net realized gain (loss) (1,792,248) (4,227,383) 25,634,670 4,025,743Change in net unrealized appreciation (depreciation) 28,040,515 30,979,063 (16,721,368) 63,660,465Increase (decrease) in net assets resulting from
operations 31,189,212 37,126,495 10,092,952 75,797,077Distributions to shareholdersFrom net investment income
Series I — (13,677,885) — (3,366,065)Series II — (672,205) — (133,621)Series NAV — (1,325,233) — (241,129)
From net realized gainSeries I — (5,256,021) — (41,422,682)Series II — (267,991) — (2,221,442)Series NAV — (492,829) — (2,750,630)
Total distributions — (21,692,164) — (50,135,569)From portfolio share transactions
Portfolio share transactions (25,803,356) (38,640,776) (48,300,174) (51,558,938)Total from portfolio share transactions (25,803,356) (38,640,776) (48,300,174) (51,558,938)Total increase (decrease) 5,385,856 (23,206,445) (38,207,222) (25,897,430)
Net assets
Beginning of period 320,035,594 343,242,039 528,451,503 554,348,933End of period $325,421,450 $320,035,594 $490,244,281 $528,451,503
Undistributed net investment income (loss) $10,937,524 $5,996,579 $6,562,922 $5,383,272
John Hancock Variable Insurance TrustStatements of changes in net assets
83The accompanying notes are an integral part of the financial statements.
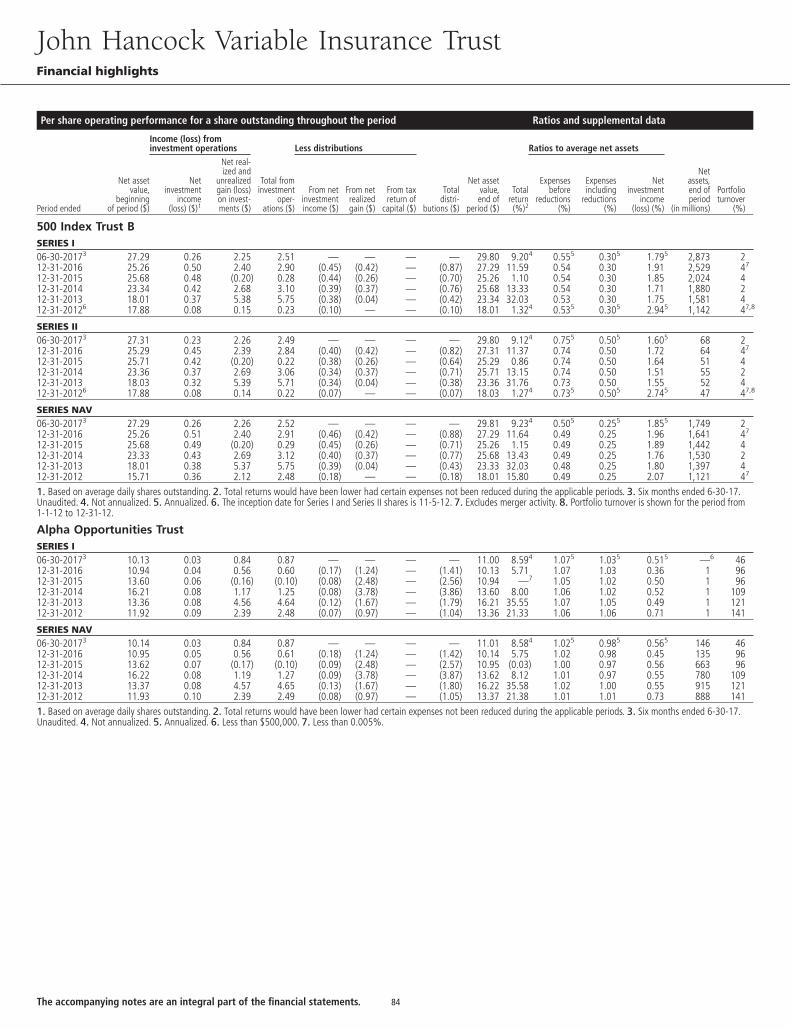
Per share operating performance for a share outstanding throughout the period Ratios and supplemental data
Income (loss) frominvestment operations Less distributions Ratios to average net assets
Period ended
Net assetvalue,
beginningof period ($)
Netinvestment
income(loss) ($)1
Net real-ized and
unrealizedgain (loss)on invest-ments ($)
Total frominvestment
oper-ations ($)
From netinvestmentincome ($)
From netrealizedgain ($)
From taxreturn of
capital ($)
Totaldistri-
butions ($)
Net assetvalue,end of
period ($)
Totalreturn(%)2
Expensesbefore
reductions(%)
Expensesincluding
reductions(%)
Netinvestment
income(loss) (%)
Netassets,end ofperiod
(in millions)
Portfolioturnover
(%)
500 Index Trust BSERIES I06-30-20173 27.29 0.26 2.25 2.51 — — — — 29.80 9.204 0.555 0.305 1.795 2,873 212-31-2016 25.26 0.50 2.40 2.90 (0.45) (0.42) — (0.87) 27.29 11.59 0.54 0.30 1.91 2,529 47
12-31-2015 25.68 0.48 (0.20) 0.28 (0.44) (0.26) — (0.70) 25.26 1.10 0.54 0.30 1.85 2,024 412-31-2014 23.34 0.42 2.68 3.10 (0.39) (0.37) — (0.76) 25.68 13.33 0.54 0.30 1.71 1,880 212-31-2013 18.01 0.37 5.38 5.75 (0.38) (0.04) — (0.42) 23.34 32.03 0.53 0.30 1.75 1,581 412-31-20126 17.88 0.08 0.15 0.23 (0.10) — — (0.10) 18.01 1.324 0.535 0.305 2.945 1,142 47,8
SERIES II06-30-20173 27.31 0.23 2.26 2.49 — — — — 29.80 9.124 0.755 0.505 1.605 68 212-31-2016 25.29 0.45 2.39 2.84 (0.40) (0.42) — (0.82) 27.31 11.37 0.74 0.50 1.72 64 47
12-31-2015 25.71 0.42 (0.20) 0.22 (0.38) (0.26) — (0.64) 25.29 0.86 0.74 0.50 1.64 51 412-31-2014 23.36 0.37 2.69 3.06 (0.34) (0.37) — (0.71) 25.71 13.15 0.74 0.50 1.51 55 212-31-2013 18.03 0.32 5.39 5.71 (0.34) (0.04) — (0.38) 23.36 31.76 0.73 0.50 1.55 52 412-31-20126 17.88 0.08 0.14 0.22 (0.07) — — (0.07) 18.03 1.274 0.735 0.505 2.745 47 47,8
SERIES NAV06-30-20173 27.29 0.26 2.26 2.52 — — — — 29.81 9.234 0.505 0.255 1.855 1,749 212-31-2016 25.26 0.51 2.40 2.91 (0.46) (0.42) — (0.88) 27.29 11.64 0.49 0.25 1.96 1,641 47
12-31-2015 25.68 0.49 (0.20) 0.29 (0.45) (0.26) — (0.71) 25.26 1.15 0.49 0.25 1.89 1,442 412-31-2014 23.33 0.43 2.69 3.12 (0.40) (0.37) — (0.77) 25.68 13.43 0.49 0.25 1.76 1,530 212-31-2013 18.01 0.38 5.37 5.75 (0.39) (0.04) — (0.43) 23.33 32.03 0.48 0.25 1.80 1,397 412-31-2012 15.71 0.36 2.12 2.48 (0.18) — — (0.18) 18.01 15.80 0.49 0.25 2.07 1,121 47
1. Based on average daily shares outstanding. 2. Total returns would have been lower had certain expenses not been reduced during the applicable periods. 3. Six months ended 6-30-17.Unaudited. 4. Not annualized. 5. Annualized. 6. The inception date for Series I and Series II shares is 11-5-12. 7. Excludes merger activity. 8. Portfolio turnover is shown for the period from1-1-12 to 12-31-12.
Alpha Opportunities TrustSERIES I06-30-20173 10.13 0.03 0.84 0.87 — — — — 11.00 8.594 1.075 1.035 0.515 —6 4612-31-2016 10.94 0.04 0.56 0.60 (0.17) (1.24) — (1.41) 10.13 5.71 1.07 1.03 0.36 1 9612-31-2015 13.60 0.06 (0.16) (0.10) (0.08) (2.48) — (2.56) 10.94 —7 1.05 1.02 0.50 1 9612-31-2014 16.21 0.08 1.17 1.25 (0.08) (3.78) — (3.86) 13.60 8.00 1.06 1.02 0.52 1 10912-31-2013 13.36 0.08 4.56 4.64 (0.12) (1.67) — (1.79) 16.21 35.55 1.07 1.05 0.49 1 12112-31-2012 11.92 0.09 2.39 2.48 (0.07) (0.97) — (1.04) 13.36 21.33 1.06 1.06 0.71 1 141
SERIES NAV06-30-20173 10.14 0.03 0.84 0.87 — — — — 11.01 8.584 1.025 0.985 0.565 146 4612-31-2016 10.95 0.05 0.56 0.61 (0.18) (1.24) — (1.42) 10.14 5.75 1.02 0.98 0.45 135 9612-31-2015 13.62 0.07 (0.17) (0.10) (0.09) (2.48) — (2.57) 10.95 (0.03) 1.00 0.97 0.56 663 9612-31-2014 16.22 0.08 1.19 1.27 (0.09) (3.78) — (3.87) 13.62 8.12 1.01 0.97 0.55 780 10912-31-2013 13.37 0.08 4.57 4.65 (0.13) (1.67) — (1.80) 16.22 35.58 1.02 1.00 0.55 915 12112-31-2012 11.93 0.10 2.39 2.49 (0.08) (0.97) — (1.05) 13.37 21.38 1.01 1.01 0.73 888 1411. Based on average daily shares outstanding. 2. Total returns would have been lower had certain expenses not been reduced during the applicable periods. 3. Six months ended 6-30-17.Unaudited. 4. Not annualized. 5. Annualized. 6. Less than $500,000. 7. Less than 0.005%.
John Hancock Variable Insurance TrustFinancial highlights
84The accompanying notes are an integral part of the financial statements.
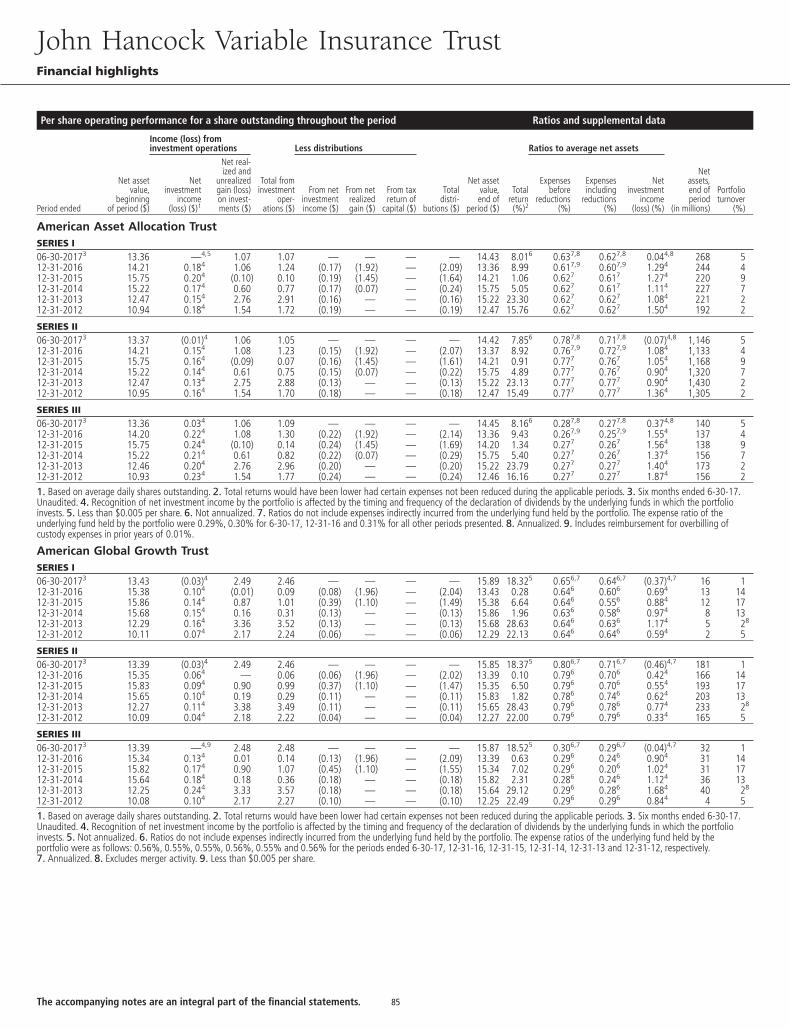
Per share operating performance for a share outstanding throughout the period Ratios and supplemental data
Income (loss) frominvestment operations Less distributions Ratios to average net assets
Period ended
Net assetvalue,
beginningof period ($)
Netinvestment
income(loss) ($)1
Net real-ized and
unrealizedgain (loss)on invest-ments ($)
Total frominvestment
oper-ations ($)
From netinvestmentincome ($)
From netrealizedgain ($)
From taxreturn of
capital ($)
Totaldistri-
butions ($)
Net assetvalue,end of
period ($)
Totalreturn(%)2
Expensesbefore
reductions(%)
Expensesincluding
reductions(%)
Netinvestment
income(loss) (%)
Netassets,end ofperiod
(in millions)
Portfolioturnover
(%)
American Asset Allocation TrustSERIES I06-30-20173 13.36 —4,5 1.07 1.07 — — — — 14.43 8.016 0.637,8 0.627,8 0.044,8 268 512-31-2016 14.21 0.184 1.06 1.24 (0.17) (1.92) — (2.09) 13.36 8.99 0.617,9 0.607,9 1.294 244 412-31-2015 15.75 0.204 (0.10) 0.10 (0.19) (1.45) — (1.64) 14.21 1.06 0.627 0.617 1.274 220 912-31-2014 15.22 0.174 0.60 0.77 (0.17) (0.07) — (0.24) 15.75 5.05 0.627 0.617 1.114 227 712-31-2013 12.47 0.154 2.76 2.91 (0.16) — — (0.16) 15.22 23.30 0.627 0.627 1.084 221 212-31-2012 10.94 0.184 1.54 1.72 (0.19) — — (0.19) 12.47 15.76 0.627 0.627 1.504 192 2
SERIES II06-30-20173 13.37 (0.01)4 1.06 1.05 — — — — 14.42 7.856 0.787,8 0.717,8 (0.07)4,8 1,146 512-31-2016 14.21 0.154 1.08 1.23 (0.15) (1.92) — (2.07) 13.37 8.92 0.767,9 0.727,9 1.084 1,133 412-31-2015 15.75 0.164 (0.09) 0.07 (0.16) (1.45) — (1.61) 14.21 0.91 0.777 0.767 1.054 1,168 912-31-2014 15.22 0.144 0.61 0.75 (0.15) (0.07) — (0.22) 15.75 4.89 0.777 0.767 0.904 1,320 712-31-2013 12.47 0.134 2.75 2.88 (0.13) — — (0.13) 15.22 23.13 0.777 0.777 0.904 1,430 212-31-2012 10.95 0.164 1.54 1.70 (0.18) — — (0.18) 12.47 15.49 0.777 0.777 1.364 1,305 2
SERIES III06-30-20173 13.36 0.034 1.06 1.09 — — — — 14.45 8.166 0.287,8 0.277,8 0.374,8 140 512-31-2016 14.20 0.224 1.08 1.30 (0.22) (1.92) — (2.14) 13.36 9.43 0.267,9 0.257,9 1.554 137 412-31-2015 15.75 0.244 (0.10) 0.14 (0.24) (1.45) — (1.69) 14.20 1.34 0.277 0.267 1.564 138 912-31-2014 15.22 0.214 0.61 0.82 (0.22) (0.07) — (0.29) 15.75 5.40 0.277 0.267 1.374 156 712-31-2013 12.46 0.204 2.76 2.96 (0.20) — — (0.20) 15.22 23.79 0.277 0.277 1.404 173 212-31-2012 10.93 0.234 1.54 1.77 (0.24) — — (0.24) 12.46 16.16 0.277 0.277 1.874 156 21. Based on average daily shares outstanding. 2. Total returns would have been lower had certain expenses not been reduced during the applicable periods. 3. Six months ended 6-30-17.Unaudited. 4. Recognition of net investment income by the portfolio is affected by the timing and frequency of the declaration of dividends by the underlying funds in which the portfolioinvests. 5. Less than $0.005 per share. 6. Not annualized. 7. Ratios do not include expenses indirectly incurred from the underlying fund held by the portfolio. The expense ratio of theunderlying fund held by the portfolio were 0.29%, 0.30% for 6-30-17, 12-31-16 and 0.31% for all other periods presented. 8. Annualized. 9. Includes reimbursement for overbilling ofcustody expenses in prior years of 0.01%.
American Global Growth TrustSERIES I06-30-20173 13.43 (0.03)4 2.49 2.46 — — — — 15.89 18.325 0.656,7 0.646,7 (0.37)4,7 16 112-31-2016 15.38 0.104 (0.01) 0.09 (0.08) (1.96) — (2.04) 13.43 0.28 0.646 0.606 0.694 13 1412-31-2015 15.86 0.144 0.87 1.01 (0.39) (1.10) — (1.49) 15.38 6.64 0.646 0.556 0.884 12 1712-31-2014 15.68 0.154 0.16 0.31 (0.13) — — (0.13) 15.86 1.96 0.636 0.586 0.974 8 1312-31-2013 12.29 0.164 3.36 3.52 (0.13) — — (0.13) 15.68 28.63 0.646 0.636 1.174 5 28
12-31-2012 10.11 0.074 2.17 2.24 (0.06) — — (0.06) 12.29 22.13 0.646 0.646 0.594 2 5
SERIES II06-30-20173 13.39 (0.03)4 2.49 2.46 — — — — 15.85 18.375 0.806,7 0.716,7 (0.46)4,7 181 112-31-2016 15.35 0.064 — 0.06 (0.06) (1.96) — (2.02) 13.39 0.10 0.796 0.706 0.424 166 1412-31-2015 15.83 0.094 0.90 0.99 (0.37) (1.10) — (1.47) 15.35 6.50 0.796 0.706 0.554 193 1712-31-2014 15.65 0.104 0.19 0.29 (0.11) — — (0.11) 15.83 1.82 0.786 0.746 0.624 203 1312-31-2013 12.27 0.114 3.38 3.49 (0.11) — — (0.11) 15.65 28.43 0.796 0.786 0.774 233 28
12-31-2012 10.09 0.044 2.18 2.22 (0.04) — — (0.04) 12.27 22.00 0.796 0.796 0.334 165 5
SERIES III06-30-20173 13.39 —4,9 2.48 2.48 — — — — 15.87 18.525 0.306,7 0.296,7 (0.04)4,7 32 112-31-2016 15.34 0.134 0.01 0.14 (0.13) (1.96) — (2.09) 13.39 0.63 0.296 0.246 0.904 31 1412-31-2015 15.82 0.174 0.90 1.07 (0.45) (1.10) — (1.55) 15.34 7.02 0.296 0.206 1.024 31 1712-31-2014 15.64 0.184 0.18 0.36 (0.18) — — (0.18) 15.82 2.31 0.286 0.246 1.124 36 1312-31-2013 12.25 0.244 3.33 3.57 (0.18) — — (0.18) 15.64 29.12 0.296 0.286 1.684 40 28
12-31-2012 10.08 0.104 2.17 2.27 (0.10) — — (0.10) 12.25 22.49 0.296 0.296 0.844 4 51. Based on average daily shares outstanding. 2. Total returns would have been lower had certain expenses not been reduced during the applicable periods. 3. Six months ended 6-30-17.Unaudited. 4. Recognition of net investment income by the portfolio is affected by the timing and frequency of the declaration of dividends by the underlying funds in which the portfolioinvests. 5. Not annualized. 6. Ratios do not include expenses indirectly incurred from the underlying fund held by the portfolio. The expense ratios of the underlying fund held by theportfolio were as follows: 0.56%, 0.55%, 0.55%, 0.56%, 0.55% and 0.56% for the periods ended 6-30-17, 12-31-16, 12-31-15, 12-31-14, 12-31-13 and 12-31-12, respectively.7. Annualized. 8. Excludes merger activity. 9. Less than $0.005 per share.
John Hancock Variable Insurance TrustFinancial highlights
85The accompanying notes are an integral part of the financial statements.
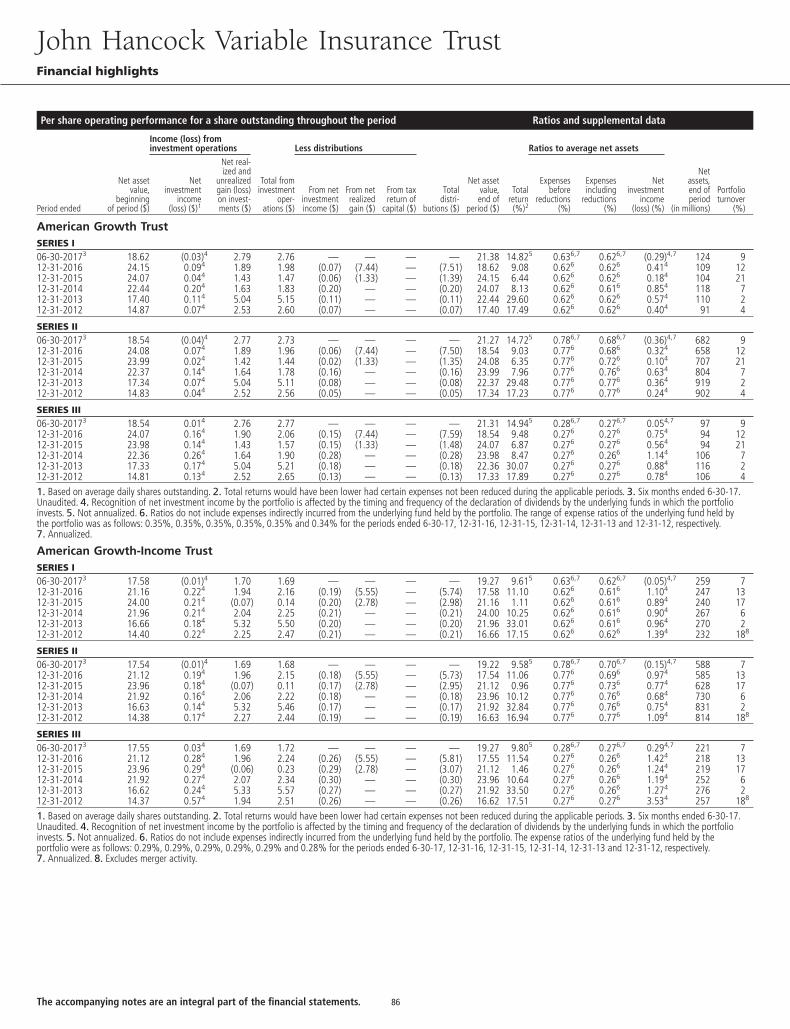
Per share operating performance for a share outstanding throughout the period Ratios and supplemental data
Income (loss) frominvestment operations Less distributions Ratios to average net assets
Period ended
Net assetvalue,
beginningof period ($)
Netinvestment
income(loss) ($)1
Net real-ized and
unrealizedgain (loss)on invest-ments ($)
Total frominvestment
oper-ations ($)
From netinvestmentincome ($)
From netrealizedgain ($)
From taxreturn of
capital ($)
Totaldistri-
butions ($)
Net assetvalue,end of
period ($)
Totalreturn(%)2
Expensesbefore
reductions(%)
Expensesincluding
reductions(%)
Netinvestment
income(loss) (%)
Netassets,end ofperiod
(in millions)
Portfolioturnover
(%)
American Growth TrustSERIES I06-30-20173 18.62 (0.03)4 2.79 2.76 — — — — 21.38 14.825 0.636,7 0.626,7 (0.29)4,7 124 912-31-2016 24.15 0.094 1.89 1.98 (0.07) (7.44) — (7.51) 18.62 9.08 0.626 0.626 0.414 109 1212-31-2015 24.07 0.044 1.43 1.47 (0.06) (1.33) — (1.39) 24.15 6.44 0.626 0.626 0.184 104 2112-31-2014 22.44 0.204 1.63 1.83 (0.20) — — (0.20) 24.07 8.13 0.626 0.616 0.854 118 712-31-2013 17.40 0.114 5.04 5.15 (0.11) — — (0.11) 22.44 29.60 0.626 0.626 0.574 110 212-31-2012 14.87 0.074 2.53 2.60 (0.07) — — (0.07) 17.40 17.49 0.626 0.626 0.404 91 4
SERIES II06-30-20173 18.54 (0.04)4 2.77 2.73 — — — — 21.27 14.725 0.786,7 0.686,7 (0.36)4,7 682 912-31-2016 24.08 0.074 1.89 1.96 (0.06) (7.44) — (7.50) 18.54 9.03 0.776 0.686 0.324 658 1212-31-2015 23.99 0.024 1.42 1.44 (0.02) (1.33) — (1.35) 24.08 6.35 0.776 0.726 0.104 707 2112-31-2014 22.37 0.144 1.64 1.78 (0.16) — — (0.16) 23.99 7.96 0.776 0.766 0.634 804 712-31-2013 17.34 0.074 5.04 5.11 (0.08) — — (0.08) 22.37 29.48 0.776 0.776 0.364 919 212-31-2012 14.83 0.044 2.52 2.56 (0.05) — — (0.05) 17.34 17.23 0.776 0.776 0.244 902 4
SERIES III06-30-20173 18.54 0.014 2.76 2.77 — — — — 21.31 14.945 0.286,7 0.276,7 0.054,7 97 912-31-2016 24.07 0.164 1.90 2.06 (0.15) (7.44) — (7.59) 18.54 9.48 0.276 0.276 0.754 94 1212-31-2015 23.98 0.144 1.43 1.57 (0.15) (1.33) — (1.48) 24.07 6.87 0.276 0.276 0.564 94 2112-31-2014 22.36 0.264 1.64 1.90 (0.28) — — (0.28) 23.98 8.47 0.276 0.266 1.144 106 712-31-2013 17.33 0.174 5.04 5.21 (0.18) — — (0.18) 22.36 30.07 0.276 0.276 0.884 116 212-31-2012 14.81 0.134 2.52 2.65 (0.13) — — (0.13) 17.33 17.89 0.276 0.276 0.784 106 41. Based on average daily shares outstanding. 2. Total returns would have been lower had certain expenses not been reduced during the applicable periods. 3. Six months ended 6-30-17.Unaudited. 4. Recognition of net investment income by the portfolio is affected by the timing and frequency of the declaration of dividends by the underlying funds in which the portfolioinvests. 5. Not annualized. 6. Ratios do not include expenses indirectly incurred from the underlying fund held by the portfolio. The range of expense ratios of the underlying fund held bythe portfolio was as follows: 0.35%, 0.35%, 0.35%, 0.35%, 0.35% and 0.34% for the periods ended 6-30-17, 12-31-16, 12-31-15, 12-31-14, 12-31-13 and 12-31-12, respectively.7. Annualized.
American Growth-Income TrustSERIES I06-30-20173 17.58 (0.01)4 1.70 1.69 — — — — 19.27 9.615 0.636,7 0.626,7 (0.05)4,7 259 712-31-2016 21.16 0.224 1.94 2.16 (0.19) (5.55) — (5.74) 17.58 11.10 0.626 0.616 1.104 247 1312-31-2015 24.00 0.214 (0.07) 0.14 (0.20) (2.78) — (2.98) 21.16 1.11 0.626 0.616 0.894 240 1712-31-2014 21.96 0.214 2.04 2.25 (0.21) — — (0.21) 24.00 10.25 0.626 0.616 0.904 267 612-31-2013 16.66 0.184 5.32 5.50 (0.20) — — (0.20) 21.96 33.01 0.626 0.616 0.964 270 212-31-2012 14.40 0.224 2.25 2.47 (0.21) — — (0.21) 16.66 17.15 0.626 0.626 1.394 232 188
SERIES II06-30-20173 17.54 (0.01)4 1.69 1.68 — — — — 19.22 9.585 0.786,7 0.706,7 (0.15)4,7 588 712-31-2016 21.12 0.194 1.96 2.15 (0.18) (5.55) — (5.73) 17.54 11.06 0.776 0.696 0.974 585 1312-31-2015 23.96 0.184 (0.07) 0.11 (0.17) (2.78) — (2.95) 21.12 0.96 0.776 0.736 0.774 628 1712-31-2014 21.92 0.164 2.06 2.22 (0.18) — — (0.18) 23.96 10.12 0.776 0.766 0.684 730 612-31-2013 16.63 0.144 5.32 5.46 (0.17) — — (0.17) 21.92 32.84 0.776 0.766 0.754 831 212-31-2012 14.38 0.174 2.27 2.44 (0.19) — — (0.19) 16.63 16.94 0.776 0.776 1.094 814 188
SERIES III06-30-20173 17.55 0.034 1.69 1.72 — — — — 19.27 9.805 0.286,7 0.276,7 0.294,7 221 712-31-2016 21.12 0.284 1.96 2.24 (0.26) (5.55) — (5.81) 17.55 11.54 0.276 0.266 1.424 218 1312-31-2015 23.96 0.294 (0.06) 0.23 (0.29) (2.78) — (3.07) 21.12 1.46 0.276 0.266 1.244 219 1712-31-2014 21.92 0.274 2.07 2.34 (0.30) — — (0.30) 23.96 10.64 0.276 0.266 1.194 252 612-31-2013 16.62 0.244 5.33 5.57 (0.27) — — (0.27) 21.92 33.50 0.276 0.266 1.274 276 212-31-2012 14.37 0.574 1.94 2.51 (0.26) — — (0.26) 16.62 17.51 0.276 0.276 3.534 257 188
1. Based on average daily shares outstanding. 2. Total returns would have been lower had certain expenses not been reduced during the applicable periods. 3. Six months ended 6-30-17.Unaudited. 4. Recognition of net investment income by the portfolio is affected by the timing and frequency of the declaration of dividends by the underlying funds in which the portfolioinvests. 5. Not annualized. 6. Ratios do not include expenses indirectly incurred from the underlying fund held by the portfolio. The expense ratios of the underlying fund held by theportfolio were as follows: 0.29%, 0.29%, 0.29%, 0.29%, 0.29% and 0.28% for the periods ended 6-30-17, 12-31-16, 12-31-15, 12-31-14, 12-31-13 and 12-31-12, respectively.7. Annualized. 8. Excludes merger activity.
John Hancock Variable Insurance TrustFinancial highlights
86The accompanying notes are an integral part of the financial statements.
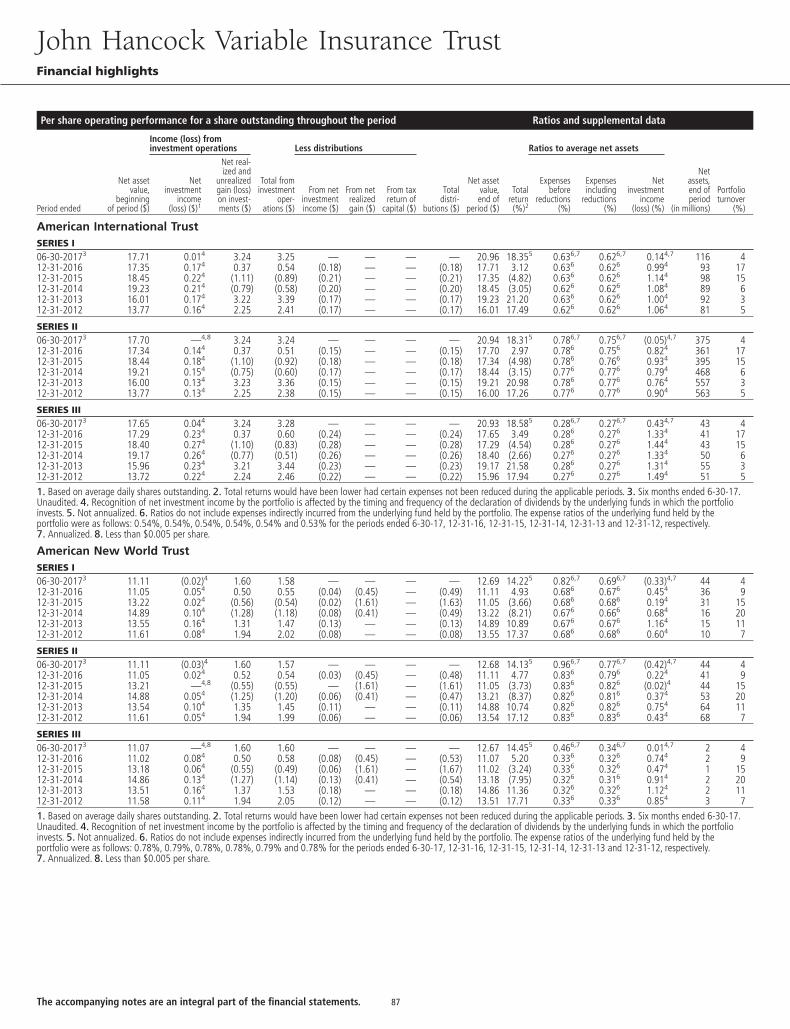
Per share operating performance for a share outstanding throughout the period Ratios and supplemental data
Income (loss) frominvestment operations Less distributions Ratios to average net assets
Period ended
Net assetvalue,
beginningof period ($)
Netinvestment
income(loss) ($)1
Net real-ized and
unrealizedgain (loss)on invest-ments ($)
Total frominvestment
oper-ations ($)
From netinvestmentincome ($)
From netrealizedgain ($)
From taxreturn of
capital ($)
Totaldistri-
butions ($)
Net assetvalue,end of
period ($)
Totalreturn(%)2
Expensesbefore
reductions(%)
Expensesincluding
reductions(%)
Netinvestment
income(loss) (%)
Netassets,end ofperiod
(in millions)
Portfolioturnover
(%)
American International TrustSERIES I06-30-20173 17.71 0.014 3.24 3.25 — — — — 20.96 18.355 0.636,7 0.626,7 0.144,7 116 412-31-2016 17.35 0.174 0.37 0.54 (0.18) — — (0.18) 17.71 3.12 0.636 0.626 0.994 93 1712-31-2015 18.45 0.224 (1.11) (0.89) (0.21) — — (0.21) 17.35 (4.82) 0.636 0.626 1.144 98 1512-31-2014 19.23 0.214 (0.79) (0.58) (0.20) — — (0.20) 18.45 (3.05) 0.626 0.626 1.084 89 612-31-2013 16.01 0.174 3.22 3.39 (0.17) — — (0.17) 19.23 21.20 0.636 0.626 1.004 92 312-31-2012 13.77 0.164 2.25 2.41 (0.17) — — (0.17) 16.01 17.49 0.626 0.626 1.064 81 5
SERIES II06-30-20173 17.70 —4,8 3.24 3.24 — — — — 20.94 18.315 0.786,7 0.756,7 (0.05)4,7 375 412-31-2016 17.34 0.144 0.37 0.51 (0.15) — — (0.15) 17.70 2.97 0.786 0.756 0.824 361 1712-31-2015 18.44 0.184 (1.10) (0.92) (0.18) — — (0.18) 17.34 (4.98) 0.786 0.766 0.934 395 1512-31-2014 19.21 0.154 (0.75) (0.60) (0.17) — — (0.17) 18.44 (3.15) 0.776 0.776 0.794 468 612-31-2013 16.00 0.134 3.23 3.36 (0.15) — — (0.15) 19.21 20.98 0.786 0.776 0.764 557 312-31-2012 13.77 0.134 2.25 2.38 (0.15) — — (0.15) 16.00 17.26 0.776 0.776 0.904 563 5
SERIES III06-30-20173 17.65 0.044 3.24 3.28 — — — — 20.93 18.585 0.286,7 0.276,7 0.434,7 43 412-31-2016 17.29 0.234 0.37 0.60 (0.24) — — (0.24) 17.65 3.49 0.286 0.276 1.334 41 1712-31-2015 18.40 0.274 (1.10) (0.83) (0.28) — — (0.28) 17.29 (4.54) 0.286 0.276 1.444 43 1512-31-2014 19.17 0.264 (0.77) (0.51) (0.26) — — (0.26) 18.40 (2.66) 0.276 0.276 1.334 50 612-31-2013 15.96 0.234 3.21 3.44 (0.23) — — (0.23) 19.17 21.58 0.286 0.276 1.314 55 312-31-2012 13.72 0.224 2.24 2.46 (0.22) — — (0.22) 15.96 17.94 0.276 0.276 1.494 51 51. Based on average daily shares outstanding. 2. Total returns would have been lower had certain expenses not been reduced during the applicable periods. 3. Six months ended 6-30-17.Unaudited. 4. Recognition of net investment income by the portfolio is affected by the timing and frequency of the declaration of dividends by the underlying funds in which the portfolioinvests. 5. Not annualized. 6. Ratios do not include expenses indirectly incurred from the underlying fund held by the portfolio. The expense ratios of the underlying fund held by theportfolio were as follows: 0.54%, 0.54%, 0.54%, 0.54%, 0.54% and 0.53% for the periods ended 6-30-17, 12-31-16, 12-31-15, 12-31-14, 12-31-13 and 12-31-12, respectively.7. Annualized. 8. Less than $0.005 per share.
American New World TrustSERIES I06-30-20173 11.11 (0.02)4 1.60 1.58 — — — — 12.69 14.225 0.826,7 0.696,7 (0.33)4,7 44 412-31-2016 11.05 0.054 0.50 0.55 (0.04) (0.45) — (0.49) 11.11 4.93 0.686 0.676 0.454 36 912-31-2015 13.22 0.024 (0.56) (0.54) (0.02) (1.61) — (1.63) 11.05 (3.66) 0.686 0.686 0.194 31 1512-31-2014 14.89 0.104 (1.28) (1.18) (0.08) (0.41) — (0.49) 13.22 (8.21) 0.676 0.666 0.684 16 2012-31-2013 13.55 0.164 1.31 1.47 (0.13) — — (0.13) 14.89 10.89 0.676 0.676 1.164 15 1112-31-2012 11.61 0.084 1.94 2.02 (0.08) — — (0.08) 13.55 17.37 0.686 0.686 0.604 10 7
SERIES II06-30-20173 11.11 (0.03)4 1.60 1.57 — — — — 12.68 14.135 0.966,7 0.776,7 (0.42)4,7 44 412-31-2016 11.05 0.024 0.52 0.54 (0.03) (0.45) — (0.48) 11.11 4.77 0.836 0.796 0.224 41 912-31-2015 13.21 —4,8 (0.55) (0.55) — (1.61) — (1.61) 11.05 (3.73) 0.836 0.826 (0.02)4 44 1512-31-2014 14.88 0.054 (1.25) (1.20) (0.06) (0.41) — (0.47) 13.21 (8.37) 0.826 0.816 0.374 53 2012-31-2013 13.54 0.104 1.35 1.45 (0.11) — — (0.11) 14.88 10.74 0.826 0.826 0.754 64 1112-31-2012 11.61 0.054 1.94 1.99 (0.06) — — (0.06) 13.54 17.12 0.836 0.836 0.434 68 7
SERIES III06-30-20173 11.07 —4,8 1.60 1.60 — — — — 12.67 14.455 0.466,7 0.346,7 0.014,7 2 412-31-2016 11.02 0.084 0.50 0.58 (0.08) (0.45) — (0.53) 11.07 5.20 0.336 0.326 0.744 2 912-31-2015 13.18 0.064 (0.55) (0.49) (0.06) (1.61) — (1.67) 11.02 (3.24) 0.336 0.326 0.474 1 1512-31-2014 14.86 0.134 (1.27) (1.14) (0.13) (0.41) — (0.54) 13.18 (7.95) 0.326 0.316 0.914 2 2012-31-2013 13.51 0.164 1.37 1.53 (0.18) — — (0.18) 14.86 11.36 0.326 0.326 1.124 2 1112-31-2012 11.58 0.114 1.94 2.05 (0.12) — — (0.12) 13.51 17.71 0.336 0.336 0.854 3 71. Based on average daily shares outstanding. 2. Total returns would have been lower had certain expenses not been reduced during the applicable periods. 3. Six months ended 6-30-17.Unaudited. 4. Recognition of net investment income by the portfolio is affected by the timing and frequency of the declaration of dividends by the underlying funds in which the portfolioinvests. 5. Not annualized. 6. Ratios do not include expenses indirectly incurred from the underlying fund held by the portfolio. The expense ratios of the underlying fund held by theportfolio were as follows: 0.78%, 0.79%, 0.78%, 0.78%, 0.79% and 0.78% for the periods ended 6-30-17, 12-31-16, 12-31-15, 12-31-14, 12-31-13 and 12-31-12, respectively.7. Annualized. 8. Less than $0.005 per share.
John Hancock Variable Insurance TrustFinancial highlights
87The accompanying notes are an integral part of the financial statements.
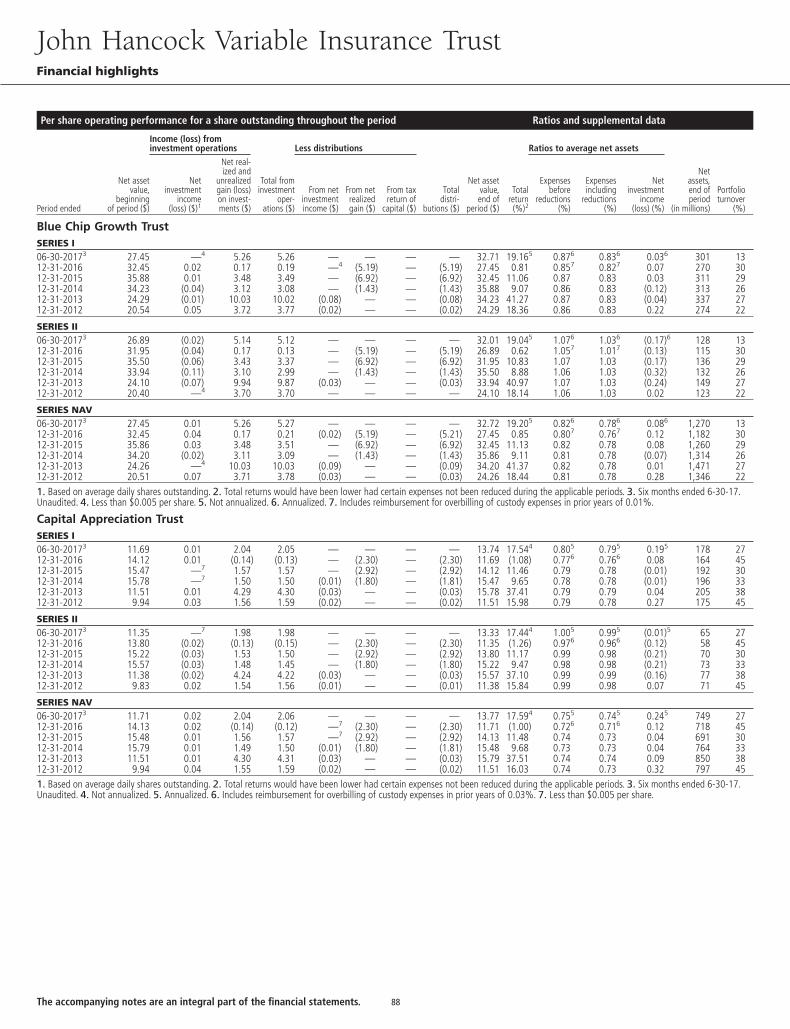
Per share operating performance for a share outstanding throughout the period Ratios and supplemental data
Income (loss) frominvestment operations Less distributions Ratios to average net assets
Period ended
Net assetvalue,
beginningof period ($)
Netinvestment
income(loss) ($)1
Net real-ized and
unrealizedgain (loss)on invest-ments ($)
Total frominvestment
oper-ations ($)
From netinvestmentincome ($)
From netrealizedgain ($)
From taxreturn of
capital ($)
Totaldistri-
butions ($)
Net assetvalue,end of
period ($)
Totalreturn(%)2
Expensesbefore
reductions(%)
Expensesincluding
reductions(%)
Netinvestment
income(loss) (%)
Netassets,end ofperiod
(in millions)
Portfolioturnover
(%)
Blue Chip Growth TrustSERIES I06-30-20173 27.45 —4 5.26 5.26 — — — — 32.71 19.165 0.876 0.836 0.036 301 1312-31-2016 32.45 0.02 0.17 0.19 —4 (5.19) — (5.19) 27.45 0.81 0.857 0.827 0.07 270 3012-31-2015 35.88 0.01 3.48 3.49 — (6.92) — (6.92) 32.45 11.06 0.87 0.83 0.03 311 2912-31-2014 34.23 (0.04) 3.12 3.08 — (1.43) — (1.43) 35.88 9.07 0.86 0.83 (0.12) 313 2612-31-2013 24.29 (0.01) 10.03 10.02 (0.08) — — (0.08) 34.23 41.27 0.87 0.83 (0.04) 337 2712-31-2012 20.54 0.05 3.72 3.77 (0.02) — — (0.02) 24.29 18.36 0.86 0.83 0.22 274 22
SERIES II06-30-20173 26.89 (0.02) 5.14 5.12 — — — — 32.01 19.045 1.076 1.036 (0.17)6 128 1312-31-2016 31.95 (0.04) 0.17 0.13 — (5.19) — (5.19) 26.89 0.62 1.057 1.017 (0.13) 115 3012-31-2015 35.50 (0.06) 3.43 3.37 — (6.92) — (6.92) 31.95 10.83 1.07 1.03 (0.17) 136 2912-31-2014 33.94 (0.11) 3.10 2.99 — (1.43) — (1.43) 35.50 8.88 1.06 1.03 (0.32) 132 2612-31-2013 24.10 (0.07) 9.94 9.87 (0.03) — — (0.03) 33.94 40.97 1.07 1.03 (0.24) 149 2712-31-2012 20.40 —4 3.70 3.70 — — — — 24.10 18.14 1.06 1.03 0.02 123 22
SERIES NAV06-30-20173 27.45 0.01 5.26 5.27 — — — — 32.72 19.205 0.826 0.786 0.086 1,270 1312-31-2016 32.45 0.04 0.17 0.21 (0.02) (5.19) — (5.21) 27.45 0.85 0.807 0.767 0.12 1,182 3012-31-2015 35.86 0.03 3.48 3.51 — (6.92) — (6.92) 32.45 11.13 0.82 0.78 0.08 1,260 2912-31-2014 34.20 (0.02) 3.11 3.09 — (1.43) — (1.43) 35.86 9.11 0.81 0.78 (0.07) 1,314 2612-31-2013 24.26 —4 10.03 10.03 (0.09) — — (0.09) 34.20 41.37 0.82 0.78 0.01 1,471 2712-31-2012 20.51 0.07 3.71 3.78 (0.03) — — (0.03) 24.26 18.44 0.81 0.78 0.28 1,346 221. Based on average daily shares outstanding. 2. Total returns would have been lower had certain expenses not been reduced during the applicable periods. 3. Six months ended 6-30-17.Unaudited. 4. Less than $0.005 per share. 5. Not annualized. 6. Annualized. 7. Includes reimbursement for overbilling of custody expenses in prior years of 0.01%.
Capital Appreciation TrustSERIES I06-30-20173 11.69 0.01 2.04 2.05 — — — — 13.74 17.544 0.805 0.795 0.195 178 2712-31-2016 14.12 0.01 (0.14) (0.13) — (2.30) — (2.30) 11.69 (1.08) 0.776 0.766 0.08 164 4512-31-2015 15.47 —7 1.57 1.57 — (2.92) — (2.92) 14.12 11.46 0.79 0.78 (0.01) 192 3012-31-2014 15.78 —7 1.50 1.50 (0.01) (1.80) — (1.81) 15.47 9.65 0.78 0.78 (0.01) 196 3312-31-2013 11.51 0.01 4.29 4.30 (0.03) — — (0.03) 15.78 37.41 0.79 0.79 0.04 205 3812-31-2012 9.94 0.03 1.56 1.59 (0.02) — — (0.02) 11.51 15.98 0.79 0.78 0.27 175 45
SERIES II06-30-20173 11.35 —7 1.98 1.98 — — — — 13.33 17.444 1.005 0.995 (0.01)5 65 2712-31-2016 13.80 (0.02) (0.13) (0.15) — (2.30) — (2.30) 11.35 (1.26) 0.976 0.966 (0.12) 58 4512-31-2015 15.22 (0.03) 1.53 1.50 — (2.92) — (2.92) 13.80 11.17 0.99 0.98 (0.21) 70 3012-31-2014 15.57 (0.03) 1.48 1.45 — (1.80) — (1.80) 15.22 9.47 0.98 0.98 (0.21) 73 3312-31-2013 11.38 (0.02) 4.24 4.22 (0.03) — — (0.03) 15.57 37.10 0.99 0.99 (0.16) 77 3812-31-2012 9.83 0.02 1.54 1.56 (0.01) — — (0.01) 11.38 15.84 0.99 0.98 0.07 71 45
SERIES NAV06-30-20173 11.71 0.02 2.04 2.06 — — — — 13.77 17.594 0.755 0.745 0.245 749 2712-31-2016 14.13 0.02 (0.14) (0.12) —7 (2.30) — (2.30) 11.71 (1.00) 0.726 0.716 0.12 718 4512-31-2015 15.48 0.01 1.56 1.57 —7 (2.92) — (2.92) 14.13 11.48 0.74 0.73 0.04 691 3012-31-2014 15.79 0.01 1.49 1.50 (0.01) (1.80) — (1.81) 15.48 9.68 0.73 0.73 0.04 764 3312-31-2013 11.51 0.01 4.30 4.31 (0.03) — — (0.03) 15.79 37.51 0.74 0.74 0.09 850 3812-31-2012 9.94 0.04 1.55 1.59 (0.02) — — (0.02) 11.51 16.03 0.74 0.73 0.32 797 451. Based on average daily shares outstanding. 2. Total returns would have been lower had certain expenses not been reduced during the applicable periods. 3. Six months ended 6-30-17.Unaudited. 4. Not annualized. 5. Annualized. 6. Includes reimbursement for overbilling of custody expenses in prior years of 0.03%. 7. Less than $0.005 per share.
John Hancock Variable Insurance TrustFinancial highlights
88The accompanying notes are an integral part of the financial statements.
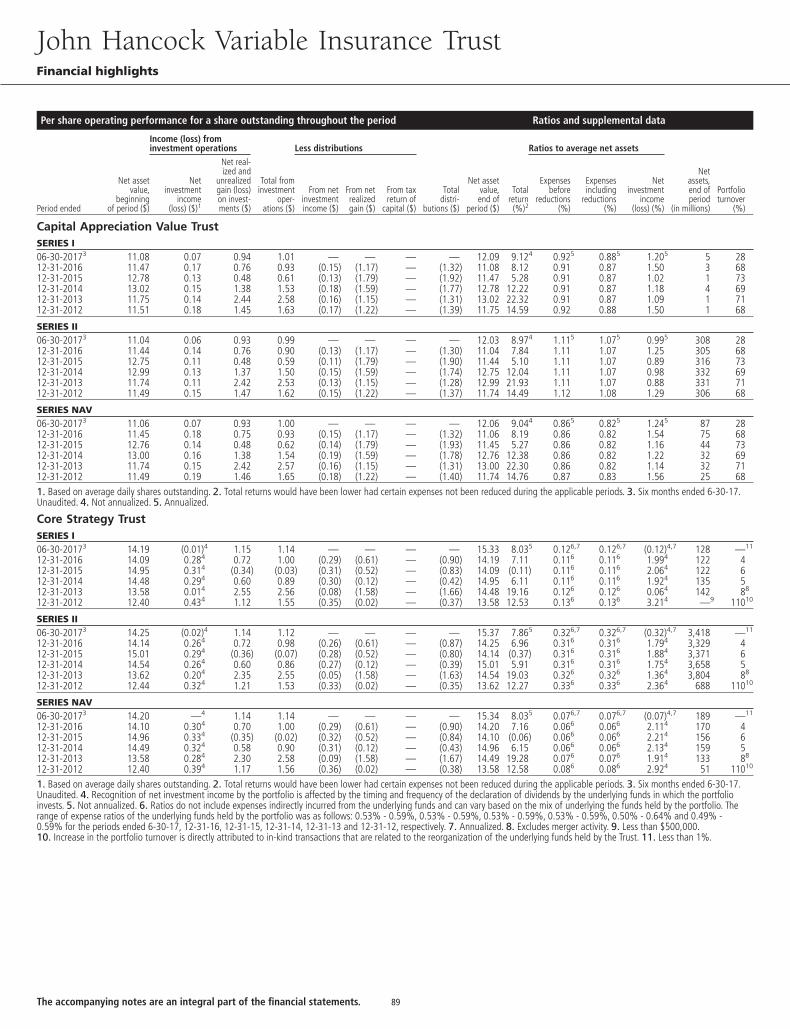
Per share operating performance for a share outstanding throughout the period Ratios and supplemental data
Income (loss) frominvestment operations Less distributions Ratios to average net assets
Period ended
Net assetvalue,
beginningof period ($)
Netinvestment
income(loss) ($)1
Net real-ized and
unrealizedgain (loss)on invest-ments ($)
Total frominvestment
oper-ations ($)
From netinvestmentincome ($)
From netrealizedgain ($)
From taxreturn of
capital ($)
Totaldistri-
butions ($)
Net assetvalue,end of
period ($)
Totalreturn(%)2
Expensesbefore
reductions(%)
Expensesincluding
reductions(%)
Netinvestment
income(loss) (%)
Netassets,end ofperiod
(in millions)
Portfolioturnover
(%)
Capital Appreciation Value TrustSERIES I06-30-20173 11.08 0.07 0.94 1.01 — — — — 12.09 9.124 0.925 0.885 1.205 5 2812-31-2016 11.47 0.17 0.76 0.93 (0.15) (1.17) — (1.32) 11.08 8.12 0.91 0.87 1.50 3 6812-31-2015 12.78 0.13 0.48 0.61 (0.13) (1.79) — (1.92) 11.47 5.28 0.91 0.87 1.02 1 7312-31-2014 13.02 0.15 1.38 1.53 (0.18) (1.59) — (1.77) 12.78 12.22 0.91 0.87 1.18 4 6912-31-2013 11.75 0.14 2.44 2.58 (0.16) (1.15) — (1.31) 13.02 22.32 0.91 0.87 1.09 1 7112-31-2012 11.51 0.18 1.45 1.63 (0.17) (1.22) — (1.39) 11.75 14.59 0.92 0.88 1.50 1 68
SERIES II06-30-20173 11.04 0.06 0.93 0.99 — — — — 12.03 8.974 1.115 1.075 0.995 308 2812-31-2016 11.44 0.14 0.76 0.90 (0.13) (1.17) — (1.30) 11.04 7.84 1.11 1.07 1.25 305 6812-31-2015 12.75 0.11 0.48 0.59 (0.11) (1.79) — (1.90) 11.44 5.10 1.11 1.07 0.89 316 7312-31-2014 12.99 0.13 1.37 1.50 (0.15) (1.59) — (1.74) 12.75 12.04 1.11 1.07 0.98 332 6912-31-2013 11.74 0.11 2.42 2.53 (0.13) (1.15) — (1.28) 12.99 21.93 1.11 1.07 0.88 331 7112-31-2012 11.49 0.15 1.47 1.62 (0.15) (1.22) — (1.37) 11.74 14.49 1.12 1.08 1.29 306 68
SERIES NAV06-30-20173 11.06 0.07 0.93 1.00 — — — — 12.06 9.044 0.865 0.825 1.245 87 2812-31-2016 11.45 0.18 0.75 0.93 (0.15) (1.17) — (1.32) 11.06 8.19 0.86 0.82 1.54 75 6812-31-2015 12.76 0.14 0.48 0.62 (0.14) (1.79) — (1.93) 11.45 5.27 0.86 0.82 1.16 44 7312-31-2014 13.00 0.16 1.38 1.54 (0.19) (1.59) — (1.78) 12.76 12.38 0.86 0.82 1.22 32 6912-31-2013 11.74 0.15 2.42 2.57 (0.16) (1.15) — (1.31) 13.00 22.30 0.86 0.82 1.14 32 7112-31-2012 11.49 0.19 1.46 1.65 (0.18) (1.22) — (1.40) 11.74 14.76 0.87 0.83 1.56 25 681. Based on average daily shares outstanding. 2. Total returns would have been lower had certain expenses not been reduced during the applicable periods. 3. Six months ended 6-30-17.Unaudited. 4. Not annualized. 5. Annualized.
Core Strategy TrustSERIES I06-30-20173 14.19 (0.01)4 1.15 1.14 — — — — 15.33 8.035 0.126,7 0.126,7 (0.12)4,7 128 —11
12-31-2016 14.09 0.284 0.72 1.00 (0.29) (0.61) — (0.90) 14.19 7.11 0.116 0.116 1.994 122 412-31-2015 14.95 0.314 (0.34) (0.03) (0.31) (0.52) — (0.83) 14.09 (0.11) 0.116 0.116 2.064 122 612-31-2014 14.48 0.294 0.60 0.89 (0.30) (0.12) — (0.42) 14.95 6.11 0.116 0.116 1.924 135 512-31-2013 13.58 0.014 2.55 2.56 (0.08) (1.58) — (1.66) 14.48 19.16 0.126 0.126 0.064 142 88
12-31-2012 12.40 0.434 1.12 1.55 (0.35) (0.02) — (0.37) 13.58 12.53 0.136 0.136 3.214 —9 11010
SERIES II06-30-20173 14.25 (0.02)4 1.14 1.12 — — — — 15.37 7.865 0.326,7 0.326,7 (0.32)4,7 3,418 —11
12-31-2016 14.14 0.264 0.72 0.98 (0.26) (0.61) — (0.87) 14.25 6.96 0.316 0.316 1.794 3,329 412-31-2015 15.01 0.294 (0.36) (0.07) (0.28) (0.52) — (0.80) 14.14 (0.37) 0.316 0.316 1.884 3,371 612-31-2014 14.54 0.264 0.60 0.86 (0.27) (0.12) — (0.39) 15.01 5.91 0.316 0.316 1.754 3,658 512-31-2013 13.62 0.204 2.35 2.55 (0.05) (1.58) — (1.63) 14.54 19.03 0.326 0.326 1.364 3,804 88
12-31-2012 12.44 0.324 1.21 1.53 (0.33) (0.02) — (0.35) 13.62 12.27 0.336 0.336 2.364 688 11010
SERIES NAV06-30-20173 14.20 —4 1.14 1.14 — — — — 15.34 8.035 0.076,7 0.076,7 (0.07)4,7 189 —11
12-31-2016 14.10 0.304 0.70 1.00 (0.29) (0.61) — (0.90) 14.20 7.16 0.066 0.066 2.114 170 412-31-2015 14.96 0.334 (0.35) (0.02) (0.32) (0.52) — (0.84) 14.10 (0.06) 0.066 0.066 2.214 156 612-31-2014 14.49 0.324 0.58 0.90 (0.31) (0.12) — (0.43) 14.96 6.15 0.066 0.066 2.134 159 512-31-2013 13.58 0.284 2.30 2.58 (0.09) (1.58) — (1.67) 14.49 19.28 0.076 0.076 1.914 133 88
12-31-2012 12.40 0.394 1.17 1.56 (0.36) (0.02) — (0.38) 13.58 12.58 0.086 0.086 2.924 51 11010
1. Based on average daily shares outstanding. 2. Total returns would have been lower had certain expenses not been reduced during the applicable periods. 3. Six months ended 6-30-17.Unaudited. 4. Recognition of net investment income by the portfolio is affected by the timing and frequency of the declaration of dividends by the underlying funds in which the portfolioinvests. 5. Not annualized. 6. Ratios do not include expenses indirectly incurred from the underlying funds and can vary based on the mix of underlying the funds held by the portfolio. Therange of expense ratios of the underlying funds held by the portfolio was as follows: 0.53% - 0.59%, 0.53% - 0.59%, 0.53% - 0.59%, 0.53% - 0.59%, 0.50% - 0.64% and 0.49% -0.59% for the periods ended 6-30-17, 12-31-16, 12-31-15, 12-31-14, 12-31-13 and 12-31-12, respectively. 7. Annualized. 8. Excludes merger activity. 9. Less than $500,000.10. Increase in the portfolio turnover is directly attributed to in-kind transactions that are related to the reorganization of the underlying funds held by the Trust. 11. Less than 1%.
John Hancock Variable Insurance TrustFinancial highlights
89The accompanying notes are an integral part of the financial statements.
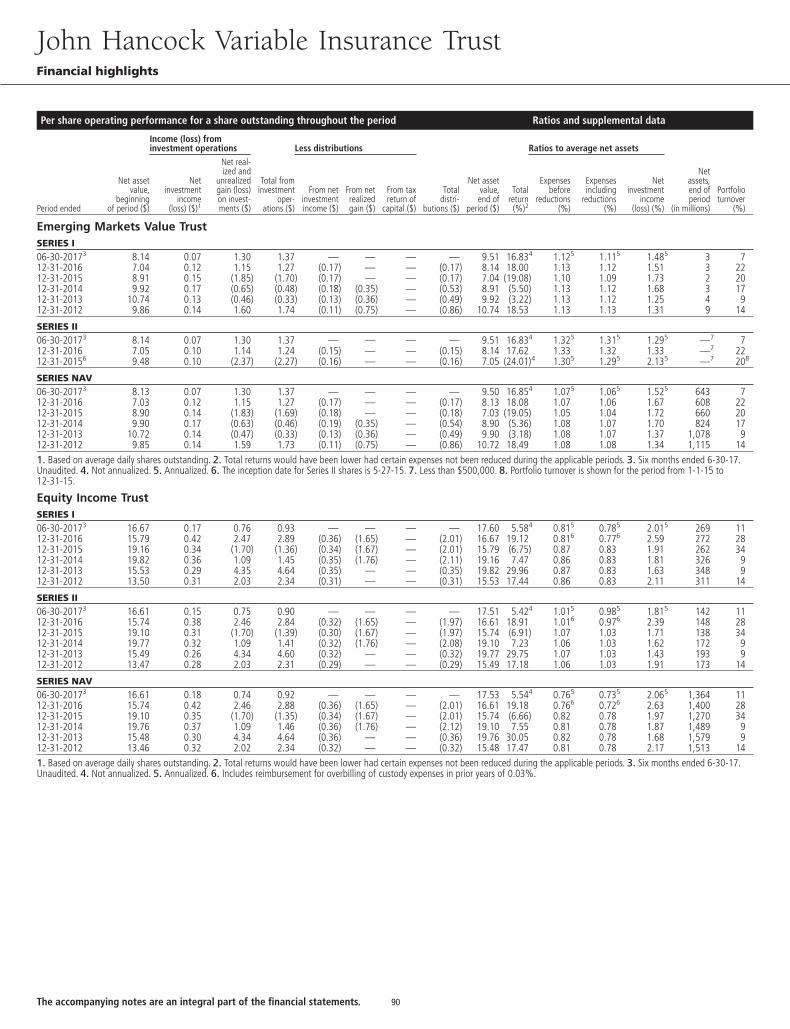
Per share operating performance for a share outstanding throughout the period Ratios and supplemental data
Income (loss) frominvestment operations Less distributions Ratios to average net assets
Period ended
Net assetvalue,
beginningof period ($)
Netinvestment
income(loss) ($)1
Net real-ized and
unrealizedgain (loss)on invest-ments ($)
Total frominvestment
oper-ations ($)
From netinvestmentincome ($)
From netrealizedgain ($)
From taxreturn of
capital ($)
Totaldistri-
butions ($)
Net assetvalue,end of
period ($)
Totalreturn(%)2
Expensesbefore
reductions(%)
Expensesincluding
reductions(%)
Netinvestment
income(loss) (%)
Netassets,end ofperiod
(in millions)
Portfolioturnover
(%)
Emerging Markets Value TrustSERIES I06-30-20173 8.14 0.07 1.30 1.37 — — — — 9.51 16.834 1.125 1.115 1.485 3 712-31-2016 7.04 0.12 1.15 1.27 (0.17) — — (0.17) 8.14 18.00 1.13 1.12 1.51 3 2212-31-2015 8.91 0.15 (1.85) (1.70) (0.17) — — (0.17) 7.04 (19.08) 1.10 1.09 1.73 2 2012-31-2014 9.92 0.17 (0.65) (0.48) (0.18) (0.35) — (0.53) 8.91 (5.50) 1.13 1.12 1.68 3 1712-31-2013 10.74 0.13 (0.46) (0.33) (0.13) (0.36) — (0.49) 9.92 (3.22) 1.13 1.12 1.25 4 912-31-2012 9.86 0.14 1.60 1.74 (0.11) (0.75) — (0.86) 10.74 18.53 1.13 1.13 1.31 9 14
SERIES II06-30-20173 8.14 0.07 1.30 1.37 — — — — 9.51 16.834 1.325 1.315 1.295 —7 712-31-2016 7.05 0.10 1.14 1.24 (0.15) — — (0.15) 8.14 17.62 1.33 1.32 1.33 —7 2212-31-20156 9.48 0.10 (2.37) (2.27) (0.16) — — (0.16) 7.05 (24.01)4 1.305 1.295 2.135 —7 208
SERIES NAV06-30-20173 8.13 0.07 1.30 1.37 — — — — 9.50 16.854 1.075 1.065 1.525 643 712-31-2016 7.03 0.12 1.15 1.27 (0.17) — — (0.17) 8.13 18.08 1.07 1.06 1.67 608 2212-31-2015 8.90 0.14 (1.83) (1.69) (0.18) — — (0.18) 7.03 (19.05) 1.05 1.04 1.72 660 2012-31-2014 9.90 0.17 (0.63) (0.46) (0.19) (0.35) — (0.54) 8.90 (5.36) 1.08 1.07 1.70 824 1712-31-2013 10.72 0.14 (0.47) (0.33) (0.13) (0.36) — (0.49) 9.90 (3.18) 1.08 1.07 1.37 1,078 912-31-2012 9.85 0.14 1.59 1.73 (0.11) (0.75) — (0.86) 10.72 18.49 1.08 1.08 1.34 1,115 141. Based on average daily shares outstanding. 2. Total returns would have been lower had certain expenses not been reduced during the applicable periods. 3. Six months ended 6-30-17.Unaudited. 4. Not annualized. 5. Annualized. 6. The inception date for Series II shares is 5-27-15. 7. Less than $500,000. 8. Portfolio turnover is shown for the period from 1-1-15 to12-31-15.
Equity Income TrustSERIES I06-30-20173 16.67 0.17 0.76 0.93 — — — — 17.60 5.584 0.815 0.785 2.015 269 1112-31-2016 15.79 0.42 2.47 2.89 (0.36) (1.65) — (2.01) 16.67 19.12 0.816 0.776 2.59 272 2812-31-2015 19.16 0.34 (1.70) (1.36) (0.34) (1.67) — (2.01) 15.79 (6.75) 0.87 0.83 1.91 262 3412-31-2014 19.82 0.36 1.09 1.45 (0.35) (1.76) — (2.11) 19.16 7.47 0.86 0.83 1.81 326 912-31-2013 15.53 0.29 4.35 4.64 (0.35) — — (0.35) 19.82 29.96 0.87 0.83 1.63 348 912-31-2012 13.50 0.31 2.03 2.34 (0.31) — — (0.31) 15.53 17.44 0.86 0.83 2.11 311 14
SERIES II06-30-20173 16.61 0.15 0.75 0.90 — — — — 17.51 5.424 1.015 0.985 1.815 142 1112-31-2016 15.74 0.38 2.46 2.84 (0.32) (1.65) — (1.97) 16.61 18.91 1.016 0.976 2.39 148 2812-31-2015 19.10 0.31 (1.70) (1.39) (0.30) (1.67) — (1.97) 15.74 (6.91) 1.07 1.03 1.71 138 3412-31-2014 19.77 0.32 1.09 1.41 (0.32) (1.76) — (2.08) 19.10 7.23 1.06 1.03 1.62 172 912-31-2013 15.49 0.26 4.34 4.60 (0.32) — — (0.32) 19.77 29.75 1.07 1.03 1.43 193 912-31-2012 13.47 0.28 2.03 2.31 (0.29) — — (0.29) 15.49 17.18 1.06 1.03 1.91 173 14
SERIES NAV06-30-20173 16.61 0.18 0.74 0.92 — — — — 17.53 5.544 0.765 0.735 2.065 1,364 1112-31-2016 15.74 0.42 2.46 2.88 (0.36) (1.65) — (2.01) 16.61 19.18 0.766 0.726 2.63 1,400 2812-31-2015 19.10 0.35 (1.70) (1.35) (0.34) (1.67) — (2.01) 15.74 (6.66) 0.82 0.78 1.97 1,270 3412-31-2014 19.76 0.37 1.09 1.46 (0.36) (1.76) — (2.12) 19.10 7.55 0.81 0.78 1.87 1,489 912-31-2013 15.48 0.30 4.34 4.64 (0.36) — — (0.36) 19.76 30.05 0.82 0.78 1.68 1,579 912-31-2012 13.46 0.32 2.02 2.34 (0.32) — — (0.32) 15.48 17.47 0.81 0.78 2.17 1,513 141. Based on average daily shares outstanding. 2. Total returns would have been lower had certain expenses not been reduced during the applicable periods. 3. Six months ended 6-30-17.Unaudited. 4. Not annualized. 5. Annualized. 6. Includes reimbursement for overbilling of custody expenses in prior years of 0.03%.
John Hancock Variable Insurance TrustFinancial highlights
90The accompanying notes are an integral part of the financial statements.
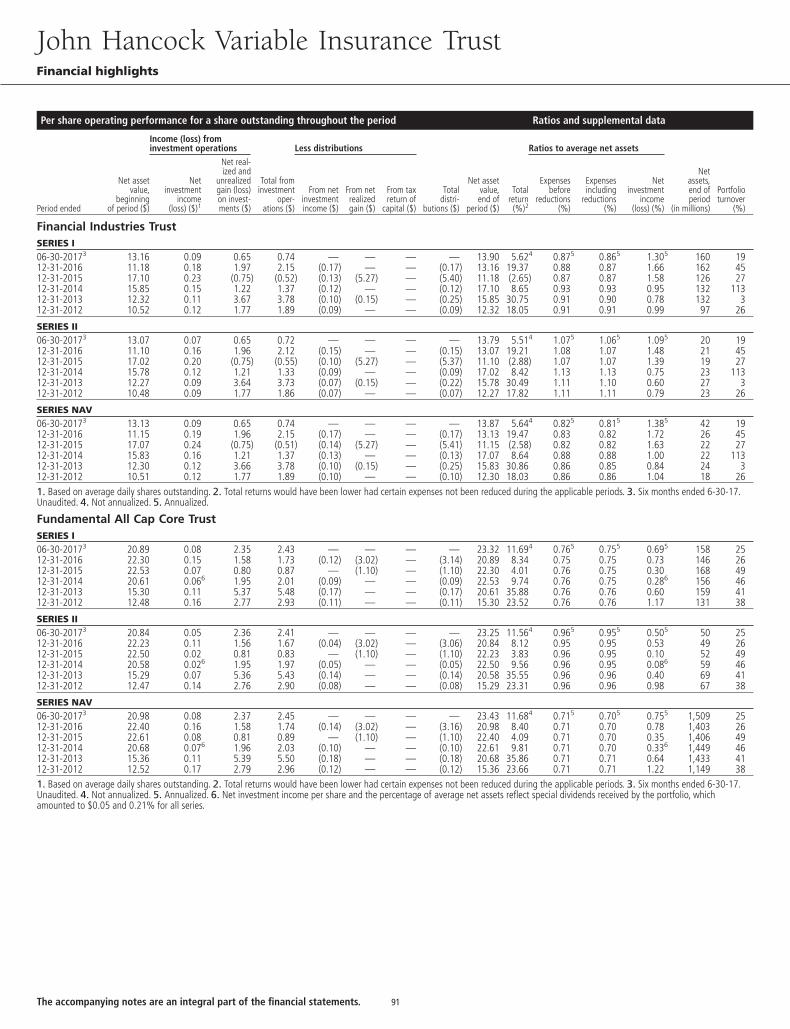
Per share operating performance for a share outstanding throughout the period Ratios and supplemental data
Income (loss) frominvestment operations Less distributions Ratios to average net assets
Period ended
Net assetvalue,
beginningof period ($)
Netinvestment
income(loss) ($)1
Net real-ized and
unrealizedgain (loss)on invest-ments ($)
Total frominvestment
oper-ations ($)
From netinvestmentincome ($)
From netrealizedgain ($)
From taxreturn of
capital ($)
Totaldistri-
butions ($)
Net assetvalue,end of
period ($)
Totalreturn(%)2
Expensesbefore
reductions(%)
Expensesincluding
reductions(%)
Netinvestment
income(loss) (%)
Netassets,end ofperiod
(in millions)
Portfolioturnover
(%)
Financial Industries TrustSERIES I06-30-20173 13.16 0.09 0.65 0.74 — — — — 13.90 5.624 0.875 0.865 1.305 160 1912-31-2016 11.18 0.18 1.97 2.15 (0.17) — — (0.17) 13.16 19.37 0.88 0.87 1.66 162 4512-31-2015 17.10 0.23 (0.75) (0.52) (0.13) (5.27) — (5.40) 11.18 (2.65) 0.87 0.87 1.58 126 2712-31-2014 15.85 0.15 1.22 1.37 (0.12) — — (0.12) 17.10 8.65 0.93 0.93 0.95 132 11312-31-2013 12.32 0.11 3.67 3.78 (0.10) (0.15) — (0.25) 15.85 30.75 0.91 0.90 0.78 132 312-31-2012 10.52 0.12 1.77 1.89 (0.09) — — (0.09) 12.32 18.05 0.91 0.91 0.99 97 26
SERIES II06-30-20173 13.07 0.07 0.65 0.72 — — — — 13.79 5.514 1.075 1.065 1.095 20 1912-31-2016 11.10 0.16 1.96 2.12 (0.15) — — (0.15) 13.07 19.21 1.08 1.07 1.48 21 4512-31-2015 17.02 0.20 (0.75) (0.55) (0.10) (5.27) — (5.37) 11.10 (2.88) 1.07 1.07 1.39 19 2712-31-2014 15.78 0.12 1.21 1.33 (0.09) — — (0.09) 17.02 8.42 1.13 1.13 0.75 23 11312-31-2013 12.27 0.09 3.64 3.73 (0.07) (0.15) — (0.22) 15.78 30.49 1.11 1.10 0.60 27 312-31-2012 10.48 0.09 1.77 1.86 (0.07) — — (0.07) 12.27 17.82 1.11 1.11 0.79 23 26
SERIES NAV06-30-20173 13.13 0.09 0.65 0.74 — — — — 13.87 5.644 0.825 0.815 1.385 42 1912-31-2016 11.15 0.19 1.96 2.15 (0.17) — — (0.17) 13.13 19.47 0.83 0.82 1.72 26 4512-31-2015 17.07 0.24 (0.75) (0.51) (0.14) (5.27) — (5.41) 11.15 (2.58) 0.82 0.82 1.63 22 2712-31-2014 15.83 0.16 1.21 1.37 (0.13) — — (0.13) 17.07 8.64 0.88 0.88 1.00 22 11312-31-2013 12.30 0.12 3.66 3.78 (0.10) (0.15) — (0.25) 15.83 30.86 0.86 0.85 0.84 24 312-31-2012 10.51 0.12 1.77 1.89 (0.10) — — (0.10) 12.30 18.03 0.86 0.86 1.04 18 261. Based on average daily shares outstanding. 2. Total returns would have been lower had certain expenses not been reduced during the applicable periods. 3. Six months ended 6-30-17.Unaudited. 4. Not annualized. 5. Annualized.
Fundamental All Cap Core TrustSERIES I06-30-20173 20.89 0.08 2.35 2.43 — — — — 23.32 11.694 0.765 0.755 0.695 158 2512-31-2016 22.30 0.15 1.58 1.73 (0.12) (3.02) — (3.14) 20.89 8.34 0.75 0.75 0.73 146 2612-31-2015 22.53 0.07 0.80 0.87 — (1.10) — (1.10) 22.30 4.01 0.76 0.75 0.30 168 4912-31-2014 20.61 0.066 1.95 2.01 (0.09) — — (0.09) 22.53 9.74 0.76 0.75 0.286 156 4612-31-2013 15.30 0.11 5.37 5.48 (0.17) — — (0.17) 20.61 35.88 0.76 0.76 0.60 159 4112-31-2012 12.48 0.16 2.77 2.93 (0.11) — — (0.11) 15.30 23.52 0.76 0.76 1.17 131 38
SERIES II06-30-20173 20.84 0.05 2.36 2.41 — — — — 23.25 11.564 0.965 0.955 0.505 50 2512-31-2016 22.23 0.11 1.56 1.67 (0.04) (3.02) — (3.06) 20.84 8.12 0.95 0.95 0.53 49 2612-31-2015 22.50 0.02 0.81 0.83 — (1.10) — (1.10) 22.23 3.83 0.96 0.95 0.10 52 4912-31-2014 20.58 0.026 1.95 1.97 (0.05) — — (0.05) 22.50 9.56 0.96 0.95 0.086 59 4612-31-2013 15.29 0.07 5.36 5.43 (0.14) — — (0.14) 20.58 35.55 0.96 0.96 0.40 69 4112-31-2012 12.47 0.14 2.76 2.90 (0.08) — — (0.08) 15.29 23.31 0.96 0.96 0.98 67 38
SERIES NAV06-30-20173 20.98 0.08 2.37 2.45 — — — — 23.43 11.684 0.715 0.705 0.755 1,509 2512-31-2016 22.40 0.16 1.58 1.74 (0.14) (3.02) — (3.16) 20.98 8.40 0.71 0.70 0.78 1,403 2612-31-2015 22.61 0.08 0.81 0.89 — (1.10) — (1.10) 22.40 4.09 0.71 0.70 0.35 1,406 4912-31-2014 20.68 0.076 1.96 2.03 (0.10) — — (0.10) 22.61 9.81 0.71 0.70 0.336 1,449 4612-31-2013 15.36 0.11 5.39 5.50 (0.18) — — (0.18) 20.68 35.86 0.71 0.71 0.64 1,433 4112-31-2012 12.52 0.17 2.79 2.96 (0.12) — — (0.12) 15.36 23.66 0.71 0.71 1.22 1,149 381. Based on average daily shares outstanding. 2. Total returns would have been lower had certain expenses not been reduced during the applicable periods. 3. Six months ended 6-30-17.Unaudited. 4. Not annualized. 5. Annualized. 6. Net investment income per share and the percentage of average net assets reflect special dividends received by the portfolio, whichamounted to $0.05 and 0.21% for all series.
John Hancock Variable Insurance TrustFinancial highlights
91The accompanying notes are an integral part of the financial statements.
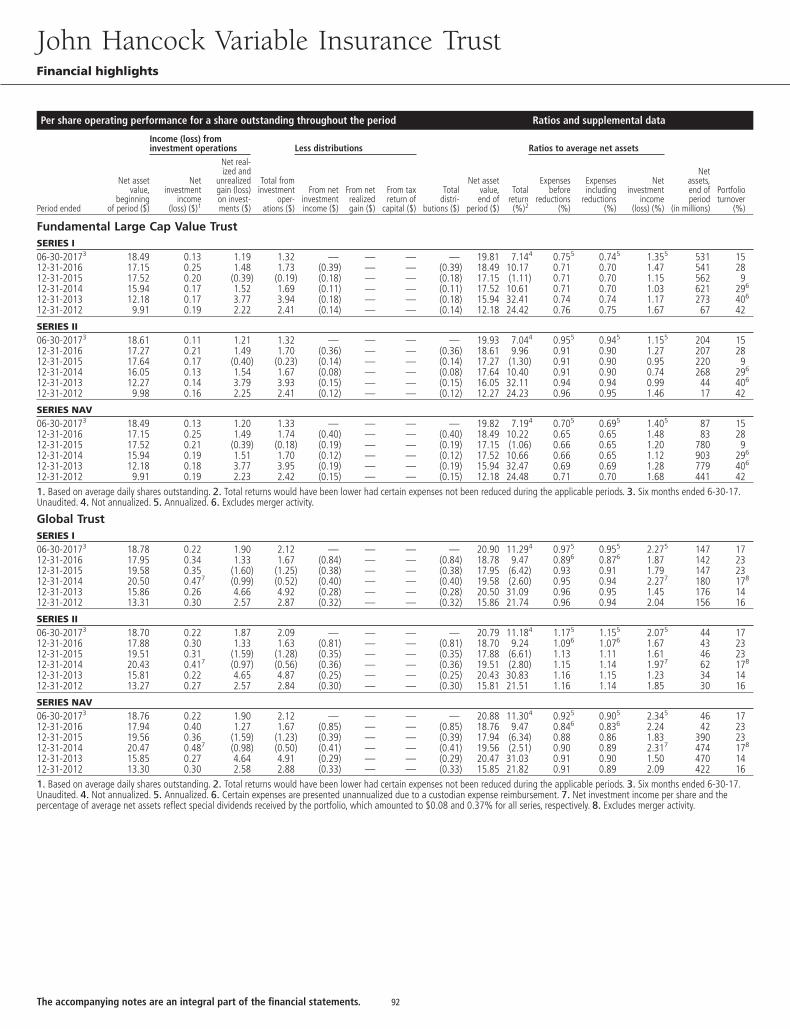
Per share operating performance for a share outstanding throughout the period Ratios and supplemental data
Income (loss) frominvestment operations Less distributions Ratios to average net assets
Period ended
Net assetvalue,
beginningof period ($)
Netinvestment
income(loss) ($)1
Net real-ized and
unrealizedgain (loss)on invest-ments ($)
Total frominvestment
oper-ations ($)
From netinvestmentincome ($)
From netrealizedgain ($)
From taxreturn of
capital ($)
Totaldistri-
butions ($)
Net assetvalue,end of
period ($)
Totalreturn(%)2
Expensesbefore
reductions(%)
Expensesincluding
reductions(%)
Netinvestment
income(loss) (%)
Netassets,end ofperiod
(in millions)
Portfolioturnover
(%)
Fundamental Large Cap Value TrustSERIES I06-30-20173 18.49 0.13 1.19 1.32 — — — — 19.81 7.144 0.755 0.745 1.355 531 1512-31-2016 17.15 0.25 1.48 1.73 (0.39) — — (0.39) 18.49 10.17 0.71 0.70 1.47 541 2812-31-2015 17.52 0.20 (0.39) (0.19) (0.18) — — (0.18) 17.15 (1.11) 0.71 0.70 1.15 562 912-31-2014 15.94 0.17 1.52 1.69 (0.11) — — (0.11) 17.52 10.61 0.71 0.70 1.03 621 296
12-31-2013 12.18 0.17 3.77 3.94 (0.18) — — (0.18) 15.94 32.41 0.74 0.74 1.17 273 406
12-31-2012 9.91 0.19 2.22 2.41 (0.14) — — (0.14) 12.18 24.42 0.76 0.75 1.67 67 42
SERIES II06-30-20173 18.61 0.11 1.21 1.32 — — — — 19.93 7.044 0.955 0.945 1.155 204 1512-31-2016 17.27 0.21 1.49 1.70 (0.36) — — (0.36) 18.61 9.96 0.91 0.90 1.27 207 2812-31-2015 17.64 0.17 (0.40) (0.23) (0.14) — — (0.14) 17.27 (1.30) 0.91 0.90 0.95 220 912-31-2014 16.05 0.13 1.54 1.67 (0.08) — — (0.08) 17.64 10.40 0.91 0.90 0.74 268 296
12-31-2013 12.27 0.14 3.79 3.93 (0.15) — — (0.15) 16.05 32.11 0.94 0.94 0.99 44 406
12-31-2012 9.98 0.16 2.25 2.41 (0.12) — — (0.12) 12.27 24.23 0.96 0.95 1.46 17 42
SERIES NAV06-30-20173 18.49 0.13 1.20 1.33 — — — — 19.82 7.194 0.705 0.695 1.405 87 1512-31-2016 17.15 0.25 1.49 1.74 (0.40) — — (0.40) 18.49 10.22 0.65 0.65 1.48 83 2812-31-2015 17.52 0.21 (0.39) (0.18) (0.19) — — (0.19) 17.15 (1.06) 0.66 0.65 1.20 780 912-31-2014 15.94 0.19 1.51 1.70 (0.12) — — (0.12) 17.52 10.66 0.66 0.65 1.12 903 296
12-31-2013 12.18 0.18 3.77 3.95 (0.19) — — (0.19) 15.94 32.47 0.69 0.69 1.28 779 406
12-31-2012 9.91 0.19 2.23 2.42 (0.15) — — (0.15) 12.18 24.48 0.71 0.70 1.68 441 421. Based on average daily shares outstanding. 2. Total returns would have been lower had certain expenses not been reduced during the applicable periods. 3. Six months ended 6-30-17.Unaudited. 4. Not annualized. 5. Annualized. 6. Excludes merger activity.
Global TrustSERIES I06-30-20173 18.78 0.22 1.90 2.12 — — — — 20.90 11.294 0.975 0.955 2.275 147 1712-31-2016 17.95 0.34 1.33 1.67 (0.84) — — (0.84) 18.78 9.47 0.896 0.876 1.87 142 2312-31-2015 19.58 0.35 (1.60) (1.25) (0.38) — — (0.38) 17.95 (6.42) 0.93 0.91 1.79 147 2312-31-2014 20.50 0.477 (0.99) (0.52) (0.40) — — (0.40) 19.58 (2.60) 0.95 0.94 2.277 180 178
12-31-2013 15.86 0.26 4.66 4.92 (0.28) — — (0.28) 20.50 31.09 0.96 0.95 1.45 176 1412-31-2012 13.31 0.30 2.57 2.87 (0.32) — — (0.32) 15.86 21.74 0.96 0.94 2.04 156 16
SERIES II06-30-20173 18.70 0.22 1.87 2.09 — — — — 20.79 11.184 1.175 1.155 2.075 44 1712-31-2016 17.88 0.30 1.33 1.63 (0.81) — — (0.81) 18.70 9.24 1.096 1.076 1.67 43 2312-31-2015 19.51 0.31 (1.59) (1.28) (0.35) — — (0.35) 17.88 (6.61) 1.13 1.11 1.61 46 2312-31-2014 20.43 0.417 (0.97) (0.56) (0.36) — — (0.36) 19.51 (2.80) 1.15 1.14 1.977 62 178
12-31-2013 15.81 0.22 4.65 4.87 (0.25) — — (0.25) 20.43 30.83 1.16 1.15 1.23 34 1412-31-2012 13.27 0.27 2.57 2.84 (0.30) — — (0.30) 15.81 21.51 1.16 1.14 1.85 30 16
SERIES NAV06-30-20173 18.76 0.22 1.90 2.12 — — — — 20.88 11.304 0.925 0.905 2.345 46 1712-31-2016 17.94 0.40 1.27 1.67 (0.85) — — (0.85) 18.76 9.47 0.846 0.836 2.24 42 2312-31-2015 19.56 0.36 (1.59) (1.23) (0.39) — — (0.39) 17.94 (6.34) 0.88 0.86 1.83 390 2312-31-2014 20.47 0.487 (0.98) (0.50) (0.41) — — (0.41) 19.56 (2.51) 0.90 0.89 2.317 474 178
12-31-2013 15.85 0.27 4.64 4.91 (0.29) — — (0.29) 20.47 31.03 0.91 0.90 1.50 470 1412-31-2012 13.30 0.30 2.58 2.88 (0.33) — — (0.33) 15.85 21.82 0.91 0.89 2.09 422 161. Based on average daily shares outstanding. 2. Total returns would have been lower had certain expenses not been reduced during the applicable periods. 3. Six months ended 6-30-17.Unaudited. 4. Not annualized. 5. Annualized. 6. Certain expenses are presented unannualized due to a custodian expense reimbursement. 7. Net investment income per share and thepercentage of average net assets reflect special dividends received by the portfolio, which amounted to $0.08 and 0.37% for all series, respectively. 8. Excludes merger activity.
John Hancock Variable Insurance TrustFinancial highlights
92The accompanying notes are an integral part of the financial statements.
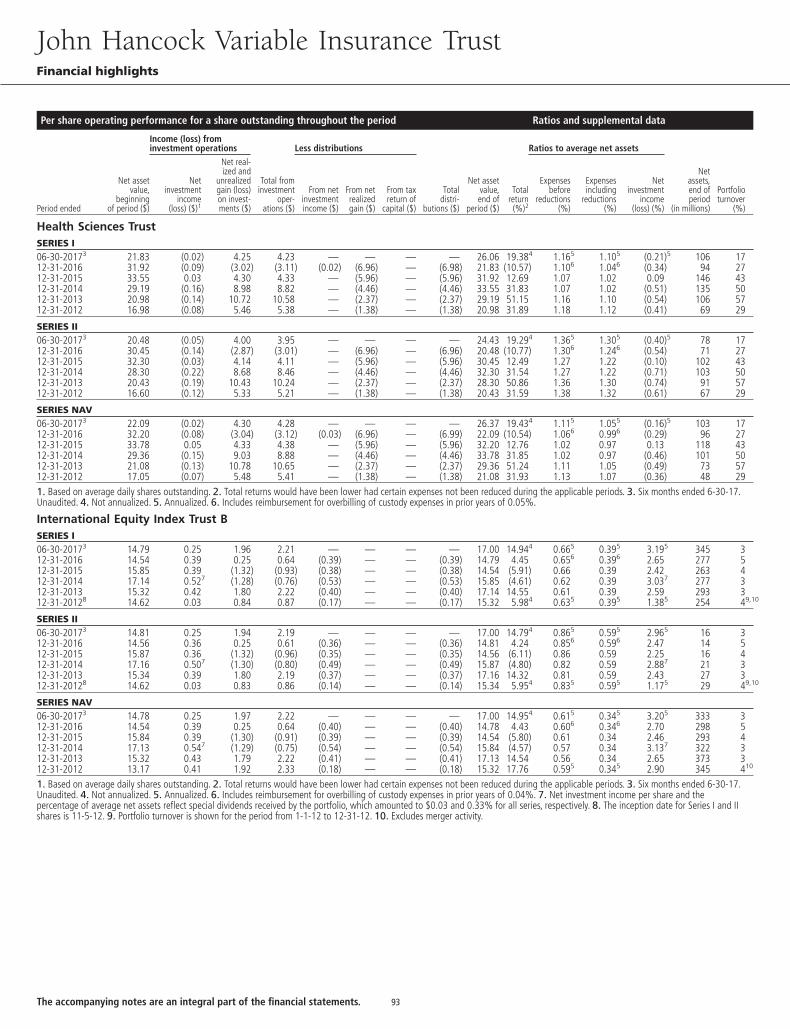
Per share operating performance for a share outstanding throughout the period Ratios and supplemental data
Income (loss) frominvestment operations Less distributions Ratios to average net assets
Period ended
Net assetvalue,
beginningof period ($)
Netinvestment
income(loss) ($)1
Net real-ized and
unrealizedgain (loss)on invest-ments ($)
Total frominvestment
oper-ations ($)
From netinvestmentincome ($)
From netrealizedgain ($)
From taxreturn of
capital ($)
Totaldistri-
butions ($)
Net assetvalue,end of
period ($)
Totalreturn(%)2
Expensesbefore
reductions(%)
Expensesincluding
reductions(%)
Netinvestment
income(loss) (%)
Netassets,end ofperiod
(in millions)
Portfolioturnover
(%)
Health Sciences TrustSERIES I06-30-20173 21.83 (0.02) 4.25 4.23 — — — — 26.06 19.384 1.165 1.105 (0.21)5 106 1712-31-2016 31.92 (0.09) (3.02) (3.11) (0.02) (6.96) — (6.98) 21.83 (10.57) 1.106 1.046 (0.34) 94 2712-31-2015 33.55 0.03 4.30 4.33 — (5.96) — (5.96) 31.92 12.69 1.07 1.02 0.09 146 4312-31-2014 29.19 (0.16) 8.98 8.82 — (4.46) — (4.46) 33.55 31.83 1.07 1.02 (0.51) 135 5012-31-2013 20.98 (0.14) 10.72 10.58 — (2.37) — (2.37) 29.19 51.15 1.16 1.10 (0.54) 106 5712-31-2012 16.98 (0.08) 5.46 5.38 — (1.38) — (1.38) 20.98 31.89 1.18 1.12 (0.41) 69 29
SERIES II06-30-20173 20.48 (0.05) 4.00 3.95 — — — — 24.43 19.294 1.365 1.305 (0.40)5 78 1712-31-2016 30.45 (0.14) (2.87) (3.01) — (6.96) — (6.96) 20.48 (10.77) 1.306 1.246 (0.54) 71 2712-31-2015 32.30 (0.03) 4.14 4.11 — (5.96) — (5.96) 30.45 12.49 1.27 1.22 (0.10) 102 4312-31-2014 28.30 (0.22) 8.68 8.46 — (4.46) — (4.46) 32.30 31.54 1.27 1.22 (0.71) 103 5012-31-2013 20.43 (0.19) 10.43 10.24 — (2.37) — (2.37) 28.30 50.86 1.36 1.30 (0.74) 91 5712-31-2012 16.60 (0.12) 5.33 5.21 — (1.38) — (1.38) 20.43 31.59 1.38 1.32 (0.61) 67 29
SERIES NAV06-30-20173 22.09 (0.02) 4.30 4.28 — — — — 26.37 19.434 1.115 1.055 (0.16)5 103 1712-31-2016 32.20 (0.08) (3.04) (3.12) (0.03) (6.96) — (6.99) 22.09 (10.54) 1.066 0.996 (0.29) 96 2712-31-2015 33.78 0.05 4.33 4.38 — (5.96) — (5.96) 32.20 12.76 1.02 0.97 0.13 118 4312-31-2014 29.36 (0.15) 9.03 8.88 — (4.46) — (4.46) 33.78 31.85 1.02 0.97 (0.46) 101 5012-31-2013 21.08 (0.13) 10.78 10.65 — (2.37) — (2.37) 29.36 51.24 1.11 1.05 (0.49) 73 5712-31-2012 17.05 (0.07) 5.48 5.41 — (1.38) — (1.38) 21.08 31.93 1.13 1.07 (0.36) 48 291. Based on average daily shares outstanding. 2. Total returns would have been lower had certain expenses not been reduced during the applicable periods. 3. Six months ended 6-30-17.Unaudited. 4. Not annualized. 5. Annualized. 6. Includes reimbursement for overbilling of custody expenses in prior years of 0.05%.
International Equity Index Trust BSERIES I06-30-20173 14.79 0.25 1.96 2.21 — — — — 17.00 14.944 0.665 0.395 3.195 345 312-31-2016 14.54 0.39 0.25 0.64 (0.39) — — (0.39) 14.79 4.45 0.656 0.396 2.65 277 512-31-2015 15.85 0.39 (1.32) (0.93) (0.38) — — (0.38) 14.54 (5.91) 0.66 0.39 2.42 263 412-31-2014 17.14 0.527 (1.28) (0.76) (0.53) — — (0.53) 15.85 (4.61) 0.62 0.39 3.037 277 312-31-2013 15.32 0.42 1.80 2.22 (0.40) — — (0.40) 17.14 14.55 0.61 0.39 2.59 293 312-31-20128 14.62 0.03 0.84 0.87 (0.17) — — (0.17) 15.32 5.984 0.635 0.395 1.385 254 49,10
SERIES II06-30-20173 14.81 0.25 1.94 2.19 — — — — 17.00 14.794 0.865 0.595 2.965 16 312-31-2016 14.56 0.36 0.25 0.61 (0.36) — — (0.36) 14.81 4.24 0.856 0.596 2.47 14 512-31-2015 15.87 0.36 (1.32) (0.96) (0.35) — — (0.35) 14.56 (6.11) 0.86 0.59 2.25 16 412-31-2014 17.16 0.507 (1.30) (0.80) (0.49) — — (0.49) 15.87 (4.80) 0.82 0.59 2.887 21 312-31-2013 15.34 0.39 1.80 2.19 (0.37) — — (0.37) 17.16 14.32 0.81 0.59 2.43 27 312-31-20128 14.62 0.03 0.83 0.86 (0.14) — — (0.14) 15.34 5.954 0.835 0.595 1.175 29 49,10
SERIES NAV06-30-20173 14.78 0.25 1.97 2.22 — — — — 17.00 14.954 0.615 0.345 3.205 333 312-31-2016 14.54 0.39 0.25 0.64 (0.40) — — (0.40) 14.78 4.43 0.606 0.346 2.70 298 512-31-2015 15.84 0.39 (1.30) (0.91) (0.39) — — (0.39) 14.54 (5.80) 0.61 0.34 2.46 293 412-31-2014 17.13 0.547 (1.29) (0.75) (0.54) — — (0.54) 15.84 (4.57) 0.57 0.34 3.137 322 312-31-2013 15.32 0.43 1.79 2.22 (0.41) — — (0.41) 17.13 14.54 0.56 0.34 2.65 373 312-31-2012 13.17 0.41 1.92 2.33 (0.18) — — (0.18) 15.32 17.76 0.595 0.345 2.90 345 410
1. Based on average daily shares outstanding. 2. Total returns would have been lower had certain expenses not been reduced during the applicable periods. 3. Six months ended 6-30-17.Unaudited. 4. Not annualized. 5. Annualized. 6. Includes reimbursement for overbilling of custody expenses in prior years of 0.04%. 7. Net investment income per share and thepercentage of average net assets reflect special dividends received by the portfolio, which amounted to $0.03 and 0.33% for all series, respectively. 8. The inception date for Series I and IIshares is 11-5-12. 9. Portfolio turnover is shown for the period from 1-1-12 to 12-31-12. 10. Excludes merger activity.
John Hancock Variable Insurance TrustFinancial highlights
93The accompanying notes are an integral part of the financial statements.
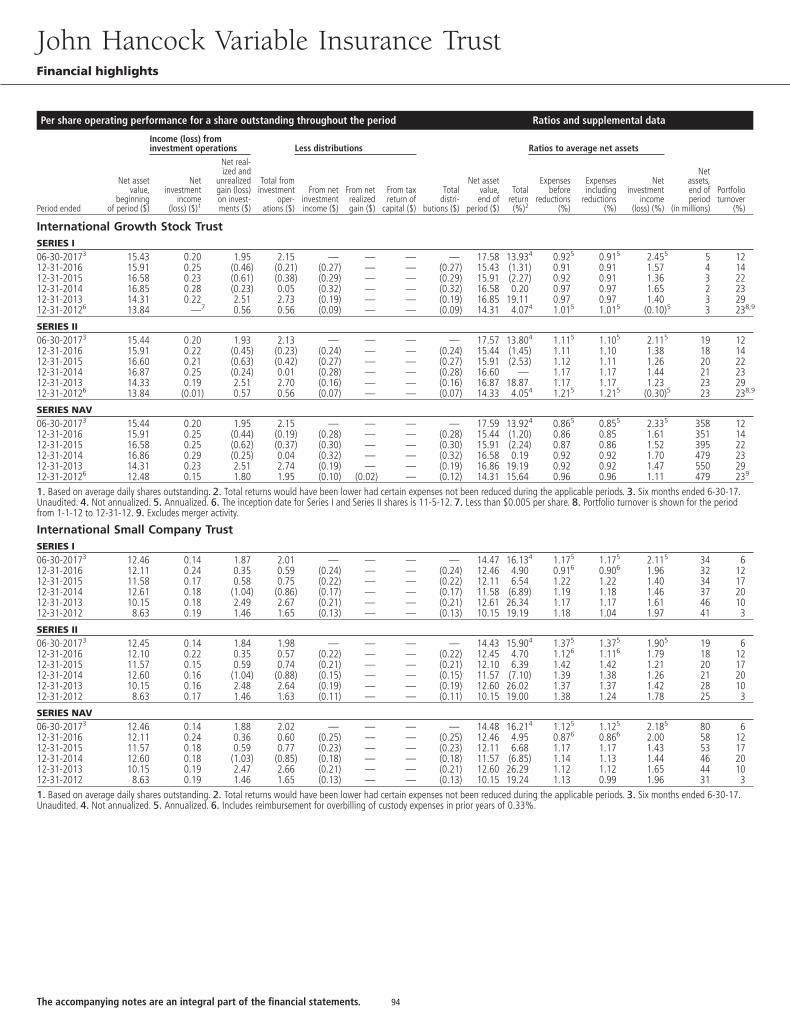
Per share operating performance for a share outstanding throughout the period Ratios and supplemental data
Income (loss) frominvestment operations Less distributions Ratios to average net assets
Period ended
Net assetvalue,
beginningof period ($)
Netinvestment
income(loss) ($)1
Net real-ized and
unrealizedgain (loss)on invest-ments ($)
Total frominvestment
oper-ations ($)
From netinvestmentincome ($)
From netrealizedgain ($)
From taxreturn of
capital ($)
Totaldistri-
butions ($)
Net assetvalue,end of
period ($)
Totalreturn(%)2
Expensesbefore
reductions(%)
Expensesincluding
reductions(%)
Netinvestment
income(loss) (%)
Netassets,end ofperiod
(in millions)
Portfolioturnover
(%)
International Growth Stock TrustSERIES I06-30-20173 15.43 0.20 1.95 2.15 — — — — 17.58 13.934 0.925 0.915 2.455 5 1212-31-2016 15.91 0.25 (0.46) (0.21) (0.27) — — (0.27) 15.43 (1.31) 0.91 0.91 1.57 4 1412-31-2015 16.58 0.23 (0.61) (0.38) (0.29) — — (0.29) 15.91 (2.27) 0.92 0.91 1.36 3 2212-31-2014 16.85 0.28 (0.23) 0.05 (0.32) — — (0.32) 16.58 0.20 0.97 0.97 1.65 2 2312-31-2013 14.31 0.22 2.51 2.73 (0.19) — — (0.19) 16.85 19.11 0.97 0.97 1.40 3 2912-31-20126 13.84 —7 0.56 0.56 (0.09) — — (0.09) 14.31 4.074 1.015 1.015 (0.10)5 3 238,9
SERIES II06-30-20173 15.44 0.20 1.93 2.13 — — — — 17.57 13.804 1.115 1.105 2.115 19 1212-31-2016 15.91 0.22 (0.45) (0.23) (0.24) — — (0.24) 15.44 (1.45) 1.11 1.10 1.38 18 1412-31-2015 16.60 0.21 (0.63) (0.42) (0.27) — — (0.27) 15.91 (2.53) 1.12 1.11 1.26 20 2212-31-2014 16.87 0.25 (0.24) 0.01 (0.28) — — (0.28) 16.60 — 1.17 1.17 1.44 21 2312-31-2013 14.33 0.19 2.51 2.70 (0.16) — — (0.16) 16.87 18.87 1.17 1.17 1.23 23 2912-31-20126 13.84 (0.01) 0.57 0.56 (0.07) — — (0.07) 14.33 4.054 1.215 1.215 (0.30)5 23 238,9
SERIES NAV06-30-20173 15.44 0.20 1.95 2.15 — — — — 17.59 13.924 0.865 0.855 2.335 358 1212-31-2016 15.91 0.25 (0.44) (0.19) (0.28) — — (0.28) 15.44 (1.20) 0.86 0.85 1.61 351 1412-31-2015 16.58 0.25 (0.62) (0.37) (0.30) — — (0.30) 15.91 (2.24) 0.87 0.86 1.52 395 2212-31-2014 16.86 0.29 (0.25) 0.04 (0.32) — — (0.32) 16.58 0.19 0.92 0.92 1.70 479 2312-31-2013 14.31 0.23 2.51 2.74 (0.19) — — (0.19) 16.86 19.19 0.92 0.92 1.47 550 2912-31-20126 12.48 0.15 1.80 1.95 (0.10) (0.02) — (0.12) 14.31 15.64 0.96 0.96 1.11 479 239
1. Based on average daily shares outstanding. 2. Total returns would have been lower had certain expenses not been reduced during the applicable periods. 3. Six months ended 6-30-17.Unaudited. 4. Not annualized. 5. Annualized. 6. The inception date for Series I and Series II shares is 11-5-12. 7. Less than $0.005 per share. 8. Portfolio turnover is shown for the periodfrom 1-1-12 to 12-31-12. 9. Excludes merger activity.
International Small Company TrustSERIES I06-30-20173 12.46 0.14 1.87 2.01 — — — — 14.47 16.134 1.175 1.175 2.115 34 612-31-2016 12.11 0.24 0.35 0.59 (0.24) — — (0.24) 12.46 4.90 0.916 0.906 1.96 32 1212-31-2015 11.58 0.17 0.58 0.75 (0.22) — — (0.22) 12.11 6.54 1.22 1.22 1.40 34 1712-31-2014 12.61 0.18 (1.04) (0.86) (0.17) — — (0.17) 11.58 (6.89) 1.19 1.18 1.46 37 2012-31-2013 10.15 0.18 2.49 2.67 (0.21) — — (0.21) 12.61 26.34 1.17 1.17 1.61 46 1012-31-2012 8.63 0.19 1.46 1.65 (0.13) — — (0.13) 10.15 19.19 1.18 1.04 1.97 41 3
SERIES II06-30-20173 12.45 0.14 1.84 1.98 — — — — 14.43 15.904 1.375 1.375 1.905 19 612-31-2016 12.10 0.22 0.35 0.57 (0.22) — — (0.22) 12.45 4.70 1.126 1.116 1.79 18 1212-31-2015 11.57 0.15 0.59 0.74 (0.21) — — (0.21) 12.10 6.39 1.42 1.42 1.21 20 1712-31-2014 12.60 0.16 (1.04) (0.88) (0.15) — — (0.15) 11.57 (7.10) 1.39 1.38 1.26 21 2012-31-2013 10.15 0.16 2.48 2.64 (0.19) — — (0.19) 12.60 26.02 1.37 1.37 1.42 28 1012-31-2012 8.63 0.17 1.46 1.63 (0.11) — — (0.11) 10.15 19.00 1.38 1.24 1.78 25 3
SERIES NAV06-30-20173 12.46 0.14 1.88 2.02 — — — — 14.48 16.214 1.125 1.125 2.185 80 612-31-2016 12.11 0.24 0.36 0.60 (0.25) — — (0.25) 12.46 4.95 0.876 0.866 2.00 58 1212-31-2015 11.57 0.18 0.59 0.77 (0.23) — — (0.23) 12.11 6.68 1.17 1.17 1.43 53 1712-31-2014 12.60 0.18 (1.03) (0.85) (0.18) — — (0.18) 11.57 (6.85) 1.14 1.13 1.44 46 2012-31-2013 10.15 0.19 2.47 2.66 (0.21) — — (0.21) 12.60 26.29 1.12 1.12 1.65 44 1012-31-2012 8.63 0.19 1.46 1.65 (0.13) — — (0.13) 10.15 19.24 1.13 0.99 1.96 31 31. Based on average daily shares outstanding. 2. Total returns would have been lower had certain expenses not been reduced during the applicable periods. 3. Six months ended 6-30-17.Unaudited. 4. Not annualized. 5. Annualized. 6. Includes reimbursement for overbilling of custody expenses in prior years of 0.33%.
John Hancock Variable Insurance TrustFinancial highlights
94The accompanying notes are an integral part of the financial statements.
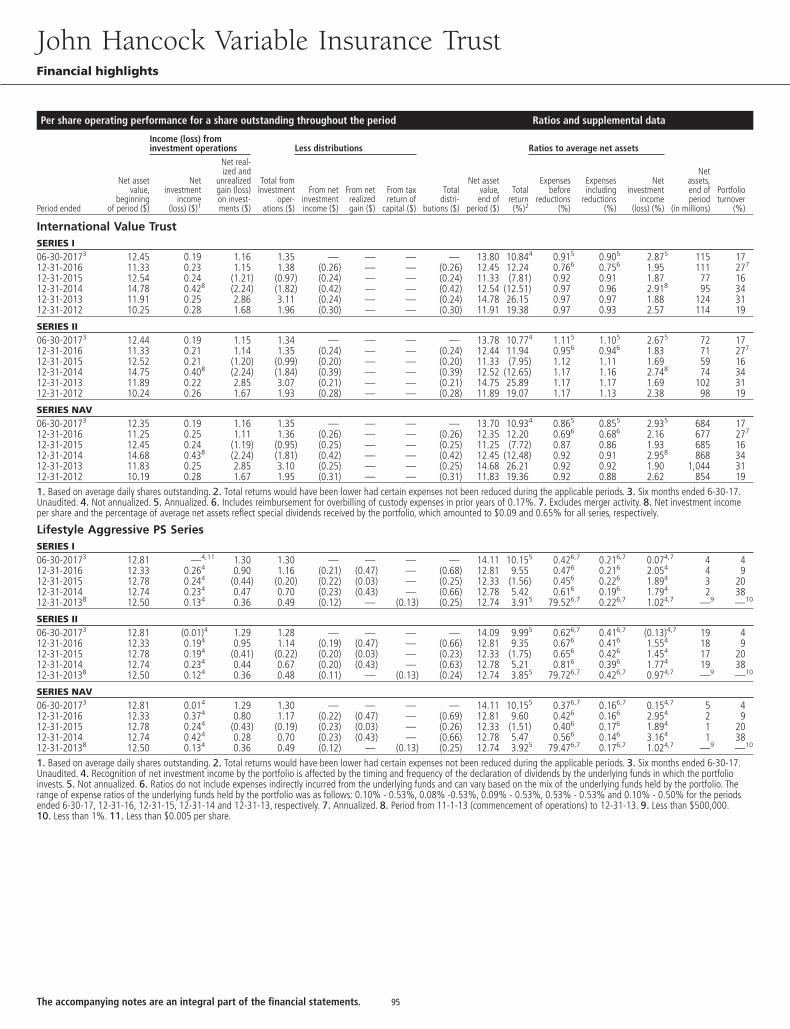
Per share operating performance for a share outstanding throughout the period Ratios and supplemental data
Income (loss) frominvestment operations Less distributions Ratios to average net assets
Period ended
Net assetvalue,
beginningof period ($)
Netinvestment
income(loss) ($)1
Net real-ized and
unrealizedgain (loss)on invest-ments ($)
Total frominvestment
oper-ations ($)
From netinvestmentincome ($)
From netrealizedgain ($)
From taxreturn of
capital ($)
Totaldistri-
butions ($)
Net assetvalue,end of
period ($)
Totalreturn(%)2
Expensesbefore
reductions(%)
Expensesincluding
reductions(%)
Netinvestment
income(loss) (%)
Netassets,end ofperiod
(in millions)
Portfolioturnover
(%)
International Value TrustSERIES I06-30-20173 12.45 0.19 1.16 1.35 — — — — 13.80 10.844 0.915 0.905 2.875 115 1712-31-2016 11.33 0.23 1.15 1.38 (0.26) — — (0.26) 12.45 12.24 0.766 0.756 1.95 111 277
12-31-2015 12.54 0.24 (1.21) (0.97) (0.24) — — (0.24) 11.33 (7.81) 0.92 0.91 1.87 77 1612-31-2014 14.78 0.428 (2.24) (1.82) (0.42) — — (0.42) 12.54 (12.51) 0.97 0.96 2.918 95 3412-31-2013 11.91 0.25 2.86 3.11 (0.24) — — (0.24) 14.78 26.15 0.97 0.97 1.88 124 3112-31-2012 10.25 0.28 1.68 1.96 (0.30) — — (0.30) 11.91 19.38 0.97 0.93 2.57 114 19
SERIES II06-30-20173 12.44 0.19 1.15 1.34 — — — — 13.78 10.774 1.115 1.105 2.675 72 1712-31-2016 11.33 0.21 1.14 1.35 (0.24) — — (0.24) 12.44 11.94 0.956 0.946 1.83 71 277
12-31-2015 12.52 0.21 (1.20) (0.99) (0.20) — — (0.20) 11.33 (7.95) 1.12 1.11 1.69 59 1612-31-2014 14.75 0.408 (2.24) (1.84) (0.39) — — (0.39) 12.52 (12.65) 1.17 1.16 2.748 74 3412-31-2013 11.89 0.22 2.85 3.07 (0.21) — — (0.21) 14.75 25.89 1.17 1.17 1.69 102 3112-31-2012 10.24 0.26 1.67 1.93 (0.28) — — (0.28) 11.89 19.07 1.17 1.13 2.38 98 19
SERIES NAV06-30-20173 12.35 0.19 1.16 1.35 — — — — 13.70 10.934 0.865 0.855 2.935 684 1712-31-2016 11.25 0.25 1.11 1.36 (0.26) — — (0.26) 12.35 12.20 0.696 0.686 2.16 677 277
12-31-2015 12.45 0.24 (1.19) (0.95) (0.25) — — (0.25) 11.25 (7.72) 0.87 0.86 1.93 685 1612-31-2014 14.68 0.438 (2.24) (1.81) (0.42) — — (0.42) 12.45 (12.48) 0.92 0.91 2.958 868 3412-31-2013 11.83 0.25 2.85 3.10 (0.25) — — (0.25) 14.68 26.21 0.92 0.92 1.90 1,044 3112-31-2012 10.19 0.28 1.67 1.95 (0.31) — — (0.31) 11.83 19.36 0.92 0.88 2.62 854 191. Based on average daily shares outstanding. 2. Total returns would have been lower had certain expenses not been reduced during the applicable periods. 3. Six months ended 6-30-17.Unaudited. 4. Not annualized. 5. Annualized. 6. Includes reimbursement for overbilling of custody expenses in prior years of 0.17%. 7. Excludes merger activity. 8. Net investment incomeper share and the percentage of average net assets reflect special dividends received by the portfolio, which amounted to $0.09 and 0.65% for all series, respectively.
Lifestyle Aggressive PS SeriesSERIES I06-30-20173 12.81 —4,11 1.30 1.30 — — — — 14.11 10.155 0.426,7 0.216,7 0.074,7 4 412-31-2016 12.33 0.264 0.90 1.16 (0.21) (0.47) — (0.68) 12.81 9.55 0.476 0.216 2.054 4 912-31-2015 12.78 0.244 (0.44) (0.20) (0.22) (0.03) — (0.25) 12.33 (1.56) 0.456 0.226 1.894 3 2012-31-2014 12.74 0.234 0.47 0.70 (0.23) (0.43) — (0.66) 12.78 5.42 0.616 0.196 1.794 2 3812-31-20138 12.50 0.134 0.36 0.49 (0.12) — (0.13) (0.25) 12.74 3.915 79.526,7 0.226,7 1.024,7 —9 —10
SERIES II06-30-20173 12.81 (0.01)4 1.29 1.28 — — — — 14.09 9.995 0.626,7 0.416,7 (0.13)4,7 19 412-31-2016 12.33 0.194 0.95 1.14 (0.19) (0.47) — (0.66) 12.81 9.35 0.676 0.416 1.554 18 912-31-2015 12.78 0.194 (0.41) (0.22) (0.20) (0.03) — (0.23) 12.33 (1.75) 0.656 0.426 1.454 17 2012-31-2014 12.74 0.234 0.44 0.67 (0.20) (0.43) — (0.63) 12.78 5.21 0.816 0.396 1.774 19 3812-31-20138 12.50 0.124 0.36 0.48 (0.11) — (0.13) (0.24) 12.74 3.855 79.726,7 0.426,7 0.974,7 —9 —10
SERIES NAV06-30-20173 12.81 0.014 1.29 1.30 — — — — 14.11 10.155 0.376,7 0.166,7 0.154,7 5 412-31-2016 12.33 0.374 0.80 1.17 (0.22) (0.47) — (0.69) 12.81 9.60 0.426 0.166 2.954 2 912-31-2015 12.78 0.244 (0.43) (0.19) (0.23) (0.03) — (0.26) 12.33 (1.51) 0.406 0.176 1.894 1 2012-31-2014 12.74 0.424 0.28 0.70 (0.23) (0.43) — (0.66) 12.78 5.47 0.566 0.146 3.164 1 3812-31-20138 12.50 0.134 0.36 0.49 (0.12) — (0.13) (0.25) 12.74 3.925 79.476,7 0.176,7 1.024,7 —9 —10
1. Based on average daily shares outstanding. 2. Total returns would have been lower had certain expenses not been reduced during the applicable periods. 3. Six months ended 6-30-17.Unaudited. 4. Recognition of net investment income by the portfolio is affected by the timing and frequency of the declaration of dividends by the underlying funds in which the portfolioinvests. 5. Not annualized. 6. Ratios do not include expenses indirectly incurred from the underlying funds and can vary based on the mix of the underlying funds held by the portfolio. Therange of expense ratios of the underlying funds held by the portfolio was as follows: 0.10% - 0.53%, 0.08% -0.53%, 0.09% - 0.53%, 0.53% - 0.53% and 0.10% - 0.50% for the periodsended 6-30-17, 12-31-16, 12-31-15, 12-31-14 and 12-31-13, respectively. 7. Annualized. 8. Period from 11-1-13 (commencement of operations) to 12-31-13. 9. Less than $500,000.10. Less than 1%. 11. Less than $0.005 per share.
John Hancock Variable Insurance TrustFinancial highlights
95The accompanying notes are an integral part of the financial statements.

Per share operating performance for a share outstanding throughout the period Ratios and supplemental data
Income (loss) frominvestment operations Less distributions Ratios to average net assets
Period ended
Net assetvalue,
beginningof period ($)
Netinvestment
income(loss) ($)1
Net real-ized and
unrealizedgain (loss)on invest-ments ($)
Total frominvestment
oper-ations ($)
From netinvestmentincome ($)
From netrealizedgain ($)
From taxreturn of
capital ($)
Totaldistri-
butions ($)
Net assetvalue,end of
period ($)
Totalreturn(%)2
Expensesbefore
reductions(%)
Expensesincluding
reductions(%)
Netinvestment
income(loss) (%)
Netassets,end ofperiod
(in millions)
Portfolioturnover
(%)
Lifestyle Balanced PS SeriesSERIES I06-30-20173 13.78 (0.01)4 0.89 0.88 — — — — 14.66 6.395 0.126,7 0.126,7 (0.12)4,6 30 212-31-2016 13.59 0.324 0.51 0.83 (0.31) (0.33) — (0.64) 13.78 6.11 0.127 0.117 2.314 31 1112-31-2015 14.18 0.344 (0.34) —8 (0.33) (0.26) — (0.59) 13.59 0.05 0.127 0.117 2.354 30 912-31-2014 13.95 0.424 0.41 0.83 (0.34) (0.26) — (0.60) 14.18 5.96 0.127 0.117 2.954 28 2712-31-20139 13.99 0.164 0.09 0.25 (0.26) (0.03) — (0.29) 13.95 1.775 0.146,7 0.126,7 1.124,5 —10 3711
SERIES II06-30-20173 13.80 (0.02)4 0.89 0.87 — — — — 14.67 6.305 0.326,7 0.326,7 (0.32)4,6 931 212-31-2016 13.61 0.294 0.52 0.81 (0.29) (0.33) — (0.62) 13.80 5.89 0.327 0.317 2.064 909 1112-31-2015 14.21 0.304 (0.33) (0.03) (0.31) (0.26) — (0.57) 13.61 (0.22) 0.327 0.317 2.114 901 912-31-2014 13.98 0.354 0.45 0.80 (0.31) (0.26) — (0.57) 14.21 5.74 0.327 0.317 2.484 932 2712-31-2013 12.92 0.254 1.38 1.63 (0.23) (0.34) — (0.57) 13.98 12.68 0.357 0.347 1.794 213 3712-31-2012 11.80 0.134 1.11 1.24 (0.10) (0.02) — (0.12) 12.92 10.54 0.407,12 0.407 1.064 170 31
SERIES NAV06-30-20173 13.77 —4,8 0.88 0.88 — — — — 14.65 6.395 0.076,7 0.076,7 (0.07)4,6 73 212-31-2016 13.58 0.364 0.48 0.84 (0.32) (0.33) — (0.65) 13.77 6.16 0.077 0.067 2.584 63 1112-31-2015 14.17 0.394 (0.38) 0.01 (0.34) (0.26) — (0.60) 13.58 0.10 0.077 0.067 2.764 44 912-31-2014 13.95 0.474 0.36 0.83 (0.35) (0.26) — (0.61) 14.17 5.94 0.077 0.067 3.314 30 2712-31-20139 13.99 0.214 0.04 0.25 (0.26) (0.03) — (0.29) 13.95 1.825 0.106,7 0.086,7 1.494,5 —10 3711
1. Based on average daily shares outstanding. 2. Total returns would have been lower had certain expenses not been reduced during the applicable periods. 3. Six months ended 6-30-17.Unaudited. 4. Recognition of net investment income by the portfolio is affected by the timing and frequency of the declaration of dividends by the underlying funds in which the portfolioinvests. 5. Not annualized. 6. Annualized. 7. Ratios do not include expenses indirectly incurred from the underlying funds and can vary based on the mix of the underlying funds held by theportfolio. The range of expense ratios of the underlying funds held by the portfolio was as follows: 0.53% - 0.59%, 0.53% - 0.59%, 0.53% - 0.59%, 0.53% - 0.59%, 0.50%–0.63%, and0.49%–1.10% for the periods ended 6-30-17, 12-31-16, 12-31-15, 12-31-14, 12-31-13, and 12-31-12, respectively. 8. Less than $0.005 per share. 9. The inception date for Series I andSeries NAV shares is 11-1-13. 10. Less than $500,000. 11. Portfolio turnover is shown for the period from 1-1-13 to 12-31-13. 12. Expense ratio has been revised to conform with currentyear presentation of expense recapture and net expense reductions.
Lifestyle Conservative PS SeriesSERIES I06-30-20173 12.91 (0.01)4 0.53 0.52 — — — — 13.43 4.035 0.156,7 0.136,7 (0.13)4,7 10 512-31-2016 12.85 0.354 0.21 0.56 (0.36) (0.14) — (0.50) 12.91 4.39 0.146 0.136 2.654 9 1912-31-2015 13.33 0.394 (0.37) 0.02 (0.36) (0.14) — (0.50) 12.85 0.17 0.146 0.136 2.874 8 1712-31-2014 13.18 0.534 0.20 0.73 (0.38) (0.20) — (0.58) 13.33 5.55 0.156 0.136 3.964 8 5612-31-20138 13.48 0.234 (0.20) 0.03 (0.28) (0.05) — (0.33) 13.18 0.205 0.276,7 0.126,7 1.744,5 —9 2210
SERIES II06-30-20173 12.93 (0.02)4 0.53 0.51 — — — — 13.44 3.945 0.356,7 0.336,7 (0.33)4,7 174 512-31-2016 12.87 0.314 0.23 0.54 (0.34) (0.14) — (0.48) 12.93 4.17 0.346 0.336 2.374 178 1912-31-2015 13.35 0.334 (0.33) —11 (0.34) (0.14) — (0.48) 12.87 (0.03) 0.346 0.336 2.444 181 1712-31-2014 13.19 0.404 0.31 0.71 (0.35) (0.20) — (0.55) 13.35 5.41 0.356 0.336 2.994 188 5612-31-2013 13.15 0.234 0.28 0.51 (0.25) (0.22) — (0.47) 13.19 3.86 0.436 0.386 1.754 50 2212-31-2012 12.36 0.174 0.76 0.93 (0.14) —11 — (0.14) 13.15 7.53 0.456 0.406 1.344 59 16
SERIES NAV06-30-20173 12.90 (0.01)4 0.54 0.53 — — — — 13.43 4.115 0.106,7 0.086,7 (0.08)4,7 3 512-31-2016 12.85 0.614 (0.05) 0.56 (0.37) (0.14) — (0.51) 12.90 4.36 0.106 0.086 4.674 3 1912-31-2015 13.33 0.464 (0.43) 0.03 (0.37) (0.14) — (0.51) 12.85 0.22 0.096 0.086 3.444 1 1712-31-2014 13.17 0.604 0.15 0.75 (0.39) (0.20) — (0.59) 13.33 5.68 0.106 0.086 4.444 —9 5612-31-20138 13.48 0.234 (0.21) 0.02 (0.28) (0.05) — (0.33) 13.17 0.185 0.226,7 0.086,7 1.744,5 —9 2210
1. Based on average daily shares outstanding. 2. Total returns would have been lower had certain expenses not been reduced during the applicable periods. 3. Six months ended 6-30-17.Unaudited. 4. Recognition of net investment income by the portfolio is affected by the timing and frequency of the declaration of dividends by the underlying funds in which the portfolioinvests. 5. Not annualized. 6. Ratios do not include expenses indirectly incurred from the underlying funds and can vary based on the mix of the underlying funds held by the portfolio. Therange of expense ratios of the underlying funds held by the portfolio was as follows: 0.53% - 0.59%, 0.53% - 0.59%, 0.53% - 0.59%, 0.53% - 0.59%, 0.50%–0.63% and 0.49%–1.10%for the periods ended 6-30-17, 12-31-16, 12-31-15, 12-31-14, 12-31-13 and 12-31-12, respectively. 7. Annualized. 8. The inception date for Series I and Series NAV shares is 11-1-13.9. Less than $500,000. 10. Portfolio turnover is shown for the period from 1-1-13 to 12-31-13. 11. Less than $0.005 per share.
John Hancock Variable Insurance TrustFinancial highlights
96The accompanying notes are an integral part of the financial statements.
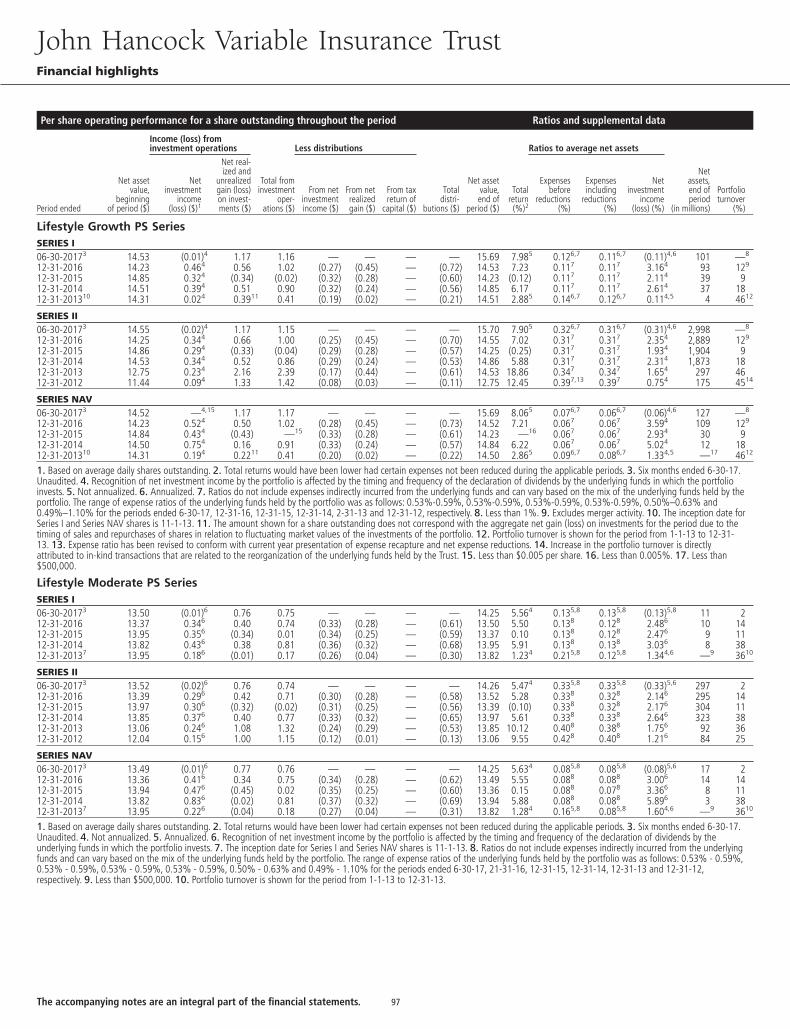
Per share operating performance for a share outstanding throughout the period Ratios and supplemental data
Income (loss) frominvestment operations Less distributions Ratios to average net assets
Period ended
Net assetvalue,
beginningof period ($)
Netinvestment
income(loss) ($)1
Net real-ized and
unrealizedgain (loss)on invest-ments ($)
Total frominvestment
oper-ations ($)
From netinvestmentincome ($)
From netrealizedgain ($)
From taxreturn of
capital ($)
Totaldistri-
butions ($)
Net assetvalue,end of
period ($)
Totalreturn(%)2
Expensesbefore
reductions(%)
Expensesincluding
reductions(%)
Netinvestment
income(loss) (%)
Netassets,end ofperiod
(in millions)
Portfolioturnover
(%)
Lifestyle Growth PS SeriesSERIES I06-30-20173 14.53 (0.01)4 1.17 1.16 — — — — 15.69 7.985 0.126,7 0.116,7 (0.11)4,6 101 —8
12-31-2016 14.23 0.464 0.56 1.02 (0.27) (0.45) — (0.72) 14.53 7.23 0.117 0.117 3.164 93 129
12-31-2015 14.85 0.324 (0.34) (0.02) (0.32) (0.28) — (0.60) 14.23 (0.12) 0.117 0.117 2.114 39 912-31-2014 14.51 0.394 0.51 0.90 (0.32) (0.24) — (0.56) 14.85 6.17 0.117 0.117 2.614 37 1812-31-201310 14.31 0.024 0.3911 0.41 (0.19) (0.02) — (0.21) 14.51 2.885 0.146,7 0.126,7 0.114,5 4 4612
SERIES II06-30-20173 14.55 (0.02)4 1.17 1.15 — — — — 15.70 7.905 0.326,7 0.316,7 (0.31)4,6 2,998 —8
12-31-2016 14.25 0.344 0.66 1.00 (0.25) (0.45) — (0.70) 14.55 7.02 0.317 0.317 2.354 2,889 129
12-31-2015 14.86 0.294 (0.33) (0.04) (0.29) (0.28) — (0.57) 14.25 (0.25) 0.317 0.317 1.934 1,904 912-31-2014 14.53 0.344 0.52 0.86 (0.29) (0.24) — (0.53) 14.86 5.88 0.317 0.317 2.314 1,873 1812-31-2013 12.75 0.234 2.16 2.39 (0.17) (0.44) — (0.61) 14.53 18.86 0.347 0.347 1.654 297 4612-31-2012 11.44 0.094 1.33 1.42 (0.08) (0.03) — (0.11) 12.75 12.45 0.397,13 0.397 0.754 175 4514
SERIES NAV06-30-20173 14.52 —4,15 1.17 1.17 — — — — 15.69 8.065 0.076,7 0.066,7 (0.06)4,6 127 —8
12-31-2016 14.23 0.524 0.50 1.02 (0.28) (0.45) — (0.73) 14.52 7.21 0.067 0.067 3.594 109 129
12-31-2015 14.84 0.434 (0.43) —15 (0.33) (0.28) — (0.61) 14.23 —16 0.067 0.067 2.934 30 912-31-2014 14.50 0.754 0.16 0.91 (0.33) (0.24) — (0.57) 14.84 6.22 0.067 0.067 5.024 12 1812-31-201310 14.31 0.194 0.2211 0.41 (0.20) (0.02) — (0.22) 14.50 2.865 0.096,7 0.086,7 1.334,5 —17 4612
1. Based on average daily shares outstanding. 2. Total returns would have been lower had certain expenses not been reduced during the applicable periods. 3. Six months ended 6-30-17.Unaudited. 4. Recognition of net investment income by the portfolio is affected by the timing and frequency of the declaration of dividends by the underlying funds in which the portfolioinvests. 5. Not annualized. 6. Annualized. 7. Ratios do not include expenses indirectly incurred from the underlying funds and can vary based on the mix of the underlying funds held by theportfolio. The range of expense ratios of the underlying funds held by the portfolio was as follows: 0.53%-0.59%, 0.53%-0.59%, 0.53%-0.59%, 0.53%-0.59%, 0.50%–0.63% and0.49%–1.10% for the periods ended 6-30-17, 12-31-16, 12-31-15, 12-31-14, 2-31-13 and 12-31-12, respectively. 8. Less than 1%. 9. Excludes merger activity. 10. The inception date forSeries I and Series NAV shares is 11-1-13. 11. The amount shown for a share outstanding does not correspond with the aggregate net gain (loss) on investments for the period due to thetiming of sales and repurchases of shares in relation to fluctuating market values of the investments of the portfolio. 12. Portfolio turnover is shown for the period from 1-1-13 to 12-31-13. 13. Expense ratio has been revised to conform with current year presentation of expense recapture and net expense reductions. 14. Increase in the portfolio turnover is directlyattributed to in-kind transactions that are related to the reorganization of the underlying funds held by the Trust. 15. Less than $0.005 per share. 16. Less than 0.005%. 17. Less than$500,000.
Lifestyle Moderate PS SeriesSERIES I06-30-20173 13.50 (0.01)6 0.76 0.75 — — — — 14.25 5.564 0.135,8 0.135,8 (0.13)5,8 11 212-31-2016 13.37 0.346 0.40 0.74 (0.33) (0.28) — (0.61) 13.50 5.50 0.138 0.128 2.486 10 1412-31-2015 13.95 0.356 (0.34) 0.01 (0.34) (0.25) — (0.59) 13.37 0.10 0.138 0.128 2.476 9 1112-31-2014 13.82 0.436 0.38 0.81 (0.36) (0.32) — (0.68) 13.95 5.91 0.138 0.138 3.036 8 3812-31-20137 13.95 0.186 (0.01) 0.17 (0.26) (0.04) — (0.30) 13.82 1.234 0.215,8 0.125,8 1.344,6 —9 3610
SERIES II06-30-20173 13.52 (0.02)6 0.76 0.74 — — — — 14.26 5.474 0.335,8 0.335,8 (0.33)5,6 297 212-31-2016 13.39 0.296 0.42 0.71 (0.30) (0.28) — (0.58) 13.52 5.28 0.338 0.328 2.146 295 1412-31-2015 13.97 0.306 (0.32) (0.02) (0.31) (0.25) — (0.56) 13.39 (0.10) 0.338 0.328 2.176 304 1112-31-2014 13.85 0.376 0.40 0.77 (0.33) (0.32) — (0.65) 13.97 5.61 0.338 0.338 2.646 323 3812-31-2013 13.06 0.246 1.08 1.32 (0.24) (0.29) — (0.53) 13.85 10.12 0.408 0.388 1.756 92 3612-31-2012 12.04 0.156 1.00 1.15 (0.12) (0.01) — (0.13) 13.06 9.55 0.428 0.408 1.216 84 25
SERIES NAV06-30-20173 13.49 (0.01)6 0.77 0.76 — — — — 14.25 5.634 0.085,8 0.085,8 (0.08)5,6 17 212-31-2016 13.36 0.416 0.34 0.75 (0.34) (0.28) — (0.62) 13.49 5.55 0.088 0.088 3.006 14 1412-31-2015 13.94 0.476 (0.45) 0.02 (0.35) (0.25) — (0.60) 13.36 0.15 0.088 0.078 3.366 8 1112-31-2014 13.82 0.836 (0.02) 0.81 (0.37) (0.32) — (0.69) 13.94 5.88 0.088 0.088 5.896 3 3812-31-20137 13.95 0.226 (0.04) 0.18 (0.27) (0.04) — (0.31) 13.82 1.284 0.165,8 0.085,8 1.604,6 —9 3610
1. Based on average daily shares outstanding. 2. Total returns would have been lower had certain expenses not been reduced during the applicable periods. 3. Six months ended 6-30-17.Unaudited. 4. Not annualized. 5. Annualized. 6. Recognition of net investment income by the portfolio is affected by the timing and frequency of the declaration of dividends by theunderlying funds in which the portfolio invests. 7. The inception date for Series I and Series NAV shares is 11-1-13. 8. Ratios do not include expenses indirectly incurred from the underlyingfunds and can vary based on the mix of the underlying funds held by the portfolio. The range of expense ratios of the underlying funds held by the portfolio was as follows: 0.53% - 0.59%,0.53% - 0.59%, 0.53% - 0.59%, 0.53% - 0.59%, 0.50% - 0.63% and 0.49% - 1.10% for the periods ended 6-30-17, 21-31-16, 12-31-15, 12-31-14, 12-31-13 and 12-31-12,respectively. 9. Less than $500,000. 10. Portfolio turnover is shown for the period from 1-1-13 to 12-31-13.
John Hancock Variable Insurance TrustFinancial highlights
97The accompanying notes are an integral part of the financial statements.
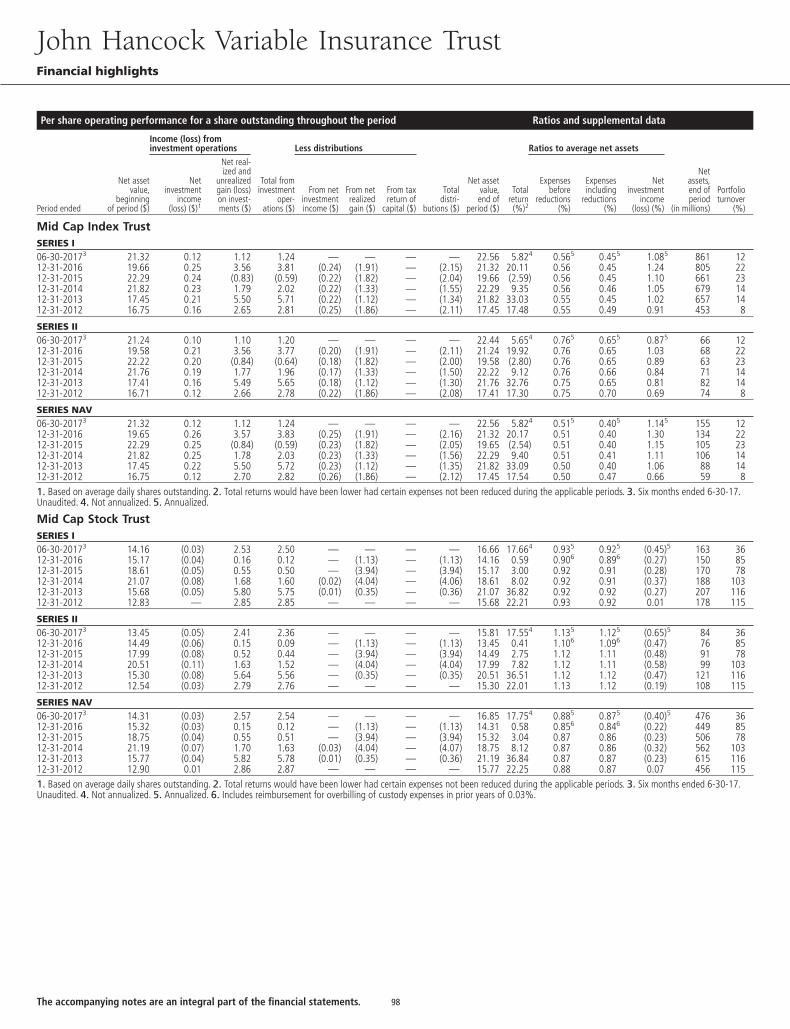
Per share operating performance for a share outstanding throughout the period Ratios and supplemental data
Income (loss) frominvestment operations Less distributions Ratios to average net assets
Period ended
Net assetvalue,
beginningof period ($)
Netinvestment
income(loss) ($)1
Net real-ized and
unrealizedgain (loss)on invest-ments ($)
Total frominvestment
oper-ations ($)
From netinvestmentincome ($)
From netrealizedgain ($)
From taxreturn of
capital ($)
Totaldistri-
butions ($)
Net assetvalue,end of
period ($)
Totalreturn(%)2
Expensesbefore
reductions(%)
Expensesincluding
reductions(%)
Netinvestment
income(loss) (%)
Netassets,end ofperiod
(in millions)
Portfolioturnover
(%)
Mid Cap Index TrustSERIES I06-30-20173 21.32 0.12 1.12 1.24 — — — — 22.56 5.824 0.565 0.455 1.085 861 1212-31-2016 19.66 0.25 3.56 3.81 (0.24) (1.91) — (2.15) 21.32 20.11 0.56 0.45 1.24 805 2212-31-2015 22.29 0.24 (0.83) (0.59) (0.22) (1.82) — (2.04) 19.66 (2.59) 0.56 0.45 1.10 661 2312-31-2014 21.82 0.23 1.79 2.02 (0.22) (1.33) — (1.55) 22.29 9.35 0.56 0.46 1.05 679 1412-31-2013 17.45 0.21 5.50 5.71 (0.22) (1.12) — (1.34) 21.82 33.03 0.55 0.45 1.02 657 1412-31-2012 16.75 0.16 2.65 2.81 (0.25) (1.86) — (2.11) 17.45 17.48 0.55 0.49 0.91 453 8
SERIES II06-30-20173 21.24 0.10 1.10 1.20 — — — — 22.44 5.654 0.765 0.655 0.875 66 1212-31-2016 19.58 0.21 3.56 3.77 (0.20) (1.91) — (2.11) 21.24 19.92 0.76 0.65 1.03 68 2212-31-2015 22.22 0.20 (0.84) (0.64) (0.18) (1.82) — (2.00) 19.58 (2.80) 0.76 0.65 0.89 63 2312-31-2014 21.76 0.19 1.77 1.96 (0.17) (1.33) — (1.50) 22.22 9.12 0.76 0.66 0.84 71 1412-31-2013 17.41 0.16 5.49 5.65 (0.18) (1.12) — (1.30) 21.76 32.76 0.75 0.65 0.81 82 1412-31-2012 16.71 0.12 2.66 2.78 (0.22) (1.86) — (2.08) 17.41 17.30 0.75 0.70 0.69 74 8
SERIES NAV06-30-20173 21.32 0.12 1.12 1.24 — — — — 22.56 5.824 0.515 0.405 1.145 155 1212-31-2016 19.65 0.26 3.57 3.83 (0.25) (1.91) — (2.16) 21.32 20.17 0.51 0.40 1.30 134 2212-31-2015 22.29 0.25 (0.84) (0.59) (0.23) (1.82) — (2.05) 19.65 (2.54) 0.51 0.40 1.15 105 2312-31-2014 21.82 0.25 1.78 2.03 (0.23) (1.33) — (1.56) 22.29 9.40 0.51 0.41 1.11 106 1412-31-2013 17.45 0.22 5.50 5.72 (0.23) (1.12) — (1.35) 21.82 33.09 0.50 0.40 1.06 88 1412-31-2012 16.75 0.12 2.70 2.82 (0.26) (1.86) — (2.12) 17.45 17.54 0.50 0.47 0.66 59 81. Based on average daily shares outstanding. 2. Total returns would have been lower had certain expenses not been reduced during the applicable periods. 3. Six months ended 6-30-17.Unaudited. 4. Not annualized. 5. Annualized.
Mid Cap Stock TrustSERIES I06-30-20173 14.16 (0.03) 2.53 2.50 — — — — 16.66 17.664 0.935 0.925 (0.45)5 163 3612-31-2016 15.17 (0.04) 0.16 0.12 — (1.13) — (1.13) 14.16 0.59 0.906 0.896 (0.27) 150 8512-31-2015 18.61 (0.05) 0.55 0.50 — (3.94) — (3.94) 15.17 3.00 0.92 0.91 (0.28) 170 7812-31-2014 21.07 (0.08) 1.68 1.60 (0.02) (4.04) — (4.06) 18.61 8.02 0.92 0.91 (0.37) 188 10312-31-2013 15.68 (0.05) 5.80 5.75 (0.01) (0.35) — (0.36) 21.07 36.82 0.92 0.92 (0.27) 207 11612-31-2012 12.83 — 2.85 2.85 — — — — 15.68 22.21 0.93 0.92 0.01 178 115
SERIES II06-30-20173 13.45 (0.05) 2.41 2.36 — — — — 15.81 17.554 1.135 1.125 (0.65)5 84 3612-31-2016 14.49 (0.06) 0.15 0.09 — (1.13) — (1.13) 13.45 0.41 1.106 1.096 (0.47) 76 8512-31-2015 17.99 (0.08) 0.52 0.44 — (3.94) — (3.94) 14.49 2.75 1.12 1.11 (0.48) 91 7812-31-2014 20.51 (0.11) 1.63 1.52 — (4.04) — (4.04) 17.99 7.82 1.12 1.11 (0.58) 99 10312-31-2013 15.30 (0.08) 5.64 5.56 — (0.35) — (0.35) 20.51 36.51 1.12 1.12 (0.47) 121 11612-31-2012 12.54 (0.03) 2.79 2.76 — — — — 15.30 22.01 1.13 1.12 (0.19) 108 115
SERIES NAV06-30-20173 14.31 (0.03) 2.57 2.54 — — — — 16.85 17.754 0.885 0.875 (0.40)5 476 3612-31-2016 15.32 (0.03) 0.15 0.12 — (1.13) — (1.13) 14.31 0.58 0.856 0.846 (0.22) 449 8512-31-2015 18.75 (0.04) 0.55 0.51 — (3.94) — (3.94) 15.32 3.04 0.87 0.86 (0.23) 506 7812-31-2014 21.19 (0.07) 1.70 1.63 (0.03) (4.04) — (4.07) 18.75 8.12 0.87 0.86 (0.32) 562 10312-31-2013 15.77 (0.04) 5.82 5.78 (0.01) (0.35) — (0.36) 21.19 36.84 0.87 0.87 (0.23) 615 11612-31-2012 12.90 0.01 2.86 2.87 — — — — 15.77 22.25 0.88 0.87 0.07 456 1151. Based on average daily shares outstanding. 2. Total returns would have been lower had certain expenses not been reduced during the applicable periods. 3. Six months ended 6-30-17.Unaudited. 4. Not annualized. 5. Annualized. 6. Includes reimbursement for overbilling of custody expenses in prior years of 0.03%.
John Hancock Variable Insurance TrustFinancial highlights
98The accompanying notes are an integral part of the financial statements.
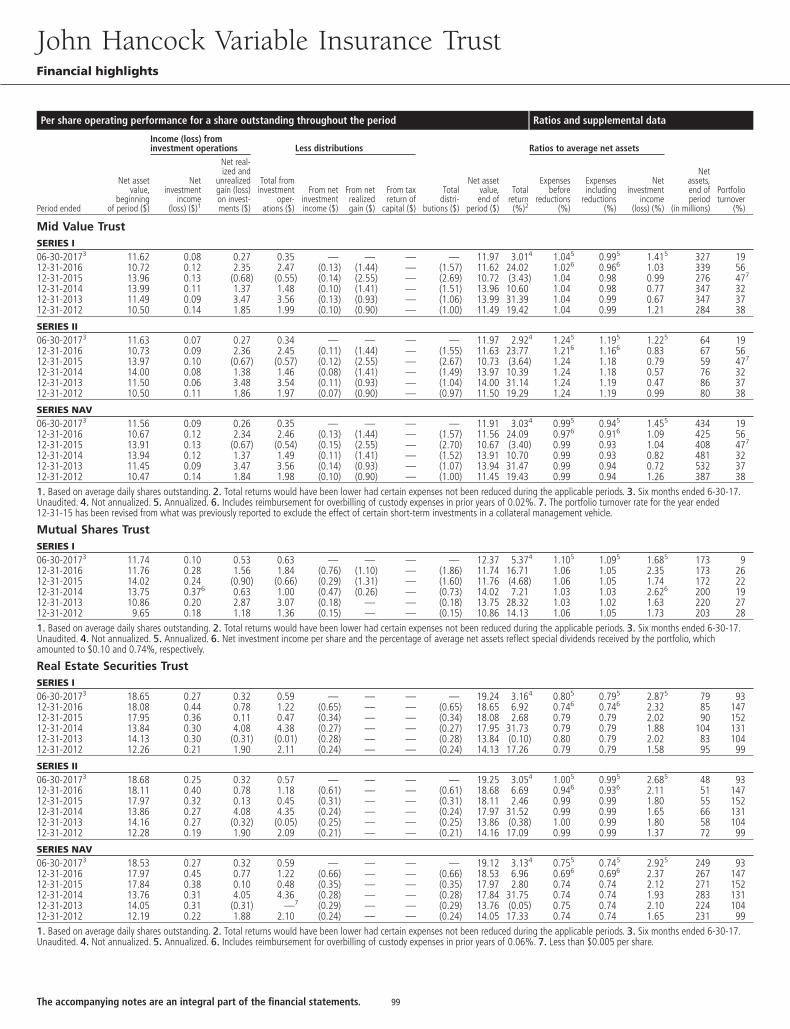
Per share operating performance for a share outstanding throughout the period Ratios and supplemental data
Income (loss) frominvestment operations Less distributions Ratios to average net assets
Period ended
Net assetvalue,
beginningof period ($)
Netinvestment
income(loss) ($)1
Net real-ized and
unrealizedgain (loss)on invest-ments ($)
Total frominvestment
oper-ations ($)
From netinvestmentincome ($)
From netrealizedgain ($)
From taxreturn of
capital ($)
Totaldistri-
butions ($)
Net assetvalue,end of
period ($)
Totalreturn(%)2
Expensesbefore
reductions(%)
Expensesincluding
reductions(%)
Netinvestment
income(loss) (%)
Netassets,end ofperiod
(in millions)
Portfolioturnover
(%)
Mid Value TrustSERIES I06-30-20173 11.62 0.08 0.27 0.35 — — — — 11.97 3.014 1.045 0.995 1.415 327 1912-31-2016 10.72 0.12 2.35 2.47 (0.13) (1.44) — (1.57) 11.62 24.02 1.026 0.966 1.03 339 5612-31-2015 13.96 0.13 (0.68) (0.55) (0.14) (2.55) — (2.69) 10.72 (3.43) 1.04 0.98 0.99 276 477
12-31-2014 13.99 0.11 1.37 1.48 (0.10) (1.41) — (1.51) 13.96 10.60 1.04 0.98 0.77 347 3212-31-2013 11.49 0.09 3.47 3.56 (0.13) (0.93) — (1.06) 13.99 31.39 1.04 0.99 0.67 347 3712-31-2012 10.50 0.14 1.85 1.99 (0.10) (0.90) — (1.00) 11.49 19.42 1.04 0.99 1.21 284 38
SERIES II06-30-20173 11.63 0.07 0.27 0.34 — — — — 11.97 2.924 1.245 1.195 1.225 64 1912-31-2016 10.73 0.09 2.36 2.45 (0.11) (1.44) — (1.55) 11.63 23.77 1.216 1.166 0.83 67 5612-31-2015 13.97 0.10 (0.67) (0.57) (0.12) (2.55) — (2.67) 10.73 (3.64) 1.24 1.18 0.79 59 477
12-31-2014 14.00 0.08 1.38 1.46 (0.08) (1.41) — (1.49) 13.97 10.39 1.24 1.18 0.57 76 3212-31-2013 11.50 0.06 3.48 3.54 (0.11) (0.93) — (1.04) 14.00 31.14 1.24 1.19 0.47 86 3712-31-2012 10.50 0.11 1.86 1.97 (0.07) (0.90) — (0.97) 11.50 19.29 1.24 1.19 0.99 80 38
SERIES NAV06-30-20173 11.56 0.09 0.26 0.35 — — — — 11.91 3.034 0.995 0.945 1.455 434 1912-31-2016 10.67 0.12 2.34 2.46 (0.13) (1.44) — (1.57) 11.56 24.09 0.976 0.916 1.09 425 5612-31-2015 13.91 0.13 (0.67) (0.54) (0.15) (2.55) — (2.70) 10.67 (3.40) 0.99 0.93 1.04 408 477
12-31-2014 13.94 0.12 1.37 1.49 (0.11) (1.41) — (1.52) 13.91 10.70 0.99 0.93 0.82 481 3212-31-2013 11.45 0.09 3.47 3.56 (0.14) (0.93) — (1.07) 13.94 31.47 0.99 0.94 0.72 532 3712-31-2012 10.47 0.14 1.84 1.98 (0.10) (0.90) — (1.00) 11.45 19.43 0.99 0.94 1.26 387 381. Based on average daily shares outstanding. 2. Total returns would have been lower had certain expenses not been reduced during the applicable periods. 3. Six months ended 6-30-17.Unaudited. 4. Not annualized. 5. Annualized. 6. Includes reimbursement for overbilling of custody expenses in prior years of 0.02%. 7. The portfolio turnover rate for the year ended12-31-15 has been revised from what was previously reported to exclude the effect of certain short-term investments in a collateral management vehicle.
Mutual Shares TrustSERIES I06-30-20173 11.74 0.10 0.53 0.63 — — — — 12.37 5.374 1.105 1.095 1.685 173 912-31-2016 11.76 0.28 1.56 1.84 (0.76) (1.10) — (1.86) 11.74 16.71 1.06 1.05 2.35 173 2612-31-2015 14.02 0.24 (0.90) (0.66) (0.29) (1.31) — (1.60) 11.76 (4.68) 1.06 1.05 1.74 172 2212-31-2014 13.75 0.376 0.63 1.00 (0.47) (0.26) — (0.73) 14.02 7.21 1.03 1.03 2.626 200 1912-31-2013 10.86 0.20 2.87 3.07 (0.18) — — (0.18) 13.75 28.32 1.03 1.02 1.63 220 2712-31-2012 9.65 0.18 1.18 1.36 (0.15) — — (0.15) 10.86 14.13 1.06 1.05 1.73 203 281. Based on average daily shares outstanding. 2. Total returns would have been lower had certain expenses not been reduced during the applicable periods. 3. Six months ended 6-30-17.Unaudited. 4. Not annualized. 5. Annualized. 6. Net investment income per share and the percentage of average net assets reflect special dividends received by the portfolio, whichamounted to $0.10 and 0.74%, respectively.
Real Estate Securities TrustSERIES I06-30-20173 18.65 0.27 0.32 0.59 — — — — 19.24 3.164 0.805 0.795 2.875 79 9312-31-2016 18.08 0.44 0.78 1.22 (0.65) — — (0.65) 18.65 6.92 0.746 0.746 2.32 85 14712-31-2015 17.95 0.36 0.11 0.47 (0.34) — — (0.34) 18.08 2.68 0.79 0.79 2.02 90 15212-31-2014 13.84 0.30 4.08 4.38 (0.27) — — (0.27) 17.95 31.73 0.79 0.79 1.88 104 13112-31-2013 14.13 0.30 (0.31) (0.01) (0.28) — — (0.28) 13.84 (0.10) 0.80 0.79 2.02 83 10412-31-2012 12.26 0.21 1.90 2.11 (0.24) — — (0.24) 14.13 17.26 0.79 0.79 1.58 95 99
SERIES II06-30-20173 18.68 0.25 0.32 0.57 — — — — 19.25 3.054 1.005 0.995 2.685 48 9312-31-2016 18.11 0.40 0.78 1.18 (0.61) — — (0.61) 18.68 6.69 0.946 0.936 2.11 51 14712-31-2015 17.97 0.32 0.13 0.45 (0.31) — — (0.31) 18.11 2.46 0.99 0.99 1.80 55 15212-31-2014 13.86 0.27 4.08 4.35 (0.24) — — (0.24) 17.97 31.52 0.99 0.99 1.65 66 13112-31-2013 14.16 0.27 (0.32) (0.05) (0.25) — — (0.25) 13.86 (0.38) 1.00 0.99 1.80 58 10412-31-2012 12.28 0.19 1.90 2.09 (0.21) — — (0.21) 14.16 17.09 0.99 0.99 1.37 72 99
SERIES NAV06-30-20173 18.53 0.27 0.32 0.59 — — — — 19.12 3.134 0.755 0.745 2.925 249 9312-31-2016 17.97 0.45 0.77 1.22 (0.66) — — (0.66) 18.53 6.96 0.696 0.696 2.37 267 14712-31-2015 17.84 0.38 0.10 0.48 (0.35) — — (0.35) 17.97 2.80 0.74 0.74 2.12 271 15212-31-2014 13.76 0.31 4.05 4.36 (0.28) — — (0.28) 17.84 31.75 0.74 0.74 1.93 283 13112-31-2013 14.05 0.31 (0.31) —7 (0.29) — — (0.29) 13.76 (0.05) 0.75 0.74 2.10 224 10412-31-2012 12.19 0.22 1.88 2.10 (0.24) — — (0.24) 14.05 17.33 0.74 0.74 1.65 231 991. Based on average daily shares outstanding. 2. Total returns would have been lower had certain expenses not been reduced during the applicable periods. 3. Six months ended 6-30-17.Unaudited. 4. Not annualized. 5. Annualized. 6. Includes reimbursement for overbilling of custody expenses in prior years of 0.06%. 7. Less than $0.005 per share.
John Hancock Variable Insurance TrustFinancial highlights
99The accompanying notes are an integral part of the financial statements.
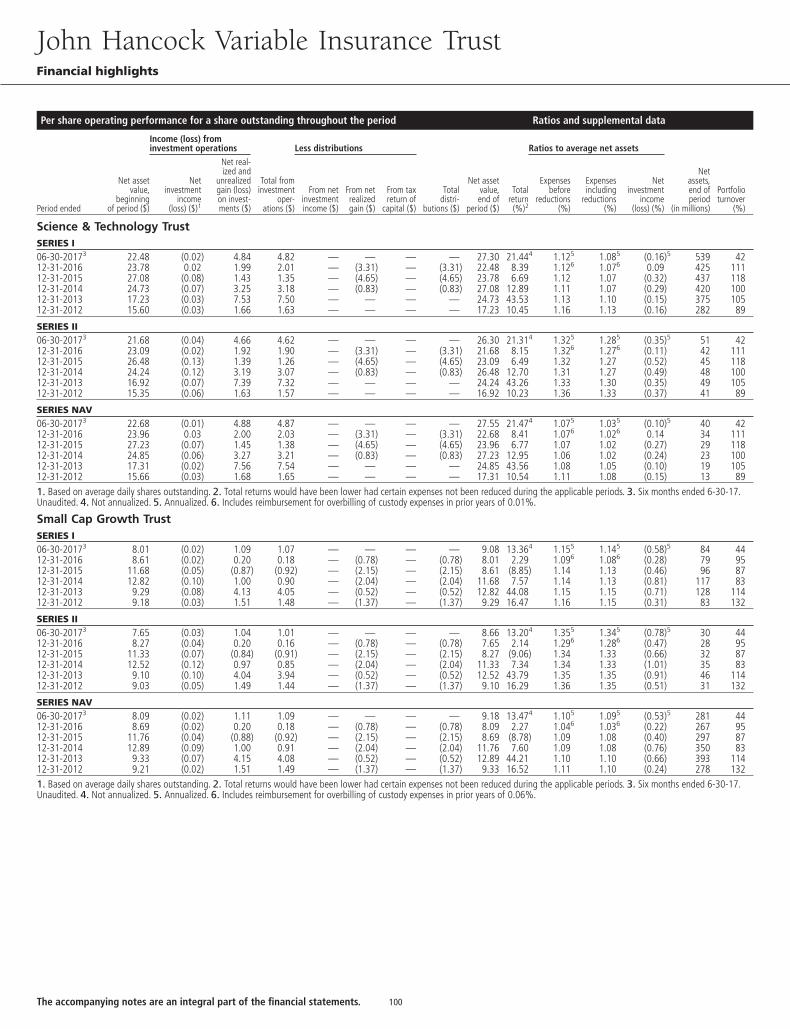
Per share operating performance for a share outstanding throughout the period Ratios and supplemental data
Income (loss) frominvestment operations Less distributions Ratios to average net assets
Period ended
Net assetvalue,
beginningof period ($)
Netinvestment
income(loss) ($)1
Net real-ized and
unrealizedgain (loss)on invest-ments ($)
Total frominvestment
oper-ations ($)
From netinvestmentincome ($)
From netrealizedgain ($)
From taxreturn of
capital ($)
Totaldistri-
butions ($)
Net assetvalue,end of
period ($)
Totalreturn(%)2
Expensesbefore
reductions(%)
Expensesincluding
reductions(%)
Netinvestment
income(loss) (%)
Netassets,end ofperiod
(in millions)
Portfolioturnover
(%)
Science & Technology TrustSERIES I06-30-20173 22.48 (0.02) 4.84 4.82 — — — — 27.30 21.444 1.125 1.085 (0.16)5 539 4212-31-2016 23.78 0.02 1.99 2.01 — (3.31) — (3.31) 22.48 8.39 1.126 1.076 0.09 425 11112-31-2015 27.08 (0.08) 1.43 1.35 — (4.65) — (4.65) 23.78 6.69 1.12 1.07 (0.32) 437 11812-31-2014 24.73 (0.07) 3.25 3.18 — (0.83) — (0.83) 27.08 12.89 1.11 1.07 (0.29) 420 10012-31-2013 17.23 (0.03) 7.53 7.50 — — — — 24.73 43.53 1.13 1.10 (0.15) 375 10512-31-2012 15.60 (0.03) 1.66 1.63 — — — — 17.23 10.45 1.16 1.13 (0.16) 282 89
SERIES II06-30-20173 21.68 (0.04) 4.66 4.62 — — — — 26.30 21.314 1.325 1.285 (0.35)5 51 4212-31-2016 23.09 (0.02) 1.92 1.90 — (3.31) — (3.31) 21.68 8.15 1.326 1.276 (0.11) 42 11112-31-2015 26.48 (0.13) 1.39 1.26 — (4.65) — (4.65) 23.09 6.49 1.32 1.27 (0.52) 45 11812-31-2014 24.24 (0.12) 3.19 3.07 — (0.83) — (0.83) 26.48 12.70 1.31 1.27 (0.49) 48 10012-31-2013 16.92 (0.07) 7.39 7.32 — — — — 24.24 43.26 1.33 1.30 (0.35) 49 10512-31-2012 15.35 (0.06) 1.63 1.57 — — — — 16.92 10.23 1.36 1.33 (0.37) 41 89
SERIES NAV06-30-20173 22.68 (0.01) 4.88 4.87 — — — — 27.55 21.474 1.075 1.035 (0.10)5 40 4212-31-2016 23.96 0.03 2.00 2.03 — (3.31) — (3.31) 22.68 8.41 1.076 1.026 0.14 34 11112-31-2015 27.23 (0.07) 1.45 1.38 — (4.65) — (4.65) 23.96 6.77 1.07 1.02 (0.27) 29 11812-31-2014 24.85 (0.06) 3.27 3.21 — (0.83) — (0.83) 27.23 12.95 1.06 1.02 (0.24) 23 10012-31-2013 17.31 (0.02) 7.56 7.54 — — — — 24.85 43.56 1.08 1.05 (0.10) 19 10512-31-2012 15.66 (0.03) 1.68 1.65 — — — — 17.31 10.54 1.11 1.08 (0.15) 13 891. Based on average daily shares outstanding. 2. Total returns would have been lower had certain expenses not been reduced during the applicable periods. 3. Six months ended 6-30-17.Unaudited. 4. Not annualized. 5. Annualized. 6. Includes reimbursement for overbilling of custody expenses in prior years of 0.01%.
Small Cap Growth TrustSERIES I06-30-20173 8.01 (0.02) 1.09 1.07 — — — — 9.08 13.364 1.155 1.145 (0.58)5 84 4412-31-2016 8.61 (0.02) 0.20 0.18 — (0.78) — (0.78) 8.01 2.29 1.096 1.086 (0.28) 79 9512-31-2015 11.68 (0.05) (0.87) (0.92) — (2.15) — (2.15) 8.61 (8.85) 1.14 1.13 (0.46) 96 8712-31-2014 12.82 (0.10) 1.00 0.90 — (2.04) — (2.04) 11.68 7.57 1.14 1.13 (0.81) 117 8312-31-2013 9.29 (0.08) 4.13 4.05 — (0.52) — (0.52) 12.82 44.08 1.15 1.15 (0.71) 128 11412-31-2012 9.18 (0.03) 1.51 1.48 — (1.37) — (1.37) 9.29 16.47 1.16 1.15 (0.31) 83 132
SERIES II06-30-20173 7.65 (0.03) 1.04 1.01 — — — — 8.66 13.204 1.355 1.345 (0.78)5 30 4412-31-2016 8.27 (0.04) 0.20 0.16 — (0.78) — (0.78) 7.65 2.14 1.296 1.286 (0.47) 28 9512-31-2015 11.33 (0.07) (0.84) (0.91) — (2.15) — (2.15) 8.27 (9.06) 1.34 1.33 (0.66) 32 8712-31-2014 12.52 (0.12) 0.97 0.85 — (2.04) — (2.04) 11.33 7.34 1.34 1.33 (1.01) 35 8312-31-2013 9.10 (0.10) 4.04 3.94 — (0.52) — (0.52) 12.52 43.79 1.35 1.35 (0.91) 46 11412-31-2012 9.03 (0.05) 1.49 1.44 — (1.37) — (1.37) 9.10 16.29 1.36 1.35 (0.51) 31 132
SERIES NAV06-30-20173 8.09 (0.02) 1.11 1.09 — — — — 9.18 13.474 1.105 1.095 (0.53)5 281 4412-31-2016 8.69 (0.02) 0.20 0.18 — (0.78) — (0.78) 8.09 2.27 1.046 1.036 (0.22) 267 9512-31-2015 11.76 (0.04) (0.88) (0.92) — (2.15) — (2.15) 8.69 (8.78) 1.09 1.08 (0.40) 297 8712-31-2014 12.89 (0.09) 1.00 0.91 — (2.04) — (2.04) 11.76 7.60 1.09 1.08 (0.76) 350 8312-31-2013 9.33 (0.07) 4.15 4.08 — (0.52) — (0.52) 12.89 44.21 1.10 1.10 (0.66) 393 11412-31-2012 9.21 (0.02) 1.51 1.49 — (1.37) — (1.37) 9.33 16.52 1.11 1.10 (0.24) 278 1321. Based on average daily shares outstanding. 2. Total returns would have been lower had certain expenses not been reduced during the applicable periods. 3. Six months ended 6-30-17.Unaudited. 4. Not annualized. 5. Annualized. 6. Includes reimbursement for overbilling of custody expenses in prior years of 0.06%.
John Hancock Variable Insurance TrustFinancial highlights
100The accompanying notes are an integral part of the financial statements.
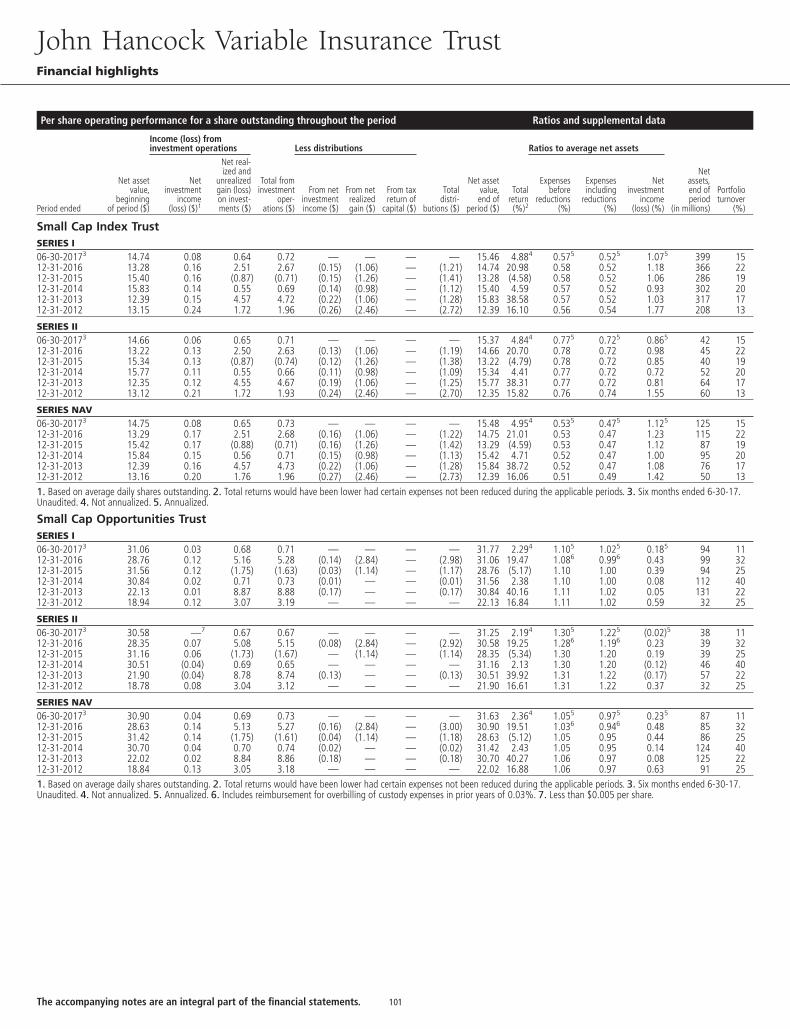
Per share operating performance for a share outstanding throughout the period Ratios and supplemental data
Income (loss) frominvestment operations Less distributions Ratios to average net assets
Period ended
Net assetvalue,
beginningof period ($)
Netinvestment
income(loss) ($)1
Net real-ized and
unrealizedgain (loss)on invest-ments ($)
Total frominvestment
oper-ations ($)
From netinvestmentincome ($)
From netrealizedgain ($)
From taxreturn of
capital ($)
Totaldistri-
butions ($)
Net assetvalue,end of
period ($)
Totalreturn(%)2
Expensesbefore
reductions(%)
Expensesincluding
reductions(%)
Netinvestment
income(loss) (%)
Netassets,end ofperiod
(in millions)
Portfolioturnover
(%)
Small Cap Index TrustSERIES I06-30-20173 14.74 0.08 0.64 0.72 — — — — 15.46 4.884 0.575 0.525 1.075 399 1512-31-2016 13.28 0.16 2.51 2.67 (0.15) (1.06) — (1.21) 14.74 20.98 0.58 0.52 1.18 366 2212-31-2015 15.40 0.16 (0.87) (0.71) (0.15) (1.26) — (1.41) 13.28 (4.58) 0.58 0.52 1.06 286 1912-31-2014 15.83 0.14 0.55 0.69 (0.14) (0.98) — (1.12) 15.40 4.59 0.57 0.52 0.93 302 2012-31-2013 12.39 0.15 4.57 4.72 (0.22) (1.06) — (1.28) 15.83 38.58 0.57 0.52 1.03 317 1712-31-2012 13.15 0.24 1.72 1.96 (0.26) (2.46) — (2.72) 12.39 16.10 0.56 0.54 1.77 208 13
SERIES II06-30-20173 14.66 0.06 0.65 0.71 — — — — 15.37 4.844 0.775 0.725 0.865 42 1512-31-2016 13.22 0.13 2.50 2.63 (0.13) (1.06) — (1.19) 14.66 20.70 0.78 0.72 0.98 45 2212-31-2015 15.34 0.13 (0.87) (0.74) (0.12) (1.26) — (1.38) 13.22 (4.79) 0.78 0.72 0.85 40 1912-31-2014 15.77 0.11 0.55 0.66 (0.11) (0.98) — (1.09) 15.34 4.41 0.77 0.72 0.72 52 2012-31-2013 12.35 0.12 4.55 4.67 (0.19) (1.06) — (1.25) 15.77 38.31 0.77 0.72 0.81 64 1712-31-2012 13.12 0.21 1.72 1.93 (0.24) (2.46) — (2.70) 12.35 15.82 0.76 0.74 1.55 60 13
SERIES NAV06-30-20173 14.75 0.08 0.65 0.73 — — — — 15.48 4.954 0.535 0.475 1.125 125 1512-31-2016 13.29 0.17 2.51 2.68 (0.16) (1.06) — (1.22) 14.75 21.01 0.53 0.47 1.23 115 2212-31-2015 15.42 0.17 (0.88) (0.71) (0.16) (1.26) — (1.42) 13.29 (4.59) 0.53 0.47 1.12 87 1912-31-2014 15.84 0.15 0.56 0.71 (0.15) (0.98) — (1.13) 15.42 4.71 0.52 0.47 1.00 95 2012-31-2013 12.39 0.16 4.57 4.73 (0.22) (1.06) — (1.28) 15.84 38.72 0.52 0.47 1.08 76 1712-31-2012 13.16 0.20 1.76 1.96 (0.27) (2.46) — (2.73) 12.39 16.06 0.51 0.49 1.42 50 131. Based on average daily shares outstanding. 2. Total returns would have been lower had certain expenses not been reduced during the applicable periods. 3. Six months ended 6-30-17.Unaudited. 4. Not annualized. 5. Annualized.
Small Cap Opportunities TrustSERIES I06-30-20173 31.06 0.03 0.68 0.71 — — — — 31.77 2.294 1.105 1.025 0.185 94 1112-31-2016 28.76 0.12 5.16 5.28 (0.14) (2.84) — (2.98) 31.06 19.47 1.086 0.996 0.43 99 3212-31-2015 31.56 0.12 (1.75) (1.63) (0.03) (1.14) — (1.17) 28.76 (5.17) 1.10 1.00 0.39 94 2512-31-2014 30.84 0.02 0.71 0.73 (0.01) — — (0.01) 31.56 2.38 1.10 1.00 0.08 112 4012-31-2013 22.13 0.01 8.87 8.88 (0.17) — — (0.17) 30.84 40.16 1.11 1.02 0.05 131 2212-31-2012 18.94 0.12 3.07 3.19 — — — — 22.13 16.84 1.11 1.02 0.59 32 25
SERIES II06-30-20173 30.58 —7 0.67 0.67 — — — — 31.25 2.194 1.305 1.225 (0.02)5 38 1112-31-2016 28.35 0.07 5.08 5.15 (0.08) (2.84) — (2.92) 30.58 19.25 1.286 1.196 0.23 39 3212-31-2015 31.16 0.06 (1.73) (1.67) — (1.14) — (1.14) 28.35 (5.34) 1.30 1.20 0.19 39 2512-31-2014 30.51 (0.04) 0.69 0.65 — — — — 31.16 2.13 1.30 1.20 (0.12) 46 4012-31-2013 21.90 (0.04) 8.78 8.74 (0.13) — — (0.13) 30.51 39.92 1.31 1.22 (0.17) 57 2212-31-2012 18.78 0.08 3.04 3.12 — — — — 21.90 16.61 1.31 1.22 0.37 32 25
SERIES NAV06-30-20173 30.90 0.04 0.69 0.73 — — — — 31.63 2.364 1.055 0.975 0.235 87 1112-31-2016 28.63 0.14 5.13 5.27 (0.16) (2.84) — (3.00) 30.90 19.51 1.036 0.946 0.48 85 3212-31-2015 31.42 0.14 (1.75) (1.61) (0.04) (1.14) — (1.18) 28.63 (5.12) 1.05 0.95 0.44 86 2512-31-2014 30.70 0.04 0.70 0.74 (0.02) — — (0.02) 31.42 2.43 1.05 0.95 0.14 124 4012-31-2013 22.02 0.02 8.84 8.86 (0.18) — — (0.18) 30.70 40.27 1.06 0.97 0.08 125 2212-31-2012 18.84 0.13 3.05 3.18 — — — — 22.02 16.88 1.06 0.97 0.63 91 251. Based on average daily shares outstanding. 2. Total returns would have been lower had certain expenses not been reduced during the applicable periods. 3. Six months ended 6-30-17.Unaudited. 4. Not annualized. 5. Annualized. 6. Includes reimbursement for overbilling of custody expenses in prior years of 0.03%. 7. Less than $0.005 per share.
John Hancock Variable Insurance TrustFinancial highlights
101The accompanying notes are an integral part of the financial statements.
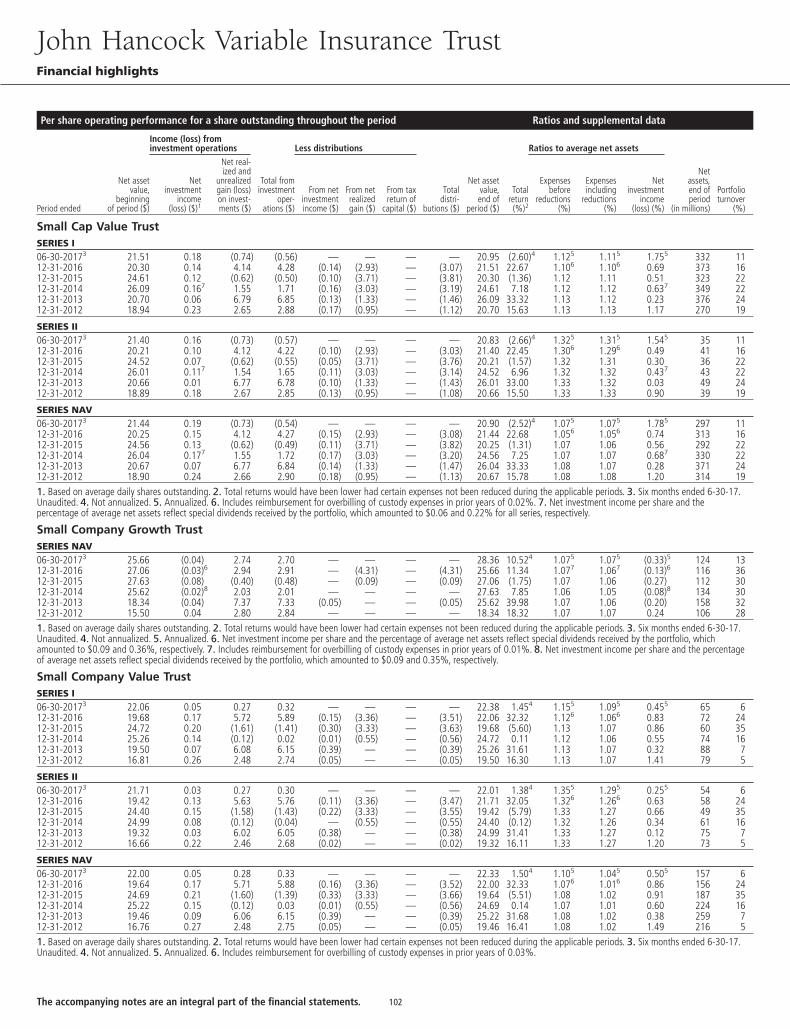
Per share operating performance for a share outstanding throughout the period Ratios and supplemental data
Income (loss) frominvestment operations Less distributions Ratios to average net assets
Period ended
Net assetvalue,
beginningof period ($)
Netinvestment
income(loss) ($)1
Net real-ized and
unrealizedgain (loss)on invest-ments ($)
Total frominvestment
oper-ations ($)
From netinvestmentincome ($)
From netrealizedgain ($)
From taxreturn of
capital ($)
Totaldistri-
butions ($)
Net assetvalue,end of
period ($)
Totalreturn(%)2
Expensesbefore
reductions(%)
Expensesincluding
reductions(%)
Netinvestment
income(loss) (%)
Netassets,end ofperiod
(in millions)
Portfolioturnover
(%)
Small Cap Value TrustSERIES I06-30-20173 21.51 0.18 (0.74) (0.56) — — — — 20.95 (2.60)4 1.125 1.115 1.755 332 1112-31-2016 20.30 0.14 4.14 4.28 (0.14) (2.93) — (3.07) 21.51 22.67 1.106 1.106 0.69 373 1612-31-2015 24.61 0.12 (0.62) (0.50) (0.10) (3.71) — (3.81) 20.30 (1.36) 1.12 1.11 0.51 323 2212-31-2014 26.09 0.167 1.55 1.71 (0.16) (3.03) — (3.19) 24.61 7.18 1.12 1.12 0.637 349 2212-31-2013 20.70 0.06 6.79 6.85 (0.13) (1.33) — (1.46) 26.09 33.32 1.13 1.12 0.23 376 2412-31-2012 18.94 0.23 2.65 2.88 (0.17) (0.95) — (1.12) 20.70 15.63 1.13 1.13 1.17 270 19
SERIES II06-30-20173 21.40 0.16 (0.73) (0.57) — — — — 20.83 (2.66)4 1.325 1.315 1.545 35 1112-31-2016 20.21 0.10 4.12 4.22 (0.10) (2.93) — (3.03) 21.40 22.45 1.306 1.296 0.49 41 1612-31-2015 24.52 0.07 (0.62) (0.55) (0.05) (3.71) — (3.76) 20.21 (1.57) 1.32 1.31 0.30 36 2212-31-2014 26.01 0.117 1.54 1.65 (0.11) (3.03) — (3.14) 24.52 6.96 1.32 1.32 0.437 43 2212-31-2013 20.66 0.01 6.77 6.78 (0.10) (1.33) — (1.43) 26.01 33.00 1.33 1.32 0.03 49 2412-31-2012 18.89 0.18 2.67 2.85 (0.13) (0.95) — (1.08) 20.66 15.50 1.33 1.33 0.90 39 19
SERIES NAV06-30-20173 21.44 0.19 (0.73) (0.54) — — — — 20.90 (2.52)4 1.075 1.075 1.785 297 1112-31-2016 20.25 0.15 4.12 4.27 (0.15) (2.93) — (3.08) 21.44 22.68 1.056 1.056 0.74 313 1612-31-2015 24.56 0.13 (0.62) (0.49) (0.11) (3.71) — (3.82) 20.25 (1.31) 1.07 1.06 0.56 292 2212-31-2014 26.04 0.177 1.55 1.72 (0.17) (3.03) — (3.20) 24.56 7.25 1.07 1.07 0.687 330 2212-31-2013 20.67 0.07 6.77 6.84 (0.14) (1.33) — (1.47) 26.04 33.33 1.08 1.07 0.28 371 2412-31-2012 18.90 0.24 2.66 2.90 (0.18) (0.95) — (1.13) 20.67 15.78 1.08 1.08 1.20 314 191. Based on average daily shares outstanding. 2. Total returns would have been lower had certain expenses not been reduced during the applicable periods. 3. Six months ended 6-30-17.Unaudited. 4. Not annualized. 5. Annualized. 6. Includes reimbursement for overbilling of custody expenses in prior years of 0.02%. 7. Net investment income per share and thepercentage of average net assets reflect special dividends received by the portfolio, which amounted to $0.06 and 0.22% for all series, respectively.
Small Company Growth TrustSERIES NAV06-30-20173 25.66 (0.04) 2.74 2.70 — — — — 28.36 10.524 1.075 1.075 (0.33)5 124 1312-31-2016 27.06 (0.03)6 2.94 2.91 — (4.31) — (4.31) 25.66 11.34 1.077 1.067 (0.13)6 116 3612-31-2015 27.63 (0.08) (0.40) (0.48) — (0.09) — (0.09) 27.06 (1.75) 1.07 1.06 (0.27) 112 3012-31-2014 25.62 (0.02)8 2.03 2.01 — — — — 27.63 7.85 1.06 1.05 (0.08)8 134 3012-31-2013 18.34 (0.04) 7.37 7.33 (0.05) — — (0.05) 25.62 39.98 1.07 1.06 (0.20) 158 3212-31-2012 15.50 0.04 2.80 2.84 — — — — 18.34 18.32 1.07 1.07 0.24 106 281. Based on average daily shares outstanding. 2. Total returns would have been lower had certain expenses not been reduced during the applicable periods. 3. Six months ended 6-30-17.Unaudited. 4. Not annualized. 5. Annualized. 6. Net investment income per share and the percentage of average net assets reflect special dividends received by the portfolio, whichamounted to $0.09 and 0.36%, respectively. 7. Includes reimbursement for overbilling of custody expenses in prior years of 0.01%. 8. Net investment income per share and the percentageof average net assets reflect special dividends received by the portfolio, which amounted to $0.09 and 0.35%, respectively.
Small Company Value TrustSERIES I06-30-20173 22.06 0.05 0.27 0.32 — — — — 22.38 1.454 1.155 1.095 0.455 65 612-31-2016 19.68 0.17 5.72 5.89 (0.15) (3.36) — (3.51) 22.06 32.32 1.126 1.066 0.83 72 2412-31-2015 24.72 0.20 (1.61) (1.41) (0.30) (3.33) — (3.63) 19.68 (5.60) 1.13 1.07 0.86 60 3512-31-2014 25.26 0.14 (0.12) 0.02 (0.01) (0.55) — (0.56) 24.72 0.11 1.12 1.06 0.55 74 1612-31-2013 19.50 0.07 6.08 6.15 (0.39) — — (0.39) 25.26 31.61 1.13 1.07 0.32 88 712-31-2012 16.81 0.26 2.48 2.74 (0.05) — — (0.05) 19.50 16.30 1.13 1.07 1.41 79 5
SERIES II06-30-20173 21.71 0.03 0.27 0.30 — — — — 22.01 1.384 1.355 1.295 0.255 54 612-31-2016 19.42 0.13 5.63 5.76 (0.11) (3.36) — (3.47) 21.71 32.05 1.326 1.266 0.63 58 2412-31-2015 24.40 0.15 (1.58) (1.43) (0.22) (3.33) — (3.55) 19.42 (5.79) 1.33 1.27 0.66 49 3512-31-2014 24.99 0.08 (0.12) (0.04) — (0.55) — (0.55) 24.40 (0.12) 1.32 1.26 0.34 61 1612-31-2013 19.32 0.03 6.02 6.05 (0.38) — — (0.38) 24.99 31.41 1.33 1.27 0.12 75 712-31-2012 16.66 0.22 2.46 2.68 (0.02) — — (0.02) 19.32 16.11 1.33 1.27 1.20 73 5
SERIES NAV06-30-20173 22.00 0.05 0.28 0.33 — — — — 22.33 1.504 1.105 1.045 0.505 157 612-31-2016 19.64 0.17 5.71 5.88 (0.16) (3.36) — (3.52) 22.00 32.33 1.076 1.016 0.86 156 2412-31-2015 24.69 0.21 (1.60) (1.39) (0.33) (3.33) — (3.66) 19.64 (5.51) 1.08 1.02 0.91 187 3512-31-2014 25.22 0.15 (0.12) 0.03 (0.01) (0.55) — (0.56) 24.69 0.14 1.07 1.01 0.60 224 1612-31-2013 19.46 0.09 6.06 6.15 (0.39) — — (0.39) 25.22 31.68 1.08 1.02 0.38 259 712-31-2012 16.76 0.27 2.48 2.75 (0.05) — — (0.05) 19.46 16.41 1.08 1.02 1.49 216 51. Based on average daily shares outstanding. 2. Total returns would have been lower had certain expenses not been reduced during the applicable periods. 3. Six months ended 6-30-17.Unaudited. 4. Not annualized. 5. Annualized. 6. Includes reimbursement for overbilling of custody expenses in prior years of 0.03%.
John Hancock Variable Insurance TrustFinancial highlights
102The accompanying notes are an integral part of the financial statements.
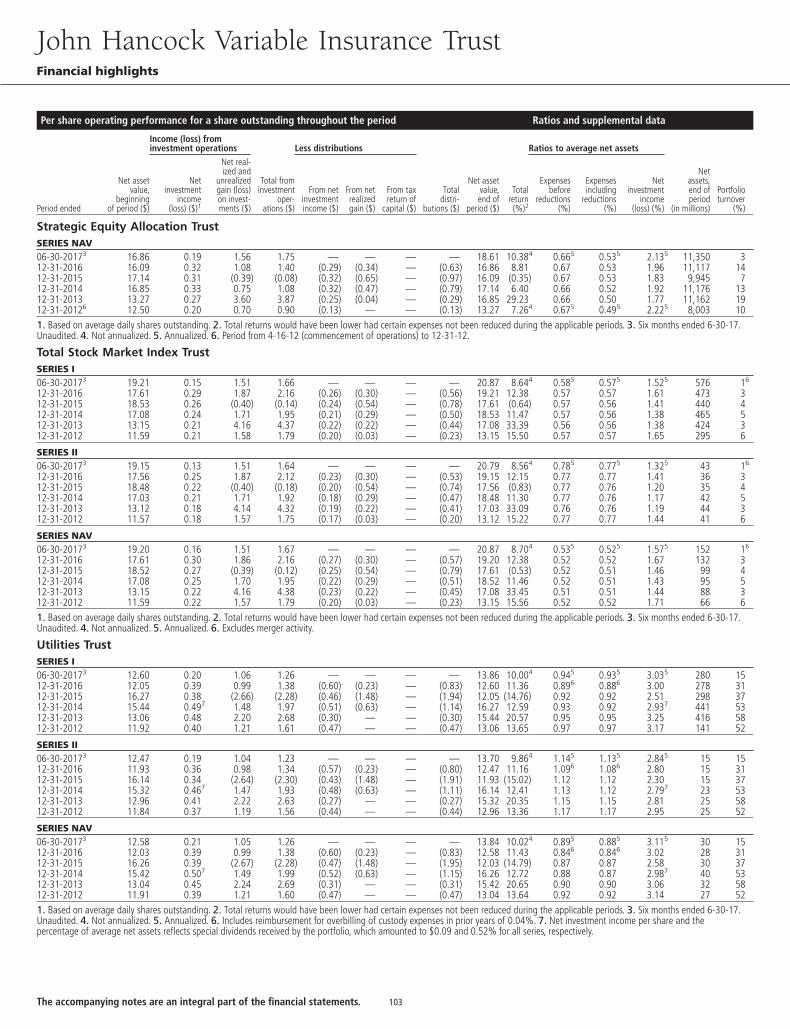
Per share operating performance for a share outstanding throughout the period Ratios and supplemental data
Income (loss) frominvestment operations Less distributions Ratios to average net assets
Period ended
Net assetvalue,
beginningof period ($)
Netinvestment
income(loss) ($)1
Net real-ized and
unrealizedgain (loss)on invest-ments ($)
Total frominvestment
oper-ations ($)
From netinvestmentincome ($)
From netrealizedgain ($)
From taxreturn of
capital ($)
Totaldistri-
butions ($)
Net assetvalue,end of
period ($)
Totalreturn(%)2
Expensesbefore
reductions(%)
Expensesincluding
reductions(%)
Netinvestment
income(loss) (%)
Netassets,end ofperiod
(in millions)
Portfolioturnover
(%)
Strategic Equity Allocation TrustSERIES NAV06-30-20173 16.86 0.19 1.56 1.75 — — — — 18.61 10.384 0.665 0.535 2.135 11,350 312-31-2016 16.09 0.32 1.08 1.40 (0.29) (0.34) — (0.63) 16.86 8.81 0.67 0.53 1.96 11,117 1412-31-2015 17.14 0.31 (0.39) (0.08) (0.32) (0.65) — (0.97) 16.09 (0.35) 0.67 0.53 1.83 9,945 712-31-2014 16.85 0.33 0.75 1.08 (0.32) (0.47) — (0.79) 17.14 6.40 0.66 0.52 1.92 11,176 1312-31-2013 13.27 0.27 3.60 3.87 (0.25) (0.04) — (0.29) 16.85 29.23 0.66 0.50 1.77 11,162 1912-31-20126 12.50 0.20 0.70 0.90 (0.13) — — (0.13) 13.27 7.264 0.675 0.495 2.225 8,003 101. Based on average daily shares outstanding. 2. Total returns would have been lower had certain expenses not been reduced during the applicable periods. 3. Six months ended 6-30-17.Unaudited. 4. Not annualized. 5. Annualized. 6. Period from 4-16-12 (commencement of operations) to 12-31-12.
Total Stock Market Index TrustSERIES I06-30-20173 19.21 0.15 1.51 1.66 — — — — 20.87 8.644 0.585 0.575 1.525 576 16
12-31-2016 17.61 0.29 1.87 2.16 (0.26) (0.30) — (0.56) 19.21 12.38 0.57 0.57 1.61 473 312-31-2015 18.53 0.26 (0.40) (0.14) (0.24) (0.54) — (0.78) 17.61 (0.64) 0.57 0.56 1.41 440 412-31-2014 17.08 0.24 1.71 1.95 (0.21) (0.29) — (0.50) 18.53 11.47 0.57 0.56 1.38 465 512-31-2013 13.15 0.21 4.16 4.37 (0.22) (0.22) — (0.44) 17.08 33.39 0.56 0.56 1.38 424 312-31-2012 11.59 0.21 1.58 1.79 (0.20) (0.03) — (0.23) 13.15 15.50 0.57 0.57 1.65 295 6
SERIES II06-30-20173 19.15 0.13 1.51 1.64 — — — — 20.79 8.564 0.785 0.775 1.325 43 16
12-31-2016 17.56 0.25 1.87 2.12 (0.23) (0.30) — (0.53) 19.15 12.15 0.77 0.77 1.41 36 312-31-2015 18.48 0.22 (0.40) (0.18) (0.20) (0.54) — (0.74) 17.56 (0.83) 0.77 0.76 1.20 35 412-31-2014 17.03 0.21 1.71 1.92 (0.18) (0.29) — (0.47) 18.48 11.30 0.77 0.76 1.17 42 512-31-2013 13.12 0.18 4.14 4.32 (0.19) (0.22) — (0.41) 17.03 33.09 0.76 0.76 1.19 44 312-31-2012 11.57 0.18 1.57 1.75 (0.17) (0.03) — (0.20) 13.12 15.22 0.77 0.77 1.44 41 6
SERIES NAV06-30-20173 19.20 0.16 1.51 1.67 — — — — 20.87 8.704 0.535 0.525 1.575 152 16
12-31-2016 17.61 0.30 1.86 2.16 (0.27) (0.30) — (0.57) 19.20 12.38 0.52 0.52 1.67 132 312-31-2015 18.52 0.27 (0.39) (0.12) (0.25) (0.54) — (0.79) 17.61 (0.53) 0.52 0.51 1.46 99 412-31-2014 17.08 0.25 1.70 1.95 (0.22) (0.29) — (0.51) 18.52 11.46 0.52 0.51 1.43 95 512-31-2013 13.15 0.22 4.16 4.38 (0.23) (0.22) — (0.45) 17.08 33.45 0.51 0.51 1.44 88 312-31-2012 11.59 0.22 1.57 1.79 (0.20) (0.03) — (0.23) 13.15 15.56 0.52 0.52 1.71 66 61. Based on average daily shares outstanding. 2. Total returns would have been lower had certain expenses not been reduced during the applicable periods. 3. Six months ended 6-30-17.Unaudited. 4. Not annualized. 5. Annualized. 6. Excludes merger activity.
Utilities TrustSERIES I06-30-20173 12.60 0.20 1.06 1.26 — — — — 13.86 10.004 0.945 0.935 3.035 280 1512-31-2016 12.05 0.39 0.99 1.38 (0.60) (0.23) — (0.83) 12.60 11.36 0.896 0.886 3.00 278 3112-31-2015 16.27 0.38 (2.66) (2.28) (0.46) (1.48) — (1.94) 12.05 (14.76) 0.92 0.92 2.51 298 3712-31-2014 15.44 0.497 1.48 1.97 (0.51) (0.63) — (1.14) 16.27 12.59 0.93 0.92 2.937 441 5312-31-2013 13.06 0.48 2.20 2.68 (0.30) — — (0.30) 15.44 20.57 0.95 0.95 3.25 416 5812-31-2012 11.92 0.40 1.21 1.61 (0.47) — — (0.47) 13.06 13.65 0.97 0.97 3.17 141 52
SERIES II06-30-20173 12.47 0.19 1.04 1.23 — — — — 13.70 9.864 1.145 1.135 2.845 15 1512-31-2016 11.93 0.36 0.98 1.34 (0.57) (0.23) — (0.80) 12.47 11.16 1.096 1.086 2.80 15 3112-31-2015 16.14 0.34 (2.64) (2.30) (0.43) (1.48) — (1.91) 11.93 (15.02) 1.12 1.12 2.30 15 3712-31-2014 15.32 0.467 1.47 1.93 (0.48) (0.63) — (1.11) 16.14 12.41 1.13 1.12 2.797 23 5312-31-2013 12.96 0.41 2.22 2.63 (0.27) — — (0.27) 15.32 20.35 1.15 1.15 2.81 25 5812-31-2012 11.84 0.37 1.19 1.56 (0.44) — — (0.44) 12.96 13.36 1.17 1.17 2.95 25 52
SERIES NAV06-30-20173 12.58 0.21 1.05 1.26 — — — — 13.84 10.024 0.895 0.885 3.115 30 1512-31-2016 12.03 0.39 0.99 1.38 (0.60) (0.23) — (0.83) 12.58 11.43 0.846 0.846 3.02 28 3112-31-2015 16.26 0.39 (2.67) (2.28) (0.47) (1.48) — (1.95) 12.03 (14.79) 0.87 0.87 2.58 30 3712-31-2014 15.42 0.507 1.49 1.99 (0.52) (0.63) — (1.15) 16.26 12.72 0.88 0.87 2.987 40 5312-31-2013 13.04 0.45 2.24 2.69 (0.31) — — (0.31) 15.42 20.65 0.90 0.90 3.06 32 5812-31-2012 11.91 0.39 1.21 1.60 (0.47) — — (0.47) 13.04 13.64 0.92 0.92 3.14 27 521. Based on average daily shares outstanding. 2. Total returns would have been lower had certain expenses not been reduced during the applicable periods. 3. Six months ended 6-30-17.Unaudited. 4. Not annualized. 5. Annualized. 6. Includes reimbursement for overbilling of custody expenses in prior years of 0.04%. 7. Net investment income per share and thepercentage of average net assets reflects special dividends received by the portfolio, which amounted to $0.09 and 0.52% for all series, respectively.
John Hancock Variable Insurance TrustFinancial highlights
103The accompanying notes are an integral part of the financial statements.
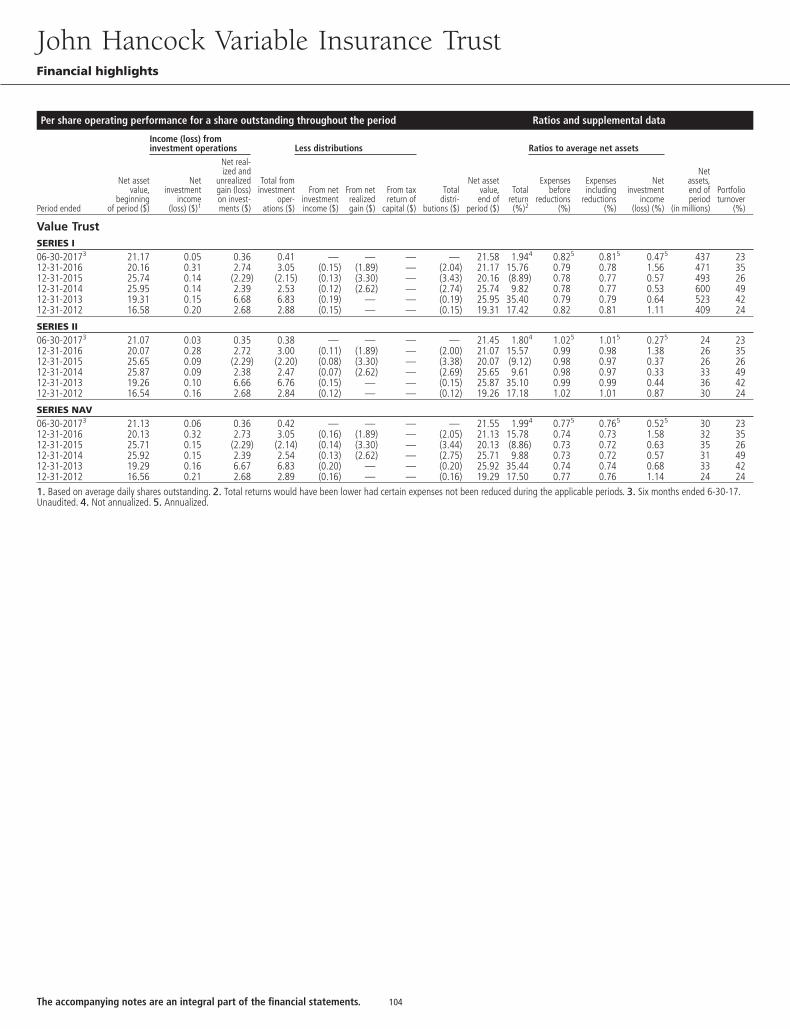
Per share operating performance for a share outstanding throughout the period Ratios and supplemental data
Income (loss) frominvestment operations Less distributions Ratios to average net assets
Period ended
Net assetvalue,
beginningof period ($)
Netinvestment
income(loss) ($)1
Net real-ized and
unrealizedgain (loss)on invest-ments ($)
Total frominvestment
oper-ations ($)
From netinvestmentincome ($)
From netrealizedgain ($)
From taxreturn of
capital ($)
Totaldistri-
butions ($)
Net assetvalue,end of
period ($)
Totalreturn(%)2
Expensesbefore
reductions(%)
Expensesincluding
reductions(%)
Netinvestment
income(loss) (%)
Netassets,end ofperiod
(in millions)
Portfolioturnover
(%)
Value TrustSERIES I06-30-20173 21.17 0.05 0.36 0.41 — — — — 21.58 1.944 0.825 0.815 0.475 437 2312-31-2016 20.16 0.31 2.74 3.05 (0.15) (1.89) — (2.04) 21.17 15.76 0.79 0.78 1.56 471 3512-31-2015 25.74 0.14 (2.29) (2.15) (0.13) (3.30) — (3.43) 20.16 (8.89) 0.78 0.77 0.57 493 2612-31-2014 25.95 0.14 2.39 2.53 (0.12) (2.62) — (2.74) 25.74 9.82 0.78 0.77 0.53 600 4912-31-2013 19.31 0.15 6.68 6.83 (0.19) — — (0.19) 25.95 35.40 0.79 0.79 0.64 523 4212-31-2012 16.58 0.20 2.68 2.88 (0.15) — — (0.15) 19.31 17.42 0.82 0.81 1.11 409 24
SERIES II06-30-20173 21.07 0.03 0.35 0.38 — — — — 21.45 1.804 1.025 1.015 0.275 24 2312-31-2016 20.07 0.28 2.72 3.00 (0.11) (1.89) — (2.00) 21.07 15.57 0.99 0.98 1.38 26 3512-31-2015 25.65 0.09 (2.29) (2.20) (0.08) (3.30) — (3.38) 20.07 (9.12) 0.98 0.97 0.37 26 2612-31-2014 25.87 0.09 2.38 2.47 (0.07) (2.62) — (2.69) 25.65 9.61 0.98 0.97 0.33 33 4912-31-2013 19.26 0.10 6.66 6.76 (0.15) — — (0.15) 25.87 35.10 0.99 0.99 0.44 36 4212-31-2012 16.54 0.16 2.68 2.84 (0.12) — — (0.12) 19.26 17.18 1.02 1.01 0.87 30 24
SERIES NAV06-30-20173 21.13 0.06 0.36 0.42 — — — — 21.55 1.994 0.775 0.765 0.525 30 2312-31-2016 20.13 0.32 2.73 3.05 (0.16) (1.89) — (2.05) 21.13 15.78 0.74 0.73 1.58 32 3512-31-2015 25.71 0.15 (2.29) (2.14) (0.14) (3.30) — (3.44) 20.13 (8.86) 0.73 0.72 0.63 35 2612-31-2014 25.92 0.15 2.39 2.54 (0.13) (2.62) — (2.75) 25.71 9.88 0.73 0.72 0.57 31 4912-31-2013 19.29 0.16 6.67 6.83 (0.20) — — (0.20) 25.92 35.44 0.74 0.74 0.68 33 4212-31-2012 16.56 0.21 2.68 2.89 (0.16) — — (0.16) 19.29 17.50 0.77 0.76 1.14 24 241. Based on average daily shares outstanding. 2. Total returns would have been lower had certain expenses not been reduced during the applicable periods. 3. Six months ended 6-30-17.Unaudited. 4. Not annualized. 5. Annualized.
John Hancock Variable Insurance TrustFinancial highlights
104The accompanying notes are an integral part of the financial statements.
1. ORGANIZATION John Hancock Variable Insurance Trust (the Trust), is a no load, open-end management investment company organized as a Massachusettsbusiness trust. The Trust is registered under the Investment Company Act of 1940, as amended (the 1940 Act). It is a series company with multiple investment series(portfolios), forty four of which are presented in this report.
American Asset Allocation Trust, American Global Growth Trust, American Growth Trust, American Growth-Income Trust, American International Trust and AmericanNew World Trust (collectively, the JHVIT Feeder Funds); Lifestyle Aggressive PS Series, Lifestyle Balanced PS Series, Lifestyle Conservative PS Series, Lifestyle Growth PSSeries and Lifestyle Moderate PS Series (collectively, the Lifestyle PS Series), and Core Strategy Trust operate as “funds of funds,” investing in shares of mutual funds(underlying funds). The American Funds Insurance Series’ accounting policies are outlined in their financial statements, available at the Securities and ExchangeCommission’s (SEC) website at www.sec.gov, or at the SEC’s public reference room in Washington, D.C. These funds are not covered by this report.
Effective April 28, 2017, All Cap Core Trust merged into Total Stock Market Index Trust.
The portfolios may offer multiple classes of shares: Series I, Series II, Series III and Series NAV. The shares currently offered by a specific portfolio are shown on theStatements of assets and liabilities. Shares of the portfolios are presently offered only to certain affiliates of John Hancock Investment Management Services, LLC (theAdvisor) and Manulife Financial Corporation (MFC) except in the case of the Emerging Markets Value Trust and International Equity Index Trust B where NAV sharesare also offered to variable insurance products of external insurance companies. Shareholders of each class have exclusive voting rights to matters that affect that class.The distribution and service fees, if any, for each class may differ.
2. SIGNIFICANT ACCOUNTING POLICIES The financial statements have been prepared in conformity with accounting principles generally accepted in theUnited States of America (US GAAP), which require management to make certain estimates and assumptions as of the date of the financial statements. Actual resultscould differ from those estimates and those differences could be significant. The portfolios qualify as investment companies under Topic 946 of Accounting StandardsCodification of US GAAP.
Events or transactions occurring after the end of the fiscal period through the date that the financial statements were issued have been evaluated in the preparation ofthe financial statements. The following summarizes the significant accounting policies of the portfolios:
Security valuation. Investments are stated at value as of the scheduled close of regular trading on the New York Stock Exchange (NYSE), normally at 4:00 p.m.,Eastern Time. In case of emergency or other disruption resulting in the NYSE not opening for trading or the NYSE closing at a time other than the regularly scheduledclose, the net asset value (NAV) may be determined as of the regularly scheduled close of the NYSE pursuant to the portfolios’ Valuation Policies and Procedures.
In order to value the securities, the portfolios use the following valuation techniques: Equity securities, including exchange-traded funds, held by the portfolios are typi-cally valued at the last sale price or official closing price on the exchange or principal market where the security trades. In the event there were no sales during the dayor closing prices are not available, the securities are valued using the last available bid price. Except for investments in exchange-traded funds, investments by the port-folios in open-end mutual funds, including John Hancock Collateral Trust (JHCT), are valued at their respective NAVs each business day. Debt obligations are valuedbased on the evaluated prices provided by an independent pricing vendor or from broker-dealers. Independent pricing vendors utilize matrix pricing which takes intoaccount factors such as institutional-size trading in similar groups of securities, yield, quality, coupon rate, maturity, type of issue, trading characteristics and other marketdata, as well as broker supplied prices. Options listed on an exchange are valued at the mean of the most recent bid and ask prices from the exchange where the optiontrades. Unlisted options are valued using evaluated prices obtained from an independent pricing vendor. Futures contracts are valued at settlement prices, which are theofficial closing prices published by the exchange on which they trade. Foreign index futures that trade in the electronic trading market subsequent to the close of regulartrading and have sufficient liquidity will be valued at the last traded price in the electronic trading market as of 4:00 p.m. ET. Foreign securities and currencies, includingforward foreign currency contracts, are valued in U.S. dollars based on foreign currency exchange rates supplied by an independent pricing vendor.
In certain instances, the Pricing Committee may determine to value equity securities using prices obtained from another exchange or market if trading on the exchangeor market on which prices are typically obtained did not open for trading as scheduled, or if trading closed earlier than scheduled, and trading occurred as normal onanother exchange or market.
Other portfolio securities and assets, for which reliable market quotations are not readily available, are valued at fair value as determined in good faith by the portfolios’Pricing Committee following procedures established by the Board of Trustees. The frequency with which these fair valuation procedures are used cannot be predicted andfair value of securities may differ significantly from the value that would have been used had a ready market for such securities existed. Trading in foreign securities maybe completed before the scheduled daily close of trading on the NYSE. Significant events at the issuer or market level may affect the values of securities between the timewhen the valuation of the securities is generally determined and the close of the NYSE. If a significant event occurs, these securities may be fair valued, as determined ingood faith by the portfolios’ Pricing Committee, following procedures established by the Board of Trustees. The portfolios use fair value adjustment factors provided by anindependent pricing vendor to value certain foreign securities in order to adjust for events that may occur between the close of foreign exchanges or markets and theclose of the NYSE.
The portfolios use a three-tier hierarchy to prioritize the pricing assumptions, referred to as inputs, used in valuation techniques to measure fair value. Level 1 includessecurities valued using quoted prices in active markets for identical securities, including registered investment companies. Level 2 includes securities valued using othersignificant observable inputs. Observable inputs may include quoted prices for similar securities, interest rates, prepayment speeds and credit risk. Prices for securitiesvalued using these inputs are received from independent pricing vendors and brokers and are based on an evaluation of the inputs described. Level 3 includes securitiesvalued using significant unobservable inputs when market prices are not readily available or reliable, including the portfolios’ own assumptions in determining the fairvalue of investments. Factors used in determining value may include market or issuer specific events or trends, changes in interest rates and credit quality. The inputs ormethodology used for valuing securities are not necessarily an indication of the risks associated with investing in those securities. Changes in valuation techniques andrelated inputs may result in transfers into or out of an assigned level within the disclosure hierarchy.
As of June 30, 2017, for American Asset Allocation Trust, American Global Growth Trust, American Growth Trust, American Growth-Income Trust, AmericanInternational Trust, American New World Trust, Lifestyle Aggressive PS Series, Lifestyle Balanced PS Series, Lifestyle Conservative PS Series, Lifestyle Moderate PS Series,Small Company Growth Trust, Small Company Value Trust and Value Trust, all investments are categorized as Level 1 under the hierarchy described above.
John Hancock Variable Insurance TrustNotes to financial statements (unaudited)
105
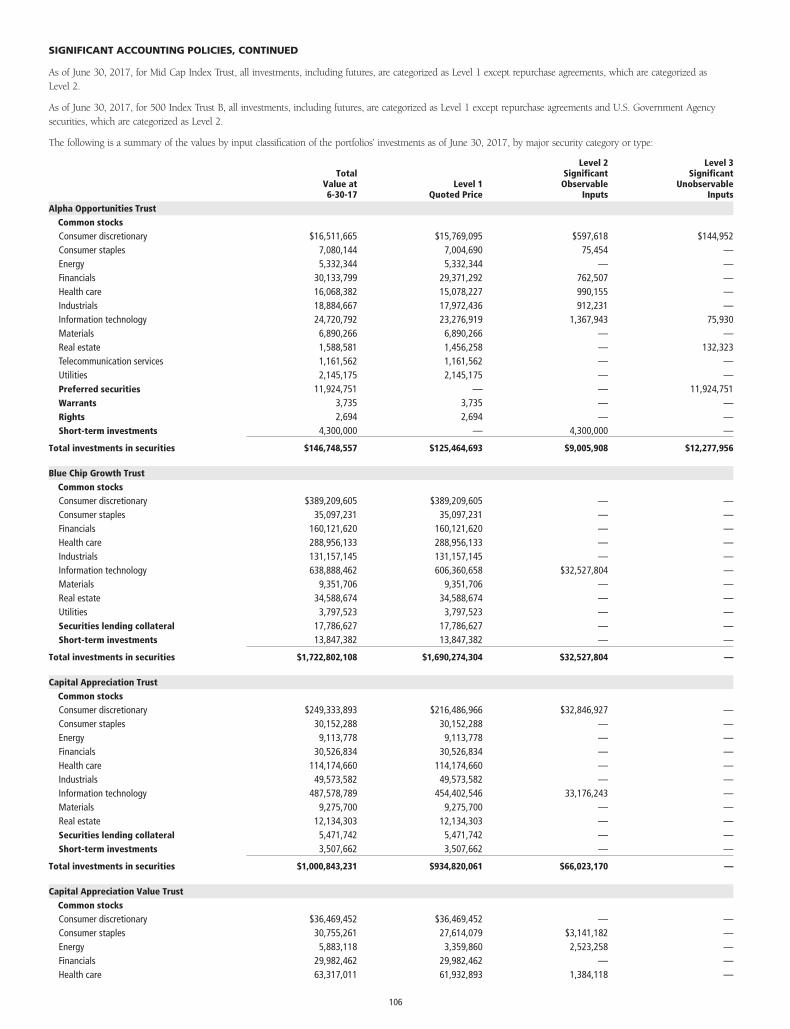
As of June 30, 2017, for Mid Cap Index Trust, all investments, including futures, are categorized as Level 1 except repurchase agreements, which are categorized asLevel 2.
As of June 30, 2017, for 500 Index Trust B, all investments, including futures, are categorized as Level 1 except repurchase agreements and U.S. Government Agencysecurities, which are categorized as Level 2.
The following is a summary of the values by input classification of the portfolios’ investments as of June 30, 2017, by major security category or type:
TotalValue at6-30-17
Level 1Quoted Price
Level 2SignificantObservable
Inputs
Level 3Significant
UnobservableInputs
Alpha Opportunities TrustCommon stocksConsumer discretionary $16,511,665 $15,769,095 $597,618 $144,952Consumer staples 7,080,144 7,004,690 75,454 —Energy 5,332,344 5,332,344 — —Financials 30,133,799 29,371,292 762,507 —Health care 16,068,382 15,078,227 990,155 —Industrials 18,884,667 17,972,436 912,231 —Information technology 24,720,792 23,276,919 1,367,943 75,930Materials 6,890,266 6,890,266 — —Real estate 1,588,581 1,456,258 — 132,323Telecommunication services 1,161,562 1,161,562 — —Utilities 2,145,175 2,145,175 — —Preferred securities 11,924,751 — — 11,924,751Warrants 3,735 3,735 — —Rights 2,694 2,694 — —Short-term investments 4,300,000 — 4,300,000 —
Total investments in securities $146,748,557 $125,464,693 $9,005,908 $12,277,956
Blue Chip Growth TrustCommon stocksConsumer discretionary $389,209,605 $389,209,605 — —Consumer staples 35,097,231 35,097,231 — —Financials 160,121,620 160,121,620 — —Health care 288,956,133 288,956,133 — —Industrials 131,157,145 131,157,145 — —Information technology 638,888,462 606,360,658 $32,527,804 —Materials 9,351,706 9,351,706 — —Real estate 34,588,674 34,588,674 — —Utilities 3,797,523 3,797,523 — —Securities lending collateral 17,786,627 17,786,627 — —Short-term investments 13,847,382 13,847,382 — —
Total investments in securities $1,722,802,108 $1,690,274,304 $32,527,804 —
Capital Appreciation TrustCommon stocksConsumer discretionary $249,333,893 $216,486,966 $32,846,927 —Consumer staples 30,152,288 30,152,288 — —Energy 9,113,778 9,113,778 — —Financials 30,526,834 30,526,834 — —Health care 114,174,660 114,174,660 — —Industrials 49,573,582 49,573,582 — —Information technology 487,578,789 454,402,546 33,176,243 —Materials 9,275,700 9,275,700 — —Real estate 12,134,303 12,134,303 — —Securities lending collateral 5,471,742 5,471,742 — —Short-term investments 3,507,662 3,507,662 — —
Total investments in securities $1,000,843,231 $934,820,061 $66,023,170 —
Capital Appreciation Value TrustCommon stocksConsumer discretionary $36,469,452 $36,469,452 — —Consumer staples 30,755,261 27,614,079 $3,141,182 —Energy 5,883,118 3,359,860 2,523,258 —Financials 29,982,462 29,982,462 — —Health care 63,317,011 61,932,893 1,384,118 —
SIGNIFICANT ACCOUNTING POLICIES, CONTINUED
106
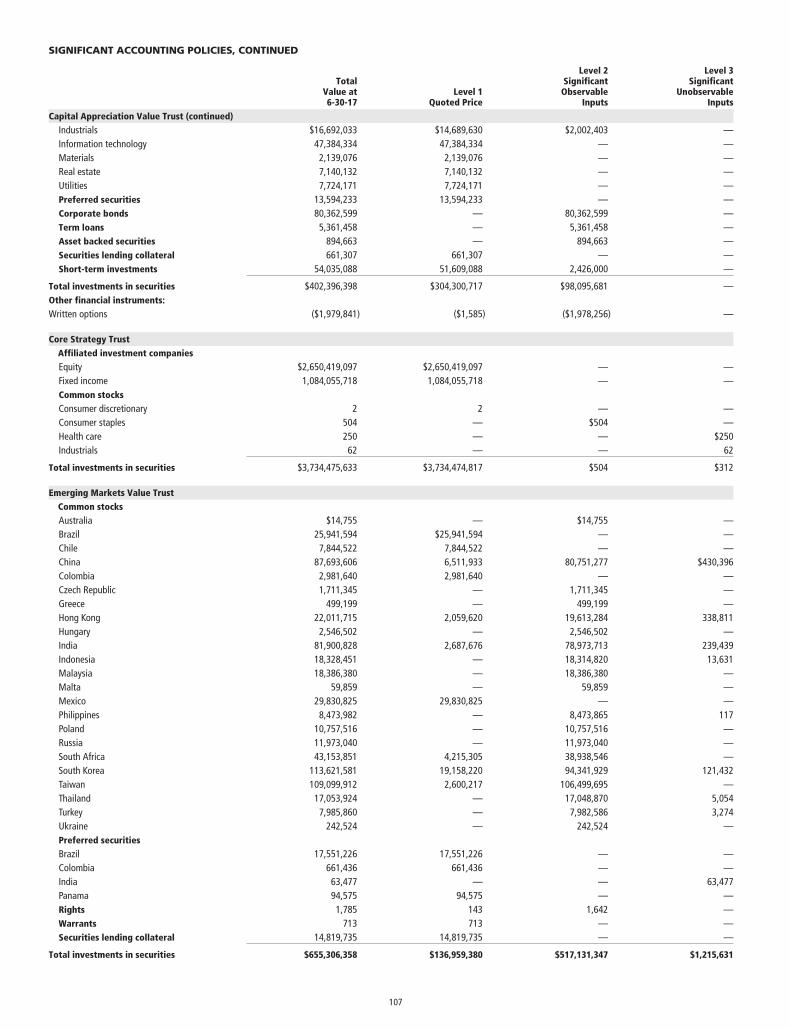
TotalValue at6-30-17
Level 1Quoted Price
Level 2SignificantObservable
Inputs
Level 3Significant
UnobservableInputs
Capital Appreciation Value Trust (continued)Industrials $16,692,033 $14,689,630 $2,002,403 —Information technology 47,384,334 47,384,334 — —Materials 2,139,076 2,139,076 — —Real estate 7,140,132 7,140,132 — —Utilities 7,724,171 7,724,171 — —Preferred securities 13,594,233 13,594,233 — —Corporate bonds 80,362,599 — 80,362,599 —Term loans 5,361,458 — 5,361,458 —Asset backed securities 894,663 — 894,663 —Securities lending collateral 661,307 661,307 — —Short-term investments 54,035,088 51,609,088 2,426,000 —
Total investments in securities $402,396,398 $304,300,717 $98,095,681 —Other financial instruments:Written options ($1,979,841) ($1,585) ($1,978,256) —
Core Strategy TrustAffiliated investment companiesEquity $2,650,419,097 $2,650,419,097 — —Fixed income 1,084,055,718 1,084,055,718 — —Common stocksConsumer discretionary 2 2 — —Consumer staples 504 — $504 —Health care 250 — — $250Industrials 62 — — 62
Total investments in securities $3,734,475,633 $3,734,474,817 $504 $312
Emerging Markets Value TrustCommon stocksAustralia $14,755 — $14,755 —Brazil 25,941,594 $25,941,594 — —Chile 7,844,522 7,844,522 — —China 87,693,606 6,511,933 80,751,277 $430,396Colombia 2,981,640 2,981,640 — —Czech Republic 1,711,345 — 1,711,345 —Greece 499,199 — 499,199 —Hong Kong 22,011,715 2,059,620 19,613,284 338,811Hungary 2,546,502 — 2,546,502 —India 81,900,828 2,687,676 78,973,713 239,439Indonesia 18,328,451 — 18,314,820 13,631Malaysia 18,386,380 — 18,386,380 —Malta 59,859 — 59,859 —Mexico 29,830,825 29,830,825 — —Philippines 8,473,982 — 8,473,865 117Poland 10,757,516 — 10,757,516 —Russia 11,973,040 — 11,973,040 —South Africa 43,153,851 4,215,305 38,938,546 —South Korea 113,621,581 19,158,220 94,341,929 121,432Taiwan 109,099,912 2,600,217 106,499,695 —Thailand 17,053,924 — 17,048,870 5,054Turkey 7,985,860 — 7,982,586 3,274Ukraine 242,524 — 242,524 —Preferred securitiesBrazil 17,551,226 17,551,226 — —Colombia 661,436 661,436 — —India 63,477 — — 63,477Panama 94,575 94,575 — —Rights 1,785 143 1,642 —Warrants 713 713 — —Securities lending collateral 14,819,735 14,819,735 — —
Total investments in securities $655,306,358 $136,959,380 $517,131,347 $1,215,631
SIGNIFICANT ACCOUNTING POLICIES, CONTINUED
107
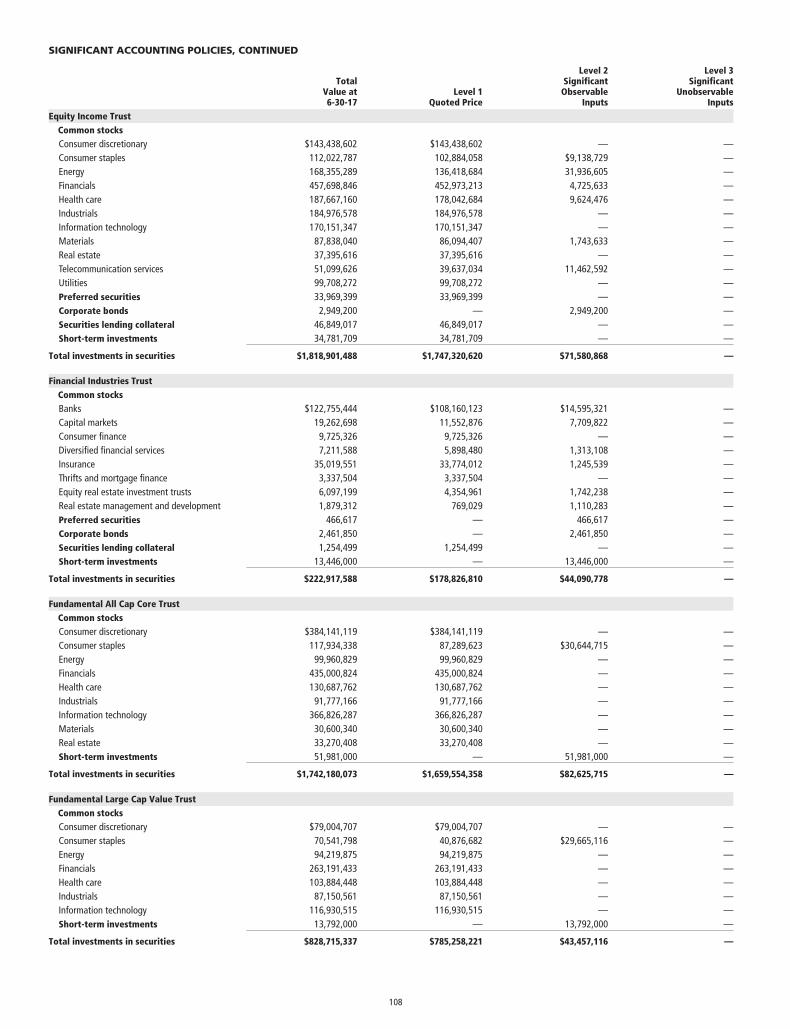
TotalValue at6-30-17
Level 1Quoted Price
Level 2SignificantObservable
Inputs
Level 3Significant
UnobservableInputs
Equity Income TrustCommon stocksConsumer discretionary $143,438,602 $143,438,602 — —Consumer staples 112,022,787 102,884,058 $9,138,729 —Energy 168,355,289 136,418,684 31,936,605 —Financials 457,698,846 452,973,213 4,725,633 —Health care 187,667,160 178,042,684 9,624,476 —Industrials 184,976,578 184,976,578 — —Information technology 170,151,347 170,151,347 — —Materials 87,838,040 86,094,407 1,743,633 —Real estate 37,395,616 37,395,616 — —Telecommunication services 51,099,626 39,637,034 11,462,592 —Utilities 99,708,272 99,708,272 — —Preferred securities 33,969,399 33,969,399 — —Corporate bonds 2,949,200 — 2,949,200 —Securities lending collateral 46,849,017 46,849,017 — —Short-term investments 34,781,709 34,781,709 — —
Total investments in securities $1,818,901,488 $1,747,320,620 $71,580,868 —
Financial Industries TrustCommon stocksBanks $122,755,444 $108,160,123 $14,595,321 —Capital markets 19,262,698 11,552,876 7,709,822 —Consumer finance 9,725,326 9,725,326 — —Diversified financial services 7,211,588 5,898,480 1,313,108 —Insurance 35,019,551 33,774,012 1,245,539 —Thrifts and mortgage finance 3,337,504 3,337,504 — —Equity real estate investment trusts 6,097,199 4,354,961 1,742,238 —Real estate management and development 1,879,312 769,029 1,110,283 —Preferred securities 466,617 — 466,617 —Corporate bonds 2,461,850 — 2,461,850 —Securities lending collateral 1,254,499 1,254,499 — —Short-term investments 13,446,000 — 13,446,000 —
Total investments in securities $222,917,588 $178,826,810 $44,090,778 —
Fundamental All Cap Core TrustCommon stocksConsumer discretionary $384,141,119 $384,141,119 — —Consumer staples 117,934,338 87,289,623 $30,644,715 —Energy 99,960,829 99,960,829 — —Financials 435,000,824 435,000,824 — —Health care 130,687,762 130,687,762 — —Industrials 91,777,166 91,777,166 — —Information technology 366,826,287 366,826,287 — —Materials 30,600,340 30,600,340 — —Real estate 33,270,408 33,270,408 — —Short-term investments 51,981,000 — 51,981,000 —
Total investments in securities $1,742,180,073 $1,659,554,358 $82,625,715 —
Fundamental Large Cap Value TrustCommon stocksConsumer discretionary $79,004,707 $79,004,707 — —Consumer staples 70,541,798 40,876,682 $29,665,116 —Energy 94,219,875 94,219,875 — —Financials 263,191,433 263,191,433 — —Health care 103,884,448 103,884,448 — —Industrials 87,150,561 87,150,561 — —Information technology 116,930,515 116,930,515 — —Short-term investments 13,792,000 — 13,792,000 —
Total investments in securities $828,715,337 $785,258,221 $43,457,116 —
SIGNIFICANT ACCOUNTING POLICIES, CONTINUED
108
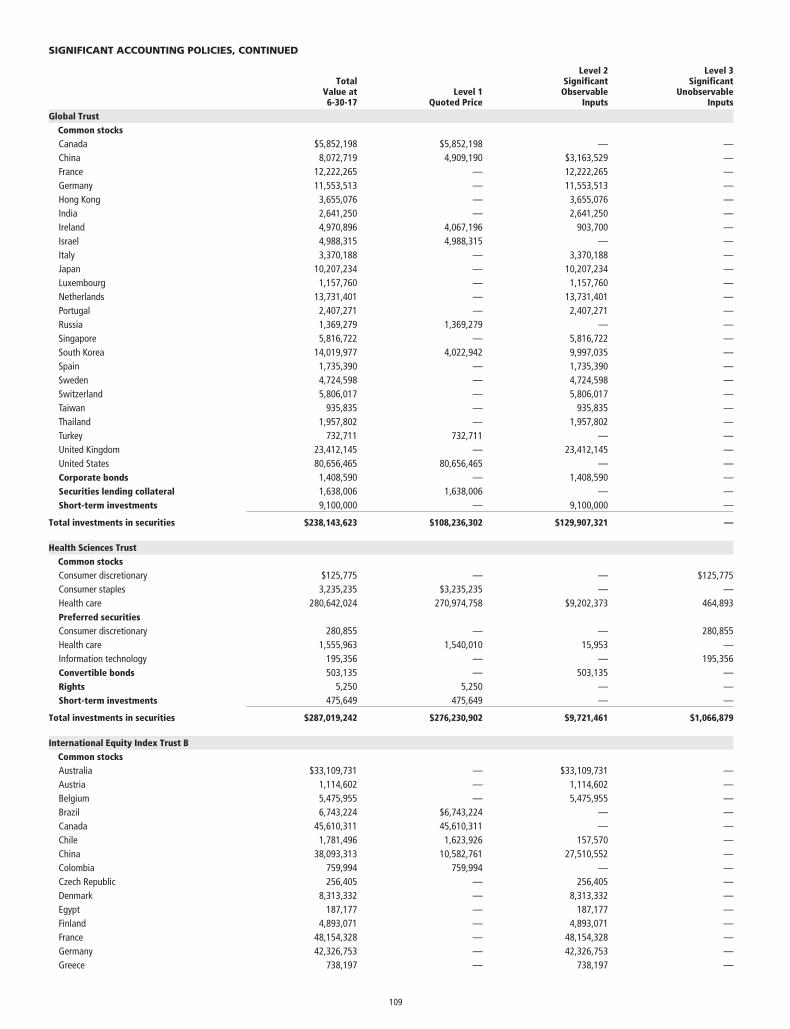
TotalValue at6-30-17
Level 1Quoted Price
Level 2SignificantObservable
Inputs
Level 3Significant
UnobservableInputs
Global TrustCommon stocksCanada $5,852,198 $5,852,198 — —China 8,072,719 4,909,190 $3,163,529 —France 12,222,265 — 12,222,265 —Germany 11,553,513 — 11,553,513 —Hong Kong 3,655,076 — 3,655,076 —India 2,641,250 — 2,641,250 —Ireland 4,970,896 4,067,196 903,700 —Israel 4,988,315 4,988,315 — —Italy 3,370,188 — 3,370,188 —Japan 10,207,234 — 10,207,234 —Luxembourg 1,157,760 — 1,157,760 —Netherlands 13,731,401 — 13,731,401 —Portugal 2,407,271 — 2,407,271 —Russia 1,369,279 1,369,279 — —Singapore 5,816,722 — 5,816,722 —South Korea 14,019,977 4,022,942 9,997,035 —Spain 1,735,390 — 1,735,390 —Sweden 4,724,598 — 4,724,598 —Switzerland 5,806,017 — 5,806,017 —Taiwan 935,835 — 935,835 —Thailand 1,957,802 — 1,957,802 —Turkey 732,711 732,711 — —United Kingdom 23,412,145 — 23,412,145 —United States 80,656,465 80,656,465 — —Corporate bonds 1,408,590 — 1,408,590 —Securities lending collateral 1,638,006 1,638,006 — —Short-term investments 9,100,000 — 9,100,000 —
Total investments in securities $238,143,623 $108,236,302 $129,907,321 —
Health Sciences TrustCommon stocksConsumer discretionary $125,775 — — $125,775Consumer staples 3,235,235 $3,235,235 — —Health care 280,642,024 270,974,758 $9,202,373 464,893Preferred securitiesConsumer discretionary 280,855 — — 280,855Health care 1,555,963 1,540,010 15,953 —Information technology 195,356 — — 195,356Convertible bonds 503,135 — 503,135 —Rights 5,250 5,250 — —Short-term investments 475,649 475,649 — —
Total investments in securities $287,019,242 $276,230,902 $9,721,461 $1,066,879
International Equity Index Trust BCommon stocksAustralia $33,109,731 — $33,109,731 —Austria 1,114,602 — 1,114,602 —Belgium 5,475,955 — 5,475,955 —Brazil 6,743,224 $6,743,224 — —Canada 45,610,311 45,610,311 — —Chile 1,781,496 1,623,926 157,570 —China 38,093,313 10,582,761 27,510,552 —Colombia 759,994 759,994 — —Czech Republic 256,405 — 256,405 —Denmark 8,313,332 — 8,313,332 —Egypt 187,177 — 187,177 —Finland 4,893,071 — 4,893,071 —France 48,154,328 — 48,154,328 —Germany 42,326,753 — 42,326,753 —Greece 738,197 — 738,197 —
SIGNIFICANT ACCOUNTING POLICIES, CONTINUED
109
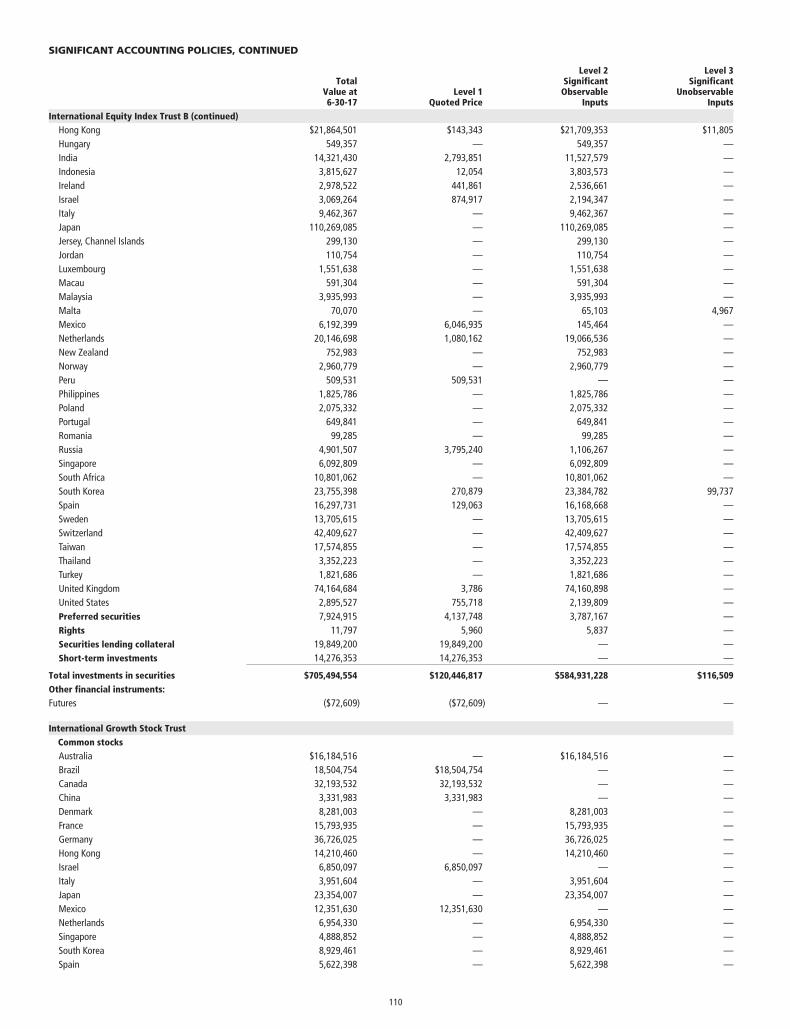
TotalValue at6-30-17
Level 1Quoted Price
Level 2SignificantObservable
Inputs
Level 3Significant
UnobservableInputs
International Equity Index Trust B (continued)Hong Kong $21,864,501 $143,343 $21,709,353 $11,805Hungary 549,357 — 549,357 —India 14,321,430 2,793,851 11,527,579 —Indonesia 3,815,627 12,054 3,803,573 —Ireland 2,978,522 441,861 2,536,661 —Israel 3,069,264 874,917 2,194,347 —Italy 9,462,367 — 9,462,367 —Japan 110,269,085 — 110,269,085 —Jersey, Channel Islands 299,130 — 299,130 —Jordan 110,754 — 110,754 —Luxembourg 1,551,638 — 1,551,638 —Macau 591,304 — 591,304 —Malaysia 3,935,993 — 3,935,993 —Malta 70,070 — 65,103 4,967Mexico 6,192,399 6,046,935 145,464 —Netherlands 20,146,698 1,080,162 19,066,536 —New Zealand 752,983 — 752,983 —Norway 2,960,779 — 2,960,779 —Peru 509,531 509,531 — —Philippines 1,825,786 — 1,825,786 —Poland 2,075,332 — 2,075,332 —Portugal 649,841 — 649,841 —Romania 99,285 — 99,285 —Russia 4,901,507 3,795,240 1,106,267 —Singapore 6,092,809 — 6,092,809 —South Africa 10,801,062 — 10,801,062 —South Korea 23,755,398 270,879 23,384,782 99,737Spain 16,297,731 129,063 16,168,668 —Sweden 13,705,615 — 13,705,615 —Switzerland 42,409,627 — 42,409,627 —Taiwan 17,574,855 — 17,574,855 —Thailand 3,352,223 — 3,352,223 —Turkey 1,821,686 — 1,821,686 —United Kingdom 74,164,684 3,786 74,160,898 —United States 2,895,527 755,718 2,139,809 —Preferred securities 7,924,915 4,137,748 3,787,167 —Rights 11,797 5,960 5,837 —Securities lending collateral 19,849,200 19,849,200 — —Short-term investments 14,276,353 14,276,353 — —
Total investments in securities $705,494,554 $120,446,817 $584,931,228 $116,509Other financial instruments:Futures ($72,609) ($72,609) — —
International Growth Stock TrustCommon stocksAustralia $16,184,516 — $16,184,516 —Brazil 18,504,754 $18,504,754 — —Canada 32,193,532 32,193,532 — —China 3,331,983 3,331,983 — —Denmark 8,281,003 — 8,281,003 —France 15,793,935 — 15,793,935 —Germany 36,726,025 — 36,726,025 —Hong Kong 14,210,460 — 14,210,460 —Israel 6,850,097 6,850,097 — —Italy 3,951,604 — 3,951,604 —Japan 23,354,007 — 23,354,007 —Mexico 12,351,630 12,351,630 — —Netherlands 6,954,330 — 6,954,330 —Singapore 4,888,852 — 4,888,852 —South Korea 8,929,461 — 8,929,461 —Spain 5,622,398 — 5,622,398 —
SIGNIFICANT ACCOUNTING POLICIES, CONTINUED
110
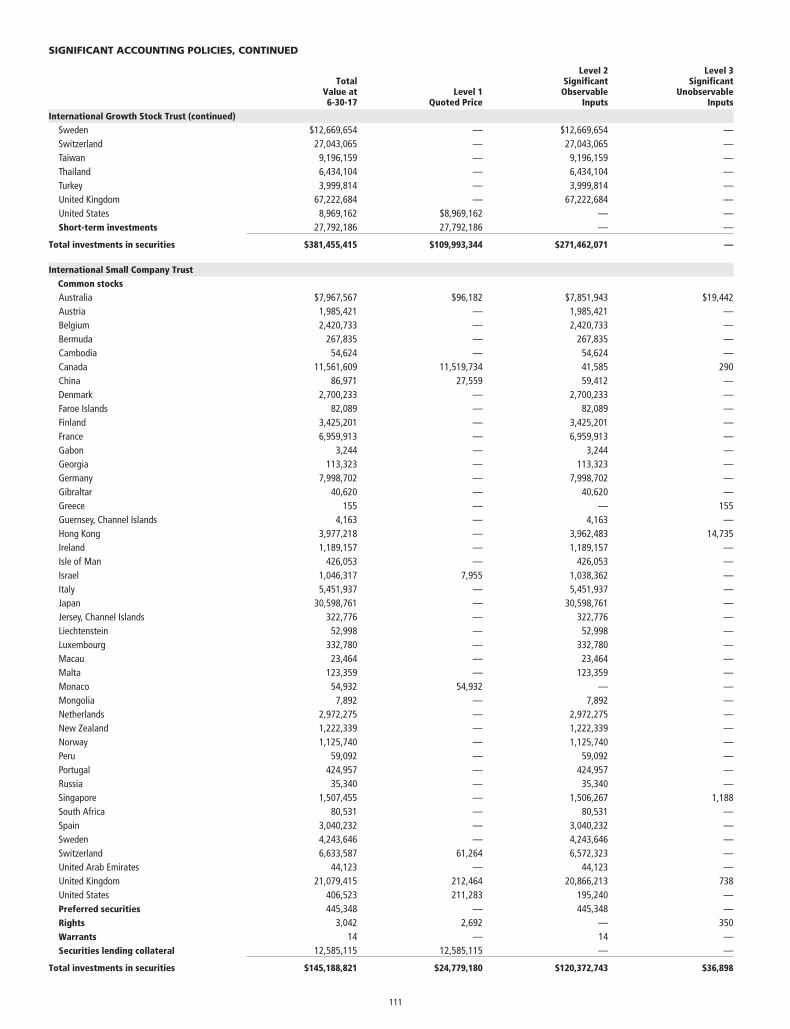
TotalValue at6-30-17
Level 1Quoted Price
Level 2SignificantObservable
Inputs
Level 3Significant
UnobservableInputs
International Growth Stock Trust (continued)Sweden $12,669,654 — $12,669,654 —Switzerland 27,043,065 — 27,043,065 —Taiwan 9,196,159 — 9,196,159 —Thailand 6,434,104 — 6,434,104 —Turkey 3,999,814 — 3,999,814 —United Kingdom 67,222,684 — 67,222,684 —United States 8,969,162 $8,969,162 — —Short-term investments 27,792,186 27,792,186 — —
Total investments in securities $381,455,415 $109,993,344 $271,462,071 —
International Small Company TrustCommon stocksAustralia $7,967,567 $96,182 $7,851,943 $19,442Austria 1,985,421 — 1,985,421 —Belgium 2,420,733 — 2,420,733 —Bermuda 267,835 — 267,835 —Cambodia 54,624 — 54,624 —Canada 11,561,609 11,519,734 41,585 290China 86,971 27,559 59,412 —Denmark 2,700,233 — 2,700,233 —Faroe Islands 82,089 — 82,089 —Finland 3,425,201 — 3,425,201 —France 6,959,913 — 6,959,913 —Gabon 3,244 — 3,244 —Georgia 113,323 — 113,323 —Germany 7,998,702 — 7,998,702 —Gibraltar 40,620 — 40,620 —Greece 155 — — 155Guernsey, Channel Islands 4,163 — 4,163 —Hong Kong 3,977,218 — 3,962,483 14,735Ireland 1,189,157 — 1,189,157 —Isle of Man 426,053 — 426,053 —Israel 1,046,317 7,955 1,038,362 —Italy 5,451,937 — 5,451,937 —Japan 30,598,761 — 30,598,761 —Jersey, Channel Islands 322,776 — 322,776 —Liechtenstein 52,998 — 52,998 —Luxembourg 332,780 — 332,780 —Macau 23,464 — 23,464 —Malta 123,359 — 123,359 —Monaco 54,932 54,932 — —Mongolia 7,892 — 7,892 —Netherlands 2,972,275 — 2,972,275 —New Zealand 1,222,339 — 1,222,339 —Norway 1,125,740 — 1,125,740 —Peru 59,092 — 59,092 —Portugal 424,957 — 424,957 —Russia 35,340 — 35,340 —Singapore 1,507,455 — 1,506,267 1,188South Africa 80,531 — 80,531 —Spain 3,040,232 — 3,040,232 —Sweden 4,243,646 — 4,243,646 —Switzerland 6,633,587 61,264 6,572,323 —United Arab Emirates 44,123 — 44,123 —United Kingdom 21,079,415 212,464 20,866,213 738United States 406,523 211,283 195,240 —Preferred securities 445,348 — 445,348 —Rights 3,042 2,692 — 350Warrants 14 — 14 —Securities lending collateral 12,585,115 12,585,115 — —
Total investments in securities $145,188,821 $24,779,180 $120,372,743 $36,898
SIGNIFICANT ACCOUNTING POLICIES, CONTINUED
111
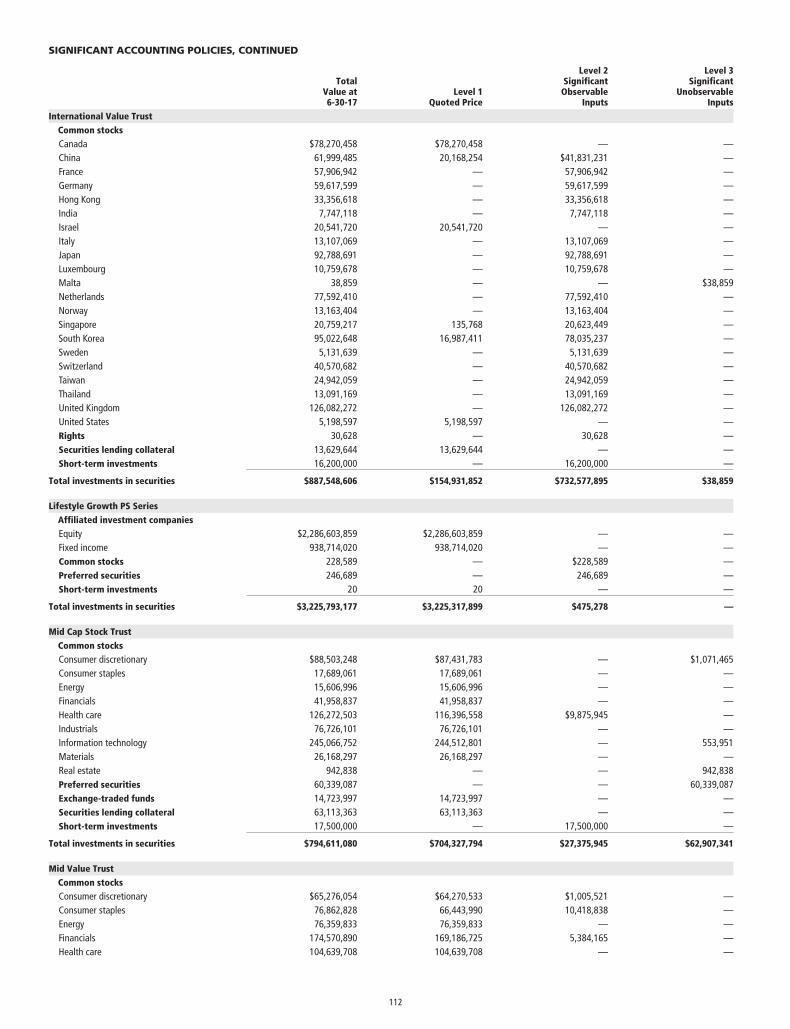
TotalValue at6-30-17
Level 1Quoted Price
Level 2SignificantObservable
Inputs
Level 3Significant
UnobservableInputs
International Value TrustCommon stocksCanada $78,270,458 $78,270,458 — —China 61,999,485 20,168,254 $41,831,231 —France 57,906,942 — 57,906,942 —Germany 59,617,599 — 59,617,599 —Hong Kong 33,356,618 — 33,356,618 —India 7,747,118 — 7,747,118 —Israel 20,541,720 20,541,720 — —Italy 13,107,069 — 13,107,069 —Japan 92,788,691 — 92,788,691 —Luxembourg 10,759,678 — 10,759,678 —Malta 38,859 — — $38,859Netherlands 77,592,410 — 77,592,410 —Norway 13,163,404 — 13,163,404 —Singapore 20,759,217 135,768 20,623,449 —South Korea 95,022,648 16,987,411 78,035,237 —Sweden 5,131,639 — 5,131,639 —Switzerland 40,570,682 — 40,570,682 —Taiwan 24,942,059 — 24,942,059 —Thailand 13,091,169 — 13,091,169 —United Kingdom 126,082,272 — 126,082,272 —United States 5,198,597 5,198,597 — —Rights 30,628 — 30,628 —Securities lending collateral 13,629,644 13,629,644 — —Short-term investments 16,200,000 — 16,200,000 —
Total investments in securities $887,548,606 $154,931,852 $732,577,895 $38,859
Lifestyle Growth PS SeriesAffiliated investment companiesEquity $2,286,603,859 $2,286,603,859 — —Fixed income 938,714,020 938,714,020 — —Common stocks 228,589 — $228,589 —Preferred securities 246,689 — 246,689 —Short-term investments 20 20 — —
Total investments in securities $3,225,793,177 $3,225,317,899 $475,278 —
Mid Cap Stock TrustCommon stocksConsumer discretionary $88,503,248 $87,431,783 — $1,071,465Consumer staples 17,689,061 17,689,061 — —Energy 15,606,996 15,606,996 — —Financials 41,958,837 41,958,837 — —Health care 126,272,503 116,396,558 $9,875,945 —Industrials 76,726,101 76,726,101 — —Information technology 245,066,752 244,512,801 — 553,951Materials 26,168,297 26,168,297 — —Real estate 942,838 — — 942,838Preferred securities 60,339,087 — — 60,339,087Exchange-traded funds 14,723,997 14,723,997 — —Securities lending collateral 63,113,363 63,113,363 — —Short-term investments 17,500,000 — 17,500,000 —
Total investments in securities $794,611,080 $704,327,794 $27,375,945 $62,907,341
Mid Value TrustCommon stocksConsumer discretionary $65,276,054 $64,270,533 $1,005,521 —Consumer staples 76,862,828 66,443,990 10,418,838 —Energy 76,359,833 76,359,833 — —Financials 174,570,890 169,186,725 5,384,165 —Health care 104,639,708 104,639,708 — —
SIGNIFICANT ACCOUNTING POLICIES, CONTINUED
112
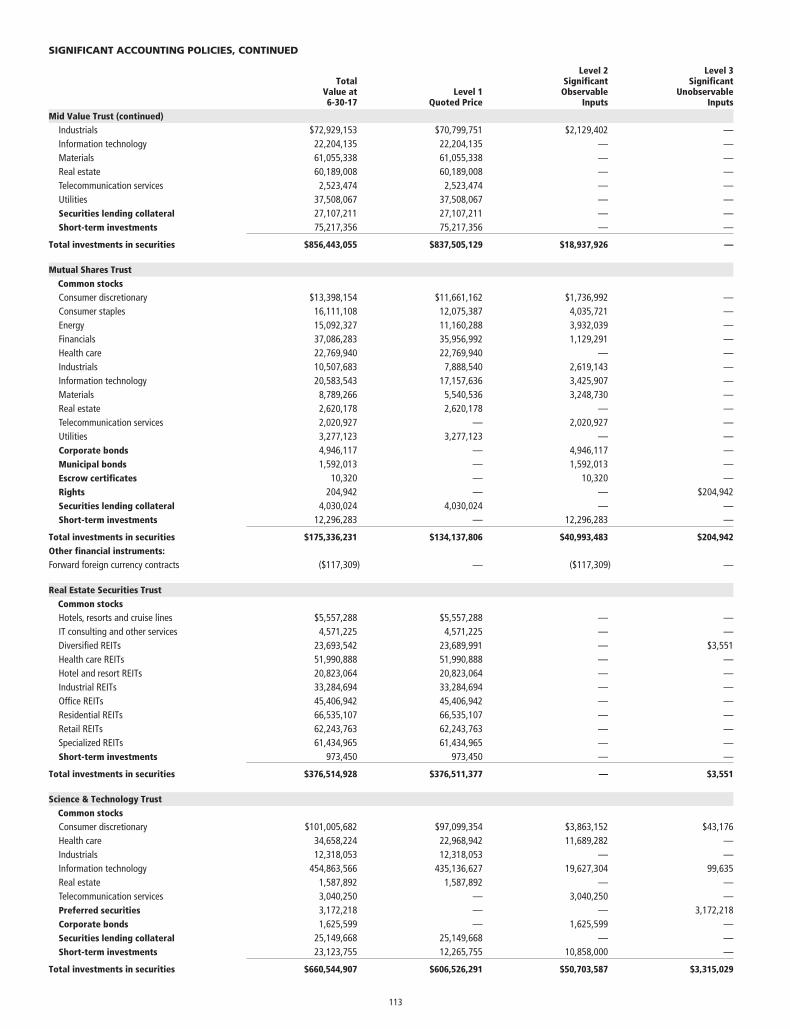
TotalValue at6-30-17
Level 1Quoted Price
Level 2SignificantObservable
Inputs
Level 3Significant
UnobservableInputs
Mid Value Trust (continued)Industrials $72,929,153 $70,799,751 $2,129,402 —Information technology 22,204,135 22,204,135 — —Materials 61,055,338 61,055,338 — —Real estate 60,189,008 60,189,008 — —Telecommunication services 2,523,474 2,523,474 — —Utilities 37,508,067 37,508,067 — —Securities lending collateral 27,107,211 27,107,211 — —Short-term investments 75,217,356 75,217,356 — —
Total investments in securities $856,443,055 $837,505,129 $18,937,926 —
Mutual Shares TrustCommon stocksConsumer discretionary $13,398,154 $11,661,162 $1,736,992 —Consumer staples 16,111,108 12,075,387 4,035,721 —Energy 15,092,327 11,160,288 3,932,039 —Financials 37,086,283 35,956,992 1,129,291 —Health care 22,769,940 22,769,940 — —Industrials 10,507,683 7,888,540 2,619,143 —Information technology 20,583,543 17,157,636 3,425,907 —Materials 8,789,266 5,540,536 3,248,730 —Real estate 2,620,178 2,620,178 — —Telecommunication services 2,020,927 — 2,020,927 —Utilities 3,277,123 3,277,123 — —Corporate bonds 4,946,117 — 4,946,117 —Municipal bonds 1,592,013 — 1,592,013 —Escrow certificates 10,320 — 10,320 —Rights 204,942 — — $204,942Securities lending collateral 4,030,024 4,030,024 — —Short-term investments 12,296,283 — 12,296,283 —
Total investments in securities $175,336,231 $134,137,806 $40,993,483 $204,942Other financial instruments:Forward foreign currency contracts ($117,309) — ($117,309) —
Real Estate Securities TrustCommon stocksHotels, resorts and cruise lines $5,557,288 $5,557,288 — —IT consulting and other services 4,571,225 4,571,225 — —Diversified REITs 23,693,542 23,689,991 — $3,551Health care REITs 51,990,888 51,990,888 — —Hotel and resort REITs 20,823,064 20,823,064 — —Industrial REITs 33,284,694 33,284,694 — —Office REITs 45,406,942 45,406,942 — —Residential REITs 66,535,107 66,535,107 — —Retail REITs 62,243,763 62,243,763 — —Specialized REITs 61,434,965 61,434,965 — —Short-term investments 973,450 973,450 — —
Total investments in securities $376,514,928 $376,511,377 — $3,551
Science & Technology TrustCommon stocksConsumer discretionary $101,005,682 $97,099,354 $3,863,152 $43,176Health care 34,658,224 22,968,942 11,689,282 —Industrials 12,318,053 12,318,053 — —Information technology 454,863,566 435,136,627 19,627,304 99,635Real estate 1,587,892 1,587,892 — —Telecommunication services 3,040,250 — 3,040,250 —Preferred securities 3,172,218 — — 3,172,218Corporate bonds 1,625,599 — 1,625,599 —Securities lending collateral 25,149,668 25,149,668 — —Short-term investments 23,123,755 12,265,755 10,858,000 —
Total investments in securities $660,544,907 $606,526,291 $50,703,587 $3,315,029
SIGNIFICANT ACCOUNTING POLICIES, CONTINUED
113
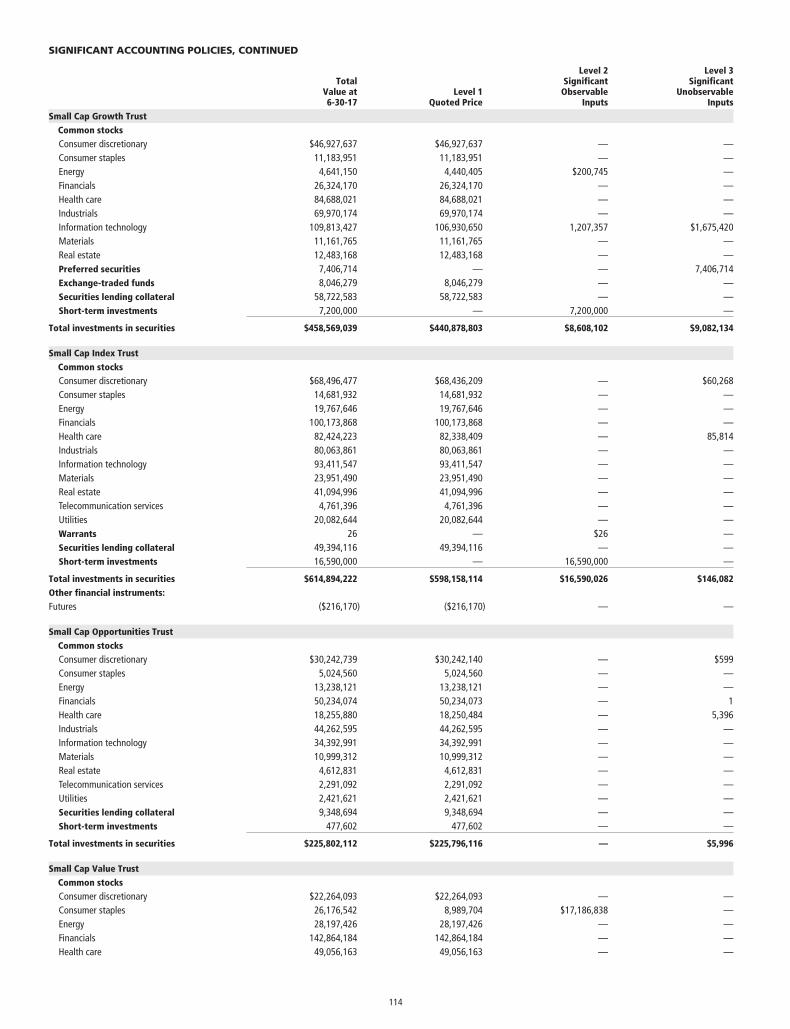
TotalValue at6-30-17
Level 1Quoted Price
Level 2SignificantObservable
Inputs
Level 3Significant
UnobservableInputs
Small Cap Growth TrustCommon stocksConsumer discretionary $46,927,637 $46,927,637 — —Consumer staples 11,183,951 11,183,951 — —Energy 4,641,150 4,440,405 $200,745 —Financials 26,324,170 26,324,170 — —Health care 84,688,021 84,688,021 — —Industrials 69,970,174 69,970,174 — —Information technology 109,813,427 106,930,650 1,207,357 $1,675,420Materials 11,161,765 11,161,765 — —Real estate 12,483,168 12,483,168 — —Preferred securities 7,406,714 — — 7,406,714Exchange-traded funds 8,046,279 8,046,279 — —Securities lending collateral 58,722,583 58,722,583 — —Short-term investments 7,200,000 — 7,200,000 —
Total investments in securities $458,569,039 $440,878,803 $8,608,102 $9,082,134
Small Cap Index TrustCommon stocksConsumer discretionary $68,496,477 $68,436,209 — $60,268Consumer staples 14,681,932 14,681,932 — —Energy 19,767,646 19,767,646 — —Financials 100,173,868 100,173,868 — —Health care 82,424,223 82,338,409 — 85,814Industrials 80,063,861 80,063,861 — —Information technology 93,411,547 93,411,547 — —Materials 23,951,490 23,951,490 — —Real estate 41,094,996 41,094,996 — —Telecommunication services 4,761,396 4,761,396 — —Utilities 20,082,644 20,082,644 — —Warrants 26 — $26 —Securities lending collateral 49,394,116 49,394,116 — —Short-term investments 16,590,000 — 16,590,000 —
Total investments in securities $614,894,222 $598,158,114 $16,590,026 $146,082Other financial instruments:Futures ($216,170) ($216,170) — —
Small Cap Opportunities TrustCommon stocksConsumer discretionary $30,242,739 $30,242,140 — $599Consumer staples 5,024,560 5,024,560 — —Energy 13,238,121 13,238,121 — —Financials 50,234,074 50,234,073 — 1Health care 18,255,880 18,250,484 — 5,396Industrials 44,262,595 44,262,595 — —Information technology 34,392,991 34,392,991 — —Materials 10,999,312 10,999,312 — —Real estate 4,612,831 4,612,831 — —Telecommunication services 2,291,092 2,291,092 — —Utilities 2,421,621 2,421,621 — —Securities lending collateral 9,348,694 9,348,694 — —Short-term investments 477,602 477,602 — —
Total investments in securities $225,802,112 $225,796,116 — $5,996
Small Cap Value TrustCommon stocksConsumer discretionary $22,264,093 $22,264,093 — —Consumer staples 26,176,542 8,989,704 $17,186,838 —Energy 28,197,426 28,197,426 — —Financials 142,864,184 142,864,184 — —Health care 49,056,163 49,056,163 — —
SIGNIFICANT ACCOUNTING POLICIES, CONTINUED
114
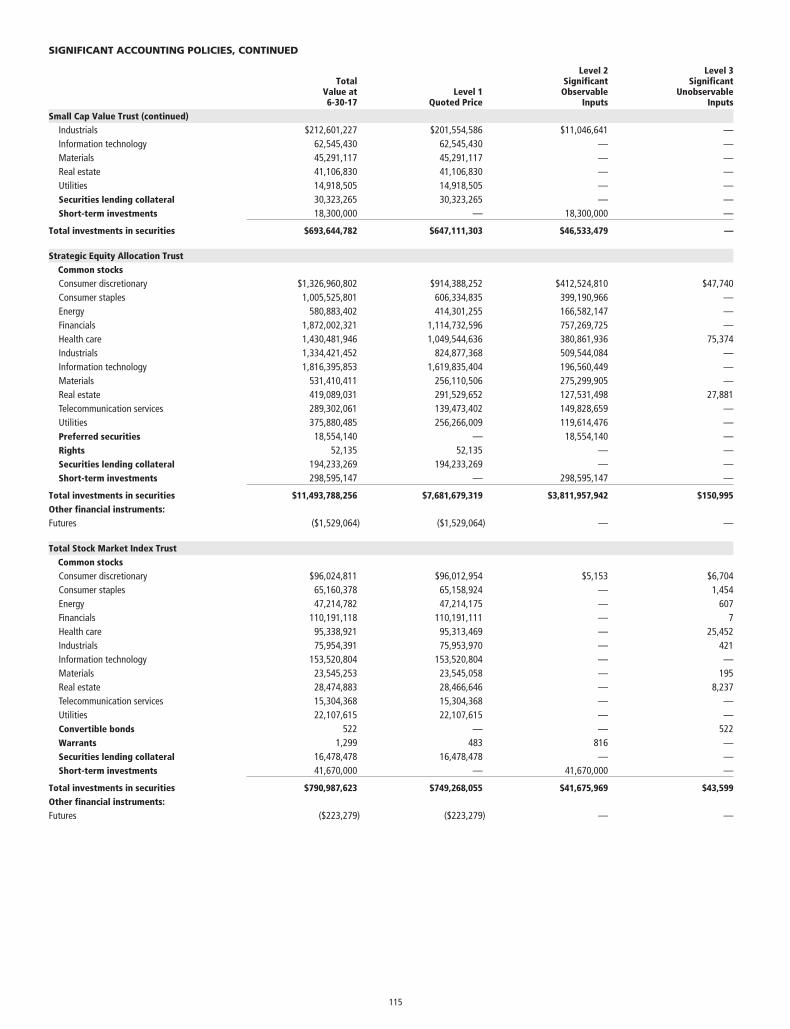
TotalValue at6-30-17
Level 1Quoted Price
Level 2SignificantObservable
Inputs
Level 3Significant
UnobservableInputs
Small Cap Value Trust (continued)Industrials $212,601,227 $201,554,586 $11,046,641 —Information technology 62,545,430 62,545,430 — —Materials 45,291,117 45,291,117 — —Real estate 41,106,830 41,106,830 — —Utilities 14,918,505 14,918,505 — —Securities lending collateral 30,323,265 30,323,265 — —Short-term investments 18,300,000 — 18,300,000 —
Total investments in securities $693,644,782 $647,111,303 $46,533,479 —
Strategic Equity Allocation TrustCommon stocksConsumer discretionary $1,326,960,802 $914,388,252 $412,524,810 $47,740Consumer staples 1,005,525,801 606,334,835 399,190,966 —Energy 580,883,402 414,301,255 166,582,147 —Financials 1,872,002,321 1,114,732,596 757,269,725 —Health care 1,430,481,946 1,049,544,636 380,861,936 75,374Industrials 1,334,421,452 824,877,368 509,544,084 —Information technology 1,816,395,853 1,619,835,404 196,560,449 —Materials 531,410,411 256,110,506 275,299,905 —Real estate 419,089,031 291,529,652 127,531,498 27,881Telecommunication services 289,302,061 139,473,402 149,828,659 —Utilities 375,880,485 256,266,009 119,614,476 —Preferred securities 18,554,140 — 18,554,140 —Rights 52,135 52,135 — —Securities lending collateral 194,233,269 194,233,269 — —Short-term investments 298,595,147 — 298,595,147 —
Total investments in securities $11,493,788,256 $7,681,679,319 $3,811,957,942 $150,995Other financial instruments:Futures ($1,529,064) ($1,529,064) — —
Total Stock Market Index TrustCommon stocksConsumer discretionary $96,024,811 $96,012,954 $5,153 $6,704Consumer staples 65,160,378 65,158,924 — 1,454Energy 47,214,782 47,214,175 — 607Financials 110,191,118 110,191,111 — 7Health care 95,338,921 95,313,469 — 25,452Industrials 75,954,391 75,953,970 — 421Information technology 153,520,804 153,520,804 — —Materials 23,545,253 23,545,058 — 195Real estate 28,474,883 28,466,646 — 8,237Telecommunication services 15,304,368 15,304,368 — —Utilities 22,107,615 22,107,615 — —Convertible bonds 522 — — 522Warrants 1,299 483 816 —Securities lending collateral 16,478,478 16,478,478 — —Short-term investments 41,670,000 — 41,670,000 —
Total investments in securities $790,987,623 $749,268,055 $41,675,969 $43,599Other financial instruments:Futures ($223,279) ($223,279) — —
SIGNIFICANT ACCOUNTING POLICIES, CONTINUED
115
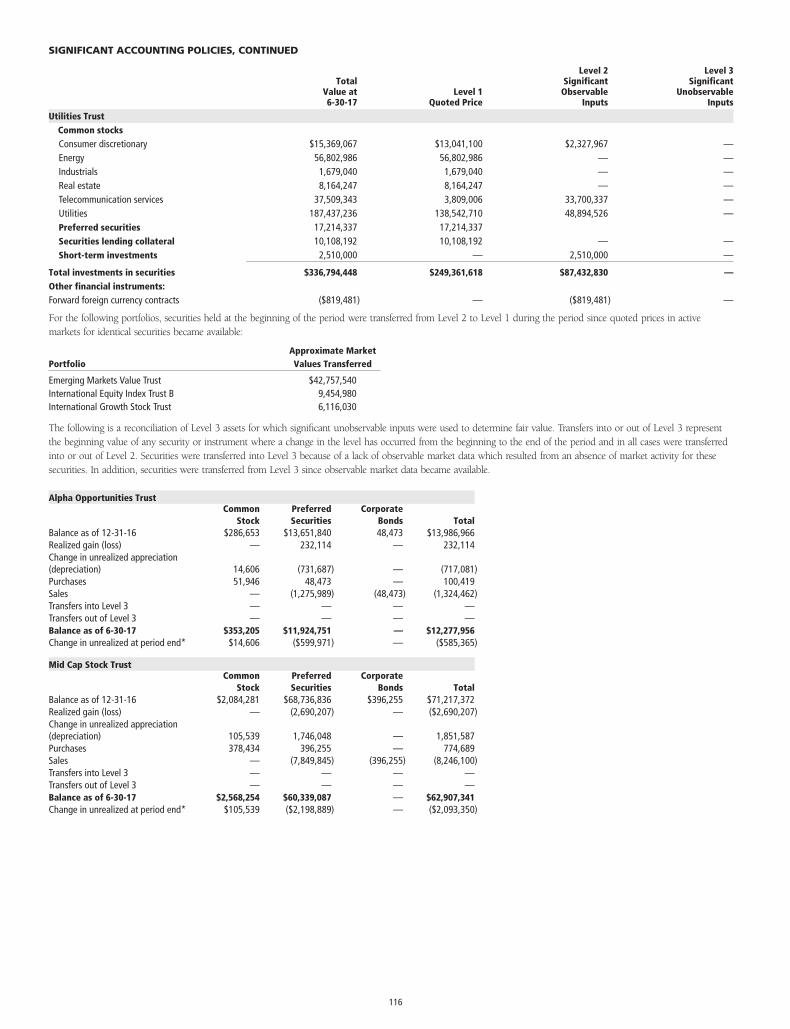
TotalValue at6-30-17
Level 1Quoted Price
Level 2SignificantObservable
Inputs
Level 3Significant
UnobservableInputs
Utilities TrustCommon stocksConsumer discretionary $15,369,067 $13,041,100 $2,327,967 —Energy 56,802,986 56,802,986 — —Industrials 1,679,040 1,679,040 — —Real estate 8,164,247 8,164,247 — —Telecommunication services 37,509,343 3,809,006 33,700,337 —Utilities 187,437,236 138,542,710 48,894,526 —Preferred securities 17,214,337 17,214,337Securities lending collateral 10,108,192 10,108,192 — —Short-term investments 2,510,000 — 2,510,000 —
Total investments in securities $336,794,448 $249,361,618 $87,432,830 —Other financial instruments:Forward foreign currency contracts ($819,481) — ($819,481) —
For the following portfolios, securities held at the beginning of the period were transferred from Level 2 to Level 1 during the period since quoted prices in activemarkets for identical securities became available:
PortfolioApproximate MarketValues Transferred
Emerging Markets Value Trust $42,757,540International Equity Index Trust B 9,454,980International Growth Stock Trust 6,116,030
The following is a reconciliation of Level 3 assets for which significant unobservable inputs were used to determine fair value. Transfers into or out of Level 3 representthe beginning value of any security or instrument where a change in the level has occurred from the beginning to the end of the period and in all cases were transferredinto or out of Level 2. Securities were transferred into Level 3 because of a lack of observable market data which resulted from an absence of market activity for thesesecurities. In addition, securities were transferred from Level 3 since observable market data became available.
Alpha Opportunities TrustCommon
StockPreferredSecurities
CorporateBonds Total
Balance as of 12-31-16 $286,653 $13,651,840 48,473 $13,986,966Realized gain (loss) — 232,114 — 232,114Change in unrealized appreciation(depreciation) 14,606 (731,687) — (717,081)Purchases 51,946 48,473 — 100,419Sales — (1,275,989) (48,473) (1,324,462)Transfers into Level 3 — — — —Transfers out of Level 3 — — — —Balance as of 6-30-17 $353,205 $11,924,751 — $12,277,956Change in unrealized at period end* $14,606 ($599,971) — ($585,365)
Mid Cap Stock TrustCommon
StockPreferredSecurities
CorporateBonds Total
Balance as of 12-31-16 $2,084,281 $68,736,836 $396,255 $71,217,372Realized gain (loss) — (2,690,207) — ($2,690,207)Change in unrealized appreciation(depreciation) 105,539 1,746,048 — 1,851,587Purchases 378,434 396,255 — 774,689Sales — (7,849,845) (396,255) (8,246,100)Transfers into Level 3 — — — —Transfers out of Level 3 — — — —Balance as of 6-30-17 $2,568,254 $60,339,087 — $62,907,341Change in unrealized at period end* $105,539 ($2,198,889) — ($2,093,350)
SIGNIFICANT ACCOUNTING POLICIES, CONTINUED
116
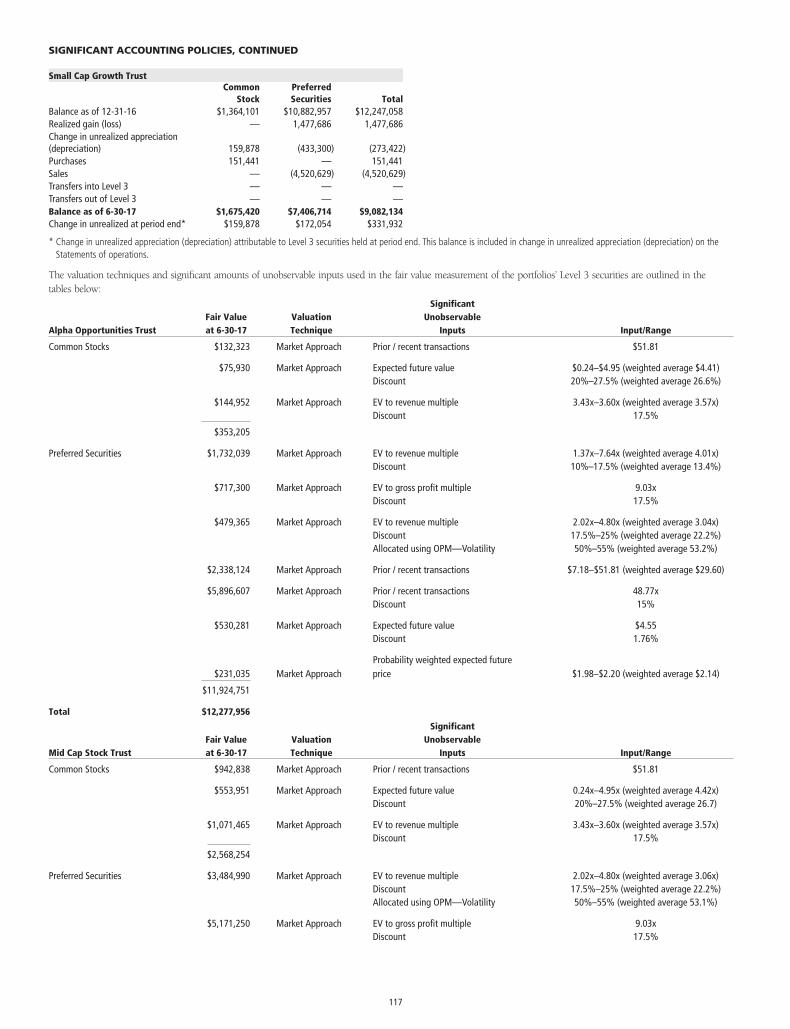
Small Cap Growth TrustCommon
StockPreferredSecurities Total
Balance as of 12-31-16 $1,364,101 $10,882,957 $12,247,058Realized gain (loss) — 1,477,686 1,477,686Change in unrealized appreciation(depreciation) 159,878 (433,300) (273,422)Purchases 151,441 — 151,441Sales — (4,520,629) (4,520,629)Transfers into Level 3 — — —Transfers out of Level 3 — — —Balance as of 6-30-17 $1,675,420 $7,406,714 $9,082,134Change in unrealized at period end* $159,878 $172,054 $331,932
* Change in unrealized appreciation (depreciation) attributable to Level 3 securities held at period end. This balance is included in change in unrealized appreciation (depreciation) on theStatements of operations.
The valuation techniques and significant amounts of unobservable inputs used in the fair value measurement of the portfolios’ Level 3 securities are outlined in thetables below:
Alpha Opportunities TrustFair Valueat 6-30-17
ValuationTechnique
SignificantUnobservable
Inputs Input/Range
Common Stocks $132,323 Market Approach Prior / recent transactions $51.81
$75,930 Market Approach Expected future value $0.24–$4.95 (weighted average $4.41)Discount 20%–27.5% (weighted average 26.6%)
$144,952 Market Approach EV to revenue multiple 3.43x–3.60x (weighted average 3.57x)Discount 17.5%
$353,205
Preferred Securities $1,732,039 Market Approach EV to revenue multiple 1.37x–7.64x (weighted average 4.01x)Discount 10%–17.5% (weighted average 13.4%)
$717,300 Market Approach EV to gross profit multiple 9.03xDiscount 17.5%
$479,365 Market Approach EV to revenue multiple 2.02x–4.80x (weighted average 3.04x)Discount 17.5%–25% (weighted average 22.2%)Allocated using OPM—Volatility 50%–55% (weighted average 53.2%)
$2,338,124 Market Approach Prior / recent transactions $7.18–$51.81 (weighted average $29.60)
$5,896,607 Market Approach Prior / recent transactions 48.77xDiscount 15%
$530,281 Market Approach Expected future value $4.55Discount 1.76%
$231,035 Market ApproachProbability weighted expected futureprice $1.98–$2.20 (weighted average $2.14)
$11,924,751
Total $12,277,956
Mid Cap Stock TrustFair Valueat 6-30-17
ValuationTechnique
SignificantUnobservable
Inputs Input/Range
Common Stocks $942,838 Market Approach Prior / recent transactions $51.81
$553,951 Market Approach Expected future value 0.24x–4.95x (weighted average 4.42x)Discount 20%–27.5% (weighted average 26.7)
$1,071,465 Market Approach EV to revenue multiple 3.43x–3.60x (weighted average 3.57x)Discount 17.5%
$2,568,254
Preferred Securities $3,484,990 Market Approach EV to revenue multiple 2.02x–4.80x (weighted average 3.06x)Discount 17.5%–25% (weighted average 22.2%)Allocated using OPM—Volatility 50%–55% (weighted average 53.1%)
$5,171,250 Market Approach EV to gross profit multiple 9.03xDiscount 17.5%
SIGNIFICANT ACCOUNTING POLICIES, CONTINUED
117
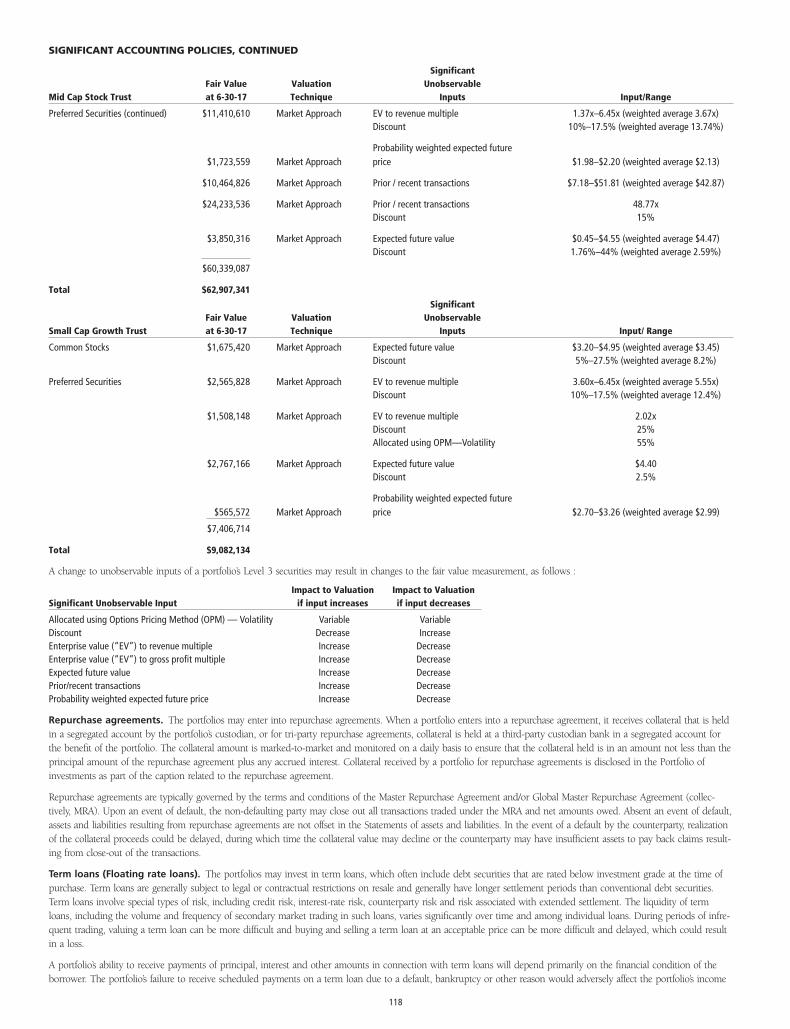
Mid Cap Stock TrustFair Valueat 6-30-17
ValuationTechnique
SignificantUnobservable
Inputs Input/Range
Preferred Securities (continued) $11,410,610 Market Approach EV to revenue multiple 1.37x–6.45x (weighted average 3.67x)Discount 10%–17.5% (weighted average 13.74%)
$1,723,559 Market ApproachProbability weighted expected futureprice $1.98–$2.20 (weighted average $2.13)
$10,464,826 Market Approach Prior / recent transactions $7.18–$51.81 (weighted average $42.87)
$24,233,536 Market Approach Prior / recent transactions 48.77xDiscount 15%
$3,850,316 Market Approach Expected future value $0.45–$4.55 (weighted average $4.47)Discount 1.76%–44% (weighted average 2.59%)
$60,339,087
Total $62,907,341
Small Cap Growth TrustFair Valueat 6-30-17
ValuationTechnique
SignificantUnobservable
Inputs Input/ Range
Common Stocks $1,675,420 Market Approach Expected future value $3.20–$4.95 (weighted average $3.45)Discount 5%–27.5% (weighted average 8.2%)
Preferred Securities $2,565,828 Market Approach EV to revenue multiple 3.60x–6.45x (weighted average 5.55x)Discount 10%–17.5% (weighted average 12.4%)
$1,508,148 Market Approach EV to revenue multiple 2.02xDiscount 25%Allocated using OPM—Volatility 55%
$2,767,166 Market Approach Expected future value $4.40Discount 2.5%
$565,572 Market ApproachProbability weighted expected futureprice $2.70–$3.26 (weighted average $2.99)
$7,406,714
Total $9,082,134
A change to unobservable inputs of a portfolio’s Level 3 securities may result in changes to the fair value measurement, as follows :
Significant Unobservable InputImpact to Valuation
if input increasesImpact to Valuationif input decreases
Allocated using Options Pricing Method (OPM) — Volatility Variable VariableDiscount Decrease IncreaseEnterprise value (“EV”) to revenue multiple Increase DecreaseEnterprise value (“EV”) to gross profit multiple Increase DecreaseExpected future value Increase DecreasePrior/recent transactions Increase DecreaseProbability weighted expected future price Increase Decrease
Repurchase agreements. The portfolios may enter into repurchase agreements. When a portfolio enters into a repurchase agreement, it receives collateral that is heldin a segregated account by the portfolio’s custodian, or for tri-party repurchase agreements, collateral is held at a third-party custodian bank in a segregated account forthe benefit of the portfolio. The collateral amount is marked-to-market and monitored on a daily basis to ensure that the collateral held is in an amount not less than theprincipal amount of the repurchase agreement plus any accrued interest. Collateral received by a portfolio for repurchase agreements is disclosed in the Portfolio ofinvestments as part of the caption related to the repurchase agreement.
Repurchase agreements are typically governed by the terms and conditions of the Master Repurchase Agreement and/or Global Master Repurchase Agreement (collec-tively, MRA). Upon an event of default, the non-defaulting party may close out all transactions traded under the MRA and net amounts owed. Absent an event of default,assets and liabilities resulting from repurchase agreements are not offset in the Statements of assets and liabilities. In the event of a default by the counterparty, realizationof the collateral proceeds could be delayed, during which time the collateral value may decline or the counterparty may have insufficient assets to pay back claims result-ing from close-out of the transactions.
Term loans (Floating rate loans). The portfolios may invest in term loans, which often include debt securities that are rated below investment grade at the time ofpurchase. Term loans are generally subject to legal or contractual restrictions on resale and generally have longer settlement periods than conventional debt securities.Term loans involve special types of risk, including credit risk, interest-rate risk, counterparty risk and risk associated with extended settlement. The liquidity of termloans, including the volume and frequency of secondary market trading in such loans, varies significantly over time and among individual loans. During periods of infre-quent trading, valuing a term loan can be more difficult and buying and selling a term loan at an acceptable price can be more difficult and delayed, which could resultin a loss.
A portfolio’s ability to receive payments of principal, interest and other amounts in connection with term loans will depend primarily on the financial condition of theborrower. The portfolio’s failure to receive scheduled payments on a term loan due to a default, bankruptcy or other reason would adversely affect the portfolio’s income
SIGNIFICANT ACCOUNTING POLICIES, CONTINUED
118
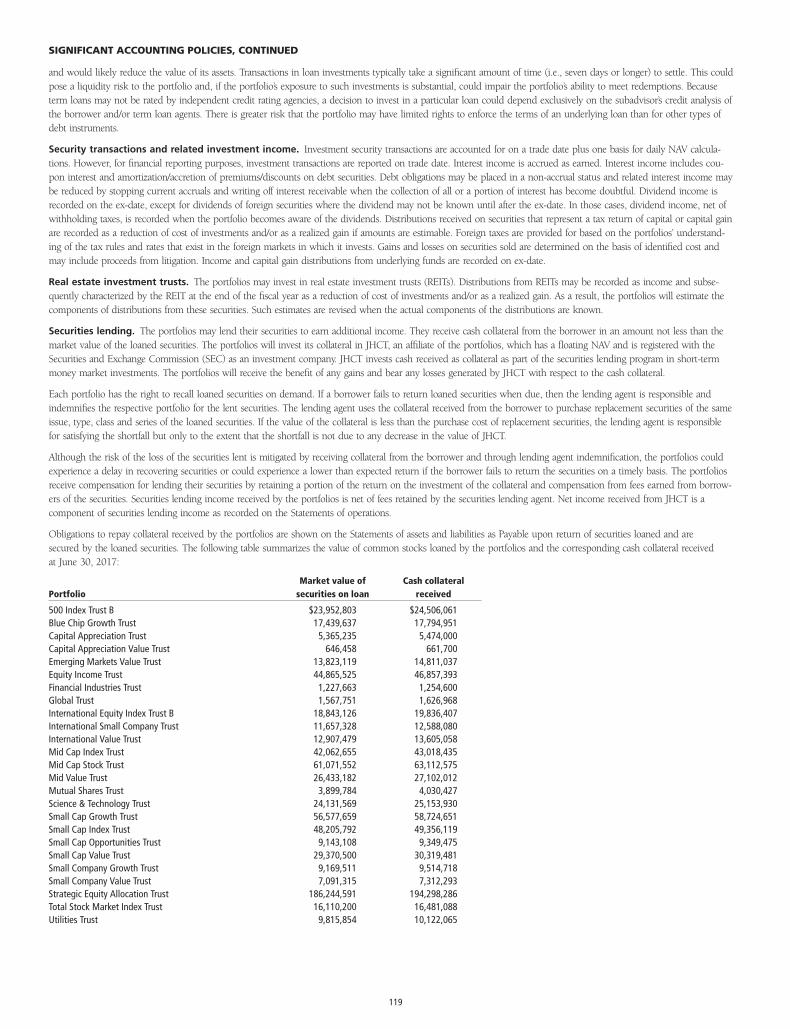
and would likely reduce the value of its assets. Transactions in loan investments typically take a significant amount of time (i.e., seven days or longer) to settle. This couldpose a liquidity risk to the portfolio and, if the portfolio’s exposure to such investments is substantial, could impair the portfolio’s ability to meet redemptions. Becauseterm loans may not be rated by independent credit rating agencies, a decision to invest in a particular loan could depend exclusively on the subadvisor’s credit analysis ofthe borrower and/or term loan agents. There is greater risk that the portfolio may have limited rights to enforce the terms of an underlying loan than for other types ofdebt instruments.
Security transactions and related investment income. Investment security transactions are accounted for on a trade date plus one basis for daily NAV calcula-tions. However, for financial reporting purposes, investment transactions are reported on trade date. Interest income is accrued as earned. Interest income includes cou-pon interest and amortization/accretion of premiums/discounts on debt securities. Debt obligations may be placed in a non-accrual status and related interest income maybe reduced by stopping current accruals and writing off interest receivable when the collection of all or a portion of interest has become doubtful. Dividend income isrecorded on the ex-date, except for dividends of foreign securities where the dividend may not be known until after the ex-date. In those cases, dividend income, net ofwithholding taxes, is recorded when the portfolio becomes aware of the dividends. Distributions received on securities that represent a tax return of capital or capital gainare recorded as a reduction of cost of investments and/or as a realized gain if amounts are estimable. Foreign taxes are provided for based on the portfolios’ understand-ing of the tax rules and rates that exist in the foreign markets in which it invests. Gains and losses on securities sold are determined on the basis of identified cost andmay include proceeds from litigation. Income and capital gain distributions from underlying funds are recorded on ex-date.
Real estate investment trusts. The portfolios may invest in real estate investment trusts (REITs). Distributions from REITs may be recorded as income and subse-quently characterized by the REIT at the end of the fiscal year as a reduction of cost of investments and/or as a realized gain. As a result, the portfolios will estimate thecomponents of distributions from these securities. Such estimates are revised when the actual components of the distributions are known.
Securities lending. The portfolios may lend their securities to earn additional income. They receive cash collateral from the borrower in an amount not less than themarket value of the loaned securities. The portfolios will invest its collateral in JHCT, an affiliate of the portfolios, which has a floating NAV and is registered with theSecurities and Exchange Commission (SEC) as an investment company. JHCT invests cash received as collateral as part of the securities lending program in short-termmoney market investments. The portfolios will receive the benefit of any gains and bear any losses generated by JHCT with respect to the cash collateral.
Each portfolio has the right to recall loaned securities on demand. If a borrower fails to return loaned securities when due, then the lending agent is responsible andindemnifies the respective portfolio for the lent securities. The lending agent uses the collateral received from the borrower to purchase replacement securities of the sameissue, type, class and series of the loaned securities. If the value of the collateral is less than the purchase cost of replacement securities, the lending agent is responsiblefor satisfying the shortfall but only to the extent that the shortfall is not due to any decrease in the value of JHCT.
Although the risk of the loss of the securities lent is mitigated by receiving collateral from the borrower and through lending agent indemnification, the portfolios couldexperience a delay in recovering securities or could experience a lower than expected return if the borrower fails to return the securities on a timely basis. The portfoliosreceive compensation for lending their securities by retaining a portion of the return on the investment of the collateral and compensation from fees earned from borrow-ers of the securities. Securities lending income received by the portfolios is net of fees retained by the securities lending agent. Net income received from JHCT is acomponent of securities lending income as recorded on the Statements of operations.
Obligations to repay collateral received by the portfolios are shown on the Statements of assets and liabilities as Payable upon return of securities loaned and aresecured by the loaned securities. The following table summarizes the value of common stocks loaned by the portfolios and the corresponding cash collateral receivedat June 30, 2017:
PortfolioMarket value of
securities on loanCash collateral
received
500 Index Trust B $23,952,803 $24,506,061Blue Chip Growth Trust 17,439,637 17,794,951Capital Appreciation Trust 5,365,235 5,474,000Capital Appreciation Value Trust 646,458 661,700Emerging Markets Value Trust 13,823,119 14,811,037Equity Income Trust 44,865,525 46,857,393Financial Industries Trust 1,227,663 1,254,600Global Trust 1,567,751 1,626,968International Equity Index Trust B 18,843,126 19,836,407International Small Company Trust 11,657,328 12,588,080International Value Trust 12,907,479 13,605,058Mid Cap Index Trust 42,062,655 43,018,435Mid Cap Stock Trust 61,071,552 63,112,575Mid Value Trust 26,433,182 27,102,012Mutual Shares Trust 3,899,784 4,030,427Science & Technology Trust 24,131,569 25,153,930Small Cap Growth Trust 56,577,659 58,724,651Small Cap Index Trust 48,205,792 49,356,119Small Cap Opportunities Trust 9,143,108 9,349,475Small Cap Value Trust 29,370,500 30,319,481Small Company Growth Trust 9,169,511 9,514,718Small Company Value Trust 7,091,315 7,312,293Strategic Equity Allocation Trust 186,244,591 194,298,286Total Stock Market Index Trust 16,110,200 16,481,088Utilities Trust 9,815,854 10,122,065
SIGNIFICANT ACCOUNTING POLICIES, CONTINUED
119
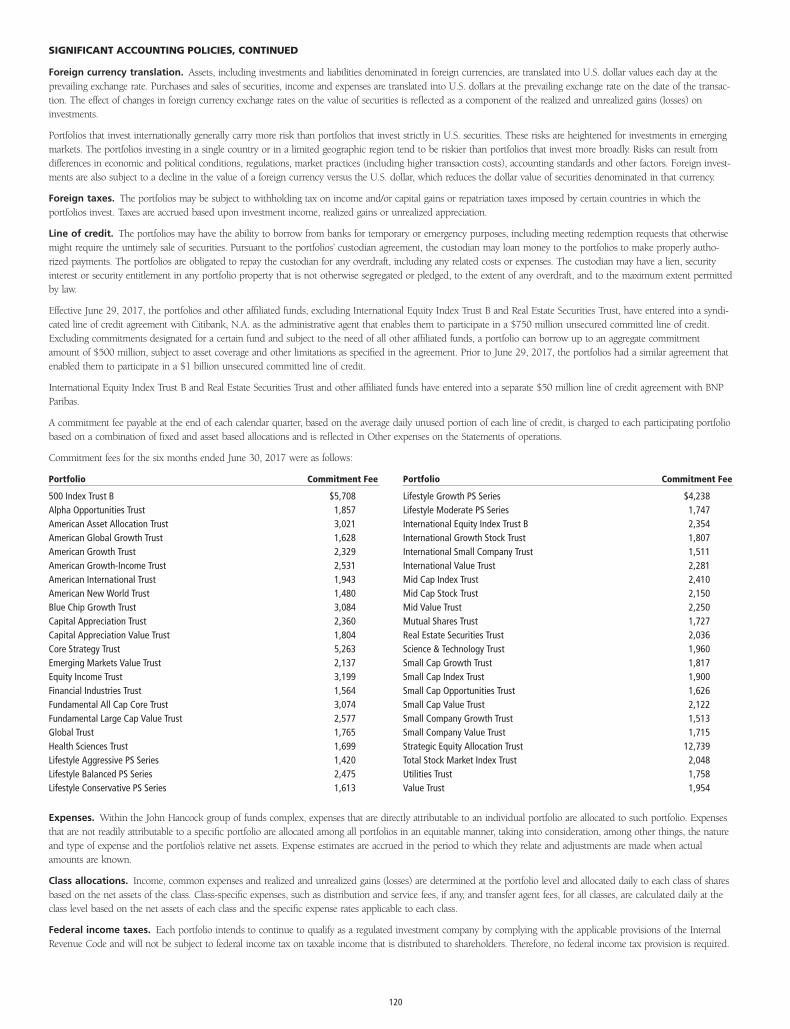
Foreign currency translation. Assets, including investments and liabilities denominated in foreign currencies, are translated into U.S. dollar values each day at theprevailing exchange rate. Purchases and sales of securities, income and expenses are translated into U.S. dollars at the prevailing exchange rate on the date of the transac-tion. The effect of changes in foreign currency exchange rates on the value of securities is reflected as a component of the realized and unrealized gains (losses) oninvestments.
Portfolios that invest internationally generally carry more risk than portfolios that invest strictly in U.S. securities. These risks are heightened for investments in emergingmarkets. The portfolios investing in a single country or in a limited geographic region tend to be riskier than portfolios that invest more broadly. Risks can result fromdifferences in economic and political conditions, regulations, market practices (including higher transaction costs), accounting standards and other factors. Foreign invest-ments are also subject to a decline in the value of a foreign currency versus the U.S. dollar, which reduces the dollar value of securities denominated in that currency.
Foreign taxes. The portfolios may be subject to withholding tax on income and/or capital gains or repatriation taxes imposed by certain countries in which theportfolios invest. Taxes are accrued based upon investment income, realized gains or unrealized appreciation.
Line of credit. The portfolios may have the ability to borrow from banks for temporary or emergency purposes, including meeting redemption requests that otherwisemight require the untimely sale of securities. Pursuant to the portfolios’ custodian agreement, the custodian may loan money to the portfolios to make properly autho-rized payments. The portfolios are obligated to repay the custodian for any overdraft, including any related costs or expenses. The custodian may have a lien, securityinterest or security entitlement in any portfolio property that is not otherwise segregated or pledged, to the extent of any overdraft, and to the maximum extent permittedby law.
Effective June 29, 2017, the portfolios and other affiliated funds, excluding International Equity Index Trust B and Real Estate Securities Trust, have entered into a syndi-cated line of credit agreement with Citibank, N.A. as the administrative agent that enables them to participate in a $750 million unsecured committed line of credit.Excluding commitments designated for a certain fund and subject to the need of all other affiliated funds, a portfolio can borrow up to an aggregate commitmentamount of $500 million, subject to asset coverage and other limitations as specified in the agreement. Prior to June 29, 2017, the portfolios had a similar agreement thatenabled them to participate in a $1 billion unsecured committed line of credit.
International Equity Index Trust B and Real Estate Securities Trust and other affiliated funds have entered into a separate $50 million line of credit agreement with BNPParibas.
A commitment fee payable at the end of each calendar quarter, based on the average daily unused portion of each line of credit, is charged to each participating portfoliobased on a combination of fixed and asset based allocations and is reflected in Other expenses on the Statements of operations.
Commitment fees for the six months ended June 30, 2017 were as follows:
Portfolio Commitment Fee
500 Index Trust B $5,708Alpha Opportunities Trust 1,857American Asset Allocation Trust 3,021American Global Growth Trust 1,628American Growth Trust 2,329American Growth-Income Trust 2,531American International Trust 1,943American New World Trust 1,480Blue Chip Growth Trust 3,084Capital Appreciation Trust 2,360Capital Appreciation Value Trust 1,804Core Strategy Trust 5,263Emerging Markets Value Trust 2,137Equity Income Trust 3,199Financial Industries Trust 1,564Fundamental All Cap Core Trust 3,074Fundamental Large Cap Value Trust 2,577Global Trust 1,765Health Sciences Trust 1,699Lifestyle Aggressive PS Series 1,420Lifestyle Balanced PS Series 2,475Lifestyle Conservative PS Series 1,613
Portfolio Commitment Fee
Lifestyle Growth PS Series $4,238Lifestyle Moderate PS Series 1,747International Equity Index Trust B 2,354International Growth Stock Trust 1,807International Small Company Trust 1,511International Value Trust 2,281Mid Cap Index Trust 2,410Mid Cap Stock Trust 2,150Mid Value Trust 2,250Mutual Shares Trust 1,727Real Estate Securities Trust 2,036Science & Technology Trust 1,960Small Cap Growth Trust 1,817Small Cap Index Trust 1,900Small Cap Opportunities Trust 1,626Small Cap Value Trust 2,122Small Company Growth Trust 1,513Small Company Value Trust 1,715Strategic Equity Allocation Trust 12,739Total Stock Market Index Trust 2,048Utilities Trust 1,758Value Trust 1,954
Expenses. Within the John Hancock group of funds complex, expenses that are directly attributable to an individual portfolio are allocated to such portfolio. Expensesthat are not readily attributable to a specific portfolio are allocated among all portfolios in an equitable manner, taking into consideration, among other things, the natureand type of expense and the portfolio’s relative net assets. Expense estimates are accrued in the period to which they relate and adjustments are made when actualamounts are known.
Class allocations. Income, common expenses and realized and unrealized gains (losses) are determined at the portfolio level and allocated daily to each class of sharesbased on the net assets of the class. Class-specific expenses, such as distribution and service fees, if any, and transfer agent fees, for all classes, are calculated daily at theclass level based on the net assets of each class and the specific expense rates applicable to each class.
Federal income taxes. Each portfolio intends to continue to qualify as a regulated investment company by complying with the applicable provisions of the InternalRevenue Code and will not be subject to federal income tax on taxable income that is distributed to shareholders. Therefore, no federal income tax provision is required.
SIGNIFICANT ACCOUNTING POLICIES, CONTINUED
120
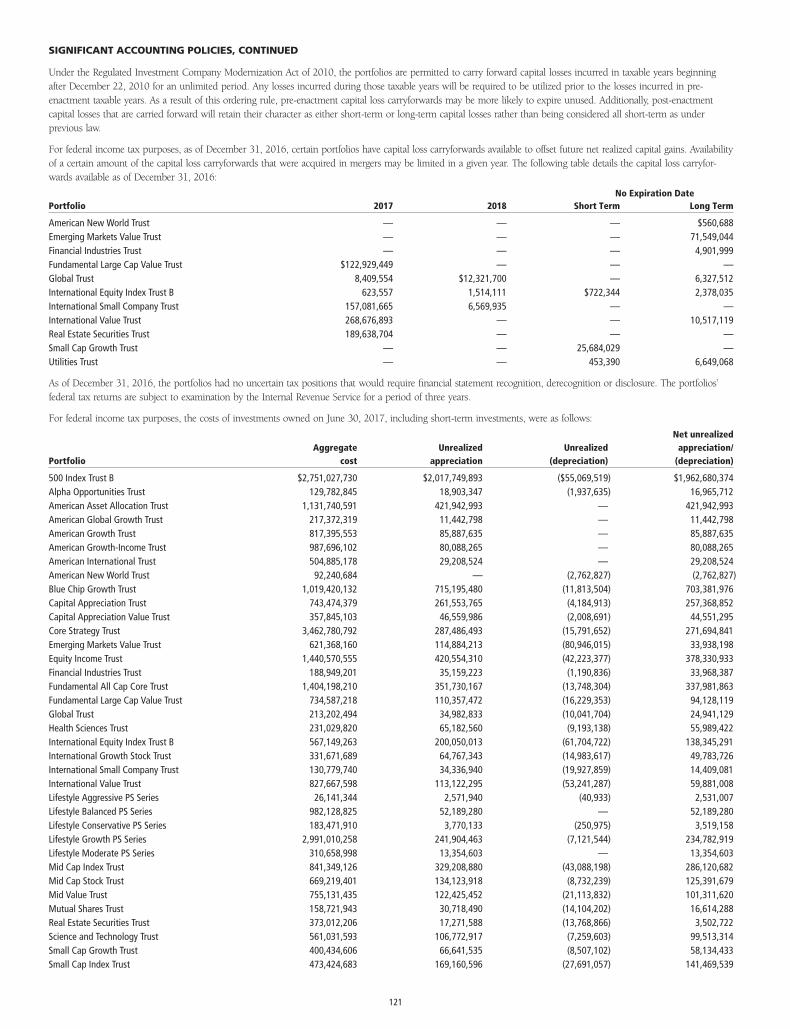
Under the Regulated Investment Company Modernization Act of 2010, the portfolios are permitted to carry forward capital losses incurred in taxable years beginningafter December 22, 2010 for an unlimited period. Any losses incurred during those taxable years will be required to be utilized prior to the losses incurred in pre-enactment taxable years. As a result of this ordering rule, pre-enactment capital loss carryforwards may be more likely to expire unused. Additionally, post-enactmentcapital losses that are carried forward will retain their character as either short-term or long-term capital losses rather than being considered all short-term as underprevious law.
For federal income tax purposes, as of December 31, 2016, certain portfolios have capital loss carryforwards available to offset future net realized capital gains. Availabilityof a certain amount of the capital loss carryforwards that were acquired in mergers may be limited in a given year. The following table details the capital loss carryfor-wards available as of December 31, 2016:
No Expiration DatePortfolio 2017 2018 Short Term Long Term
American New World Trust — — — $560,688Emerging Markets Value Trust — — — 71,549,044Financial Industries Trust — — — 4,901,999Fundamental Large Cap Value Trust $122,929,449 — — —Global Trust 8,409,554 $12,321,700 — 6,327,512International Equity Index Trust B 623,557 1,514,111 $722,344 2,378,035International Small Company Trust 157,081,665 6,569,935 — —International Value Trust 268,676,893 — — 10,517,119Real Estate Securities Trust 189,638,704 — — —Small Cap Growth Trust — — 25,684,029 —Utilities Trust — — 453,390 6,649,068
As of December 31, 2016, the portfolios had no uncertain tax positions that would require financial statement recognition, derecognition or disclosure. The portfolios’federal tax returns are subject to examination by the Internal Revenue Service for a period of three years.
For federal income tax purposes, the costs of investments owned on June 30, 2017, including short-term investments, were as follows:
PortfolioAggregate
costUnrealized
appreciationUnrealized
(depreciation)
Net unrealizedappreciation/
(depreciation)
500 Index Trust B $2,751,027,730 $2,017,749,893 ($55,069,519) $1,962,680,374Alpha Opportunities Trust 129,782,845 18,903,347 (1,937,635) 16,965,712American Asset Allocation Trust 1,131,740,591 421,942,993 — 421,942,993American Global Growth Trust 217,372,319 11,442,798 — 11,442,798American Growth Trust 817,395,553 85,887,635 — 85,887,635American Growth-Income Trust 987,696,102 80,088,265 — 80,088,265American International Trust 504,885,178 29,208,524 — 29,208,524American New World Trust 92,240,684 — (2,762,827) (2,762,827)Blue Chip Growth Trust 1,019,420,132 715,195,480 (11,813,504) 703,381,976Capital Appreciation Trust 743,474,379 261,553,765 (4,184,913) 257,368,852Capital Appreciation Value Trust 357,845,103 46,559,986 (2,008,691) 44,551,295Core Strategy Trust 3,462,780,792 287,486,493 (15,791,652) 271,694,841Emerging Markets Value Trust 621,368,160 114,884,213 (80,946,015) 33,938,198Equity Income Trust 1,440,570,555 420,554,310 (42,223,377) 378,330,933Financial Industries Trust 188,949,201 35,159,223 (1,190,836) 33,968,387Fundamental All Cap Core Trust 1,404,198,210 351,730,167 (13,748,304) 337,981,863Fundamental Large Cap Value Trust 734,587,218 110,357,472 (16,229,353) 94,128,119Global Trust 213,202,494 34,982,833 (10,041,704) 24,941,129Health Sciences Trust 231,029,820 65,182,560 (9,193,138) 55,989,422International Equity Index Trust B 567,149,263 200,050,013 (61,704,722) 138,345,291International Growth Stock Trust 331,671,689 64,767,343 (14,983,617) 49,783,726International Small Company Trust 130,779,740 34,336,940 (19,927,859) 14,409,081International Value Trust 827,667,598 113,122,295 (53,241,287) 59,881,008Lifestyle Aggressive PS Series 26,141,344 2,571,940 (40,933) 2,531,007Lifestyle Balanced PS Series 982,128,825 52,189,280 — 52,189,280Lifestyle Conservative PS Series 183,471,910 3,770,133 (250,975) 3,519,158Lifestyle Growth PS Series 2,991,010,258 241,904,463 (7,121,544) 234,782,919Lifestyle Moderate PS Series 310,658,998 13,354,603 — 13,354,603Mid Cap Index Trust 841,349,126 329,208,880 (43,088,198) 286,120,682Mid Cap Stock Trust 669,219,401 134,123,918 (8,732,239) 125,391,679Mid Value Trust 755,131,435 122,425,452 (21,113,832) 101,311,620Mutual Shares Trust 158,721,943 30,718,490 (14,104,202) 16,614,288Real Estate Securities Trust 373,012,206 17,271,588 (13,768,866) 3,502,722Science and Technology Trust 561,031,593 106,772,917 (7,259,603) 99,513,314Small Cap Growth Trust 400,434,606 66,641,535 (8,507,102) 58,134,433Small Cap Index Trust 473,424,683 169,160,596 (27,691,057) 141,469,539
SIGNIFICANT ACCOUNTING POLICIES, CONTINUED
121
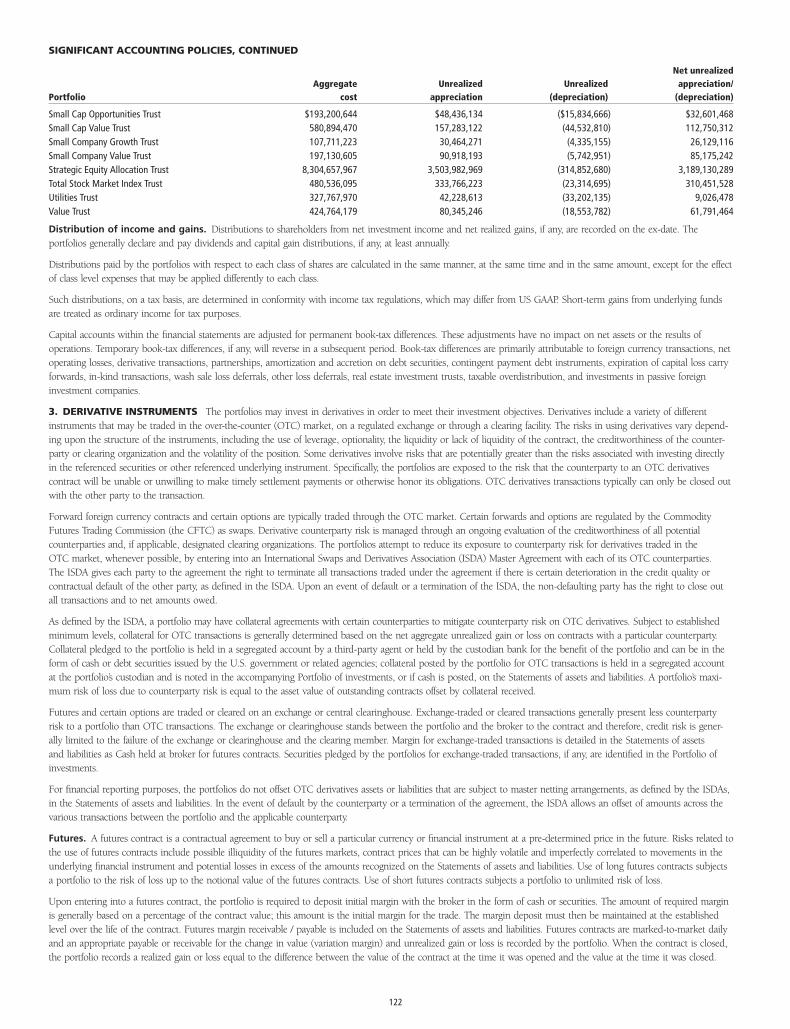
PortfolioAggregate
costUnrealized
appreciationUnrealized
(depreciation)
Net unrealizedappreciation/
(depreciation)
Small Cap Opportunities Trust $193,200,644 $48,436,134 ($15,834,666) $32,601,468Small Cap Value Trust 580,894,470 157,283,122 (44,532,810) 112,750,312Small Company Growth Trust 107,711,223 30,464,271 (4,335,155) 26,129,116Small Company Value Trust 197,130,605 90,918,193 (5,742,951) 85,175,242Strategic Equity Allocation Trust 8,304,657,967 3,503,982,969 (314,852,680) 3,189,130,289Total Stock Market Index Trust 480,536,095 333,766,223 (23,314,695) 310,451,528Utilities Trust 327,767,970 42,228,613 (33,202,135) 9,026,478Value Trust 424,764,179 80,345,246 (18,553,782) 61,791,464
Distribution of income and gains. Distributions to shareholders from net investment income and net realized gains, if any, are recorded on the ex-date. Theportfolios generally declare and pay dividends and capital gain distributions, if any, at least annually.
Distributions paid by the portfolios with respect to each class of shares are calculated in the same manner, at the same time and in the same amount, except for the effectof class level expenses that may be applied differently to each class.
Such distributions, on a tax basis, are determined in conformity with income tax regulations, which may differ from US GAAP. Short-term gains from underlying fundsare treated as ordinary income for tax purposes.
Capital accounts within the financial statements are adjusted for permanent book-tax differences. These adjustments have no impact on net assets or the results ofoperations. Temporary book-tax differences, if any, will reverse in a subsequent period. Book-tax differences are primarily attributable to foreign currency transactions, netoperating losses, derivative transactions, partnerships, amortization and accretion on debt securities, contingent payment debt instruments, expiration of capital loss carryforwards, in-kind transactions, wash sale loss deferrals, other loss deferrals, real estate investment trusts, taxable overdistribution, and investments in passive foreigninvestment companies.
3. DERIVATIVE INSTRUMENTS The portfolios may invest in derivatives in order to meet their investment objectives. Derivatives include a variety of differentinstruments that may be traded in the over-the-counter (OTC) market, on a regulated exchange or through a clearing facility. The risks in using derivatives vary depend-ing upon the structure of the instruments, including the use of leverage, optionality, the liquidity or lack of liquidity of the contract, the creditworthiness of the counter-party or clearing organization and the volatility of the position. Some derivatives involve risks that are potentially greater than the risks associated with investing directlyin the referenced securities or other referenced underlying instrument. Specifically, the portfolios are exposed to the risk that the counterparty to an OTC derivativescontract will be unable or unwilling to make timely settlement payments or otherwise honor its obligations. OTC derivatives transactions typically can only be closed outwith the other party to the transaction.
Forward foreign currency contracts and certain options are typically traded through the OTC market. Certain forwards and options are regulated by the CommodityFutures Trading Commission (the CFTC) as swaps. Derivative counterparty risk is managed through an ongoing evaluation of the creditworthiness of all potentialcounterparties and, if applicable, designated clearing organizations. The portfolios attempt to reduce its exposure to counterparty risk for derivatives traded in theOTC market, whenever possible, by entering into an International Swaps and Derivatives Association (ISDA) Master Agreement with each of its OTC counterparties.The ISDA gives each party to the agreement the right to terminate all transactions traded under the agreement if there is certain deterioration in the credit quality orcontractual default of the other party, as defined in the ISDA. Upon an event of default or a termination of the ISDA, the non-defaulting party has the right to close outall transactions and to net amounts owed.
As defined by the ISDA, a portfolio may have collateral agreements with certain counterparties to mitigate counterparty risk on OTC derivatives. Subject to establishedminimum levels, collateral for OTC transactions is generally determined based on the net aggregate unrealized gain or loss on contracts with a particular counterparty.Collateral pledged to the portfolio is held in a segregated account by a third-party agent or held by the custodian bank for the benefit of the portfolio and can be in theform of cash or debt securities issued by the U.S. government or related agencies; collateral posted by the portfolio for OTC transactions is held in a segregated accountat the portfolio’s custodian and is noted in the accompanying Portfolio of investments, or if cash is posted, on the Statements of assets and liabilities. A portfolio’s maxi-mum risk of loss due to counterparty risk is equal to the asset value of outstanding contracts offset by collateral received.
Futures and certain options are traded or cleared on an exchange or central clearinghouse. Exchange-traded or cleared transactions generally present less counterpartyrisk to a portfolio than OTC transactions. The exchange or clearinghouse stands between the portfolio and the broker to the contract and therefore, credit risk is gener-ally limited to the failure of the exchange or clearinghouse and the clearing member. Margin for exchange-traded transactions is detailed in the Statements of assetsand liabilities as Cash held at broker for futures contracts. Securities pledged by the portfolios for exchange-traded transactions, if any, are identified in the Portfolio ofinvestments.
For financial reporting purposes, the portfolios do not offset OTC derivatives assets or liabilities that are subject to master netting arrangements, as defined by the ISDAs,in the Statements of assets and liabilities. In the event of default by the counterparty or a termination of the agreement, the ISDA allows an offset of amounts across thevarious transactions between the portfolio and the applicable counterparty.
Futures. A futures contract is a contractual agreement to buy or sell a particular currency or financial instrument at a pre-determined price in the future. Risks related tothe use of futures contracts include possible illiquidity of the futures markets, contract prices that can be highly volatile and imperfectly correlated to movements in theunderlying financial instrument and potential losses in excess of the amounts recognized on the Statements of assets and liabilities. Use of long futures contracts subjectsa portfolio to the risk of loss up to the notional value of the futures contracts. Use of short futures contracts subjects a portfolio to unlimited risk of loss.
Upon entering into a futures contract, the portfolio is required to deposit initial margin with the broker in the form of cash or securities. The amount of required marginis generally based on a percentage of the contract value; this amount is the initial margin for the trade. The margin deposit must then be maintained at the establishedlevel over the life of the contract. Futures margin receivable / payable is included on the Statements of assets and liabilities. Futures contracts are marked-to-market dailyand an appropriate payable or receivable for the change in value (variation margin) and unrealized gain or loss is recorded by the portfolio. When the contract is closed,the portfolio records a realized gain or loss equal to the difference between the value of the contract at the time it was opened and the value at the time it was closed.
SIGNIFICANT ACCOUNTING POLICIES, CONTINUED
122
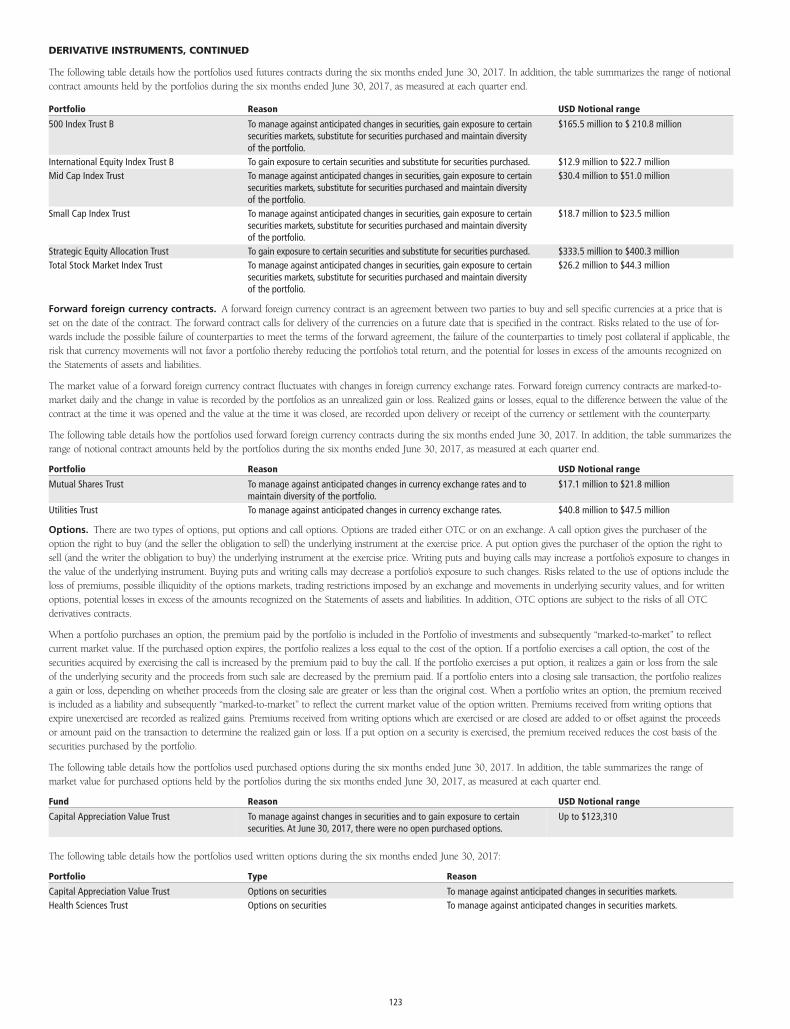
The following table details how the portfolios used futures contracts during the six months ended June 30, 2017. In addition, the table summarizes the range of notionalcontract amounts held by the portfolios during the six months ended June 30, 2017, as measured at each quarter end.
Portfolio Reason USD Notional range
500 Index Trust B To manage against anticipated changes in securities, gain exposure to certainsecurities markets, substitute for securities purchased and maintain diversityof the portfolio.
$165.5 million to $ 210.8 million
International Equity Index Trust B To gain exposure to certain securities and substitute for securities purchased. $12.9 million to $22.7 millionMid Cap Index Trust To manage against anticipated changes in securities, gain exposure to certain
securities markets, substitute for securities purchased and maintain diversityof the portfolio.
$30.4 million to $51.0 million
Small Cap Index Trust To manage against anticipated changes in securities, gain exposure to certainsecurities markets, substitute for securities purchased and maintain diversityof the portfolio.
$18.7 million to $23.5 million
Strategic Equity Allocation Trust To gain exposure to certain securities and substitute for securities purchased. $333.5 million to $400.3 millionTotal Stock Market Index Trust To manage against anticipated changes in securities, gain exposure to certain
securities markets, substitute for securities purchased and maintain diversityof the portfolio.
$26.2 million to $44.3 million
Forward foreign currency contracts. A forward foreign currency contract is an agreement between two parties to buy and sell specific currencies at a price that isset on the date of the contract. The forward contract calls for delivery of the currencies on a future date that is specified in the contract. Risks related to the use of for-wards include the possible failure of counterparties to meet the terms of the forward agreement, the failure of the counterparties to timely post collateral if applicable, therisk that currency movements will not favor a portfolio thereby reducing the portfolio’s total return, and the potential for losses in excess of the amounts recognized onthe Statements of assets and liabilities.
The market value of a forward foreign currency contract fluctuates with changes in foreign currency exchange rates. Forward foreign currency contracts are marked-to-market daily and the change in value is recorded by the portfolios as an unrealized gain or loss. Realized gains or losses, equal to the difference between the value of thecontract at the time it was opened and the value at the time it was closed, are recorded upon delivery or receipt of the currency or settlement with the counterparty.
The following table details how the portfolios used forward foreign currency contracts during the six months ended June 30, 2017. In addition, the table summarizes therange of notional contract amounts held by the portfolios during the six months ended June 30, 2017, as measured at each quarter end.
Portfolio Reason USD Notional range
Mutual Shares Trust To manage against anticipated changes in currency exchange rates and tomaintain diversity of the portfolio.
$17.1 million to $21.8 million
Utilities Trust To manage against anticipated changes in currency exchange rates. $40.8 million to $47.5 million
Options. There are two types of options, put options and call options. Options are traded either OTC or on an exchange. A call option gives the purchaser of theoption the right to buy (and the seller the obligation to sell) the underlying instrument at the exercise price. A put option gives the purchaser of the option the right tosell (and the writer the obligation to buy) the underlying instrument at the exercise price. Writing puts and buying calls may increase a portfolio’s exposure to changes inthe value of the underlying instrument. Buying puts and writing calls may decrease a portfolio’s exposure to such changes. Risks related to the use of options include theloss of premiums, possible illiquidity of the options markets, trading restrictions imposed by an exchange and movements in underlying security values, and for writtenoptions, potential losses in excess of the amounts recognized on the Statements of assets and liabilities. In addition, OTC options are subject to the risks of all OTCderivatives contracts.
When a portfolio purchases an option, the premium paid by the portfolio is included in the Portfolio of investments and subsequently “marked-to-market” to reflectcurrent market value. If the purchased option expires, the portfolio realizes a loss equal to the cost of the option. If a portfolio exercises a call option, the cost of thesecurities acquired by exercising the call is increased by the premium paid to buy the call. If the portfolio exercises a put option, it realizes a gain or loss from the saleof the underlying security and the proceeds from such sale are decreased by the premium paid. If a portfolio enters into a closing sale transaction, the portfolio realizesa gain or loss, depending on whether proceeds from the closing sale are greater or less than the original cost. When a portfolio writes an option, the premium receivedis included as a liability and subsequently “marked-to-market” to reflect the current market value of the option written. Premiums received from writing options thatexpire unexercised are recorded as realized gains. Premiums received from writing options which are exercised or are closed are added to or offset against the proceedsor amount paid on the transaction to determine the realized gain or loss. If a put option on a security is exercised, the premium received reduces the cost basis of thesecurities purchased by the portfolio.
The following table details how the portfolios used purchased options during the six months ended June 30, 2017. In addition, the table summarizes the range ofmarket value for purchased options held by the portfolios during the six months ended June 30, 2017, as measured at each quarter end.
Fund Reason USD Notional range
Capital Appreciation Value Trust To manage against changes in securities and to gain exposure to certainsecurities. At June 30, 2017, there were no open purchased options.
Up to $123,310
The following table details how the portfolios used written options during the six months ended June 30, 2017:
Portfolio Type Reason
Capital Appreciation Value Trust Options on securities To manage against anticipated changes in securities markets.Health Sciences Trust Options on securities To manage against anticipated changes in securities markets.
DERIVATIVE INSTRUMENTS, CONTINUED
123
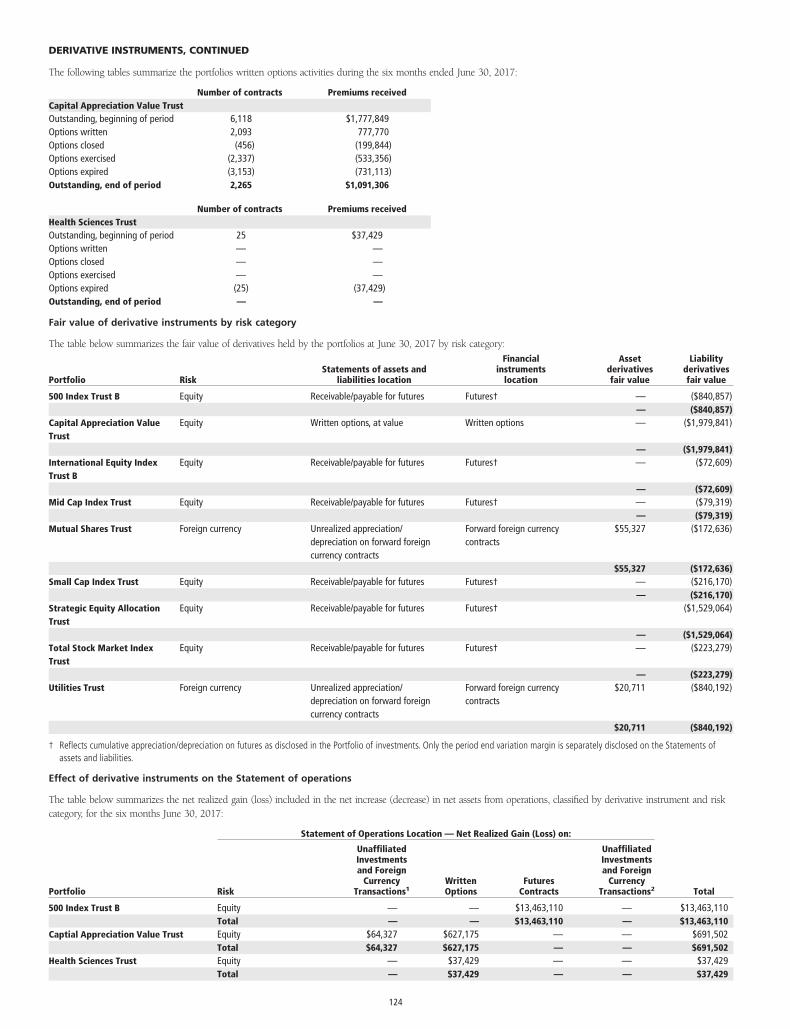
The following tables summarize the portfolios written options activities during the six months ended June 30, 2017:
Number of contracts Premiums receivedCapital Appreciation Value TrustOutstanding, beginning of period 6,118 $1,777,849Options written 2,093 777,770Options closed (456) (199,844)Options exercised (2,337) (533,356)Options expired (3,153) (731,113)Outstanding, end of period 2,265 $1,091,306
Number of contracts Premiums receivedHealth Sciences TrustOutstanding, beginning of period 25 $37,429Options written — —Options closed — —Options exercised — —Options expired (25) (37,429)Outstanding, end of period — —
Fair value of derivative instruments by risk category
The table below summarizes the fair value of derivatives held by the portfolios at June 30, 2017 by risk category:
Portfolio RiskStatements of assets and
liabilities location
Financialinstruments
location
Assetderivativesfair value
Liabilityderivativesfair value
500 Index Trust B Equity Receivable/payable for futures Futures† — ($840,857)— ($840,857)
Capital Appreciation ValueTrust
Equity Written options, at value Written options — ($1,979,841)
— ($1,979,841)International Equity IndexTrust B
Equity Receivable/payable for futures Futures† — ($72,609)
— ($72,609)Mid Cap Index Trust Equity Receivable/payable for futures Futures† — ($79,319)
— ($79,319)Mutual Shares Trust Foreign currency Unrealized appreciation/
depreciation on forward foreigncurrency contracts
Forward foreign currencycontracts
$55,327 ($172,636)
$55,327 ($172,636)Small Cap Index Trust Equity Receivable/payable for futures Futures† — ($216,170)
— ($216,170)Strategic Equity AllocationTrust
Equity Receivable/payable for futures Futures† ($1,529,064)
— ($1,529,064)Total Stock Market IndexTrust
Equity Receivable/payable for futures Futures† — ($223,279)
— ($223,279)Utilities Trust Foreign currency Unrealized appreciation/
depreciation on forward foreigncurrency contracts
Forward foreign currencycontracts
$20,711 ($840,192)
$20,711 ($840,192)
† Reflects cumulative appreciation/depreciation on futures as disclosed in the Portfolio of investments. Only the period end variation margin is separately disclosed on the Statements ofassets and liabilities.
Effect of derivative instruments on the Statement of operations
The table below summarizes the net realized gain (loss) included in the net increase (decrease) in net assets from operations, classified by derivative instrument and riskcategory, for the six months June 30, 2017:
Statement of Operations Location — Net Realized Gain (Loss) on:
Portfolio Risk
UnaffiliatedInvestmentsand Foreign
CurrencyTransactions1
WrittenOptions
FuturesContracts
UnaffiliatedInvestmentsand Foreign
CurrencyTransactions2 Total
500 Index Trust B Equity — — $13,463,110 — $13,463,110Total — — $13,463,110 — $13,463,110
Captial Appreciation Value Trust Equity $64,327 $627,175 — — $691,502Total $64,327 $627,175 — — $691,502
Health Sciences Trust Equity — $37,429 — — $37,429Total — $37,429 — — $37,429
DERIVATIVE INSTRUMENTS, CONTINUED
124
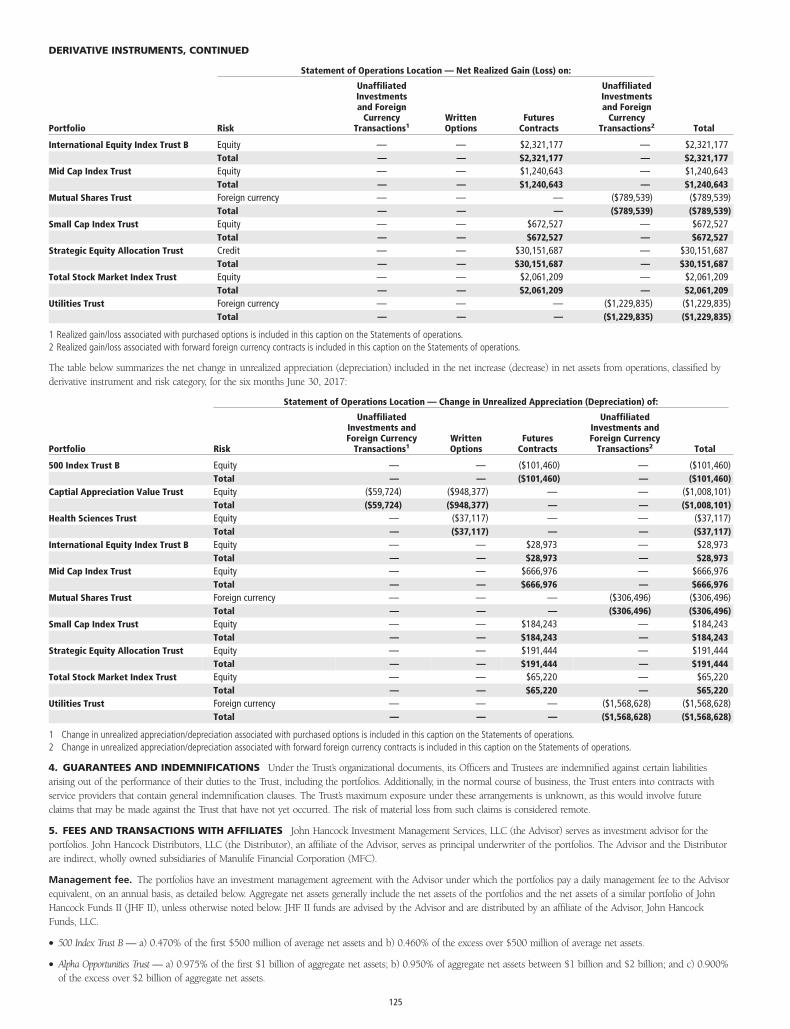
Statement of Operations Location — Net Realized Gain (Loss) on:
Portfolio Risk
UnaffiliatedInvestmentsand Foreign
CurrencyTransactions1
WrittenOptions
FuturesContracts
UnaffiliatedInvestmentsand Foreign
CurrencyTransactions2 Total
International Equity Index Trust B Equity — — $2,321,177 — $2,321,177Total — — $2,321,177 — $2,321,177
Mid Cap Index Trust Equity — — $1,240,643 — $1,240,643Total — — $1,240,643 — $1,240,643
Mutual Shares Trust Foreign currency — — — ($789,539) ($789,539)Total — — — ($789,539) ($789,539)
Small Cap Index Trust Equity — — $672,527 — $672,527Total — — $672,527 — $672,527
Strategic Equity Allocation Trust Credit — — $30,151,687 — $30,151,687Total — — $30,151,687 — $30,151,687
Total Stock Market Index Trust Equity — — $2,061,209 — $2,061,209Total — — $2,061,209 — $2,061,209
Utilities Trust Foreign currency — — — ($1,229,835) ($1,229,835)Total — — — ($1,229,835) ($1,229,835)
1 Realized gain/loss associated with purchased options is included in this caption on the Statements of operations.2 Realized gain/loss associated with forward foreign currency contracts is included in this caption on the Statements of operations.
The table below summarizes the net change in unrealized appreciation (depreciation) included in the net increase (decrease) in net assets from operations, classified byderivative instrument and risk category, for the six months June 30, 2017:
Statement of Operations Location — Change in Unrealized Appreciation (Depreciation) of:
Portfolio Risk
UnaffiliatedInvestments andForeign Currency
Transactions1WrittenOptions
FuturesContracts
UnaffiliatedInvestments andForeign Currency
Transactions2 Total
500 Index Trust B Equity — — ($101,460) — ($101,460)Total — — ($101,460) — ($101,460)
Captial Appreciation Value Trust Equity ($59,724) ($948,377) — — ($1,008,101)Total ($59,724) ($948,377) — — ($1,008,101)
Health Sciences Trust Equity — ($37,117) — — ($37,117)Total — ($37,117) — — ($37,117)
International Equity Index Trust B Equity — — $28,973 — $28,973Total — — $28,973 — $28,973
Mid Cap Index Trust Equity — — $666,976 — $666,976Total — — $666,976 — $666,976
Mutual Shares Trust Foreign currency — — — ($306,496) ($306,496)Total — — — ($306,496) ($306,496)
Small Cap Index Trust Equity — — $184,243 — $184,243Total — — $184,243 — $184,243
Strategic Equity Allocation Trust Equity — — $191,444 — $191,444Total — — $191,444 — $191,444
Total Stock Market Index Trust Equity — — $65,220 — $65,220Total — — $65,220 — $65,220
Utilities Trust Foreign currency — — — ($1,568,628) ($1,568,628)Total — — — ($1,568,628) ($1,568,628)
1 Change in unrealized appreciation/depreciation associated with purchased options is included in this caption on the Statements of operations.2 Change in unrealized appreciation/depreciation associated with forward foreign currency contracts is included in this caption on the Statements of operations.
4. GUARANTEES AND INDEMNIFICATIONS Under the Trust’s organizational documents, its Officers and Trustees are indemnified against certain liabilitiesarising out of the performance of their duties to the Trust, including the portfolios. Additionally, in the normal course of business, the Trust enters into contracts withservice providers that contain general indemnification clauses. The Trust’s maximum exposure under these arrangements is unknown, as this would involve futureclaims that may be made against the Trust that have not yet occurred. The risk of material loss from such claims is considered remote.
5. FEES AND TRANSACTIONS WITH AFFILIATES John Hancock Investment Management Services, LLC (the Advisor) serves as investment advisor for theportfolios. John Hancock Distributors, LLC (the Distributor), an affiliate of the Advisor, serves as principal underwriter of the portfolios. The Advisor and the Distributorare indirect, wholly owned subsidiaries of Manulife Financial Corporation (MFC).
Management fee. The portfolios have an investment management agreement with the Advisor under which the portfolios pay a daily management fee to the Advisorequivalent, on an annual basis, as detailed below. Aggregate net assets generally include the net assets of the portfolios and the net assets of a similar portfolio of JohnHancock Funds II (JHF II), unless otherwise noted below. JHF II funds are advised by the Advisor and are distributed by an affiliate of the Advisor, John HancockFunds, LLC.
• 500 Index Trust B — a) 0.470% of the first $500 million of average net assets and b) 0.460% of the excess over $500 million of average net assets.
• Alpha Opportunities Trust — a) 0.975% of the first $1 billion of aggregate net assets; b) 0.950% of aggregate net assets between $1 billion and $2 billion; and c) 0.900%of the excess over $2 billion of aggregate net assets.
DERIVATIVE INSTRUMENTS, CONTINUED
125
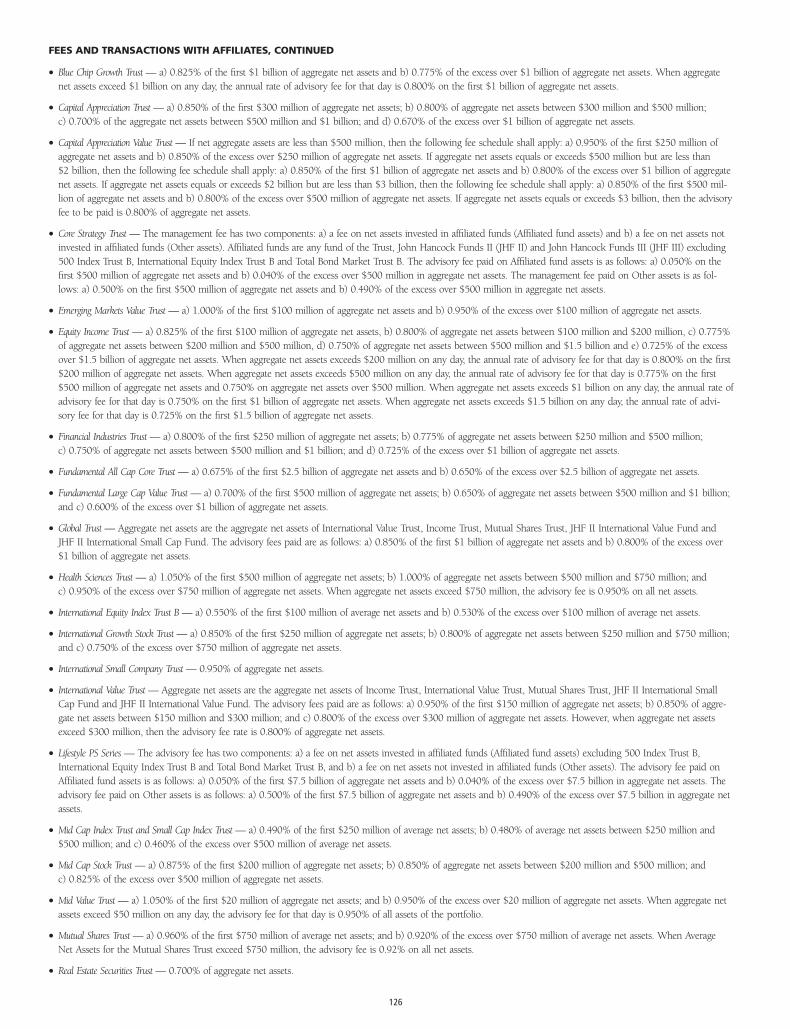
• Blue Chip Growth Trust — a) 0.825% of the first $1 billion of aggregate net assets and b) 0.775% of the excess over $1 billion of aggregate net assets. When aggregatenet assets exceed $1 billion on any day, the annual rate of advisory fee for that day is 0.800% on the first $1 billion of aggregate net assets.
• Capital Appreciation Trust — a) 0.850% of the first $300 million of aggregate net assets; b) 0.800% of aggregate net assets between $300 million and $500 million;c) 0.700% of the aggregate net assets between $500 million and $1 billion; and d) 0.670% of the excess over $1 billion of aggregate net assets.
• Capital Appreciation Value Trust — If net aggregate assets are less than $500 million, then the following fee schedule shall apply: a) 0.950% of the first $250 million ofaggregate net assets and b) 0.850% of the excess over $250 million of aggregate net assets. If aggregate net assets equals or exceeds $500 million but are less than$2 billion, then the following fee schedule shall apply: a) 0.850% of the first $1 billion of aggregate net assets and b) 0.800% of the excess over $1 billion of aggregatenet assets. If aggregate net assets equals or exceeds $2 billion but are less than $3 billion, then the following fee schedule shall apply: a) 0.850% of the first $500 mil-lion of aggregate net assets and b) 0.800% of the excess over $500 million of aggregate net assets. If aggregate net assets equals or exceeds $3 billion, then the advisoryfee to be paid is 0.800% of aggregate net assets.
• Core Strategy Trust — The management fee has two components: a) a fee on net assets invested in affiliated funds (Affiliated fund assets) and b) a fee on net assets notinvested in affiliated funds (Other assets). Affiliated funds are any fund of the Trust, John Hancock Funds II (JHF II) and John Hancock Funds III (JHF III) excluding500 Index Trust B, International Equity Index Trust B and Total Bond Market Trust B. The advisory fee paid on Affiliated fund assets is as follows: a) 0.050% on thefirst $500 million of aggregate net assets and b) 0.040% of the excess over $500 million in aggregate net assets. The management fee paid on Other assets is as fol-lows: a) 0.500% on the first $500 million of aggregate net assets and b) 0.490% of the excess over $500 million in aggregate net assets.
• Emerging Markets Value Trust — a) 1.000% of the first $100 million of aggregate net assets and b) 0.950% of the excess over $100 million of aggregate net assets.
• Equity Income Trust — a) 0.825% of the first $100 million of aggregate net assets, b) 0.800% of aggregate net assets between $100 million and $200 million, c) 0.775%of aggregate net assets between $200 million and $500 million, d) 0.750% of aggregate net assets between $500 million and $1.5 billion and e) 0.725% of the excessover $1.5 billion of aggregate net assets. When aggregate net assets exceeds $200 million on any day, the annual rate of advisory fee for that day is 0.800% on the first$200 million of aggregate net assets. When aggregate net assets exceeds $500 million on any day, the annual rate of advisory fee for that day is 0.775% on the first$500 million of aggregate net assets and 0.750% on aggregate net assets over $500 million. When aggregate net assets exceeds $1 billion on any day, the annual rate ofadvisory fee for that day is 0.750% on the first $1 billion of aggregate net assets. When aggregate net assets exceeds $1.5 billion on any day, the annual rate of advi-sory fee for that day is 0.725% on the first $1.5 billion of aggregate net assets.
• Financial Industries Trust — a) 0.800% of the first $250 million of aggregate net assets; b) 0.775% of aggregate net assets between $250 million and $500 million;c) 0.750% of aggregate net assets between $500 million and $1 billion; and d) 0.725% of the excess over $1 billion of aggregate net assets.
• Fundamental All Cap Core Trust — a) 0.675% of the first $2.5 billion of aggregate net assets and b) 0.650% of the excess over $2.5 billion of aggregate net assets.
• Fundamental Large Cap Value Trust — a) 0.700% of the first $500 million of aggregate net assets; b) 0.650% of aggregate net assets between $500 million and $1 billion;and c) 0.600% of the excess over $1 billion of aggregate net assets.
• Global Trust — Aggregate net assets are the aggregate net assets of International Value Trust, Income Trust, Mutual Shares Trust, JHF II International Value Fund andJHF II International Small Cap Fund. The advisory fees paid are as follows: a) 0.850% of the first $1 billion of aggregate net assets and b) 0.800% of the excess over$1 billion of aggregate net assets.
• Health Sciences Trust — a) 1.050% of the first $500 million of aggregate net assets; b) 1.000% of aggregate net assets between $500 million and $750 million; andc) 0.950% of the excess over $750 million of aggregate net assets. When aggregate net assets exceed $750 million, the advisory fee is 0.950% on all net assets.
• International Equity Index Trust B — a) 0.550% of the first $100 million of average net assets and b) 0.530% of the excess over $100 million of average net assets.
• International Growth Stock Trust — a) 0.850% of the first $250 million of aggregate net assets; b) 0.800% of aggregate net assets between $250 million and $750 million;and c) 0.750% of the excess over $750 million of aggregate net assets.
• International Small Company Trust — 0.950% of aggregate net assets.
• International Value Trust — Aggregate net assets are the aggregate net assets of Income Trust, International Value Trust, Mutual Shares Trust, JHF II International SmallCap Fund and JHF II International Value Fund. The advisory fees paid are as follows: a) 0.950% of the first $150 million of aggregate net assets; b) 0.850% of aggre-gate net assets between $150 million and $300 million; and c) 0.800% of the excess over $300 million of aggregate net assets. However, when aggregate net assetsexceed $300 million, then the advisory fee rate is 0.800% of aggregate net assets.
• Lifestyle PS Series — The advisory fee has two components: a) a fee on net assets invested in affiliated funds (Affiliated fund assets) excluding 500 Index Trust B,International Equity Index Trust B and Total Bond Market Trust B, and b) a fee on net assets not invested in affiliated funds (Other assets). The advisory fee paid onAffiliated fund assets is as follows: a) 0.050% of the first $7.5 billion of aggregate net assets and b) 0.040% of the excess over $7.5 billion in aggregate net assets. Theadvisory fee paid on Other assets is as follows: a) 0.500% of the first $7.5 billion of aggregate net assets and b) 0.490% of the excess over $7.5 billion in aggregate netassets.
• Mid Cap Index Trust and Small Cap Index Trust — a) 0.490% of the first $250 million of average net assets; b) 0.480% of average net assets between $250 million and$500 million; and c) 0.460% of the excess over $500 million of average net assets.
• Mid Cap Stock Trust — a) 0.875% of the first $200 million of aggregate net assets; b) 0.850% of aggregate net assets between $200 million and $500 million; andc) 0.825% of the excess over $500 million of aggregate net assets.
• Mid Value Trust — a) 1.050% of the first $20 million of aggregate net assets; and b) 0.950% of the excess over $20 million of aggregate net assets. When aggregate netassets exceed $50 million on any day, the advisory fee for that day is 0.950% of all assets of the portfolio.
• Mutual Shares Trust — a) 0.960% of the first $750 million of average net assets; and b) 0.920% of the excess over $750 million of average net assets. When AverageNet Assets for the Mutual Shares Trust exceed $750 million, the advisory fee is 0.92% on all net assets.
• Real Estate Securities Trust — 0.700% of aggregate net assets.
FEES AND TRANSACTIONS WITH AFFILIATES, CONTINUED
126
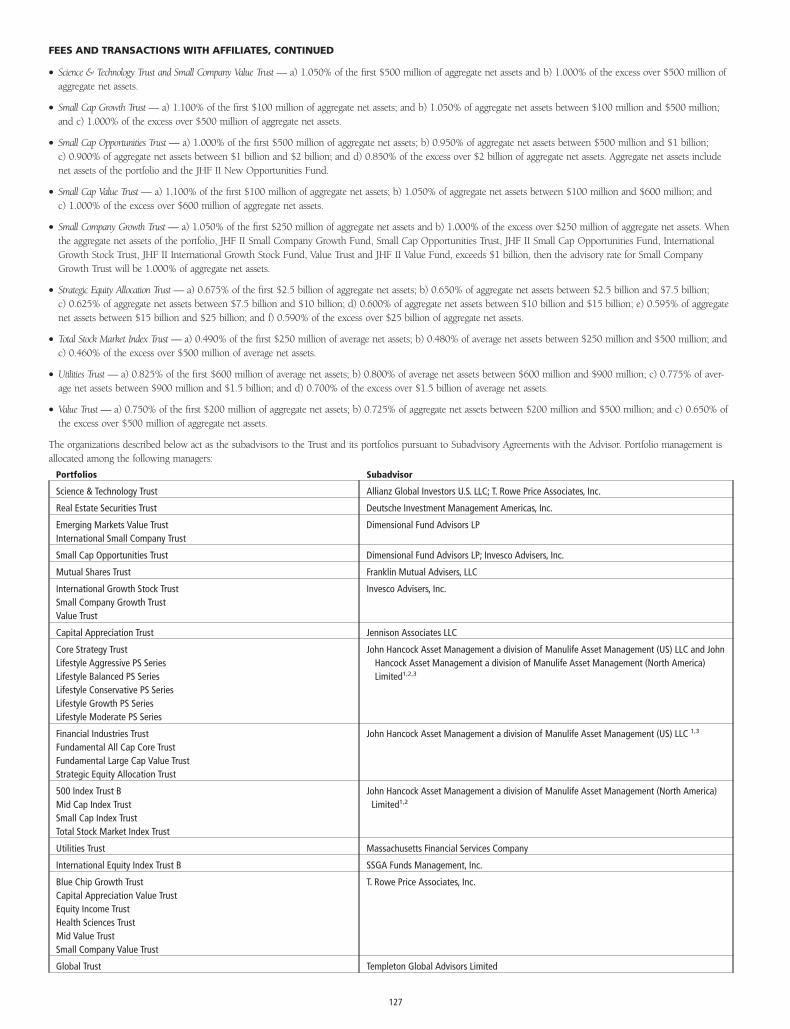
• Science & Technology Trust and Small Company Value Trust — a) 1.050% of the first $500 million of aggregate net assets and b) 1.000% of the excess over $500 million ofaggregate net assets.
• Small Cap Growth Trust — a) 1.100% of the first $100 million of aggregate net assets; and b) 1.050% of aggregate net assets between $100 million and $500 million;and c) 1.000% of the excess over $500 million of aggregate net assets.
• Small Cap Opportunities Trust — a) 1.000% of the first $500 million of aggregate net assets; b) 0.950% of aggregate net assets between $500 million and $1 billion;c) 0.900% of aggregate net assets between $1 billion and $2 billion; and d) 0.850% of the excess over $2 billion of aggregate net assets. Aggregate net assets includenet assets of the portfolio and the JHF II New Opportunities Fund.
• Small Cap Value Trust — a) 1.100% of the first $100 million of aggregate net assets; b) 1.050% of aggregate net assets between $100 million and $600 million; andc) 1.000% of the excess over $600 million of aggregate net assets.
• Small Company Growth Trust — a) 1.050% of the first $250 million of aggregate net assets and b) 1.000% of the excess over $250 million of aggregate net assets. Whenthe aggregate net assets of the portfolio, JHF II Small Company Growth Fund, Small Cap Opportunities Trust, JHF II Small Cap Opportunities Fund, InternationalGrowth Stock Trust, JHF II International Growth Stock Fund, Value Trust and JHF II Value Fund, exceeds $1 billion, then the advisory rate for Small CompanyGrowth Trust will be 1.000% of aggregate net assets.
• Strategic Equity Allocation Trust — a) 0.675% of the first $2.5 billion of aggregate net assets; b) 0.650% of aggregate net assets between $2.5 billion and $7.5 billion;c) 0.625% of aggregate net assets between $7.5 billion and $10 billion; d) 0.600% of aggregate net assets between $10 billion and $15 billion; e) 0.595% of aggregatenet assets between $15 billion and $25 billion; and f) 0.590% of the excess over $25 billion of aggregate net assets.
• Total Stock Market Index Trust — a) 0.490% of the first $250 million of average net assets; b) 0.480% of average net assets between $250 million and $500 million; andc) 0.460% of the excess over $500 million of average net assets.
• Utilities Trust — a) 0.825% of the first $600 million of average net assets; b) 0.800% of average net assets between $600 million and $900 million; c) 0.775% of aver-age net assets between $900 million and $1.5 billion; and d) 0.700% of the excess over $1.5 billion of average net assets.
• Value Trust — a) 0.750% of the first $200 million of aggregate net assets; b) 0.725% of aggregate net assets between $200 million and $500 million; and c) 0.650% ofthe excess over $500 million of aggregate net assets.
The organizations described below act as the subadvisors to the Trust and its portfolios pursuant to Subadvisory Agreements with the Advisor. Portfolio management isallocated among the following managers:
Portfolios Subadvisor
Science & Technology Trust Allianz Global Investors U.S. LLC; T. Rowe Price Associates, Inc.
Real Estate Securities Trust Deutsche Investment Management Americas, Inc.
Emerging Markets Value Trust Dimensional Fund Advisors LPInternational Small Company Trust
Small Cap Opportunities Trust Dimensional Fund Advisors LP; Invesco Advisers, Inc.
Mutual Shares Trust Franklin Mutual Advisers, LLC
International Growth Stock Trust Invesco Advisers, Inc.Small Company Growth TrustValue Trust
Capital Appreciation Trust Jennison Associates LLC
Core Strategy Trust John Hancock Asset Management a division of Manulife Asset Management (US) LLC and JohnLifestyle Aggressive PS Series Hancock Asset Management a division of Manulife Asset Management (North America)Lifestyle Balanced PS Series Limited1,2,3
Lifestyle Conservative PS SeriesLifestyle Growth PS SeriesLifestyle Moderate PS Series
Financial Industries Trust John Hancock Asset Management a division of Manulife Asset Management (US) LLC 1,3
Fundamental All Cap Core TrustFundamental Large Cap Value TrustStrategic Equity Allocation Trust
500 Index Trust B John Hancock Asset Management a division of Manulife Asset Management (North America)Mid Cap Index Trust Limited1,2
Small Cap Index TrustTotal Stock Market Index Trust
Utilities Trust Massachusetts Financial Services Company
International Equity Index Trust B SSGA Funds Management, Inc.
Blue Chip Growth Trust T. Rowe Price Associates, Inc.Capital Appreciation Value TrustEquity Income TrustHealth Sciences TrustMid Value TrustSmall Company Value Trust
Global Trust Templeton Global Advisors Limited
FEES AND TRANSACTIONS WITH AFFILIATES, CONTINUED
127
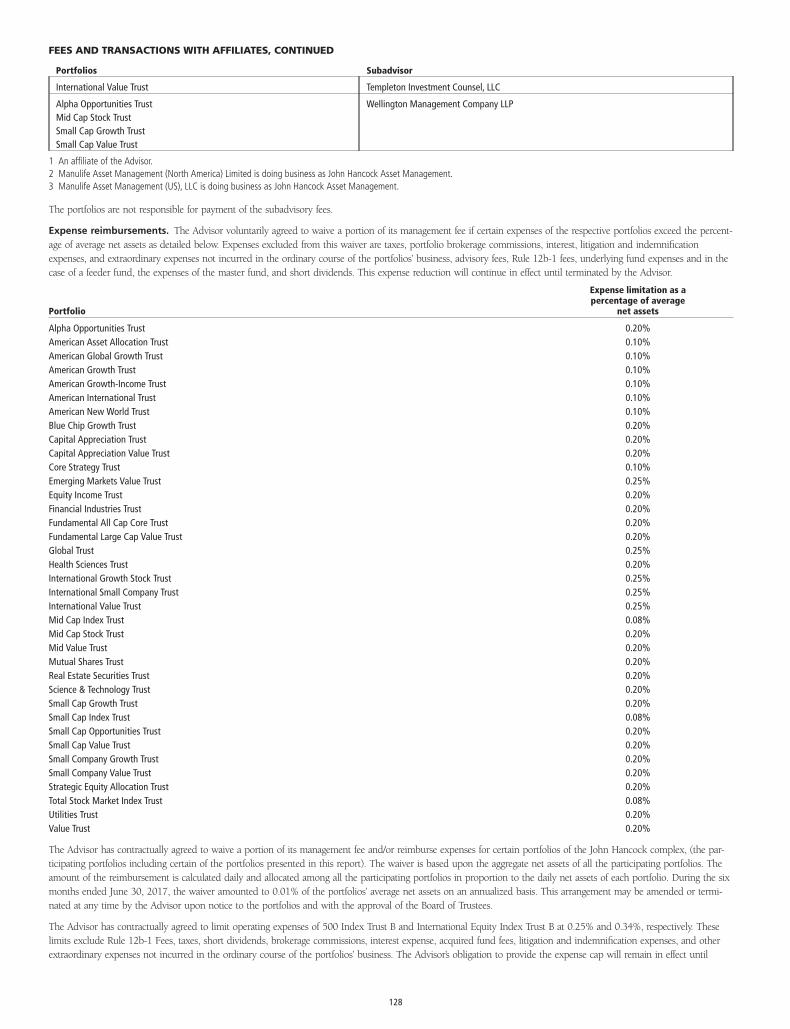
Portfolios Subadvisor
International Value Trust Templeton Investment Counsel, LLC
Alpha Opportunities Trust Wellington Management Company LLPMid Cap Stock TrustSmall Cap Growth TrustSmall Cap Value Trust
1 An affiliate of the Advisor.2 Manulife Asset Management (North America) Limited is doing business as John Hancock Asset Management.3 Manulife Asset Management (US), LLC is doing business as John Hancock Asset Management.
The portfolios are not responsible for payment of the subadvisory fees.
Expense reimbursements. The Advisor voluntarily agreed to waive a portion of its management fee if certain expenses of the respective portfolios exceed the percent-age of average net assets as detailed below. Expenses excluded from this waiver are taxes, portfolio brokerage commissions, interest, litigation and indemnificationexpenses, and extraordinary expenses not incurred in the ordinary course of the portfolios’ business, advisory fees, Rule 12b-1 fees, underlying fund expenses and in thecase of a feeder fund, the expenses of the master fund, and short dividends. This expense reduction will continue in effect until terminated by the Advisor.
Portfolio
Expense limitation as apercentage of average
net assets
Alpha Opportunities Trust 0.20%American Asset Allocation Trust 0.10%American Global Growth Trust 0.10%American Growth Trust 0.10%American Growth-Income Trust 0.10%American International Trust 0.10%American New World Trust 0.10%Blue Chip Growth Trust 0.20%Capital Appreciation Trust 0.20%Capital Appreciation Value Trust 0.20%Core Strategy Trust 0.10%Emerging Markets Value Trust 0.25%Equity Income Trust 0.20%Financial Industries Trust 0.20%Fundamental All Cap Core Trust 0.20%Fundamental Large Cap Value Trust 0.20%Global Trust 0.25%Health Sciences Trust 0.20%International Growth Stock Trust 0.25%International Small Company Trust 0.25%International Value Trust 0.25%Mid Cap Index Trust 0.08%Mid Cap Stock Trust 0.20%Mid Value Trust 0.20%Mutual Shares Trust 0.20%Real Estate Securities Trust 0.20%Science & Technology Trust 0.20%Small Cap Growth Trust 0.20%Small Cap Index Trust 0.08%Small Cap Opportunities Trust 0.20%Small Cap Value Trust 0.20%Small Company Growth Trust 0.20%Small Company Value Trust 0.20%Strategic Equity Allocation Trust 0.20%Total Stock Market Index Trust 0.08%Utilities Trust 0.20%Value Trust 0.20%
The Advisor has contractually agreed to waive a portion of its management fee and/or reimburse expenses for certain portfolios of the John Hancock complex, (the par-ticipating portfolios including certain of the portfolios presented in this report). The waiver is based upon the aggregate net assets of all the participating portfolios. Theamount of the reimbursement is calculated daily and allocated among all the participating portfolios in proportion to the daily net assets of each portfolio. During the sixmonths ended June 30, 2017, the waiver amounted to 0.01% of the portfolios’ average net assets on an annualized basis. This arrangement may be amended or termi-nated at any time by the Advisor upon notice to the portfolios and with the approval of the Board of Trustees.
The Advisor has contractually agreed to limit operating expenses of 500 Index Trust B and International Equity Index Trust B at 0.25% and 0.34%, respectively. Theselimits exclude Rule 12b-1 Fees, taxes, short dividends, brokerage commissions, interest expense, acquired fund fees, litigation and indemnification expenses, and otherextraordinary expenses not incurred in the ordinary course of the portfolios’ business. The Advisor’s obligation to provide the expense cap will remain in effect until
FEES AND TRANSACTIONS WITH AFFILIATES, CONTINUED
128
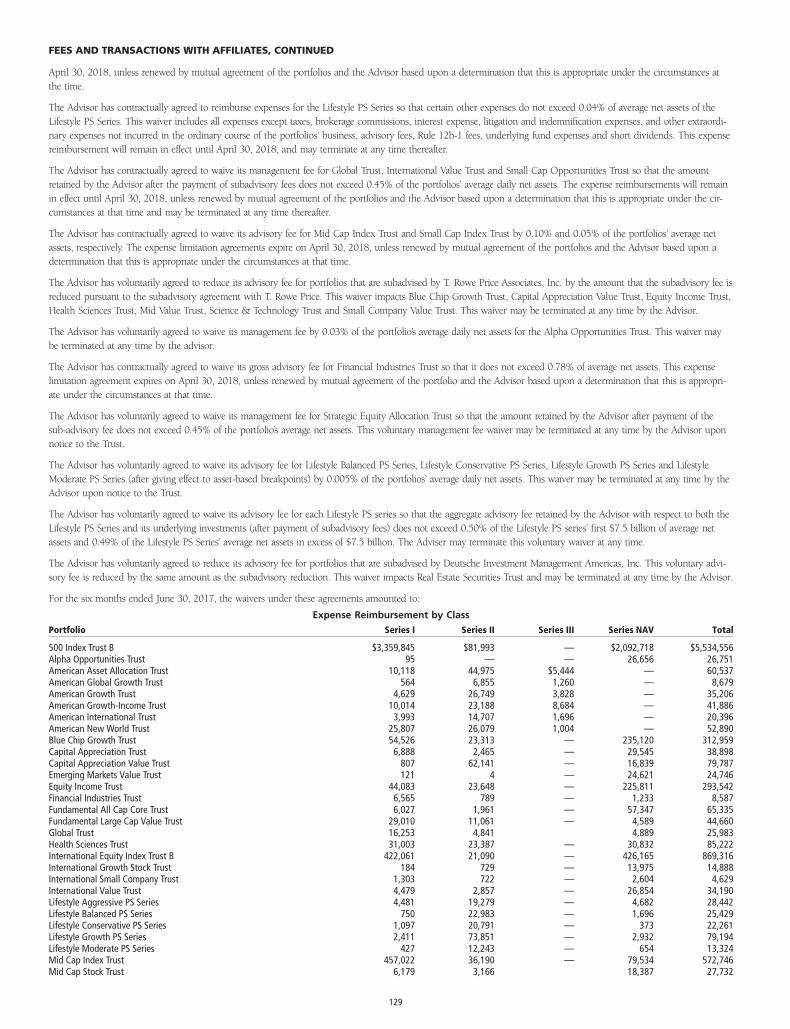
April 30, 2018, unless renewed by mutual agreement of the portfolios and the Advisor based upon a determination that this is appropriate under the circumstances atthe time.
The Advisor has contractually agreed to reimburse expenses for the Lifestyle PS Series so that certain other expenses do not exceed 0.04% of average net assets of theLifestyle PS Series. This waiver includes all expenses except taxes, brokerage commissions, interest expense, litigation and indemnification expenses, and other extraordi-nary expenses not incurred in the ordinary course of the portfolios’ business, advisory fees, Rule 12b-1 fees, underlying fund expenses and short dividends. This expensereimbursement will remain in effect until April 30, 2018, and may terminate at any time thereafter.
The Advisor has contractually agreed to waive its management fee for Global Trust, International Value Trust and Small Cap Opportunities Trust so that the amountretained by the Advisor after the payment of subadvisory fees does not exceed 0.45% of the portfolios’ average daily net assets. The expense reimbursements will remainin effect until April 30, 2018, unless renewed by mutual agreement of the portfolios and the Advisor based upon a determination that this is appropriate under the cir-cumstances at that time and may be terminated at any time thereafter.
The Advisor has contractually agreed to waive its advisory fee for Mid Cap Index Trust and Small Cap Index Trust by 0.10% and 0.05% of the portfolios’ average netassets, respectively. The expense limitation agreements expire on April 30, 2018, unless renewed by mutual agreement of the portfolios and the Advisor based upon adetermination that this is appropriate under the circumstances at that time.
The Advisor has voluntarily agreed to reduce its advisory fee for portfolios that are subadvised by T. Rowe Price Associates, Inc. by the amount that the subadvisory fee isreduced pursuant to the subadvisory agreement with T. Rowe Price. This waiver impacts Blue Chip Growth Trust, Capital Appreciation Value Trust, Equity Income Trust,Health Sciences Trust, Mid Value Trust, Science & Technology Trust and Small Company Value Trust. This waiver may be terminated at any time by the Advisor.
The Advisor has voluntarily agreed to waive its management fee by 0.03% of the portfolio’s average daily net assets for the Alpha Opportunities Trust. This waiver maybe terminated at any time by the advisor.
The Advisor has contractually agreed to waive its gross advisory fee for Financial Industries Trust so that it does not exceed 0.78% of average net assets. This expenselimitation agreement expires on April 30, 2018, unless renewed by mutual agreement of the portfolio and the Advisor based upon a determination that this is appropri-ate under the circumstances at that time.
The Advisor has voluntarily agreed to waive its management fee for Strategic Equity Allocation Trust so that the amount retained by the Advisor after payment of thesub-advisory fee does not exceed 0.45% of the portfolio’s average net assets. This voluntary management fee waiver may be terminated at any time by the Advisor uponnotice to the Trust.
The Advisor has voluntarily agreed to waive its advisory fee for Lifestyle Balanced PS Series, Lifestyle Conservative PS Series, Lifestyle Growth PS Series and LifestyleModerate PS Series (after giving effect to asset-based breakpoints) by 0.005% of the portfolios’ average daily net assets. This waiver may be terminated at any time by theAdvisor upon notice to the Trust.
The Advisor has voluntarily agreed to waive its advisory fee for each Lifestyle PS series so that the aggregate advisory fee retained by the Advisor with respect to both theLifestyle PS Series and its underlying investments (after payment of subadvisory fees) does not exceed 0.50% of the Lifestyle PS series’ first $7.5 billion of average netassets and 0.49% of the Lifestyle PS Series’ average net assets in excess of $7.5 billion. The Adviser may terminate this voluntary waiver at any time.
The Advisor has voluntarily agreed to reduce its advisory fee for portfolios that are subadvised by Deutsche Investment Management Americas, Inc. This voluntary advi-sory fee is reduced by the same amount as the subadvisory reduction. This waiver impacts Real Estate Securities Trust and may be terminated at any time by the Advisor.
For the six months ended June 30, 2017, the waivers under these agreements amounted to:
Expense Reimbursement by Class
Portfolio Series I Series II Series III Series NAV Total
500 Index Trust B $3,359,845 $81,993 — $2,092,718 $5,534,556Alpha Opportunities Trust 95 — — 26,656 26,751American Asset Allocation Trust 10,118 44,975 $5,444 — 60,537American Global Growth Trust 564 6,855 1,260 — 8,679American Growth Trust 4,629 26,749 3,828 — 35,206American Growth-Income Trust 10,014 23,188 8,684 — 41,886American International Trust 3,993 14,707 1,696 — 20,396American New World Trust 25,807 26,079 1,004 — 52,890Blue Chip Growth Trust 54,526 23,313 — 235,120 312,959Capital Appreciation Trust 6,888 2,465 — 29,545 38,898Capital Appreciation Value Trust 807 62,141 — 16,839 79,787Emerging Markets Value Trust 121 4 — 24,621 24,746Equity Income Trust 44,083 23,648 — 225,811 293,542Financial Industries Trust 6,565 789 — 1,233 8,587Fundamental All Cap Core Trust 6,027 1,961 — 57,347 65,335Fundamental Large Cap Value Trust 29,010 11,061 — 4,589 44,660Global Trust 16,253 4,841 4,889 25,983Health Sciences Trust 31,003 23,387 — 30,832 85,222International Equity Index Trust B 422,061 21,090 — 426,165 869,316International Growth Stock Trust 184 729 — 13,975 14,888International Small Company Trust 1,303 722 — 2,604 4,629International Value Trust 4,479 2,857 — 26,854 34,190Lifestyle Aggressive PS Series 4,481 19,279 — 4,682 28,442Lifestyle Balanced PS Series 750 22,983 — 1,696 25,429Lifestyle Conservative PS Series 1,097 20,791 — 373 22,261Lifestyle Growth PS Series 2,411 73,851 — 2,932 79,194Lifestyle Moderate PS Series 427 12,243 — 654 13,324Mid Cap Index Trust 457,022 36,190 — 79,534 572,746Mid Cap Stock Trust 6,179 3,166 18,387 27,732
FEES AND TRANSACTIONS WITH AFFILIATES, CONTINUED
129
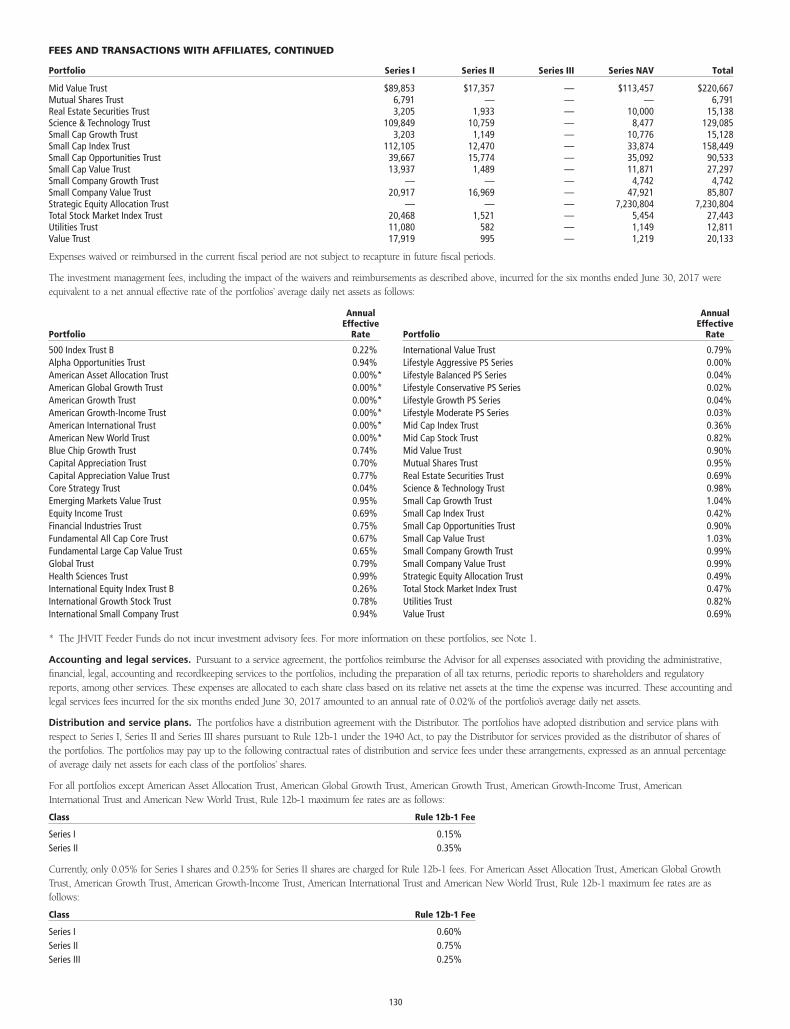
Portfolio Series I Series II Series III Series NAV Total
Mid Value Trust $89,853 $17,357 — $113,457 $220,667Mutual Shares Trust 6,791 — — — 6,791Real Estate Securities Trust 3,205 1,933 — 10,000 15,138Science & Technology Trust 109,849 10,759 — 8,477 129,085Small Cap Growth Trust 3,203 1,149 — 10,776 15,128Small Cap Index Trust 112,105 12,470 — 33,874 158,449Small Cap Opportunities Trust 39,667 15,774 — 35,092 90,533Small Cap Value Trust 13,937 1,489 — 11,871 27,297Small Company Growth Trust — — — 4,742 4,742Small Company Value Trust 20,917 16,969 — 47,921 85,807Strategic Equity Allocation Trust — — — 7,230,804 7,230,804Total Stock Market Index Trust 20,468 1,521 — 5,454 27,443Utilities Trust 11,080 582 — 1,149 12,811Value Trust 17,919 995 — 1,219 20,133
Expenses waived or reimbursed in the current fiscal period are not subject to recapture in future fiscal periods.
The investment management fees, including the impact of the waivers and reimbursements as described above, incurred for the six months ended June 30, 2017 wereequivalent to a net annual effective rate of the portfolios’ average daily net assets as follows:
Portfolio
AnnualEffective
Rate
500 Index Trust B 0.22%Alpha Opportunities Trust 0.94%American Asset Allocation Trust 0.00%*American Global Growth Trust 0.00%*American Growth Trust 0.00%*American Growth-Income Trust 0.00%*American International Trust 0.00%*American New World Trust 0.00%*Blue Chip Growth Trust 0.74%Capital Appreciation Trust 0.70%Capital Appreciation Value Trust 0.77%Core Strategy Trust 0.04%Emerging Markets Value Trust 0.95%Equity Income Trust 0.69%Financial Industries Trust 0.75%Fundamental All Cap Core Trust 0.67%Fundamental Large Cap Value Trust 0.65%Global Trust 0.79%Health Sciences Trust 0.99%International Equity Index Trust B 0.26%International Growth Stock Trust 0.78%International Small Company Trust 0.94%
Portfolio
AnnualEffective
Rate
International Value Trust 0.79%Lifestyle Aggressive PS Series 0.00%Lifestyle Balanced PS Series 0.04%Lifestyle Conservative PS Series 0.02%Lifestyle Growth PS Series 0.04%Lifestyle Moderate PS Series 0.03%Mid Cap Index Trust 0.36%Mid Cap Stock Trust 0.82%Mid Value Trust 0.90%Mutual Shares Trust 0.95%Real Estate Securities Trust 0.69%Science & Technology Trust 0.98%Small Cap Growth Trust 1.04%Small Cap Index Trust 0.42%Small Cap Opportunities Trust 0.90%Small Cap Value Trust 1.03%Small Company Growth Trust 0.99%Small Company Value Trust 0.99%Strategic Equity Allocation Trust 0.49%Total Stock Market Index Trust 0.47%Utilities Trust 0.82%Value Trust 0.69%
* The JHVIT Feeder Funds do not incur investment advisory fees. For more information on these portfolios, see Note 1.
Accounting and legal services. Pursuant to a service agreement, the portfolios reimburse the Advisor for all expenses associated with providing the administrative,financial, legal, accounting and recordkeeping services to the portfolios, including the preparation of all tax returns, periodic reports to shareholders and regulatoryreports, among other services. These expenses are allocated to each share class based on its relative net assets at the time the expense was incurred. These accounting andlegal services fees incurred for the six months ended June 30, 2017 amounted to an annual rate of 0.02% of the portfolio’s average daily net assets.
Distribution and service plans. The portfolios have a distribution agreement with the Distributor. The portfolios have adopted distribution and service plans withrespect to Series I, Series II and Series III shares pursuant to Rule 12b-1 under the 1940 Act, to pay the Distributor for services provided as the distributor of shares ofthe portfolios. The portfolios may pay up to the following contractual rates of distribution and service fees under these arrangements, expressed as an annual percentageof average daily net assets for each class of the portfolios’ shares.
For all portfolios except American Asset Allocation Trust, American Global Growth Trust, American Growth Trust, American Growth-Income Trust, AmericanInternational Trust and American New World Trust, Rule 12b-1 maximum fee rates are as follows:
Class Rule 12b-1 Fee
Series I 0.15%Series II 0.35%
Currently, only 0.05% for Series I shares and 0.25% for Series II shares are charged for Rule 12b-1 fees. For American Asset Allocation Trust, American Global GrowthTrust, American Growth Trust, American Growth-Income Trust, American International Trust and American New World Trust, Rule 12b-1 maximum fee rates are asfollows:
Class Rule 12b-1 Fee
Series I 0.60%Series II 0.75%Series III 0.25%
FEES AND TRANSACTIONS WITH AFFILIATES, CONTINUED
130
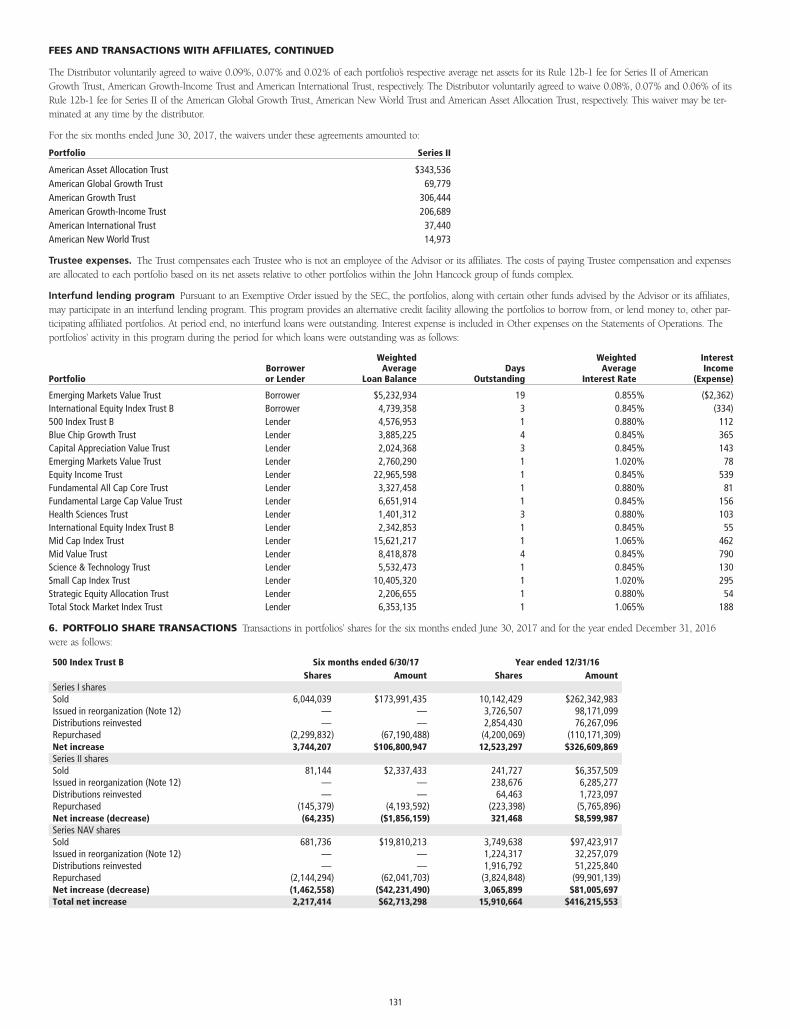
The Distributor voluntarily agreed to waive 0.09%, 0.07% and 0.02% of each portfolio’s respective average net assets for its Rule 12b-1 fee for Series II of AmericanGrowth Trust, American Growth-Income Trust and American International Trust, respectively. The Distributor voluntarily agreed to waive 0.08%, 0.07% and 0.06% of itsRule 12b-1 fee for Series II of the American Global Growth Trust, American New World Trust and American Asset Allocation Trust, respectively. This waiver may be ter-minated at any time by the distributor.
For the six months ended June 30, 2017, the waivers under these agreements amounted to:
Portfolio Series II
American Asset Allocation Trust $343,536American Global Growth Trust 69,779American Growth Trust 306,444American Growth-Income Trust 206,689American International Trust 37,440American New World Trust 14,973
Trustee expenses. The Trust compensates each Trustee who is not an employee of the Advisor or its affiliates. The costs of paying Trustee compensation and expensesare allocated to each portfolio based on its net assets relative to other portfolios within the John Hancock group of funds complex.
Interfund lending program Pursuant to an Exemptive Order issued by the SEC, the portfolios, along with certain other funds advised by the Advisor or its affiliates,may participate in an interfund lending program. This program provides an alternative credit facility allowing the portfolios to borrow from, or lend money to, other par-ticipating affiliated portfolios. At period end, no interfund loans were outstanding. Interest expense is included in Other expenses on the Statements of Operations. Theportfolios’ activity in this program during the period for which loans were outstanding was as follows:
PortfolioBorroweror Lender
WeightedAverage
Loan BalanceDays
Outstanding
WeightedAverage
Interest Rate
InterestIncome
(Expense)
Emerging Markets Value Trust Borrower $5,232,934 19 0.855% ($2,362)International Equity Index Trust B Borrower 4,739,358 3 0.845% (334)500 Index Trust B Lender 4,576,953 1 0.880% 112Blue Chip Growth Trust Lender 3,885,225 4 0.845% 365Capital Appreciation Value Trust Lender 2,024,368 3 0.845% 143Emerging Markets Value Trust Lender 2,760,290 1 1.020% 78Equity Income Trust Lender 22,965,598 1 0.845% 539Fundamental All Cap Core Trust Lender 3,327,458 1 0.880% 81Fundamental Large Cap Value Trust Lender 6,651,914 1 0.845% 156Health Sciences Trust Lender 1,401,312 3 0.880% 103International Equity Index Trust B Lender 2,342,853 1 0.845% 55Mid Cap Index Trust Lender 15,621,217 1 1.065% 462Mid Value Trust Lender 8,418,878 4 0.845% 790Science & Technology Trust Lender 5,532,473 1 0.845% 130Small Cap Index Trust Lender 10,405,320 1 1.020% 295Strategic Equity Allocation Trust Lender 2,206,655 1 0.880% 54Total Stock Market Index Trust Lender 6,353,135 1 1.065% 188
6. PORTFOLIO SHARE TRANSACTIONS Transactions in portfolios’ shares for the six months ended June 30, 2017 and for the year ended December 31, 2016were as follows:
500 Index Trust B Six months ended 6/30/17 Year ended 12/31/16Shares Amount Shares Amount
Series I sharesSold 6,044,039 $173,991,435 10,142,429 $262,342,983Issued in reorganization (Note 12) — — 3,726,507 98,171,099Distributions reinvested — — 2,854,430 76,267,096Repurchased (2,299,832) (67,190,488) (4,200,069) (110,171,309)Net increase 3,744,207 $106,800,947 12,523,297 $326,609,869Series II sharesSold 81,144 $2,337,433 241,727 $6,357,509Issued in reorganization (Note 12) — — 238,676 6,285,277Distributions reinvested — — 64,463 1,723,097Repurchased (145,379) (4,193,592) (223,398) (5,765,896)Net increase (decrease) (64,235) ($1,856,159) 321,468 $8,599,987Series NAV sharesSold 681,736 $19,810,213 3,749,638 $97,423,917Issued in reorganization (Note 12) — — 1,224,317 32,257,079Distributions reinvested — — 1,916,792 51,225,840Repurchased (2,144,294) (62,041,703) (3,824,848) (99,901,139)Net increase (decrease) (1,462,558) ($42,231,490) 3,065,899 $81,005,697Total net increase 2,217,414 $62,713,298 15,910,664 $416,215,553
FEES AND TRANSACTIONS WITH AFFILIATES, CONTINUED
131
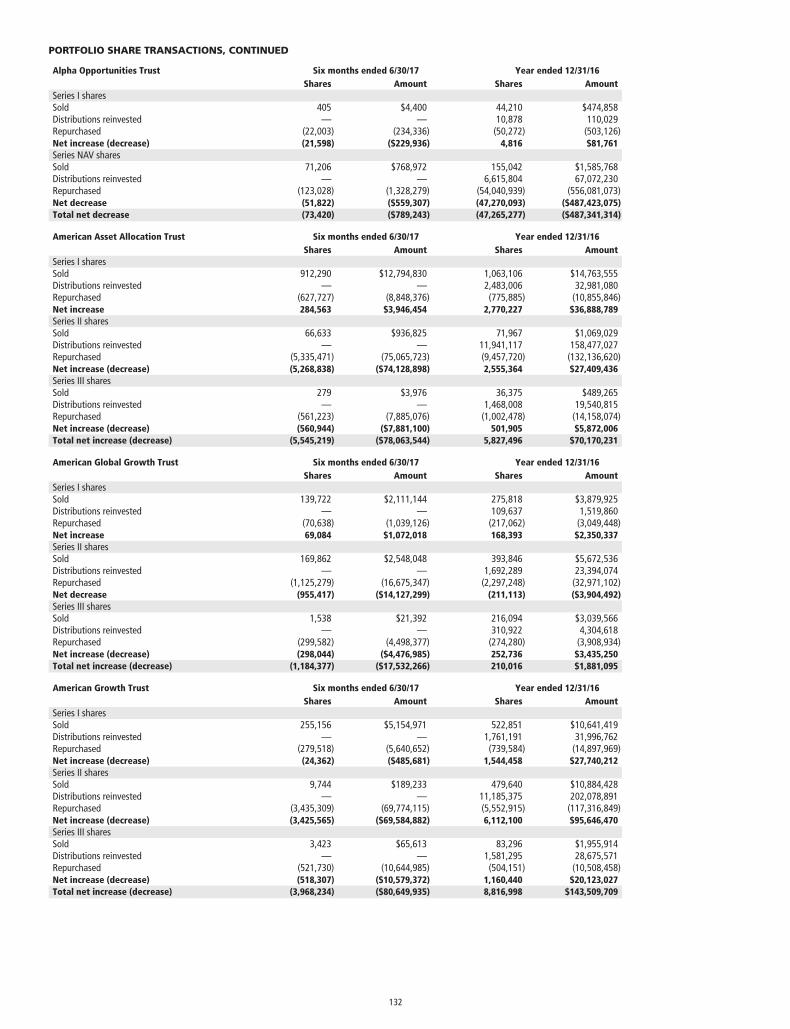
Alpha Opportunities Trust Six months ended 6/30/17 Year ended 12/31/16Shares Amount Shares Amount
Series I sharesSold 405 $4,400 44,210 $474,858Distributions reinvested — — 10,878 110,029Repurchased (22,003) (234,336) (50,272) (503,126)Net increase (decrease) (21,598) ($229,936) 4,816 $81,761Series NAV sharesSold 71,206 $768,972 155,042 $1,585,768Distributions reinvested — — 6,615,804 67,072,230Repurchased (123,028) (1,328,279) (54,040,939) (556,081,073)Net decrease (51,822) ($559,307) (47,270,093) ($487,423,075)Total net decrease (73,420) ($789,243) (47,265,277) ($487,341,314)
American Asset Allocation Trust Six months ended 6/30/17 Year ended 12/31/16Shares Amount Shares Amount
Series I sharesSold 912,290 $12,794,830 1,063,106 $14,763,555Distributions reinvested — — 2,483,006 32,981,080Repurchased (627,727) (8,848,376) (775,885) (10,855,846)Net increase 284,563 $3,946,454 2,770,227 $36,888,789Series II sharesSold 66,633 $936,825 71,967 $1,069,029Distributions reinvested — — 11,941,117 158,477,027Repurchased (5,335,471) (75,065,723) (9,457,720) (132,136,620)Net increase (decrease) (5,268,838) ($74,128,898) 2,555,364 $27,409,436Series III sharesSold 279 $3,976 36,375 $489,265Distributions reinvested — — 1,468,008 19,540,815Repurchased (561,223) (7,885,076) (1,002,478) (14,158,074)Net increase (decrease) (560,944) ($7,881,100) 501,905 $5,872,006Total net increase (decrease) (5,545,219) ($78,063,544) 5,827,496 $70,170,231
American Global Growth Trust Six months ended 6/30/17 Year ended 12/31/16Shares Amount Shares Amount
Series I sharesSold 139,722 $2,111,144 275,818 $3,879,925Distributions reinvested — — 109,637 1,519,860Repurchased (70,638) (1,039,126) (217,062) (3,049,448)Net increase 69,084 $1,072,018 168,393 $2,350,337Series II sharesSold 169,862 $2,548,048 393,846 $5,672,536Distributions reinvested — — 1,692,289 23,394,074Repurchased (1,125,279) (16,675,347) (2,297,248) (32,971,102)Net decrease (955,417) ($14,127,299) (211,113) ($3,904,492)Series III sharesSold 1,538 $21,392 216,094 $3,039,566Distributions reinvested — — 310,922 4,304,618Repurchased (299,582) (4,498,377) (274,280) (3,908,934)Net increase (decrease) (298,044) ($4,476,985) 252,736 $3,435,250Total net increase (decrease) (1,184,377) ($17,532,266) 210,016 $1,881,095
American Growth Trust Six months ended 6/30/17 Year ended 12/31/16Shares Amount Shares Amount
Series I sharesSold 255,156 $5,154,971 522,851 $10,641,419Distributions reinvested — — 1,761,191 31,996,762Repurchased (279,518) (5,640,652) (739,584) (14,897,969)Net increase (decrease) (24,362) ($485,681) 1,544,458 $27,740,212Series II sharesSold 9,744 $189,233 479,640 $10,884,428Distributions reinvested — — 11,185,375 202,078,891Repurchased (3,435,309) (69,774,115) (5,552,915) (117,316,849)Net increase (decrease) (3,425,565) ($69,584,882) 6,112,100 $95,646,470Series III sharesSold 3,423 $65,613 83,296 $1,955,914Distributions reinvested — — 1,581,295 28,675,571Repurchased (521,730) (10,644,985) (504,151) (10,508,458)Net increase (decrease) (518,307) ($10,579,372) 1,160,440 $20,123,027Total net increase (decrease) (3,968,234) ($80,649,935) 8,816,998 $143,509,709
PORTFOLIO SHARE TRANSACTIONS, CONTINUED
132
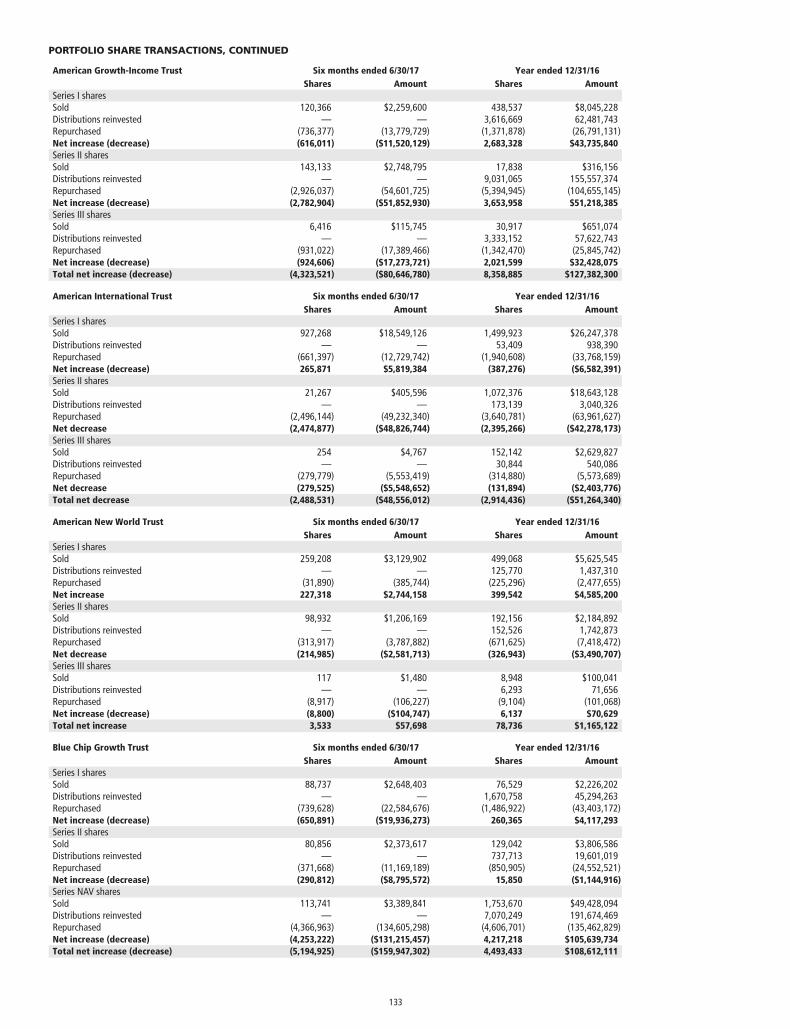
American Growth-Income Trust Six months ended 6/30/17 Year ended 12/31/16Shares Amount Shares Amount
Series I sharesSold 120,366 $2,259,600 438,537 $8,045,228Distributions reinvested — — 3,616,669 62,481,743Repurchased (736,377) (13,779,729) (1,371,878) (26,791,131)Net increase (decrease) (616,011) ($11,520,129) 2,683,328 $43,735,840Series II sharesSold 143,133 $2,748,795 17,838 $316,156Distributions reinvested — — 9,031,065 155,557,374Repurchased (2,926,037) (54,601,725) (5,394,945) (104,655,145)Net increase (decrease) (2,782,904) ($51,852,930) 3,653,958 $51,218,385Series III sharesSold 6,416 $115,745 30,917 $651,074Distributions reinvested — — 3,333,152 57,622,743Repurchased (931,022) (17,389,466) (1,342,470) (25,845,742)Net increase (decrease) (924,606) ($17,273,721) 2,021,599 $32,428,075Total net increase (decrease) (4,323,521) ($80,646,780) 8,358,885 $127,382,300
American International Trust Six months ended 6/30/17 Year ended 12/31/16Shares Amount Shares Amount
Series I sharesSold 927,268 $18,549,126 1,499,923 $26,247,378Distributions reinvested — — 53,409 938,390Repurchased (661,397) (12,729,742) (1,940,608) (33,768,159)Net increase (decrease) 265,871 $5,819,384 (387,276) ($6,582,391)Series II sharesSold 21,267 $405,596 1,072,376 $18,643,128Distributions reinvested — — 173,139 3,040,326Repurchased (2,496,144) (49,232,340) (3,640,781) (63,961,627)Net decrease (2,474,877) ($48,826,744) (2,395,266) ($42,278,173)Series III sharesSold 254 $4,767 152,142 $2,629,827Distributions reinvested — — 30,844 540,086Repurchased (279,779) (5,553,419) (314,880) (5,573,689)Net decrease (279,525) ($5,548,652) (131,894) ($2,403,776)Total net decrease (2,488,531) ($48,556,012) (2,914,436) ($51,264,340)
American New World Trust Six months ended 6/30/17 Year ended 12/31/16Shares Amount Shares Amount
Series I sharesSold 259,208 $3,129,902 499,068 $5,625,545Distributions reinvested — — 125,770 1,437,310Repurchased (31,890) (385,744) (225,296) (2,477,655)Net increase 227,318 $2,744,158 399,542 $4,585,200Series II sharesSold 98,932 $1,206,169 192,156 $2,184,892Distributions reinvested — — 152,526 1,742,873Repurchased (313,917) (3,787,882) (671,625) (7,418,472)Net decrease (214,985) ($2,581,713) (326,943) ($3,490,707)Series III sharesSold 117 $1,480 8,948 $100,041Distributions reinvested — — 6,293 71,656Repurchased (8,917) (106,227) (9,104) (101,068)Net increase (decrease) (8,800) ($104,747) 6,137 $70,629Total net increase 3,533 $57,698 78,736 $1,165,122
Blue Chip Growth Trust Six months ended 6/30/17 Year ended 12/31/16Shares Amount Shares Amount
Series I sharesSold 88,737 $2,648,403 76,529 $2,226,202Distributions reinvested — — 1,670,758 45,294,263Repurchased (739,628) (22,584,676) (1,486,922) (43,403,172)Net increase (decrease) (650,891) ($19,936,273) 260,365 $4,117,293Series II sharesSold 80,856 $2,373,617 129,042 $3,806,586Distributions reinvested — — 737,713 19,601,019Repurchased (371,668) (11,169,189) (850,905) (24,552,521)Net increase (decrease) (290,812) ($8,795,572) 15,850 ($1,144,916)Series NAV sharesSold 113,741 $3,389,841 1,753,670 $49,428,094Distributions reinvested — — 7,070,249 191,674,469Repurchased (4,366,963) (134,605,298) (4,606,701) (135,462,829)Net increase (decrease) (4,253,222) ($131,215,457) 4,217,218 $105,639,734Total net increase (decrease) (5,194,925) ($159,947,302) 4,493,433 $108,612,111
PORTFOLIO SHARE TRANSACTIONS, CONTINUED
133
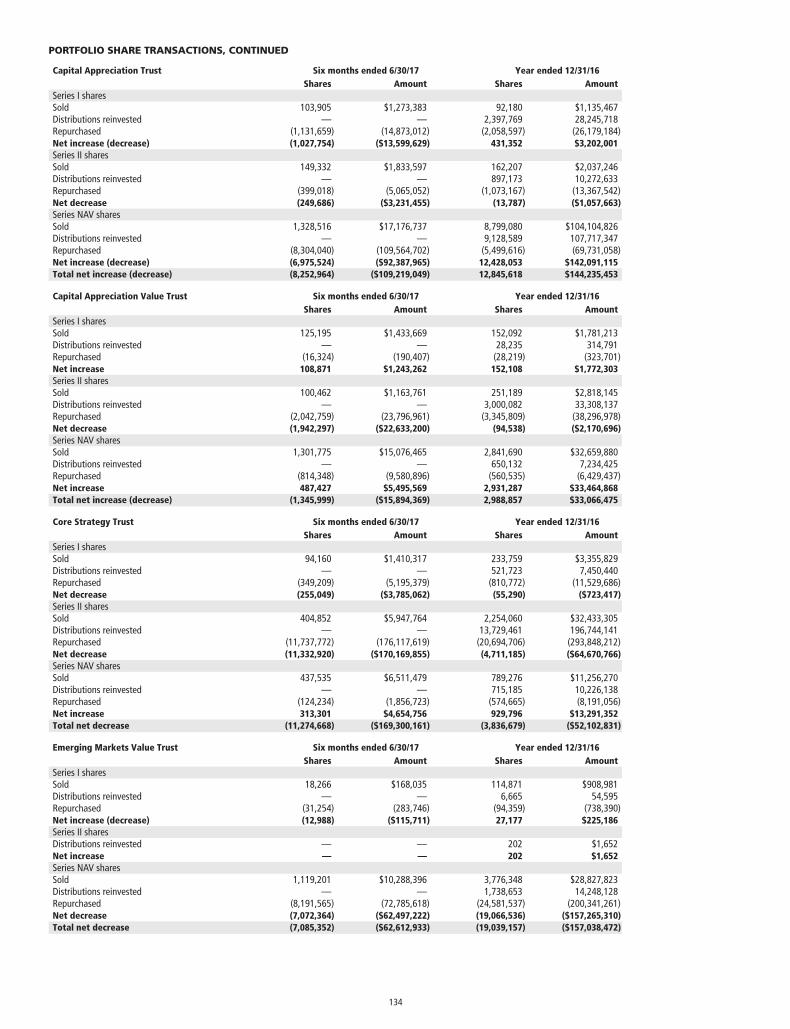
Capital Appreciation Trust Six months ended 6/30/17 Year ended 12/31/16Shares Amount Shares Amount
Series I sharesSold 103,905 $1,273,383 92,180 $1,135,467Distributions reinvested — — 2,397,769 28,245,718Repurchased (1,131,659) (14,873,012) (2,058,597) (26,179,184)Net increase (decrease) (1,027,754) ($13,599,629) 431,352 $3,202,001Series II sharesSold 149,332 $1,833,597 162,207 $2,037,246Distributions reinvested — — 897,173 10,272,633Repurchased (399,018) (5,065,052) (1,073,167) (13,367,542)Net decrease (249,686) ($3,231,455) (13,787) ($1,057,663)Series NAV sharesSold 1,328,516 $17,176,737 8,799,080 $104,104,826Distributions reinvested — — 9,128,589 107,717,347Repurchased (8,304,040) (109,564,702) (5,499,616) (69,731,058)Net increase (decrease) (6,975,524) ($92,387,965) 12,428,053 $142,091,115Total net increase (decrease) (8,252,964) ($109,219,049) 12,845,618 $144,235,453
Capital Appreciation Value Trust Six months ended 6/30/17 Year ended 12/31/16Shares Amount Shares Amount
Series I sharesSold 125,195 $1,433,669 152,092 $1,781,213Distributions reinvested — — 28,235 314,791Repurchased (16,324) (190,407) (28,219) (323,701)Net increase 108,871 $1,243,262 152,108 $1,772,303Series II sharesSold 100,462 $1,163,761 251,189 $2,818,145Distributions reinvested — — 3,000,082 33,308,137Repurchased (2,042,759) (23,796,961) (3,345,809) (38,296,978)Net decrease (1,942,297) ($22,633,200) (94,538) ($2,170,696)Series NAV sharesSold 1,301,775 $15,076,465 2,841,690 $32,659,880Distributions reinvested — — 650,132 7,234,425Repurchased (814,348) (9,580,896) (560,535) (6,429,437)Net increase 487,427 $5,495,569 2,931,287 $33,464,868Total net increase (decrease) (1,345,999) ($15,894,369) 2,988,857 $33,066,475
Core Strategy Trust Six months ended 6/30/17 Year ended 12/31/16Shares Amount Shares Amount
Series I sharesSold 94,160 $1,410,317 233,759 $3,355,829Distributions reinvested — — 521,723 7,450,440Repurchased (349,209) (5,195,379) (810,772) (11,529,686)Net decrease (255,049) ($3,785,062) (55,290) ($723,417)Series II sharesSold 404,852 $5,947,764 2,254,060 $32,433,305Distributions reinvested — — 13,729,461 196,744,141Repurchased (11,737,772) (176,117,619) (20,694,706) (293,848,212)Net decrease (11,332,920) ($170,169,855) (4,711,185) ($64,670,766)Series NAV sharesSold 437,535 $6,511,479 789,276 $11,256,270Distributions reinvested — — 715,185 10,226,138Repurchased (124,234) (1,856,723) (574,665) (8,191,056)Net increase 313,301 $4,654,756 929,796 $13,291,352Total net decrease (11,274,668) ($169,300,161) (3,836,679) ($52,102,831)
Emerging Markets Value Trust Six months ended 6/30/17 Year ended 12/31/16Shares Amount Shares Amount
Series I sharesSold 18,266 $168,035 114,871 $908,981Distributions reinvested — — 6,665 54,595Repurchased (31,254) (283,746) (94,359) (738,390)Net increase (decrease) (12,988) ($115,711) 27,177 $225,186Series II sharesDistributions reinvested — — 202 $1,652Net increase — — 202 $1,652Series NAV sharesSold 1,119,201 $10,288,396 3,776,348 $28,827,823Distributions reinvested — — 1,738,653 14,248,128Repurchased (8,191,565) (72,785,618) (24,581,537) (200,341,261)Net decrease (7,072,364) ($62,497,222) (19,066,536) ($157,265,310)Total net decrease (7,085,352) ($62,612,933) (19,039,157) ($157,038,472)
PORTFOLIO SHARE TRANSACTIONS, CONTINUED
134
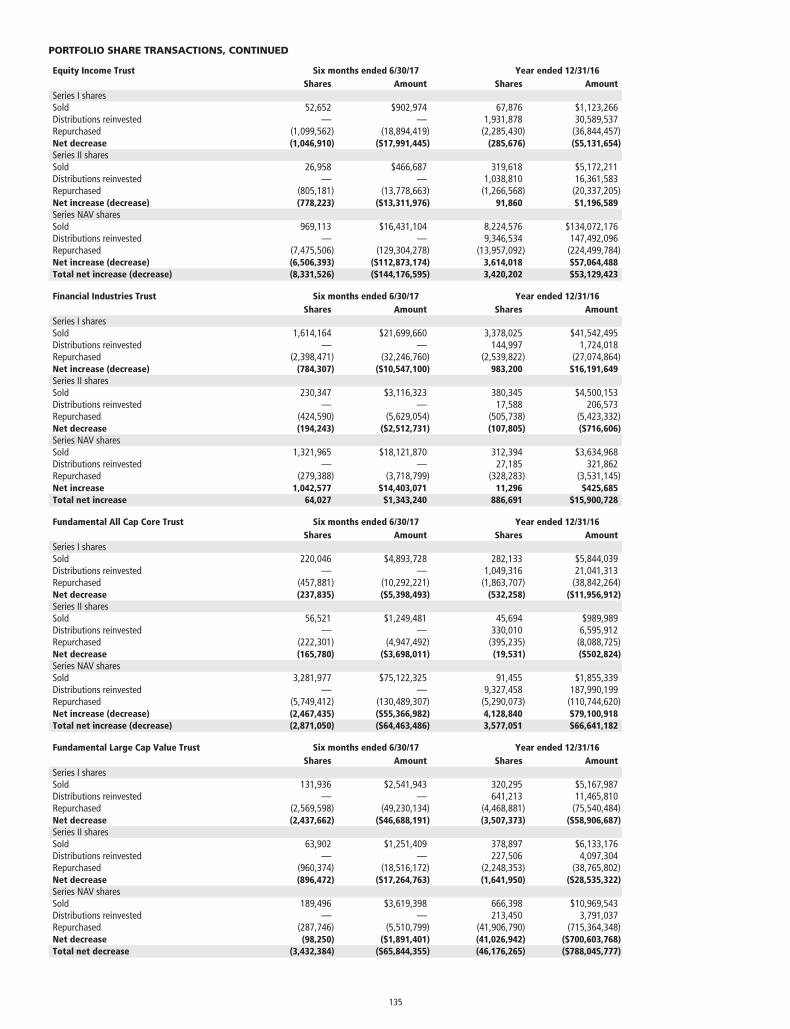
Equity Income Trust Six months ended 6/30/17 Year ended 12/31/16Shares Amount Shares Amount
Series I sharesSold 52,652 $902,974 67,876 $1,123,266Distributions reinvested — — 1,931,878 30,589,537Repurchased (1,099,562) (18,894,419) (2,285,430) (36,844,457)Net decrease (1,046,910) ($17,991,445) (285,676) ($5,131,654)Series II sharesSold 26,958 $466,687 319,618 $5,172,211Distributions reinvested — — 1,038,810 16,361,583Repurchased (805,181) (13,778,663) (1,266,568) (20,337,205)Net increase (decrease) (778,223) ($13,311,976) 91,860 $1,196,589Series NAV sharesSold 969,113 $16,431,104 8,224,576 $134,072,176Distributions reinvested — — 9,346,534 147,492,096Repurchased (7,475,506) (129,304,278) (13,957,092) (224,499,784)Net increase (decrease) (6,506,393) ($112,873,174) 3,614,018 $57,064,488Total net increase (decrease) (8,331,526) ($144,176,595) 3,420,202 $53,129,423
Financial Industries Trust Six months ended 6/30/17 Year ended 12/31/16Shares Amount Shares Amount
Series I sharesSold 1,614,164 $21,699,660 3,378,025 $41,542,495Distributions reinvested — — 144,997 1,724,018Repurchased (2,398,471) (32,246,760) (2,539,822) (27,074,864)Net increase (decrease) (784,307) ($10,547,100) 983,200 $16,191,649Series II sharesSold 230,347 $3,116,323 380,345 $4,500,153Distributions reinvested — — 17,588 206,573Repurchased (424,590) (5,629,054) (505,738) (5,423,332)Net decrease (194,243) ($2,512,731) (107,805) ($716,606)Series NAV sharesSold 1,321,965 $18,121,870 312,394 $3,634,968Distributions reinvested — — 27,185 321,862Repurchased (279,388) (3,718,799) (328,283) (3,531,145)Net increase 1,042,577 $14,403,071 11,296 $425,685Total net increase 64,027 $1,343,240 886,691 $15,900,728
Fundamental All Cap Core Trust Six months ended 6/30/17 Year ended 12/31/16Shares Amount Shares Amount
Series I sharesSold 220,046 $4,893,728 282,133 $5,844,039Distributions reinvested — — 1,049,316 21,041,313Repurchased (457,881) (10,292,221) (1,863,707) (38,842,264)Net decrease (237,835) ($5,398,493) (532,258) ($11,956,912)Series II sharesSold 56,521 $1,249,481 45,694 $989,989Distributions reinvested — — 330,010 6,595,912Repurchased (222,301) (4,947,492) (395,235) (8,088,725)Net decrease (165,780) ($3,698,011) (19,531) ($502,824)Series NAV sharesSold 3,281,977 $75,122,325 91,455 $1,855,339Distributions reinvested — — 9,327,458 187,990,199Repurchased (5,749,412) (130,489,307) (5,290,073) (110,744,620)Net increase (decrease) (2,467,435) ($55,366,982) 4,128,840 $79,100,918Total net increase (decrease) (2,871,050) ($64,463,486) 3,577,051 $66,641,182
Fundamental Large Cap Value Trust Six months ended 6/30/17 Year ended 12/31/16Shares Amount Shares Amount
Series I sharesSold 131,936 $2,541,943 320,295 $5,167,987Distributions reinvested — — 641,213 11,465,810Repurchased (2,569,598) (49,230,134) (4,468,881) (75,540,484)Net decrease (2,437,662) ($46,688,191) (3,507,373) ($58,906,687)Series II sharesSold 63,902 $1,251,409 378,897 $6,133,176Distributions reinvested — — 227,506 4,097,304Repurchased (960,374) (18,516,172) (2,248,353) (38,765,802)Net decrease (896,472) ($17,264,763) (1,641,950) ($28,535,322)Series NAV sharesSold 189,496 $3,619,398 666,398 $10,969,543Distributions reinvested — — 213,450 3,791,037Repurchased (287,746) (5,510,799) (41,906,790) (715,364,348)Net decrease (98,250) ($1,891,401) (41,026,942) ($700,603,768)Total net decrease (3,432,384) ($65,844,355) (46,176,265) ($788,045,777)
PORTFOLIO SHARE TRANSACTIONS, CONTINUED
135
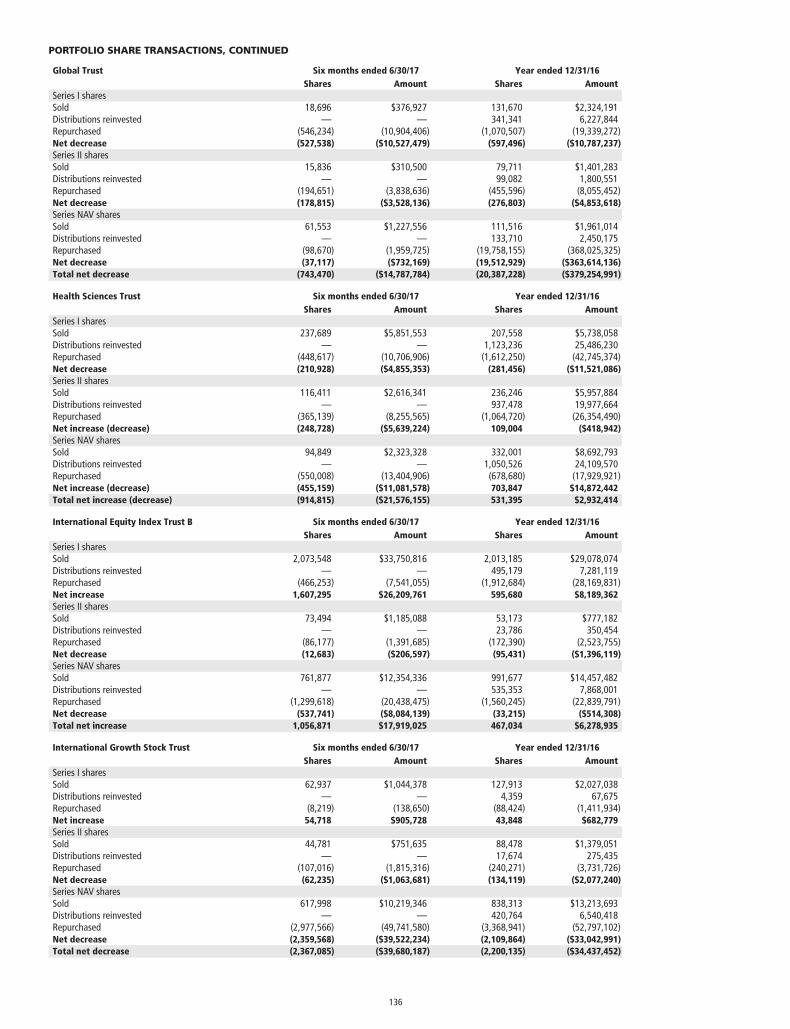
Global Trust Six months ended 6/30/17 Year ended 12/31/16Shares Amount Shares Amount
Series I sharesSold 18,696 $376,927 131,670 $2,324,191Distributions reinvested — — 341,341 6,227,844Repurchased (546,234) (10,904,406) (1,070,507) (19,339,272)Net decrease (527,538) ($10,527,479) (597,496) ($10,787,237)Series II sharesSold 15,836 $310,500 79,711 $1,401,283Distributions reinvested — — 99,082 1,800,551Repurchased (194,651) (3,838,636) (455,596) (8,055,452)Net decrease (178,815) ($3,528,136) (276,803) ($4,853,618)Series NAV sharesSold 61,553 $1,227,556 111,516 $1,961,014Distributions reinvested — — 133,710 2,450,175Repurchased (98,670) (1,959,725) (19,758,155) (368,025,325)Net decrease (37,117) ($732,169) (19,512,929) ($363,614,136)Total net decrease (743,470) ($14,787,784) (20,387,228) ($379,254,991)
Health Sciences Trust Six months ended 6/30/17 Year ended 12/31/16Shares Amount Shares Amount
Series I sharesSold 237,689 $5,851,553 207,558 $5,738,058Distributions reinvested — — 1,123,236 25,486,230Repurchased (448,617) (10,706,906) (1,612,250) (42,745,374)Net decrease (210,928) ($4,855,353) (281,456) ($11,521,086)Series II sharesSold 116,411 $2,616,341 236,246 $5,957,884Distributions reinvested — — 937,478 19,977,664Repurchased (365,139) (8,255,565) (1,064,720) (26,354,490)Net increase (decrease) (248,728) ($5,639,224) 109,004 ($418,942)Series NAV sharesSold 94,849 $2,323,328 332,001 $8,692,793Distributions reinvested — — 1,050,526 24,109,570Repurchased (550,008) (13,404,906) (678,680) (17,929,921)Net increase (decrease) (455,159) ($11,081,578) 703,847 $14,872,442Total net increase (decrease) (914,815) ($21,576,155) 531,395 $2,932,414
International Equity Index Trust B Six months ended 6/30/17 Year ended 12/31/16Shares Amount Shares Amount
Series I sharesSold 2,073,548 $33,750,816 2,013,185 $29,078,074Distributions reinvested — — 495,179 7,281,119Repurchased (466,253) (7,541,055) (1,912,684) (28,169,831)Net increase 1,607,295 $26,209,761 595,680 $8,189,362Series II sharesSold 73,494 $1,185,088 53,173 $777,182Distributions reinvested — — 23,786 350,454Repurchased (86,177) (1,391,685) (172,390) (2,523,755)Net decrease (12,683) ($206,597) (95,431) ($1,396,119)Series NAV sharesSold 761,877 $12,354,336 991,677 $14,457,482Distributions reinvested — — 535,353 7,868,001Repurchased (1,299,618) (20,438,475) (1,560,245) (22,839,791)Net decrease (537,741) ($8,084,139) (33,215) ($514,308)Total net increase 1,056,871 $17,919,025 467,034 $6,278,935
International Growth Stock Trust Six months ended 6/30/17 Year ended 12/31/16Shares Amount Shares Amount
Series I sharesSold 62,937 $1,044,378 127,913 $2,027,038Distributions reinvested — — 4,359 67,675Repurchased (8,219) (138,650) (88,424) (1,411,934)Net increase 54,718 $905,728 43,848 $682,779Series II sharesSold 44,781 $751,635 88,478 $1,379,051Distributions reinvested — — 17,674 275,435Repurchased (107,016) (1,815,316) (240,271) (3,731,726)Net decrease (62,235) ($1,063,681) (134,119) ($2,077,240)Series NAV sharesSold 617,998 $10,219,346 838,313 $13,213,693Distributions reinvested — — 420,764 6,540,418Repurchased (2,977,566) (49,741,580) (3,368,941) (52,797,102)Net decrease (2,359,568) ($39,522,234) (2,109,864) ($33,042,991)Total net decrease (2,367,085) ($39,680,187) (2,200,135) ($34,437,452)
PORTFOLIO SHARE TRANSACTIONS, CONTINUED
136
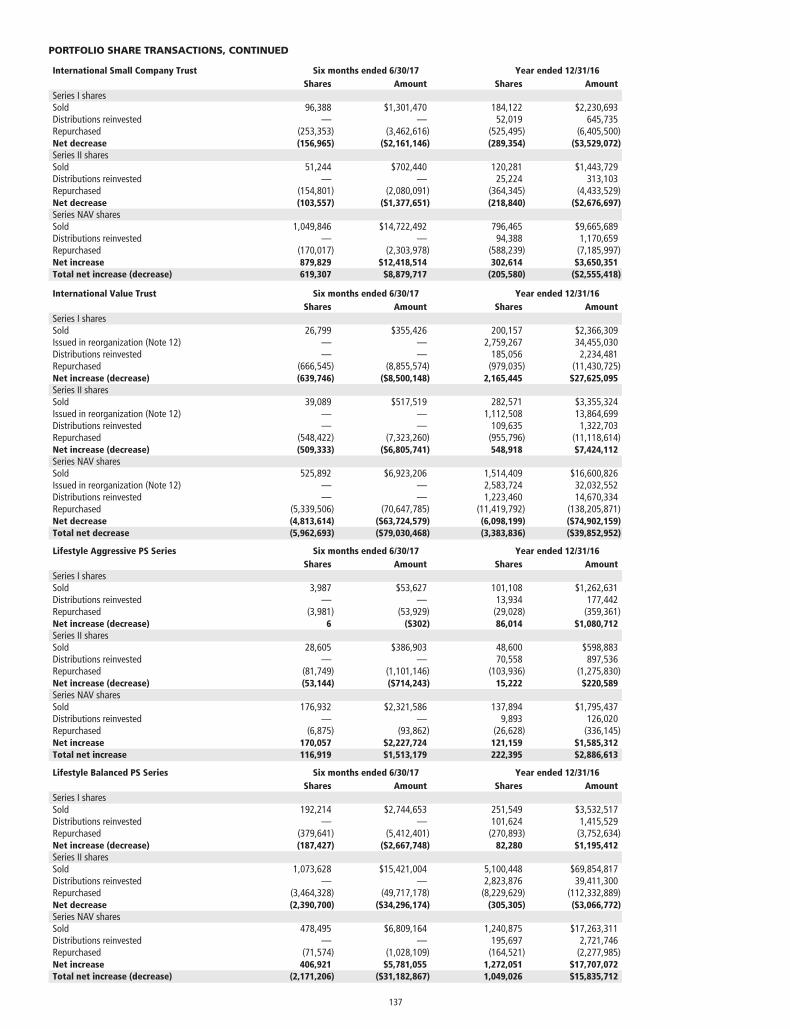
International Small Company Trust Six months ended 6/30/17 Year ended 12/31/16Shares Amount Shares Amount
Series I sharesSold 96,388 $1,301,470 184,122 $2,230,693Distributions reinvested — — 52,019 645,735Repurchased (253,353) (3,462,616) (525,495) (6,405,500)Net decrease (156,965) ($2,161,146) (289,354) ($3,529,072)Series II sharesSold 51,244 $702,440 120,281 $1,443,729Distributions reinvested — — 25,224 313,103Repurchased (154,801) (2,080,091) (364,345) (4,433,529)Net decrease (103,557) ($1,377,651) (218,840) ($2,676,697)Series NAV sharesSold 1,049,846 $14,722,492 796,465 $9,665,689Distributions reinvested — — 94,388 1,170,659Repurchased (170,017) (2,303,978) (588,239) (7,185,997)Net increase 879,829 $12,418,514 302,614 $3,650,351Total net increase (decrease) 619,307 $8,879,717 (205,580) ($2,555,418)
International Value Trust Six months ended 6/30/17 Year ended 12/31/16Shares Amount Shares Amount
Series I sharesSold 26,799 $355,426 200,157 $2,366,309Issued in reorganization (Note 12) — — 2,759,267 34,455,030Distributions reinvested — — 185,056 2,234,481Repurchased (666,545) (8,855,574) (979,035) (11,430,725)Net increase (decrease) (639,746) ($8,500,148) 2,165,445 $27,625,095Series II sharesSold 39,089 $517,519 282,571 $3,355,324Issued in reorganization (Note 12) — — 1,112,508 13,864,699Distributions reinvested — — 109,635 1,322,703Repurchased (548,422) (7,323,260) (955,796) (11,118,614)Net increase (decrease) (509,333) ($6,805,741) 548,918 $7,424,112Series NAV sharesSold 525,892 $6,923,206 1,514,409 $16,600,826Issued in reorganization (Note 12) — — 2,583,724 32,032,552Distributions reinvested — — 1,223,460 14,670,334Repurchased (5,339,506) (70,647,785) (11,419,792) (138,205,871)Net decrease (4,813,614) ($63,724,579) (6,098,199) ($74,902,159)Total net decrease (5,962,693) ($79,030,468) (3,383,836) ($39,852,952)
Lifestyle Aggressive PS Series Six months ended 6/30/17 Year ended 12/31/16Shares Amount Shares Amount
Series I sharesSold 3,987 $53,627 101,108 $1,262,631Distributions reinvested — — 13,934 177,442Repurchased (3,981) (53,929) (29,028) (359,361)Net increase (decrease) 6 ($302) 86,014 $1,080,712Series II sharesSold 28,605 $386,903 48,600 $598,883Distributions reinvested — — 70,558 897,536Repurchased (81,749) (1,101,146) (103,936) (1,275,830)Net increase (decrease) (53,144) ($714,243) 15,222 $220,589Series NAV sharesSold 176,932 $2,321,586 137,894 $1,795,437Distributions reinvested — — 9,893 126,020Repurchased (6,875) (93,862) (26,628) (336,145)Net increase 170,057 $2,227,724 121,159 $1,585,312Total net increase 116,919 $1,513,179 222,395 $2,886,613
Lifestyle Balanced PS Series Six months ended 6/30/17 Year ended 12/31/16Shares Amount Shares Amount
Series I sharesSold 192,214 $2,744,653 251,549 $3,532,517Distributions reinvested — — 101,624 1,415,529Repurchased (379,641) (5,412,401) (270,893) (3,752,634)Net increase (decrease) (187,427) ($2,667,748) 82,280 $1,195,412Series II sharesSold 1,073,628 $15,421,004 5,100,448 $69,854,817Distributions reinvested — — 2,823,876 39,411,300Repurchased (3,464,328) (49,717,178) (8,229,629) (112,332,889)Net decrease (2,390,700) ($34,296,174) (305,305) ($3,066,772)Series NAV sharesSold 478,495 $6,809,164 1,240,875 $17,263,311Distributions reinvested — — 195,697 2,721,746Repurchased (71,574) (1,028,109) (164,521) (2,277,985)Net increase 406,921 $5,781,055 1,272,051 $17,707,072Total net increase (decrease) (2,171,206) ($31,182,867) 1,049,026 $15,835,712
PORTFOLIO SHARE TRANSACTIONS, CONTINUED
137
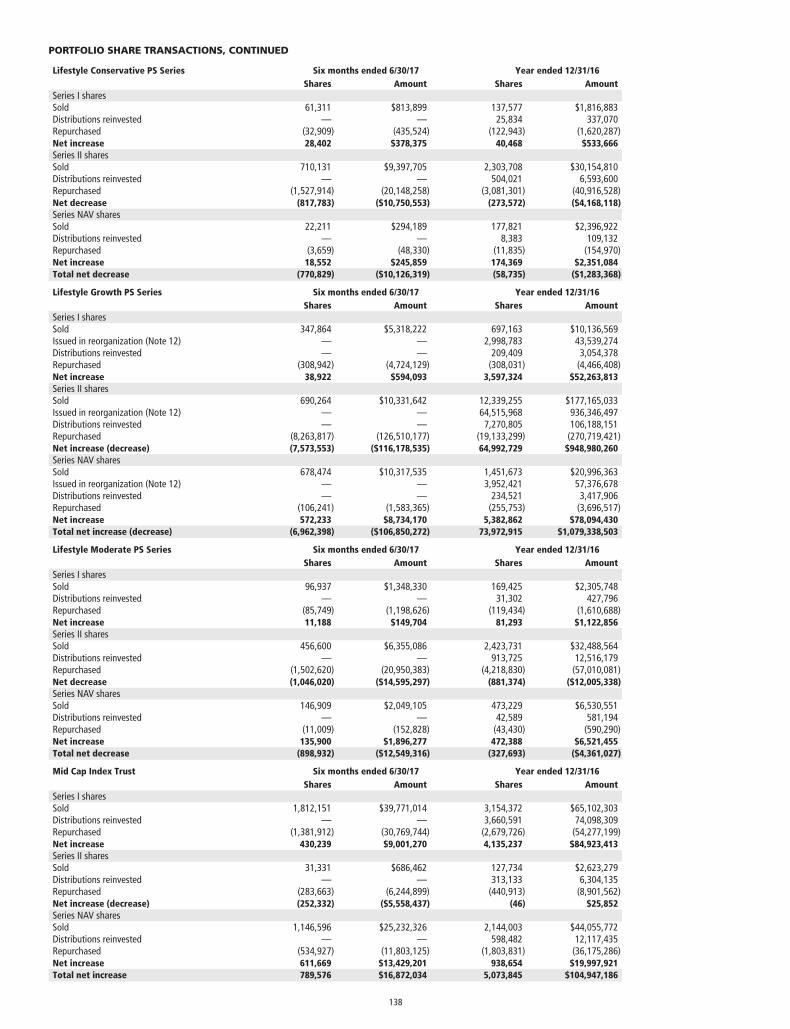
Lifestyle Conservative PS Series Six months ended 6/30/17 Year ended 12/31/16Shares Amount Shares Amount
Series I sharesSold 61,311 $813,899 137,577 $1,816,883Distributions reinvested — — 25,834 337,070Repurchased (32,909) (435,524) (122,943) (1,620,287)Net increase 28,402 $378,375 40,468 $533,666Series II sharesSold 710,131 $9,397,705 2,303,708 $30,154,810Distributions reinvested — — 504,021 6,593,600Repurchased (1,527,914) (20,148,258) (3,081,301) (40,916,528)Net decrease (817,783) ($10,750,553) (273,572) ($4,168,118)Series NAV sharesSold 22,211 $294,189 177,821 $2,396,922Distributions reinvested — — 8,383 109,132Repurchased (3,659) (48,330) (11,835) (154,970)Net increase 18,552 $245,859 174,369 $2,351,084Total net decrease (770,829) ($10,126,319) (58,735) ($1,283,368)
Lifestyle Growth PS Series Six months ended 6/30/17 Year ended 12/31/16Shares Amount Shares Amount
Series I sharesSold 347,864 $5,318,222 697,163 $10,136,569Issued in reorganization (Note 12) — — 2,998,783 43,539,274Distributions reinvested — — 209,409 3,054,378Repurchased (308,942) (4,724,129) (308,031) (4,466,408)Net increase 38,922 $594,093 3,597,324 $52,263,813Series II sharesSold 690,264 $10,331,642 12,339,255 $177,165,033Issued in reorganization (Note 12) — — 64,515,968 936,346,497Distributions reinvested — — 7,270,805 106,188,151Repurchased (8,263,817) (126,510,177) (19,133,299) (270,719,421)Net increase (decrease) (7,573,553) ($116,178,535) 64,992,729 $948,980,260Series NAV sharesSold 678,474 $10,317,535 1,451,673 $20,996,363Issued in reorganization (Note 12) — — 3,952,421 57,376,678Distributions reinvested — — 234,521 3,417,906Repurchased (106,241) (1,583,365) (255,753) (3,696,517)Net increase 572,233 $8,734,170 5,382,862 $78,094,430Total net increase (decrease) (6,962,398) ($106,850,272) 73,972,915 $1,079,338,503
Lifestyle Moderate PS Series Six months ended 6/30/17 Year ended 12/31/16Shares Amount Shares Amount
Series I sharesSold 96,937 $1,348,330 169,425 $2,305,748Distributions reinvested — — 31,302 427,796Repurchased (85,749) (1,198,626) (119,434) (1,610,688)Net increase 11,188 $149,704 81,293 $1,122,856Series II sharesSold 456,600 $6,355,086 2,423,731 $32,488,564Distributions reinvested — — 913,725 12,516,179Repurchased (1,502,620) (20,950,383) (4,218,830) (57,010,081)Net decrease (1,046,020) ($14,595,297) (881,374) ($12,005,338)Series NAV sharesSold 146,909 $2,049,105 473,229 $6,530,551Distributions reinvested — — 42,589 581,194Repurchased (11,009) (152,828) (43,430) (590,290)Net increase 135,900 $1,896,277 472,388 $6,521,455Total net decrease (898,932) ($12,549,316) (327,693) ($4,361,027)
Mid Cap Index Trust Six months ended 6/30/17 Year ended 12/31/16Shares Amount Shares Amount
Series I sharesSold 1,812,151 $39,771,014 3,154,372 $65,102,303Distributions reinvested — — 3,660,591 74,098,309Repurchased (1,381,912) (30,769,744) (2,679,726) (54,277,199)Net increase 430,239 $9,001,270 4,135,237 $84,923,413Series II sharesSold 31,331 $686,462 127,734 $2,623,279Distributions reinvested — — 313,133 6,304,135Repurchased (283,663) (6,244,899) (440,913) (8,901,562)Net increase (decrease) (252,332) ($5,558,437) (46) $25,852Series NAV sharesSold 1,146,596 $25,232,326 2,144,003 $44,055,772Distributions reinvested — — 598,482 12,117,435Repurchased (534,927) (11,803,125) (1,803,831) (36,175,286)Net increase 611,669 $13,429,201 938,654 $19,997,921Total net increase 789,576 $16,872,034 5,073,845 $104,947,186
PORTFOLIO SHARE TRANSACTIONS, CONTINUED
138
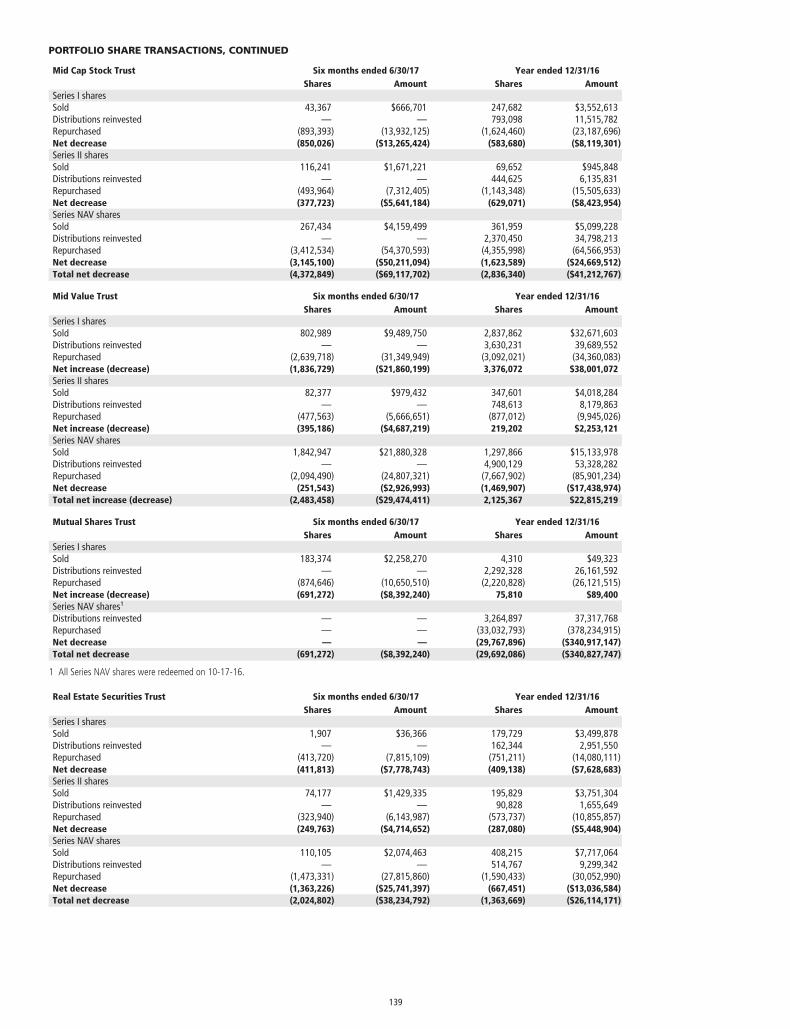
Mid Cap Stock Trust Six months ended 6/30/17 Year ended 12/31/16Shares Amount Shares Amount
Series I sharesSold 43,367 $666,701 247,682 $3,552,613Distributions reinvested — — 793,098 11,515,782Repurchased (893,393) (13,932,125) (1,624,460) (23,187,696)Net decrease (850,026) ($13,265,424) (583,680) ($8,119,301)Series II sharesSold 116,241 $1,671,221 69,652 $945,848Distributions reinvested — — 444,625 6,135,831Repurchased (493,964) (7,312,405) (1,143,348) (15,505,633)Net decrease (377,723) ($5,641,184) (629,071) ($8,423,954)Series NAV sharesSold 267,434 $4,159,499 361,959 $5,099,228Distributions reinvested — — 2,370,450 34,798,213Repurchased (3,412,534) (54,370,593) (4,355,998) (64,566,953)Net decrease (3,145,100) ($50,211,094) (1,623,589) ($24,669,512)Total net decrease (4,372,849) ($69,117,702) (2,836,340) ($41,212,767)
Mid Value Trust Six months ended 6/30/17 Year ended 12/31/16Shares Amount Shares Amount
Series I sharesSold 802,989 $9,489,750 2,837,862 $32,671,603Distributions reinvested — — 3,630,231 39,689,552Repurchased (2,639,718) (31,349,949) (3,092,021) (34,360,083)Net increase (decrease) (1,836,729) ($21,860,199) 3,376,072 $38,001,072Series II sharesSold 82,377 $979,432 347,601 $4,018,284Distributions reinvested — — 748,613 8,179,863Repurchased (477,563) (5,666,651) (877,012) (9,945,026)Net increase (decrease) (395,186) ($4,687,219) 219,202 $2,253,121Series NAV sharesSold 1,842,947 $21,880,328 1,297,866 $15,133,978Distributions reinvested — — 4,900,129 53,328,282Repurchased (2,094,490) (24,807,321) (7,667,902) (85,901,234)Net decrease (251,543) ($2,926,993) (1,469,907) ($17,438,974)Total net increase (decrease) (2,483,458) ($29,474,411) 2,125,367 $22,815,219
Mutual Shares Trust Six months ended 6/30/17 Year ended 12/31/16Shares Amount Shares Amount
Series I sharesSold 183,374 $2,258,270 4,310 $49,323Distributions reinvested — — 2,292,328 26,161,592Repurchased (874,646) (10,650,510) (2,220,828) (26,121,515)Net increase (decrease) (691,272) ($8,392,240) 75,810 $89,400Series NAV shares1
Distributions reinvested — — 3,264,897 37,317,768Repurchased — — (33,032,793) (378,234,915)Net decrease — — (29,767,896) ($340,917,147)Total net decrease (691,272) ($8,392,240) (29,692,086) ($340,827,747)
1 All Series NAV shares were redeemed on 10-17-16.
Real Estate Securities Trust Six months ended 6/30/17 Year ended 12/31/16Shares Amount Shares Amount
Series I sharesSold 1,907 $36,366 179,729 $3,499,878Distributions reinvested — — 162,344 2,951,550Repurchased (413,720) (7,815,109) (751,211) (14,080,111)Net decrease (411,813) ($7,778,743) (409,138) ($7,628,683)Series II sharesSold 74,177 $1,429,335 195,829 $3,751,304Distributions reinvested — — 90,828 1,655,649Repurchased (323,940) (6,143,987) (573,737) (10,855,857)Net decrease (249,763) ($4,714,652) (287,080) ($5,448,904)Series NAV sharesSold 110,105 $2,074,463 408,215 $7,717,064Distributions reinvested — — 514,767 9,299,342Repurchased (1,473,331) (27,815,860) (1,590,433) (30,052,990)Net decrease (1,363,226) ($25,741,397) (667,451) ($13,036,584)Total net decrease (2,024,802) ($38,234,792) (1,363,669) ($26,114,171)
PORTFOLIO SHARE TRANSACTIONS, CONTINUED
139
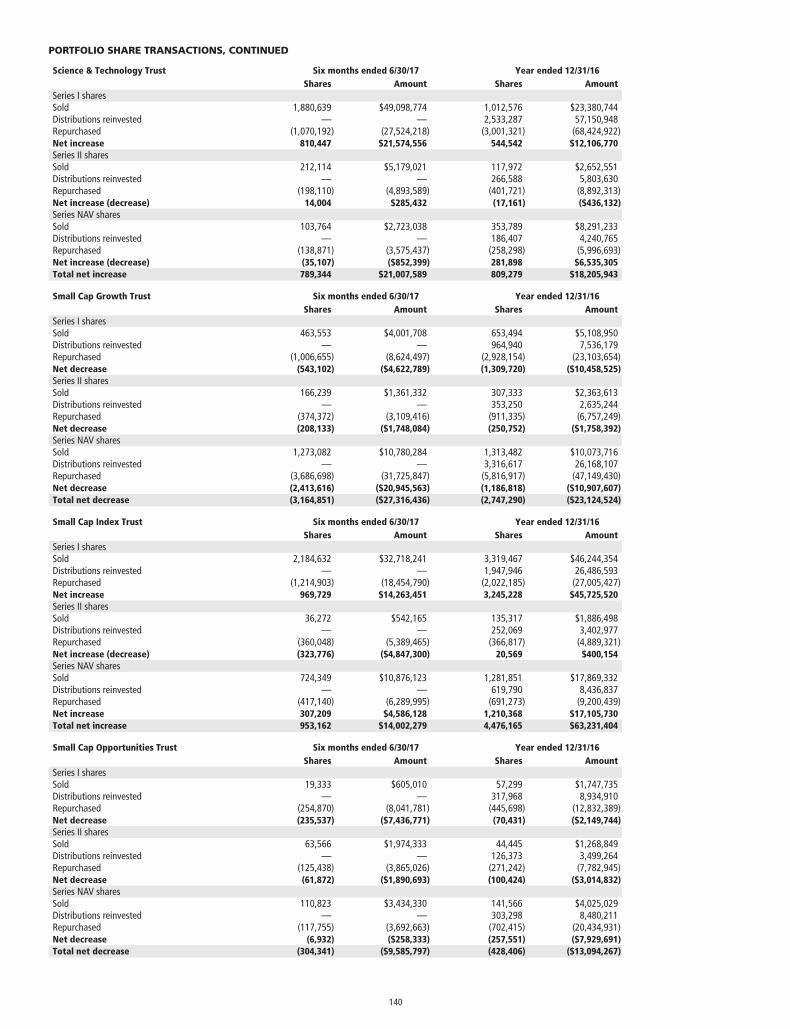
Science & Technology Trust Six months ended 6/30/17 Year ended 12/31/16Shares Amount Shares Amount
Series I sharesSold 1,880,639 $49,098,774 1,012,576 $23,380,744Distributions reinvested — — 2,533,287 57,150,948Repurchased (1,070,192) (27,524,218) (3,001,321) (68,424,922)Net increase 810,447 $21,574,556 544,542 $12,106,770Series II sharesSold 212,114 $5,179,021 117,972 $2,652,551Distributions reinvested — — 266,588 5,803,630Repurchased (198,110) (4,893,589) (401,721) (8,892,313)Net increase (decrease) 14,004 $285,432 (17,161) ($436,132)Series NAV sharesSold 103,764 $2,723,038 353,789 $8,291,233Distributions reinvested — — 186,407 4,240,765Repurchased (138,871) (3,575,437) (258,298) (5,996,693)Net increase (decrease) (35,107) ($852,399) 281,898 $6,535,305Total net increase 789,344 $21,007,589 809,279 $18,205,943
Small Cap Growth Trust Six months ended 6/30/17 Year ended 12/31/16Shares Amount Shares Amount
Series I sharesSold 463,553 $4,001,708 653,494 $5,108,950Distributions reinvested — — 964,940 7,536,179Repurchased (1,006,655) (8,624,497) (2,928,154) (23,103,654)Net decrease (543,102) ($4,622,789) (1,309,720) ($10,458,525)Series II sharesSold 166,239 $1,361,332 307,333 $2,363,613Distributions reinvested — — 353,250 2,635,244Repurchased (374,372) (3,109,416) (911,335) (6,757,249)Net decrease (208,133) ($1,748,084) (250,752) ($1,758,392)Series NAV sharesSold 1,273,082 $10,780,284 1,313,482 $10,073,716Distributions reinvested — — 3,316,617 26,168,107Repurchased (3,686,698) (31,725,847) (5,816,917) (47,149,430)Net decrease (2,413,616) ($20,945,563) (1,186,818) ($10,907,607)Total net decrease (3,164,851) ($27,316,436) (2,747,290) ($23,124,524)
Small Cap Index Trust Six months ended 6/30/17 Year ended 12/31/16Shares Amount Shares Amount
Series I sharesSold 2,184,632 $32,718,241 3,319,467 $46,244,354Distributions reinvested — — 1,947,946 26,486,593Repurchased (1,214,903) (18,454,790) (2,022,185) (27,005,427)Net increase 969,729 $14,263,451 3,245,228 $45,725,520Series II sharesSold 36,272 $542,165 135,317 $1,886,498Distributions reinvested — — 252,069 3,402,977Repurchased (360,048) (5,389,465) (366,817) (4,889,321)Net increase (decrease) (323,776) ($4,847,300) 20,569 $400,154Series NAV sharesSold 724,349 $10,876,123 1,281,851 $17,869,332Distributions reinvested — — 619,790 8,436,837Repurchased (417,140) (6,289,995) (691,273) (9,200,439)Net increase 307,209 $4,586,128 1,210,368 $17,105,730Total net increase 953,162 $14,002,279 4,476,165 $63,231,404
Small Cap Opportunities Trust Six months ended 6/30/17 Year ended 12/31/16Shares Amount Shares Amount
Series I sharesSold 19,333 $605,010 57,299 $1,747,735Distributions reinvested — — 317,968 8,934,910Repurchased (254,870) (8,041,781) (445,698) (12,832,389)Net decrease (235,537) ($7,436,771) (70,431) ($2,149,744)Series II sharesSold 63,566 $1,974,333 44,445 $1,268,849Distributions reinvested — — 126,373 3,499,264Repurchased (125,438) (3,865,026) (271,242) (7,782,945)Net decrease (61,872) ($1,890,693) (100,424) ($3,014,832)Series NAV sharesSold 110,823 $3,434,330 141,566 $4,025,029Distributions reinvested — — 303,298 8,480,211Repurchased (117,755) (3,692,663) (702,415) (20,434,931)Net decrease (6,932) ($258,333) (257,551) ($7,929,691)Total net decrease (304,341) ($9,585,797) (428,406) ($13,094,267)
PORTFOLIO SHARE TRANSACTIONS, CONTINUED
140
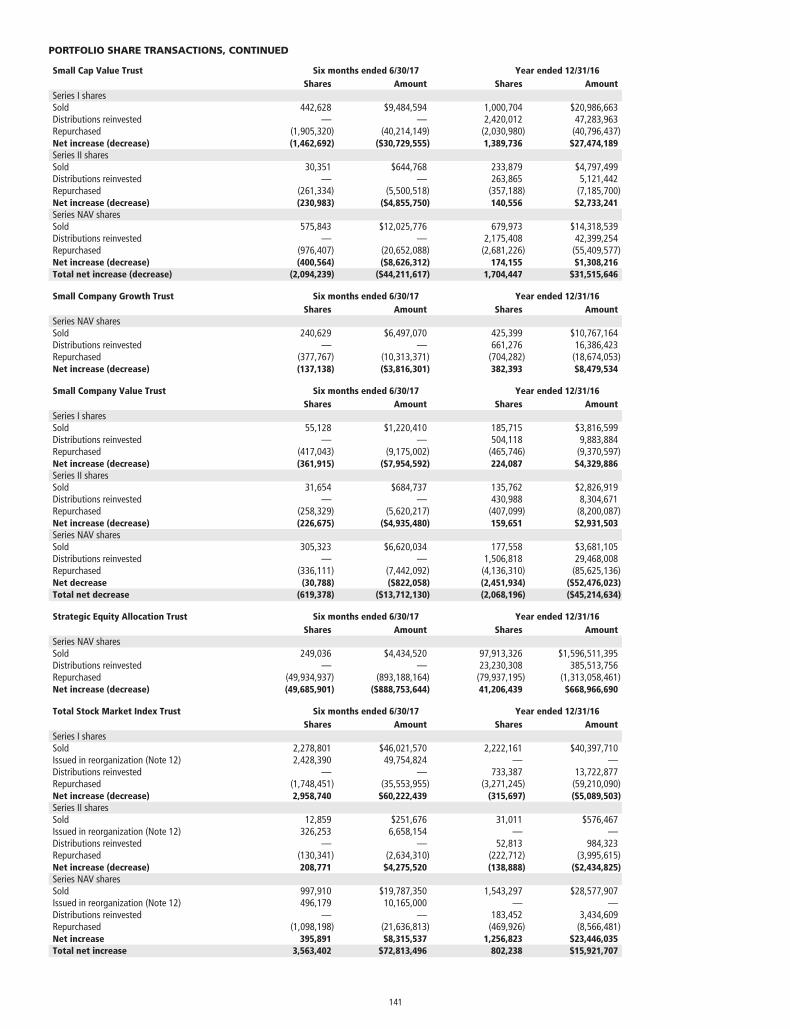
Small Cap Value Trust Six months ended 6/30/17 Year ended 12/31/16Shares Amount Shares Amount
Series I sharesSold 442,628 $9,484,594 1,000,704 $20,986,663Distributions reinvested — — 2,420,012 47,283,963Repurchased (1,905,320) (40,214,149) (2,030,980) (40,796,437)Net increase (decrease) (1,462,692) ($30,729,555) 1,389,736 $27,474,189Series II sharesSold 30,351 $644,768 233,879 $4,797,499Distributions reinvested — — 263,865 5,121,442Repurchased (261,334) (5,500,518) (357,188) (7,185,700)Net increase (decrease) (230,983) ($4,855,750) 140,556 $2,733,241Series NAV sharesSold 575,843 $12,025,776 679,973 $14,318,539Distributions reinvested — — 2,175,408 42,399,254Repurchased (976,407) (20,652,088) (2,681,226) (55,409,577)Net increase (decrease) (400,564) ($8,626,312) 174,155 $1,308,216Total net increase (decrease) (2,094,239) ($44,211,617) 1,704,447 $31,515,646
Small Company Growth Trust Six months ended 6/30/17 Year ended 12/31/16Shares Amount Shares Amount
Series NAV sharesSold 240,629 $6,497,070 425,399 $10,767,164Distributions reinvested — — 661,276 16,386,423Repurchased (377,767) (10,313,371) (704,282) (18,674,053)Net increase (decrease) (137,138) ($3,816,301) 382,393 $8,479,534
Small Company Value Trust Six months ended 6/30/17 Year ended 12/31/16Shares Amount Shares Amount
Series I sharesSold 55,128 $1,220,410 185,715 $3,816,599Distributions reinvested — — 504,118 9,883,884Repurchased (417,043) (9,175,002) (465,746) (9,370,597)Net increase (decrease) (361,915) ($7,954,592) 224,087 $4,329,886Series II sharesSold 31,654 $684,737 135,762 $2,826,919Distributions reinvested — — 430,988 8,304,671Repurchased (258,329) (5,620,217) (407,099) (8,200,087)Net increase (decrease) (226,675) ($4,935,480) 159,651 $2,931,503Series NAV sharesSold 305,323 $6,620,034 177,558 $3,681,105Distributions reinvested — — 1,506,818 29,468,008Repurchased (336,111) (7,442,092) (4,136,310) (85,625,136)Net decrease (30,788) ($822,058) (2,451,934) ($52,476,023)Total net decrease (619,378) ($13,712,130) (2,068,196) ($45,214,634)
Strategic Equity Allocation Trust Six months ended 6/30/17 Year ended 12/31/16Shares Amount Shares Amount
Series NAV sharesSold 249,036 $4,434,520 97,913,326 $1,596,511,395Distributions reinvested — — 23,230,308 385,513,756Repurchased (49,934,937) (893,188,164) (79,937,195) (1,313,058,461)Net increase (decrease) (49,685,901) ($888,753,644) 41,206,439 $668,966,690
Total Stock Market Index Trust Six months ended 6/30/17 Year ended 12/31/16Shares Amount Shares Amount
Series I sharesSold 2,278,801 $46,021,570 2,222,161 $40,397,710Issued in reorganization (Note 12) 2,428,390 49,754,824 — —Distributions reinvested — — 733,387 13,722,877Repurchased (1,748,451) (35,553,955) (3,271,245) (59,210,090)Net increase (decrease) 2,958,740 $60,222,439 (315,697) ($5,089,503)Series II sharesSold 12,859 $251,676 31,011 $576,467Issued in reorganization (Note 12) 326,253 6,658,154 — —Distributions reinvested — — 52,813 984,323Repurchased (130,341) (2,634,310) (222,712) (3,995,615)Net increase (decrease) 208,771 $4,275,520 (138,888) ($2,434,825)Series NAV sharesSold 997,910 $19,787,350 1,543,297 $28,577,907Issued in reorganization (Note 12) 496,179 10,165,000 — —Distributions reinvested — — 183,452 3,434,609Repurchased (1,098,198) (21,636,813) (469,926) (8,566,481)Net increase 395,891 $8,315,537 1,256,823 $23,446,035Total net increase 3,563,402 $72,813,496 802,238 $15,921,707
PORTFOLIO SHARE TRANSACTIONS, CONTINUED
141
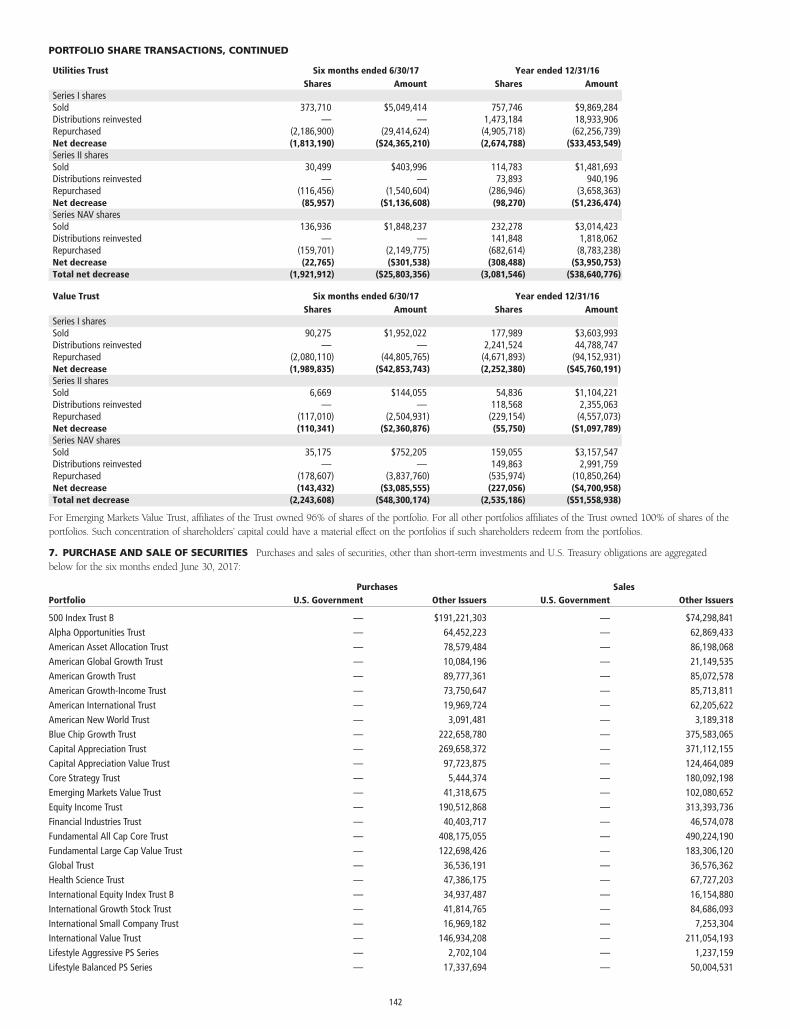
Utilities Trust Six months ended 6/30/17 Year ended 12/31/16Shares Amount Shares Amount
Series I sharesSold 373,710 $5,049,414 757,746 $9,869,284Distributions reinvested — — 1,473,184 18,933,906Repurchased (2,186,900) (29,414,624) (4,905,718) (62,256,739)Net decrease (1,813,190) ($24,365,210) (2,674,788) ($33,453,549)Series II sharesSold 30,499 $403,996 114,783 $1,481,693Distributions reinvested — — 73,893 940,196Repurchased (116,456) (1,540,604) (286,946) (3,658,363)Net decrease (85,957) ($1,136,608) (98,270) ($1,236,474)Series NAV sharesSold 136,936 $1,848,237 232,278 $3,014,423Distributions reinvested — — 141,848 1,818,062Repurchased (159,701) (2,149,775) (682,614) (8,783,238)Net decrease (22,765) ($301,538) (308,488) ($3,950,753)Total net decrease (1,921,912) ($25,803,356) (3,081,546) ($38,640,776)
Value Trust Six months ended 6/30/17 Year ended 12/31/16Shares Amount Shares Amount
Series I sharesSold 90,275 $1,952,022 177,989 $3,603,993Distributions reinvested — — 2,241,524 44,788,747Repurchased (2,080,110) (44,805,765) (4,671,893) (94,152,931)Net decrease (1,989,835) ($42,853,743) (2,252,380) ($45,760,191)Series II sharesSold 6,669 $144,055 54,836 $1,104,221Distributions reinvested — — 118,568 2,355,063Repurchased (117,010) (2,504,931) (229,154) (4,557,073)Net decrease (110,341) ($2,360,876) (55,750) ($1,097,789)Series NAV sharesSold 35,175 $752,205 159,055 $3,157,547Distributions reinvested — — 149,863 2,991,759Repurchased (178,607) (3,837,760) (535,974) (10,850,264)Net decrease (143,432) ($3,085,555) (227,056) ($4,700,958)Total net decrease (2,243,608) ($48,300,174) (2,535,186) ($51,558,938)
For Emerging Markets Value Trust, affiliates of the Trust owned 96% of shares of the portfolio. For all other portfolios affiliates of the Trust owned 100% of shares of theportfolios. Such concentration of shareholders’ capital could have a material effect on the portfolios if such shareholders redeem from the portfolios.
7. PURCHASE AND SALE OF SECURITIES Purchases and sales of securities, other than short-term investments and U.S. Treasury obligations are aggregatedbelow for the six months ended June 30, 2017:
Purchases SalesPortfolio U.S. Government Other Issuers U.S. Government Other Issuers
500 Index Trust B — $191,221,303 — $74,298,841Alpha Opportunities Trust — 64,452,223 — 62,869,433American Asset Allocation Trust — 78,579,484 — 86,198,068American Global Growth Trust — 10,084,196 — 21,149,535American Growth Trust — 89,777,361 — 85,072,578American Growth-Income Trust — 73,750,647 — 85,713,811American International Trust — 19,969,724 — 62,205,622American New World Trust — 3,091,481 — 3,189,318Blue Chip Growth Trust — 222,658,780 — 375,583,065Capital Appreciation Trust — 269,658,372 — 371,112,155Capital Appreciation Value Trust — 97,723,875 — 124,464,089Core Strategy Trust — 5,444,374 — 180,092,198Emerging Markets Value Trust — 41,318,675 — 102,080,652Equity Income Trust — 190,512,868 — 313,393,736Financial Industries Trust — 40,403,717 — 46,574,078Fundamental All Cap Core Trust — 408,175,055 — 490,224,190Fundamental Large Cap Value Trust — 122,698,426 — 183,306,120Global Trust — 36,536,191 — 36,576,362Health Science Trust — 47,386,175 — 67,727,203International Equity Index Trust B — 34,937,487 — 16,154,880International Growth Stock Trust — 41,814,765 — 84,686,093International Small Company Trust — 16,969,182 — 7,253,304International Value Trust — 146,934,208 — 211,054,193Lifestyle Aggressive PS Series — 2,702,104 — 1,237,159Lifestyle Balanced PS Series — 17,337,694 — 50,004,531
PORTFOLIO SHARE TRANSACTIONS, CONTINUED
142
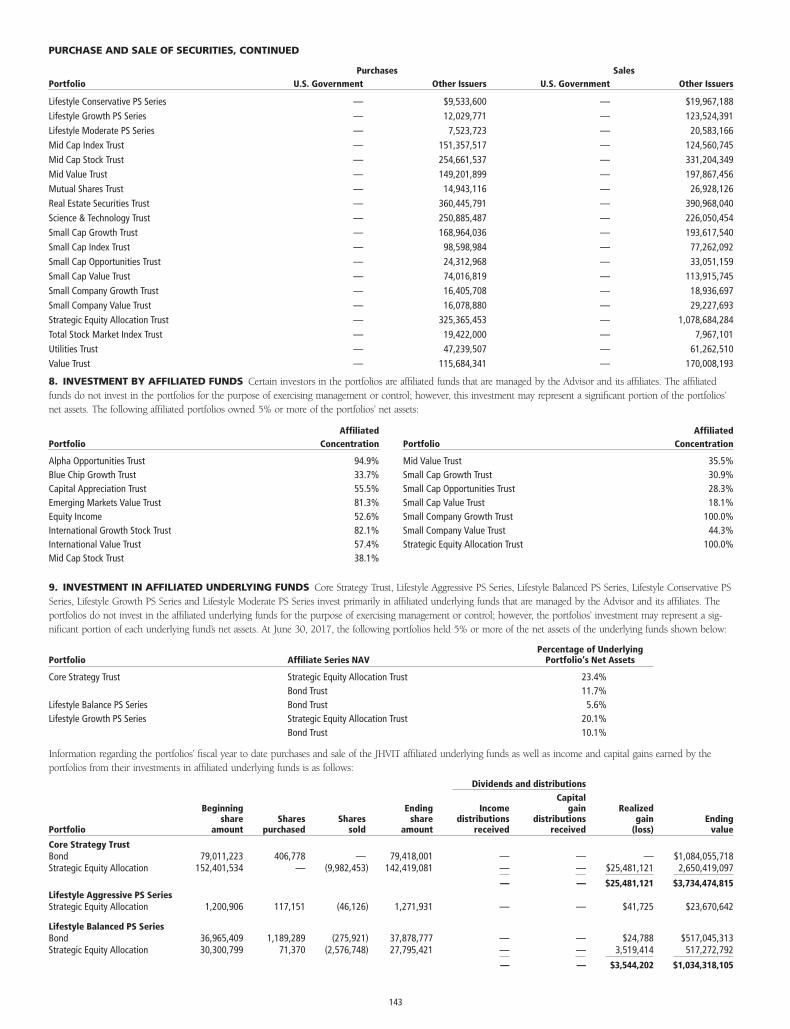
Purchases SalesPortfolio U.S. Government Other Issuers U.S. Government Other Issuers
Lifestyle Conservative PS Series — $9,533,600 — $19,967,188Lifestyle Growth PS Series — 12,029,771 — 123,524,391Lifestyle Moderate PS Series — 7,523,723 — 20,583,166Mid Cap Index Trust — 151,357,517 — 124,560,745Mid Cap Stock Trust — 254,661,537 — 331,204,349Mid Value Trust — 149,201,899 — 197,867,456Mutual Shares Trust — 14,943,116 — 26,928,126Real Estate Securities Trust — 360,445,791 — 390,968,040Science & Technology Trust — 250,885,487 — 226,050,454Small Cap Growth Trust — 168,964,036 — 193,617,540Small Cap Index Trust — 98,598,984 — 77,262,092Small Cap Opportunities Trust — 24,312,968 — 33,051,159Small Cap Value Trust — 74,016,819 — 113,915,745Small Company Growth Trust — 16,405,708 — 18,936,697Small Company Value Trust — 16,078,880 — 29,227,693Strategic Equity Allocation Trust — 325,365,453 — 1,078,684,284Total Stock Market Index Trust — 19,422,000 — 7,967,101Utilities Trust — 47,239,507 — 61,262,510Value Trust — 115,684,341 — 170,008,193
8. INVESTMENT BY AFFILIATED FUNDS Certain investors in the portfolios are affiliated funds that are managed by the Advisor and its affiliates. The affiliatedfunds do not invest in the portfolios for the purpose of exercising management or control; however, this investment may represent a significant portion of the portfolios’net assets. The following affiliated portfolios owned 5% or more of the portfolios’ net assets:
PortfolioAffiliated
Concentration
Alpha Opportunities Trust 94.9%Blue Chip Growth Trust 33.7%Capital Appreciation Trust 55.5%Emerging Markets Value Trust 81.3%Equity Income 52.6%International Growth Stock Trust 82.1%International Value Trust 57.4%Mid Cap Stock Trust 38.1%
PortfolioAffiliated
Concentration
Mid Value Trust 35.5%Small Cap Growth Trust 30.9%Small Cap Opportunities Trust 28.3%Small Cap Value Trust 18.1%Small Company Growth Trust 100.0%Small Company Value Trust 44.3%Strategic Equity Allocation Trust 100.0%
9. INVESTMENT IN AFFILIATED UNDERLYING FUNDS Core Strategy Trust, Lifestyle Aggressive PS Series, Lifestyle Balanced PS Series, Lifestyle Conservative PSSeries, Lifestyle Growth PS Series and Lifestyle Moderate PS Series invest primarily in affiliated underlying funds that are managed by the Advisor and its affiliates. Theportfolios do not invest in the affiliated underlying funds for the purpose of exercising management or control; however, the portfolios’ investment may represent a sig-nificant portion of each underlying fund’s net assets. At June 30, 2017, the following portfolios held 5% or more of the net assets of the underlying funds shown below:
Portfolio Affiliate Series NAVPercentage of Underlying
Portfolio’s Net Assets
Core Strategy Trust Strategic Equity Allocation Trust 23.4%Bond Trust 11.7%
Lifestyle Balance PS Series Bond Trust 5.6%Lifestyle Growth PS Series Strategic Equity Allocation Trust 20.1%
Bond Trust 10.1%
Information regarding the portfolios’ fiscal year to date purchases and sale of the JHVIT affiliated underlying funds as well as income and capital gains earned by theportfolios from their investments in affiliated underlying funds is as follows:
Dividends and distributions
Portfolio
Beginningshare
amountShares
purchasedShares
sold
Endingshare
amount
Incomedistributions
received
Capitalgain
distributionsreceived
Realizedgain
(loss)Ending
value
Core Strategy TrustBond 79,011,223 406,778 — 79,418,001 — — — $1,084,055,718Strategic Equity Allocation 152,401,534 — (9,982,453) 142,419,081 — — $25,481,121 2,650,419,097
— — $25,481,121 $3,734,474,815Lifestyle Aggressive PS SeriesStrategic Equity Allocation 1,200,906 117,151 (46,126) 1,271,931 — — $41,725 $23,670,642
Lifestyle Balanced PS SeriesBond 36,965,409 1,189,289 (275,921) 37,878,777 — — $24,788 $517,045,313Strategic Equity Allocation 30,300,799 71,370 (2,576,748) 27,795,421 — — 3,519,414 517,272,792
— — $3,544,202 $1,034,318,105
PURCHASE AND SALE OF SECURITIES, CONTINUED
143
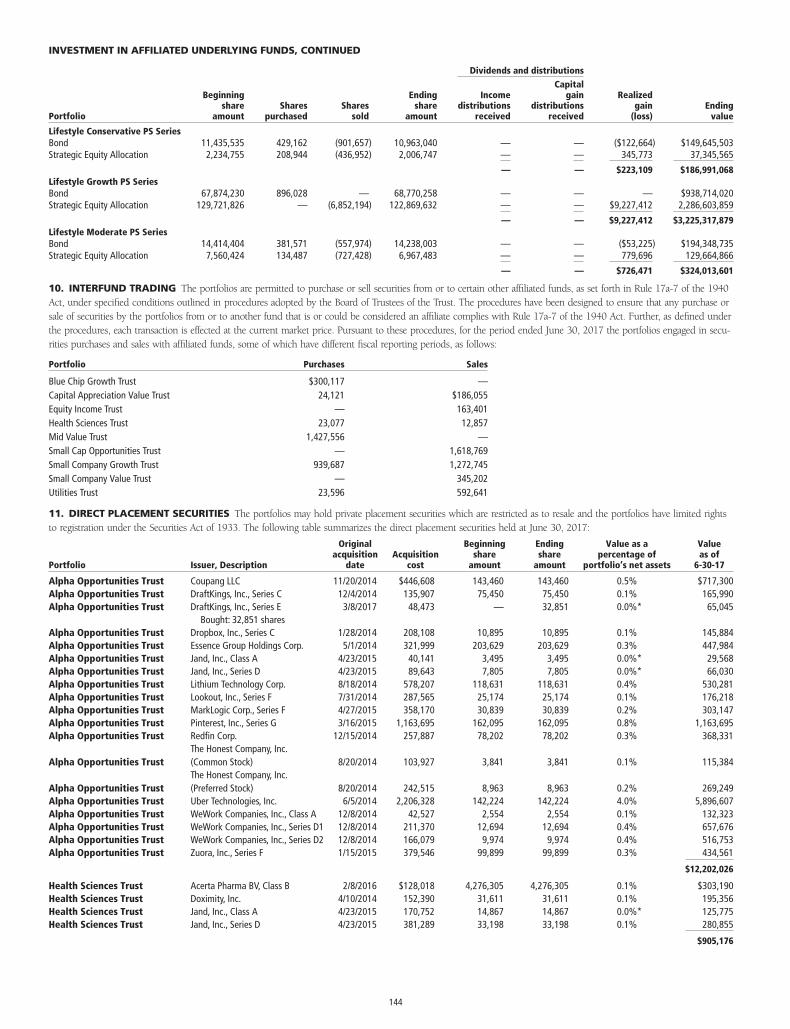
Dividends and distributions
Portfolio
Beginningshare
amountShares
purchasedShares
sold
Endingshare
amount
Incomedistributions
received
Capitalgain
distributionsreceived
Realizedgain
(loss)Ending
value
Lifestyle Conservative PS SeriesBond 11,435,535 429,162 (901,657) 10,963,040 — — ($122,664) $149,645,503Strategic Equity Allocation 2,234,755 208,944 (436,952) 2,006,747 — — 345,773 37,345,565
— — $223,109 $186,991,068Lifestyle Growth PS SeriesBond 67,874,230 896,028 — 68,770,258 — — — $938,714,020Strategic Equity Allocation 129,721,826 — (6,852,194) 122,869,632 — — $9,227,412 2,286,603,859
— — $9,227,412 $3,225,317,879Lifestyle Moderate PS SeriesBond 14,414,404 381,571 (557,974) 14,238,003 — — ($53,225) $194,348,735Strategic Equity Allocation 7,560,424 134,487 (727,428) 6,967,483 — — 779,696 129,664,866
— — $726,471 $324,013,601
10. INTERFUND TRADING The portfolios are permitted to purchase or sell securities from or to certain other affiliated funds, as set forth in Rule 17a-7 of the 1940Act, under specified conditions outlined in procedures adopted by the Board of Trustees of the Trust. The procedures have been designed to ensure that any purchase orsale of securities by the portfolios from or to another fund that is or could be considered an affiliate complies with Rule 17a-7 of the 1940 Act. Further, as defined underthe procedures, each transaction is effected at the current market price. Pursuant to these procedures, for the period ended June 30, 2017 the portfolios engaged in secu-rities purchases and sales with affiliated funds, some of which have different fiscal reporting periods, as follows:
Portfolio Purchases Sales
Blue Chip Growth Trust $300,117 —Capital Appreciation Value Trust 24,121 $186,055Equity Income Trust — 163,401Health Sciences Trust 23,077 12,857Mid Value Trust 1,427,556 —Small Cap Opportunities Trust — 1,618,769Small Company Growth Trust 939,687 1,272,745Small Company Value Trust — 345,202Utilities Trust 23,596 592,641
11. DIRECT PLACEMENT SECURITIES The portfolios may hold private placement securities which are restricted as to resale and the portfolios have limited rightsto registration under the Securities Act of 1933. The following table summarizes the direct placement securities held at June 30, 2017:
Portfolio Issuer, Description
Originalacquisition
dateAcquisition
cost
Beginningshare
amount
Endingshare
amount
Value as apercentage of
portfolio’s net assets
Valueas of
6-30-17
Alpha Opportunities Trust Coupang LLC 11/20/2014 $446,608 143,460 143,460 0.5% $717,300Alpha Opportunities Trust DraftKings, Inc., Series C 12/4/2014 135,907 75,450 75,450 0.1% 165,990Alpha Opportunities Trust DraftKings, Inc., Series E 3/8/2017 48,473 — 32,851 0.0%* 65,045
Bought: 32,851 sharesAlpha Opportunities Trust Dropbox, Inc., Series C 1/28/2014 208,108 10,895 10,895 0.1% 145,884Alpha Opportunities Trust Essence Group Holdings Corp. 5/1/2014 321,999 203,629 203,629 0.3% 447,984Alpha Opportunities Trust Jand, Inc., Class A 4/23/2015 40,141 3,495 3,495 0.0%* 29,568Alpha Opportunities Trust Jand, Inc., Series D 4/23/2015 89,643 7,805 7,805 0.0%* 66,030Alpha Opportunities Trust Lithium Technology Corp. 8/18/2014 578,207 118,631 118,631 0.4% 530,281Alpha Opportunities Trust Lookout, Inc., Series F 7/31/2014 287,565 25,174 25,174 0.1% 176,218Alpha Opportunities Trust MarkLogic Corp., Series F 4/27/2015 358,170 30,839 30,839 0.2% 303,147Alpha Opportunities Trust Pinterest, Inc., Series G 3/16/2015 1,163,695 162,095 162,095 0.8% 1,163,695Alpha Opportunities Trust Redfin Corp. 12/15/2014 257,887 78,202 78,202 0.3% 368,331
Alpha Opportunities TrustThe Honest Company, Inc.(Common Stock) 8/20/2014 103,927 3,841 3,841 0.1% 115,384
Alpha Opportunities TrustThe Honest Company, Inc.(Preferred Stock) 8/20/2014 242,515 8,963 8,963 0.2% 269,249
Alpha Opportunities Trust Uber Technologies, Inc. 6/5/2014 2,206,328 142,224 142,224 4.0% 5,896,607Alpha Opportunities Trust WeWork Companies, Inc., Class A 12/8/2014 42,527 2,554 2,554 0.1% 132,323Alpha Opportunities Trust WeWork Companies, Inc., Series D1 12/8/2014 211,370 12,694 12,694 0.4% 657,676Alpha Opportunities Trust WeWork Companies, Inc., Series D2 12/8/2014 166,079 9,974 9,974 0.4% 516,753Alpha Opportunities Trust Zuora, Inc., Series F 1/15/2015 379,546 99,899 99,899 0.3% 434,561
$12,202,026
Health Sciences Trust Acerta Pharma BV, Class B 2/8/2016 $128,018 4,276,305 4,276,305 0.1% $303,190Health Sciences Trust Doximity, Inc. 4/10/2014 152,390 31,611 31,611 0.1% 195,356Health Sciences Trust Jand, Inc., Class A 4/23/2015 170,752 14,867 14,867 0.0%* 125,775Health Sciences Trust Jand, Inc., Series D 4/23/2015 381,289 33,198 33,198 0.1% 280,855
$905,176
INVESTMENT IN AFFILIATED UNDERLYING FUNDS, CONTINUED
144
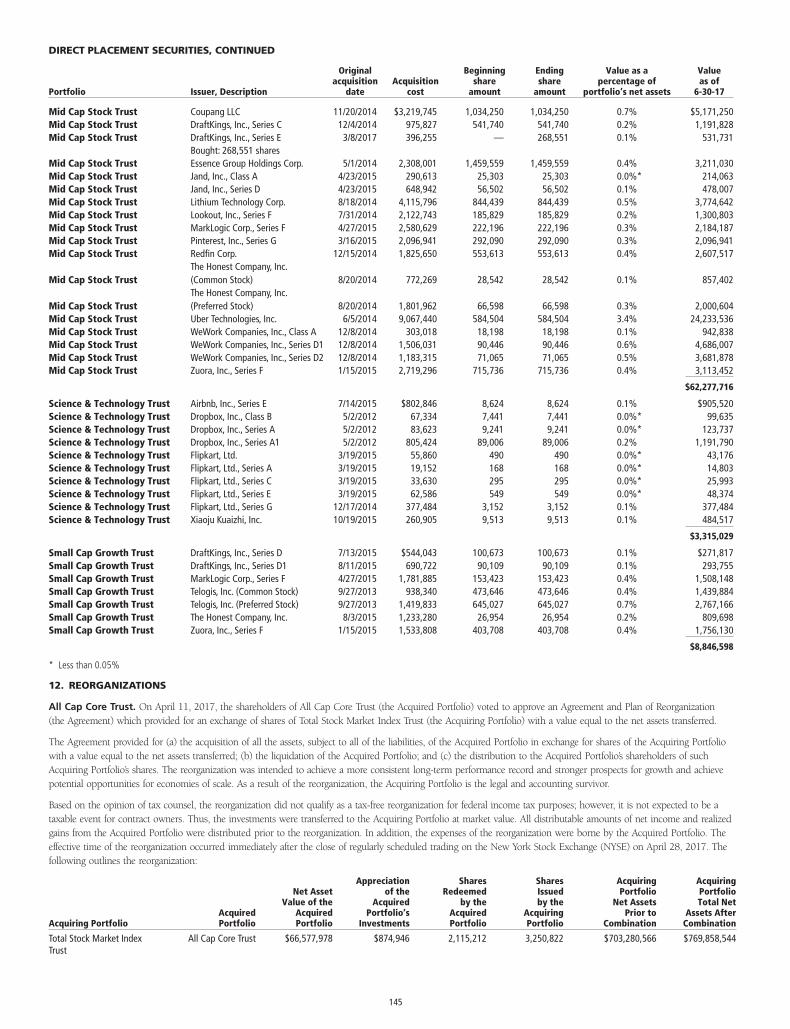
Portfolio Issuer, Description
Originalacquisition
dateAcquisition
cost
Beginningshare
amount
Endingshare
amount
Value as apercentage of
portfolio’s net assets
Valueas of
6-30-17
Mid Cap Stock Trust Coupang LLC 11/20/2014 $3,219,745 1,034,250 1,034,250 0.7% $5,171,250Mid Cap Stock Trust DraftKings, Inc., Series C 12/4/2014 975,827 541,740 541,740 0.2% 1,191,828Mid Cap Stock Trust DraftKings, Inc., Series E 3/8/2017 396,255 — 268,551 0.1% 531,731
Bought: 268,551 sharesMid Cap Stock Trust Essence Group Holdings Corp. 5/1/2014 2,308,001 1,459,559 1,459,559 0.4% 3,211,030Mid Cap Stock Trust Jand, Inc., Class A 4/23/2015 290,613 25,303 25,303 0.0%* 214,063Mid Cap Stock Trust Jand, Inc., Series D 4/23/2015 648,942 56,502 56,502 0.1% 478,007Mid Cap Stock Trust Lithium Technology Corp. 8/18/2014 4,115,796 844,439 844,439 0.5% 3,774,642Mid Cap Stock Trust Lookout, Inc., Series F 7/31/2014 2,122,743 185,829 185,829 0.2% 1,300,803Mid Cap Stock Trust MarkLogic Corp., Series F 4/27/2015 2,580,629 222,196 222,196 0.3% 2,184,187Mid Cap Stock Trust Pinterest, Inc., Series G 3/16/2015 2,096,941 292,090 292,090 0.3% 2,096,941Mid Cap Stock Trust Redfin Corp. 12/15/2014 1,825,650 553,613 553,613 0.4% 2,607,517
Mid Cap Stock TrustThe Honest Company, Inc.(Common Stock) 8/20/2014 772,269 28,542 28,542 0.1% 857,402
Mid Cap Stock TrustThe Honest Company, Inc.(Preferred Stock) 8/20/2014 1,801,962 66,598 66,598 0.3% 2,000,604
Mid Cap Stock Trust Uber Technologies, Inc. 6/5/2014 9,067,440 584,504 584,504 3.4% 24,233,536Mid Cap Stock Trust WeWork Companies, Inc., Class A 12/8/2014 303,018 18,198 18,198 0.1% 942,838Mid Cap Stock Trust WeWork Companies, Inc., Series D1 12/8/2014 1,506,031 90,446 90,446 0.6% 4,686,007Mid Cap Stock Trust WeWork Companies, Inc., Series D2 12/8/2014 1,183,315 71,065 71,065 0.5% 3,681,878Mid Cap Stock Trust Zuora, Inc., Series F 1/15/2015 2,719,296 715,736 715,736 0.4% 3,113,452
$62,277,716
Science & Technology Trust Airbnb, Inc., Series E 7/14/2015 $802,846 8,624 8,624 0.1% $905,520Science & Technology Trust Dropbox, Inc., Class B 5/2/2012 67,334 7,441 7,441 0.0%* 99,635Science & Technology Trust Dropbox, Inc., Series A 5/2/2012 83,623 9,241 9,241 0.0%* 123,737Science & Technology Trust Dropbox, Inc., Series A1 5/2/2012 805,424 89,006 89,006 0.2% 1,191,790Science & Technology Trust Flipkart, Ltd. 3/19/2015 55,860 490 490 0.0%* 43,176Science & Technology Trust Flipkart, Ltd., Series A 3/19/2015 19,152 168 168 0.0%* 14,803Science & Technology Trust Flipkart, Ltd., Series C 3/19/2015 33,630 295 295 0.0%* 25,993Science & Technology Trust Flipkart, Ltd., Series E 3/19/2015 62,586 549 549 0.0%* 48,374Science & Technology Trust Flipkart, Ltd., Series G 12/17/2014 377,484 3,152 3,152 0.1% 377,484Science & Technology Trust Xiaoju Kuaizhi, Inc. 10/19/2015 260,905 9,513 9,513 0.1% 484,517
$3,315,029
Small Cap Growth Trust DraftKings, Inc., Series D 7/13/2015 $544,043 100,673 100,673 0.1% $271,817Small Cap Growth Trust DraftKings, Inc., Series D1 8/11/2015 690,722 90,109 90,109 0.1% 293,755Small Cap Growth Trust MarkLogic Corp., Series F 4/27/2015 1,781,885 153,423 153,423 0.4% 1,508,148Small Cap Growth Trust Telogis, Inc. (Common Stock) 9/27/2013 938,340 473,646 473,646 0.4% 1,439,884Small Cap Growth Trust Telogis, Inc. (Preferred Stock) 9/27/2013 1,419,833 645,027 645,027 0.7% 2,767,166Small Cap Growth Trust The Honest Company, Inc. 8/3/2015 1,233,280 26,954 26,954 0.2% 809,698Small Cap Growth Trust Zuora, Inc., Series F 1/15/2015 1,533,808 403,708 403,708 0.4% 1,756,130
$8,846,598
* Less than 0.05%
12. REORGANIZATIONS
All Cap Core Trust. On April 11, 2017, the shareholders of All Cap Core Trust (the Acquired Portfolio) voted to approve an Agreement and Plan of Reorganization(the Agreement) which provided for an exchange of shares of Total Stock Market Index Trust (the Acquiring Portfolio) with a value equal to the net assets transferred.
The Agreement provided for (a) the acquisition of all the assets, subject to all of the liabilities, of the Acquired Portfolio in exchange for shares of the Acquiring Portfoliowith a value equal to the net assets transferred; (b) the liquidation of the Acquired Portfolio; and (c) the distribution to the Acquired Portfolio’s shareholders of suchAcquiring Portfolio’s shares. The reorganization was intended to achieve a more consistent long-term performance record and stronger prospects for growth and achievepotential opportunities for economies of scale. As a result of the reorganization, the Acquiring Portfolio is the legal and accounting survivor.
Based on the opinion of tax counsel, the reorganization did not qualify as a tax-free reorganization for federal income tax purposes; however, it is not expected to be ataxable event for contract owners. Thus, the investments were transferred to the Acquiring Portfolio at market value. All distributable amounts of net income and realizedgains from the Acquired Portfolio were distributed prior to the reorganization. In addition, the expenses of the reorganization were borne by the Acquired Portfolio. Theeffective time of the reorganization occurred immediately after the close of regularly scheduled trading on the New York Stock Exchange (NYSE) on April 28, 2017. Thefollowing outlines the reorganization:
Acquiring PortfolioAcquiredPortfolio
Net AssetValue of the
AcquiredPortfolio
Appreciationof the
AcquiredPortfolio’s
Investments
SharesRedeemed
by theAcquiredPortfolio
SharesIssuedby the
AcquiringPortfolio
AcquiringPortfolio
Net AssetsPrior to
Combination
AcquiringPortfolioTotal Net
Assets AfterCombination
Total Stock Market IndexTrust
All Cap Core Trust $66,577,978 $874,946 2,115,212 3,250,822 $703,280,566 $769,858,544
DIRECT PLACEMENT SECURITIES, CONTINUED
145
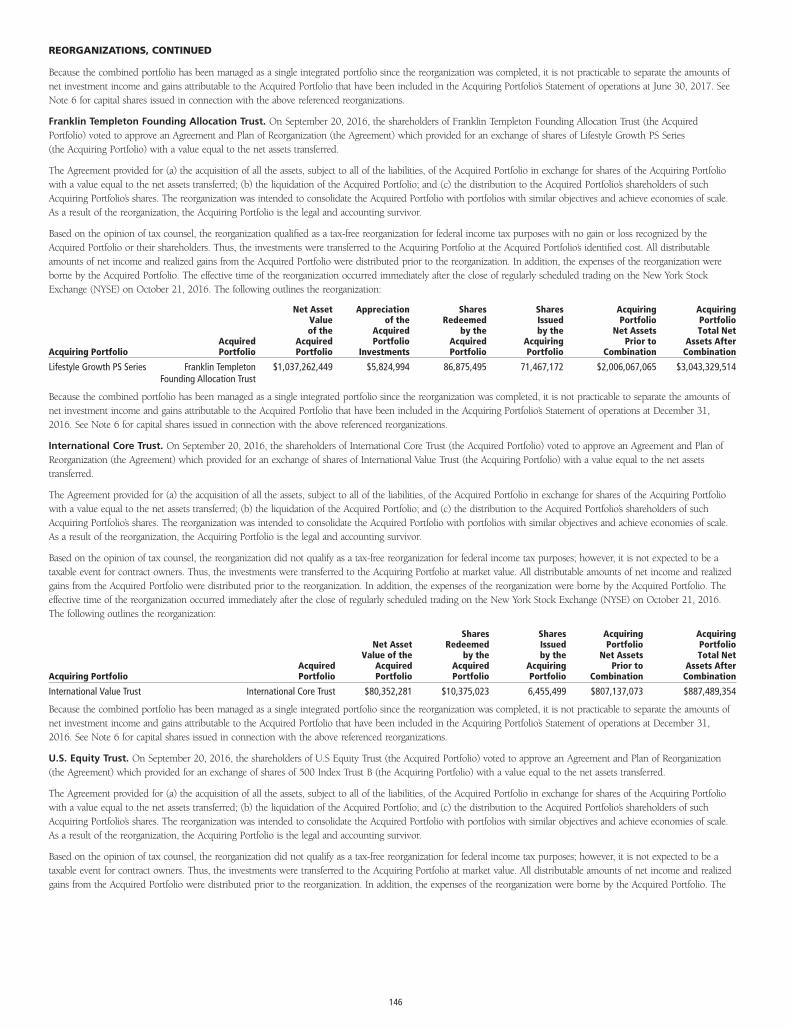
Because the combined portfolio has been managed as a single integrated portfolio since the reorganization was completed, it is not practicable to separate the amounts ofnet investment income and gains attributable to the Acquired Portfolio that have been included in the Acquiring Portfolio’s Statement of operations at June 30, 2017. SeeNote 6 for capital shares issued in connection with the above referenced reorganizations.
Franklin Templeton Founding Allocation Trust. On September 20, 2016, the shareholders of Franklin Templeton Founding Allocation Trust (the AcquiredPortfolio) voted to approve an Agreement and Plan of Reorganization (the Agreement) which provided for an exchange of shares of Lifestyle Growth PS Series(the Acquiring Portfolio) with a value equal to the net assets transferred.
The Agreement provided for (a) the acquisition of all the assets, subject to all of the liabilities, of the Acquired Portfolio in exchange for shares of the Acquiring Portfoliowith a value equal to the net assets transferred; (b) the liquidation of the Acquired Portfolio; and (c) the distribution to the Acquired Portfolio’s shareholders of suchAcquiring Portfolio’s shares. The reorganization was intended to consolidate the Acquired Portfolio with portfolios with similar objectives and achieve economies of scale.As a result of the reorganization, the Acquiring Portfolio is the legal and accounting survivor.
Based on the opinion of tax counsel, the reorganization qualified as a tax-free reorganization for federal income tax purposes with no gain or loss recognized by theAcquired Portfolio or their shareholders. Thus, the investments were transferred to the Acquiring Portfolio at the Acquired Portfolio’s identified cost. All distributableamounts of net income and realized gains from the Acquired Portfolio were distributed prior to the reorganization. In addition, the expenses of the reorganization wereborne by the Acquired Portfolio. The effective time of the reorganization occurred immediately after the close of regularly scheduled trading on the New York StockExchange (NYSE) on October 21, 2016. The following outlines the reorganization:
Acquiring PortfolioAcquiredPortfolio
Net AssetValueof the
AcquiredPortfolio
Appreciationof the
AcquiredPortfolio
Investments
SharesRedeemed
by theAcquiredPortfolio
SharesIssuedby the
AcquiringPortfolio
AcquiringPortfolio
Net AssetsPrior to
Combination
AcquiringPortfolioTotal Net
Assets AfterCombination
Lifestyle Growth PS Series Franklin TempletonFounding Allocation Trust
$1,037,262,449 $5,824,994 86,875,495 71,467,172 $2,006,067,065 $3,043,329,514
Because the combined portfolio has been managed as a single integrated portfolio since the reorganization was completed, it is not practicable to separate the amounts ofnet investment income and gains attributable to the Acquired Portfolio that have been included in the Acquiring Portfolio’s Statement of operations at December 31,2016. See Note 6 for capital shares issued in connection with the above referenced reorganizations.
International Core Trust. On September 20, 2016, the shareholders of International Core Trust (the Acquired Portfolio) voted to approve an Agreement and Plan ofReorganization (the Agreement) which provided for an exchange of shares of International Value Trust (the Acquiring Portfolio) with a value equal to the net assetstransferred.
The Agreement provided for (a) the acquisition of all the assets, subject to all of the liabilities, of the Acquired Portfolio in exchange for shares of the Acquiring Portfoliowith a value equal to the net assets transferred; (b) the liquidation of the Acquired Portfolio; and (c) the distribution to the Acquired Portfolio’s shareholders of suchAcquiring Portfolio’s shares. The reorganization was intended to consolidate the Acquired Portfolio with portfolios with similar objectives and achieve economies of scale.As a result of the reorganization, the Acquiring Portfolio is the legal and accounting survivor.
Based on the opinion of tax counsel, the reorganization did not qualify as a tax-free reorganization for federal income tax purposes; however, it is not expected to be ataxable event for contract owners. Thus, the investments were transferred to the Acquiring Portfolio at market value. All distributable amounts of net income and realizedgains from the Acquired Portfolio were distributed prior to the reorganization. In addition, the expenses of the reorganization were borne by the Acquired Portfolio. Theeffective time of the reorganization occurred immediately after the close of regularly scheduled trading on the New York Stock Exchange (NYSE) on October 21, 2016.The following outlines the reorganization:
Acquiring PortfolioAcquiredPortfolio
Net AssetValue of the
AcquiredPortfolio
SharesRedeemed
by theAcquiredPortfolio
SharesIssuedby the
AcquiringPortfolio
AcquiringPortfolio
Net AssetsPrior to
Combination
AcquiringPortfolioTotal Net
Assets AfterCombination
International Value Trust International Core Trust $80,352,281 $10,375,023 6,455,499 $807,137,073 $887,489,354
Because the combined portfolio has been managed as a single integrated portfolio since the reorganization was completed, it is not practicable to separate the amounts ofnet investment income and gains attributable to the Acquired Portfolio that have been included in the Acquiring Portfolio’s Statement of operations at December 31,2016. See Note 6 for capital shares issued in connection with the above referenced reorganizations.
U.S. Equity Trust. On September 20, 2016, the shareholders of U.S Equity Trust (the Acquired Portfolio) voted to approve an Agreement and Plan of Reorganization(the Agreement) which provided for an exchange of shares of 500 Index Trust B (the Acquiring Portfolio) with a value equal to the net assets transferred.
The Agreement provided for (a) the acquisition of all the assets, subject to all of the liabilities, of the Acquired Portfolio in exchange for shares of the Acquiring Portfoliowith a value equal to the net assets transferred; (b) the liquidation of the Acquired Portfolio; and (c) the distribution to the Acquired Portfolio’s shareholders of suchAcquiring Portfolio’s shares. The reorganization was intended to consolidate the Acquired Portfolio with portfolios with similar objectives and achieve economies of scale.As a result of the reorganization, the Acquiring Portfolio is the legal and accounting survivor.
Based on the opinion of tax counsel, the reorganization did not qualify as a tax-free reorganization for federal income tax purposes; however, it is not expected to be ataxable event for contract owners. Thus, the investments were transferred to the Acquiring Portfolio at market value. All distributable amounts of net income and realizedgains from the Acquired Portfolio were distributed prior to the reorganization. In addition, the expenses of the reorganization were borne by the Acquired Portfolio. The
REORGANIZATIONS, CONTINUED
146
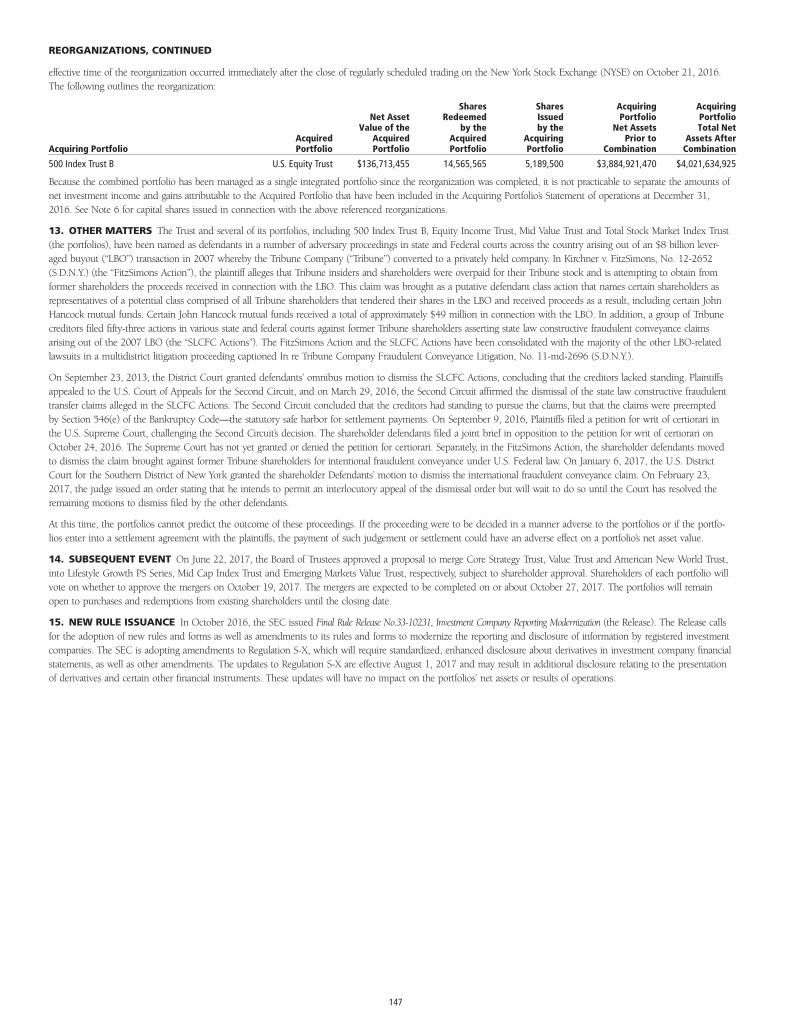
effective time of the reorganization occurred immediately after the close of regularly scheduled trading on the New York Stock Exchange (NYSE) on October 21, 2016.The following outlines the reorganization:
Acquiring PortfolioAcquiredPortfolio
Net AssetValue of the
AcquiredPortfolio
SharesRedeemed
by theAcquiredPortfolio
SharesIssuedby the
AcquiringPortfolio
AcquiringPortfolio
Net AssetsPrior to
Combination
AcquiringPortfolioTotal Net
Assets AfterCombination
500 Index Trust B U.S. Equity Trust $136,713,455 14,565,565 5,189,500 $3,884,921,470 $4,021,634,925
Because the combined portfolio has been managed as a single integrated portfolio since the reorganization was completed, it is not practicable to separate the amounts ofnet investment income and gains attributable to the Acquired Portfolio that have been included in the Acquiring Portfolio’s Statement of operations at December 31,2016. See Note 6 for capital shares issued in connection with the above referenced reorganizations.
13. OTHER MATTERS The Trust and several of its portfolios, including 500 Index Trust B, Equity Income Trust, Mid Value Trust and Total Stock Market Index Trust(the portfolios), have been named as defendants in a number of adversary proceedings in state and Federal courts across the country arising out of an $8 billion lever-aged buyout (“LBO”) transaction in 2007 whereby the Tribune Company (“Tribune”) converted to a privately held company. In Kirchner v. FitzSimons, No. 12-2652(S.D.N.Y.) (the “FitzSimons Action”), the plaintiff alleges that Tribune insiders and shareholders were overpaid for their Tribune stock and is attempting to obtain fromformer shareholders the proceeds received in connection with the LBO. This claim was brought as a putative defendant class action that names certain shareholders asrepresentatives of a potential class comprised of all Tribune shareholders that tendered their shares in the LBO and received proceeds as a result, including certain JohnHancock mutual funds. Certain John Hancock mutual funds received a total of approximately $49 million in connection with the LBO. In addition, a group of Tribunecreditors filed fifty-three actions in various state and federal courts against former Tribune shareholders asserting state law constructive fraudulent conveyance claimsarising out of the 2007 LBO (the “SLCFC Actions”). The FitzSimons Action and the SLCFC Actions have been consolidated with the majority of the other LBO-relatedlawsuits in a multidistrict litigation proceeding captioned In re Tribune Company Fraudulent Conveyance Litigation, No. 11-md-2696 (S.D.N.Y.).
On September 23, 2013, the District Court granted defendants’ omnibus motion to dismiss the SLCFC Actions, concluding that the creditors lacked standing. Plaintiffsappealed to the U.S. Court of Appeals for the Second Circuit, and on March 29, 2016, the Second Circuit affirmed the dismissal of the state law constructive fraudulenttransfer claims alleged in the SLCFC Actions. The Second Circuit concluded that the creditors had standing to pursue the claims, but that the claims were preemptedby Section 546(e) of the Bankruptcy Code—the statutory safe harbor for settlement payments. On September 9, 2016, Plaintiffs filed a petition for writ of certiorari inthe U.S. Supreme Court, challenging the Second Circuit’s decision. The shareholder defendants filed a joint brief in opposition to the petition for writ of certiorari onOctober 24, 2016. The Supreme Court has not yet granted or denied the petition for certiorari. Separately, in the FitzSimons Action, the shareholder defendants movedto dismiss the claim brought against former Tribune shareholders for intentional fraudulent conveyance under U.S. Federal law. On January 6, 2017, the U.S. DistrictCourt for the Southern District of New York granted the shareholder Defendants’ motion to dismiss the international fraudulent conveyance claim. On February 23,2017, the judge issued an order stating that he intends to permit an interlocutory appeal of the dismissal order but will wait to do so until the Court has resolved theremaining motions to dismiss filed by the other defendants.
At this time, the portfolios cannot predict the outcome of these proceedings. If the proceeding were to be decided in a manner adverse to the portfolios or if the portfo-lios enter into a settlement agreement with the plaintiffs, the payment of such judgement or settlement could have an adverse effect on a portfolio’s net asset value.
14. SUBSEQUENT EVENT On June 22, 2017, the Board of Trustees approved a proposal to merge Core Strategy Trust, Value Trust and American New World Trust,into Lifestyle Growth PS Series, Mid Cap Index Trust and Emerging Markets Value Trust, respectively, subject to shareholder approval. Shareholders of each portfolio willvote on whether to approve the mergers on October 19, 2017. The mergers are expected to be completed on or about October 27, 2017. The portfolios will remainopen to purchases and redemptions from existing shareholders until the closing date.
15. NEW RULE ISSUANCE In October 2016, the SEC issued Final Rule Release No.33-10231, Investment Company Reporting Modernization (the Release). The Release callsfor the adoption of new rules and forms as well as amendments to its rules and forms to modernize the reporting and disclosure of information by registered investmentcompanies. The SEC is adopting amendments to Regulation S-X, which will require standardized, enhanced disclosure about derivatives in investment company financialstatements, as well as other amendments. The updates to Regulation S-X are effective August 1, 2017 and may result in additional disclosure relating to the presentationof derivatives and certain other financial instruments. These updates will have no impact on the portfolios’ net assets or results of operations.
REORGANIZATIONS, CONTINUED
147
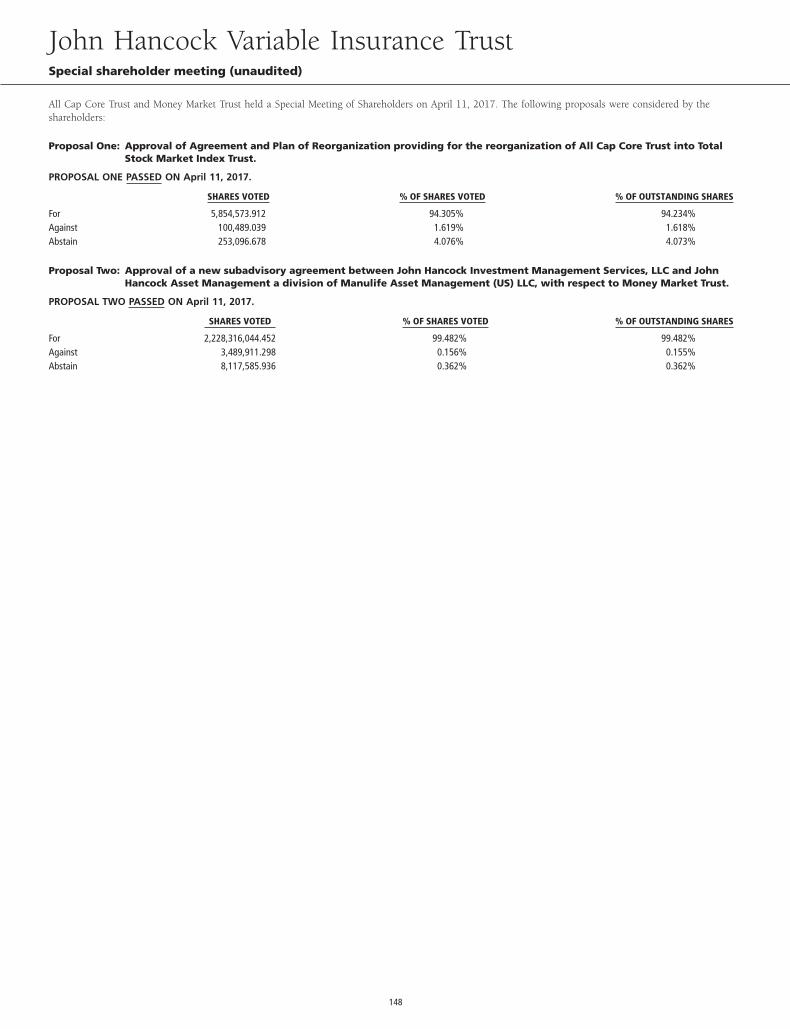
All Cap Core Trust and Money Market Trust held a Special Meeting of Shareholders on April 11, 2017. The following proposals were considered by theshareholders:
Proposal One: Approval of Agreement and Plan of Reorganization providing for the reorganization of All Cap Core Trust into TotalStock Market Index Trust.
PROPOSAL ONE PASSED ON April 11, 2017.
SHARES VOTED % OF SHARES VOTED % OF OUTSTANDING SHARES
For 5,854,573.912 94.305% 94.234%Against 100,489.039 1.619% 1.618%Abstain 253,096.678 4.076% 4.073%
Proposal Two: Approval of a new subadvisory agreement between John Hancock Investment Management Services, LLC and JohnHancock Asset Management a division of Manulife Asset Management (US) LLC, with respect to Money Market Trust.
PROPOSAL TWO PASSED ON April 11, 2017.
SHARES VOTED % OF SHARES VOTED % OF OUTSTANDING SHARES
For 2,228,316,044.452 99.482% 99.482%Against 3,489,911.298 0.156% 0.155%Abstain 8,117,585.936 0.362% 0.362%
John Hancock Variable Insurance TrustSpecial shareholder meeting (unaudited)
148
This section describes the evaluation by the Board of Trustees (the Board) of JohnHancock Variable Insurance Trust (the Trust) of the Advisory Agreement (theAdvisory Agreement) and each Subadvisory Agreement and Sub-SubadvisoryAgreement (collectively, the Subadvisory Agreements) with respect to each of theportfolios of the Trust included in this report except those otherwise noted below(the Funds). The Advisory and Subadvisory Agreements are collectively referredto as the Agreements. Prior to the June 19-22, 2017 in-person meeting at whichthe Agreements were approved, the Board also discussed and considered informa-tion regarding the proposed continuation of the Agreements at an in-personmeeting held on May 22-24, 2017.
The following Funds are feeder funds, which invest all of their assets in masterfunds: American Asset Allocation Trust, American Global Growth Trust, AmericanGrowth Trust, American Growth-Income Trust, American International Trust andAmerican New World Trust. These Funds do not pay an advisory fee at the Fundlevel and do not have advisory agreements.
Approval of Advisory and Subadvisory Agreements
At in-person meetings held on June 19-22, 2017, the Board, including the Trust-ees who are not parties to any Agreement or considered to be interested personsof the Trust under the Investment Company Act of 1940, as amended (the 1940Act) (the Independent Trustees), reapproved for an annual period, the continua-tion of the Advisory Agreement between the Trust and the Advisor and the appli-cable Subadvisory Agreements between the Advisor and the sub-advisers (andsub-subadvisers) (each, a Subadvisor and collectively, the Subadvisors) withrespect to each of the Funds in this report, except as noted above.
In considering the Advisory Agreement and the Subadvisory Agreements withrespect to each Fund, the Board received in advance of the meetings a variety ofmaterials relating to each Fund, the Advisor and each Subadvisor, including com-parative performance, fee and expense information for peer groups of similarmutual funds prepared by an independent third-party provider of mutual funddata; performance information for the Funds’ benchmark indices; and, withrespect to each Subadvisor, comparative performance information for comparablymanaged accounts, as applicable; and other information provided by the Advisorand the Subadvisors regarding the nature, extent and quality of services providedby the Advisor and the Subadvisors under their respective Agreements, as well asinformation regarding the Advisor’s revenues and costs of providing services tothe Funds and any compensation paid to affiliates of the Advisor. At the meetingsat which the renewal of the Advisory Agreement and Subadvisory Agreements areconsidered, particular focus is given to information concerning Fund perfor-mance, comparability of fees and total expenses, and profitability. However, theBoard noted that the evaluation process with respect to the Advisor and theSubadvisors is an ongoing one. In this regard, the Board also took into accountdiscussions with management and information provided to the Board (includingits various committees) at prior meetings with respect to the services provided bythe Advisor and the Subadvisors to the Funds, including quarterly performancereports prepared by management containing reviews of investment results, andperiodic presentations from the Subadvisors with respect to the Funds they man-age. The information received and considered by the Board both in conjunctionwith the May and June meetings and throughout the year was both written andoral. The Board noted the affiliation of certain of the Subadvisors with theAdvisor, noting any potential conflicts of interest. The Board also consideredthe nature, quality, and extent of the non-advisory services, if any, to be providedto the Funds by the Advisor’s affiliates, including distribution services. The Boardconsidered the Advisory Agreement and the Subadvisory Agreements separatelyin the course of its review. In doing so, the Board noted the respective roles ofthe Advisor and the Subadvisors in providing services to the Funds. In addition,although the Board approved the renewal of the Agreements for all of the Fundsat the June meeting, the Board considered each Fund separately.
Throughout the process, the Board asked questions of and requested additionalinformation from management. The Board is assisted by counsel for the Trust andthe Independent Trustees are also separately assisted by independent legal counselthroughout the process. The Independent Trustees also received a memorandum
from their independent counsel discussing the legal standards for their consider-ation of the proposed continuation of the Agreements and discussed the pro-posed continuation of the Agreements in private sessions with their independentlegal counsel at which no representatives of management were present.
Approval of Advisory Agreement
In approving the Advisory Agreement with respect to each Fund, the Board,including the Independent Trustees, considered a variety of factors, includingthose discussed below. The Board also considered other factors (including condi-tions and trends prevailing generally in the economy, the securities markets andthe industry) and did not treat any single factor as determinative, and eachTrustee may have attributed different weights to different factors. The Board’s con-clusions may be based in part on its consideration of the advisory and subadvi-sory arrangements in prior years and on the Board’s ongoing regular review ofFund performance and operations throughout the year.
Nature, Extent and Quality of Services. Among the information receivedby the Board from the Advisor relating to the nature, extent and quality of ser-vices provided to the Funds, the Board reviewed information provided by theAdvisor relating to its operations and personnel, descriptions of its organizationaland management structure, and information regarding the Advisor’s complianceand regulatory history, including its Form ADV. The Board also noted that on aregular basis it receives and reviews information from the Trust’s Chief Compli-ance Officer (CCO) regarding the Funds’ compliance policies and proceduresestablished pursuant to Rule 38a-1 under the 1940 Act. The Board observed thatthe scope of services provided by the Advisor, and of the undertakings requiredof the Advisor in connection with those services, including maintaining andmonitoring its own and the Fund’s compliance programs, risk management pro-grams, liquidity management programs and cybersecurity programs, hadexpanded over time as a result of regulatory, market and other developments.The Board considered that the Advisor is responsible for the management of theday-to-day operations of the Funds, including but not limited to, general supervi-sion of and coordination of the services provided by the Subadvisors, and is alsoresponsible for monitoring and reviewing the activities of the Subadvisors andother third-party service providers. The Board also considered the significant risksassumed by the Advisor in connection with the services provided to the Fundsincluding entrepreneurial risk in sponsoring new Funds and ongoing risksincluding investment, operational, enterprise, litigation, regulatory and compli-ance risks with respect to all Funds.
In considering the nature, extent and quality of the services provided by theAdvisor, the Trustees also took into account their knowledge of the Advisor’smanagement and the quality of the performance of the Advisor’s duties, throughBoard meetings, discussions and reports during the preceding year and througheach Trustee’s experience as a Trustee of the Trust and of the other trusts in thecomplex.
In the course of their deliberations regarding the Advisory Agreement, the Boardconsidered, among other things:
(a) the skills and competency with which the Advisor has in the past managedthe Trust’s affairs and its subadvisory relationships, the Advisor’s oversight andmonitoring of the Subadvisors’ investment performance and compliance pro-grams, such as the Subadvisors’ compliance with fund policies and objectives,review of brokerage matters including with respect to trade allocation and bestexecution, and the Advisor’s timeliness in responding to performance issues;
(b) the background, qualifications and skills of the Advisor’s personnel;
(c) the Advisor’s compliance policies and procedures and its responsiveness toregulatory changes and mutual fund industry developments;
(d) the Advisor’s administrative capabilities, including its ability to supervise theother service providers for the Funds;
(e) the financial condition of the Advisor and whether it has the financial where-withal to provide a high level and quality of services to the Funds; and
John Hancock Variable Insurance TrustEvaluation of advisory and subadvisory agreements by the board of trustees
149
(f) the Advisor’s initiatives intended to improve various aspects of the Trust’soperations and investor experience with the Funds; and
(g) the Advisor’s reputation and experience in serving as an investment adviser tothe Trust and the benefit to contractholders of investing in funds that are part ofa family of variable insurance portfolios offering a variety of investments.
The Board concluded that the Advisor may reasonably be expected to continue toprovide a high quality of services under the Advisory Agreement with respect tothe Funds.
Investment Performance. In considering each Fund’s performance, the Boardnoted that it reviews at its regularly scheduled meetings information about theFunds’ performance results. In connection with the consideration of the AdvisoryAgreement, the Board:
(a) reviewed information prepared by management regarding the Funds’performance;
(b) considered the comparative performance of each Fund’s respectivebenchmark;
(c) considered the performance of comparable funds, if any, as included in thereport prepared by an independent third-party provider of mutual fund data; and
(d) took into account the Advisor’s analysis of each Fund’s performance and itsplans and recommendations regarding the Trust’s subadvisory arrangements gen-erally and with respect to particular Funds.
The Board noted that while it found the data provided by the independent third-party generally useful it recognized its limitations, including in particular that thedata may vary depending on the end date selected and that the results of theperformance comparisons may vary depending on the selection of the peergroup. The Board concluded that the performance of each of the Funds hasgenerally been in line with or generally outperformed the historical performanceof comparable funds and/or the Fund’s respective benchmark, with certainexceptions noted in Appendix A. In such cases, the Board considered steps theAdvisor had taken to address performance and concluded that such performanceis being monitored and reasonably addressed.
Fees and Expenses. The Board reviewed comparative information prepared byan independent third-party provider of mutual fund data including, among otherdata, each Fund’s contractual and net management fees (and subadvisory fees, tothe extent available) and total expenses as compared to similarly situated invest-ment companies deemed to be comparable to the Fund in light of the nature,extent and quality of the management and subadvisory services provided by theAdvisor and the Subadvisors.. The Board considered each Fund’s ranking within asmaller group of peer funds chosen by the independent third-party provider, aswell as the Fund’s ranking within broader groups of funds. In comparing eachFund’s contractual and net management fees to that of comparable funds, theBoard noted that such fee includes both advisory and administrative costs.
The Board took into account management’s discussion with respect to the overallmanagement fee, the fees of each Subadvisor, including the amount of theadvisory fee retained by the Advisor after payment of the subadvisory fees, ineach case in light of the services rendered for those amounts and the risks under-taken by the Advisor. The Board also noted that, in addition, the Advisor is cur-rently waiving fees and/or reimbursing expenses with respect to certain of theFunds. The Board also noted that the Advisor pays the subadvisory fees of theFunds, and that such fees are negotiated at arm’s length with respect to unaffili-ated Subadvisors. In addition, the Board noted that the Advisor continued advi-sory and subadvisory fee reductions in the past year with respect to severalFunds. The Board also took into account that management had agreed to imple-ment an overall fee waiver across the complex, which is discussed further below.The Board also noted management’s discussion of the Funds’ expenses, as well ascertain actions taken over the past several years to reduce the Funds’ operatingexpenses. The Board reviewed information provided by the Advisor concerninginvestment advisory fees charged to other clients (including other funds in the
complex) having similar investment mandates, if any. The Board considered anydifferences between the Advisor’s and Subadvisor’s services to a Fund and theservices they provide to other such comparable clients or funds. The Board con-cluded that the advisory fee paid with respect to each of the Funds is reasonablein light of the nature, extent and quality of the services provided to the Fundsunder the Advisory Agreement.
In addition, in the case of the Core Strategy Trust and each Lifestyle PS Series(each a Fund of Funds), the Trustees reviewed the advisory fee to be paid to theAdvisor for each Fund of Funds and concluded that the advisory fee to be paidto the Advisor with respect to each Fund of Funds is based on services providedthat are in addition to, rather than duplicative of, the services provided pursuantto the advisory agreements for the underlying portfolios of the Fund of Fundsand that the additional services are necessary because of the differences betweenthe investment policies, strategies and techniques of a Fund of Funds and thoseof its underlying portfolios.
Profitability/Fall Out Benefits. In considering the costs of the services to beprovided and the profits to be realized by the Advisor and its affiliates (includingthe Subadvisors that are affiliated with the Advisor) from the Advisor’s relation-ship with the Trust, the Board:
(a) reviewed financial information of the Advisor;
(b) reviewed and considered (i) information presented by the Advisor regardingthe net profitability to the Advisor and its affiliates, of each Fund; and (ii) therepresentation by the John Hancock insurance companies in registration state-ments for registered variable insurance contracts using the Funds as investmentoptions in registered separate accounts, that the fees and charges deducted undertheir variable insurance contracts (including the fees and expenses of the Trust),in the aggregate, are reasonable in relation to the services rendered, the expensesexpected to be incurred and the risks assumed by such companies;
(c) received and reviewed profitability information with respect to the JohnHancock fund complex as a whole and with respect to each Fund;
(d) received information with respect to the Advisor’s allocation methodologiesused in preparing the profitability data and considered that the Advisor hired anindependent third-party consultant to provide an analysis of the Advisor’s alloca-tion methodologies;
(e) considered that the John Hancock insurance companies that are affiliates ofthe Advisor, as shareholders of the Trust directly or through their separateaccounts, receive certain tax credits or deductions relating to foreign taxes paidand dividends received by certain Funds of the Trust and noted that these taxbenefits, which are not available to contractholders under applicable income taxlaw, are reflected in the profitability analysis reviewed by the Board;
(f) considered that the Advisor also provides administrative services to the Fundson a cost basis pursuant to an administrative services agreement;
(g) noted that certain of the Funds’ Subadvisors are affiliates of the Advisor;
(h) noted that affiliates of the Advisor provide distribution services to the Funds,and that the Trust’s distributor also receives Rule 12b-1 payments to support dis-tribution of the products;
(i) noted that the Advisor also derives reputational and other indirect benefitsfrom providing advisory services to the Funds;
(j) noted that the subadvisory fees for the Funds are paid by the Advisor and arenegotiated at arms’ length with respect to the unaffiliated Subadvisors;
(k) with respect to each Fund of Funds, the Board noted that the advisory fee isin addition to the fees received by the Advisor and its affiliates with regard to theunderlying portfolios in which the Funds may invest; and
(l) considered the Advisor’s ongoing costs and expenditures necessary to improveservices, meet new regulatory and compliance requirements, and adapt to otherchallenges impacting the mutual fund industry; and
John Hancock Variable Insurance TrustEvaluation of advisory and subadvisory agreements by the board of trustees
150
(m) considered that the Advisor should be entitled to earn a reasonable level ofprofits in exchange for the level of services it provides to each Fund and the risksthat it assumes as Advisor, including entrepreneurial, operational, reputational,litigation and regulatory risk.
Based upon its review, the Board concluded that the level of profitability, if any, ofthe Advisor and its affiliates (including any Subadvisors that are affiliated with theAdvisor), from their relationship with each Fund was reasonable and notexcessive.
Economies of Scale. In considering the extent to which economies of scalewould be realized as a Fund grows and whether fee levels reflect these economiesof scale for the benefit of Fund shareholders, the Board:
(a) with respect to each Fund (except those discussed specifically below), consid-ered that the Advisor has agreed to waive a portion of its management fee forsuch Fund and for each of the other John Hancock funds in the complex (exceptas discussed below) (the Participating Portfolios) or otherwise reimburse theexpenses of the Participating Portfolios (the Reimbursement). This waiver is basedon the aggregate net assets of all the Participating Portfolios. The Board also notedthat the Advisor had implemented additional breakpoints to the complex-widefee waiver in recent years.
(The Funds that are not Participating Portfolios as of the date of this annualreport are each of the funds of funds of the Trust and John Hancock Funds IIand John Hancock Collateral Trust. The funds of funds also benefit from suchoverall management fee waiver through their investment in underlying portfoliosthat include certain of the Participating Portfolios, which are subject to theReimbursement.);
(b) reviewed the Trust’s advisory fee structure and the incorporation thereinof any subadvisory fee breakpoints in the advisory fees charged and concludedthat (i) most of the Funds’ fee structures contain breakpoints at the subadvisoryfee level and that such breakpoints are reflected as breakpoints in the advisoryfees for Funds and (ii) although economies of scale cannot be measured withprecision, these arrangements permit shareholders of Funds with advisory feebreakpoints to benefit from economies of scale if those Funds grow. The Boardalso took into account management’s discussion of the Funds’ advisory feestructure, including with respect to those Funds that did not currently havebreakpoints; and
(c) the Board also considered the effect of the Funds’ growth in size on their per-formance and fees. The Board also noted that if the Funds’ assets increase overtime, the Funds may realize other economies of scale.
Approval of Subadvisory Agreements
In making its determination with respect to approval of the Subadvisory Agree-ments, the Board reviewed:
(1) information relating to each Subadvisor’s business, including current subadvi-sory services to the Trust (and other funds in the John Hancock family offunds);
(2) the historical and current performance of each Fund and comparative perfor-mance information relating to the Fund’s benchmark and comparable funds;
(3) the subadvisory fee for each Fund, including any breakpoints, and compara-tive fee information, where available, prepared by an independent third-partyprovider of mutual fund data; and
(4) information relating to the nature and scope of any material relationships andtheir significance to the Trust’s Advisor and unaffiliated Subadvisors.
Nature, Extent and Quality of Services. With respect to the services pro-vided by each of the Subadvisors with respect to each Fund, the Board receivedinformation provided to the Board by each Subadvisor, including each Subadvi-sor’s Form ADV, as well as took into account information presented throughoutthe past year. The Board considered each Subadvisor’s current level of staffing andits overall resources, as well as received information relating to a Subadvisor’s
compensation program. The Board reviewed each Subadvisor’s history and invest-ment experience, as well as information regarding the qualifications, backgroundand responsibilities of the Subadvisor’s investment and compliance personnel whoprovide services to the Funds. The Board also considered, among other things,the Subadvisor’s compliance program and any disciplinary history. The Board alsoconsidered the Subadvisor’s risk assessment and monitoring process. The Boardreviewed each Subadvisor’s regulatory history, including whether it was currentlyinvolved in any regulatory actions or investigations as well as material litigation,and any settlements and amelioratory actions undertaken, as appropriate. TheBoard noted that the Advisor conducts regular, periodic reviews of each Subadvi-sor and its operations, including regarding investment processes and organiza-tional and staffing matters. The Board also noted that the CCO and his staffconduct regular, periodic compliance reviews with each of the Subadvisors andpresent reports to the Independent Trustees regarding the same, which includesevaluating the regulatory compliance systems of the Subadvisors and proceduresreasonably designed by them to assure compliance with the federal securitieslaws. The Board also took into account the financial condition of eachSubadvisor.
The Board considered each Subadvisor’s investment process and philosophy. TheBoard took into account that each Subadvisor’s responsibilities include the devel-opment and maintenance of an investment program for the applicable Fundwhich is consistent with the Fund’s investment objectives, the selection of invest-ment securities and the placement of orders for the purchase and sale of suchsecurities, as well as the implementation of compliance controls related to perfor-mance of these services. The Board also received information with respect to eachSubadvisor’s brokerage policies and practices, including with respect to bestexecution and soft dollars.
Subadvisor Compensation. In considering the cost of services to be providedby each Subadvisor and the profitability to that Subadvisor of its relationship withthe Fund, the Board noted that the fees under the Subadvisory Agreements arepaid by the Advisor and not the Funds. The Board also relied on the ability ofthe Advisor to negotiate each Subadvisory Agreement with Subadvisors that arenot affiliated with the Advisor and the fees thereunder at arm’s length. As a result,the costs of the services to be provided and the profits to be realized by unaffili-ated Subadvisors from their relationship with the Trust were not a material factorin the Board’s consideration of the Subadvisory Agreements.
The Board also received information regarding the nature and scope (includingtheir significance to the Advisor and its affiliates and to unaffiliated Subadvisors)of any material relationships with respect to the unaffiliated Subadvisors, whichinclude arrangements in which unaffiliated Subadvisors or their affiliates provideadvisory, distribution or management services in connection with financialproducts sponsored by the Trust’s Advisor or its affiliates, and may include sharesof the Trust, other registered investment companies, a 529 education savingsplan, managed separate accounts and exempt group annuity contracts sold toqualified plans. The Board also received information and took into account anyother potential conflicts of interests the Advisor might have in connection withthe Subadvisory Agreements.
In addition, the Board considered other potential indirect benefits that the Subad-visors and their affiliates may receive from the Subadvisor’s relationship with theFund, such as the opportunity to provide advisory services to additional portfo-lios of the Trusts and reputational benefits.
Subadvisory Fees. The Board considered that the Fund pays an advisory feeto the Advisor and that, in turn, the Advisor pays a subadvisory fee to each Sub-advisor. As noted above, the Board also considered, if available, each Fund’s sub-advisory fees as compared to similarly situated investment companies deemed tobe comparable to the Fund as included in the report prepared by the indepen-dent third party provider of mutual fund data. The Board also took into accountthe sub-advisory fees paid by the Advisor to fees charged by each Fund’s Subad-visor to manage other sub-advised portfolios and portfolios not subject to regula-tion under the 1940 Act, as applicable.
John Hancock Variable Insurance TrustEvaluation of advisory and subadvisory agreements by the board of trustees
151
Subadvisor Performance. As noted above, the Board considered each Fund’sperformance as compared to the Fund’s respective peer group and benchmarkand noted that the Board reviews information about the Fund’s performanceresults at its regularly scheduled meetings. The Board noted the Advisor’s exper-tise and resources in monitoring the performance, investment style, and risk-adjusted performance of each Subadvisor. The Board was mindful of the Advisor’sfocus on each Subadvisor’s performance. The Board also noted each Subadvisor’slong-term performance record for similar accounts, as applicable.
The Board’s decision to approve the Subadvisory Agreement with respect to eachFund was based on a number of determinations, including the following:
(1) Each Subadvisor has extensive experience and demonstrated skills as amanager;
(2) Although not without variation, the performance of each Fund managed by aSubadvisor generally has been in line with or outperformed the historicalperformance of comparable funds and the Fund’s respective benchmarks,with the exceptions noted in Appendix A (with respect to such exceptions,the Board considered the steps the Subadvisor had taken to address perfor-mance and concluded that performance is being monitored and reasonablyaddressed);
(3) The subadvisory fees are reasonable in relation to the level and quality ofservices being provided under the Subadvisory Agreement; and
(4) With respect to those Funds that have subadvisory fees that contain break-points, certain breakpoints are reflected as breakpoints in the advisory fees
for the Funds in order to permit shareholders to benefit from economies ofscale if those Funds grow.
In addition, in the case of each Fund of Funds, the Trustees reviewed thesubadvisory fee to be paid to the Subadvisor for the Fund of Funds and con-cluded that the subadvisory fee to be paid to the Subadvisor with respect to eachFund of Funds is based on services provided that are in addition to, rather thanduplicative of, the services provided pursuant to the advisory agreements andsubadvisory agreements for the underlying portfolios of the Fund of Funds andthat the additional services are necessary because of the differences between theinvestment policies, strategies and techniques of a Fund of Funds and those of itsunderlying portfolios.
Additional information relating to each Fund’s fees and expenses and performance that theBoard considered in approving the Advisory Agreement and Subadvisory Agreement for aparticular Fund is set forth in Appendix A.
* * *
Based on their evaluation of all factors that they deemed to be material, includingthose factors described above, the Board, including the Independent Trustees,concluded that renewal of the Advisory Agreement and each of the SubadvisoryAgreements with respect to each Fund would be in the best interest of each ofthe respective Funds and its shareholders. Accordingly, the Board, and the Inde-pendent Trustees voting separately, approved the Advisory Agreement and Subad-visory Agreement with respect to each Fund for an additional one-year period.
John Hancock Variable Insurance TrustEvaluation of advisory and subadvisory agreements by the board of trustees
152
Portfolio(Subadviser)
Performance asof 12.31.2016 Fees and Expenses Comments
500 Index Trust B
(Manulife Asset Management(North America))
Benchmark Index — The Trustunderperformed the benchmarkindex for the one- and three-yearperiods.
Broadridge Category — The Trustoutperformed the average for theone- and three-year periods.
The subadviser fees for this Trustare equal to the peer groupmedian.
Net management fees for thisTrust are lower than the peergroup median.
Net total expenses for this Trustare lower than the peer groupmedian.
The Board took into accountmanagement’s discussion of thefactors that contributed to theTrust’s one- and three-yearperformance relative to thebenchmark index.
The Board noted the Trust’sfavorable performance relative tothe peer group average for theone- and three-year periods.
The Board noted the Fund’s netmanagement fees and net totalexpenses are lower than the peergroup median.
Alpha Opportunities Trust
(Wellington ManagementCompany LLP)
Benchmark Index — The Trustunderperformed the benchmarkindex for the one-, three- andfive-year periods.
Broadridge Category — The Trustunderperformed the average forthe one- and three-year periodsand outperformed the average forthe five-year period.
Subadviser fee comparative datanot provided due to limited sizeof Broadridge peer group for thispurpose.
Net management fees for thisTrust are higher than the peergroup median.
Net total expenses for this Trustare lower than the peer groupmedian.
The Board took into accountmanagement’s discussion of thefactors that contributed to theTrust’s one-, three- and five-yearperformance relative to thebenchmark index and to the peergroup average for the one- andthree-year periods.
The Board noted the Trust’sfavorable performance relative tothe peer group average for thefive-year period.
The Board took into accountmanagement’s discussion of theTrust’s expenses. The Board notedthe Trust’s net total expenses arelower than the peer groupmedian.
John Hancock Variable Insurance TrustAppendix A
153
Portfolio(Subadviser)
Performance asof 12.31.2016 Fees and Expenses Comments
Blue Chip Growth Trust
(T. Rowe Price Associates, Inc.)
Benchmark Index — The Trustunderperformed the benchmarkindex for the one- and three-yearperiods and outperformed for thefive-year period.
Broadridge Category — The Trustunderperformed the average forthe one-year period andoutperformed the average for thethree- and five-year periods.
Subadviser fees for this Trust arehigher than the peer groupmedian.
Net management fees for thisTrust are higher than the peergroup median.
Net total expenses for this Trustare lower than the peer groupmedian.
The Board took into accountmanagement’s discussion of thefactors that contributed to theTrust’s one- and three-yearperformance relative to thebenchmark index and to the peergroup average for the one-yearperiod.
The Board noted the Trust’sfavorable performance relative tothe benchmark index for thefive-year period and to the peergroup average for the three- andfive-year periods.
The Board took into accountmanagement’s discussion of theTrust’s expenses noting thateffective July 1, 2017 themanagement fee will be reduceddecreasing the expenses of theTrust. The Board noted the Trust’snet total expenses are lower thanthe peer group median.
Capital Appreciation Trust
(Jennison Associates LLC)
Benchmark Index — The Trustunderperformed the benchmarkindex for the one-, three- andfive-year periods.
Broadridge Category — The Trustunderperformed the average forthe one-year period, andoutperformed the average for thethree- and five-year periods.
Subadvisory fee comparative datanot provided due to limited sizeof Broadridge peer group for thispurpose.
Net management fees for thisTrust are higher than the peergroup median.
Net total expenses for this Trustare lower than the peer groupmedian.
The Board took into accountmanagement’s discussion of thefactors that contributed to theTrust’s one-, three- and five-yearperformance relative to thebenchmark index and to the peergroup average for the one-yearperiod.
The Board noted the Trust’sfavorable performance relative thebenchmark index year-to-date andto the peer group average for thethree- and five-year periods.
The Board took into accountmanagement’s discussion of theFund’s expenses. The Board notedthe Fund’s net total expenses arelower than the peer groupmedian.
John Hancock Variable Insurance TrustAppendix A
154
Portfolio(Subadviser)
Performance asof 12.31.2016 Fees and Expenses Comments
Capital Appreciation Value Trust
(T. Rowe Price Associates, Inc.)
Benchmark Index — The Trustunderperformed the benchmarkindex for the one-year period andoutperformed the benchmarkindex for the three- and five-yearperiods.
Broadridge Category — The Trustoutperformed the average for theone-, three- and five-year periods.
Subadviser fees for this Trust arehigher than the peer groupmedian.
Net management fees for thisTrust are higher than the peergroup median.
Net total expenses for this Trustare higher than the peer groupmedian.
The Board took into accountmanagement’s discussion of thefactors that contributed to theTrust’s one-year performancerelative to the benchmark index.
The Board noted the Trust’sfavorable performance relative tothe benchmark index for thethree- and five-year periods andto the peer group average for theone-, three- and five-year periods.
The Board took into accountmanagement’s discussion of theTrust’s expenses.
Core Strategy Trust
(Manulife Asset Management(U.S.))
(Manulife Asset Management(North America))
Benchmark Index — The Trustunderperformed the benchmarkindex for the one-, three- andfive-year periods.
Broadridge Category — The Trustoutperformed the average for theone- and three-year periods andunderperformed the average forthe five-year period.
Subadviser fee comparative datanot provided due to limited sizeof Broadridge peer group for thispurpose.
Net management fees for thisTrust are lower than the peergroup median.
Net total expenses for this Trustare lower than the peer groupmedian.
The Board took into accountmanagement’s discussion of thefactors that contributed to theTrust’s one-, three- and five-yearperformance relative to thebenchmark index and to the peergroup average for the five-yearperiod.
The Board noted the Trust’sfavorable performance relative tothe peer group average for theone- and three-year period.
The Board noted the Trust’s netmanagement fees and net totalexpenses are lower than the peergroup median.
Emerging Markets Value Trust
(Dimensional Fund Advisors LP)
Benchmark Index — The Trustoutperformed the benchmarkindex for the one-year period andunderperformed the three- andfive-year periods.
Broadridge Category — The Trustoutperformed the average for theone-year period andunderperformed for the three-and five-year periods.
Subadviser fee comparative datanot provided due to limited sizeof Broadridge peer group for thispurpose.
Net management fees for thisTrust are lower than the peergroup median.
Net total expenses for this Trustare lower than the peer groupmedian.
The Board took into accountmanagement’s discussion of thefactors that contributed to theTrust’s three- and five-yearperformance relative to thebenchmark index and to its peergroup average.
The Board noted the Trust’sfavorable performance relative toits benchmark index and to itspeer group average for the one-year period.
The Board noted the Trust’s netmanagement fees and net totalexpenses are lower than the peergroup median.
John Hancock Variable Insurance TrustAppendix A
155
Portfolio(Subadviser)
Performance asof 12.31.2016 Fees and Expenses Comments
Equity Income Trust
(T. Rowe Price Associates, Inc.)
Benchmark Index — The Trustoutperformed the benchmarkindex for the one-year period andunderperformed the benchmarkindex for the three-and five-yearperiods.
Broadridge Category — The Trustoutperformed the average for theone- and five-year periods andunderperformed the average forthe three-year period.
Subadviser fees for this Trust arehigher than the peer groupmedian.
Net management fees for thisTrust are higher than the peergroup median.
Net total expenses for this Trustare lower than the peer groupmedian.
The Board took into accountmanagement’s discussion of thefactors that contributed to theTrust’s three- and five-yearperformance relative to thebenchmark index and to the peergroup average for the three-yearperiod.
The Board noted the Trust’sfavorable performance relative tothe benchmark index for theone-year period and to the peergroup average for the one- andfive-year periods.
The Board took into accountmanagement’s discussion of theTrust’s expenses. The Board notedthe Trust’s net total expenses arelower than the peer groupmedian.
Financial Industries Trust
(Manulife Asset Management(U.S.))
Benchmark Index — The Trustunderperformed the benchmarkindex for the one-, three- andfive-year periods.
Broadridge Category — The Trustunderperformed the average forthe one-, three- and five-yearperiods.
Subadviser fee comparative datanot provided due to limited sizeof Broadridge peer group for thispurpose.
Net management fees for thisTrust are higher than the peergroup median.
Net total expenses for this Trustare higher than the peer groupmedian.
The Board took into accountmanagement’s discussion of thefactors that contributed to theTrust’s one-, three-, and five-yearperformance relative to thebenchmark index and to the peergroup average.
The Board took into accountmanagement’s discussion of theFund’s expenses.
Fundamental All Cap Core Trust
(Manulife Asset Management(U.S.))
Benchmark Index — The Trustunderperformed the benchmarkindex for the one- and three-yearperiods, and outperformed for thefive-year period.
Broadridge Category — The Trustoutperformed the average for theone-, three- and five-year periods.
The subadviser fees for this Trustare lower than the peer groupmedian.
Net management fees for thisTrust are lower than the peergroup median.
Net total expenses for this Trustare lower than the peer groupmedian.
The Board took into accountmanagement’s discussion of thefactors that contributed to theTrust’s one- and three-yearperformance relative to thebenchmark index.
The Board noted the Trust’sfavorable performance relative tothe benchmark index for thefive-year period and to the peergroup average for the one-, three-and five-year periods.
The Board noted the Trust’s netmanagement fees and net totalexpenses are lower than the peergroup median.
John Hancock Variable Insurance TrustAppendix A
156
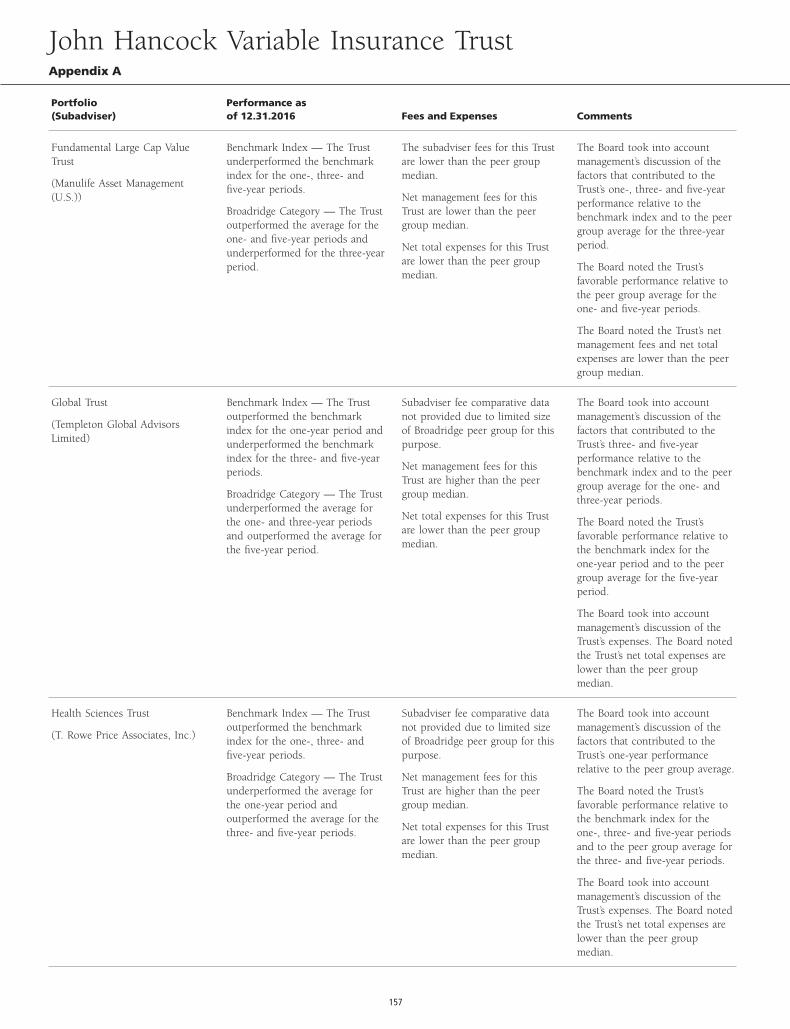
Portfolio(Subadviser)
Performance asof 12.31.2016 Fees and Expenses Comments
Fundamental Large Cap ValueTrust
(Manulife Asset Management(U.S.))
Benchmark Index — The Trustunderperformed the benchmarkindex for the one-, three- andfive-year periods.
Broadridge Category — The Trustoutperformed the average for theone- and five-year periods andunderperformed for the three-yearperiod.
The subadviser fees for this Trustare lower than the peer groupmedian.
Net management fees for thisTrust are lower than the peergroup median.
Net total expenses for this Trustare lower than the peer groupmedian.
The Board took into accountmanagement’s discussion of thefactors that contributed to theTrust’s one-, three- and five-yearperformance relative to thebenchmark index and to the peergroup average for the three-yearperiod.
The Board noted the Trust’sfavorable performance relative tothe peer group average for theone- and five-year periods.
The Board noted the Trust’s netmanagement fees and net totalexpenses are lower than the peergroup median.
Global Trust
(Templeton Global AdvisorsLimited)
Benchmark Index — The Trustoutperformed the benchmarkindex for the one-year period andunderperformed the benchmarkindex for the three- and five-yearperiods.
Broadridge Category — The Trustunderperformed the average forthe one- and three-year periodsand outperformed the average forthe five-year period.
Subadviser fee comparative datanot provided due to limited sizeof Broadridge peer group for thispurpose.
Net management fees for thisTrust are higher than the peergroup median.
Net total expenses for this Trustare lower than the peer groupmedian.
The Board took into accountmanagement’s discussion of thefactors that contributed to theTrust’s three- and five-yearperformance relative to thebenchmark index and to the peergroup average for the one- andthree-year periods.
The Board noted the Trust’sfavorable performance relative tothe benchmark index for theone-year period and to the peergroup average for the five-yearperiod.
The Board took into accountmanagement’s discussion of theTrust’s expenses. The Board notedthe Trust’s net total expenses arelower than the peer groupmedian.
Health Sciences Trust
(T. Rowe Price Associates, Inc.)
Benchmark Index — The Trustoutperformed the benchmarkindex for the one-, three- andfive-year periods.
Broadridge Category — The Trustunderperformed the average forthe one-year period andoutperformed the average for thethree- and five-year periods.
Subadviser fee comparative datanot provided due to limited sizeof Broadridge peer group for thispurpose.
Net management fees for thisTrust are higher than the peergroup median.
Net total expenses for this Trustare lower than the peer groupmedian.
The Board took into accountmanagement’s discussion of thefactors that contributed to theTrust’s one-year performancerelative to the peer group average.
The Board noted the Trust’sfavorable performance relative tothe benchmark index for theone-, three- and five-year periodsand to the peer group average forthe three- and five-year periods.
The Board took into accountmanagement’s discussion of theTrust’s expenses. The Board notedthe Trust’s net total expenses arelower than the peer groupmedian.
John Hancock Variable Insurance TrustAppendix A
157
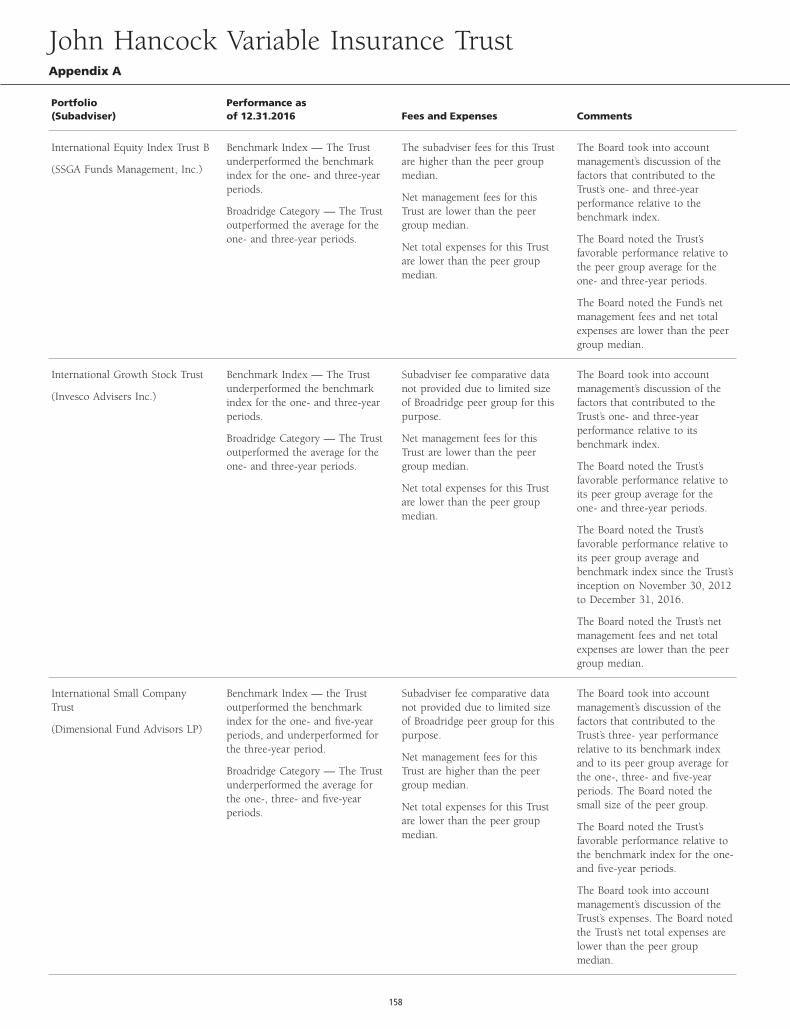
Portfolio(Subadviser)
Performance asof 12.31.2016 Fees and Expenses Comments
International Equity Index Trust B
(SSGA Funds Management, Inc.)
Benchmark Index — The Trustunderperformed the benchmarkindex for the one- and three-yearperiods.
Broadridge Category — The Trustoutperformed the average for theone- and three-year periods.
The subadviser fees for this Trustare higher than the peer groupmedian.
Net management fees for thisTrust are lower than the peergroup median.
Net total expenses for this Trustare lower than the peer groupmedian.
The Board took into accountmanagement’s discussion of thefactors that contributed to theTrust’s one- and three-yearperformance relative to thebenchmark index.
The Board noted the Trust’sfavorable performance relative tothe peer group average for theone- and three-year periods.
The Board noted the Fund’s netmanagement fees and net totalexpenses are lower than the peergroup median.
International Growth Stock Trust
(Invesco Advisers Inc.)
Benchmark Index — The Trustunderperformed the benchmarkindex for the one- and three-yearperiods.
Broadridge Category — The Trustoutperformed the average for theone- and three-year periods.
Subadviser fee comparative datanot provided due to limited sizeof Broadridge peer group for thispurpose.
Net management fees for thisTrust are lower than the peergroup median.
Net total expenses for this Trustare lower than the peer groupmedian.
The Board took into accountmanagement’s discussion of thefactors that contributed to theTrust’s one- and three-yearperformance relative to itsbenchmark index.
The Board noted the Trust’sfavorable performance relative toits peer group average for theone- and three-year periods.
The Board noted the Trust’sfavorable performance relative toits peer group average andbenchmark index since the Trust’sinception on November 30, 2012to December 31, 2016.
The Board noted the Trust’s netmanagement fees and net totalexpenses are lower than the peergroup median.
International Small CompanyTrust
(Dimensional Fund Advisors LP)
Benchmark Index — the Trustoutperformed the benchmarkindex for the one- and five-yearperiods, and underperformed forthe three-year period.
Broadridge Category — The Trustunderperformed the average forthe one-, three- and five-yearperiods.
Subadviser fee comparative datanot provided due to limited sizeof Broadridge peer group for thispurpose.
Net management fees for thisTrust are higher than the peergroup median.
Net total expenses for this Trustare lower than the peer groupmedian.
The Board took into accountmanagement’s discussion of thefactors that contributed to theTrust’s three- year performancerelative to its benchmark indexand to its peer group average forthe one-, three- and five-yearperiods. The Board noted thesmall size of the peer group.
The Board noted the Trust’sfavorable performance relative tothe benchmark index for the one-and five-year periods.
The Board took into accountmanagement’s discussion of theTrust’s expenses. The Board notedthe Trust’s net total expenses arelower than the peer groupmedian.
John Hancock Variable Insurance TrustAppendix A
158
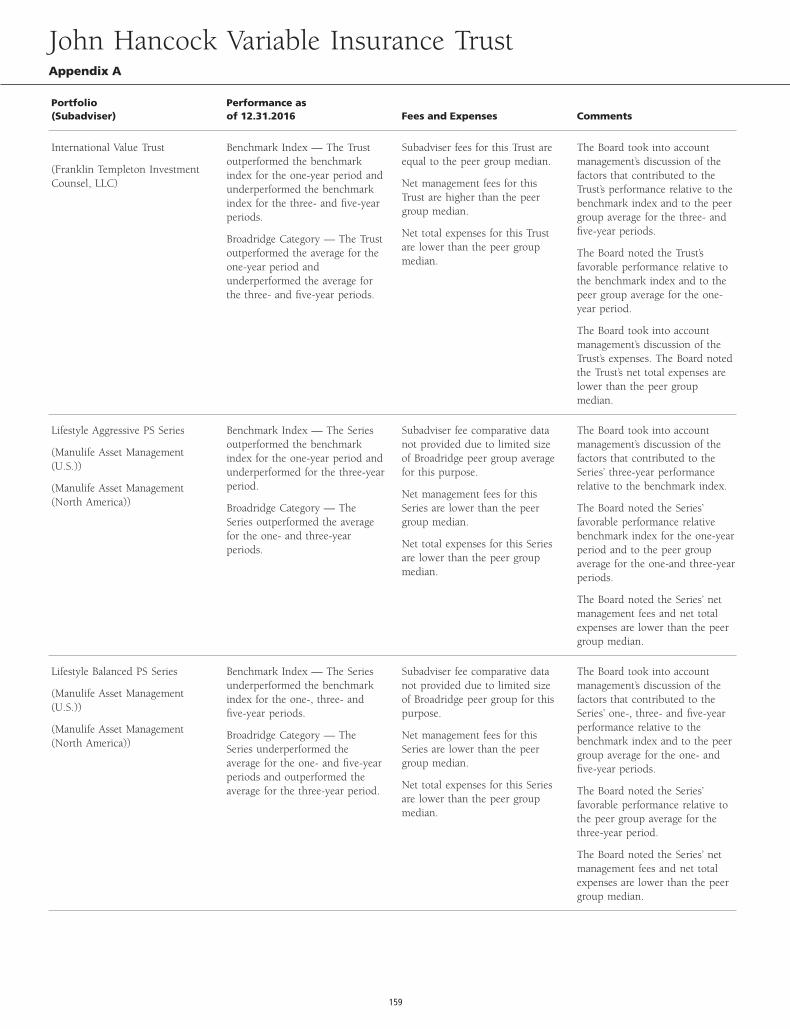
Portfolio(Subadviser)
Performance asof 12.31.2016 Fees and Expenses Comments
International Value Trust
(Franklin Templeton InvestmentCounsel, LLC)
Benchmark Index — The Trustoutperformed the benchmarkindex for the one-year period andunderperformed the benchmarkindex for the three- and five-yearperiods.
Broadridge Category — The Trustoutperformed the average for theone-year period andunderperformed the average forthe three- and five-year periods.
Subadviser fees for this Trust areequal to the peer group median.
Net management fees for thisTrust are higher than the peergroup median.
Net total expenses for this Trustare lower than the peer groupmedian.
The Board took into accountmanagement’s discussion of thefactors that contributed to theTrust’s performance relative to thebenchmark index and to the peergroup average for the three- andfive-year periods.
The Board noted the Trust’sfavorable performance relative tothe benchmark index and to thepeer group average for the one-year period.
The Board took into accountmanagement’s discussion of theTrust’s expenses. The Board notedthe Trust’s net total expenses arelower than the peer groupmedian.
Lifestyle Aggressive PS Series
(Manulife Asset Management(U.S.))
(Manulife Asset Management(North America))
Benchmark Index — The Seriesoutperformed the benchmarkindex for the one-year period andunderperformed for the three-yearperiod.
Broadridge Category — TheSeries outperformed the averagefor the one- and three-yearperiods.
Subadviser fee comparative datanot provided due to limited sizeof Broadridge peer group averagefor this purpose.
Net management fees for thisSeries are lower than the peergroup median.
Net total expenses for this Seriesare lower than the peer groupmedian.
The Board took into accountmanagement’s discussion of thefactors that contributed to theSeries’ three-year performancerelative to the benchmark index.
The Board noted the Series’favorable performance relativebenchmark index for the one-yearperiod and to the peer groupaverage for the one-and three-yearperiods.
The Board noted the Series’ netmanagement fees and net totalexpenses are lower than the peergroup median.
Lifestyle Balanced PS Series
(Manulife Asset Management(U.S.))
(Manulife Asset Management(North America))
Benchmark Index — The Seriesunderperformed the benchmarkindex for the one-, three- andfive-year periods.
Broadridge Category — TheSeries underperformed theaverage for the one- and five-yearperiods and outperformed theaverage for the three-year period.
Subadviser fee comparative datanot provided due to limited sizeof Broadridge peer group for thispurpose.
Net management fees for thisSeries are lower than the peergroup median.
Net total expenses for this Seriesare lower than the peer groupmedian.
The Board took into accountmanagement’s discussion of thefactors that contributed to theSeries’ one-, three- and five-yearperformance relative to thebenchmark index and to the peergroup average for the one- andfive-year periods.
The Board noted the Series’favorable performance relative tothe peer group average for thethree-year period.
The Board noted the Series’ netmanagement fees and net totalexpenses are lower than the peergroup median.
John Hancock Variable Insurance TrustAppendix A
159
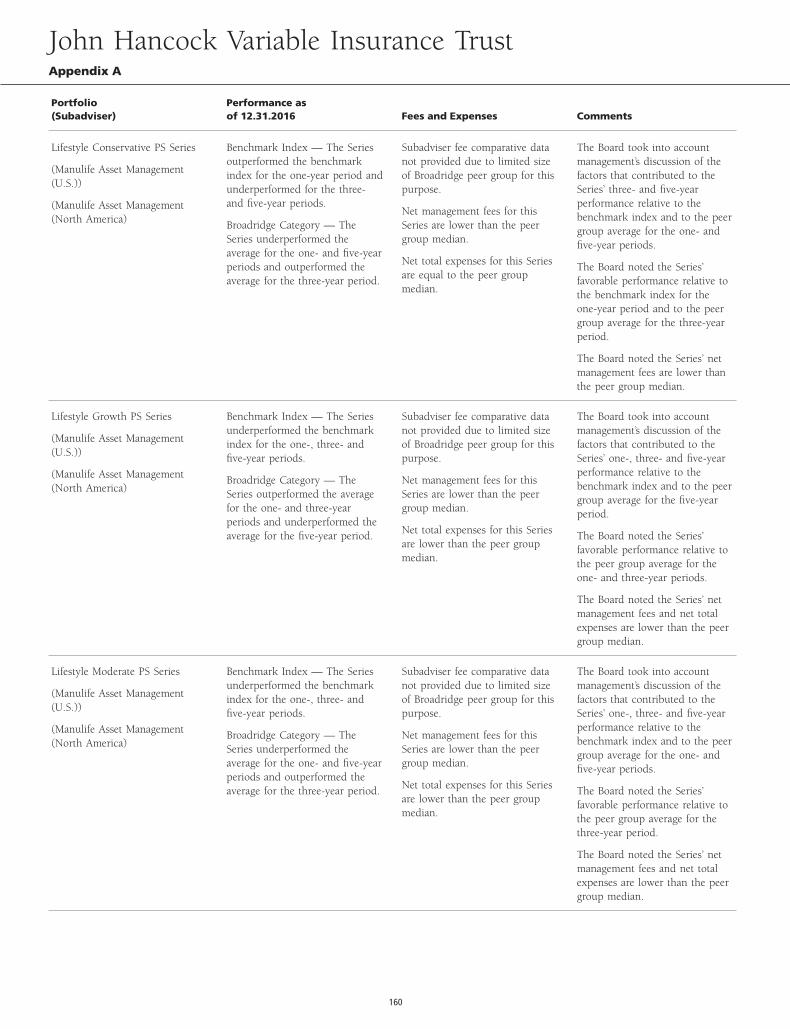
Portfolio(Subadviser)
Performance asof 12.31.2016 Fees and Expenses Comments
Lifestyle Conservative PS Series
(Manulife Asset Management(U.S.))
(Manulife Asset Management(North America)
Benchmark Index — The Seriesoutperformed the benchmarkindex for the one-year period andunderperformed for the three-and five-year periods.
Broadridge Category — TheSeries underperformed theaverage for the one- and five-yearperiods and outperformed theaverage for the three-year period.
Subadviser fee comparative datanot provided due to limited sizeof Broadridge peer group for thispurpose.
Net management fees for thisSeries are lower than the peergroup median.
Net total expenses for this Seriesare equal to the peer groupmedian.
The Board took into accountmanagement’s discussion of thefactors that contributed to theSeries’ three- and five-yearperformance relative to thebenchmark index and to the peergroup average for the one- andfive-year periods.
The Board noted the Series’favorable performance relative tothe benchmark index for theone-year period and to the peergroup average for the three-yearperiod.
The Board noted the Series’ netmanagement fees are lower thanthe peer group median.
Lifestyle Growth PS Series
(Manulife Asset Management(U.S.))
(Manulife Asset Management(North America)
Benchmark Index — The Seriesunderperformed the benchmarkindex for the one-, three- andfive-year periods.
Broadridge Category — TheSeries outperformed the averagefor the one- and three-yearperiods and underperformed theaverage for the five-year period.
Subadviser fee comparative datanot provided due to limited sizeof Broadridge peer group for thispurpose.
Net management fees for thisSeries are lower than the peergroup median.
Net total expenses for this Seriesare lower than the peer groupmedian.
The Board took into accountmanagement’s discussion of thefactors that contributed to theSeries’ one-, three- and five-yearperformance relative to thebenchmark index and to the peergroup average for the five-yearperiod.
The Board noted the Series’favorable performance relative tothe peer group average for theone- and three-year periods.
The Board noted the Series’ netmanagement fees and net totalexpenses are lower than the peergroup median.
Lifestyle Moderate PS Series
(Manulife Asset Management(U.S.))
(Manulife Asset Management(North America)
Benchmark Index — The Seriesunderperformed the benchmarkindex for the one-, three- andfive-year periods.
Broadridge Category — TheSeries underperformed theaverage for the one- and five-yearperiods and outperformed theaverage for the three-year period.
Subadviser fee comparative datanot provided due to limited sizeof Broadridge peer group for thispurpose.
Net management fees for thisSeries are lower than the peergroup median.
Net total expenses for this Seriesare lower than the peer groupmedian.
The Board took into accountmanagement’s discussion of thefactors that contributed to theSeries’ one-, three- and five-yearperformance relative to thebenchmark index and to the peergroup average for the one- andfive-year periods.
The Board noted the Series’favorable performance relative tothe peer group average for thethree-year period.
The Board noted the Series’ netmanagement fees and net totalexpenses are lower than the peergroup median.
John Hancock Variable Insurance TrustAppendix A
160
Portfolio(Subadviser)
Performance asof 12.31.2016 Fees and Expenses Comments
Mid Cap Index Trust
(Manulife Asset Management(North America))
Benchmark Index — The Trustunderperformed the benchmarkindex for the one-, three- andfive-year periods.
Broadridge Category — The Trustoutperformed the average for theone-, three- and five-year periods.
Subadviser fee comparative datanot provided due to limited sizeof Broadridge peer group for thispurpose.
Net management fees for thisTrust are higher than the peergroup median.
Net total expenses for this Trustare lower than the peer groupmedian.
The Board took into accountmanagement’s discussion of thefactors that contributed to theTrust’s one-, three- and five-yearperformance relative to thebenchmark index.
The Board noted the Trust’sfavorable performance relative tothe peer group average for theone-, three- and five-year periodsand to the Morningstar peergroup year-to-date.
The Board took into accountmanagement’s discussion of theFund’s expenses. The Board notedthe Fund’s net total expenses arelower than the peer groupmedian.
Mid Cap Stock Trust
(Wellington ManagementCompany LLP)
Benchmark Index — The Trustunderperformed the benchmarkindex for the one-, three- andfive-year periods.
Broadridge Category — The Trustunderperformed the average forthe one- and three-year periodsand outperformed the average forthe five-year period.
Subadviser fee comparative datanot provided due to limited sizeof Broadridge peer group for thispurpose.
Net management fees for thisTrust are higher than the peergroup median.
Net total expenses for this Trustare lower than the peer groupmedian.
The Board took into accountmanagement’s discussion of thefactors that contributed to theTrust’s one-, three- and five-yearperformance relative to thebenchmark index and to the peergroup average for the one- andthree-year periods.
The Board noted the Trust’sfavorable performance relative tothe peer group average for thefive-year period.
The Board took into accountmanagement’s discussion of theTrust’s expenses. The Board notedthe Trust’s net total expenses arelower than the peer groupmedian.
Mid Value Trust
(T. Rowe Price Associates, Inc.)
Benchmark Index — The Trustoutperformed the benchmarkindex for the one-, three- andfive-year periods.
Broadridge Category — The Trustoutperformed the average for theone-, three- and five-year periods.
Subadviser fee comparative datanot provided due to limited sizeof Broadridge peer group for thispurpose.
Net management fees for thisTrust are higher than the peergroup median.
Net total expenses for this Trustare lower than the peer groupmedian.
The Board noted the Trust’sfavorable performance relative tothe benchmark index and to thepeer group average for the one-,three- and five-year periods.
The Board took into accountmanagement’s discussion of theTrust’s expenses. The Board notedthe Trust’s net total expenses arelower than the peer groupmedian.
John Hancock Variable Insurance TrustAppendix A
161
Portfolio(Subadviser)
Performance asof 12.31.2016 Fees and Expenses Comments
Mutual Shares Trust
(Franklin Mutual Advisers, LLC)
Benchmark Index — The Trustoutperformed the benchmarkindex for the one-year period andunderperformed the benchmarkindex for the three- and five-yearperiods.
Broadridge Category — The Trustoutperformed the average for theone-, three- and five-year periods.
Subadviser fee comparative datanot provided due to limited sizeof Broadridge peer group for thispurpose.
Net management fees for thisTrust are higher than the peergroup median.
Net total expenses for this Trustare lower than the peer groupmedian.
The Board took into accountmanagement’s discussion of thefactors that contributed to theTrust’s three- and five-yearperformance relative to thebenchmark index.
The Board noted the Trust’sfavorable performance relative tothe benchmark index for theone-year period and to the peergroup average for the one-, three-and five-year periods.
The Board took into accountmanagement’s discussion of theTrust’s expenses. The Board notedthe Trust’s net total expenses arelower than the peer groupmedian.
Real Estate Securities Trust
(Deutsche InvestmentManagement Americas, Inc./RREEF America, LLC)
Benchmark Index — The Trustunderperformed the benchmarkindex for the one-, three- andfive-year periods.
Broadridge Category — The Trustoutperformed the average for theone-, three- and five-year periods.
Subadviser fees for this Trust arelower than the peer groupmedian.
Net management fees for thisTrust are lower than the peergroup median.
Net total expenses for this Trustare lower than the peer groupmedian.
The Board took into accountmanagement’s discussion of thefactors that contributed to theTrust’s one-, three- and five-yearperformance relative to thebenchmark index.
The Board noted the Trust’sfavorable performance relative tothe benchmark year-to-date andto the peer group average for theone-, three- and five-year periods.
The Board noted the Fund’s netmanagement fees and net totalexpenses are lower than the peergroup median.
Science & Technology Trust
(Allianz Global Investors U.S. LLC
T. Rowe Price Associates, LLC)
Benchmark Index — The Trustunderperformed the benchmarkindex for the one-year period andoutperformed the benchmarkindex for the three- and five-yearperiods.
Broadridge Category — The Trustunderperformed the average forthe one- and three-year periodsand outperformed the average forthe five-year period.
Subadviser fee comparative datanot provided due to limited sizeof Broadridge peer group for thispurpose.
Net management fees for thisTrust are higher than the peergroup median.
Net total expenses for this Trustare lower than the peer groupmedian.
The Board took into accountmanagement’s discussion of thefactors that contributed to theTrust’s one-year performancerelative to the benchmark indexand to the peer group average forthe one- and three-year periods.
The Board noted the Trust’sfavorable performance relative tothe benchmark index for thethree- and five-year periods andto the peer group average for thefive-year period.
The Board took into accountmanagement’s discussion of theTrust’s expenses. The Board notedthe Trust’s net total expenses arelower than the peer groupmedian.
John Hancock Variable Insurance TrustAppendix A
162
Portfolio(Subadviser)
Performance asof 12.31.2016 Fees and Expenses Comments
Small Cap Growth Trust
(Wellington ManagementCompany LLP)
Benchmark Index — The Trustunderperformed the benchmarkindex for the one-, three- andfive-year periods.
Broadridge Category — The Trustunderperformed the average forthe one-, three- and five-yearperiods.
Subadviser fees for this Trust arehigher than the peer groupmedian.
Net management fees for thisTrust are higher than the peergroup median.
Net total expenses for this Trustare lower than the peer groupmedian.
The Board took into accountmanagement’s discussion of thefactors that contributed to theTrust’s one-, three- and five-yearperformance relative to thebenchmark index and to the peergroup average.
The Board took into accountmanagement’s discussion of theTrust’s expenses noting thateffective July 1, 2017 themanagement fee will be reduceddecreasing the expenses of theTrust. The Board noted the Trust’snet total expenses are lower thanthe peer group median.
Small Cap Index Trust
(Manulife Asset Management(North America))
Benchmark Index — The Trustunderperformed the benchmarkindex for the one-, three- andfive-year periods.
Broadridge Category — The Trustunderperformed the average forthe one-, three- and five-yearperiod.
Subadviser fee comparative datanot provided due to limited sizeof Broadridge peer group for thispurpose.
Net management fees for thisTrust are higher than the peergroup median.
Net total expenses for this Trustare lower than the peer groupmedian.
The Board took into accountmanagement’s discussion of thefactors that contributed to theTrust’s one-, three- and five-yearperformance relative to thebenchmark index and to the peergroup average.
The Board noted the Trust’sfavorable performance relative tothe Morningstar peer group forthe quarter-to-date, three-monthand year-to-date periods.
The Board took into accountmanagement’s discussion of theFund’s expenses. The Board notedthe Fund’s net total expenses arelower than the peer groupmedian.
Small Cap Opportunities Trust
(Invesco Advisers Inc.
Dimensional Fund Advisors LP)
Benchmark Index — The Trustunderperformed the benchmarkindex for the one-, three- andfive-year periods.
Broadridge Category — The Trustunderperformed the average forthe one-, three-and five-yearperiods.
Subadviser fee comparative datanot provided due to limited sizeof Broadridge peer group for thispurpose.
Net management fees for thisTrust are higher than the peergroup median.
Net total expenses for this Trustare lower than the peer groupmedian.
The Board took into accountmanagement’s discussion of thefactors that contributed to theTrust’s one-, three- and five-yearperformance relative to itsbenchmark index and its peergroup average.
The Board took into accountmanagement’s discussion of theTrust’s expenses. The Board notedthe Trust’s net total expenses arelower than the peer group median
John Hancock Variable Insurance TrustAppendix A
163
Portfolio(Subadviser)
Performance asof 12.31.2016 Fees and Expenses Comments
Small Cap Value Trust
(Wellington ManagementCompany LLP)
Benchmark Index — The Trustunderperformed the benchmarkindex for the one- and five-yearperiods and outperformed thebenchmark index for the three-year period.
Broadridge Category — The Trustunderperformed the average forthe one-year period andoutperformed the average for thethree- and five-year periods.
Subadviser fee comparative datanot provided due to limited sizeof Broadridge peer group for thispurpose.
Net management fees for thisTrust are higher than the peergroup median.
Net total expenses for this Trustare higher than the peer groupmedian.
The Board took into accountmanagement’s discussion of thefactors that contributed to theTrust’s one- and five-yearperformance relative to thebenchmark index and to the peergroup average for the one-yearperiod.
The Board noted the Trust’sfavorable performance relative tothe benchmark index for thethree-year period and to the peergroup average for the three- andfive-year periods.
The Board took into accountmanagement’s discussion of theTrust’s expenses.
Small Company Growth Trust
(Invesco Advisers Inc.)
Benchmark Index — The Trustoutperformed the benchmarkindex for the one-, three- andfive-year periods.
Broadridge Category — The Trustoutperformed the average for theone-, three- and five-year periods.
Subadviser fee comparative datanot provided due to limited sizeof Broadridge peer group for thispurpose.
Net management fees for thisTrust are higher than the peergroup median.
Net total expenses for this Trustare higher than the peer groupmedian.
The Board noted the Trust’sfavorable performance relative toits benchmark index and to itspeer group average for the one-,three- and five-year periods.
The Board took into accountmanagement’s discussion of theTrust’s expenses.
Small Company Value Trust
(T. Rowe Price Associates, Inc.)
Benchmark Index — The Trustoutperformed the benchmarkindex for one-year period andunderperformed the benchmarkindex for the three- and five-yearperiods.
Broadridge Category — The Trustoutperformed the average for theone- and three-year periods andunderperformed the average forthe five-year period.
Subadviser fee comparative datanot provided due to limited sizeof Broadridge peer group for thispurpose.
Net management fees for thisTrust are higher than the peergroup median.
Net total expenses for this Trustare higher than the peer groupmedian.
The Board took into accountmanagement’s discussion of thefactors that contributed to theTrust’s three- and five-yearperformance relative to thebenchmark index and to the peergroup average for the five-yearperiod.
The Board noted the Trust’sfavorable performance relative tothe benchmark index for theone-year period and to the peergroup average for the one- andthree-year periods.
The Board took into accountmanagement’s discussion of theTrust’s expenses.
John Hancock Variable Insurance TrustAppendix A
164
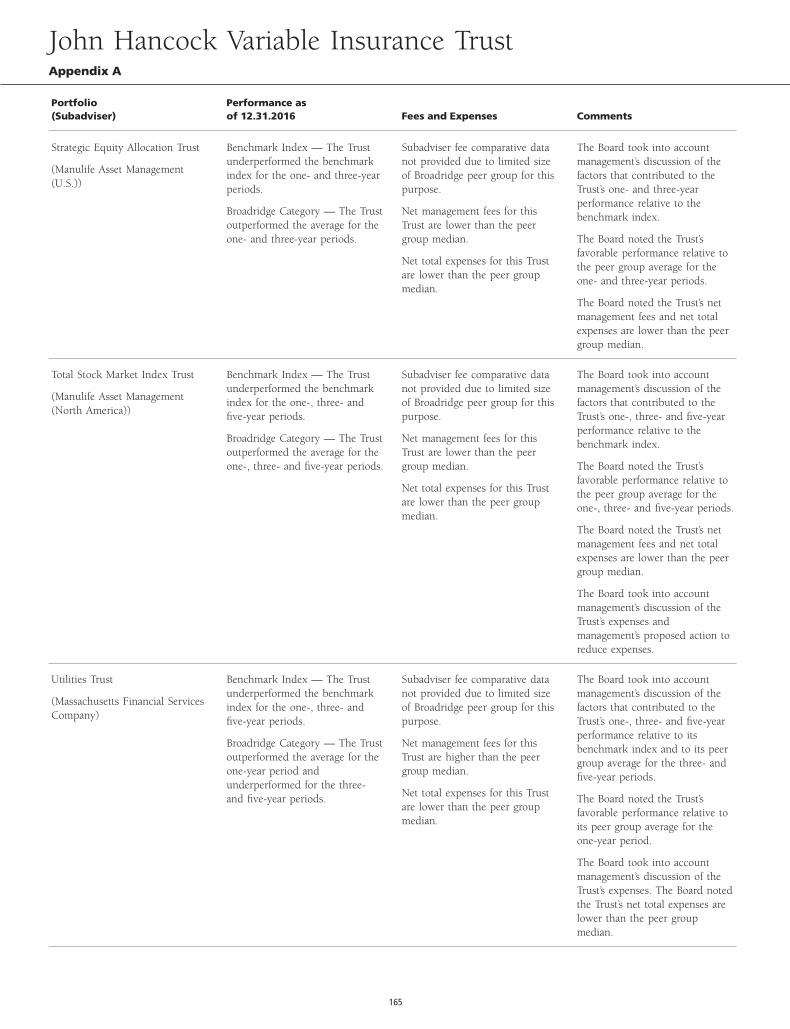
Portfolio(Subadviser)
Performance asof 12.31.2016 Fees and Expenses Comments
Strategic Equity Allocation Trust
(Manulife Asset Management(U.S.))
Benchmark Index — The Trustunderperformed the benchmarkindex for the one- and three-yearperiods.
Broadridge Category — The Trustoutperformed the average for theone- and three-year periods.
Subadviser fee comparative datanot provided due to limited sizeof Broadridge peer group for thispurpose.
Net management fees for thisTrust are lower than the peergroup median.
Net total expenses for this Trustare lower than the peer groupmedian.
The Board took into accountmanagement’s discussion of thefactors that contributed to theTrust’s one- and three-yearperformance relative to thebenchmark index.
The Board noted the Trust’sfavorable performance relative tothe peer group average for theone- and three-year periods.
The Board noted the Trust’s netmanagement fees and net totalexpenses are lower than the peergroup median.
Total Stock Market Index Trust
(Manulife Asset Management(North America))
Benchmark Index — The Trustunderperformed the benchmarkindex for the one-, three- andfive-year periods.
Broadridge Category — The Trustoutperformed the average for theone-, three- and five-year periods.
Subadviser fee comparative datanot provided due to limited sizeof Broadridge peer group for thispurpose.
Net management fees for thisTrust are lower than the peergroup median.
Net total expenses for this Trustare lower than the peer groupmedian.
The Board took into accountmanagement’s discussion of thefactors that contributed to theTrust’s one-, three- and five-yearperformance relative to thebenchmark index.
The Board noted the Trust’sfavorable performance relative tothe peer group average for theone-, three- and five-year periods.
The Board noted the Trust’s netmanagement fees and net totalexpenses are lower than the peergroup median.
The Board took into accountmanagement’s discussion of theTrust’s expenses andmanagement’s proposed action toreduce expenses.
Utilities Trust
(Massachusetts Financial ServicesCompany)
Benchmark Index — The Trustunderperformed the benchmarkindex for the one-, three- andfive-year periods.
Broadridge Category — The Trustoutperformed the average for theone-year period andunderperformed for the three-and five-year periods.
Subadviser fee comparative datanot provided due to limited sizeof Broadridge peer group for thispurpose.
Net management fees for thisTrust are higher than the peergroup median.
Net total expenses for this Trustare lower than the peer groupmedian.
The Board took into accountmanagement’s discussion of thefactors that contributed to theTrust’s one-, three- and five-yearperformance relative to itsbenchmark index and to its peergroup average for the three- andfive-year periods.
The Board noted the Trust’sfavorable performance relative toits peer group average for theone-year period.
The Board took into accountmanagement’s discussion of theTrust’s expenses. The Board notedthe Trust’s net total expenses arelower than the peer groupmedian.
John Hancock Variable Insurance TrustAppendix A
165
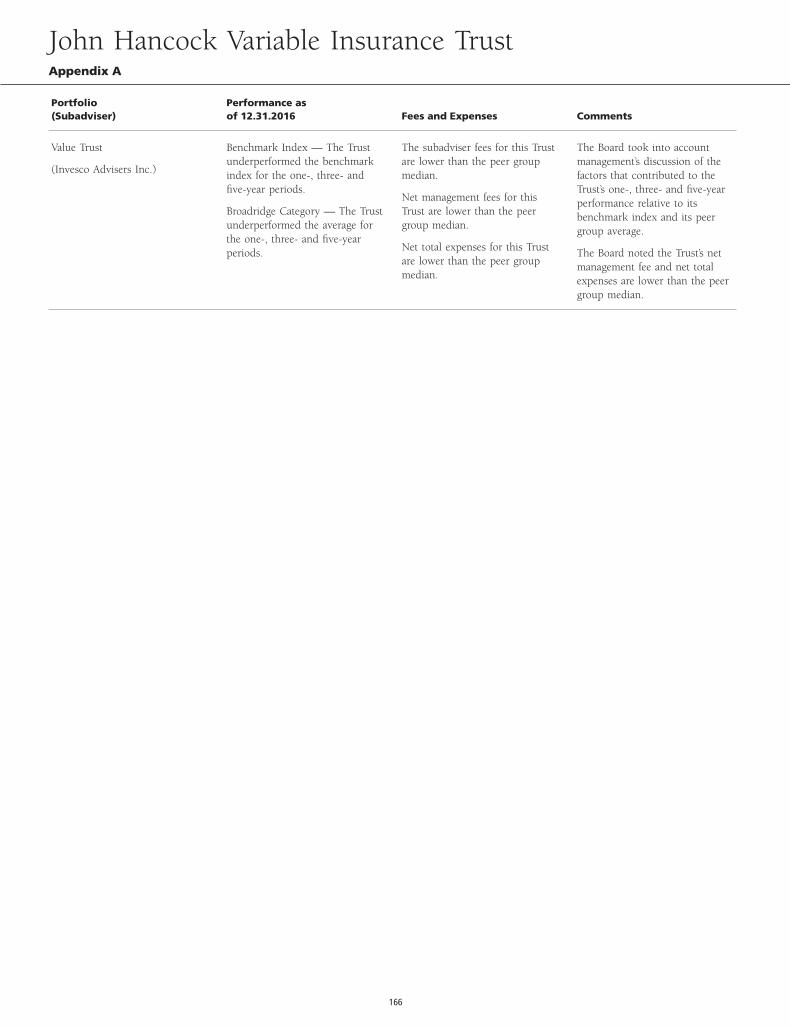
Portfolio(Subadviser)
Performance asof 12.31.2016 Fees and Expenses Comments
Value Trust
(Invesco Advisers Inc.)
Benchmark Index — The Trustunderperformed the benchmarkindex for the one-, three- andfive-year periods.
Broadridge Category — The Trustunderperformed the average forthe one-, three- and five-yearperiods.
The subadviser fees for this Trustare lower than the peer groupmedian.
Net management fees for thisTrust are lower than the peergroup median.
Net total expenses for this Trustare lower than the peer groupmedian.
The Board took into accountmanagement’s discussion of thefactors that contributed to theTrust’s one-, three- and five-yearperformance relative to itsbenchmark index and its peergroup average.
The Board noted the Trust’s netmanagement fee and net totalexpenses are lower than the peergroup median.
John Hancock Variable Insurance TrustAppendix A
166

The Statement of Additional Information, a separate document with supplemental information not contained in the prospectus, includes additional information on the Board of Trusteesand can be obtained without charge by calling 800-344-1029 or on the Securities and Exchange Commission (SEC) website at sec.gov.
PROXY VOTING POLICY A description of the trust’s proxy voting policies and procedures and information regarding how the trust voted proxies relating to portfolio securities duringthe most recent twelve-month period ended June 30 is available without charge, upon request, by calling 800-344-1029 or on the SEC website at sec.gov.
QUARTERLY PORTFOLIO DISCLOSURE The trust files a complete schedule of portfolio holdings with the SEC for the first and third quarters of each fiscal year on Form N-Q. The trust’sForm N-Q is available electronically on the SEC website (sec.gov); hard copies may be reviewed and copied at the SEC’s Public Reference Room, 450 Fifth Street, N.W., Washington, DC20549. For more information on the Public Reference Room, call 800-SEC-0330.
The report is certified under the Sarbanes-Oxley Act, which requires mutual funds and other public companies to affirm that, to the best of their knowledge, the information in their financialreports is fairly and accurately stated in all material respects.
John Hancock Variable Insurance TrustFor more information
167
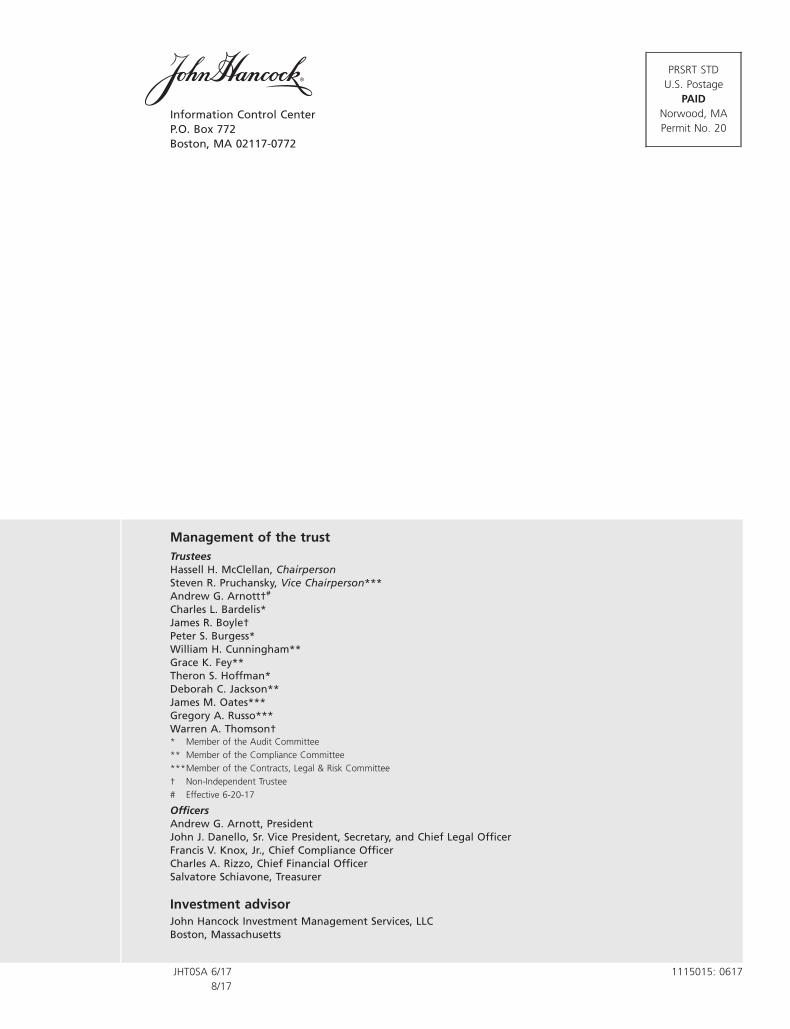
Information Control CenterP.O. Box 772Boston, MA 02117-0772
Management of the trustTrusteesHassell H. McClellan, ChairpersonSteven R. Pruchansky, Vice Chairperson***Andrew G. Arnott†#
Charles L. Bardelis*James R. Boyle†Peter S. Burgess*William H. Cunningham**Grace K. Fey**Theron S. Hoffman*Deborah C. Jackson**James M. Oates***Gregory A. Russo***Warren A. Thomson†* Member of the Audit Committee** Member of the Compliance Committee***Member of the Contracts, Legal & Risk Committee† Non-Independent Trustee# Effective 6-20-17
OfficersAndrew G. Arnott, PresidentJohn J. Danello, Sr. Vice President, Secretary, and Chief Legal OfficerFrancis V. Knox, Jr., Chief Compliance OfficerCharles A. Rizzo, Chief Financial OfficerSalvatore Schiavone, Treasurer
Investment advisorJohn Hancock Investment Management Services, LLCBoston, Massachusetts
JHT0SA 6/17 1115015: 06178/17
PRSRT STDU.S. Postage
PAIDNorwood, MAPermit No. 20
Related Documents