Accepted Manuscript Title: Variability in the structure of epiphytic assemblages of Posidonia oceanica in relation to human interferences in the Gulf of Gabes, Tunisia Authors: Mounir Ben Brahim, Asma Hamza, Imen Hannachi, Ahmed Rebai, Othman Jarboui, Abderrahmen Bouain, Lotfi Aleya PII: S0141-1136(10)00120-0 DOI: 10.1016/j.marenvres.2010.08.005 Reference: MERE 3471 To appear in: Marine Environmental Research Received Date: 25 March 2010 Revised Date: 31 July 2010 Accepted Date: 16 August 2010 Please cite this article as: Ben Brahim, M., Hamza, A., Hannachi, I., Rebai, A., Jarboui, O., Bouain, A., Aleya, L. Variability in the structure of epiphytic assemblages of Posidonia oceanica in relation to human interferences in the Gulf of Gabes, Tunisia, Marine Environmental Research (2010), doi: 10.1016/ j.marenvres.2010.08.005 This is a PDF file of an unedited manuscript that has been accepted for publication. As a service to our customers we are providing this early version of the manuscript. The manuscript will undergo copyediting, typesetting, and review of the resulting proof before it is published in its final form. Please note that during the production process errors may be discovered which could affect the content, and all legal disclaimers that apply to the journal pertain.

Welcome message from author
This document is posted to help you gain knowledge. Please leave a comment to let me know what you think about it! Share it to your friends and learn new things together.
Transcript

Accepted Manuscript
Title: Variability in the structure of epiphytic assemblages of Posidonia oceanica inrelation to human interferences in the Gulf of Gabes, Tunisia
Authors: Mounir Ben Brahim, Asma Hamza, Imen Hannachi, Ahmed Rebai, OthmanJarboui, Abderrahmen Bouain, Lotfi Aleya
PII: S0141-1136(10)00120-0
DOI: 10.1016/j.marenvres.2010.08.005
Reference: MERE 3471
To appear in: Marine Environmental Research
Received Date: 25 March 2010
Revised Date: 31 July 2010
Accepted Date: 16 August 2010
Please cite this article as: Ben Brahim, M., Hamza, A., Hannachi, I., Rebai, A., Jarboui, O., Bouain, A.,Aleya, L. Variability in the structure of epiphytic assemblages of Posidonia oceanica in relation to humaninterferences in the Gulf of Gabes, Tunisia, Marine Environmental Research (2010), doi: 10.1016/j.marenvres.2010.08.005
This is a PDF file of an unedited manuscript that has been accepted for publication. As a service toour customers we are providing this early version of the manuscript. The manuscript will undergocopyediting, typesetting, and review of the resulting proof before it is published in its final form. Pleasenote that during the production process errors may be discovered which could affect the content, and alllegal disclaimers that apply to the journal pertain.

Variability in the structure of epiphytic assemblages of Posidonia oceanica in relation to 1
human interferences in the Gulf of Gabes, Tunisia 2
3
4
5
Mounir Ben Brahim1, 2, Asma Hamza 2, Imen Hannachi 1, 2, Ahmed Rebai3, Othman Jarboui2, 6
Abderrahmen Bouain1 and Lotfi Aleya*4 7
8
9
1 Université de Sfax, Faculté des Sciences Sfax. Route Soukra Km 3.5, BP: 802, 3018 Sfax. 10
Tunisia 11
2 Institut National des Sciences et Technologies de la Mer, Centre de Sfax, Rue Madagascar, 12
BP 1035, Sfax, CP 3018, Tunisie. 13
3 Centre de Biotechnologie de Sfax, Route Sidi Mansour Km 6, Sfax, Tunisie 14
4 Université de Franche-Comté, Laboratoire de Chrono-Environnement, UMR CNRS 6249 1, 15
Place Leclerc, F-25030 Besançon cedex, France. 16
17
*Corresponding author: [email protected] 18
Phone: 03 81 66 57 64 19
Fax: 03 81 66 57 97 20
21
22
23
24
25
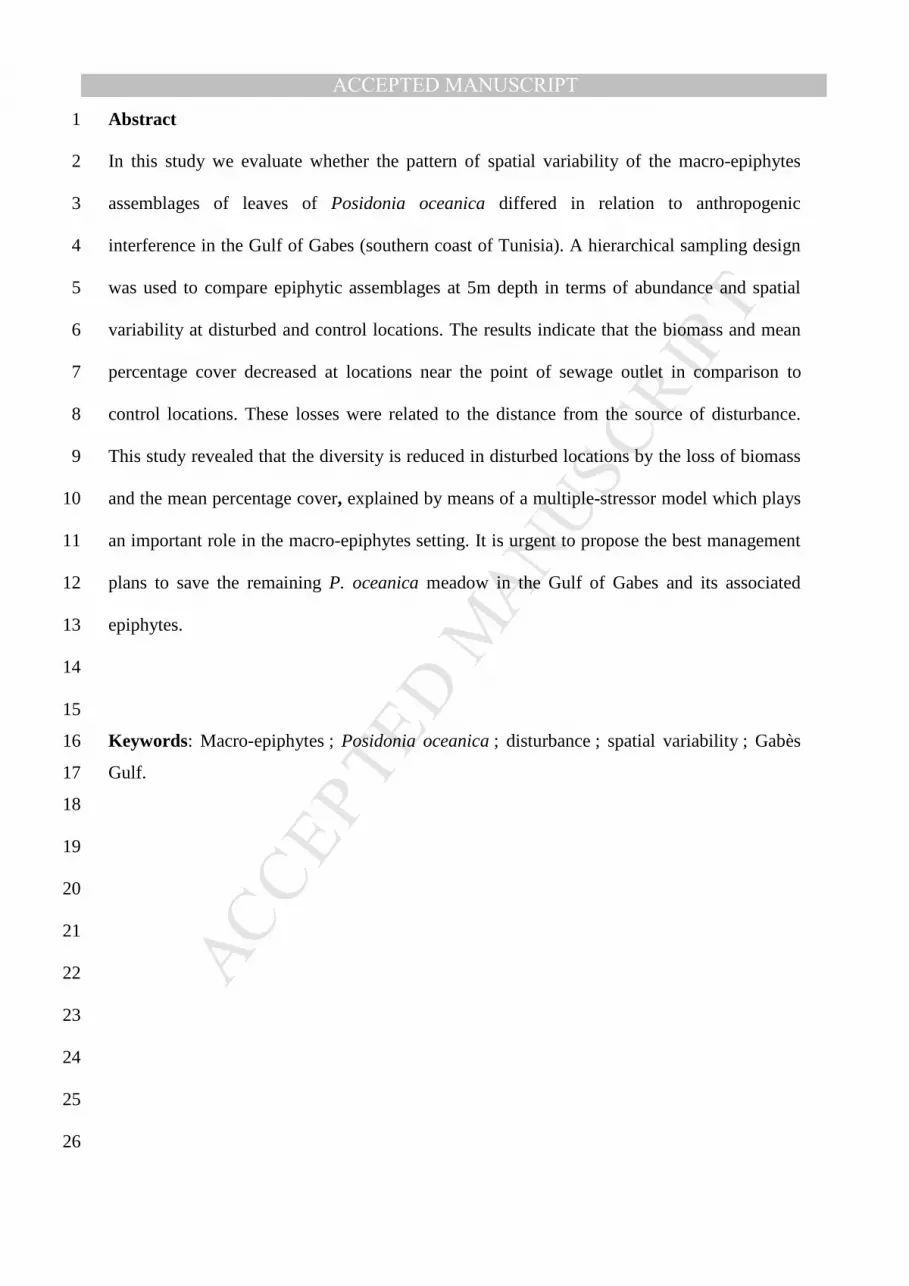
Abstract 1
In this study we evaluate whether the pattern of spatial variability of the macro-epiphytes 2
assemblages of leaves of Posidonia oceanica differed in relation to anthropogenic 3
interference in the Gulf of Gabes (southern coast of Tunisia). A hierarchical sampling design 4
was used to compare epiphytic assemblages at 5m depth in terms of abundance and spatial 5
variability at disturbed and control locations. The results indicate that the biomass and mean 6
percentage cover decreased at locations near the point of sewage outlet in comparison to 7
control locations. These losses were related to the distance from the source of disturbance. 8
This study revealed that the diversity is reduced in disturbed locations by the loss of biomass 9
and the mean percentage cover, explained by means of a multiple-stressor model which plays 10
an important role in the macro-epiphytes setting. It is urgent to propose the best management 11
plans to save the remaining P. oceanica meadow in the Gulf of Gabes and its associated 12
epiphytes. 13
14
15
Keywords: Macro-epiphytes ; Posidonia oceanica ; disturbance ; spatial variability ; Gabès 16
Gulf. 17
18
19
20
21
22
23
24
25
26

1. Introduction 1
Over the past 20 years, the Gulf of Gabes, on the southeast coast of Tunisia, has produced 2
more than 65% of the annual fish yield in Tunisia (Ben Mustapha, 1995; C.G.P., 1996), being 3
favoured by widespread seagrass beds widely recognized as key ecosystems in temperate and 4
tropical infra littoral habitats (Hemminga and Duarte, 2000; Boudouresque et al., 2009). 5
However, fish production is gradually decreasing parallel to the decline of littoral beds of the 6
endemic Mediterranean seagrass Posidonia oceanica (L.) Delile species as the coastal area of 7
the Gulf is now a threatened biotope mainly due to the pressure of anthropogenic expansion 8
and dumping of large quantities of phosphogypsum and other chemical products which 9
severely impacted benthic habitats ((Hamza-Chaffai et al., 1999, Bejaoui et al., 2004). The 10
loss of the native vegetable cover in the Gulf of Gabes is estimated at 90% with the P. 11
oceanica beds being replaced by the opportunistic and caulerpenyne-producing green algae 12
Caulerpa prolifera (Forsskål) Lamouroux in deeper zones (Hamza et al., 1995; Ramos-Espla 13
et al., 2000). The remaining Posidonia meadows cover the littoral fringes at depths ranging 14
between -3 and -4 m (Hattour et al., 1998). On the other hand, most biological studies of the 15
Gulf of Gabes have dealt with the distribution of phytoplankton (Drira et al., 2008; Bel 16
Hassen et al., 2009) zooplankton (Drira et al., 2009) ciliates (Kchaou et al., 2009; Hannachi et 17
al., 2009), demosponges (Ben Mustapha et al., 2003) while seagrass species and their 18
epiphytes which are known to be highly sensitive to environmental changes (Balata et al., 19
2007; Prado et al., 2008; Montefalcone, 2009) have been given limited attention. Epiphytes of 20
seagrass not only contribute significantly to the primary production of the meadow (Buia et 21
al., 1992; Nelson and Waaland, 1997; Duarte et al., 2004), but are also more sensitive to 22
environmental changes than the plant host (Delgado et al., 1999; Nesti et al., 2008; 23
Giovannetti et al., 2010). For example, various studies reported increases in epiphyte biomass 24
parallel with nutrient enrichment (Armitage et al., 2006; Neckles et al., 1993), eutrophication 25

(Balata et al., 2008; Frankovich et al., 2009) and water quality (Meric et al., 2005). 1
Differences in the spatial heterogeneity of epiphytes (Piazzi et al., 2004; Martínez-Crego et 2
al., 2010) and shifts in species composition (Nesti et al., 2008; Fourqurean et al., 2010) have 3
also been observed. It is widely known that the distribution of epiphytic assemblages of P. 4
oceanica both on leaves (Van der Ben., 1971; Mazzella et al., 1989) and rhizomes (Piazzi et 5
al., 2002; Balata et al., 2008) can change, but these changes have not yet been explored on a 6
horizontal scale in the Gulf of Gabes. Differences in the spatial heterogeneity of epiphytes 7
(Piazzi et al., 2004) and shifts in species composition (Nesti et al., 2008; Fourqurean et al., 8
2010; Martínez-Crego et al., 2010) have also been observed. Several findings have provided 9
evidence that epiphytes are patchy at 1 to 10 cm (Kendrick and Burt, 1997; Jernakoff and 10
Neilsen, 1998) and > kilometer scales, (Vanderklift and Lavery 2000, Lavery and Vanderklift 11
2002), other studies have indicated that epiphytes may be uniform at relatively small spatial 12
scales (e.g., 0.1 m Vanderklift and Lavery 2000; <10 m, Saunders et al., 2003, Piazzi et al., 13
2004). Moore et al. (2006) reported that epiphytes biomass is uniform at the scale < 100 m 14
transect. Variability in leaves epiphytic biomass at the scale of meters may be relatable to 15
differences in shoot density (Gambi et al., 1989), and to impacts of water movements on both 16
settlement and recruitment of propagules (Trautman and Borowitzka, 1999; Vanderklift and 17
Lavery, 2000). It is, therefore, of importance to undertake a study of the effects of urban 18
pressure on P. oceanica dynamics under the impact of human activities versus control 19
conditions. To our knowledge, only the flowering and fructification of P. oceanica along the 20
coastline of the Gulf of Gabes has been the subject of studies in recent years (Hattour et al., 21
1998). As part of a comprehensive study intended to understand the dramatic decline of the 22
endemic Mediterranean seagrass P. oceanica in the Gulf of Gabes, we analyzed, for the first 23
time in this ecosystem, the structure and patterns of spatial variability of leaf macro-epiphytic 24
assemblages and tested their relationships with anthropogenic disturbance. We attempted to 25

answer the questions 1) how vulnerable are the leaf macro-epiphytic assemblages to these 1
environmental pressures? 2) Does epiphyte biomass increase parallel with organic and 2
nutrient enrichment and which members of the epiphytic community should be considered as 3
most sensitive species? And 3) Does anthropogenic disturbance modify the spatial scales at 4
which variability of the epiphytic communities is highest/lowest or also influences the 5
partition of total variability among spatial scales? We, thus, compared epiphytic assemblages 6
between locations exposed to urban and industrial effluents and control locations, and 7
examined their variability at spatial scales ranging from cm to km, using a hierarchical 8
sampling design (Underwood, 1994; Chapman et al., 1995). 9
10
2. Material and methods 11
2.1. Study area 12
The Gulf of Gabes is located between 35° N and 33° N and extends from “Ras kapoudia” at 13
the 35° N parallel level to the Tunisian-Libyan border (Fig. 1). It shelters various islands 14
(Kerkennah and Djerba) and lagoons (Bougrara and El Bibane). The climate is dry (average 15
precipitation: 210 mm year-1) and sunny with strong easterly winds. The tide is semidiurnal, 16
with a maximum range of about 2 m. 17
2.2. Sampling 18
Because the P. oceanica epiphytic community reaches its optimum seasonal development in 19
summer (Romero, 1988) fieldwork was conducted in July-August 2006. Four locations distant 20
30 km from each other were chosen for the samplings. The depth of all stations was 5 m and 21
temperature and salinity ranges were 27°C-30°C and 38-40 P.S.U., respectively. Two 22
locations were disturbed by a sewage discharge: Ghannouch (34° 30' 523'' N 10° 54' 743'' E) 23
and Zarrat (33º 43'417'' N 10º 20' 486'' E) labeled herein respectively, D1 and D2. The other 24

two: Hassar (34° 44' 290'' N 11° 08' 590'' E) and Ajim (33° 45' 112'' N 10° 42' 992'' E) were 1
control locations, located north and south of the disturbed area and labeled respectively, C1 2
and C2. Within each location (D1, D2, C1, C2), three sites were randomly selected, 500-600 3
m apart, and within each site two sub-sites were also randomly selected. Each sub-site was 4
randomly divided into three plots, each plot then being divided into three quadrats 20 cm 5
apart. We examined variability at tens of centimeter-scale by collecting samples from the 6
same quadrat. This quadrat was 20 cm × 20 cm and divided into a grid of 10 cm × 10 cm sub-7
quadrats. 8
2.3. Data collection 9
The density of P. oceanica shoots was estimated from 216 replicates present within 100 cm² 10
sub-quadrats inside each meadow. Five shoots were randomly collected from each sub-11
quadrat during SCUBA diving and preserved in seawater-formalin (5%) solution for species 12
identification in the laboratory. Leaf length corresponds in fact to the average evaluated from 13
each meadow. The samples were examined for leaf surface per shoot and the coverage 14
(expressed as a percentage of leaf surface) of each morphological group which was estimated 15
with a binocular lens, then carefully scraped with a razor blade (Libes, 1986). Epiphytes and 16
scraped leaves were oven-dried at 60 °C for 48 h before weighing (Alcoverro et al., 1997; 17
Lepoint et al., 1999). 18
2.4. Data analysis 19
Multivariate analysis (MPMANOVA) was used to test the hypothesis that the structure of 20
epiphytic assemblages differed between disturbed and control locations and to evaluate 21
variability at different spatial scales (Anderson, 2001). The analysis consisted of a 6-way 22
model with sites (three levels) being nested within locations (two levels), subsites (two levels) 23
being nested within sites, plots (three levels) being nested within subsites, quadrats being 24
nested within plots and sub-quadrats (four levels) being nested within quadrats. Sites, 25

subsites, plots and quadrats were random whereas the contrast of disturbed versus control and 1
the disturbed were fixed. All data were transformed to ln (x + 1) to remove heterogeneity of 2
variances (after Cochran’s C-test). SIMPER analysis (Clarke, 1993) was used to identify the 3
percentage contribution of each species to the Bray-Curtis dissimilarity between the average 4
of the disturbed and the control locations. A two-dimensional nMDS (non-metric 5
multidimensional scaling), based on the centroids of the sites of the four locations, was used 6
for a graphical representation of the data for leaf epiphytic assemblages. 7
Variance components of all assemblages were calculated for each location and for all spatial 8
scales. A discriminant analysis was used for classifying the different meadows into one 9
among possible K classes. These classes were identified by linear combinations of the 10
variables maximizing the homogeneity of each class. The test Wilks' lambda was employed to 11
test whether there are differences between the means of identified groups of subjects among a 12
combination of dependent variables. 13
Epiphyte biomass was standardized by shoot biomass to be able to compare epiphyte load 14
among locations. This is necessary because a significant positive correlation was found 15
between epiphyte biomass and leaf biomass (Fig. 2), allowing us to express epiphyte biomass 16
as gdw epiphytes /gdw of leaves. Differences in epiphytic biomass and the percentage cover of 17
the main phyla or morphological groups were analyzed through 6-way ANOVA with the 18
same factors and levels used in the multivariate analysis. Student-Newman-Keuls (SNK) test 19
was employed for a posteriori multiple comparisons of means. 20
3. Results 21
A total of 49 taxa were identified in the epiphyte assemblages of control locations: 20 22
Macroalgae (11 Rhodophyta, 6 Cyanobacteria, 2 Chlorophyta, 1 Heterokontophyta), 11 23
Bryozoa, 9 Cnidaria (Hydrozoans), 3 Annelida, 2 Tunicata and 3 Porifera. A total of 32 taxa 24
were identified in the epiphyte assemblages of disturbed locations: 13 Macroalgae (7 25

Rhodophyta, 4 Cyanobacteria, 1 Chlorophyta, 1 Heterokontophyta), 9 Bryozoa, 8 Cnidaria 1
(Hydrozoans), 1 Annelida and 1 Tunicata (Appendix 1). In control locations, leaf assemblages 2
were dominated by filamentous algae belonging to the genera Polysiphonia, Ceramium and 3
Antithamnion; common algal species were also present such as Dasycladus vermicularis, 4
Cladophora sp., Griffithsia opuntoides, Neomonospora sp. and Laurencia obtusa. Among 5
animals, the Bryozoans Alcyonidium and Electra Posidoniae dominated the community. The 6
Tunicata Botryllus schlosseri and Clavelina lepadiformis were numerically dominant. Among 7
the Cnidaria the most abundant species were Dynamina cavolinii, Monotheca sp. and 8
Aglaophenia sp. For encrusting Annelida the genus Spirorbis was the dominant genus, and for 9
the Porifera the genus Ircinia dominated the Porifera assemblage. In disturbed locations, leaf 10
assemblages were dominated by filamentous algae belonging to genera Antithamnion and 11
Polysiphonia; other common algal species were also present such as Laurencia obtusa, 12
dictyota dichotoma and Ceramium gracillimum. Among Bryozoa the genera Alcyonidium, 13
Scrupocellaria and Bowerbankia were the most abundant. The Cnidaria Dynamena and 14
Obelia were the most abundant genera. For the encrusting Annelida, the genus Spirorbis 15
dominated the assemblage. 16
There was a difference between the two disturbed locations; the location Ghannouch was 17
more affected than the location Zarrat, the number of species and the mean percentage cover 18
were reduced for the majority of taxa. We noted the absence of Aetea truncata, Micropora 19
complanata. Filamentous algae, namely Ceramium tenuissimum, Neomonospora sp. and 20
Dasya sp. were absent in the location of Ghannouch. 21
The high mean value of shoot density (1022 ± 54.23 shoot m-²) was recorded in the site 1 of 22
Hassar location (C1), whereas the lowest mean value (119.5 ± 17.67 shoot m-²) has been 23
detected in site 1 of Ghannouch location (D1) (Fig. 3). The lowest mean value of the leaf 24
surface area (205.28 ± 5.56 cm² shoot -1) was recorded in the site 1 of the location Ghannouch 25

(D1), whereas the hightest mean value (467.28 ± 5.82 cm² shoot -1) was detected in the site 2 1
of the location Ghannouch (D1) (Fig. 4). 2
The hightest mean value of leaf length (59.68 ± 7.87 cm) was recorded in the site b of the 3
control location Hassar (C1), whearas le lowest mean value (29.2 ± 4.87 cm) was observed in 4
the site a of the disturbed location Ghannouch (D1) (Fig. 5). 5
ANOVA analysis showed that for density, leaf surface area and leaf length there was a 6
significant difference between (i) locations and (ii) between the contrast ‘disturbed vs. 7
control’ locations. For leaf surface area and leaf length, no significant difference could be 8
detected in the disturbed and the control locations separately. The difference was not 9
significant for shoot density among the control locations (Table 1). The disturbed location D1 10
has a lower mean epiphyte biomass (gdw epiphytes /gdw of leaves) than the location D2; this 11
value ranging between 0.02 ± 0.07 and 0.1 ± 0.08 gdw epiphytes /gdw of leaves at D1, and 12
between 0.25 ± 0.07 and 0.38 ± 0.09 gdw epiphytes /gdw of leaves in the location D2. In the 13
control location C1, the mean epiphyte biomass varied between 0.46 ± 0.01 and 0.63 ±±±± 0.03 14
gdw epiphytes /gdw of leaves and between 0.33 ± 0.17 and 0.38 ± 0.19 gdw epiphytes /gdw of 15
leaves in the location C2 (Fig. 6). 16
Epiphyte biomass vs. leaf biomass displayed a fairly similar relationship in all locations, 17
suggesting that the leaf biomass pattern and hence the leaf surface availability was an 18
important factor governing the epiphytic biomass pattern as also reported by Borowitzka et al. 19
(2006) (Fig. 2). The two control locations C1 and C2 had the upper slope whereas the 20
disturbed locations present the lower what strongly suggests that anthropogenic disturbance 21
affects epiphyte load (Test of homogeneity of slope between control and disturbed locations; 22
F(n=3) = 430.07; p = 0.00002). Analyses of variance indicate a wide variability in the epiphytic 23
biomass among locations, sites, subsites and quadrats, whereas variation at the scale plot was 24
insignificant (Table 2). Variation between the two disturbed locations was important for both 25

the largest and the smallest scales (quadrat), whereas significant difference was detected only 1
at the subsite and quadrat scale for the control locations. The structure of epiphytic 2
assemblage of leaves differed between the contrast of disturbed vs. control locations (Table 3
3), while no significant difference was observed among disturbed and control location 4
separately. Significant difference was observed in particular at the smallest scales plots and 5
quadrats. Epiphytes were generally abundant on leaves of P. oceanica (Fig. 7). Algae, 6
bryozoans and encrusting Annelida were common and abundant at all locations. Also 7
hydrozoans were widespread, but their percentage cover was generally low. The two 8
disturbed meadows were different from each other with an extra variability in percentage 9
covered in hydrozoans. Four morphological groups of organisms were sufficiently abundant 10
to be included in univariate analyses. For example, and concerning the percentage cover of 11
filamentous algae and hydrozoans, we recorded a significant difference between (i) locations 12
when considered separately and between (ii) the contrast ‘disturbed vs. control locations’. For 13
encrusting Annelida a significant difference was detected only for the scale locations when 14
considered separately, whereas, no significant difference was found for the contrast ‘disturbed 15
vs. control locations’. For bryozoans, there was no significant difference between these two 16
scales (Table 4). On a scale site, a significant variability was detected for encrusting Annelida. 17
At the scale subsite, a significant variability was detected for algae, whereas at the scale plot, 18
variability was detected for all parameters. For the scale quadrat, a difference was significant 19
for all variables but no difference was found between the percentage covers of disturbed and 20
control locations. 21
nMDS ordination of leaf assemblages at the four locations showed a clear separation between 22
the centroids based on sites of each control and disturbed locations (Fig. 8). The species 23
responsible for the difference between disturbed and control locations changed. For example, 24
the cover percentages of the algae Antithamnion sp., Polysiphonia elongata, Ceramium 25

tenuissimum and Ceramium codii, the bryozoans such as Micropora complanata and the 1
hydrozoan Dynamena cavolinii increased on leaves in the control locations, though some 2
species showed similar trends in these locations (Table 5). 3
Biomass, epiphytic leaf assemblages and the four abundant morphological groups of epiphyte 4
displayed different responses to the spatial variability among different scales at the disturbed 5
and the control locations (Table 6). Variance components indicated that most of the variability 6
occurred not only at the plot scale but also between locations and quadrats, with the exception 7
of biomass that displayed larger variation at the quadrat scale in disturbed locations. 8
Discriminate analysis, for both disturbed and control locations showed that there was a 9
strongly significant variation including all the factors of the P. oceanica meadows. Wilks’ 10
lambda showed a high variability between locations for biomass, hydrozoans and density, and 11
high variability within locations especially for bryozoans (Table 7). 12
The projection on the first factorial design crossing the first two factorial discriminant axes 13
corresponding to the first two discriminating linear functions as in table 8, allows a 14
description and a classification of the characterized variables (Fig. 9). The first axis shows 15
discrimination between the two control and the two disturbed locations. The second axis 16
divides locations in three groups: the control location C1, the crossing of the two disturbed 17
locations, and the control location C2. 18
4. Discussion 19
The multivariate analysis illustrates a decrease in seagrass vitality (i.e. shoot density, leaf 20
surface area and leaf length) in disturbed versus control locations, thus indicating the inability 21
of disturbed meadows to withstand increasing urban interferences. Cancemi et al. (2003) and 22
Balestri et al. (2004) reported that the decline of the phenologic parameters used to assess the 23
seagrass bed vitality among the disturbed locations they sampled is function of the distance 24
from the disturbance source as compared to control locations. In fact, the mean biomass in the 25

inner Ghannouch location (D1) was lower than that recorded close to sewage outlet at Zarrat 1
location (D2). Similar results were reported by others (Short and Wyllie-Echeverria, 1996; 2
Leriche et al., 2006). We suspect the water column stability and the quality of sewage as 3
probably being the most important factor affecting the growth of P. oceanica in the coastal 4
disturbed area of the Gulf of Gabes. This is supported by at least two observations. First, the 5
disturbed locations D1 and D2, which have a muddy bottom, were mechanically turbulent 6
from the constant input of sewage outlet, conveying uniformity throughout the shallow water 7
column (Soussi and Mammoun, 1992; Zaouali, 1993), and therefore probably reducing leaf 8
photosynthetic activity (Mascaro et al., 2009). Decreases in shoot density and leaf length 9
related to decreases in light environment have already been reported from inner disturbed 10
locations (Ruiz and Romero, 2003). In contrast, Giovannetti et al. (2006) found no difference 11
in the shoot density, the Conservation Index and the epiphyte coverage between the control 12
(marine protected area) and the disturbed (urbanized area) locations examined in their study. 13
Only a shift in the epiphyte species composition was observed in the urban meadows 14
subjected to the increase of the sewage outfalls during summer, which showed a considerable 15
development of the brown algae. Indeed, Terrados et al. (2008) found no difference in shoot 16
density between the control and the disturbed locations that they sampled. However, these 17
authors studied locations that received inputs of nutrients and organic matter from only the 18
resident population (Giovannetti et al., 2006) and park visitors (Terrados et al., 2008), 19
whereas the Gulf of Gabes is exposed to a plethora of toxic inputs. For example, studies here 20
have reported high phosphogypsum concentration (10 g l-1) at the sewage outlet, which spread 21
over more than 60 km² (Bejaoui et al., 2004). Dissolution of phosphogypsum was carried out 22
by releasing cadmium and fluorine in sea water (Bejaoui et al., 2004), and cadmium has also 23
been shown to be toxic to clams in the Gulf of Gabes (Hamza-Chaffai et al., 1999; Smaoui-24
Damak et al., 2003, 2006). In the control locations Hassar and Ajim, P. oceanica beds seemed 25

healthy and no death was observed (Hattour et al., 1998; Ramos-Espla et al., 2000; Ben 1
Brahim et al., 2007). Also, since P. oceanica is very sensitive to low salinity in Tunisian 2
coastal regions such as the Gulf of Tunis (Northern Tunisia) (Ben Alaya, 1972), fresh waters 3
from sewage may also have lowered water salinity, thus affecting meadow growth too, but to 4
a lesser extent. 5
In terms of epiphytic leaf biomass, we also found the lowest mean biomass at the inner 6
disturbed Ghannouch location (D1). As previously mentioned for the meadow biomass, 7
increases in water turbidity in disturbed locations are also detrimental to leaf epiphytic 8
biomass since light is restricted (Cebrian et al., 1999). A similar general loss of epiphyte 9
biomass and the regression of P. oceanica meadow according to disturbance level has also 10
been reported (Cambrige and McComb, 1984; Guidetti, 2001; Piazzi et al., 2004). In addition, 11
macrograzers are known to feed preferentially on leaf tips where maximum epiphyte biomass 12
is reached (Alcoverro et al., 1997; Ruiz and Romero, 2003; Peterson et al., 2007). This may 13
have accounted, at least partially, for the natural loss of the epiphyte biomass both in 14
disturbed and control locations in the Gulf of Gabes. This decrease in epiphyte biomass was 15
also associated with a reduction of species sharing the epiphyte total biomass (49 species in 16
disturbed location vs 32 species in control locations, see Appendix). Our findings are also 17
supported by those of Mannino et al. (2010) who found a well-structured algal assemblage 18
close to the sea (with low anthropogenic pressure) compared to the locations subjected to 19
human disturbance. We, therefore, propose that in the Gulf of Gabes the spectrum of existing 20
conditions was narrow and thus unfavorable for the coexistence of a high number of species. 21
This is most likely due to toxicity from several compounds such as Cd (10-15 ppm, Soussi et 22
al., 1992) and, as previously mentioned, phosphogypsum with a sedimentary section reaching 23
50 cm in Ghannouch location. In addition, concentrations in hydrocarbon were relatively high 24
(between 882 µg g−1 and 4087 µg g−1) compared to those recorded from other coastal 25

Mediterranean sediments (Zaghden et al., 2005). The spatial distribution of these polluting 1
elements is favored by dominant winds (west-east in summer and north-east and south-west in 2
winter) which permanently induced not only the mixing of sediment but also the 3
remobilization of the surface deposits (Soussi et al 1992). Others have also reported a 4
decrease in the vitality of the Posidonia meadow due to trace metal pollution (Pergent-Martini 5
et Pergent, 2000; Ben Chikha, 2009). Furthermore, animals on leaves exhibited different 6
responses to disturbance. For example, encrusting Annelida and Bryozoa displayed a reduced 7
amount of variation in mean cover percentage at large spatial scales; in fact, the increase of 8
the relative dominance in mean cover near the sewage outlet indicates a functional change in 9
the assemblage related with the increase of the trophic component of micropredators 10
(Fraschetti et al., 2006). On the other hand, the sewage causes a significant decrease in terms 11
of mean cover of Hydrozoans as previously reported by Cifuentes et al. (2007). The 12
hydrozoan Gonothyraea gracilis and the two bryozoans Amathia lendigera and Beania 13
hirtissima (Bryozoa) were presumably the most sensitive species to environmental stress as 14
they were absent in the disturbed locations. We infer that this decrease is probably related to 15
the water turbulence close to the discharge which affected the availability of potential preys 16
such as zooplankton and particulate matter (Wahl, 1989; McKinney and Jackson, 1989; Ben 17
Brahim et al., unpublished). In addition, bryozoans and hydrozoans showed different 18
behavioral patterns related to the degree of disturbance, with bryozoans seeming more 19
adapted than hydrozoans to increased disturbance (McKinney and Jackson, 1989). Obviously, 20
further studies are needed, for example by comparing the response of different epiphytes taxa, 21
in order to elucidate the resilience of each group of epiphytes against disturbance levels and 22
their strategy facing disturbed conditions. The present study showed that the variation in both 23
the spatial pattern and abundance of macroalgal species, rather than their presence/absence, 24
are indicative of disturbance. For example, the assemblage of epiphytic algae dominated by 25

the Rhodophyta (order Ceramiales) tends to decrease in the two disturbed locations D1 and 1
D2. In this context, filamentous algae, especially the Ceramiales, may be considered the most 2
sensitive to disturbance. In other Mediterranean regions, Dictyotales were the dominant 3
species and grew abundantly in the disturbed sampled areas (Balata et al., 2007). On the other 4
hand, our results showed that the decrease of Ceramiales algae was paralleled with the 5
decrease of the green algae Dasycladus vermicularis, the cyanobacteria Lyngbia sp., Rivularia 6
sp., Gloeotrichia sp., Phormidium sp. and the red algae Dasya sp., Griffithsia sp. and 7
Pleonosporium sp., a decrease also paralleled with increases of anthropogenic disturbance. 8
Brown algae such as Myrionema orbiculare and Giraudia sphacelarioides are considered 9
characteristic of epiphyte community of P. oceanica leaves and have been already reported 10
along the northern Tunisian coast (Ribera et al., 1992). In many Mediterranean regions, M. 11
orbiculare was abundant (Giovannetti et al., 2006; Pardi et al., 2006; Sliskovic et al., 2010). 12
However, along the Tunisian coast this taxon was detected only in Bechateur which is located 13
in northern Tunisia (Menez and Mathieson, 1981). In the present study (southern Tunisia) 14
brown algae such as M. orbiculare, G. sphacelarioides were absent and only the species 15
Dictyota dichotoma was recorded. We infer that this absence might be related to the high 16
level of disturbance in the Gulf of Gabes. Our suggestion may be supported by the study of 17
Giovannetti et al. (2006) at Prelo cove in the Ligurian Sea (NW Mediterranean Sea) showing 18
that some brown algae such as Myrionema orbiculare, Giraudia sphacelarioides and 19
Fenestrulina johannae did not play a significant role in the epiphytic community structure, 20
whereas some Rhodophyta such as Hydrolithon-Pneophyllum spp. were the main epiphytes 21
that were present throughout the year at all stations. In control locations, leaf epiphytes 22
biomass of P. oceanica were most variable at the small scales investigated (among plots), 23
whereas variation at the intermediate scale (among sites, subsites) was negligible. In this 24
study, hierarchical sampling designs enabled an identification of homogeneity of epiphyte 25

assemblage distribution for the majority of functional groups and biomass among the scale 1
site (500-600 m), while heterogeneity is displayed at large scales among regions and at small 2
scales among plots. Our study supports the results of Pardi et al. (2006), and Piazzi et al. 3
(2004), in terms of variability of epiphyte load on Posidonia oceanica which was greatest at 4
the extremes of the spatial extents they investigated, with patchiness greatest at the among-5
shoot level (i.e. within quadrats), and at sites separated by a few hundred meters. Moore and 6
Fairweather (2006) and Balata et al. (2007) also considered that the epiphytes biomass within 7
the 100 m long transect sampled was homogenous, and more generally, Jernakoff and Neilsen 8
(1997) and Balestri et al. (2004) indicated that patchiness in epiphytes as well as in seagrass 9
morphology is significant over a range of scales (typically cm to km). 10
5. Conclusion 11
Our study illustrated a spatial variability related to anthropogenic disturbance for (i) the 12
phenologic parameters of the plant host P. oceanica, such as shoot density, leaf length and 13
leaf surface area in the disturbed locations, for (ii) the mean percentage cover of targeted 14
organisms and for (iii) the epiphytic biomass on leaves of P. oceanica. 15
The hierarchical sampling designs used in this study similarly to other investigations dealing 16
with the spatial structuring of epiphytes-seagrass relations, pointed out a homogeneity in the 17
distribution of epiphyte assemblages for the majority of functional groups and biomass among 18
the scale site (500-600 m transect) while a heterogeneity was displayed at large scales among 19
regions and at small scales among plots. Seagrass beds separated by few hundred of meters in 20
both disturbed and control locations will apparently be subjected to unique environmental 21
conditions resulting in equally epiphytic leaves biomass and assemblages. P. oceanica 22
meadow and its associated epiphytes appear to be strongly affected by human pressure in the 23
Gulf of Gabes through sewage outlet (this study), in addition to other disturbances such as 24
trawling, mooring, fish farming and coastal pollution. The regression trend will significantly 25

increase unless there is efficient implementation of legal protection along with a reduction in 1
human interference. While restrictions on trawling have been introduced in Tunisia, this 2
practice being responsible for the loss of about 80% of the surface area of seagrass meadows 3
in the Gulf of Gabes (Zaouali, 1992), the legislation is not respected. In a recent review, many 4
authors regretted the lack of data in some Mediterranean regions, particularly indicating the 5
urgent need for studies on P. oceanica in North Africa (Ruiz et al., 2009). We, thus, believe 6
that our data may be, on a North African scale, not only worthwhile but also useful in 7
initiating other investigations. For example, the construction of “matte” by P. oceanica, a 8
feature unique among Mediterranean seagrasses and which may be useful for assessing the 9
regression of P. oceanica (Leriche et al., 2004; Boudouresque et al., 2009), should be further 10
addressed. Finally, it is urgent to propose the best management plans to save the remaining 11
20% of P. oceanica in the Gulf of Gabes and its associated epiphytes which have been 12
reported to be among the most productive marine and terrestrial ecosystems (Duarte and 13
Chiscano, 1999). 14
6. Acknowledgements 15
This study was conducted by Mounir Ben Brahim in the framework of his PhD and supported 16
by grants from by JICA (Japan International Cooperation Agency) and ESREB project (Étude 17
des Stocks et des Ressources Exploitables des Bivalves). It was conducted as part of a 18
collaborative project between the INSTM (Institut National des Sciences et Techniques de la 19
Pêche), the Faculty of Sciences of Sfax (Tunisia) and the University of Franche-Comté 20
(Chrono-Environnement, UMR CNRS 4269). The authors wish to thank the two reviewers for 21
helpful suggestions which improved our contribution. 22

List of figures: 1 2 Figure 1. Geographical map focussing on sampling locations in the Gulf of Gabes. 3
Figure 2. Leaf biomass vs. epiphyte biomass (gdw leaf-1 ) for disturbed (D) and control (C) 4
locations. 5
Figure 3. Average ± SD values of the shoot density at the control (C1, C2) and disturbed D1, 6
D2) locations with the three nested sites a, b and c. 7
Figure 4. Average ± SD values of the leaf surface area at the control (C) and disturbed (D) 8
locations with the three nested sites a, b and c. 9
Figure 5. Average ± SD values of leaf length at the control (C) and disturbed (D) locations 10
with the three nested sites a, b and c. 11
Figure 6. Average ± SD values of the mean biomass of leaf epiphytes of P. oceanica at the 12
control (C) and disturbed (D) locations with the three nested sites a, b and c. 13
Figure 7. Mean percentage cover of the main epiphyte groups at the control and disturbed 14
locations with the three nested sites a, b and c. (C1: Hassar; D1: Ghannouch; D2: Zarrat and 15
C1: Ajim). 16
Figure 8. nMDS showing the dissimilarity among centroids of sites of epiphytic assemblages 17
on leaves. Ghannouch: D1 , Zarrat: D2 , Hassar: C1, Ajim: C2. 18
Figure 9. Global projection on the first factorial design discriminating of variables and group 19
centroids. 20
21
22
23
24
25
26

References 1
Alcoverro, T., Duarte, C.M., Romero, J., 1997. The influence of herbivores on Posidonia 2
oceanica epiphytes. Aquatic Botany 56, 93-104. 3
Anderson, M.J., 2001. A new method for non-parametric multivariate analysis of variance. 4
Austral Ecology 26, 32–46. 5
Armitage, A. R., Frankovich, T. A., Fourqurean, J. W., 2006. Variable responses within 6
epiphytic and benthic microalgal communities to nutrient enrichment. Hydrobiologia 569, 7
423-35. 8
Balata, D., Nesti, U., Piazzi, L., Cinelli, F., 2007. Patterns of spatial variability of seagrass 9
epiphytes in the north-west Mediterranean Sea. Marine Biology 151, 2025-2035. 10
Balata, D., Bertocci, I., Piazzi, L., Nesti, U., 2008. Comparison between epiphyte 11
assemblages of leaves and rhizomes of the seagrass Posidonia oceanica subjected to different 12
levels of anthropogenic eutrophication. Estuarine, Coastal and Shelf Science 79, 533-540. 13
Balestri, E., Benedetti-Cecchi, L., Lardicci, C., 2004. Variability in patterns of growth and 14
morphology of Posidonia oceanica exposed to urban and industrial wastes: contrasts with two 15
reference locations. Journal of Experimental Marine Biology and Ecology 308, 1-21. 16
Bejaoui, B., Raïs, S., Koutitonsky, V., 2004. Modélisation de la dispersion du phosphogypse 17
dans le Golfe de Gabès. Bulletins de l’Institut Océanographique et de Pêche de Salammbô. 18
31, 103-109. 19
Bel Hassen, M., Drira, Z., Hamza, A., Ayadi, H., Akrout, F., Messaoudi, S., Issaoui, H., 20
Aleya, L., Bouaïn, A., 2009. Phytoplankton dynamics related to water mass properties in the 21
Gulf of Gabes: Ecological implications. Journal of Marine Systems 75, 216-226. 22
Ben Alaya, H., 1972. Répartition et conditions d’installation de Posidonia oceanica Delile et 23
Cymodocea nodosa Ascherson dans le Golfe de Tunis. Bulletins de l’Institut 24
Océanographique et de Pêche de Salammbô 2, 331-416. 25

Ben Brahim, M., Hiroaki, T., Hamza, A., 2007. Proceedings of the third Mediterranean 1
symposium on marine vegetation, Marseille, 300 pp. 2
Ben Chikha, M., 2009. Evaluation de la réaction de la Magnoliophyte marine Posidonia 3
oceanica (L.) Delile, vis-à-vis de la contamination mercurielle dans les côtes nord de la ville 4
de Sfax. Master, Université de Sfax, Tunisie, 80 pp. 5
Ben Mustapha, K., 1995. The Gulf of Gabes: A case study in the Mediterranean decline in 6
Fishing out the Mediterranean. 21st session of the G.F.C.M, Spain, Greenpeace International 7
(Eds), Netherlands, 8-9. 8
Ben Mustapha, K., Zarrouk, S., Souissi, A., El Abed, A., 2003. Diversity of Tunisian 9
demosponges. Bulletins de l’Institut Océanographique et de Pêche de Salammbô 30, 55-78. 10
Boudouresque, C.F., Bernad, G., Pergent, G., Shili A., Verlaque M., 2009. Regression of 11
Mediterranean seagrasses caused by natural processes and anthropogenic disturbances and 12
stress: a critical review. Botanica Marina 52, 395-418. 13
Buia, M.C., Zupo, V., Mazzella L., 1992. Primary production and growth in Posidonia 14
oceanica. P.S.Z.N. Marine Ecology 13, 2-16. 15
Cambrige, M.L., McComb, A.J., 1984. The loss of seagrasses in Cockburn Sound. Western 16
Australia. I. the time course and magnitude of seagrass decline in relation to industrial 17
development. Aquatic Botany 20, 229-243. 18
Cancemi, G., De Falco, G., Pergent, G., 2003. Effects of organic matter input from a fish 19
farming facility on a Posidonia oceanica meadow. Estuarine, Coastal and Shelf Science 56, 20
961-968. 21
Cebrian, J., Enriquez, S., Fortes, M., Agawin, N., Vermaat, J.E., Duarte, C.M., 1999. 22
Epiphyte accrual on Posidonia oceanica (L.) Delile leaves: implications for light absorption. 23
Botanica Marina 42, 123-128. 24

C.G.P. 1996. Annuaire des statistiques des pêches en Tunisie. Ministère de l’agriculture, 1
Tunisie. 2
Chapman, M.G., Underwood, A.J., Skilleter, G.A., 1995. Variability at different spatial scales 3
between a subtidal assemblage exposed to the discharge of sewage and two control 4
assemblages. Journal of Experimental Marine Biology and Ecology 189, 103-122. 5
Cifuentes, M., Kamlah, C., Thiel, M., Lenz, M., Wahl, M., 2007. Effects of temporal 6
variability of disturbance on the succession in marine fouling communities in northern-central 7
Chile. Journal of Experimental Marine Biology and Ecology 352, 280-294. 8
Clarke, K.R., 1993. Non-parametric multivariate analyses of changes in community structure. 9
Australian Journal of Ecology 18, 117-143. 10
Delgado, O., Ruiz, J., Pérez, M., Ballesteros, E., 1999. Effects of fish farming on seagrass 11
(Posidonia oceanica) in a Mediterranean bay: seagrass decline after organic loading 12
cessation. Oceanologica Acta 22, 109-117. 13
Drira, Z., Hamza, A., Bel Hassen, M., Ayadi, H., Bouaïn, A., Aleya, L., 2008. Dynamics of 14
dinoflagellates and environmental factors during the summer in the Gulf of Gabes (Tunisia, 15
Eastern Mediterranean Sea). Scientia Marina 72, 59-71. 16
Drira, Z., Bel Hassen, M., Hamza, A., Rebai, A., Bouaïn, A., Ayadi, H., Aleya, L., 2009. 17
Coupling of phytoplankton community structure to nutrients, ciliates and copepods in the 18
Gulf of Gabes (South Ionian Sea, Tunisia). Journal of the Marine Biological Association, UK. 19
1-11, doi: 10.1017/S002531540900023. 20
Duarte, C. M., Borum, J., Short, F. T., Walker, D. I., 2004. Seagrass ecosystems: their global 21
status and prospects. In Aquatic Ecosystems: Trends and Global Prospects, pp. 281–294. 22
Edited by N. V. C. Polunin. Cambridge: Cambridge University Press. 23
Duarte, C. M and C. L., Chiscano, 1999. Seagrass biomass and production: a reassessment. 24
Aquatic Botany 1334, 1-16. 25

Fourqurean, J. W., Muth M. F. A., Boyer, J. N., 2010. Epiphyte loads on seagrasses and 1
microphytobenthos abundance are not reliable indicators of nutrient availability in 2
oligotrophic coastal ecosystems. Marine Pollution Bulletin 60, 971–983 3
Frankovich, T. A., Armitage, A. R., Wachnicka, A. H., Gaiser, E. E and Fourqurean J. W. 4
2009. Nutrient effects on seagrass epiphyte community structure in Florida Bay. Journal of 5
Phycology 45, 1010–1020. 6
Fraschetti, S., Gambi, C., Giangrande, A., Musco, L., Terlizzi, A., Danovaro, R., 2006. 7
Structural and functional response of meiofauna rocky assemblages to sewage pollution. 8
Marine Pollution Bulletin 52, 540-548. 9
Gambi, M.C., Giangrande, A., Chessa, L.A., Manconi, R., Scardi M., 1989. Distribution and 10
ecology of Polychaetes in the foliar stratum of a Posidonia oceanica bed in the bay of Porto 11
Conte (N.W. Sardinia). International Workshop on Posidonia beds. édit., GIS Posidonie publ. 12
Fr. 2, 175-187. 13
Giovannetti, E,. Montefalcone, M., Bianchi, C.N., Morri, C., Albertelli, G., 2006. Structural 14
variability of the epiphytic community in a Posidonia oceanica meadow (Ligurian sea, NW 15
mediteranean). Biologia Marina Mediterranea 13, 145-148. 16
Giovannetti, E., Montefalcone, M., Morri, C., Bianchi, C.N., Albertelli, G., 2010. Early 17
warning response of Posidonia oceanica epiphyte community to environmental alterations 18
(Ligurian Sea, NW Mediterranean). Marine Pollution Bulletin 60, 1032-1039. 19
Guidetti, P., 2001. Detecting environmental impacts on the Mediterranean seagrass Posidonia 20
oceanica (L.) Delile: the use of reconstructive methods in combination with “beyond BACI” 21
designs. Journal of Experimental Marine Biology and Ecology 260, 27-39. 22
Hamza, A., Bradai, M. N., Ghorbel, M., Abdelmoulah, A., 1995. New mentions of Caulerpa 23
racemosa (Forsskal) J. Agardh in the Gabes Gulf (Tunisia). Bulletins de l’Institut 24
Océanographique et de Pêche de Salammbô 22, 81-88. 25

Hamza-Chaffai, A., Amiard, J.C., Cosson, R.P., 1999. Relationship between metallothionein 1
and metals in a natural population of clam Ruditapes decussates from Sfax coast, a non-linear 2
model using Box-Cox transformation. Comparative Biochemistry and Physiology 123, 153-3
163. 4
Hannachi, I., Drira, Z., Bel Hassen, M., Hamza, A., Ayadi, H., Bouain, A., Aleya, L., 2009. 5
Abundance and biomass of the ciliate community during a spring cruise in the Gulf of Gabes 6
(East Mediterranean Sea, Tunisia). Acta Protozoologica 47, 293-305. 7
Hattour, A., Ben Mustapha, K., El Abed, A., Chaouch, M., 1998. L’écosystème du golfe de 8
Gabès; dégradation de son couvert végétal et de sa pêcherie benthique. Bulletins de l’Institut 9
Océanographique et de Pêche de Salammbô 25, 5-40. 10
Hemminga, M., Duarte, C.M., 2000. Seagrass Biology. Cambridge, Univ, Press, 298 pp. 11
Jernakoff, P., Nielson, J., 1997. The relative importance of amphipod and gastropod grazers in 12
Posidonia sinuosa meadows. Aquatic Botany 56, 183-202. 13
Kchaou, N., Elloumi, J., Drira, Z., Hamza, A., Ayadi, H., Bouain, A., Aleya, L., 2009. 14
Distribution of ciliates in relation to environmental factors along the coastline of the Gulf of 15
Gabes, Tunisia. Estuarine, Coastal and Shelf Science 83, 414-424. 16
Kendrick, G. A., Burt, J. S., 1997. Seasonal changes in epiphyte macro-algae assemblages 17
between offshore exposed and inshore protected Posidonia sinuosa Cambridge et Kuo 18
seagrass meadows, Western Australia. Botanica Marina 40, 77-86. 19
Lavery, P., Vanderklift, M., 2002. A comparison of spatial and temporal patterns in epiphytic 20
macroalgal assemblages of the seagrasses Amphibolis griffithii and Posidonia coriacea. 21
Marine Ecology Progress Series 236, 99–112. 22
Lepoint, G., Havelange, S., Gobert, S., Bouquegneau, J.M., 1999. Fauna vs flora contribution 23
to leaf epiphytes biomass in a Posidonia oceanica seagrass bed (Revellata Bay Corsica). 24
Hydrobiologia 394, 63-67. 25

Leriche, A., Boudouresque, C. F., Bernard, G., Bonhomme, P., Denis J., 2004. A one-century 1
suite of seagrass bed maps: can we trust ancient maps? Estuarine, Coastal and Shelf Science 2
59, 353-362. 3
Libes, M., 1986. Productivity-irradiance relationship of Posidonia oceanica and its epiphytes. 4
Aquatic Botany 26, 285-306. 5
Manninio, A. M., 2010. Temporal and spatial variation of the algal community in a southern 6
Mediterranean shallow system. Cryptogamie Algologie 31, 255-272. 7
Martínez-Crego, B., Prado, P., Alcoverro, T., Romero, J., 2010. Composition of epiphytic leaf 8
community of Posidonia oceanica as a tool for environmental biomonitoring. Estuarine, 9
Coastal and Shelf Science 88, 199-208. 10
Mascaro, O., T. Valdemarsen, M., Holmer, M., Perez., J. Romero., 2009. Experimental 11
manipulation of sediment organic content and water column aeration reduces Zostera marina 12
(eelgrass) growth and survival. Journal of Experimental Marine Biology and Ecology 373, 26-13
34. 14
Mazzella, L., Scipione, M.B., Buia, M.C., 1989. Spatio-temporal distribution of algal and 15
animal communities in a Posidonia oceanica (L.) Delile meadow. PSZNI. Marine Ecolgy 10, 16
107-131. 17
McKinney, F. K and Jackson, J. B. C., 1989. Bryozoan evolution. Special Topics in 18
Palaeontology. Boston, MA: Unwin Hyman. 19
Menez, E.G., Mathieson, A.G., 1981. The Marine Algae of Tunisia. Smithsonian Institution 20
Press. 58 pp. 21
Meric, S., Nicola, E. D., Iaccarino, M., Gallo, M., Gennaro, A. D., Morrone, G., Warnau, M., 22
Belgiorno, V., Pagano, G., 2005. Toxicity of leather tanning wastewater effluents in sea 23
urchin early development and in marine microalgae. Chemosphere 61, 208-217. 24
Montefalcone, M., 2009. Ecosystem health assessment using the Mediterranean seagrass 1
Posidonia oceanica: a review. Ecological Indicators 9, 595-604. 2
Moore, T.N., Fairweather, P.G., 2006. Lack of significant change in epiphyte biomass with 3
increasing extent of measurement within seagrass meadows. Estuarine, Coastal and Shelf 4
Science 68, 413-420. 5
Neckles, H. A., Koepfler, E. T., Haas, L. W., Wetzel, R. L., Orth, R. J., 1994. Dynamics of 6
epiphytic photoautotrophs and heterotrophs in Zostera marina (eelgrass) microcosms: 7
responses to nutrient enrichment and grazing. Estuaries 17, 597-605. 8
Nelson, T.A., Waaland, J.R., 1997. Seasonality of eelgrass, epiphyte, and grazer biomass and 9
productivity in subtidal eelgrass meadows subjected to moderate tidal amplitude. Aquatic 10
Botany 56, 51-74. 11
Nesti, U., Piazzi, L., Balata, D., 2008. Variability in the structure of epiphytic assemblages of 12
the Mediterranean seagrass Posidonia oceanica in relation to depth. Marine Ecology 30, 276-13
287. 14
Pardi, G., Piazzi, L., Balata, D., Papi, I., Cinelli F., Benedetti-Cecchi, L., 2006. Spatial 15
variability of Posidonia oceanica (L.) Delile epiphytes around the mainland and the islands of 16
Sicily (Mediterranean Sea). Marine Ecology 27, 397-403. 17
Pergent-Martini, C; Pergent, G., 2000. Marine phanerogams as a tool in the evaluation of 18
marine trace-metal contamination: an example from the Mediterranean. International Journal 19
of Environment and Pollution 13, 1-6. 20
Peterson, B.J., Frankovich, T.A., Zieman, J.C., 2007. Response of seagrass epiphyte loading 21
to field manipulations of fertilization. Gastropod grazing and leaf turnover rates. Journal of 22
Experimental Marine Biology and Ecology 349, 61-72. 23
Piazzi, L., Balata, D., Cinelli, F., 2002. Epiphytic macroalgal assemblages of Posidonia 24
oceanica rhizomes in the western Mediterranean. European Journal of Phycology 37, 69-76. 25

Piazzi, L., Balata, D., Cinelli, F., Benedetti-Cecchi, L., 2004. Patterns of spatial variability in 1
epiphytes of Posidonia oceanica. Differences between a disturbed and two reference 2
locations. Aquatic Botany 79, 345-356. 3
Prado, P., Farina, S., Tomas, F., Romero., J., Alcoverro, T., 2008. Marine protection and 4
meadow size alter fish herbivory in seagrass ecosystems. Marine Ecology Progress Series 5
371, 11-21. 6
Ramos-Espla, A., Ouergui, A., Bayle, J.T., Ben Mbarek, N., Fernanadez-Troquemada, Y., 7
Gallouza, S., Khidri, R., Sanchez-lizaso, J.L., Yamak, S., 2000. Contribution à la 8
caractérisation des herbiers à Posidonia oceanica (L.) Delile aux Iles Kerkennah (Est de la 9
Tunisie, Mediterranée orientale). Proceedings of The First Mediterranean Symposium on 10
Marine Vegetation 177-181. 11
Ribera, M.A., Gomez-Garreta, A., Gallardo, T., Cormaci, M., Furnari, G., Giaccone, G., 12
1992. Checklist of Mediterranean seaweed. I. Fucophyceae (Warming, 1884). Botanica 13
Marina 35, 109-130. 14
Ruiz, J.M., Romero, J., 2003. Effects of disturbances caused by coastal constructions on 15
spatial structure, growth dynamics and photosynthesis of the seagrass Posidonia oceanica. 16
Marine Pollution Bulletin 46, 1523-1533. 17
Saunders, J. E., Attrill, M. J., Shaw, S. M., Rowden, A. A., 2003. Spatial variability in the 18
epiphytic algal assemblages of Zostera marina seagrass beds. Marine Ecology Progress Series 19
249, 107-115. 20
Sliskovic, M., Jelic-Mrcelic, G., Antolic, B., Anicic, I., 2010. The fouling of fish farm cage 21
nets as bioindicator of aquaculture pollution in the Adriatic Sea (Croatia). Environmental and 22
Monitoring Assessment doi: 10.1007/s10661-010-1402-y. 23
Smaoui-Damak, W., Hamza-Chaffai, A., Berthet, B., Amiard, J.C., 2003. Preliminary study 24
of the clam Ruditapes decussatus exposed in situ to metal contamination and originating from 25

the Gulf of Gabes, Tunisia. Bulletin of Environmental Contamination and Toxicology 7, 961-1
970. 2
Smaoui-Damak, W., Rebai, T., Berthet, B., Hamza-Chaffai, A., 2006. Does cadmium 3
pollution affect reproduction in the clam Ruditapes decussates? A one-year case study. 4
Comparative Biochemistry and Physiology, Part C 143, 252-261. 5
Soussi, N., Mammoun, B., 1992. Contribution à l'étude de la pollution marine dans le Golfe 6
de Gabès. Rapport de synthèse 50pp. 7
Terrados, J and Javier Medina Pons, F., 2008. Epiphyte load on the seagrass Posidonia 8
oceanica (L.) Delile does not indicate anthropogenic nutrient loading in Cabrera Archipelago 9
National Park (Balearic Islands, Western Mediterranean). Scientia Marina 72, 503- 510. 10
Trautman D. A., Borowitzka M. A., 1999. The distribution of the epiphytic organisms on 11
Posidonia australis and P. sinuosa, two seagrasses with differing leaf morphology. Marine 12
Ecology Progress Series 179, 215-229. 13
Underwood, A.J., 1994. On beyond BACI: sampling designs that might reliably detect 14
environmental disturbances. Ecological Application 4, 3-15. 15
Van der Ben, D., 1971. Les épiphytes des feuilles de Posidonia oceanica Delile sur les côtes 16
françaises de la Méditerranée. Mémoire de l'Institut Royal des Sciences Naturelles de 17
Belgique 168, 1-101. 18
Vanderklift, M., Lavery, P., 2000. Patchiness in assemblages of epiphytic macroalgae on 19
Posidonia coriacea at a hierarchy of spatial scales. Marine Ecology Progress Series 192, 127-20
135. 21
Wahl, M., 1989. Marine epibiosis. I. Fouling and antifouling: some basic aspects. Marine 22
Ecology Progress Series 58, 175-189. 23

Zaghden, H., Kallel, M., Louati, A., Elleuch, B., Oudot, J., Saliot, A. 2005. Hydrocarbons in 1
surface sediments from the Sfax coastal zone, (Tunisia) Mediterranean Sea. Marine Pollution 2
Bulletin 50, 1287-1294. 3
Zaouali, J., 1993. Les peuplements benthiques de la petite Syrte, Golfe de Gabès – Tunisie. 4
Résultats de la campagne de prospection du mois de juillet 1990. Marine Life 3, 47-60. 5
6
7
8
9
10
11
12

Table 1. Analysis of variance on shoot density, leaf surface area and leaf length. Bold numbers indicate significant effects. C = control locations; D= disturbed locations.
Shoot density Leaf surface area Leaf length
Source of Variation d.f MS F P MS F P MS F P Locations = L 3 2.68 107 176.90 0.00 1.03 106 11.71 0.00 9.31 8.25 0.00 Disturbed vs. Controls (DC) 1 6.88 107 503.81 0.00 2.44 106 16.55 0.02 20.15 12.78 0.02 Among Disturbed (=D) 1 1.17 107 63.28 0.00 5.52 105 4.579 0.10 0.07 0.06 0.82 Among Controls (=C) 1 215.90 0.002 0.97 1.03 105 1.868 0.24 7.71 7.46 0.05 Site (DC) 4 1.36 105 6.19 0.03 147 105 9.46 0.01 1.57 0.17 0.94 Site (D) 4 1.85 105 18.95 0.00 120 105 13.3 0.00 1.22 0.24 0.91 Site (C ) 4 1.18 105 5.43 0.03 55474.20 7.71 0.02 1.03 0.22 0.92 Subsite (Site (DC)) 6 22030.05 1.19 0.34 15550.04 3.879 0.01 9.46 3.66 0.01 Subsite (Site (D)) 6 9767.25 0.97 0.47 9060.70 4.58 0.00 5.19 4.08 0.00 Subsite (Site (C)) 6 21758.39 1.30 0.30 7192.68 3.56 0.01 4.68 3.17 0.02 Plot (subsite (Site (DC))) 24 18454.41 0.82 0.70 4009.17 6.925 0.00 2.58 3.44 0.00 Plot (subsite (Site (D))) 26 10079.36 0.45 0.99 1992.08 7.32 0.00 1.27 3.04 0.00 Plot (subsite (Site (C))) 26 16742.5 1.42 0.13 2020.14 6.39 0.00 1.48 3.82 0.00 Quadrat (plot(subsite( Site (DC)))) 72 22433.62 0.82 0.86 578.97 0.339 0.99 0.75 6.76 0.00 Quadrat (plot(subsite( Site (D)))) 72 22550.45 12.38 0.00 271.83 0.802 0.86 0.42 3.78 0.00 Quadrat (plot(subsite( Site (C)))) 72 11816.26 2.69 0.00 316.04 0.95 0.58 0.39 5.59 0.00 Residual 432 3108.5 334.92 0.09 Residual D 216 1820.99 339.03 0.11 Residual C 216 4396.01 330.8 0.07 Transformation None None Ln(x+1) Cochran's C test C=0.05, p<0.01 C=0.403, p<0.01 C=0.288, not significant

Table 2. Analysis of variance on the epiphytic biomass on the leaves of P. oceanica. Bold
numbers indicate significant effects.
Source of Variation d.f MS F P
Locations = L 3 3.46 × 10⁷ 30.85 0.00
Disturbed vs. Controls (DC) 1 8.08 × 10⁷ 25.23 0.00
Among Disturbed (=D) 1 8.57 × 10⁶ 655.01 0.00
Among Controls (=C) 1 1.44 × 10⁷ 6.48 0.06
Site (DC) 10 3.20 × 10⁶ 5.97 0.00 Site (D) 4 13097.61 0.25 0.89
Site (C ) 4 2.23 × 10⁶ 2.17 0.19 Subsite (Site (DC)) 12 537886.63 4.834 0.00 Subsite (Site (D)) 6 51026.48 1.94 0.11
Subsite (Site (C)) 6 1.0 × 10⁶ 5.22 0.00 Plot (subsite (Site (DC))) 48 111265.64 1.05 0.40 Plot (subsite (Site (D))) 24 26197.42 1.34 0.17 Plot (subsite (Site (C))) 24 196333.85 1.02 0.45 Quadrat (plot(subsite( Site (DC)))) 144 105953.6 4.59 0.00 Quadrat (plot(subsite( Site (D)))) 72 19465.36 4.58 0.00 Quadrat (plot(subsite( Site (C)))) 72 192441.83 4.59 0.00 Residual 648 23086.88 Residual D 324 4243.37 Residual C 324 41930.39

Table 3. Non-parametric multivariate analysis of variance (NP-MANOVA) on epiphytic
assemblage of Posidonia oceanica. Bold numbers indicate significant effects.
Source of Variation d.f MS F P Locations = L 3 489.94 24.27 0 Disturbed vs. Controls (DC) 1 1412.48 64.55 0 Among Disturbed (=D) 1 52.46 3.44 0.137 Among Controls (=C) 1 4.88 0.19 0.682 Site (DC) 10 21.88 1.173 0.391 Site (D) 4 15.23 0.46 0.762 Site (C ) 4 25.14 5.761 0.03 Subsite (Site (DC)) 12 18.66 0.855 0.595 Subsite (Site (D)) 6 32.96 1.16 0.361 Subsite (Site (C)) 6 4.36 0.29 0.937
Plot (subsite (Site (DC))) 48 21.18 2.15 × 10¹³ 0 Plot (subsite (Site (D))) 24 28.47 0 0 Plot (subsite (Site (C))) 24 15.16 0 0 Quadrat (plot(subsite( Site (DC)))) 144 0 0 0 Quadrat (plot(subsite( Site (D)))) 72 0 0 0 Quadrat (plot(subsite( Site (C)))) 72 0 0 0 Residual 648 0 Residual D 324 0 Residual C 324 0

Table 4. Analysis of variance on mean percentage cover of epiphytes of Posidonia oceanica.
Bold numbers indicate significant effects.
Filamentous algae Bryozoans Hydrozoans Encrusting Annelida
Source of Variation d.f MS F P MS F P MS F P MS F P
Locations = L 3 43.014 10.5 0.004 0.11 0.06 0.986 147.13 12.08 0.002 64.1 4.83 0.033
Disturbed vs. Controls = DC 1 104.59 19.6 0.001 0.2 0.1 0.755 395.59 29.12 0 44.75 1.78 0.211
Disturbed =D 1 12.68 1.85 0.245 0.02 0.01 0.929 31.92 1.54 0.281 86.09 6.19 0.068
Controls = C 1 8.812 7.87 0.049 0.08 0.03 0.864 8.12 2.44 0.194 59.74 4.85 0.092
Site (L) = SL 8 4.07 0.46 0.861 2.53 1.8 0.173 12.18 1.75 0.183 13.28 2.59 0.067
Site (DC) = SiDC 10 5.32 0.61 0.781 1.95 1.41 0.282 13.58 1.95 0.136 25.07 4.87 0.006
Site (D) = SiD 4 6.83 0.46 0.759 2.43 0.95 0.495 20.61 2.25 0.178 13.9 1.94 0.222
Site (C ) = SiC 4 1.12 0.39 0.813 2.42 11.43 0.006 3.33 0.69 0.623 12.32 3.91 0.067
Subsite (SL) 12 8.8 2.3 0.02 1.4 1.29 0.25 6.93 1.18 0.322 5.12 0.9 0.551
Subsite (SiDC) 12 8.76 2.28 0.022 1.38 1.33 0.232 6.96 1.19 0.312 5.15 0.91 0.544
Subsite (SiD) 6 14.62 2.56 0.046 2.55 1.67 0.17 9.12 1.17 0.351 7.14 0.82 0.567
Subsite (SiC) 6 2.91 1.47 0.23 0.21 0.38 0.882 4.81 1.24 0.321 3.15 1.221 0.33
Plot ( Subsite (SL)) 48 3.81 0 0 0 0 0 5.87 0 0 5.67 0 0
Plot (Subsite(SiDC)) 48 3.83 1569.1 0 1.04 867.34 0 5.81 1346.47 0 5.65 2220.02 0 Plot (subsite(S(D)) 24 5.69 1386.2 0 1.52 1456.2 0 7.75 1242.7 0 8.73 4416.98 0
Plot (subsite(SiC)) 24 1.97 2528.35 0 0.55 409.47 0 3.87 1616.59 0 2.58 826.63 0
Quadrat(Plot(Subsite (SL))) 144 0 0 0 0 0 0 0.001 0 0 0 0 0
Quadrat(Plot(Subsite(SiDC))) 144 0.002 0.92 0.74 0.001 0.92 0.746 0.004 1.01 0.457 0.01 0.98 0.539
Quadrat(plot(subsite(S(D))) 72 0.004 0.91 0.679 0.001 1 0.484 0.006 1 0.484 0.01 0.95 0.584
Quadrat(plot(subsite(S(D))) 72 0.001 0.94 0.607 0.001 0.86 0.775 0.002 1.04 0.402 0.01 1.01 0.478
Residual L 648 0 0 0 0
Residual DC 648 0.003 0.001 0.004 0.003
Residual D 324 0.004 0.001 0.006 0.002
Residual C 324 0.008 0.002 0.002 0.003
Cochran's C-test 0.309, p < 0.01 0.307, p < 0.01 0.406, p < 0.01 0.206, p < 0.01
Transformation Ln (x+1) Ln (x+1) Ln (x+1) Ln (x+1)
S-N-K test D2<D1<C2<C1 D2<D1<C2<C1 D2<C1<D1<C2

Table 5. Major species, ranked in order of importance, contributing to the average
dissimilarities between the disturbed and the control locations as determined by similarity
percentages (SIMPER).
C D
Species Av. % cover Av. % cover Av. Diss %. Contri
Antithamnion sp (Rhodophyta) 44.83 2.57 5.32 9.53 Polysiphonia elongata (Hudson) Sprengel (Rhodophyta) 40.67 4.4 4.39 7.87 Ceramium tenuissimum (Roth) Aresch (Rhodophyta) 34.96 0.05 4.02 7.2
Ceramium codii (Richards) Mazoyer (Rhodophyta) 29.34 0 3.91 7 Dynamena cavolinii Neppi (Hydrozoa) 23.11 3.07 3.71 6.64 Spirorbis spirorbis Linnaeus (Annelida) 16.83 11.11 3.6 6.45 Scrupocellaria sp. (Bryozoa) 4.89 4.13 3.36 6.02 Bowerbankia imbricata Adams (Bryozoa) 3.09 4.2 3.29 5.9 Electra posidoniae Gautier (Bryozoa) 12.7 15.05 3.15 5.65 Lichenopora radiata Audouin (Bryozoa) 8.21 1.91 2.64 4.73 Micropora complanata Norman (Bryozoa) 12.94 4.25 2.13 3.82 Monotheca sp. (Hydrozoa) 3.07 2.92 1.96 3.51 Obelia geniculata Linnaeus (Hydrozoa) 3 2.97 1.63 2.92 Aetea truncata Landsborough (Bryozoa) 0.39 3.62 1.56 2.8 Halocordyle disticha Goldfuss (Hydrozoa) 0.77 0.1 1.44 2.58 Lyngbya sp. C. Agardh ex Gomont (Cyanobacteria) 0.71 0.39 1.29 2.31
Plumularia setacea Linnaeus (Hydrozoa) 0.75 0 1.23 2.2
Rivularia bullata (Poir) Berkeley (Cyanobacteria) 0.7 0.02 1.03 1.84 Gloeotrichia sp. (Cyanobacteria) 0 0.16 0.81 1.45 Chelidonia cordieri Audouin (Bryozoa) 0 0.01 0.76 1.36 Dasya. sp. (Rhodophyta) 4.83 1.52 0.72 1.29 Phormidium sp. (Cyanobacteria) 0.51 0 0.63 1.14 Griffithsia sp. (Rhodophyta) 0.4 0 0.54 0.97 Dasycladus vermicularis (Scopoli) Krasser (Chlorophyta) 0.17 0 0.53 0.95 Aglaophenia sp. (Hydrozoa) 0.06 0.02 0.5 0.9 Campanularia hincksi Alder (Hydrozoa) 0 0.02 0.18 0.33
Pleonosporium borreri (J.E.Smith) Nägeli (Rhodophyta) 0.01 0 0.18 0.32 Orthopyxis caliculata (Hincks) (Hydrozoa) 0.02 0 0.15 0.27 Cribrilina radiate (Smitt) (Bryozoa) 0.01 0 0.14 0.25

Table 6. Variance components expressed as percentage calculated for the epiphytic biomass
and the epiphytic assemblages on leaves in the disturbed and the control locations (D =
disturbed locations, C = control locations).
Encrusting Source of variation
(%) Biomass Whole assemblages Filamentous algae Bryozoans Hydrozoans
Annelida
C D C D C D C D C D C D
Location 8.75 8 0 6.46 18.57 0 0 0 17.6 11.36 31.28 24.55
Site 10.22 0 18.59 0 0 9.8 39.6 5.72 0 12.04 13.94 0
Subsite 0.00 3.56 0 4.67 3.6 19.85 0 22.3 15.65 0 9.14 0
Plot 22.03 12.82 81.41 88.87 77.83 70.35 60.4 72 66.75 76.6 45.66 75.45
Quadrat 0 26.83 0 0 0 0 0 0 0 0 0 0

Table 7. Test of equality of mean variables studied for P. oceanica meadows. F:, df1, df2, Sig.:
Wilks' Lambda F df1 df2 Sig.
Biomass 0.081 30.85 3 8 0 Filamentous algae 0.285 6.673 3 8 0.014 Bryozoans 0.967 0.092 3 8 0.962 Hydrozoans 0.131 17.61 3 8 0
Encrusting Annelida 0.363 4.66 3 8 0.036 Leaf length 0.373 4.476 3 8 0.04 Shoot density 0.015 175.4 3 8 0

Table 8. Standardized canonical discriminant function coefficients of the studied variables for
Posidonia oceanica.
Function
1 2 3
Biomass 1.143 1.52 0.07 Hydrozoans 2.523 1.287 0.866
Encrusting Annelida 0.608 -0.79 0.984
Shoot density -2.992 -0.898 -0.287

Figure 1.
a

C1: y = 0.59 x - 0.38
R2 = 0.98
D2: y = 0.28 x + 0.13
R2 = 0.96
D1: y = 0.20 x + 0.12
R2 = 0.97
C2: y = 0.47 x - 0.61
R2 = 0.93
0
0.5
1
1.5
2
2.5
1 2 3 4 5
Leaf biomass
Ep
iph
yte
bio
mas
s
C2 D1 D2 C1
Figure 2.

0
200
400
600
800
1000
1200
D1a D1b D1c D2a D2b D2c C1a C1b C1c C2a C2b C2c
Sh
oo
t den
sity
(sh
oo
t m-²
)
Figure 3.

0
100
200
300
400
500
D1a D1b D1c D2a D2b D2c C1a C1b C1c C2a C2b C2c
Le
af s
urfa
ce a
rea
cm²
/sho
ot
Figure 4.

0
20
40
60
80
D1a D1b D1c D2a D2b D2c C1a C1b C1c C2a C2b C2c
Lea
f len
gth
(cm
)
Figure 5.

0
0.2
0.4
0.6
0.8
1
D1a D1b D1c D2a D2b D2c C1a C2b C1c C2a C2b C2c
Mea
n e
pip
hyt
e b
iom
ass
(gd
w e
pip
hyt
es /
g
dw o
f le
aves)
Figure 6.

Encrusting algae
0
20
40
60
80
D1a D1b D1c D2a D2b D2c C1a C1b C1c C2a C2b C2c
Bryozoa
0
20
40
60
80
100
D1a D1b D1c D2a D2b D2c C1a C1b C1c C2a C2b C2c
Hydrozoa
0
20
40
60
80
D1a D1b D1c D2a D2b D2c C1a C1b C1c C2a C2b C2c
Encrusting Annelida
0
20
40
60
D1a D1b D1c D2a D2b D2c C1a C1b C1c C2a C2b C2c
'
Figure 7.

Figure 8.
D2
D1
C1
C2

Function 2 Figure 9.

List of figures: Figure 1. Geographical map focussing on sampling locations in the Gulf of Gabes.
Figure 2. Leaf biomass vs. epiphyte biomass (gdw leaf-1 ) for disturbed (D) and control (C)
locations.
Figure 3. Average ± SD values of the shoot density at the control (C1, C2) and disturbed D1,
D2) locations with the three nested sites a, b and c.
Figure 4. Average ± SD values of the leaf surface area at the control (C) and disturbed (D)
locations with the three nested sites a, b and c.
Figure 5. Average ± SD values of leaf length at the control (C) and disturbed (D) locations
with the three nested sites a, b and c.
Figure 6. Average ± SD values of the mean biomass of leaf epiphytes of P. oceanica at the
control (C) and disturbed (D) locations with the three nested sites a, b and c.
Figure 7. Mean percentage cover of the main epiphyte groups at the control and disturbed
locations with the three nested sites a, b and c. (C1: Hassar; D1: Ghannouch; D2: Zarrat and
C1: Ajim).
Figure 8. nMDS showing the dissimilarity among centroids of sites of epiphytic assemblages
on leaves. Ghannouch: D1 , Zarrat: D2 , Hassar: C1, Ajim: C2.
Figure 9. Global projection on the first factorial design discriminating of variables and group
centroids.

C D
Filamentous algae
Chlorophyta Cladophora sp. 1 0 Dasycladus vermicularis (Scopoli) Krasser 1 1
Heterokontophyta
Dictyota dichotoma (Hudson) J.V Lamouroux 1 1
Rhodophyta Antithamnion sp. 1 1 Ceramium codii (Richards) Mazoyer 1 1 Ceramium gracillimum (Kützing) Zanardini 1 0 Ceramium tenuissimum (Roth) Aresch 1 1 Dasya sp. 1 1 Falkenbergia rufolanosa (Harvey) F. Schmitz 1 0 Griffithsia opuntioides J. Agardh 1 1 Laurencia obtusa (Hudson) J.V. Lamouroux 1 0 Neomonospora sp. 1 0 Pleonosporium borreri (J.E.Smith) Nägeli 1 1 Polysiphonia elongate (Hudson) Sprengel 1 1
Cyanobacteria Calothrix sp. 1 0 Gloeotrichia J. Agardh ex Bornet & Flahault 1 1 Lyngbya sp. 1 1 Phormidium sp. 1 1 Rivularia bullata (Poir) Berkeley ex Bornet & Flahault 1 1 Rivularia mesenterica Thuret 1 0
Hydrozoa Aglaophenia sp. 1 1 Campanularia hincksi Alder 1 1 Dynamena cavolinii Neppi 1 1 Gonothyraea gracilis M. Sars 1 0 Halocordyle disticha Goldfuss 1 1 Monotheca sp. 1 1 Obelia geniculata Linnaeus 1 1 Orthopyxis caliculata Hincks 1 1 Plumularia setacea Linnaeus 1 1
Bryozoa Aetea truncata Landsborough 1 1 Alcyonidium sp. 1 1 Amathia lendigera Linnaeus 1 0 Beania hirtissima Heller 1 0 Bowerbankia imbricata Adams 1 1 Chelidonia cordieri Audouin 1 1 Cribrilina radiate Smitt 1 1 Electra posidoniae Gautier 1 1 Lichenopora radiata Audouin 1 1 Micropora complanata Norman 1 1 Scrupocellaria sp. 1 1
Annelida Aphrodita sp. 1 0

Brania clavata Claparede 1 0 Spirorbis spirorbis Linnaeus 1 1
Porifera Halichondria sp. 1 0 Ircinia fasciculata Esper 1 0 Ircinia muscarum Schimd 1 0
Tunicata Botryllus schlosseri Pallas 1 0 Clavelina lepadiformis (light-bulb sea squirt) 1 1
Total number of taxa 49 32
Appendix. Presence/absence of species and/or genus found growing on Posidonia oceanica leaves in the disturbed (D) and control locations (C) at Gabes gulf.
Related Documents