Impacts of ocean acidifica0on on the Mediterranean seagrass Posidonia oceanica and its epiphy0c community Cox TE, Ga=uso JP, Diaz V, Delille J, Schenone S, Gazeau F ASLO mee0ng, Granada, Spain, February 24 th 2015

Welcome message from author
This document is posted to help you gain knowledge. Please leave a comment to let me know what you think about it! Share it to your friends and learn new things together.
Transcript
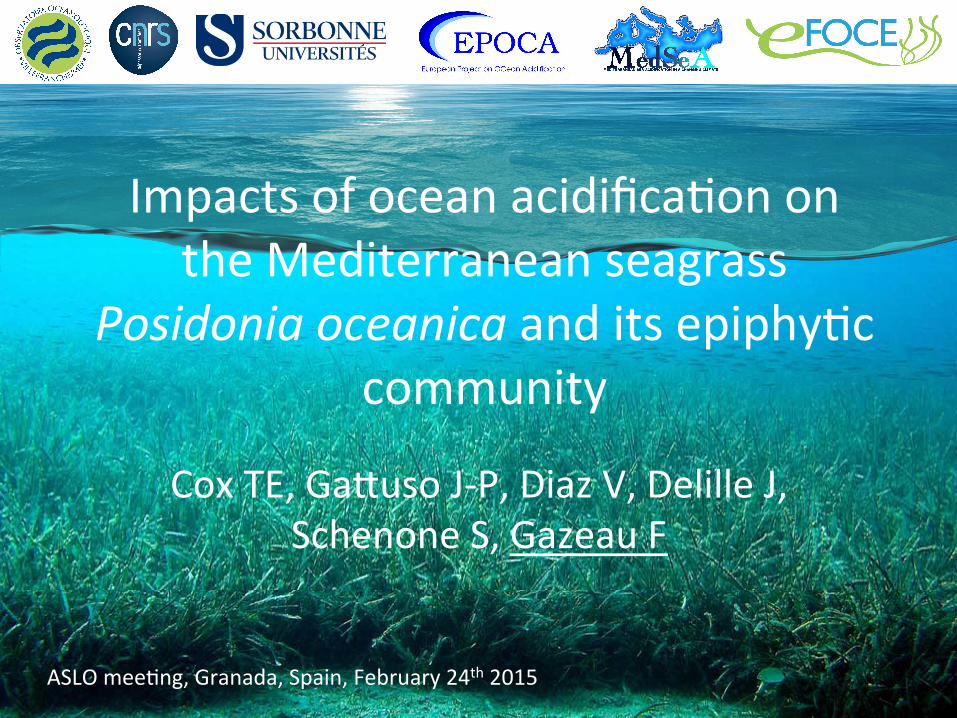
Impacts of ocean acidifica0on on the Mediterranean seagrass
Posidonia oceanica and its epiphy0c community
Cox TE, Ga=uso J-‐P, Diaz V, Delille J, Schenone S, Gazeau F
ASLO mee0ng, Granada, Spain, February 24th 2015
Background
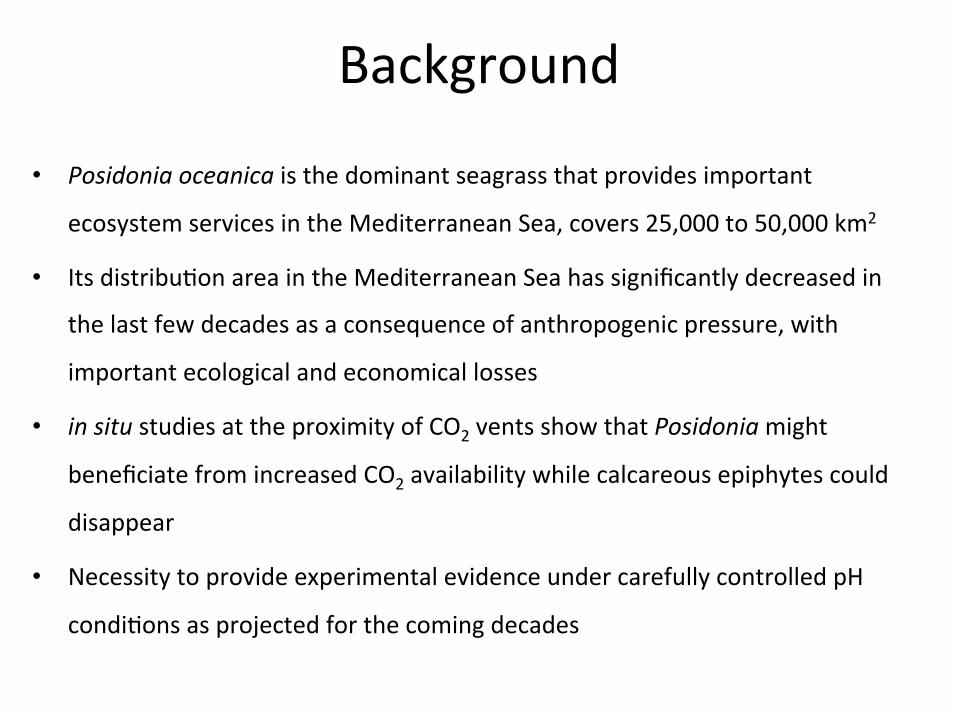
• Posidonia oceanica is the dominant seagrass that provides important
ecosystem services in the Mediterranean Sea, covers 25,000 to 50,000 km2
• Its distribu0on area in the Mediterranean Sea has significantly decreased in
the last few decades as a consequence of anthropogenic pressure, with
important ecological and economical losses
• in situ studies at the proximity of CO2 vents show that Posidonia might
beneficiate from increased CO2 availability while calcareous epiphytes could
disappear
• Necessity to provide experimental evidence under carefully controlled pH
condi0ons as projected for the coming decades
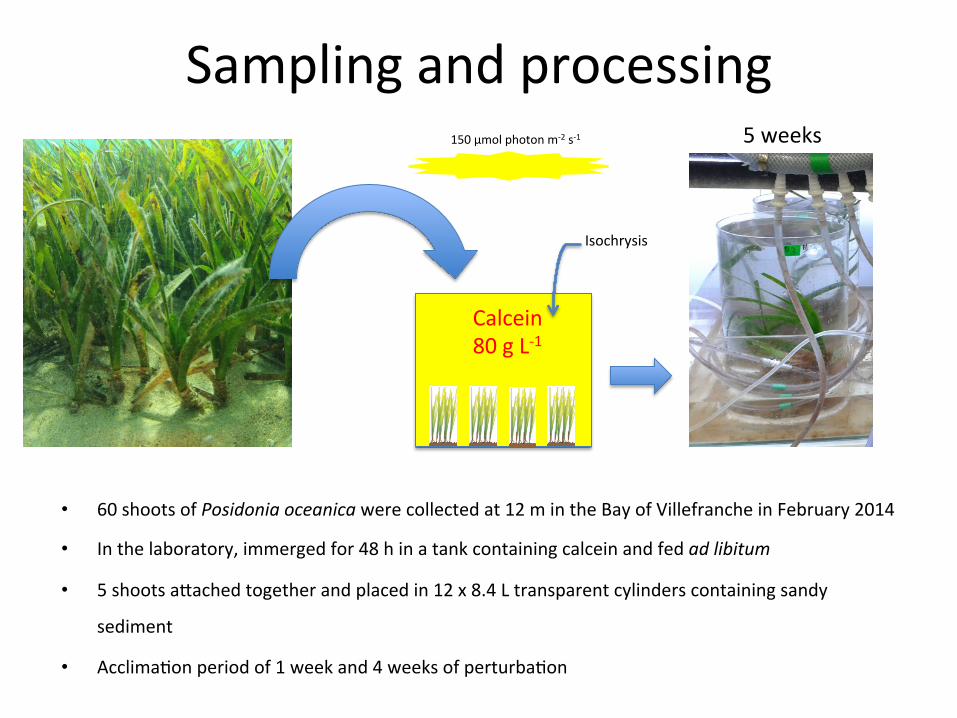
Sampling and processing
• 60 shoots of Posidonia oceanica were collected at 12 m in the Bay of Villefranche in February 2014
• In the laboratory, immerged for 48 h in a tank containing calcein and fed ad libitum
• 5 shoots a=ached together and placed in 12 x 8.4 L transparent cylinders containing sandy
sediment
• Acclima0on period of 1 week and 4 weeks of perturba0on
Isochrysis
150 μmol photon m-‐2 s-‐1
Calcein 80 g L-‐1
5 weeks
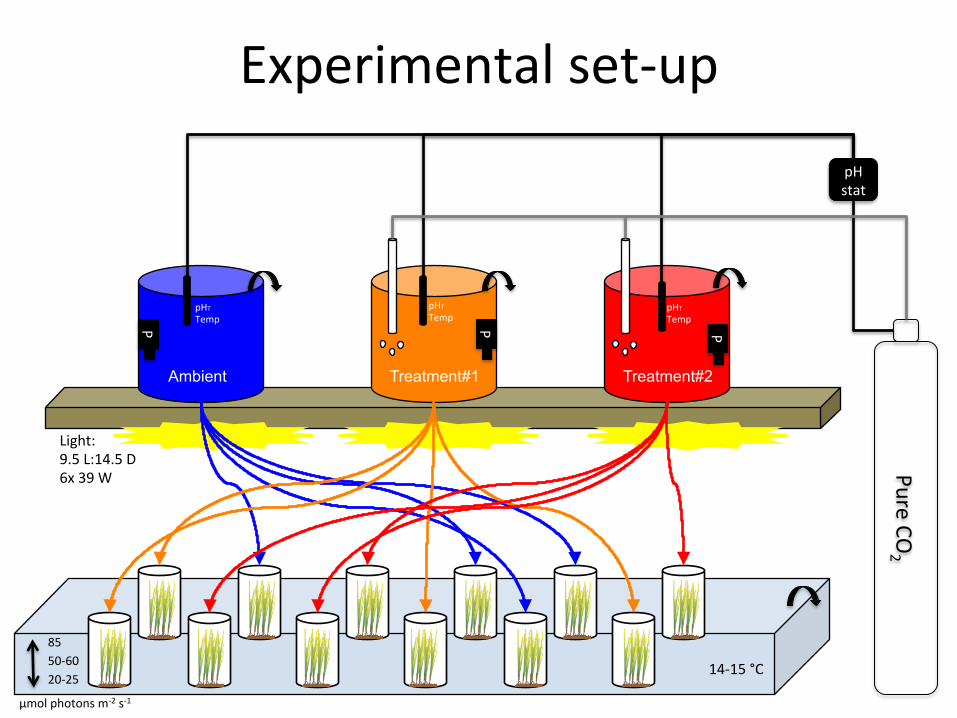
Ambient
Pure CO2
Treatment#1
P P P
pH stat
pHT Temp
pHT Temp
pHT Temp
Treatment#2
14-‐15 °C
Light: 9.5 L:14.5 D 6x 39 W
85 50-‐60 20-‐25
μmol photons m-‐2 s-‐1
Experimental set-‐up
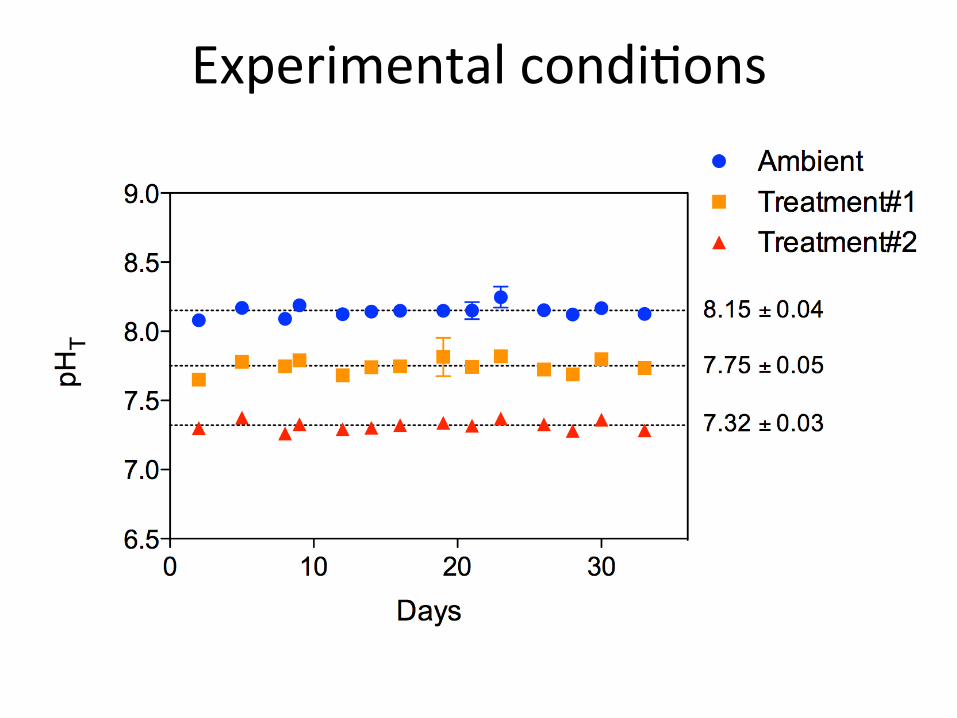
Experimental condi0ons
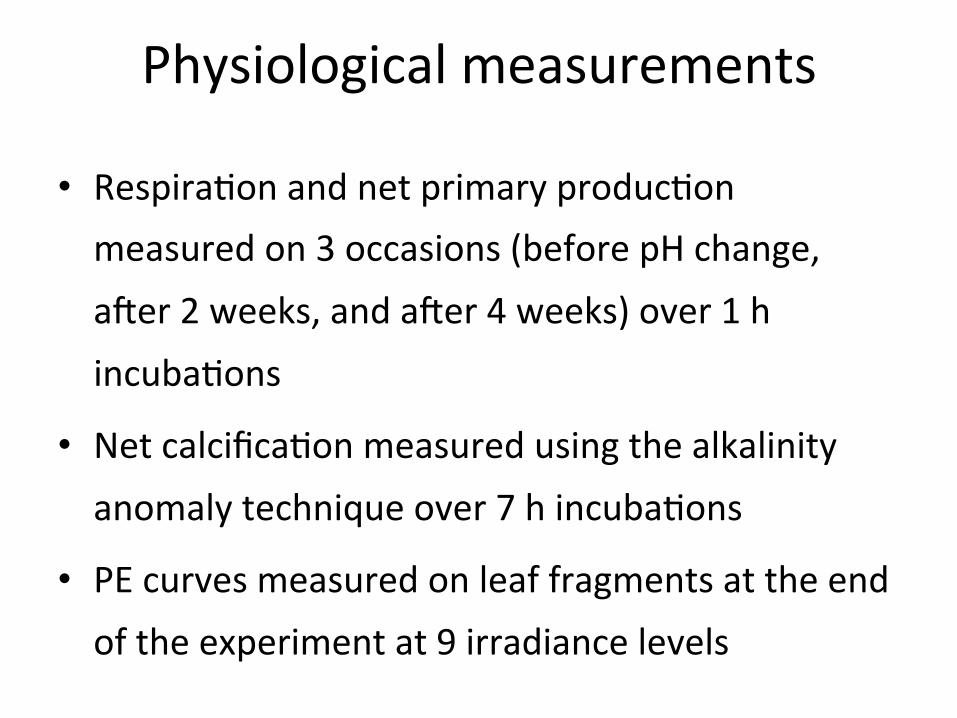
Physiological measurements
• Respira0on and net primary produc0on measured on 3 occasions (before pH change, acer 2 weeks, and acer 4 weeks) over 1 h incuba0ons
• Net calcifica0on measured using the alkalinity anomaly technique over 7 h incuba0ons
• PE curves measured on leaf fragments at the end of the experiment at 9 irradiance levels
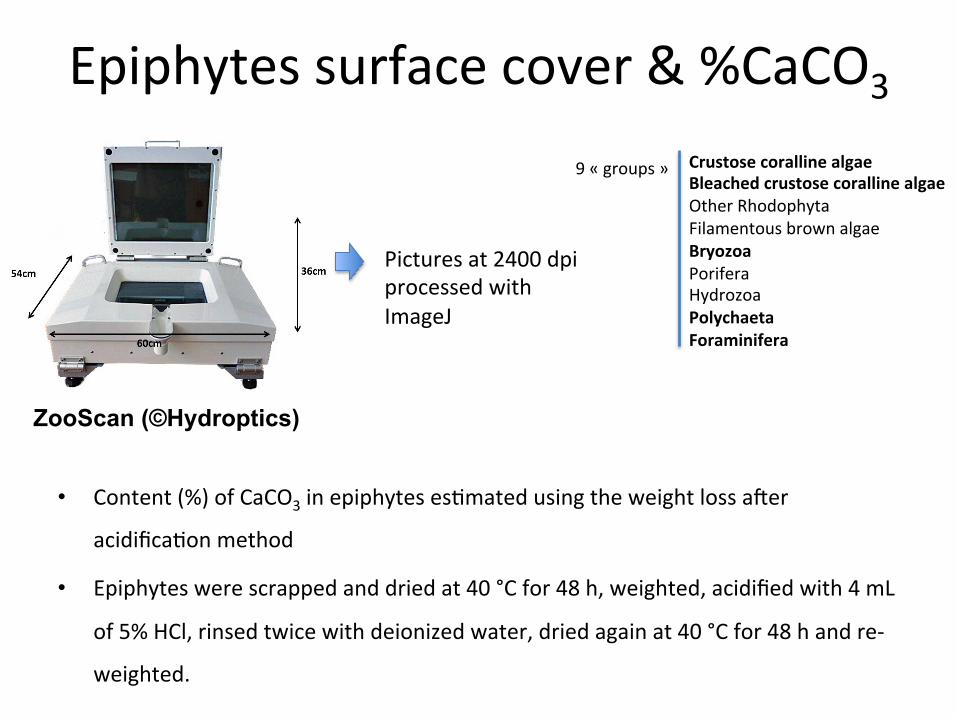
Epiphytes surface cover & %CaCO3
ZooScan (©Hydroptics)
Crustose coralline algae Bleached crustose coralline algae Other Rhodophyta Filamentous brown algae Bryozoa Porifera Hydrozoa Polychaeta Foraminifera
9 « groups »
Pictures at 2400 dpi processed with ImageJ
• Content (%) of CaCO3 in epiphytes es0mated using the weight loss acer
acidifica0on method
• Epiphytes were scrapped and dried at 40 °C for 48 h, weighted, acidified with 4 mL
of 5% HCl, rinsed twice with deionized water, dried again at 40 °C for 48 h and re-‐
weighted.
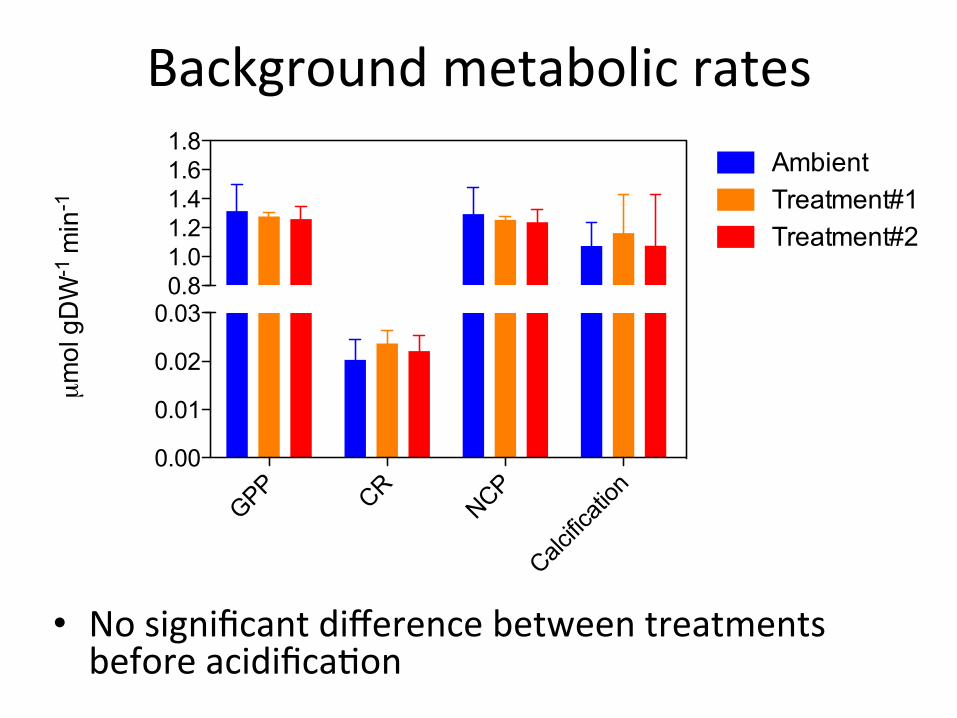
Background metabolic rates
GPP CRNCP
Calcific
ation
0.00
0.01
0.02
0.030.81.01.21.41.61.8
AmbientTreatment#1Treatment#2
µm
ol g
DW
-1 m
in-1
• No significant difference between treatments before acidifica0on
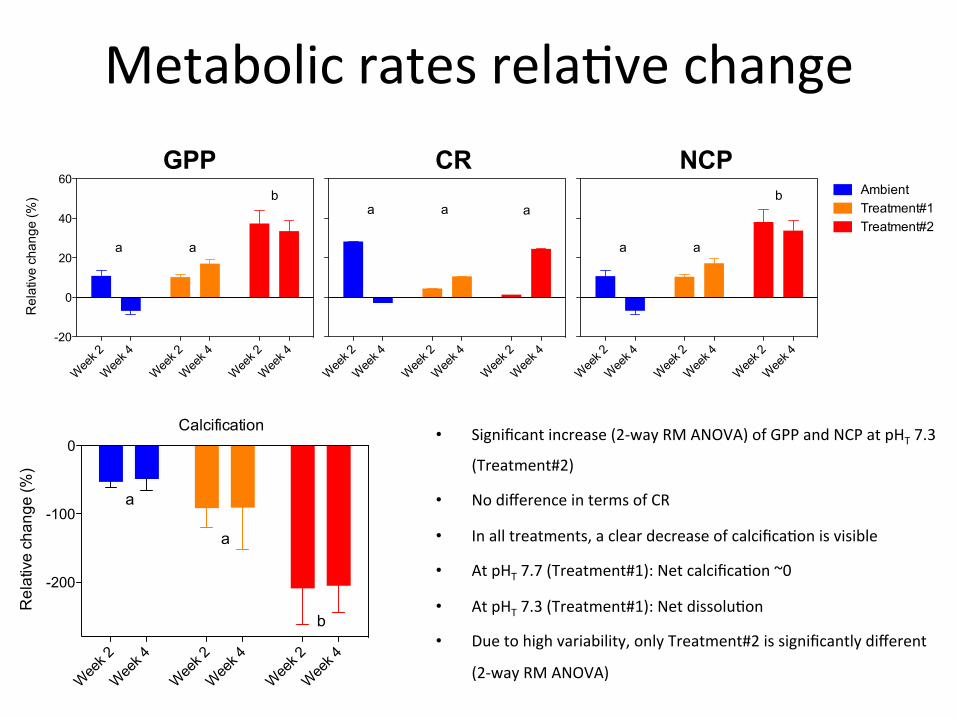
Metabolic rates rela0ve change
Week 2
Week 4
Week 2
Week 4
Week 2
Week 4
-20
0
20
40
60
Rel
ativ
e ch
ange
(%)
a a
b
Week 2
Week 4
Week 2
Week 4
Week 2
Week 4
a a a
Week 2
Week 4
Week 2
Week 4
Week 2
Week 4
AmbientTreatment#1Treatment#2
a a
b
GPP CR NCP
• Significant increase (2-‐way RM ANOVA) of GPP and NCP at pHT 7.3
(Treatment#2)
• No difference in terms of CR
• In all treatments, a clear decrease of calcifica0on is visible
• At pHT 7.7 (Treatment#1): Net calcifica0on ~0
• At pHT 7.3 (Treatment#1): Net dissolu0on
• Due to high variability, only Treatment#2 is significantly different
(2-‐way RM ANOVA)
W
eek 2
Wee
k 4
Wee
k 2
Wee
k 4
Wee
k 2
Wee
k 4
-200
-100
0
a
a
b
Rel
ativ
e ch
ange
(%)
Calcification
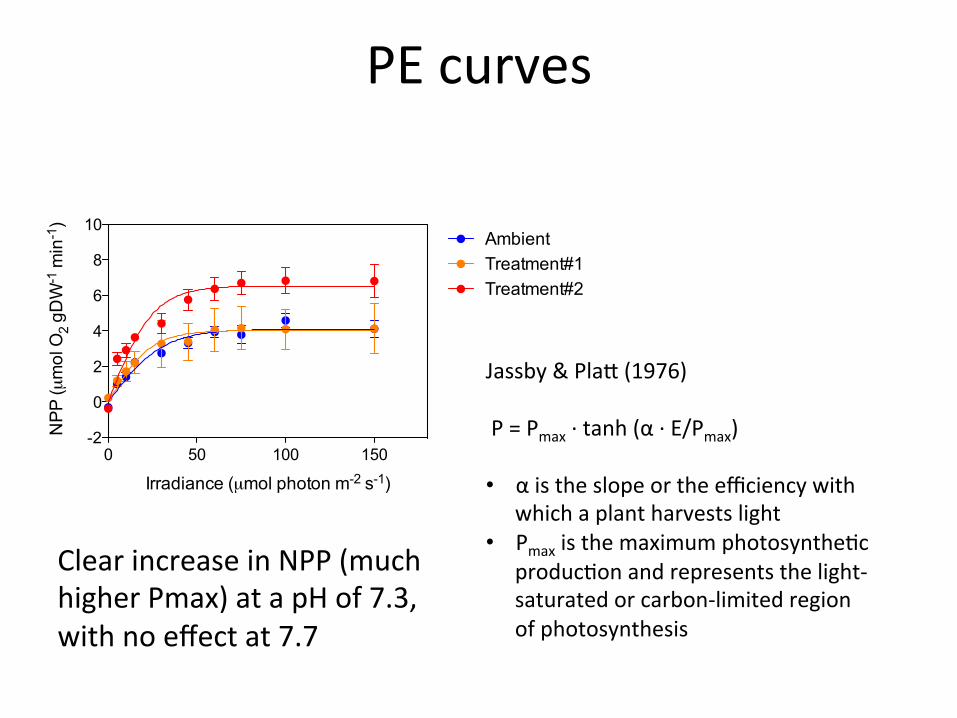
PE curves
0 50 100 150-2
0
2
4
6
8
10AmbientTreatment#1Treatment#2
Irradiance (µmol photon m-2 s-1)
NPP
(µm
ol O2 g
DW-1
min-1
)
Jassby & Pla= (1976) P = Pmax ·∙ tanh (α ·∙ E/Pmax) • α is the slope or the efficiency with
which a plant harvests light • Pmax is the maximum photosynthe0c
produc0on and represents the light-‐saturated or carbon-‐limited region of photosynthesis
Clear increase in NPP (much higher Pmax) at a pH of 7.3, with no effect at 7.7
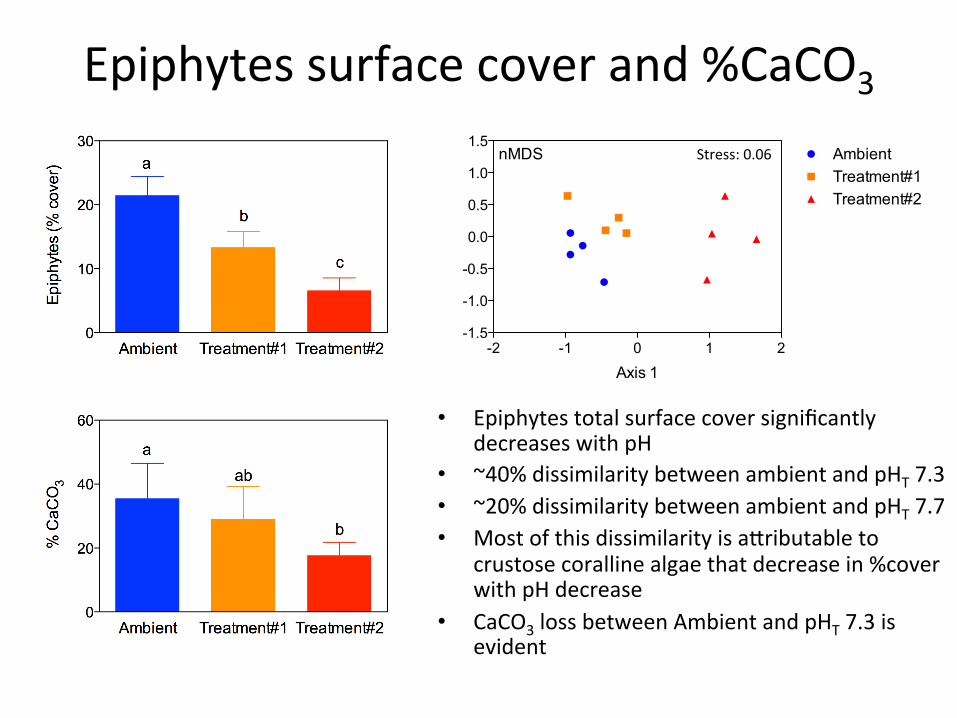
Epiphytes surface cover and %CaCO3
• Epiphytes total surface cover significantly decreases with pH
• ~40% dissimilarity between ambient and pHT 7.3 • ~20% dissimilarity between ambient and pHT 7.7 • Most of this dissimilarity is a=ributable to
crustose coralline algae that decrease in %cover with pH decrease
• CaCO3 loss between Ambient and pHT 7.3 is evident
-2 -1 0 1 2-1.5
-1.0
-0.5
0.0
0.5
1.0
1.5AmbientTreatment#1Treatment#2
Axis 1
nMDS Stress: 0.06
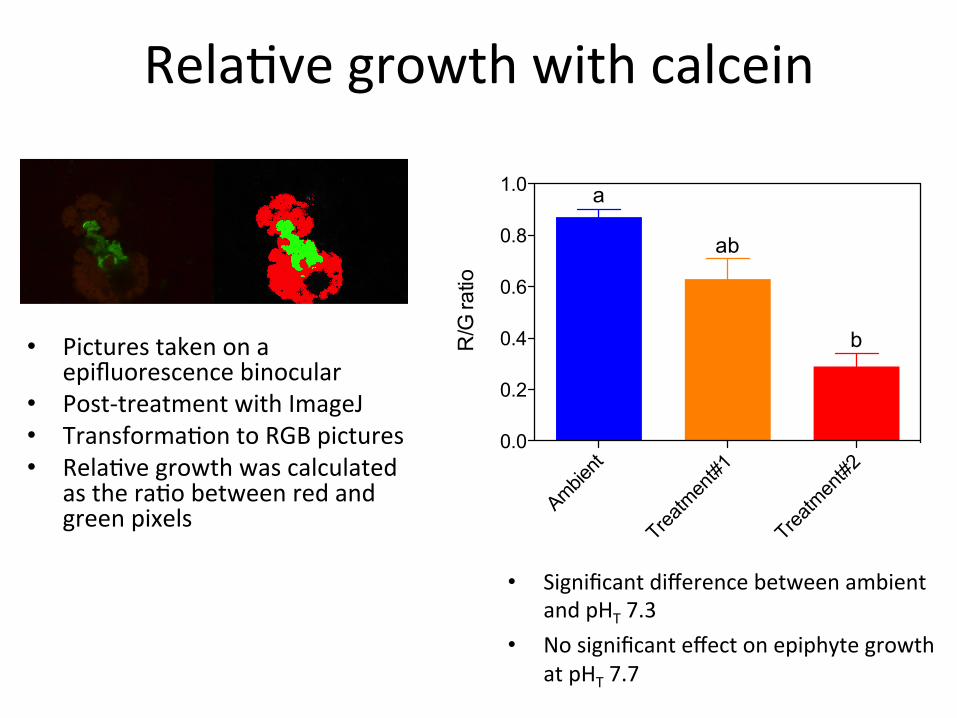
Rela0ve growth with calcein
Ambient
Treatm
ent#1
Treatm
ent#2
0.0
0.2
0.4
0.6
0.8
1.0
R/G
ratio
a
ab
b
• Significant difference between ambient and pHT 7.3
• No significant effect on epiphyte growth at pHT 7.7
• Pictures taken on a epifluorescence binocular
• Post-‐treatment with ImageJ • Transforma0on to RGB pictures • Rela0ve growth was calculated
as the ra0o between red and green pixels
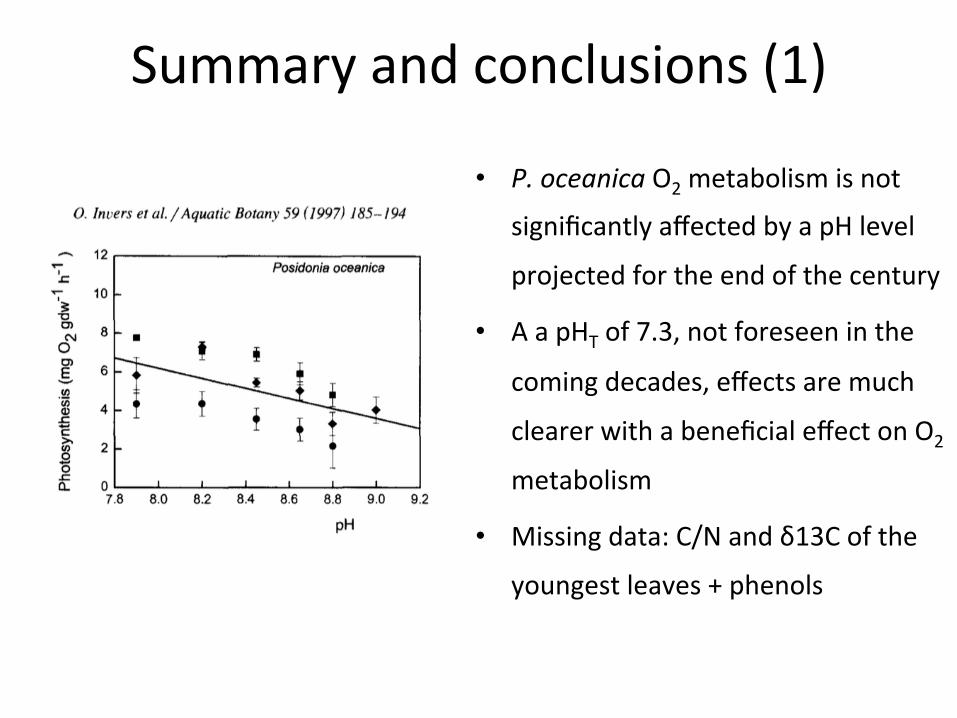
Summary and conclusions (1)
• P. oceanica O2 metabolism is not
significantly affected by a pH level
projected for the end of the century
• A a pHT of 7.3, not foreseen in the
coming decades, effects are much
clearer with a beneficial effect on O2
metabolism
• Missing data: C/N and δ13C of the
youngest leaves + phenols
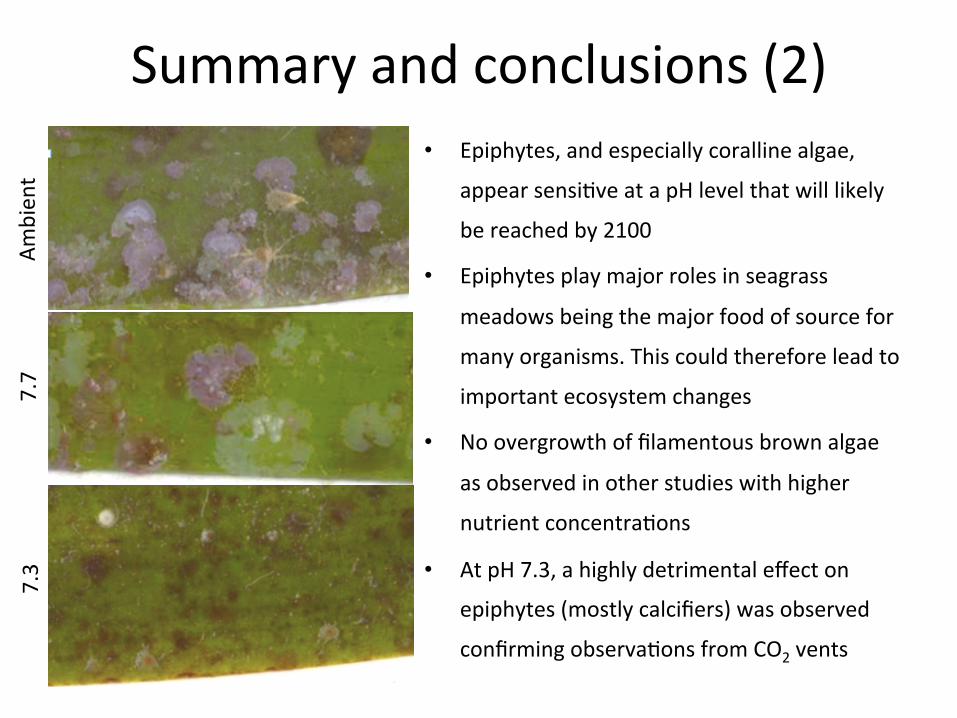
Summary and conclusions (2) • Epiphytes, and especially coralline algae,
appear sensi0ve at a pH level that will likely
be reached by 2100
• Epiphytes play major roles in seagrass
meadows being the major food of source for
many organisms. This could therefore lead to
important ecosystem changes
• No overgrowth of filamentous brown algae
as observed in other studies with higher
nutrient concentra0ons
• At pH 7.3, a highly detrimental effect on
epiphytes (mostly calcifiers) was observed
confirming observa0ons from CO2 vents
Ambien
t 7.7
7.3
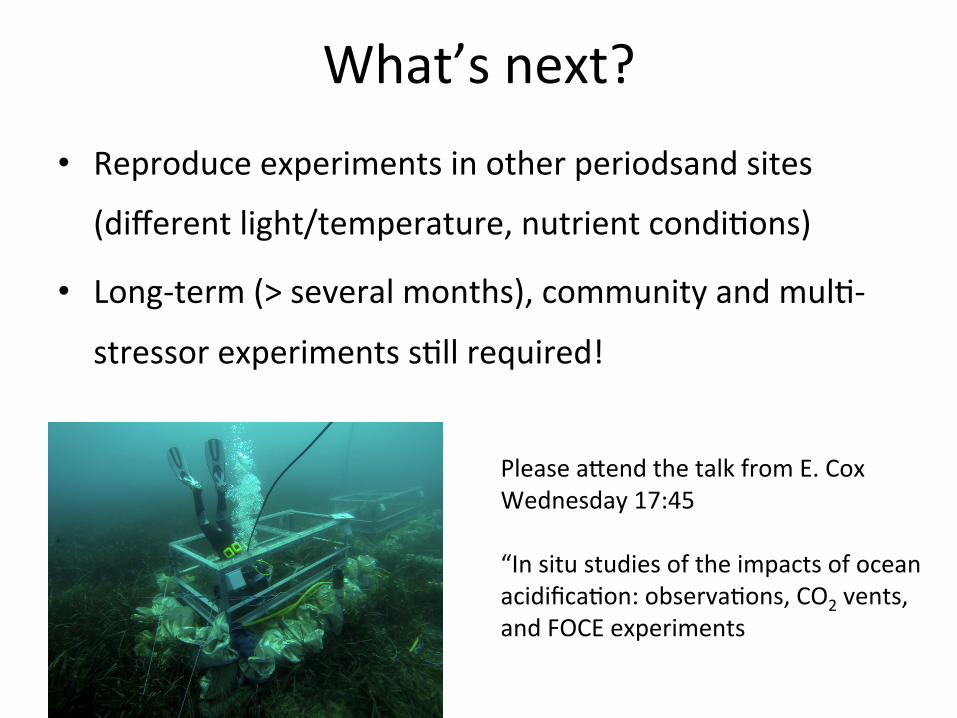
What’s next? • Reproduce experiments in other periodsand sites
(different light/temperature, nutrient condi0ons)
• Long-‐term (> several months), community and mul0-‐
stressor experiments s0ll required!
Please a=end the talk from E. Cox Wednesday 17:45 “In situ studies of the impacts of ocean acidifica0on: observa0ons, CO2 vents, and FOCE experiments
Thank you for your a=en0on
Acknowledgements • A. Elineau for help with the ZooScan • C. Rouvière for help with the epifluorescence binocular
Related Documents