Value at Risk • Concepts, data, industry estimates – Adam Hoppes – Moses Chao • Portfolio applications – Cathy Li – Muthu Ramanujam • Comparison to volatility and beta – John Summers – Wei-Hao Tseng

Value at Risk Concepts, data, industry estimates –Adam Hoppes –Moses Chao Portfolio applications –Cathy Li –Muthu Ramanujam Comparison to volatility and.
Dec 18, 2015
Welcome message from author
This document is posted to help you gain knowledge. Please leave a comment to let me know what you think about it! Share it to your friends and learn new things together.
Transcript

Value at Risk
• Concepts, data, industry estimates
– Adam Hoppes
– Moses Chao
• Portfolio applications
– Cathy Li
– Muthu Ramanujam
• Comparison to volatility and beta
– John Summers
– Wei-Hao Tseng

Value at Risk:
The objective of this presentation is to introduce an alternative way of looking at risk.
Data Description:
Monthly returns from 1970 to 2001 were collected on the following industries and the total market(NYMEX, AMEX, NASDAQ).
Industries: SIC Codes:– Households (2047-3995)– Chip Manufactures (3622-3812)– Transportation (4000-4789)– Oil (1399-2999)Source: http://mba.tuck.dartmouth.edu/pages/faculty/ken.french/
• Each company is assigned to an industry portfolio based on their SIC code. Value weighted monthly returns are used for the analysis.
Description of Value at Risk:
• Definition:
– Value at Risk is an estimate of the worst possible loss an investment could realize over a given time horizon, under normal market conditions (defined by a given level of confidence).
– To estimate Value at Risk a confidence level must be specified.
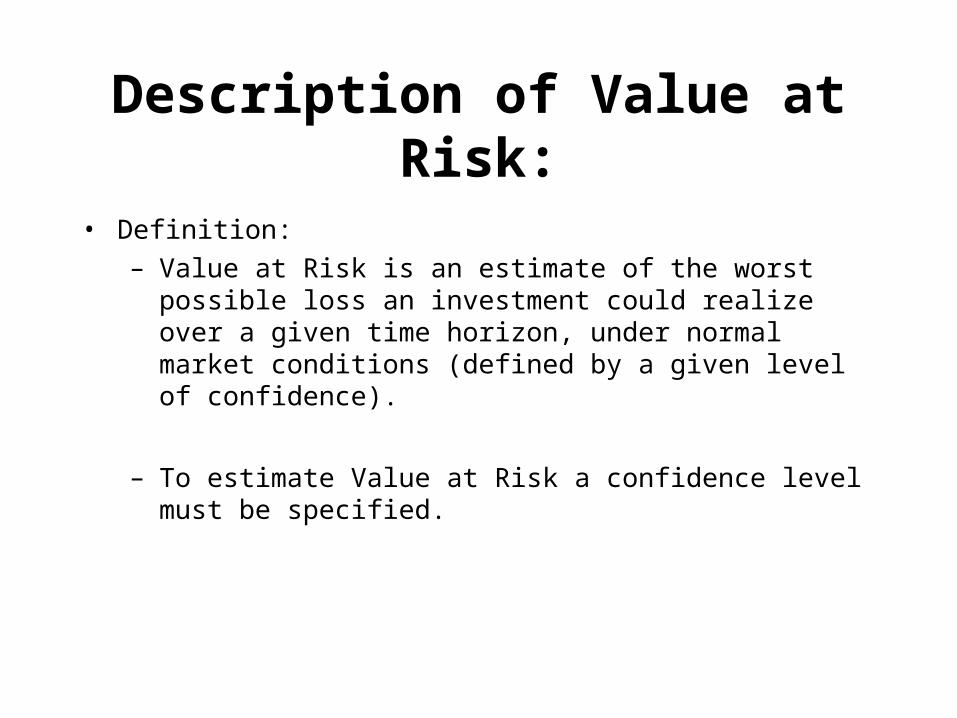
5% 95%
Choice of confidence level – 95%
Normal market conditions – the returns that account for 95% of the distribution of possible outcomes.Abnormal market conditions – the returns that account for the other 5% of the possible outcomes.
Investment returns

If a 95% confidence level is used to estimateValue at Risk for a monthly horizon;
losses greater than the Value at Risk estimateare expected to occur one in twenty months (5%).
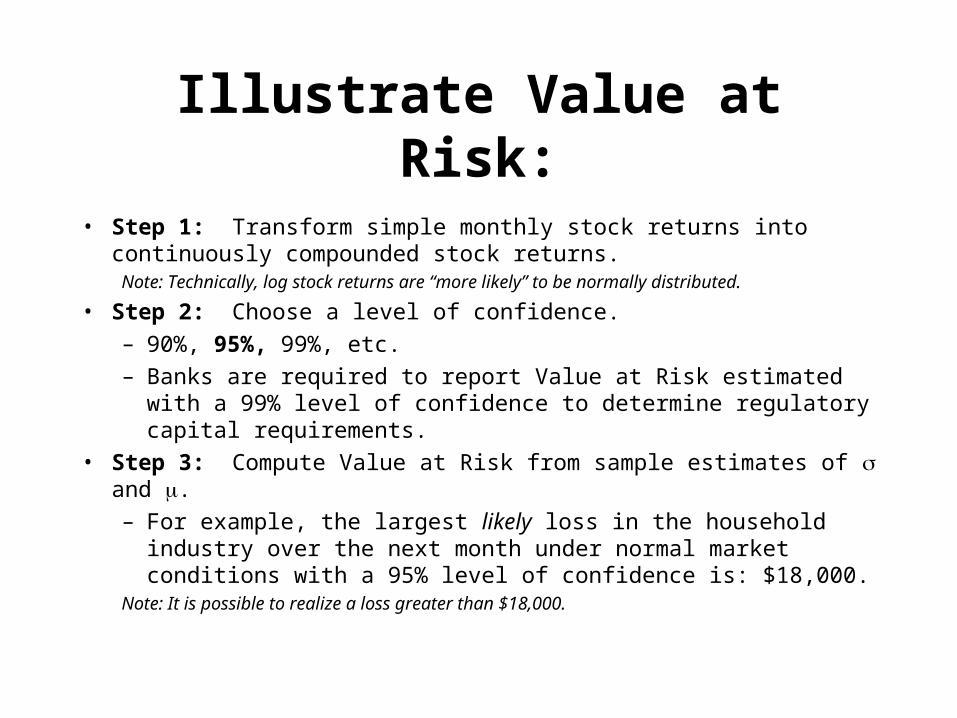
Illustrate Value at Risk:
• Step 1: Transform simple monthly stock returns into continuously compounded stock returns.
Note: Technically, log stock returns are “more likely” to be normally distributed.
• Step 2: Choose a level of confidence.
– 90%, 95%, 99%, etc.
– Banks are required to report Value at Risk estimated with a 99% level of confidence to determine regulatory capital requirements.
• Step 3: Compute Value at Risk from sample estimates of and .
– For example, the largest likely loss in the household industry over the next month under normal market conditions with a 95% level of confidence is: $18,000.
Note: It is possible to realize a loss greater than $18,000.

Other Common Interpretations of Value at Risk:
• “an attempt to provide a single number for senior management summarizing the total risk in a portfolio of assets”
– Hull, OF&OD
• “an estimate, with a given degree of confidence, of how much one can lose from one’s portfolio over a given time horizon”
– Wilmott, PWOQF

Conclusions:
• Value at Risk can be used as a stand alone risk measure or be applied to a portfolio of assets.
• Value at Risk is a dollar value risk measure, as opposed to the other measurements of risk in the financial industry such as: beta and standard deviation.
• “We are X percent certain that we will not lose more than V dollars in the next N days.” – Hull
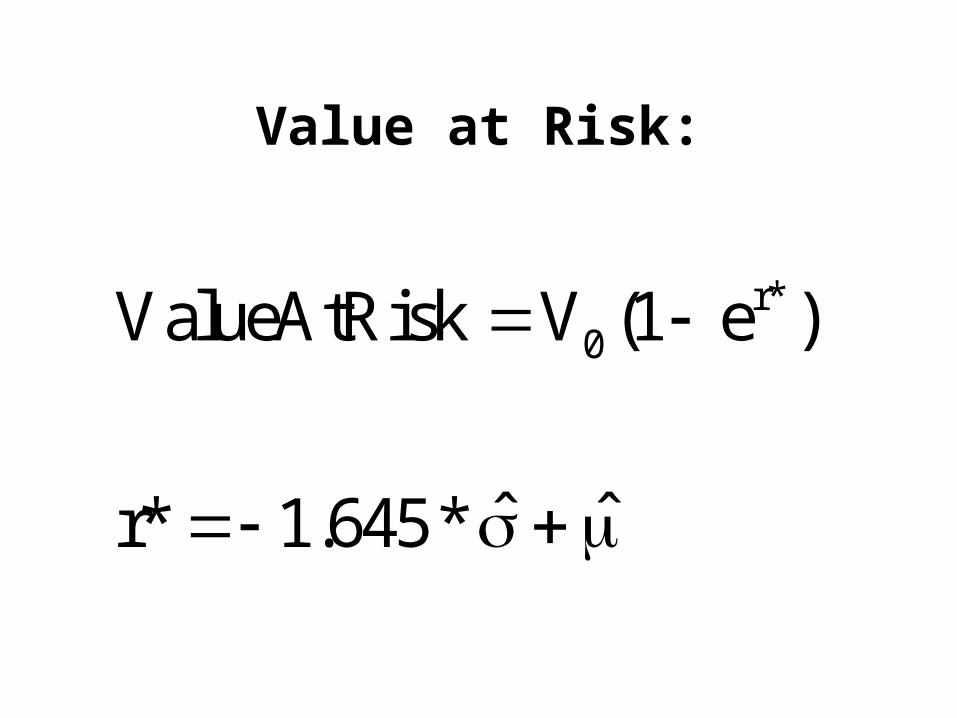
Value at Risk:
r*0ValueAtRisk V (1 e )
ˆ ˆr* 1.645*
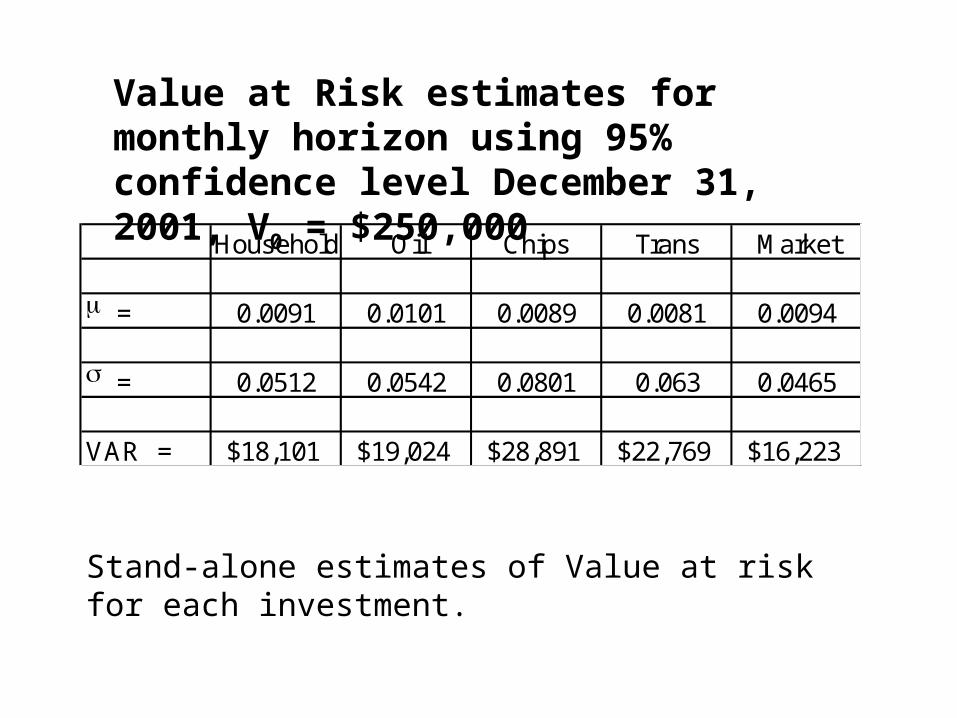
Household Oil Chips Trans Market
= 0.0091 0.0101 0.0089 0.0081 0.0094
= 0.0512 0.0542 0.0801 0.063 0.0465
VAR = $18,101 $19,024 $28,891 $22,769 $16,223
Value at Risk estimates for monthly horizon using 95% confidence level December 31, 2001, V0 = $250,000
Stand-alone estimates of Value at risk for each investment.
Value at Risk
Part Π
Value at Risk(Portfolio)
• One month
• Parametric method-normal distribution
• Current market value of portfolio $1M
• Confidence level 95%

Portfolio
• Equally weighted portfolio; household, chips, transportation and oil.
• Sample used to estimate variance-covaraince matrix.
• Rp=W1R1+W2R2+W3R3+W4R4
• σp²=ΣWi σi²+Σρi,jWiWjσiσj
• VAR=V0*(1-exp(r*))
Variance & Covariance
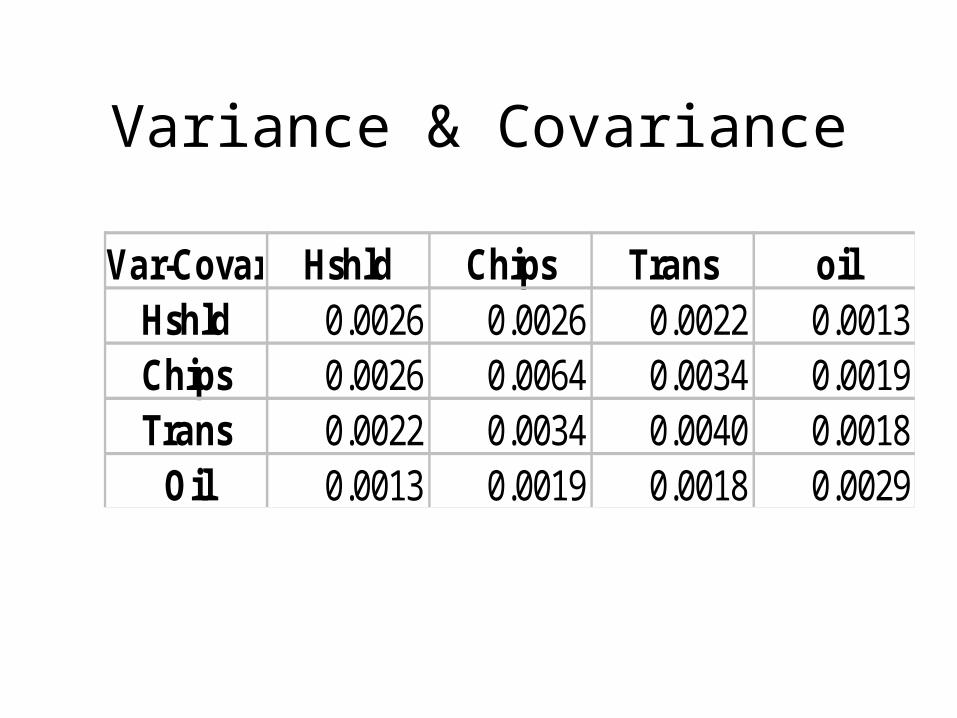
Var-Covar Hshld Chips Trans oilHshld 0.0026 0.0026 0.0022 0.0013Chips 0.0026 0.0064 0.0034 0.0019Trans 0.0022 0.0034 0.0040 0.0018
Oil 0.0013 0.0019 0.0018 0.0029
Correlation
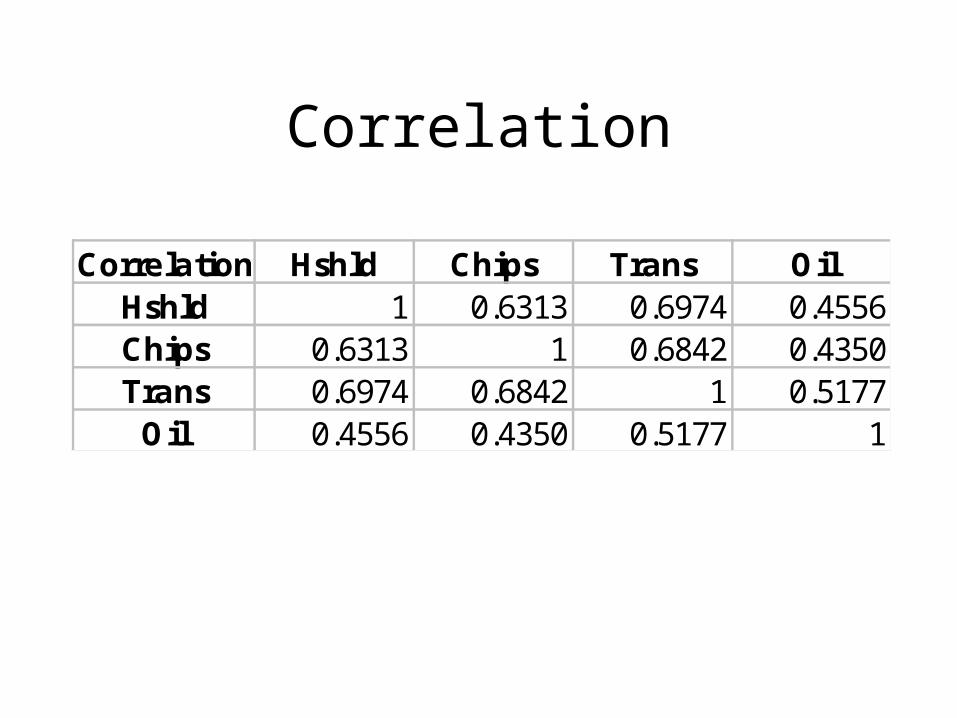
Correlation Hshld Chips Trans OilHshld 1 0.6313 0.6974 0.4556Chips 0.6313 1 0.6842 0.4350Trans 0.6974 0.6842 1 0.5177
Oil 0.4556 0.4350 0.5177 1
Portfolio benefits
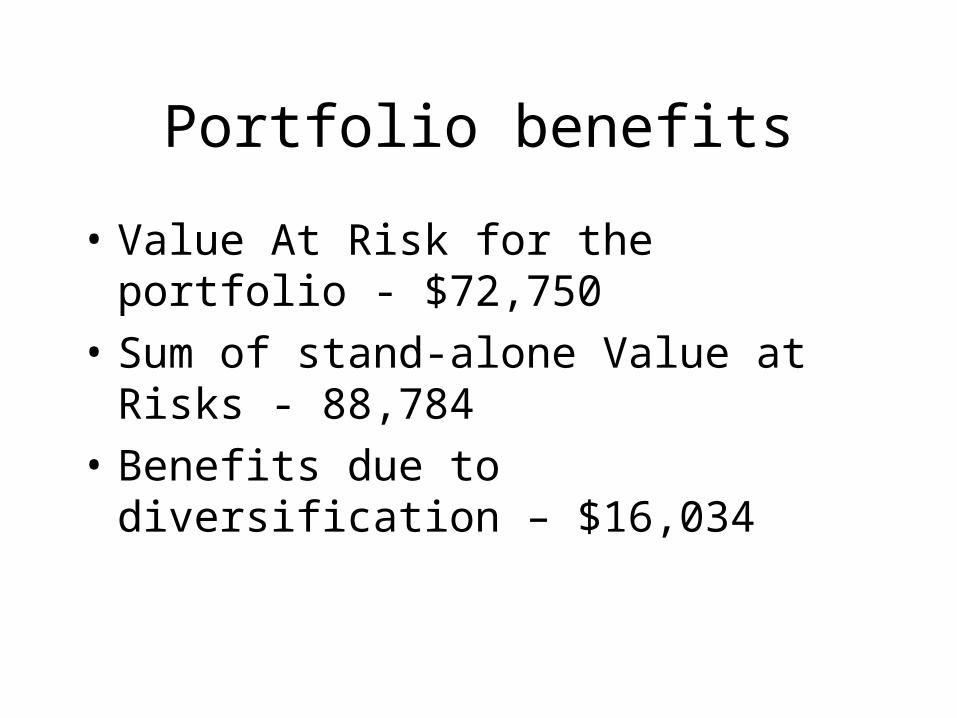
• Value At Risk for the portfolio - $72,750
• Sum of stand-alone Value at Risks - 88,784
• Benefits due to diversification – $16,034
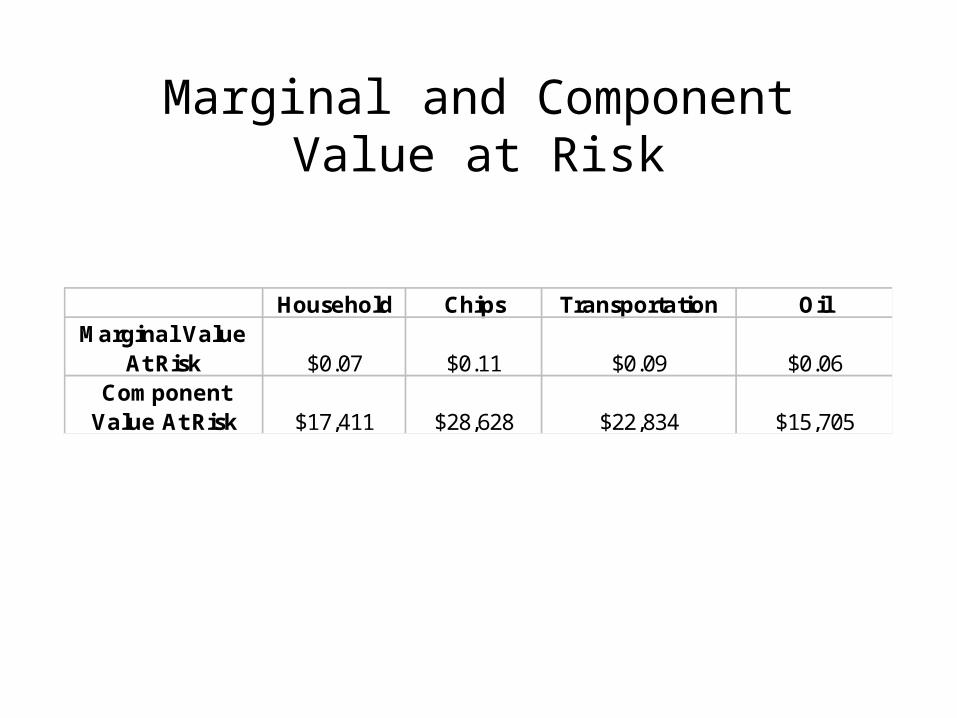
Marginal and Component Value at Risk
Household Chips Transportation OilMarginal Value
At Risk $0.07 $0.11 $0.09 $0.06Component
Value At Risk $17,411 $28,628 $22,834 $15,705
Value at Risk
Part ΠI

Measures of Risk
• Standard Deviation (• Beta (ß)• Value at Risk (VaR)

Measured by
VAR
Measured by
ß
Stand-Alone Risk
Or
Total Risk
Systematic Risk
Unsystematic Risk
Non-Diversifiable
Risk
Diversifiable Risk
Market Risk Company-Specific Risk
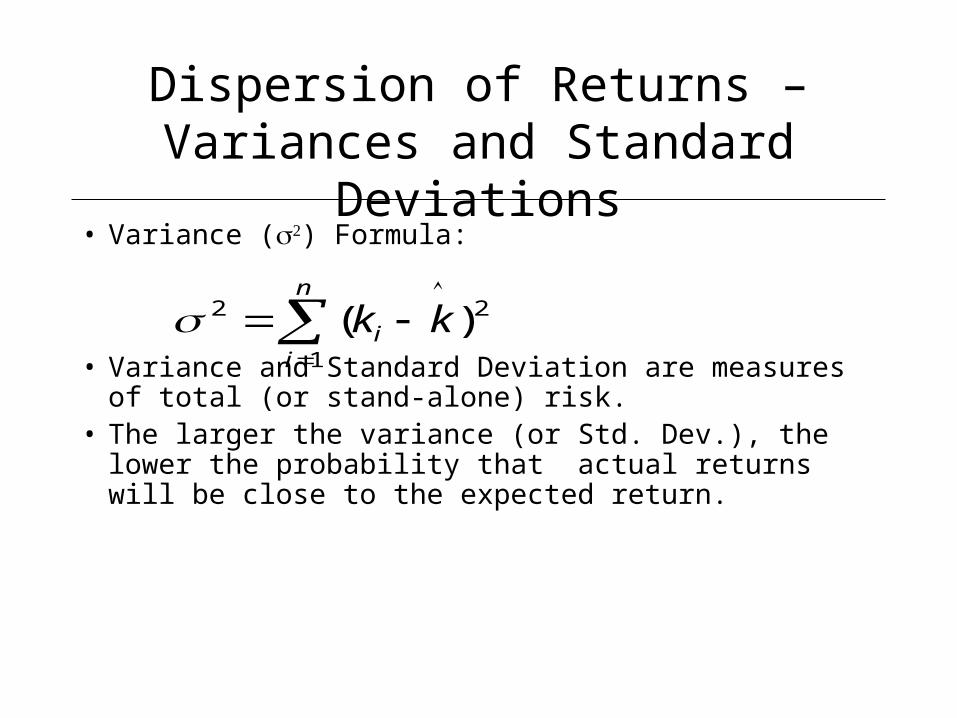
Dispersion of Returns –Variances and Standard Deviations
• Variance () Formula:
• Variance and Standard Deviation are measures of total (or stand-alone) risk.
• The larger the variance (or Std. Dev.), the lower the probability that actual returns will be close to the expected return.
2
1
2 )(
kkn
ii

Risk Measure - Beta (ß)
• Beta (ß) formula:
• Beta measures the portfolio’s systematic risk, that is, the degree to which its return is correlated with the return on the market as a whole.
• Stock with high beta (ß>1) is more volatile than the market taken as a whole.
)(
),(
m
mi
kVar
kkCov

Risk Measures – Value at Risk (VaR)
• VaR is a measure of risk based on a probability of loss and a specific time horizon.
• VaR translates portfolio volatility into a dollar value.
• Measure of Total Risk) rather than Systematic (or Non-Diversifiable Risk) measured by Beta.
Advantages of VaR
• VaR provides an measure of total risk.• VaR is an easy number to understand and explain
to clients.• VaR translates portfolio volatility into a dollar
value.• VaR is useful for monitoring and controlling risk
within the portfolio.

Advantages of VaR (Cont.)
• VaR can measure the risk of many types of financial securities (i.e., stocks, bonds, commodities, foreign exchange, off-balance-sheet derivatives such as futures, forwards, swaps, and options, and etc.)
• As a tool, VaR is very useful for comparing a portfolio with the market portfolio (S&P500).
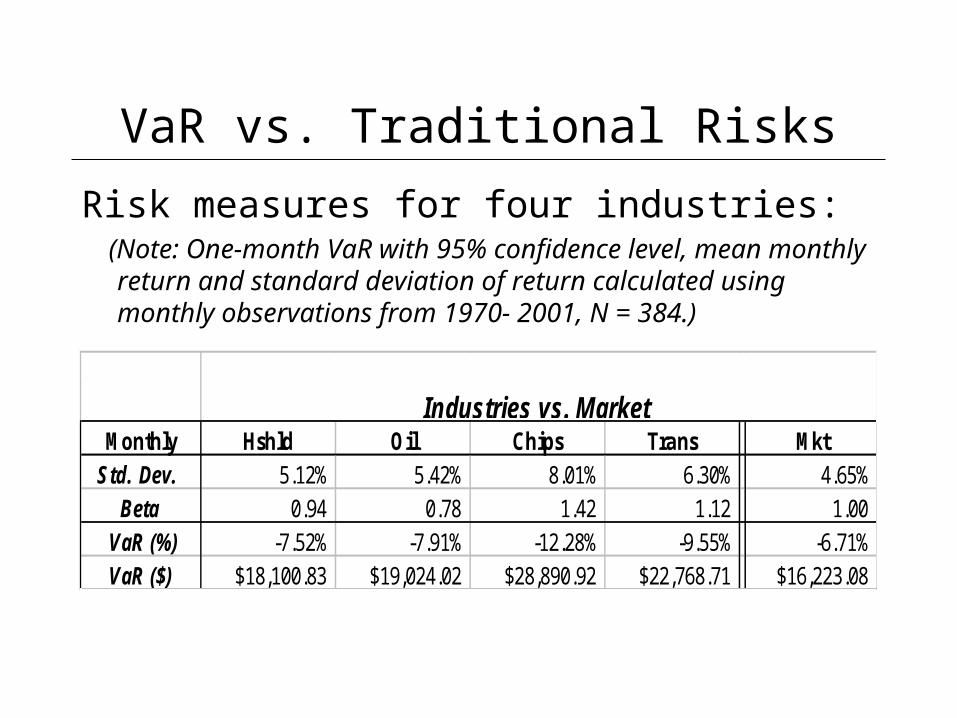
VaR vs. Traditional Risks
Risk measures for four industries: (Note: One-month VaR with 95% confidence level, mean monthly
return and standard deviation of return calculated using monthly observations from 1970- 2001, N = 384.)
Monthly Hshld Oil Chips Trans MktStd. Dev. 5.12% 5.42% 8.01% 6.30% 4.65%
Beta 0.94 0.78 1.42 1.12 1.00 VaR (%) -7.52% -7.91% -12.28% -9.55% -6.71%VaR ($) $18,100.83 $19,024.02 $28,890.92 $22,768.71 $16,223.08
Industries vs. Market

Relative VaR
• Relative VaR measures the risk of underperformance relative to a pre-defined benchmark.
• Relative VaR is calculated from a time series of the difference in monthly logarithmic returns of an investment minus the logarithmic return of the benchmark portfolio.

Relative VaR (Cont.)
Note: One-month VaR and Relative VaR with 95% confidence level,
mean monthly return and standard deviation of return calculated using
monthly observations from 1970- 2001, N = 384.
Monthly Hshld Oil Chips Trans MktAverage 0.91% 1.01% 0.89% 0.81% 0.94%Std. Dev. 5.12% 5.42% 8.01% 6.30% 4.65% VaR (%) -7.52% -7.91% -12.28% -9.55% -6.71%VaR ($) $18,100.83 $19,024.02 $28,890.92 $22,768.71 $16,223.08
Monthly Rel_Hshld Rel_Oil Rel_Chips Rel_Trans MktAverage -0.04% 0.07% -0.05% -0.13% -Std. Dev. 2.69% 4.17% 4.90% 3.59% -
Relative VaR (%) -4.47% -6.79% -8.11% -6.04% -Relative VaR ($) $10,917.36 $16,417.18 $19,471.36 $14,646.77 -
Related Documents