VALUE ADDED TAX AND TAX CAPACITY IN DEVELOPING COUNTRIES By Konara Mudiyanselage Harsha Kaushalya Dasanayake BSc(Accounting)(Sp), MSc (Econ), ACA This thesis is presented for the degree of Doctor of Philosophy of The University of Western Australia Economics Department Business School The University of Western Australia Perth, Australia 2021

Welcome message from author
This document is posted to help you gain knowledge. Please leave a comment to let me know what you think about it! Share it to your friends and learn new things together.
Transcript
VALUE ADDED TAX AND TAX CAPACITY
IN DEVELOPING COUNTRIES
By
Konara Mudiyanselage Harsha Kaushalya Dasanayake
BSc(Accounting)(Sp), MSc (Econ), ACA
This thesis is presented for the degree of Doctor of Philosophy of
The University of Western Australia
Economics Department
Business School
The University of Western Australia
Perth, Australia
2021


Dedicated to the love of my life:
Dilini, Dehara and Janiru


THESIS DECLARATION
I, Konara Mudiyanselage Harsha Kaushalya Dasanayake, certify that:
This thesis has been accomplished during enrolment in this degree.
This thesis does not contain material which has been submitted for the award
of any other degree or diploma in my name, in any university or other tertiary
institution.
In the future, no part of this thesis will be used in a submission in my name, for
any other degree or diploma in any university or other tertiary institution without
the prior approval of The University of Western Australia and where applicable,
any partner institution responsible for the joint-award of this degree.
This thesis does not contain any material previously published or written by an-
other person, except where due reference has been made in the text and, where
relevant, in the Authorship Declaration that follows.
This thesis does not violate or infringe any copyright, trademark, patent, or other
rights whatsoever of any person. This thesis contains work prepared for publica-
tion, some of which has been co-authored.
Signature:
Date: 20 August 2021
i

ABSTRACT
Developing countries find it challenging to generate enough tax revenue to meet
essential government expenditure needs on social welfare and economic develop-
ment. Weak revenue performance has become a crucial source of instability and
a constraint on sustainable growth. However, over the years, taxation technol-
ogy has developed in leaps and bounds to provide more sophisticated taxation
methods that improve both tax capacity and efficiency. This leaves us with an
interesting question of why many developing countries have still failed to reap the
benefits of new taxation methods to enhance their tax capacity. Concentrating
on one such innovation in taxation: Value Added Tax (VAT), this thesis offers
three related studies (Chapters 2 to 4) that investigate the effectiveness of VAT
on tax capacity of developing countries.
The first study (Chapter 2) focuses on the main channels that constrain the ef-
fectiveness of VAT in developing countries. The first section of this study estab-
lishes the positive impact of VAT adoption on tax capacity using the difference-
in-difference approach with an instrumental variable considering a developing
country panel. In the next section, we focus on three different channels: effective
tax rate, tax base and informal sector, to decompose the effect of VAT adoption
on tax capacity. Our findings re-confirm that the presence of VAT has a positive
impact on both total and indirect tax-GDP share in developing countries. Results
also reveal that the main channel of increase in tax capacity is through an increase
in the effective tax rate. However, the role of VAT as an information source that
compels the informal sector to move to the formal sector does not significantly
contribute towards the increase in tax capacity in developing countries.
In the second study (Chapter 3), we examine the diffusion and the appropriate-
iii
ness of VAT as an economic institution for each country based on its impact on
tax capacity. For this purpose, we develop an appropriateness index based on the
assumption that VAT diffusion is jointly determined by the countries’ geography
and socio-economic condition. In the regression analysis, we use a spatial regres-
sion model to disentangle the appropriateness of VAT from geographic factors
and use geographic neighbours as an instrumental variable of VAT introduction
with interaction terms. Consistent with the literature, our findings confirm that
VAT diffusion is primarily driven by countries’ geographic distance. More impor-
tantly, our results show that the effect of VAT adoption on tax capacity depends
on its appropriateness, where countries with a higher appropriateness index have
a more significant increase in tax capacity after the introduction of VAT.
The final study (Chapter 4) is based on micro firm survey data in Sri Lanka. We
study the variation in the distribution of formal firms below the VAT threshold
to investigate the effect of VAT adoption and change in the VAT rate on firms’
sales reporting. Using a repeated cross-section survey data from 1994 to 2017 and
identification with difference-in-difference, we find that proportion of firms below
the threshold has decreased by 11 percentage points immediately after the VAT
introduction. However, an increase in the standard VAT rate from 10% to 15% in
2005 has increased the proportion of firms below the threshold by 5.9 percentage
points. This suggests 1.2% more firms de-register for every 1% increase in the
standard VAT rate. The implications of these results are two-folded. On the one
hand, VAT is effective in information revelation through registration. However,
on the other hand its informational role is limited, and the de-registration makes
it harder to enhance tax capacity by setting up a higher tax rate.
The findings of these studies are expected to contribute towards a better design
and implementation of VAT policy in developing countries, which will ensure an
enhanced tax capacity and an efficient taxation system providing much-needed
funds for development and social welfare.
iv

CONTENTS
THESIS DECLARATION . . . . . . . . . . . . . . . . . . . . . . i
ABSTRACT . . . . . . . . . . . . . . . . . . . . . . . . . . . . . . iii
TABLE OF CONTENTS . . . . . . . . . . . . . . . . . . . . . . . vii
LIST OF FIGURES . . . . . . . . . . . . . . . . . . . . . . . . . viii
LIST OF TABLES . . . . . . . . . . . . . . . . . . . . . . . . . . ix
ACKNOWLEDGEMENTS . . . . . . . . . . . . . . . . . . . . . . xi
AUTHORSHIP DECLARATION: CO-AUTHORED PUBLICA-
TIONS . . . . . . . . . . . . . . . . . . . . . . . . . . . . . . . . . xiii
1 INTRODUCTION 1
1.1 Background and Motivation . . . . . . . . . . . . . . . . . . . . . 1
1.2 Contribution and Organisation of the Thesis . . . . . . . . . . . . 2
REFERENCES . . . . . . . . . . . . . . . . . . . . . . . . . . . . . . . 5
2 WHAT IMPAIRS THE “MONEY MACHINE” OF VAT
IN DEVELOPING COUNTRIES? 7
2.1 Introduction . . . . . . . . . . . . . . . . . . . . . . . . . . . . . . 7
2.2 Data, Main Variables and Motivating Facts . . . . . . . . . . . . . 10
2.2.1 Data Description . . . . . . . . . . . . . . . . . . . . . . . 10
2.2.2 Measurement of Main Variables . . . . . . . . . . . . . . . 11
2.2.3 Motivating Facts . . . . . . . . . . . . . . . . . . . . . . . 12
2.3 Empirical Strategy . . . . . . . . . . . . . . . . . . . . . . . . . . 13
2.3.1 OLS . . . . . . . . . . . . . . . . . . . . . . . . . . . . . . 13
2.3.2 Leading Years . . . . . . . . . . . . . . . . . . . . . . . . . 14
2.3.3 Event Study . . . . . . . . . . . . . . . . . . . . . . . . . . 14
2.3.4 IV . . . . . . . . . . . . . . . . . . . . . . . . . . . . . . . 15
v
2.4 Empirical Results . . . . . . . . . . . . . . . . . . . . . . . . . . . 16
2.4.1 OLS Estimation . . . . . . . . . . . . . . . . . . . . . . . . 16
2.4.2 IV Estimation . . . . . . . . . . . . . . . . . . . . . . . . . 19
2.4.3 Test of Exclusion Restriction . . . . . . . . . . . . . . . . . 22
2.5 Mechanism . . . . . . . . . . . . . . . . . . . . . . . . . . . . . . 23
2.6 Additional Results . . . . . . . . . . . . . . . . . . . . . . . . . . 26
2.6.1 Effect on Direct Taxes . . . . . . . . . . . . . . . . . . . . 26
2.6.2 Heterogeneity . . . . . . . . . . . . . . . . . . . . . . . . . 30
2.7 Conclusion . . . . . . . . . . . . . . . . . . . . . . . . . . . . . . . 33
REFERENCES . . . . . . . . . . . . . . . . . . . . . . . . . . . . . . . 35
Appendix . . . . . . . . . . . . . . . . . . . . . . . . . . . . . . . . . . 38
3 APPROPRIATENESS AND EFFECTIVENESS OF VAT: EVI-
DENCE FROM CROSS-COUNTRY VAT DIFFUSION 46
3.1 Introduction . . . . . . . . . . . . . . . . . . . . . . . . . . . . . . 46
3.2 Data, Spatial Matrices and Motivating Facts . . . . . . . . . . . . 50
3.2.1 Data Description . . . . . . . . . . . . . . . . . . . . . . . 50
3.2.2 Spatial Weight Matrices . . . . . . . . . . . . . . . . . . . 51
3.2.3 Motivating Facts . . . . . . . . . . . . . . . . . . . . . . . 52
3.3 Empirical Strategy and Regression Specifications . . . . . . . . . 53
3.3.1 Empirical Strategy . . . . . . . . . . . . . . . . . . . . . . 53
3.3.2 Regression Specifications . . . . . . . . . . . . . . . . . . . 54
3.4 Empirical Results . . . . . . . . . . . . . . . . . . . . . . . . . . . 55
3.4.1 Geography as Mechanical Diffusion Force . . . . . . . . . . 55
3.4.2 Measurement of Appropriateness Index (AI) . . . . . . . . 58
3.4.3 Effect of AI on Tax Capacity . . . . . . . . . . . . . . . . 58
3.5 Conclusion . . . . . . . . . . . . . . . . . . . . . . . . . . . . . . . 63
REFERENCES . . . . . . . . . . . . . . . . . . . . . . . . . . . . . . . 65
4 VAT REGISTRATION THRESHOLD AND FIRM SALES RE-
vi
PORTING: EVIDENCE FROM SRI LANKA 69
4.1 Introduction . . . . . . . . . . . . . . . . . . . . . . . . . . . . . . 69
4.2 Tax System and VAT Reforms in Sri Lanka . . . . . . . . . . . . 73
4.2.1 Background of the Tax System . . . . . . . . . . . . . . . 73
4.2.2 VAT Introduction and Reforms . . . . . . . . . . . . . . . 74
4.3 Data and Motivation . . . . . . . . . . . . . . . . . . . . . . . . . 77
4.3.1 Data . . . . . . . . . . . . . . . . . . . . . . . . . . . . . . 77
4.3.2 Motivation . . . . . . . . . . . . . . . . . . . . . . . . . . . 77
4.4 Empirical Strategy and Results . . . . . . . . . . . . . . . . . . . 81
4.4.1 Empirical Strategy . . . . . . . . . . . . . . . . . . . . . . 81
4.4.2 Baseline Results . . . . . . . . . . . . . . . . . . . . . . . . 83
4.4.3 Parallel Trends Assumption . . . . . . . . . . . . . . . . . 86
4.5 Additional Results . . . . . . . . . . . . . . . . . . . . . . . . . . 88
4.6 Conclusion . . . . . . . . . . . . . . . . . . . . . . . . . . . . . . . 88
REFERENCES . . . . . . . . . . . . . . . . . . . . . . . . . . . . . . . 91
Appendix . . . . . . . . . . . . . . . . . . . . . . . . . . . . . . . . . . 94
5 CONCLUSION AND POLICY IMPLICATIONS 95
5.1 Summary of Major Findings . . . . . . . . . . . . . . . . . . . . . 95
5.2 Policy Implications . . . . . . . . . . . . . . . . . . . . . . . . . . 97
REFERENCES . . . . . . . . . . . . . . . . . . . . . . . . . . . . . . . 99
vii
LIST OF FIGURES
2.1 Tax Share Based on Calendar Year and VAT Year . . . . . . . . . 15
2.2 Effect of VAT on Total Tax Share . . . . . . . . . . . . . . . . . . 19
2.3 Effect of VAT on Indirect Tax Share . . . . . . . . . . . . . . . . 19
2.A.1Countries Introduced VAT by 1970 . . . . . . . . . . . . . . . . . 43
2.A.2Countries Introduced VAT by 1980 . . . . . . . . . . . . . . . . . 43
2.A.3Countries Introduced VAT by 1990 . . . . . . . . . . . . . . . . . 43
2.A.4Countries Introduced VAT by 2000 . . . . . . . . . . . . . . . . . 44
2.A.5Countries Introduced VAT by 2010 . . . . . . . . . . . . . . . . . 44
2.A.6Distribution of ϕ Estimated with Placebo VAT Introduction Year 45
3.1 Appropriateness and Effectiveness of VAT: Two-Country Compar-
ison . . . . . . . . . . . . . . . . . . . . . . . . . . . . . . . . . . 53
3.2 Appropriateness Index Across Countries . . . . . . . . . . . . . . 60
4.1 Total, Direct and Indirect Tax Shares . . . . . . . . . . . . . . . . 75
4.2 Proportion of Firms below the VAT Registration Threshold . . . . 80
4.3 Proportion of Firms below the VAT Threshold - SMEs and non-SMEs 82
4.4 Effect of Tax Reforms on Firm Size Distribution . . . . . . . . . . 86
4.5 VAT Reforms and Sales Distribution Around VAT Threshold . . . 89
4.A.1Histograms for Log Sales . . . . . . . . . . . . . . . . . . . . . . . 94
viii
LIST OF TABLES
2.1 Summary Statistics . . . . . . . . . . . . . . . . . . . . . . . . . . 11
2.2 Effect of VAT on Tax Share - OLS . . . . . . . . . . . . . . . . . 18
2.3 Effect of VAT on Tax Share - IV Approach . . . . . . . . . . . . . 21
2.4 Channels of VAT Effect on Indirect Tax Share . . . . . . . . . . . 27
2.5 Effect of VAT on Direct Taxes . . . . . . . . . . . . . . . . . . . . 29
2.6 Effect of VAT Rate and Multiple VAT Rates on Indirect Tax Share 32
2.A.1Effect of VAT on Total Tax Share - OLS with Leading Years . . . 38
2.A.2Effect of VAT on Indirect Tax Share - OLS with Leading Years . . 39
2.A.3Results of the Event Study . . . . . . . . . . . . . . . . . . . . . . 40
2.A.4First Stage Results of the IV Model . . . . . . . . . . . . . . . . . 42
3.1 Summary Statistics . . . . . . . . . . . . . . . . . . . . . . . . . . 51
3.2 Cross-Country Diffusion of VAT Introduction . . . . . . . . . . . 57
3.3 Effect of Appropriateness of VAT on Tax Capacity - IV Estimation 62
3.4 Quintiles of AI and Effectiveness of VAT on Tax Capacity . . . . 63
4.1 VAT Reforms in Sri Lanka from 1998 to 2019 . . . . . . . . . . . 76
4.2 Effect of VAT Policies on Firm Size Distribution . . . . . . . . . . 85
4.3 Effect of VAT Reforms on Firm Size Distribution . . . . . . . . . 87
ix


ACKNOWLEDGEMENTS
Throughout my PhD journey, I have received a great deal of support, assistance
and encouragement.
First, I would like to thank my supervisors Professor Anu Rammohan and As-
sistant Professor Shawn Chen, whose expertise was invaluable in shaping my
research. Your valuable feedback and continuous encouragement helped me enor-
mously to lift the standard of my thesis. I owe you much more than what is
reflected in this thesis.
I would also like to thank all the academic staff at the Department of Economics,
including Professor Ken Clements, Professor Peter Robertson, Professor Rod Ty-
ers, Professor Michael McLure, Professor Yanrui Wu and Associate Professor Abu
Siddique, for their valuable comments and feedback in the department seminar
series at the UWA Business School. Additionally, I thank Professor James Alms
and all the conference participants at the 6th Shadow Economy Conference in
Italy, for their comments and feedback.
I am thankful for the tutoring opportunities provided by Dr Elisa Brich, Dr
Ishita Chatterjee and Dr Andrew Williams. I enjoyed sharing my knowledge and
experience with students a lot.
I also thank all my PhD colleagues at the department for their support and
companionship during this period. It was a privilege to do a PhD in such a nice
place surrounded by all the lovely people.
I gratefully acknowledge the financial support of the Australian government through
the Research Training Program (RTP) scholarship and the postgraduate schol-
xi

arship program of the Central Bank of Sri Lanka.
I must owe a special thanks to my family and friends. I am deeply indebted to
my parents: your blessings gave me the strength to rise at difficult times. I am
thankful to my loving wife Dilini and kids, Dehara and Janiru, for your patience
and sacrifice throughout this period. You are the best gift in my life, and without
you, I would not have come this far. Finally, thanks to all my friends who helped
me and my family in different ways during my PhD journey.
Konara Mudiyanselage Harsha Kaushalya Dasanayake
Perth, 2021
xii

AUTHORSHIP DECLARATION: CO-AUTHORED
PUBLICATIONS
This thesis contains work that is prepared for publication. Specifically, content
from one chapter of the thesis is submitted to a journal.
Details of the work:
“What impairs the “Money Machine” of VAT in Developing Countries?”
with Shawn Chen. submitted to International Tax and Public
Finance Journal
Relevant chapter in the thesis: [Chapter 2]
Student contribution to work:
I worked on the data management, model construction and development,
estimation and, write up of the papers.
Co-author signature and date:
(Shawn Chen) Date: 20 August,
Student signature:
Date: 20 August, 2021
I, Anu Rammohan, certify that Konara Mudiyanselage Harsha Kaushalya
Dasanayake’s statement regarding his contribution to the work is correct.
Coordinating supervisor signature:
Date: 20 August, 2021
xiii


Chapter 1
INTRODUCTION
“In this world nothing can be said to be certain, except DEATH and TAXES”
Benjamin Franklin (1789)
1.1 Background and Motivation
Government revenue is an integral part of fiscal policy, particularly in develop-
ing countries where a significant proportion of government expenditure includes
spending on social welfare and infrastructure development. Therefore, tax rev-
enue as the main contributor of government revenue has continued to receive
substantial attention from policy makers. Achieving a higher tax revenue with
a minimal impact on economic activities has been of paramount importance for
any government.
However, a number of previous studies find that developing countries are faced
with the problem of lower tax capacity, which results in potential socio-economic
issues such as insufficient supply of public goods, higher budget deficits and debt
sustainability (Gordon and Li, 2009; Kleven, 2014; Besley and Persson, 2014).
The tax share of GDP in developing countries is typically low compared to de-
veloped countries but may also be insufficient to meet their public spending.
At the same time, several noteworthy innovations in tax administration have
come into limelight in recent history, which were supposed to improve overall tax
capacity and efficiency. Value Added Tax (VAT) is one such innovation. The
1
INTRODUCTION Chapter 1
past few decades have witnessed a surge in developing and transition countries
adopting VAT with the primary objective of improving tax capacity. However,
not all countries have been able to achieve the expected outcome and importantly
a majority of them are developing countries (Keen and Lockwood, 2010; Ahlerup
et al., 2015). This raises the important question of why some of these recent
innovations in taxation technology are not delivering desired results in developing
countries.
Sri Lanka is a classic example of such a situation. The country has faced a
continuous decline in tax share in the recent past, and even the adoption of VAT
in 2002 has not resulted in overturning the downward trend (Mudiyanselage et al.,
2020). This weak tax performance has created several macroeconomic imbalances
in the island nation. The average budget deficit and debt level as a share of GDP
in Sri Lanka over the last three decades have been about 7% and 88% respectively.
The main reason for such a weak fiscal situation is the below-par tax performance
where the tax-GDP share has been declining from around 19% in 1990 to around
11% in 2019.
1.2 Contribution and Organisation of the Thesis
Motivated by the weak tax capacity in most of the developing countries and more
specifically by the declining tax share observed in Sri Lanka, this thesis combines
three distinct yet related essays focusing on the role of VAT and tax capacity
in developing countries. In doing so, it tries to answer the striking question of
why has VAT not succeeded in improving tax capacity in a number of developing
countries as expected.
In the first essay (Chapter 2), we look at general patterns in a cross-country study
and analyse the main channels that constrain the effectiveness of VAT in develop-
ing countries. We use a novel measure of tax capacity using tax revenue as a share
2
Chapter 1 INTRODUCTION
of “True GDP” which is the sum of reported GDP and the informal economy.1
This new measurement allows us to identify the changes in tax capacity due to
the variations in informal sector after VAT introduction. Next we decompose
the effect of the introduction of VAT on tax capacity into three channels: effec-
tive tax rate, tax base and the informal sector. In this decomposition exercise,
our main emphasis is on the role of VAT in information revelation considering
the “last mile problem” as discussed by Pomeranz (2015); Gerard and Naritomi
(2018); Naritomi (2019). As highlighted by its proponents, one important feature
of VAT compared to other indirect taxes is the self-revelation of information to
tax authorities. They argue that the design of the VAT allows better access to
financial information via the self-reporting feature of VAT which limits the firms’
ability to hide their financial transactions. The use of the informal sector as a
separate channel allows us to closely examine the validity of this claim in the case
of developing countries.
In the second essay (Chapter 3) we look at whether the effectiveness of VAT can
be affected by the appropriateness of VAT in each specific country. As it is well
known that ‘one size does not fit all’, we argue that an institution may be inappro-
priate if it is introduced to the host country due to geographic factors as it might
be incompatible with local economic and political fundamentals. Based on the
literature around this and the idea of Keen and Lockwood (2010) on the causes of
VAT, we construct a measurement of the appropriateness of VAT to describe the
degree of compatibility of VAT adoption to the host country. Our study enriches
the understanding of VAT as an institution to mobilize government revenue but
also a tax technology that involves new process, equipment and skill to implement
it (Gerard and Naritomi, 2018; Ghirmai et al., 2014; Fan et al., 2018; Fjeldstad
et al., 2020). In this analysis we consider VAT adoption to be jointly deter-
mined by mechanical diffusion force and socio-economic condition. We regard
1For the purpose of this study, We use the general definition of informal economy: which isthe part of economy that is not monitored or recorded by any form of government. We use theterms ‘underground economy’ and ‘shadow economy’ interchangeably to informal economy.
3
INTRODUCTION Chapter 1
spatial interdependence as the mechanical diffusion and it allows us to separately
identify the influence from neighbouring countries for VAT adoption from the ap-
propriateness of different countries for VAT. We measure spatial interdependence
considering geographical neighbourhoods and use the appropriateness index of
the socio-economic conditions to study the impact of the appropriateness on the
effectiveness of VAT. We find that effectiveness of VAT on tax capacity can be
constrained by the appropriateness in that country.
We devote the final essay (Chapter 4) to examining the micro mechanisms of VAT
by focusing on Sri Lanka, a typical developing country with weak tax capacity
even after VAT introduction. In this essay, we look at an important parameter
of VAT policy: VAT threshold for formal firms. VAT threshold is a size-based
regulation set by the revenue authorities which determines mandatory registration
for VAT. Firms below the VAT threshold are not required to register and pay
VAT while for the firms above the threshold, it is mandatory by law to register
and pay VAT accordingly. Though its undesirable, size-based regulations create
incentive for firms to stay small and avoid the compulsory registration which can
significantly distort firm-size distribution (Dharmapala et al., 2011; Gourio and
Roys, 2014). Additionally, past studies specifically on VAT threshold find that
there could be a significant bunching of firms below the threshold level (Harju
et al., 2016; Boonzaaier et al., 2016; Sow and Gebresilasse, 2020). Moving forward
from the current literature, in this essay we examine the behavioural response of
firms to the changes in the VAT policy after its adoption in Sri Lanka. One
innovative finding of this study is that firms actively respond to the increase in
standard VAT rate by hiding behind the VAT threshold undermining the tax
capacity of Sri Lanka. This is a novel outcome which has not been discussed in
the literature before. This shows that the VAT threshold could be a loophole
where firms use to stay behind by under-reporting sales in a situation of any
other VAT policy changes such as a rate increase.
4
This thesis is organized into five chapters. Introduction chapter (Chapter 1)
provides an overall background with the motivation of the study followed by the
contribution of each essay. Three core chapters representing three related essays
on VAT and tax capacity in developing countries are included from chapter 2 to
chapter 4. Chapter 2 examines the different channels that affects the effectiveness
of VAT, giving important emphasis on information revelation. Chapter 3 observes
the appropriateness of socio-economic condition for VAT, while chapter 4 includes
a micro analysis which looks at firms’ response on VAT policy changes. Final
chapter (Chapter 5) provides conclusion and policy implications.
REFERENCES
Ahlerup, P., Baskaran, T., and Bigsten, A. (2015). Tax Innovations and Pub-
lic Revenues in Sub-Saharan Africa. The Journal of Development Studies,
51(6):689–706.
Besley, T. and Persson, T. (2014). Why Do Developing Countries Tax So Little?
Journal of Economic Perspectives, 28(4):99–120.
Boonzaaier, W., Harju, J., Matikka, T., and LastNamePirttila, J. (2016). How
do small firms respond to tax schedule discontinuities? Evidence from South
African tax registers. WIDER Working Paper, 36.
Dharmapala, D., Slemrod, J., and Wilson, J. D. (2011). Tax policy and the
missing middle: Optimal tax remittance with firm-level administrative costs.
Journal of Public Economics, 95(9-10):1036–1047.
Fan, H., Liu, Y., Qian, N., and Wen, J. (2018). Computerizing VAT Invoices in
China. National Bureau of Economic Research, Working Paper(24414).
Fjeldstad, O. H., Kagoma, C., Mdee, E., Sjursen, I. H., and Somville, V. (2020).
The customer is king: Evidence on VAT compliance in Tanzania. World De-
velopment, 128:1–12.
5

INTRODUCTION Chapter 1
Gerard, F. and Naritomi, J. (2018). Value Added Tax in developing countries:
Lessons from recent research. IGC Growth Brief Series 15.
Ghirmai, E., Logan, S., and Murray, S. (2014). The incidence and impact of
Electronic Billing Machines for VAT in Rwanda - IGC. Technical report, In-
ternational Growth Centre.
Gordon, R. H. and Li, W. (2009). Tax structures in developing countries: Many
puzzles and a possible explanation. Journal of Public Economics, 93(7-8):855–
866.
Gourio, F. and Roys, N. (2014). Size-dependent regulations, firm size distribution,
and reallocation. Quantitative Economics, 5(2):377–416.
Harju, J., Matikka, T., and Rauhanen, T. (2016). The Effects of Size-Based
Regulation on Small Firms: Evidence from Vat Threshold. VATT Institute for
Economic Research Working Paper, 75.
Keen, M. and Lockwood, B. (2010). The value added tax: Its causes and conse-
quences. Journal of Development Economics, 92(2):138–151.
Kleven, H. J. (2014). How Can Scandinavians Tax So Much? Journal of Economic
Perspectives, 28(4):77–98.
Mudiyanselage, H. K., Rammohan, A., and Chen, S. X. (2020). Tax Effort in
Developing Countries: Where is Sri Lanka? Journal of Tax Administration,
6(1):162–189.
Naritomi, J. (2019). Consumers as Tax Auditors. American Economic Review,
109(9):3031–3072.
Pomeranz, D. (2015). No Taxation without Information: Deterrence and
Self-Enforcement in the Value Added Tax. American Economic Review,
105(8):2539–2569.
Sow, S. and Gebresilasse, M. (2020). Effect of VAT Adoption on Manufacturing
Firms in Ethiopia. International Journal of Economics and Finance, 12(10):85.
6
Chapter 2
WHAT IMPAIRS THE “MONEY MACHINE” OF VAT
IN DEVELOPING COUNTRIES?
2.1 Introduction
VAT has been regarded as a ‘money machine’ for government revenue, and its
rise is considered as a significant development in tax instruments and tax ad-
ministration (Keen, 2007; Keen and Lockwood, 2010). Proponents of VAT claim
not only that it generates higher tax revenue, but also that it improves the over-
all tax administration and compliance. Some studies even suggest that VAT
improves the aggregate production efficiency of a country (Boadway and Sato,
2009; Adhikari, 2020). Developing countries introduced VAT mainly to increase
tax revenue whereas for some developed countries the objective is to improve the
tax mix by increasing the indirect tax share.
However, recent evidence shows that the effectiveness of VAT in revenue gener-
ation is not as desirable as it had been expected mainly due to the informality
and information problem in developing countries. Keen and Lockwood (2010)
find that the long run effect of the presence of VAT on the overall revenue-GDP
ratio is modest, at about 4.5%. The effect is stronger in rich countries because
of their capacity to deal with the administrative and compliance challenges from
VAT. For Sub-Saharan countries, they even find negative predicted revenue gain
from VAT. Additionally, Ahlerup et al. (2015) examine the effect of tax innova-
tions on tax revenues in sub-Saharan Africa and find that VAT is not a solution
7
WHAT IMPAIRS THE “MONEY MACHINE” OF VAT Chapter 2
to the revenue shortages in African countries. Mudiyanselage et al. (2020) show
that the tax-GDP ratio in Sri Lanka has been declining since 1990 and that the
introduction of VAT in 2002 did not change the downward trend.
Existing studies suggest that informality and information are two crucial factors
that weaken the performance of VAT. Some show that broadening the VAT base
could increase the informal sector (Piggott and Whalley, 2001); VAT is less ef-
fective dealing with the informal sector compared with trade tariffs (Emran and
Stiglitz, 2005); and the credit method used to collect VAT creates informality
along the supply chain (De Paula and Scheinkman, 2010). In addition to the
problems of informality, the VAT can be undermined by the loopholes in the in-
formation revelation particularly because of the ‘last mile problem’ (Pomeranz,
2015; Gerard and Naritomi, 2018; Naritomi, 2019). However, there is a lack of
research examining the overall impact of informality and information on the ef-
fectiveness of VAT in revenue mobilization from a macro perspective especially
in developing countries.
This paper aims to investigate the main channels that constrain the effectiveness
of VAT in increasing the tax capacity of developing countries. We measure the
tax capacity using the ratio of tax revenue to the ‘True’ GDP, where the ‘True’
GDP is the sum of the reported GDP and the un-reported shadow economy.
In this aspect, our paper differs from Keen and Lockwood (2010) and Ahlerup
et al. (2015) which use the revenue ratio and tax-GDP share as measurements
of tax capacity. Our new measurement allows us to identify the changes in tax
capacity due to the variations in informal sector after VAT introduction. Then
we decompose the effect of VAT on tax-‘True’ GDP ratio into three channels:
effective tax rate, tax base and informal sector.
We use the number of neighbouring countries with VAT as the instrumental
variable (IV) to overcome any possible endogeneity in the identification. Other
studies in the literature have used a similar strategy: Alavuotunki et al. (2019)
8

Chapter 2 WHAT IMPAIRS THE “MONEY MACHINE” OF VAT
adopt the previous values of neighbouring countries’ VAT systems as an instru-
ment of VAT introduction; Ahlerup et al. (2015) employ a two-stage procedure
to deal with the self-selection problem of VAT adoption by using the number of
neighbours with VAT as a significant predictor for whether a given country has
VAT.
The 2SLS regression results using difference-in-difference approach with IV show
that the presence of VAT has a significant positive impact on both total tax and
indirect tax shares in developing countries. Results also reveal that the main
channel of increase in tax capacity is the higher effective tax rate, while the
tax base declines in response. However, the role of VAT as an information source
does not significantly contribute towards the increase in tax revenue in developing
countries.
This paper contributes to the literature by revealing the main constraints that
limit the effectiveness of VAT in developing countries. Adhikari (2020) highlights
that VAT introduction has a meaningful impact on economic efficiency only in
high-income countries while it has no significant effect in low-income countries.
We show that the reason for such an insignificant contribution in developing coun-
tries are a strong negative response in the tax base and a weak information role.
Related papers include Desai and Hines (2005) who show that presence of VAT
has a negative impact on trade performance in low income countries and claim
that this could be due to problems in the rebate process for exporters. Examin-
ing the revenue impact of trade liberalization, Baunsgaard and Keen (2010) find
that low-income countries with VAT have not recovered revenue lost from trade
liberalization than those without VAT.
The paper proceeds with a section to discuss data, variables and motivation
(section 2.2). Section 2.3 explains the empirical strategy, followed by the main
results in section 2.4. Section 2.5 discusses the mechanism explicitly and section
2.6 provide additional results. Section 2.7 of this chapter provides the conclusion.
9
WHAT IMPAIRS THE “MONEY MACHINE” OF VAT Chapter 2
2.2 Data, Main Variables and Motivating Facts
2.2.1 Data Description
Our study considers 127 developing countries for the period 1991-2015. The
selection of countries is based on the analytical classification by the World Bank
where countries that have per capita Gross National Income (GNI) lower than
USD 12,055 are considered as developing countries. The sample includes 105
countries with VAT and 22 countries without VAT. Countries that introduced
VAT have both VAT and without VAT years within the sample period. This
allows us to use the difference-in-difference approach at the country level as well
as the year level.
In this study, we combine data from several different sources. Tax share data
are from the International Centre for Tax and Development (ICTD) data base.
ICTD provides a comprehensive data set on government revenue shares (Alavuo-
tunki et al., 2019). In this study we use the ICTD government revenue data set
November 2017 version. VAT introduction data is from Annex 1 of a book titled
‘International Tax Dialogue – Key issues and debates in VAT, SME taxation and
the tax treatment of the financial sector’ edited by Alan Carter (Carter, 2013).
We use a set of control variables most commonly identified as determinants of tax
share in the tax literature (Ansari, 1982; Eltony, 2002; Gupta, 2007; Keen and
Mansour, 2009; Leuthold, 1991; Tanzi, 1992; Zarra-Nezhad et al., 2016). Those
determinants include per capita GDP, agriculture share, import share, export
share, level of urbanization, external debt exposure and old-age population.
GDP per capita controls for the different levels of economic conditions while agri-
culture sector as a share of GDP represents the composition of the output struc-
ture. Import and export shares of GDP control for the different trade openness
levels and external debt as a share of GNI accounts for the level of foreign debt
exposure. Urban population as a share of total population represents the level
10
Chapter 2 WHAT IMPAIRS THE “MONEY MACHINE” OF VAT
of urbanization and the old age population is the population aged 65 years and
above as a percentage of total population. These variables control for economic
and demographic differences of the countries considered. Data on the control
variables is from the World Development Indicators (WDI). We use estimates of
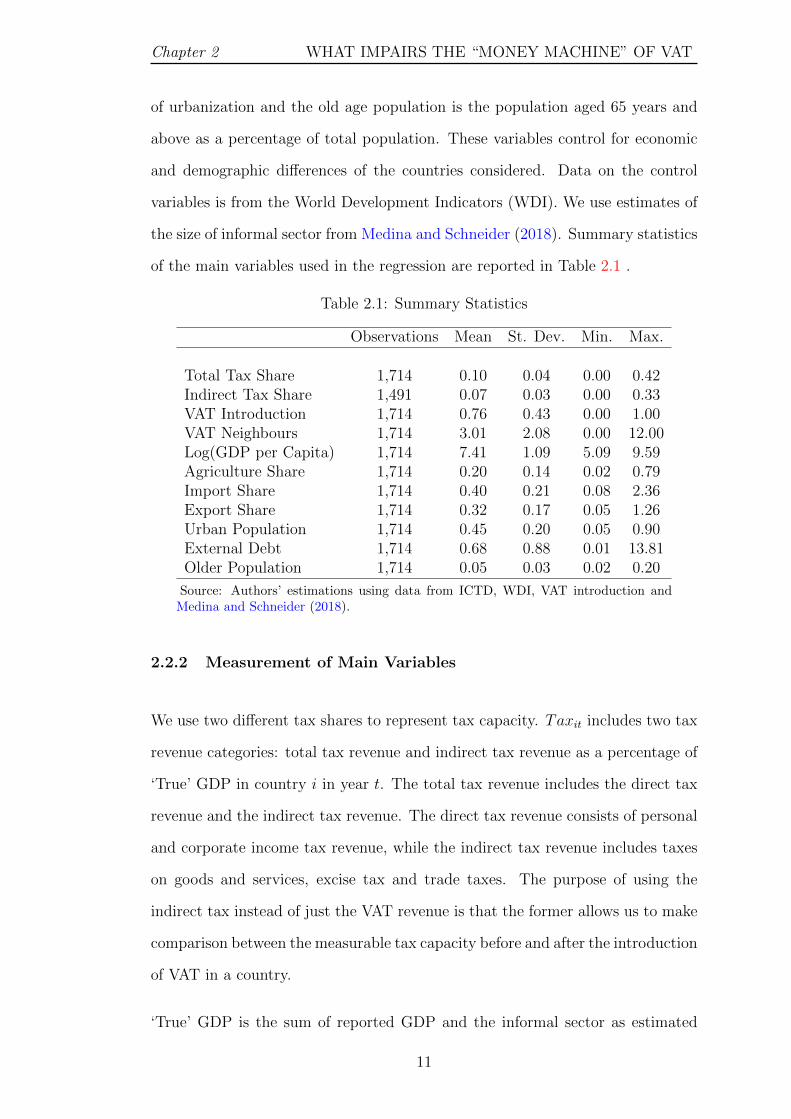
the size of informal sector from Medina and Schneider (2018). Summary statistics
of the main variables used in the regression are reported in Table 2.1 .
Table 2.1: Summary Statistics
Observations Mean St. Dev. Min. Max.
Total Tax Share 1,714 0.10 0.04 0.00 0.42Indirect Tax Share 1,491 0.07 0.03 0.00 0.33VAT Introduction 1,714 0.76 0.43 0.00 1.00VAT Neighbours 1,714 3.01 2.08 0.00 12.00Log(GDP per Capita) 1,714 7.41 1.09 5.09 9.59Agriculture Share 1,714 0.20 0.14 0.02 0.79Import Share 1,714 0.40 0.21 0.08 2.36Export Share 1,714 0.32 0.17 0.05 1.26Urban Population 1,714 0.45 0.20 0.05 0.90External Debt 1,714 0.68 0.88 0.01 13.81Older Population 1,714 0.05 0.03 0.02 0.20
Source: Authors’ estimations using data from ICTD, WDI, VAT introduction andMedina and Schneider (2018).
2.2.2 Measurement of Main Variables
We use two different tax shares to represent tax capacity. Taxit includes two tax
revenue categories: total tax revenue and indirect tax revenue as a percentage of
‘True’ GDP in country i in year t. The total tax revenue includes the direct tax
revenue and the indirect tax revenue. The direct tax revenue consists of personal
and corporate income tax revenue, while the indirect tax revenue includes taxes
on goods and services, excise tax and trade taxes. The purpose of using the
indirect tax instead of just the VAT revenue is that the former allows us to make
comparison between the measurable tax capacity before and after the introduction
of VAT in a country.
‘True’ GDP is the sum of reported GDP and the informal sector as estimated
11
WHAT IMPAIRS THE “MONEY MACHINE” OF VAT Chapter 2
by Medina and Schneider (2018).2 This is a new measurement as opposed to
the normal tax-to-GDP share used in tax literature (Keen and Lockwood, 2010;
Ahlerup et al., 2015). The ‘True’ GDP allows us to analyze the changes in tax
capacity due to variations in informal sector which is important when we study
the mechanisms of change in tax capacity at the second stage.
The dummy variable VAT introduction V atDit is the main independent variable
of interest. This variable takes on a value of 1 after the introduction of VAT and
zero before. If a country introduced VAT within the first six months of a given
year we consider that year as the year of VAT introduction. On the other hand,
if VAT was introduced in the last six months of a given year we consider next
year as the year of introduction for the dummy variable of VAT introduction.
The number of neighbouring countries with VAT, V atNit, is the instrument we
use for VAT introduction. We constructed V atNit by considering the VAT in-
troduction of bordering nations of a particular country. This variable takes the
value of bordering countries that have introduced VAT in any given year.
2.2.3 Motivating Facts
The introduction of a new taxation system may be considered as a significant pol-
icy change. Governments as well as private firms have to allocate time and other
resources to adopt to the new taxation technology. As in many other technol-
ogy related spillovers, the motivation to introduce advanced taxation technology
could come in as a spillover effect from neighbouring countries.3 The argument
is that if neighbouring countries have already adopted VAT, that is the best
2We acknowledge that there is no perfect estimation for informal sector. However, we usedthe informal sector estimates to construct the explained variables. These are not subject to theendogeneity concern of measurement error that undermines the explanatory regressors. Themeasurement error of the informal sector estimates would not lead to bias estimation unless themeasurement error itself is affected by the introduction of VAT. It only increases the standarderror of the estimates.
3Cızek et al. (2017) show that there is a significant spatial correlation between the VATintroductions of neighbouring countries.
12
Chapter 2 WHAT IMPAIRS THE “MONEY MACHINE” OF VAT
source of information and the motivating factor for a government to introduce
VAT. Keen and Lockwood (2010) also highlight that having a higher proportion
of neighbouring countries with VAT in the region increases the probability of a
country to adopt VAT.
In order to check the validity of this argument we developed a series of world
maps for each year to see which countries have introduced VAT in a given year.
These maps clearly show that there is a higher tendency for a country to adopt
VAT if its neighbours have already introduced VAT. Maps of VAT introduction
in every decade from 1970 to 2010 are shown in Figures 2.A.1 to 2.A.5 of the
Appendix. In these maps, countries that introduced VAT in the same decade are
shown in dark Red and countries that introduced VAT in previous decades are in
light Red. Non-VAT countries are shown in White. The manner in which VAT
introduction has proceeded in these maps show that it is similar to the diffusion
of technology through neighbouring countries. This allows us to use number of
neighbouring countries as the instrument for the VAT introduction.
2.3 Empirical Strategy
2.3.1 OLS
In order to estimate the effect of VAT introduction on tax capacity we use a
standard difference-in-difference regression as specified below:
Taxit = αt + ηr + ϕ× V atDit + γ ×Xit + εit (2.1)
V atDit is a dummy variable of VAT introduction in country i in year t. V atDit
= 1 after the VAT introduction and V atDit = 0 before the introduction. Xit is
a vector of control variables including per capita GDP, agriculture share, import
13

WHAT IMPAIRS THE “MONEY MACHINE” OF VAT Chapter 2
and export shares, urbanization, external debt and older population used in all the
equations that follow. The parameter of interest is ϕ which captures the response
of the tax share to the introduction of VAT. Year fixed effects αt capture the
time specific characteristics including the effect of technological change such as
computerization over time and regional fixed effects ηr capture the region-specific
characteristics.
2.3.2 Leading Years
In addition to the baseline regression, we estimate the following regression to
check whether there is any impact on revenue share before the VAT introduction.
Taxit = αt + ηr + ϕ× V atDit +6∑
k=1
βk × V atBDkit + γ ×Xit + εit (2.2)
In this setting, V atBDi is a set of dummy variables to identify the leading years
to VAT introduction from t− 1 to t− 6. This enables us to test whether there is
any effect on tax share before the VAT introduction particularly considering the
declining trend of tax share prior to the VAT introduction as shown in Figure
2.1.
2.3.3 Event Study
Another way of looking at the VAT introduction is to consider it as an event and
analyze the impact of its introduction on tax share before and after the event.
Following regression is considered along the lines of the event study by Li et al.
(2016).
Taxit = αt + ηr + ϕk ×15∑
k=−15
Dkit + γ ×Xit + εit (2.3)
Dkit is a set of dummy variables that identify the period before and after VAT
14
Chapter 2 WHAT IMPAIRS THE “MONEY MACHINE” OF VAT
introduction. For the event study analysis we consider a period of 15 years before
and 15 years after the VAT introduction due to the availability of higher level of
data.
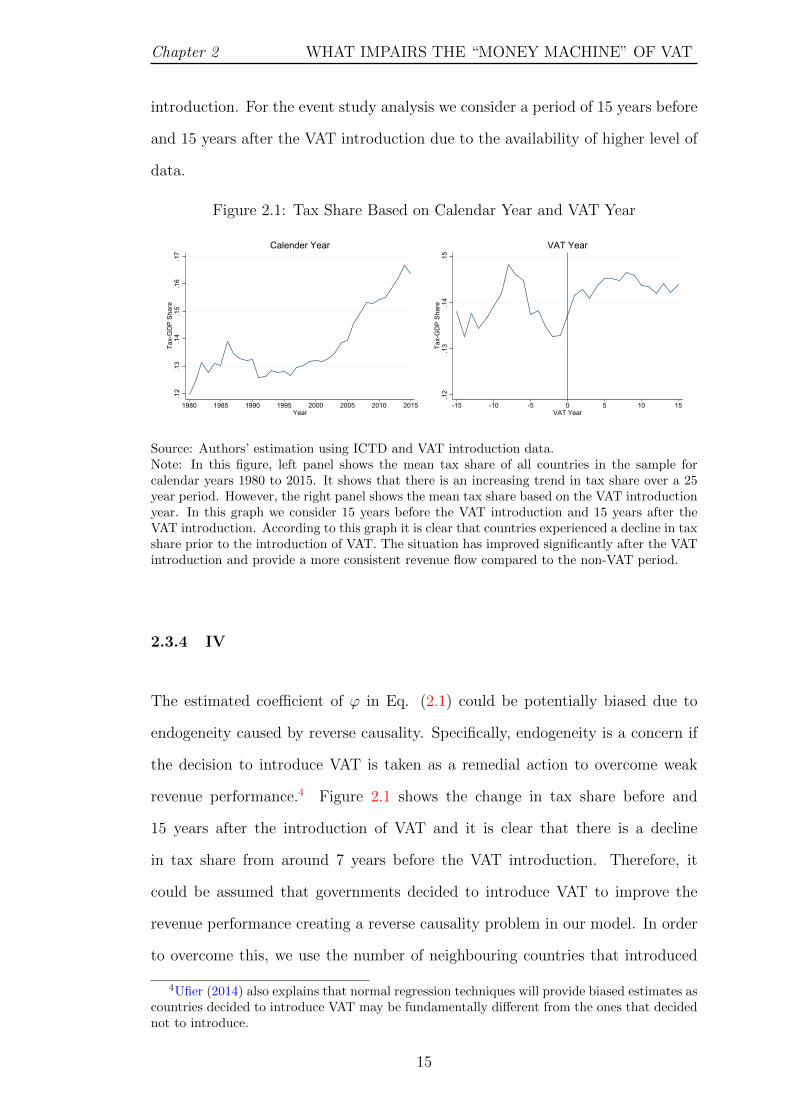
Figure 2.1: Tax Share Based on Calendar Year and VAT Year
.12
.13
.14
.15
.16
.17
Tax-
GD
P Sh
are
1980 1985 1990 1995 2000 2005 2010 2015Year
Calender Year
.12
.13
.14
.15
Tax-
GD
P Sh
are
-15 -10 -5 0 5 10 15VAT Year
VAT Year
Source: Authors’ estimation using ICTD and VAT introduction data.Note: In this figure, left panel shows the mean tax share of all countries in the sample forcalendar years 1980 to 2015. It shows that there is an increasing trend in tax share over a 25year period. However, the right panel shows the mean tax share based on the VAT introductionyear. In this graph we consider 15 years before the VAT introduction and 15 years after theVAT introduction. According to this graph it is clear that countries experienced a decline in taxshare prior to the introduction of VAT. The situation has improved significantly after the VATintroduction and provide a more consistent revenue flow compared to the non-VAT period.
2.3.4 IV
The estimated coefficient of ϕ in Eq. (2.1) could be potentially biased due to
endogeneity caused by reverse causality. Specifically, endogeneity is a concern if
the decision to introduce VAT is taken as a remedial action to overcome weak
revenue performance.4 Figure 2.1 shows the change in tax share before and
15 years after the introduction of VAT and it is clear that there is a decline
in tax share from around 7 years before the VAT introduction. Therefore, it
could be assumed that governments decided to introduce VAT to improve the
revenue performance creating a reverse causality problem in our model. In order
to overcome this, we use the number of neighbouring countries that introduced
4Ufier (2014) also explains that normal regression techniques will provide biased estimates ascountries decided to introduce VAT may be fundamentally different from the ones that decidednot to introduce.
15
WHAT IMPAIRS THE “MONEY MACHINE” OF VAT Chapter 2
VAT as an instrument to the VAT introduction dummy.5
The corresponding reduced form regression is given by;
Taxit = αt + ηr + β × V atNit + γ ×Xit + εit (2.4)
where V atNit refers to the number of bordering countries that introduced VAT for
each country each year. The first-stage regression with the instrumental variable
can be expressed as follows;
V atDit = αt + ηr + ϕ× V atNit + γ ×Xit + εit (2.5)
The instrument is correlated with the VAT introduction of a particular country.
This is because VAT introduction of neighbouring countries has a positive im-
pact on VAT introduction in the host country due to diffusion of technology as
discussed in section 2.2.3 and shown in maps of VAT introduction in appendix
Figures 2.A.1 to 2.A.5. However, the instrument is exogenous as the tax capacity
of the host country is not determined by the number of neighbouring countries
with VAT. The IV regression is implemented using the 2SLS combining Eq. (2.5)
and Eq. (2.1) respectively as the first and the second stage.
2.4 Empirical Results
2.4.1 OLS Estimation
Table 2.2 reports the baseline OLS regression result of Eq. (2.1). Panel A of
Table 2.2 shows the results for total tax share while panel B shows the results
5Ebeke and Ehrhart (2011); Alavuotunki et al. (2019) use share of VAT neighbour as the IVin their studies and Ahlerup et al. (2015) use the number of neighbouring countries with VATin a two stage procedure to estimate the impact of VAT on tax revenue in Sub-Saharan Africa.
16
Chapter 2 WHAT IMPAIRS THE “MONEY MACHINE” OF VAT
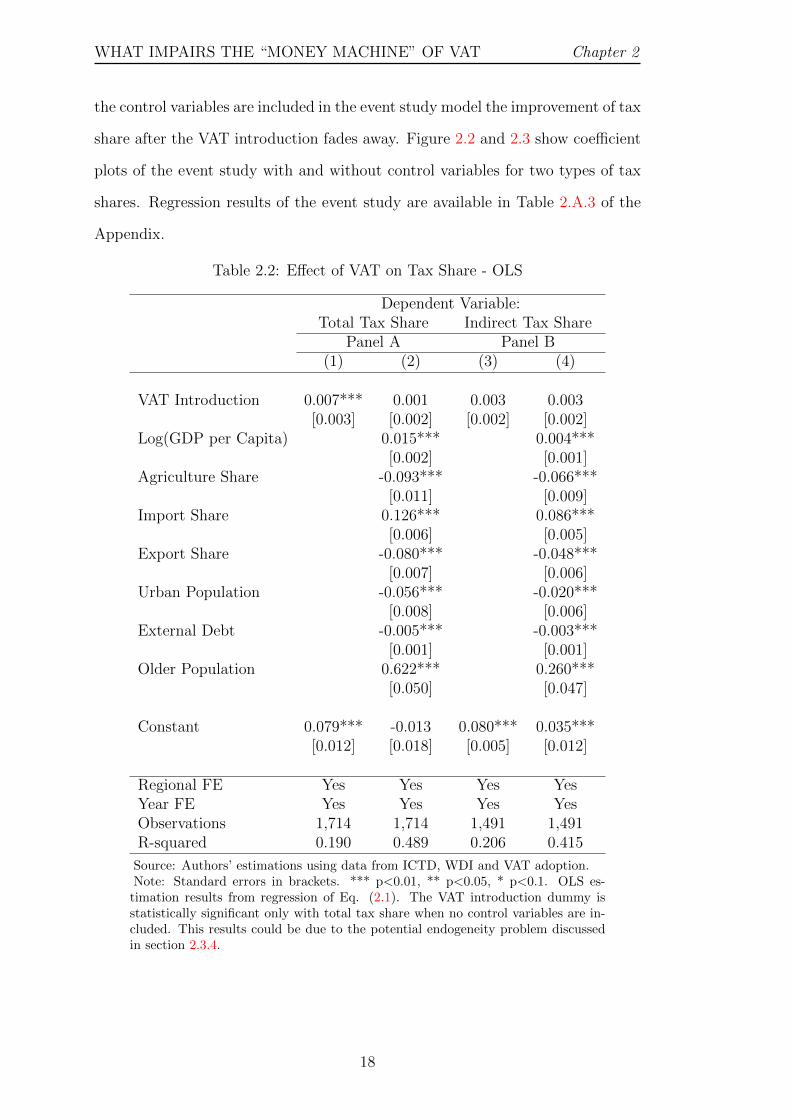
of the indirect tax share. The columns in each panel shows the results with
and without control variables. Column (1) shows that VAT introduction has a
positive and significant impact on total tax share, but, it is not significant when
control variables are included as shown in column (2). When we consider indirect
tax share as the dependent variable in columns (3) and (4), VAT introduction
is not significant with or without control variables. The coefficients of control
variables with total tax share and indirect tax share as shown in columns (2) and
(4) are in line with the previous literature. Income levels have a positive and
significant relationship with tax share while agriculture share has a significant
negative relationship. Tax share has a positive relationship with imports but
exports obviously has a negative relationship. In almost every country there are
indirect taxes imposed on imports and as a result, higher imports generate higher
tax revenue for the government. On the other hand, exports are taxed at zero
rate for VAT in many countries where exporters need not to charge output VAT
but can claim VAT refund on input VAT paid in the production process. This
policy is in place to maintain the competitiveness in the international market and
promote exports. In keeping with Zarra-Nezhad et al. (2016) urbanization has a
negative relationship with tax share. External debt has a negative relationship
while a larger elderly population is positively related to tax shares. Appendix
Table 2.A.1 and 2.A.2 show the regression results with the inclusion of the pre-
treatment dummies up to six years before the VAT introduction for total and
indirect tax shares respectively. None of the pre-treatment dummy variables in
any of the models are significant. This suggests that previous policy changes have
not affected the decline in tax shares before the VAT introduction or any previous
trends. Additionally, the results of the VAT dummy and the control variables are
consistent with previous OLS regression results.
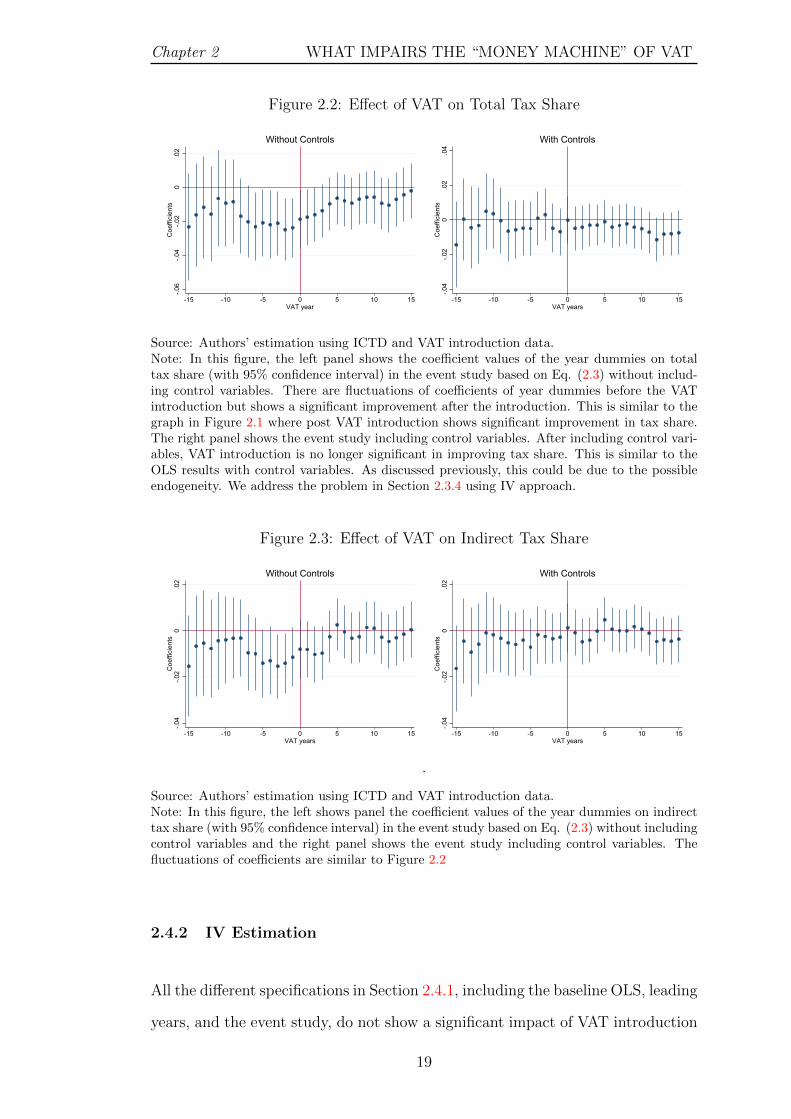
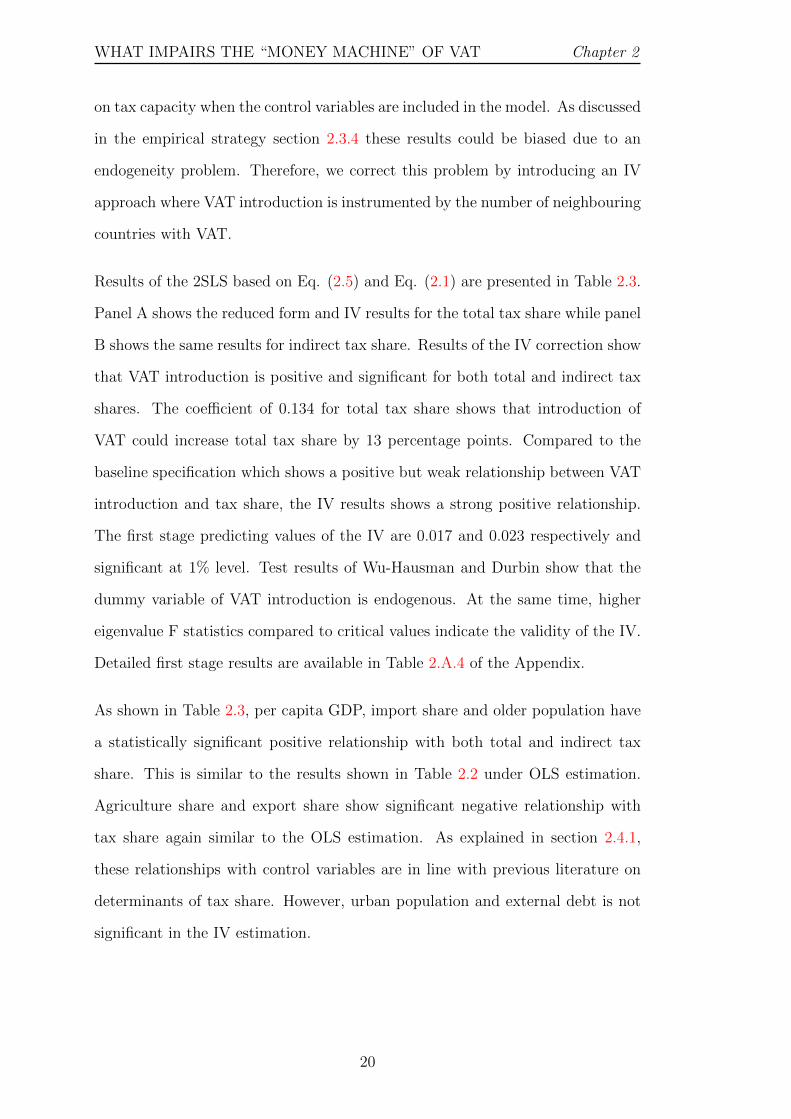
The event study considering 15 years before and after the VAT introduction
period shows that government tax revenue shares were fluctuating before the VAT
introduction but shows improvement post introduction period. However, when
17
WHAT IMPAIRS THE “MONEY MACHINE” OF VAT Chapter 2
the control variables are included in the event study model the improvement of tax
share after the VAT introduction fades away. Figure 2.2 and 2.3 show coefficient
plots of the event study with and without control variables for two types of tax
shares. Regression results of the event study are available in Table 2.A.3 of the
Appendix.
Table 2.2: Effect of VAT on Tax Share - OLS
Dependent Variable:Total Tax Share Indirect Tax Share
Panel A Panel B(1) (2) (3) (4)
VAT Introduction 0.007*** 0.001 0.003 0.003[0.003] [0.002] [0.002] [0.002]
Log(GDP per Capita) 0.015*** 0.004***[0.002] [0.001]
Agriculture Share -0.093*** -0.066***[0.011] [0.009]
Import Share 0.126*** 0.086***[0.006] [0.005]
Export Share -0.080*** -0.048***[0.007] [0.006]
Urban Population -0.056*** -0.020***[0.008] [0.006]
External Debt -0.005*** -0.003***[0.001] [0.001]
Older Population 0.622*** 0.260***[0.050] [0.047]
Constant 0.079*** -0.013 0.080*** 0.035***[0.012] [0.018] [0.005] [0.012]
Regional FE Yes Yes Yes YesYear FE Yes Yes Yes YesObservations 1,714 1,714 1,491 1,491R-squared 0.190 0.489 0.206 0.415
Source: Authors’ estimations using data from ICTD, WDI and VAT adoption.Note: Standard errors in brackets. *** p<0.01, ** p<0.05, * p<0.1. OLS es-
timation results from regression of Eq. (2.1). The VAT introduction dummy isstatistically significant only with total tax share when no control variables are in-cluded. This results could be due to the potential endogeneity problem discussedin section 2.3.4.
18
Chapter 2 WHAT IMPAIRS THE “MONEY MACHINE” OF VAT
Figure 2.2: Effect of VAT on Total Tax Share
-.06
-.04
-.02
0.0
2C
oeffi
cien
ts
-15 -10 -5 0 5 10 15VAT year
Without Controls
-.04
-.02
0.0
2.0
4C
oeffi
cien
ts
-15 -10 -5 0 5 10 15VAT years
With Controls
Source: Authors’ estimation using ICTD and VAT introduction data.Note: In this figure, the left panel shows the coefficient values of the year dummies on totaltax share (with 95% confidence interval) in the event study based on Eq. (2.3) without includ-ing control variables. There are fluctuations of coefficients of year dummies before the VATintroduction but shows a significant improvement after the introduction. This is similar to thegraph in Figure 2.1 where post VAT introduction shows significant improvement in tax share.The right panel shows the event study including control variables. After including control vari-ables, VAT introduction is no longer significant in improving tax share. This is similar to theOLS results with control variables. As discussed previously, this could be due to the possibleendogeneity. We address the problem in Section 2.3.4 using IV approach.
Figure 2.3: Effect of VAT on Indirect Tax Share
-.04
-.02
0.0
2C
oeffi
cien
ts
-15 -10 -5 0 5 10 15VAT years
Without Controls
-.04
-.02
0.0
2C
oeffi
cien
ts
-15 -10 -5 0 5 10 15VAT years
With Controls
.
Source: Authors’ estimation using ICTD and VAT introduction data.Note: In this figure, the left shows panel the coefficient values of the year dummies on indirecttax share (with 95% confidence interval) in the event study based on Eq. (2.3) without includingcontrol variables and the right panel shows the event study including control variables. Thefluctuations of coefficients are similar to Figure 2.2
2.4.2 IV Estimation
All the different specifications in Section 2.4.1, including the baseline OLS, leading
years, and the event study, do not show a significant impact of VAT introduction
19
WHAT IMPAIRS THE “MONEY MACHINE” OF VAT Chapter 2
on tax capacity when the control variables are included in the model. As discussed
in the empirical strategy section 2.3.4 these results could be biased due to an
endogeneity problem. Therefore, we correct this problem by introducing an IV
approach where VAT introduction is instrumented by the number of neighbouring
countries with VAT.
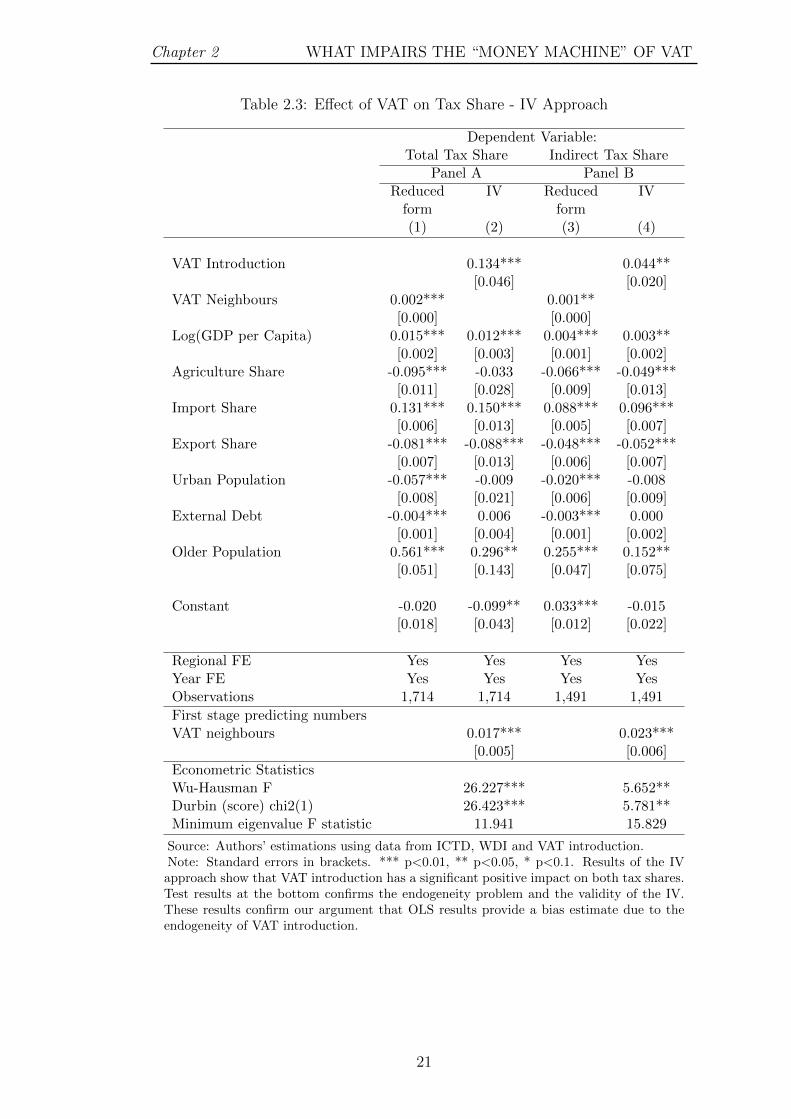
Results of the 2SLS based on Eq. (2.5) and Eq. (2.1) are presented in Table 2.3.
Panel A shows the reduced form and IV results for the total tax share while panel
B shows the same results for indirect tax share. Results of the IV correction show
that VAT introduction is positive and significant for both total and indirect tax
shares. The coefficient of 0.134 for total tax share shows that introduction of
VAT could increase total tax share by 13 percentage points. Compared to the
baseline specification which shows a positive but weak relationship between VAT
introduction and tax share, the IV results shows a strong positive relationship.
The first stage predicting values of the IV are 0.017 and 0.023 respectively and
significant at 1% level. Test results of Wu-Hausman and Durbin show that the
dummy variable of VAT introduction is endogenous. At the same time, higher
eigenvalue F statistics compared to critical values indicate the validity of the IV.
Detailed first stage results are available in Table 2.A.4 of the Appendix.
As shown in Table 2.3, per capita GDP, import share and older population have
a statistically significant positive relationship with both total and indirect tax
share. This is similar to the results shown in Table 2.2 under OLS estimation.
Agriculture share and export share show significant negative relationship with
tax share again similar to the OLS estimation. As explained in section 2.4.1,
these relationships with control variables are in line with previous literature on
determinants of tax share. However, urban population and external debt is not
significant in the IV estimation.
20
Chapter 2 WHAT IMPAIRS THE “MONEY MACHINE” OF VAT
Table 2.3: Effect of VAT on Tax Share - IV Approach
Dependent Variable:Total Tax Share Indirect Tax Share
Panel A Panel BReduced IV Reduced IV
form form(1) (2) (3) (4)
VAT Introduction 0.134*** 0.044**[0.046] [0.020]
VAT Neighbours 0.002*** 0.001**[0.000] [0.000]
Log(GDP per Capita) 0.015*** 0.012*** 0.004*** 0.003**[0.002] [0.003] [0.001] [0.002]
Agriculture Share -0.095*** -0.033 -0.066*** -0.049***[0.011] [0.028] [0.009] [0.013]
Import Share 0.131*** 0.150*** 0.088*** 0.096***[0.006] [0.013] [0.005] [0.007]
Export Share -0.081*** -0.088*** -0.048*** -0.052***[0.007] [0.013] [0.006] [0.007]
Urban Population -0.057*** -0.009 -0.020*** -0.008[0.008] [0.021] [0.006] [0.009]
External Debt -0.004*** 0.006 -0.003*** 0.000[0.001] [0.004] [0.001] [0.002]
Older Population 0.561*** 0.296** 0.255*** 0.152**[0.051] [0.143] [0.047] [0.075]
Constant -0.020 -0.099** 0.033*** -0.015[0.018] [0.043] [0.012] [0.022]
Regional FE Yes Yes Yes YesYear FE Yes Yes Yes YesObservations 1,714 1,714 1,491 1,491
First stage predicting numbersVAT neighbours 0.017*** 0.023***
[0.005] [0.006]
Econometric StatisticsWu-Hausman F 26.227*** 5.652**Durbin (score) chi2(1) 26.423*** 5.781**Minimum eigenvalue F statistic 11.941 15.829
Source: Authors’ estimations using data from ICTD, WDI and VAT introduction.Note: Standard errors in brackets. *** p<0.01, ** p<0.05, * p<0.1. Results of the IVapproach show that VAT introduction has a significant positive impact on both tax shares.Test results at the bottom confirms the endogeneity problem and the validity of the IV.These results confirm our argument that OLS results provide a bias estimate due to theendogeneity of VAT introduction.
21
WHAT IMPAIRS THE “MONEY MACHINE” OF VAT Chapter 2
2.4.3 Test of Exclusion Restriction
One key assumption when using an IV is that it should not be correlated with
unobserved factors driving the outcome. The only impact on the outcome should
be through the endogenous variable. In our study, the number of neighbouring
countries with VAT should only have an impact on tax capacity through the VAT
introduction of that particular country. We need to test the exclusion restriction
by checking whether the IV directly affects either tax revenue or GDP. Although
we cannot rule out all cases of violation of exclusion restrictions, we attempt to
test the exclusion restriction using two different tests.
Firstly, we use Personal Income Tax Share in GDP as the dependent variable in
the IV model as a falsification test. Personal Income Tax Share in GDP may
change if the overall tax capacity of a country is affected by the introduction
of VAT in neighbouring countries. Personal income tax is an appropriate tax
for this test because it is fairly independent of the VAT. Tax payers of the per-
sonal income tax are individual residents, unlike the VAT tax payers. We use
the results from section 2.6.1, column 2 of Table 2.5, where VAT introduction
has no significant impact on personal income tax share when using number of
neighbouring countries with VAT as an instrumental variable. This shows that,
VAT introduction in neighbouring countries has no impact on either the income
levels of the tax payers in the country of interest or other types of tax revenues
that are unrelated to VAT.
Secondly, we do another test by randomly assigning a placebo VAT introduction
year for the countries by considering the period before its actual VAT introduc-
tion. Then we repeated our IV regression using the number of neighbouring
countries as the instrument for the newly assigned placebo VAT introduction
dummy. We conduct this random test 10,000 times and draw the Kernel density
graph for the coefficients of VAT introduction dummy ϕ shown in appendix Fig-
22
Chapter 2 WHAT IMPAIRS THE “MONEY MACHINE” OF VAT
ure 2.A.6. The figure shows that there is a striking spike in the distribution of ϕ
around zero, suggesting the direct effect of the IV on the dependent variable is
very likely small. The solid vertical line shows the coefficient value of the actual
VAT introduction. Eighty-one percent of the placebo VAT introduction coeffi-
cients are lower than actual VAT introduction coefficient. The mean of ϕ is -0.057
and indicated by the dash vertical line which is lower than the actual coefficient.
It implies that estimated actual effect from the IV would not over-estimate the
true effect due to any potential violation of the exclusion restriction.
2.5 Mechanism
Our analysis in this section is dedicated to understanding the channels through
which tax capacity has increased following the VAT introduction. There could
be three possible channels: (1) Effective tax rate; (2) Tax base; and (3) Informal
sector. The equation below summarizes the channels through which tax share
could be affected after the VAT introduction.
Indirect Tax
‘True′ GDP=Indirect Tax
Tax Base× Tax Base
Reported GDP× Reported GDP
‘True′ GDP(2.6)
Mechanically, introduction of new taxes provides the opportunity for governments
to increase tax revenue from existing firms. This could also be the case with VAT
as the government would obviously want VAT to generate higher revenue espe-
cially due to weak revenue performance in these countries in the period leading
up to the VAT introduction. Therefore, increase in tax capacity after the VAT
introduction could be due to the increase in tax rate. In order to test the change
in tax rate we use effective tax rate: that is tax revenue as a share of tax base to
check whether there is a change in the effective tax rate after the VAT introduc-
tion. In this analysis we use consumption as the tax base and indirect tax as the
tax revenue component.
23

WHAT IMPAIRS THE “MONEY MACHINE” OF VAT Chapter 2
Another possible channel of change in tax capacity after the VAT introduction
could be through the tax base. Firms have a behavioural response to the tax
reforms introduced by the government. As discussed in the literature (Pomeranz,
2015; Krever, 2008) this would result in either an increase or decrease in tax base.
We use tax base as a share of reported GDP to measure the change in tax base
after the VAT introduction.
Annicchiarico and Cesaroni (2018) find that informal sector would lead to severely
miscalculating the economic effect of tax reforms. Therefore, another possible
channel through which tax capacity could change after the VAT introduction
could be due to the existence of the informal sector. Proponents of VAT argue
that VAT reforms play a vital role in bringing informal firms to the formal sector.
With the VAT introduction, firms in the informal sector are encouraged to register
for VAT for of several reasons. Firstly, when larger firms in the formal sector
become VAT registered they always seek out VAT registered firms in the supply
chain to claim the input tax credit. That would encourage the small firms in the
supply chain to register for VAT. De Paula and Scheinkman (2010) show that
small firms in Brazil are more likely to register for VAT if their suppliers and/or
customers are registered. If small firms do not get the VAT registration they have
to either sell at a discount or they will lose business contracts with formal firms.
However, if firms in the informal sector supply directly to the unregistered final
customers, the rising cost could be shifted downward. In that case, tax incidence
depends on the bargaining power of sellers and buyers in the market, and on
the elasticity of demand and supply. In most cases, a business has to take a fair
share of the rising cost unless it has full bargaining power through which the total
costs can be shifted to its customers. Secondly, for unregistered firms, VAT paid
on supplies and imports becomes a final tax as they cannot claim input tax and
that increase their total cost (Ahlerup et al., 2015). Therefore, there is a valid
argument that VAT introduction helps to curtail informal sector by encouraging
smaller firms to join the formal stream.
24
Chapter 2 WHAT IMPAIRS THE “MONEY MACHINE” OF VAT
However, VAT introduction could also have a deterrence effect on the informal
sector. With the introduction of VAT, government is now equipped with new tax-
ation technology that gives better access to firms’ financial information via the
self reporting feature of VAT. This could limit the opportunity for small firms
to hide their financial transactions and evade taxes. Therefore, they might be
discouraged to join the formal sector. Moreover, higher compliance and adminis-
tration cost could also deter informal sector firms from joining the formal sector
(Faridy et al., 2014). Another aspect of this is the VAT registration threshold
(Keen and Mintz, 2004). It could create a bunching phenomenon due to the self-
selection of registration by the small firms in which many of them would decide
to remain unregistered (Harju et al., 2016). Additionally, Zu (2017) also explain
that the registration threshold which is a form of technical concession, creates
significant legal and economic distortions as well as administrative and compli-
ance burdens. Therefore, to investigate whether the variation in informal sector
has helped countries to increase tax capacity, we use reported GDP as a share of
‘True’ GDP as another channel.
Table 2.4 presents the IV results of the three channels through which indirect tax
share could increase after the VAT introduction. The regressions are based on the
2SLS combining Eq. (2.5) and Eq. (2.1). Column (1) shows the contribution of
effective tax rate towards the increase in tax share. The introduction of VAT has
significantly increased the effective tax rate. This suggests that increase in tax
capacity after the VAT introduction has mainly channeled through the increase
in effective tax rate. Column (2) which represents the change in tax base shows a
significant negative relationship with VAT introduction. This indicates a decrease
in tax base after the VAT introduction, which this may be due to the behavioral
response by firms to the increase in effective tax rate. This is in line with Alm
and El-Ganainy (2013), who find that an increase in VAT rate would lead to a
reduction in aggregate consumption. Column (3) suggests that the relationship
between informal sector and VAT introduction is not statistically significant, i.e.
25

WHAT IMPAIRS THE “MONEY MACHINE” OF VAT Chapter 2
there is no change in informal sector after the VAT introduction.
This result emphasises that increase in tax share after the VAT introduction is
a result of the increase in effective tax rate on the small tax base. Especially
in developing countries VAT is not contributing toward the increase in tax ca-
pacity through encouraging informal firms to the formal stream. Conversely, the
ultimate objective of introducing VAT is to have a larger tax base with a lower
tax rate to generate higher tax capacity. If it is implemented successfully the de-
sign of the VAT scheme with enhanced information flow through paper trails will
enable achieving that objective. However, governments in developing countries
have failed to reap the benefits of these advanced features of the VAT scheme.
Instead they are still utilizing the conventional and more convenient method of
imposing further tax burden on small tax base to achieve higher tax share.6
2.6 Additional Results
2.6.1 Effect on Direct Taxes
Any reform in one type of tax could have spillover effects on other types of
taxes in the revenue mix. In this section we use IV approach considering direct
tax as a share of ‘True’ GDP as the dependent variable to check whether VAT
introduction has spillover effect on direct taxes. Column (1) of Table 2.5 shows
how VAT introduction has affected direct tax as a share of ‘True’ GDP. According
to these results we observe that direct tax share has had a positive significant
impact after the VAT introduction. This could be due to an improved information
flow to the tax authorities after VAT introduction and the complimentary effect
between direct and indirect taxes.
6Nevertheless, the magnitude of these results could vary across countries due to differencesin the VAT scheme. One such difference is the registration threshold. However, due to theunavailability of data on the registration threshold across countries and time, we are unable toaddress the heterogeneous effect across countries.
26
Chapter 2 WHAT IMPAIRS THE “MONEY MACHINE” OF VAT
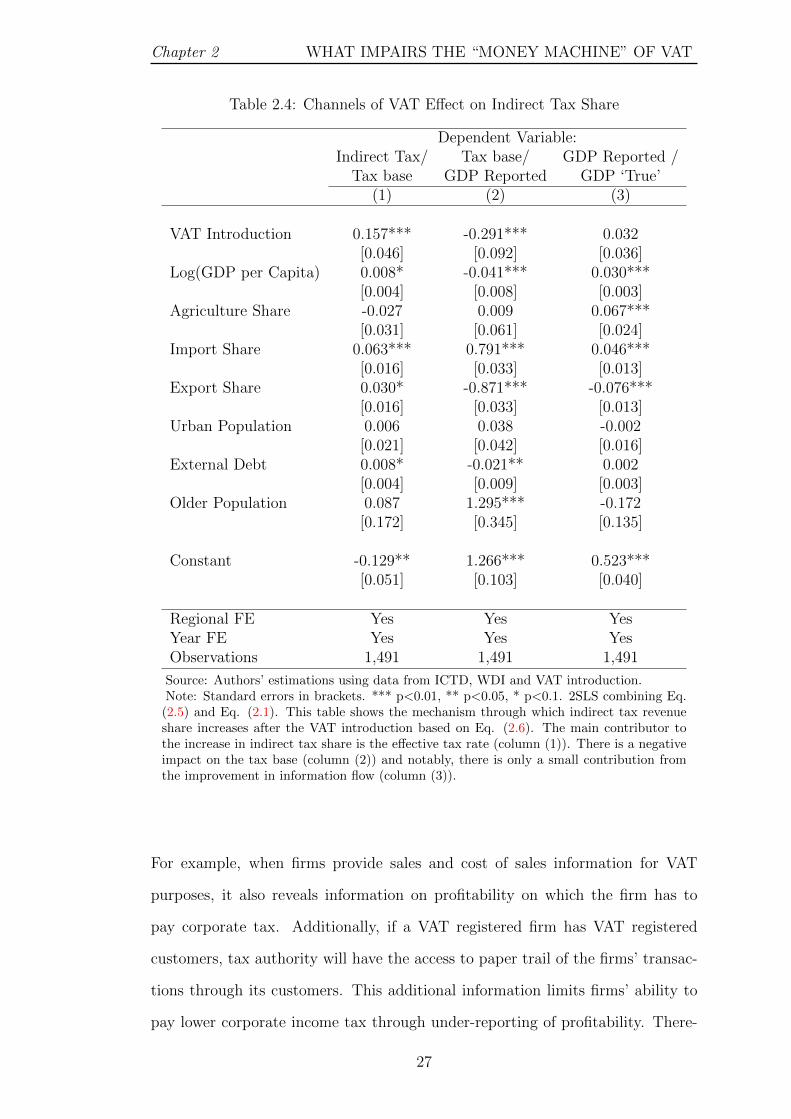
Table 2.4: Channels of VAT Effect on Indirect Tax Share
Dependent Variable:Indirect Tax/ Tax base/ GDP Reported /
Tax base GDP Reported GDP ‘True’(1) (2) (3)
VAT Introduction 0.157*** -0.291*** 0.032[0.046] [0.092] [0.036]
Log(GDP per Capita) 0.008* -0.041*** 0.030***[0.004] [0.008] [0.003]
Agriculture Share -0.027 0.009 0.067***[0.031] [0.061] [0.024]
Import Share 0.063*** 0.791*** 0.046***[0.016] [0.033] [0.013]
Export Share 0.030* -0.871*** -0.076***[0.016] [0.033] [0.013]
Urban Population 0.006 0.038 -0.002[0.021] [0.042] [0.016]
External Debt 0.008* -0.021** 0.002[0.004] [0.009] [0.003]
Older Population 0.087 1.295*** -0.172[0.172] [0.345] [0.135]
Constant -0.129** 1.266*** 0.523***[0.051] [0.103] [0.040]
Regional FE Yes Yes YesYear FE Yes Yes YesObservations 1,491 1,491 1,491
Source: Authors’ estimations using data from ICTD, WDI and VAT introduction.Note: Standard errors in brackets. *** p<0.01, ** p<0.05, * p<0.1. 2SLS combining Eq.
(2.5) and Eq. (2.1). This table shows the mechanism through which indirect tax revenueshare increases after the VAT introduction based on Eq. (2.6). The main contributor tothe increase in indirect tax share is the effective tax rate (column (1)). There is a negativeimpact on the tax base (column (2)) and notably, there is only a small contribution fromthe improvement in information flow (column (3)).
For example, when firms provide sales and cost of sales information for VAT
purposes, it also reveals information on profitability on which the firm has to
pay corporate tax. Additionally, if a VAT registered firm has VAT registered
customers, tax authority will have the access to paper trail of the firms’ transac-
tions through its customers. This additional information limits firms’ ability to
pay lower corporate income tax through under-reporting of profitability. There-
27
WHAT IMPAIRS THE “MONEY MACHINE” OF VAT Chapter 2
fore, there could be a positive information spillover effect of VAT introduction on
corporate tax revenue.7
In order to further confirm our results we divided direct tax share into personal
income tax and corporate income tax. Columns (2) and (3) of Table 2.5 show
the results of personal and corporate tax revenue as a share of ‘True’ GDP re-
spectively. As expected there is a positive and statistically significant impact
on corporate income tax which validates our argument of positive information
spillover of VAT introduction to corporate income tax. However, personal in-
come tax has no impact after VAT introduction since VAT is only associated
with firms.
Comparing results for the channels of increasing tax share with direct taxes, re-
veals an important aspect of the information role of VAT. When we investigate
the mechanism we find that the information role of VAT is not effective in en-
couraging informal sector firms to the formal stream. However, we also find that
extra information after VAT introduction helps to increase corporate tax rev-
enue. This implies that the information role of VAT in developing countries is
only effective in providing information about the firms that are already in the
formal stream but are not effective in approaching the informal sector. This is
particularly important in designing tax policies since different approaches would
be required to address these two different outcomes.
7It is hard to attribute the increase in the total corporate tax revenue after VAT introductionto an increase in the number of corporate tax payers because many new VAT registrations couldbe unincorporated small businesses which do not pay the corporate income tax.
28

Chapter 2 WHAT IMPAIRS THE “MONEY MACHINE” OF VAT
Table 2.5: Effect of VAT on Direct Taxes
Dependent Variable:Direct Tax / PI Tax / CI Tax /GDP ‘True’ GDP ‘True’ GDP ‘True’
(1) (2) (3)
VAT Introduction 0.075*** 0.016 0.047**[0.025] [0.010] [0.021]
Log(GDP per Capita) 0.011*** 0.006*** 0.002[0.002] [0.001] [0.002]
Agriculture Share 0.017 -0.012** 0.011[0.016] [0.005] [0.010]
Import Share 0.053*** 0.014*** 0.017***[0.008] [0.003] [0.006]
Export Share -0.023*** -0.006* 0.012[0.008] [0.004] [0.007]
Urban Population -0.011 -0.015*** -0.001[0.011] [0.004] [0.007]
External Debt 0.003 0.001 0.003[0.002] [0.001] [0.002]
Older Population 0.044 0.042 -0.118[0.085] [0.029] [0.076]
Constant -0.096*** -0.029*** -0.051***[0.027] [0.009] [0.016]
Regional FE Yes Yes YesYear FE Yes Yes YesObservations 1,509 1,150 1,054
Source: Authors’ estimations using data from ICTD, WDI and VAT introduc-tion.Note: Standard errors in brackets. *** p<0.01, ** p<0.05, * p<0.1. 2SLS
combining Eq. (2.5) and Eq. (2.1). This table further breaks down the increasein tax capacity into different types of direct taxes using IV approach. Directtax has also contributed positively to the increase in tax revenue after the VATintroduction. Columns (2) and (3) show the breakdown of direct taxes intopersonal income tax and corporate income tax where only corporate tax share ispositive and significant as expected. This result suggests that VAT introductionhas a positive impact on direct tax revenue and furthermore, that impact iscoming through corporate income tax. VAT introduction has no impact onpersonnel income tax share.
29

WHAT IMPAIRS THE “MONEY MACHINE” OF VAT Chapter 2
2.6.2 Heterogeneity
In practice, VAT schemes in various countries differ from each other. Some coun-
tries have multiple VAT rates, imposing lower VAT rate on essential goods and
service and higher VAT rate on luxury goods. At the same time some countries
use a single VAT rate. However, even the single VAT rate can differ from one
country to another, as some countries have a lower VAT rate and some countries
have a higher VAT rate. Therefore, it is important to study how the heterogeneity
can affect the tax capacity and its channels. We use interaction terms in our IV
model in order to understand the heterogeneity effect. Accordingly, we change
Eq. (2.4) and Eq. (2.5) by interacting V atDit with standard VAT rate of each
country as one interaction term and V atDit with number of VAT rates for each
country in each year as another interaction term.
Table 2.6 shows the results of total effect and effect on channels. Results of
column (1) showing the interaction term between VAT introduction dummy and
standard VAT rate again confirm that countries with a higher standard VAT
rate after VAT introduction has a significant positive impact on tax capacity.
Furthermore, as shown in columns (2) and (3) most of this positive impact is
coming from the higher VAT rate and it has a negative impact on tax base as we
find in the mechanism results (Table 2.4). Column (4) suggests that the impact
of the interaction term on reported GDP as a share of ‘True’ GDP is positive
but not statistically significant. However, the baseline coefficient of the reported
GDP share is now negative and significant. This means that the effect of VAT
introduction on informal sector will be positive until the standard VAT rate is
higher enough. But on average, the effect of VAT introduction on reported GDP
share is not significant (Column (3) of Table 2.4). This could be understood as if
a country’s VAT rate is significantly higher, there is a decrease in informal sector
compared to a country with a lower standard VAT rate. It might be because a
higher VAT rate leads to higher losses for informal sector firms if they do not
30
Chapter 2 WHAT IMPAIRS THE “MONEY MACHINE” OF VAT
come into the formal stream. For example, in a country with a higher VAT rate,
the incentive for formal sector firms to find another formal sector firm in the
supply chain is higher than in a country with lower VAT rate.
Therefore, there is a higher probability that informal sector firms lose business
if they do not register for VAT. Additionally, informal firms’ cost of production
will also increase significantly as they are unable to claim input VAT. Of course,
more micro-evidence is still needed to test this explanation.
One caveat we need to consider in interpreting these results is that, the effects
we identify may include not only that of the VAT introduction, but also other
changes that were taking place along with the VAT introduction such as mod-
ernization of tax administration. Establishment of ‘Large Tax Payer Unit’ is one
such change happened in most of the countries that adopted the VAT. However,
in this paper we try to address this concern to a certain degree by considering
the role of information. With our findings we argue that the role of information
is quite weak especially in developing countries. Furthermore, tax capacity may
depend not only on the tax administration technology, but also on political and
fiscal institutions that may affect the incentives of tax enforcement and better
utilization of the technology. Many countries, as we know, still lack sufficient
incentives (Chen, 2017).
31

WHAT IMPAIRS THE “MONEY MACHINE” OF VAT Chapter 2
Table 2.6: Effect of VAT Rate and Multiple VAT Rates on Indirect Tax Share
Dependent Variable:Ind. Tax / Ind. Tax / Tax Base / GDP Rep. /GDP ‘True’ Tax Base GDP Reported GDP ‘True’
(1) (2) (3) (4)
VAT Introduction -0.088*** -0.219*** 0.285*** -0.138**[0.027] [0.047] [0.091] [0.055]
VAT × Std VAT rate 0.552*** 1.629*** -3.290*** 0.541[0.191] [0.331] [0.636] [0.382]
VAT × No. of VAT rates 0.003 0.006 0.025* -0.010[0.005] [0.008] [0.015] [0.009]
Std VAT rate -0.173 -0.791*** 2.498*** 0.171[0.150] [0.260] [0.499] [0.300]
No. of VAT rates -0.005 -0.012* -0.021 0.014*[0.004] [0.007] [0.014] [0.008]
Log(GDP per Capita) 0.009*** 0.015*** -0.038*** 0.036***[0.002] [0.003] [0.006] [0.003]
Agriculture Share -0.074*** -0.096*** 0.044 0.009[0.012] [0.020] [0.039] [0.023]
Import Share 0.102*** 0.023* 0.845*** 0.057***[0.008] [0.013] [0.026] [0.015]
Export Share -0.058*** 0.058*** -0.907*** -0.077***[0.008] [0.014] [0.026] [0.016]
Urban Population -0.045*** -0.081*** 0.117*** -0.081***[0.008] [0.013] [0.025] [0.015]
External Debt -0.006*** -0.010*** -0.019*** -0.007*[0.002] [0.003] [0.007] [0.004]
Older Population 0.301*** 0.587*** 0.108 0.168[0.052] [0.091] [0.174] [0.105]
Constant 0.026 0.057 0.886*** 0.577***[0.021] [0.037] [0.070] [0.042]
Regional FE Yes Yes Yes YesYear FE Yes Yes Yes YesObservations 1,415 1,415 1,415 1,415
Source: Authors’ estimations using data from ICTD, WDI and VAT introduction.Note: Standard errors in brackets. *** p<0.01, ** p<0.05, * p<0.1. 2SLS combining Eq. (2.5)and Eq. (2.1). Both number of VAT rates and standard VAT rate are standardized based on thelowest value. The interaction term between V atDit and standard VAT rate shows that higherthe standard VAT rate, higher the tax burden and lower the tax base. The coefficient of reportedGDP share is not statistically significant for the interaction term, however, the baseline coefficientis now significantly negative.
32
Chapter 2 WHAT IMPAIRS THE “MONEY MACHINE” OF VAT
2.7 Conclusion
The introduction of VAT is a critical juncture in tax reforms especially in develop-
ing countries. It is apparent that governments in developing countries introduced
VAT at a time of weak revenue performance. Therefore, it is important to inves-
tigate the success of VAT introduction in increasing tax capacity and the under-
lying mechanisms of such an increase. Abundant studies have been conducted on
different aspects of VAT including both theoretical and empirical analysis. How-
ever, to the best of our knowledge there is no study that examines the underlying
mechanisms of increasing tax capacity after VAT introduction. Using panel data
from 1991 to 2015 for 127 developing countries, we first investigate the effect of
VAT introduction on total and indirect tax shares and in the next stage we study
channels through which VAT introduction could increase indirect tax share.
The results of the IV model show that VAT introduction has significantly helped
in increasing tax share in developing countries compared to the OLS estimation.
These results emphasise the importance of using the IV approach especially due
to the possible endogeneity problem of VAT introduction in the OLS estimation.
The results of the next stage reveal that the increase in indirect tax share after
the VAT introduction is mainly channeled through the increase in effective tax
rate. Governments have used VAT introduction to earn higher tax revenue by
increasing the tax burden on the existing tax base and overcome the weak revenue
performance prevailed in the pre-VAT period. This is further established by the
decline in the tax base after the VAT introduction as firms responded to such
extra burden. More importantly, VAT introduction has no positive impact on
encouraging informal firms to the formal sector. This highlights that information
role of VAT is not effective in increasing tax capacity in developing countries
through curtailing the informal sector.
33
WHAT IMPAIRS THE “MONEY MACHINE” OF VAT Chapter 2
In addition to these findings, we also investigate the change in direct tax share
in response to VAT introduction. The results show that VAT introduction has a
positive impact also on direct tax revenue. This implies that VAT introduction
has a positive information spillover effect more specifically on corporate income
tax. Finally, we focus on how the differences in VAT schemes could affect tax
capacity differently. The results show that countries with a higher standard VAT
rate could record a decline in informal sector as the costs of operating in the
underground economy is higher for informal sector firms than in a country with
a lower standard VAT rate.
In this study we could only use regional fixed effects instead of country fixed-
effects. The reason is that our IV is time invariant for some countries as number of
neighbours with VAT have not changed over the sample period. However, in order
to minimize the impact of not using country fixed-effects we have used several
control variables to account for any country-specific characteristics. Furthermore,
our IV; VAT introduction in neighbouring countries does not depend on any
country specific characteristic of the given country. Future research could focus
on using different IVs that could capture country fixed effects, consider other
possible channels and use different other econometric methods.
VAT has been promoted as one of the best tax reforms in history and it has de-
livered results especially in improving tax capacity and tax efficiency. However,
developing countries have not utilized VAT to its full potential but have con-
tinued to use conventional methods to overcome the weak revenue performance.
Therefore, governments in developing countries should take maximum advantage
of superior taxation technologies such as VAT to further enhance tax capacity
and tax efficiency by giving more attention to the information role.
34
Chapter 2 WHAT IMPAIRS THE “MONEY MACHINE” OF VAT
REFERENCES
Adhikari, B. (2020). Does A Value-Added Tax Increase Economic Efficiency ?
Economic Inquiry, 58(1):496–517.
Ahlerup, P., Baskaran, T., and Bigsten, A. (2015). Tax Innovations and Pub-
lic Revenues in Sub-Saharan Africa. The Journal of Development Studies,
51(6):689–706.
Alavuotunki, K., Haapanen, M., and Pirttila, J. (2019). The Effects of the Value-
Added Tax on Revenue and Inequality. The Journal of Development Studies,
55(4):490–508.
Alm, J. and El-Ganainy, A. (2013). Value-added taxation and consumption.
International Tax and Public Finance,, 20:105–128.
Annicchiarico, B. and Cesaroni, C. (2018). Tax reforms and the underground
economy: a simulation-based analysis. International Tax and Public Finance,
25(2):458–518.
Ansari, M. M. (1982). Determinants of Tax Ratio: A Cross-Country Analysis.
Economic and Political Weekly, 17(25):1035–1042.
Baunsgaard, T. and Keen, M. (2010). Tax revenue and (or?) trade liberalization.
Journal of Public Economics, 94(9-10):563–577.
Boadway, R. and Sato, M. (2009). Optimal Tax Design and Enforcement with
an Informal Sector. American Economic Journal, 1(1):1–27.
Carter, A., editor (2013). International Tax Dialogue: Key Issues and Debates in
VAT, SME Taxation and the Tax Treatment of the Financial sector. European
Commission.
Chen, S. X. (2017). The effect of a fiscal squeeze on tax enforcement: Evidence
from a natural experiment in China. Journal of Public Economics, 147:62–76.
Cızek, P., Lei, J., and Ligthart, J. E. (2017). Do Neighbours Influence Value-
Added-Tax Introduction? A Spatial Duration Analysis. Oxford Bulletin of
Economics and Statistics, 79(1):25–54.
35
WHAT IMPAIRS THE “MONEY MACHINE” OF VAT Chapter 2
De Paula, A. and Scheinkman, J. A. (2010). Value-Added Taxes, Chain Effects,
and Informality. American Economic Journal: Macroeconomics, 2:195–221.
Desai, M. A. and Hines, J. (2005). Value-Added Taxes and International Trades:
The Evidence. The University of Michigan Law School.
Ebeke, C. and Ehrhart, H. (2011). Does VAT reduce the instability of tax rev-
enues? CERDI Working Paper No. E 2011.24,.
Eltony, M. N. (2002). The Determinants of Tax Effort in Arab Countries. Arab
Planning InstituteWorking Paper.
Emran, S. M. and Stiglitz, J. E. (2005). On selective indirect tax reform in
developing countries. Journal of Public Economics, 89:599–623.
Faridy, N., Copp, R., Freudenberg, B., and Sarker, T. (2014). Complexity, Com-
pliance Costs and Non-Compliance with VAT by Small and Medium Enter-
prises (SMEs) in Bangladesh: Is there a Relationship? Australian Tax Forum,
29(2):281–328.
Gerard, F. and Naritomi, J. (2018). Value Added Tax in developing countries:
Lessons from recent research. IGC Growth Brief Series 15.
Gupta, A. S. (2007). Determinants of Tax Revenue Efforts in Developing Coun-
tries. IMF Working Papers, 07(184):1.
Harju, J., Matikka, T., and Rauhanen, T. (2016). The Effects of Size-Based
Regulation on Small Firms: Evidence from Vat Threshold. VATT Institute for
Economic Research Working Paper, 75.
Keen, M. (2007). VAT attacks! International Tax and Public Finance,, 14:365–
381.
Keen, M. and Lockwood, B. (2010). The value added tax: Its causes and conse-
quences. Journal of Development Economics, 92(2):138–151.
Keen, M. and Mansour, M. (2009). Revenue Mobilization in Sub-Saharan Africa:
Challenges from Globalization. IMF Working Paper, WP/09/157.
Keen, M. and Mintz, J. (2004). The optimal threshold for a value-added tax.
Journal of Public Economics, 88:559–576.
36
Chapter 2 WHAT IMPAIRS THE “MONEY MACHINE” OF VAT
Krever, R. (2008). Designing and Drafting VAT Laws for Africa. In Krever, R.,
editor, VAT in Africa, pages 17–36. Pretoria University Law Press., Pretoria.
Leuthold, J. H. (1991). Tax shares in developing economies A panel study. Journal
of Development Economics, 35:173–185.
Li, P., Lu, Y., and Wang, J. (2016). Does flattening government improve eco-
nomic performance? Evidence from China. Journal of Development Economics,
123:18–37.
Medina, L. and Schneider, F. (2018). Shadow economies around the world: what
did we learn over the last 20 years? IMF Working Papers, 18(17):1–76.
Mudiyanselage, H. K., Rammohan, A., and Chen, S. X. (2020). Tax Effort in
Developing Countries: Where is Sri Lanka? Journal of Tax Administration,
6(1):162–189.
Naritomi, J. (2019). Consumers as Tax Auditors. American Economic Review,
109(9):3031–3072.
Piggott, J. and Whalley, J. (2001). VAT Base Broadening, Self Supply, and the
Informal Sector. American Economic Review, 91(4):1084–1094.
Pomeranz, D. (2015). No Taxation without Information: Deterrence and
Self-Enforcement in the Value Added Tax. American Economic Review,
105(8):2539–2569.
Tanzi, V. (1992). Structural factors and tax revenue in developing countries:
a decade of evidence. In I. Goldin & L. Winters, editor, Open Economies:
Structural Adjustment and Agriculture, pages 267–285. Cambridge University
Press, Cambridge.
Ufier, A. (2014). Quasi-Experimental Analysis on the Effects of Adoption of a
Value Added Tax. Economics Inquiry, 52(4):1364–1379.
Zarra-Nezhad, M., Sheikh Ansari, M., and Moradi, M. (2016). Determinants of
Tax Revenue: Does Liberalization Boost or Decline It? Journal of Economic
Cooperation and Development, 37(2):103–126.
Zu, Y. (2017). Reforming VAT Concessions: A Tax Expenditure Analysis . British
Tax Review, 4:418–437.
37
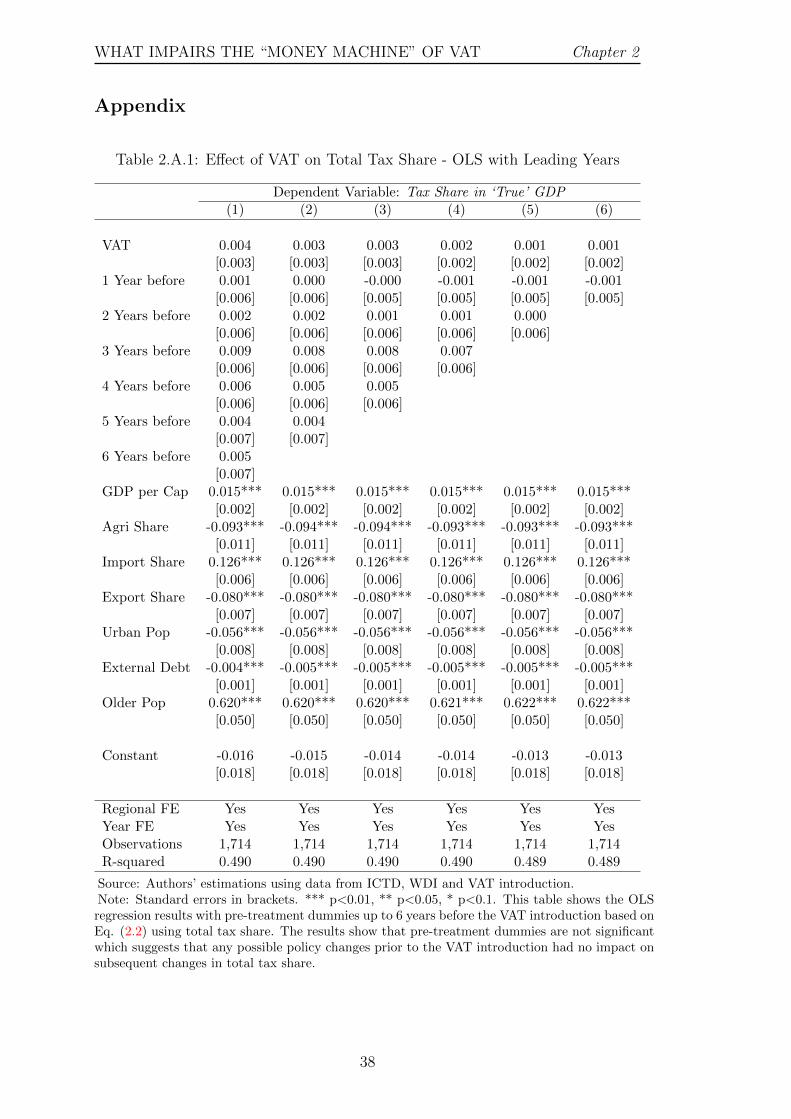
WHAT IMPAIRS THE “MONEY MACHINE” OF VAT Chapter 2
Appendix
Table 2.A.1: Effect of VAT on Total Tax Share - OLS with Leading Years
Dependent Variable: Tax Share in ‘True’ GDP(1) (2) (3) (4) (5) (6)
VAT 0.004 0.003 0.003 0.002 0.001 0.001[0.003] [0.003] [0.003] [0.002] [0.002] [0.002]
1 Year before 0.001 0.000 -0.000 -0.001 -0.001 -0.001[0.006] [0.006] [0.005] [0.005] [0.005] [0.005]
2 Years before 0.002 0.002 0.001 0.001 0.000[0.006] [0.006] [0.006] [0.006] [0.006]
3 Years before 0.009 0.008 0.008 0.007[0.006] [0.006] [0.006] [0.006]
4 Years before 0.006 0.005 0.005[0.006] [0.006] [0.006]
5 Years before 0.004 0.004[0.007] [0.007]
6 Years before 0.005[0.007]
GDP per Cap 0.015*** 0.015*** 0.015*** 0.015*** 0.015*** 0.015***[0.002] [0.002] [0.002] [0.002] [0.002] [0.002]
Agri Share -0.093*** -0.094*** -0.094*** -0.093*** -0.093*** -0.093***[0.011] [0.011] [0.011] [0.011] [0.011] [0.011]
Import Share 0.126*** 0.126*** 0.126*** 0.126*** 0.126*** 0.126***[0.006] [0.006] [0.006] [0.006] [0.006] [0.006]
Export Share -0.080*** -0.080*** -0.080*** -0.080*** -0.080*** -0.080***[0.007] [0.007] [0.007] [0.007] [0.007] [0.007]
Urban Pop -0.056*** -0.056*** -0.056*** -0.056*** -0.056*** -0.056***[0.008] [0.008] [0.008] [0.008] [0.008] [0.008]
External Debt -0.004*** -0.005*** -0.005*** -0.005*** -0.005*** -0.005***[0.001] [0.001] [0.001] [0.001] [0.001] [0.001]
Older Pop 0.620*** 0.620*** 0.620*** 0.621*** 0.622*** 0.622***[0.050] [0.050] [0.050] [0.050] [0.050] [0.050]
Constant -0.016 -0.015 -0.014 -0.014 -0.013 -0.013[0.018] [0.018] [0.018] [0.018] [0.018] [0.018]
Regional FE Yes Yes Yes Yes Yes YesYear FE Yes Yes Yes Yes Yes YesObservations 1,714 1,714 1,714 1,714 1,714 1,714R-squared 0.490 0.490 0.490 0.490 0.489 0.489
Source: Authors’ estimations using data from ICTD, WDI and VAT introduction.Note: Standard errors in brackets. *** p<0.01, ** p<0.05, * p<0.1. This table shows the OLSregression results with pre-treatment dummies up to 6 years before the VAT introduction based onEq. (2.2) using total tax share. The results show that pre-treatment dummies are not significantwhich suggests that any possible policy changes prior to the VAT introduction had no impact onsubsequent changes in total tax share.
38
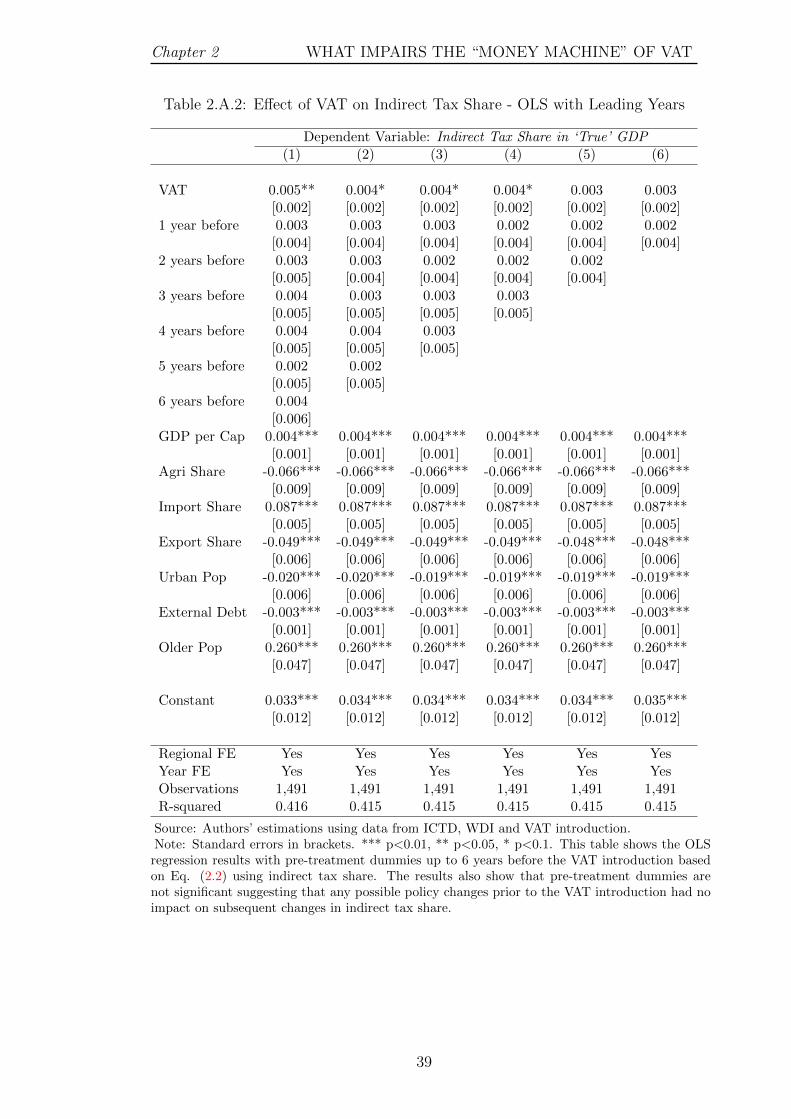
Chapter 2 WHAT IMPAIRS THE “MONEY MACHINE” OF VAT
Table 2.A.2: Effect of VAT on Indirect Tax Share - OLS with Leading Years
Dependent Variable: Indirect Tax Share in ‘True’ GDP(1) (2) (3) (4) (5) (6)
VAT 0.005** 0.004* 0.004* 0.004* 0.003 0.003[0.002] [0.002] [0.002] [0.002] [0.002] [0.002]
1 year before 0.003 0.003 0.003 0.002 0.002 0.002[0.004] [0.004] [0.004] [0.004] [0.004] [0.004]
2 years before 0.003 0.003 0.002 0.002 0.002[0.005] [0.004] [0.004] [0.004] [0.004]
3 years before 0.004 0.003 0.003 0.003[0.005] [0.005] [0.005] [0.005]
4 years before 0.004 0.004 0.003[0.005] [0.005] [0.005]
5 years before 0.002 0.002[0.005] [0.005]
6 years before 0.004[0.006]
GDP per Cap 0.004*** 0.004*** 0.004*** 0.004*** 0.004*** 0.004***[0.001] [0.001] [0.001] [0.001] [0.001] [0.001]
Agri Share -0.066*** -0.066*** -0.066*** -0.066*** -0.066*** -0.066***[0.009] [0.009] [0.009] [0.009] [0.009] [0.009]
Import Share 0.087*** 0.087*** 0.087*** 0.087*** 0.087*** 0.087***[0.005] [0.005] [0.005] [0.005] [0.005] [0.005]
Export Share -0.049*** -0.049*** -0.049*** -0.049*** -0.048*** -0.048***[0.006] [0.006] [0.006] [0.006] [0.006] [0.006]
Urban Pop -0.020*** -0.020*** -0.019*** -0.019*** -0.019*** -0.019***[0.006] [0.006] [0.006] [0.006] [0.006] [0.006]
External Debt -0.003*** -0.003*** -0.003*** -0.003*** -0.003*** -0.003***[0.001] [0.001] [0.001] [0.001] [0.001] [0.001]
Older Pop 0.260*** 0.260*** 0.260*** 0.260*** 0.260*** 0.260***[0.047] [0.047] [0.047] [0.047] [0.047] [0.047]
Constant 0.033*** 0.034*** 0.034*** 0.034*** 0.034*** 0.035***[0.012] [0.012] [0.012] [0.012] [0.012] [0.012]
Regional FE Yes Yes Yes Yes Yes YesYear FE Yes Yes Yes Yes Yes YesObservations 1,491 1,491 1,491 1,491 1,491 1,491R-squared 0.416 0.415 0.415 0.415 0.415 0.415
Source: Authors’ estimations using data from ICTD, WDI and VAT introduction.Note: Standard errors in brackets. *** p<0.01, ** p<0.05, * p<0.1. This table shows the OLSregression results with pre-treatment dummies up to 6 years before the VAT introduction basedon Eq. (2.2) using indirect tax share. The results also show that pre-treatment dummies arenot significant suggesting that any possible policy changes prior to the VAT introduction had noimpact on subsequent changes in indirect tax share.
39
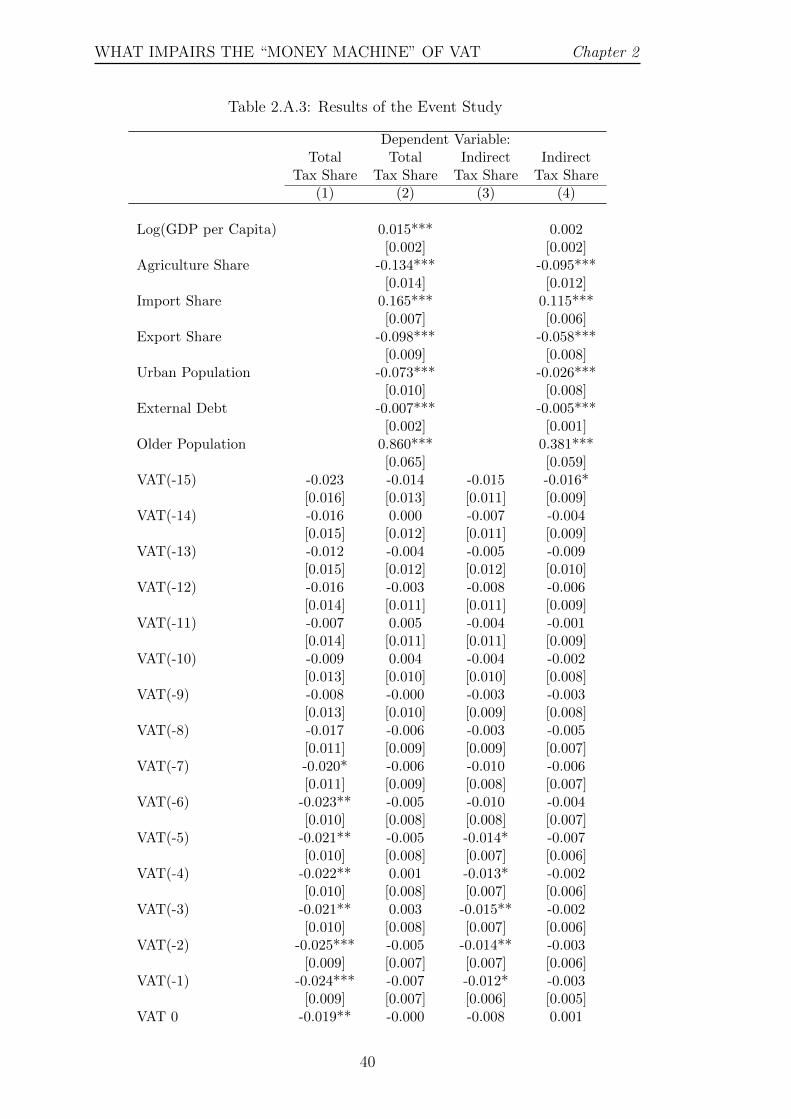
WHAT IMPAIRS THE “MONEY MACHINE” OF VAT Chapter 2
Table 2.A.3: Results of the Event Study
Dependent Variable:Total Total Indirect Indirect
Tax Share Tax Share Tax Share Tax Share(1) (2) (3) (4)
Log(GDP per Capita) 0.015*** 0.002[0.002] [0.002]
Agriculture Share -0.134*** -0.095***[0.014] [0.012]
Import Share 0.165*** 0.115***[0.007] [0.006]
Export Share -0.098*** -0.058***[0.009] [0.008]
Urban Population -0.073*** -0.026***[0.010] [0.008]
External Debt -0.007*** -0.005***[0.002] [0.001]
Older Population 0.860*** 0.381***[0.065] [0.059]
VAT(-15) -0.023 -0.014 -0.015 -0.016*[0.016] [0.013] [0.011] [0.009]
VAT(-14) -0.016 0.000 -0.007 -0.004[0.015] [0.012] [0.011] [0.009]
VAT(-13) -0.012 -0.004 -0.005 -0.009[0.015] [0.012] [0.012] [0.010]
VAT(-12) -0.016 -0.003 -0.008 -0.006[0.014] [0.011] [0.011] [0.009]
VAT(-11) -0.007 0.005 -0.004 -0.001[0.014] [0.011] [0.011] [0.009]
VAT(-10) -0.009 0.004 -0.004 -0.002[0.013] [0.010] [0.010] [0.008]
VAT(-9) -0.008 -0.000 -0.003 -0.003[0.013] [0.010] [0.009] [0.008]
VAT(-8) -0.017 -0.006 -0.003 -0.005[0.011] [0.009] [0.009] [0.007]
VAT(-7) -0.020* -0.006 -0.010 -0.006[0.011] [0.009] [0.008] [0.007]
VAT(-6) -0.023** -0.005 -0.010 -0.004[0.010] [0.008] [0.008] [0.007]
VAT(-5) -0.021** -0.005 -0.014* -0.007[0.010] [0.008] [0.007] [0.006]
VAT(-4) -0.022** 0.001 -0.013* -0.002[0.010] [0.008] [0.007] [0.006]
VAT(-3) -0.021** 0.003 -0.015** -0.002[0.010] [0.008] [0.007] [0.006]
VAT(-2) -0.025*** -0.005 -0.014** -0.003[0.009] [0.007] [0.007] [0.006]
VAT(-1) -0.024*** -0.007 -0.012* -0.003[0.009] [0.007] [0.006] [0.005]
VAT 0 -0.019** -0.000 -0.008 0.001
40
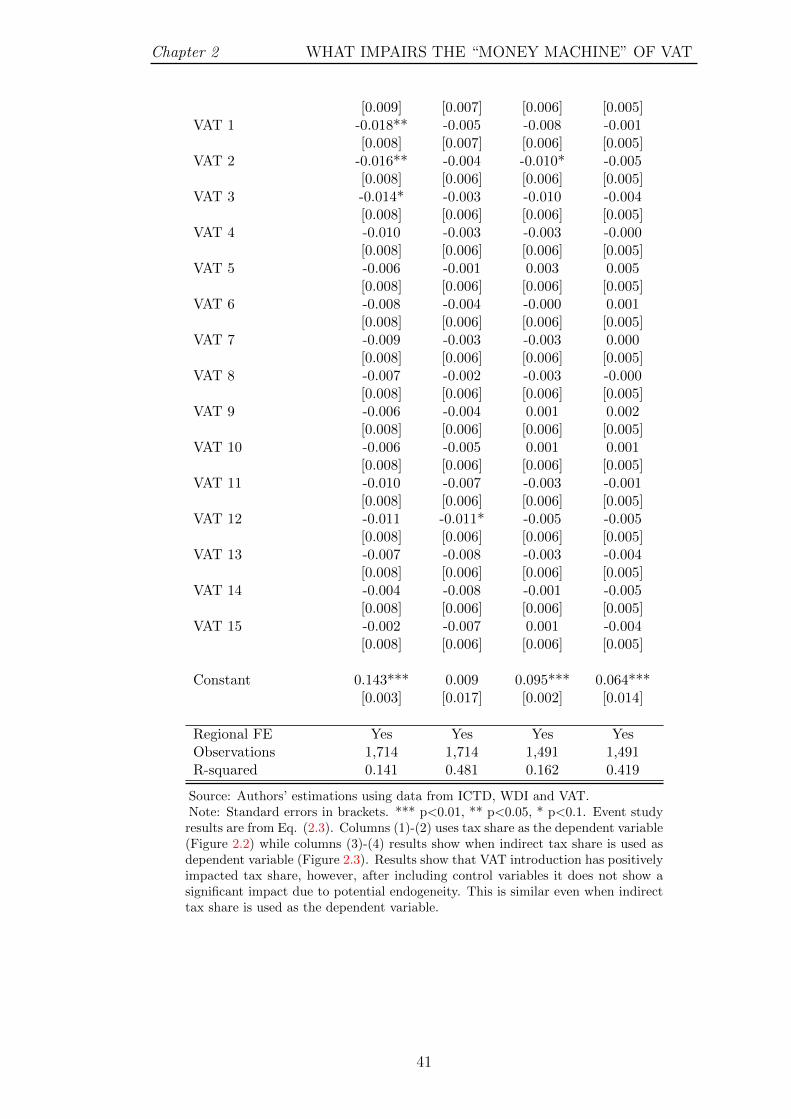
Chapter 2 WHAT IMPAIRS THE “MONEY MACHINE” OF VAT
[0.009] [0.007] [0.006] [0.005]VAT 1 -0.018** -0.005 -0.008 -0.001
[0.008] [0.007] [0.006] [0.005]VAT 2 -0.016** -0.004 -0.010* -0.005
[0.008] [0.006] [0.006] [0.005]VAT 3 -0.014* -0.003 -0.010 -0.004
[0.008] [0.006] [0.006] [0.005]VAT 4 -0.010 -0.003 -0.003 -0.000
[0.008] [0.006] [0.006] [0.005]VAT 5 -0.006 -0.001 0.003 0.005
[0.008] [0.006] [0.006] [0.005]VAT 6 -0.008 -0.004 -0.000 0.001
[0.008] [0.006] [0.006] [0.005]VAT 7 -0.009 -0.003 -0.003 0.000
[0.008] [0.006] [0.006] [0.005]VAT 8 -0.007 -0.002 -0.003 -0.000
[0.008] [0.006] [0.006] [0.005]VAT 9 -0.006 -0.004 0.001 0.002
[0.008] [0.006] [0.006] [0.005]VAT 10 -0.006 -0.005 0.001 0.001
[0.008] [0.006] [0.006] [0.005]VAT 11 -0.010 -0.007 -0.003 -0.001
[0.008] [0.006] [0.006] [0.005]VAT 12 -0.011 -0.011* -0.005 -0.005
[0.008] [0.006] [0.006] [0.005]VAT 13 -0.007 -0.008 -0.003 -0.004
[0.008] [0.006] [0.006] [0.005]VAT 14 -0.004 -0.008 -0.001 -0.005
[0.008] [0.006] [0.006] [0.005]VAT 15 -0.002 -0.007 0.001 -0.004
[0.008] [0.006] [0.006] [0.005]
Constant 0.143*** 0.009 0.095*** 0.064***[0.003] [0.017] [0.002] [0.014]
Regional FE Yes Yes Yes YesObservations 1,714 1,714 1,491 1,491R-squared 0.141 0.481 0.162 0.419
Source: Authors’ estimations using data from ICTD, WDI and VAT.Note: Standard errors in brackets. *** p<0.01, ** p<0.05, * p<0.1. Event studyresults are from Eq. (2.3). Columns (1)-(2) uses tax share as the dependent variable(Figure 2.2) while columns (3)-(4) results show when indirect tax share is used asdependent variable (Figure 2.3). Results show that VAT introduction has positivelyimpacted tax share, however, after including control variables it does not show asignificant impact due to potential endogeneity. This is similar even when indirecttax share is used as the dependent variable.
41
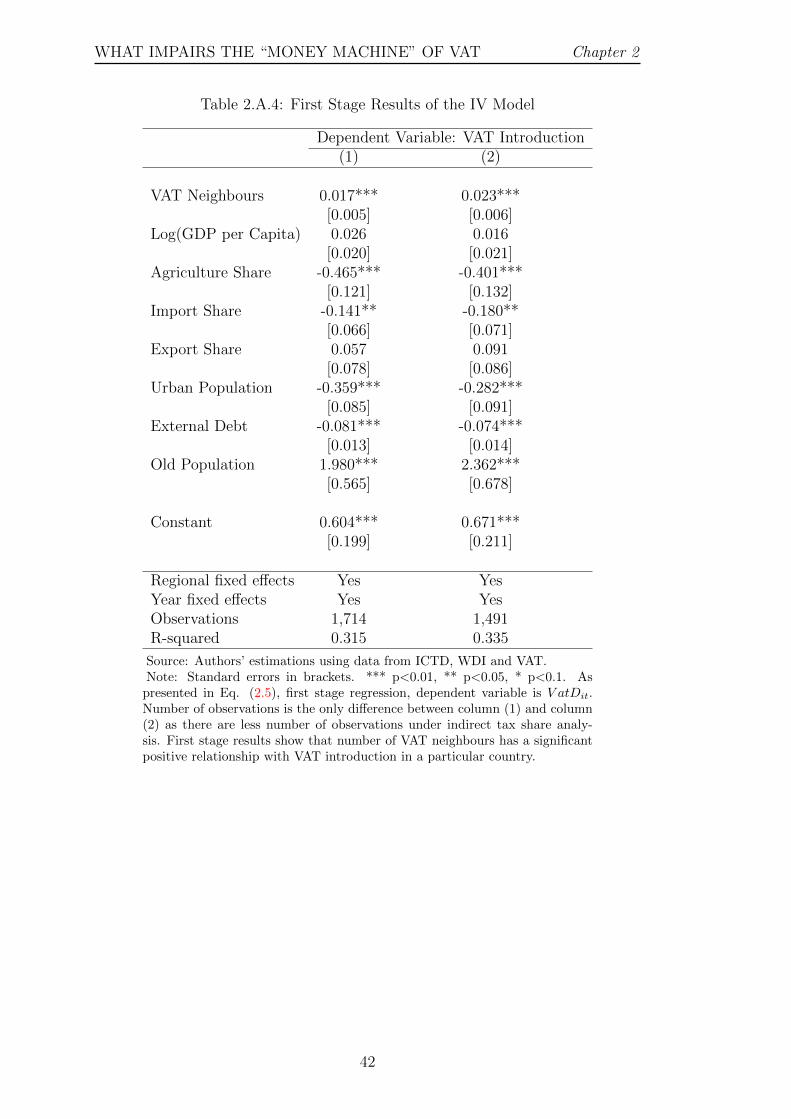
WHAT IMPAIRS THE “MONEY MACHINE” OF VAT Chapter 2
Table 2.A.4: First Stage Results of the IV Model
Dependent Variable: VAT Introduction(1) (2)
VAT Neighbours 0.017*** 0.023***[0.005] [0.006]
Log(GDP per Capita) 0.026 0.016[0.020] [0.021]
Agriculture Share -0.465*** -0.401***[0.121] [0.132]
Import Share -0.141** -0.180**[0.066] [0.071]
Export Share 0.057 0.091[0.078] [0.086]
Urban Population -0.359*** -0.282***[0.085] [0.091]
External Debt -0.081*** -0.074***[0.013] [0.014]
Old Population 1.980*** 2.362***[0.565] [0.678]
Constant 0.604*** 0.671***[0.199] [0.211]
Regional fixed effects Yes YesYear fixed effects Yes YesObservations 1,714 1,491R-squared 0.315 0.335
Source: Authors’ estimations using data from ICTD, WDI and VAT.Note: Standard errors in brackets. *** p<0.01, ** p<0.05, * p<0.1. As
presented in Eq. (2.5), first stage regression, dependent variable is V atDit.Number of observations is the only difference between column (1) and column(2) as there are less number of observations under indirect tax share analy-sis. First stage results show that number of VAT neighbours has a significantpositive relationship with VAT introduction in a particular country.
42

Chapter 2 WHAT IMPAIRS THE “MONEY MACHINE” OF VAT
Figure 2.A.1: Countries Introduced VAT by 1970
Source: Authors’ estimation using VAT introduction data.Note: In this map, countries shown in dark Red colour are the countries that introduced VATbefore 1970.
Figure 2.A.2: Countries Introduced VAT by 1980
Source: Authors’ estimation using VAT introduction data.Note: In this map, countries shown in dark Red colour are the countries that introduced VATbetween 1970 and 1980. Countries shown in light Red colour are the countries that introducedVAT before 1970
Figure 2.A.3: Countries Introduced VAT by 1990
Source: Authors’ estimation using VAT introduction data.Note: In this map, countries shown in dark Red colour are the countries that introduced VATbetween 1980 and 1990. Countries shown in light Red colour are the countries that introducedVAT before 1980
43
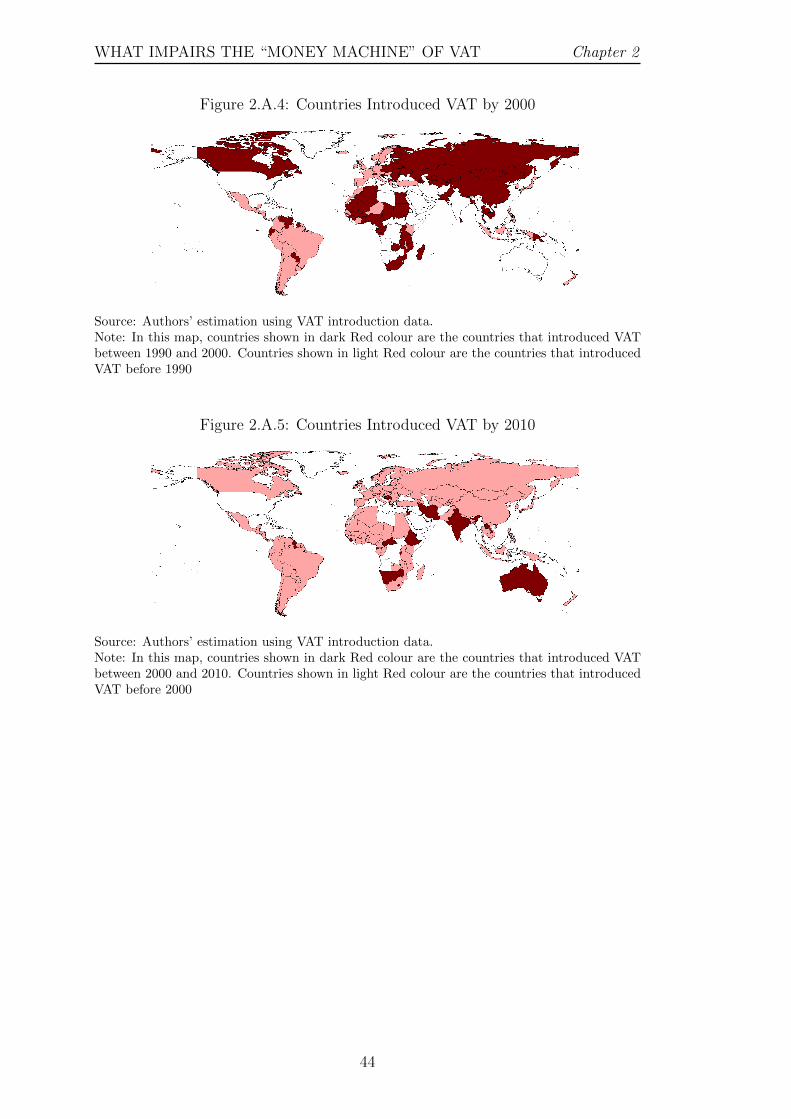
WHAT IMPAIRS THE “MONEY MACHINE” OF VAT Chapter 2
Figure 2.A.4: Countries Introduced VAT by 2000
Source: Authors’ estimation using VAT introduction data.Note: In this map, countries shown in dark Red colour are the countries that introduced VATbetween 1990 and 2000. Countries shown in light Red colour are the countries that introducedVAT before 1990
Figure 2.A.5: Countries Introduced VAT by 2010
Source: Authors’ estimation using VAT introduction data.Note: In this map, countries shown in dark Red colour are the countries that introduced VATbetween 2000 and 2010. Countries shown in light Red colour are the countries that introducedVAT before 2000
44
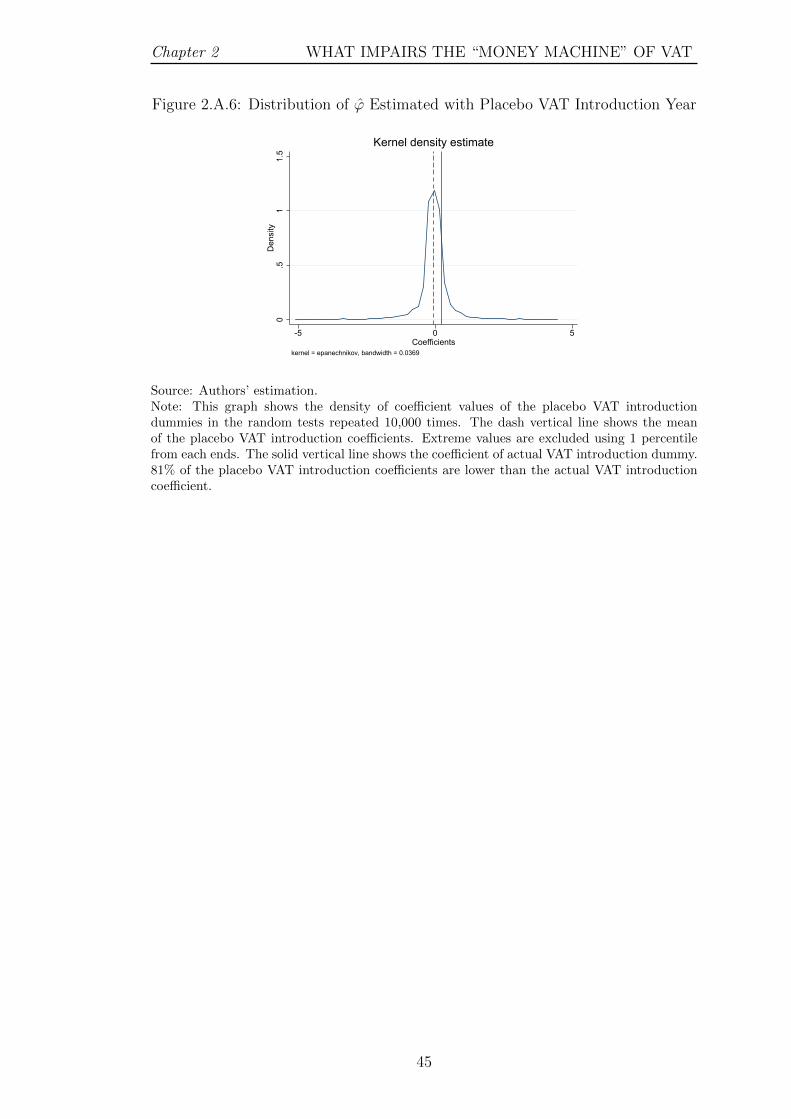
Chapter 2 WHAT IMPAIRS THE “MONEY MACHINE” OF VAT
Figure 2.A.6: Distribution of ϕ Estimated with Placebo VAT Introduction Year
0.5
11.
5D
ensi
ty
-5 0 5Coefficients
kernel = epanechnikov, bandwidth = 0.0369
Kernel density estimate
Source: Authors’ estimation.Note: This graph shows the density of coefficient values of the placebo VAT introductiondummies in the random tests repeated 10,000 times. The dash vertical line shows the meanof the placebo VAT introduction coefficients. Extreme values are excluded using 1 percentilefrom each ends. The solid vertical line shows the coefficient of actual VAT introduction dummy.81% of the placebo VAT introduction coefficients are lower than the actual VAT introductioncoefficient.
45
Chapter 3
APPROPRIATENESS AND EFFECTIVENESS OF VAT:
EVIDENCE FROM CROSS-COUNTRY VAT DIFFUSION
“The existence of effectiveness gains from adoption of a VAT is by no means
assured, but varies systematically with country circumstances...”
Keen and Lockwood (2010)
3.1 Introduction
Institutions fundamentally affect the economic performance of a state (North,
1981; Acemoglu et al., 2001; Dell and Olken, 2020). New institutions usually
originate in one place and diffuse across countries. The diffusion may follow a
forceful dynamic process driven by external forces such as military conquests and
colonization (Acemoglu et al., 2001; Dell and Olken, 2020), or wishful reform
guidance of international institutions such as the World Bank and International
Monetary Fund (IMF) (Knoll and Zloczysti, 2012; Ward and Dorussen, 2015).
Amid diffusion, institutional and policy choices can also be shaped by exogenous
factors such as geography (Gallup et al., 1999; Hall and Jones, 1999), and natural
resources (Carmignani and Chowdhury, 2012).
However, one size does not fit all. The institutions that work well in some coun-
tries may not produce desirable outcomes in others. An example is the third wave
of democratization and its associated problems. Rose and Shin (2001) show that
countries have not been successful compared to the first wave of democratization
46
Chapter 3 APPROPRIATENESS AND EFFECTIVENESS OF VAT
if they introduced elections before establishing basic institutions such as rule of
law, institutions of civil society and accountability. Therefore, it is crucial to
investigate the economic and political conditions that may fail a potentially good
institution.
In this paper, we argue that institutional dysfunction follows a similar mechanism
as the inappropriateness of technology in the study of cross-country technology
adoption. Previous studies suggest a technology developed in a rich country
which is suitable for a capital-abundant environment may not be appropriate to
a labour-abundant less developed country (Acemoglu and Zilibotti, 2001; Caselli
and Coleman, 2006). As a result, the technological appropriateness crucially
affects the aggregate productivity and income level of a country (Acemoglu and
Zilibotti, 2001; Basu and Weil, 1998; Caselli and Coleman, 2006; Diwan and
Rodrik, 1991). Enlightened by these literature, we use the term “Institutional
Appropriateness” to describe the degree of compatibility of an adopted institution
to the host country. An institution may be inappropriate if it is introduced to the
host country mainly due to external forces while it might be incompatible with
the local economic and political fundamentals.
We focus on a specific economic institution: Value-added Tax (VAT). We inves-
tigate how the appropriateness of VAT to each country affects its tax capacity
measured by tax-GDP ratio, after the introduction of VAT. In keeping with Keen
and Lockwood (2010), we construct a measure of the appropriateness of VAT. We
use tax-GDP ratio as the outcome variable to capture the impact of VAT on tax
capacity, which is thought to be a pillar of state capacity for economic prosperity
(Besley and Persson, 2009, 2011, 2014).
VAT is desirable for investigating institutional and technological diffusion. On
the one hand, VAT is not only an institution to mobilize government revenue
but also a tax technology that involves new processes, equipment and skills to
implement it (Gerard and Naritomi, 2018; Ghirmai et al., 2014; Fan et al., 2018;
47
APPROPRIATENESS AND EFFECTIVENESS OF VAT Chapter 3
Fjeldstad et al., 2020). Therefore, both the general mechanisms of diffusion and
appropriateness of institutions (and technologies) can be applied to VAT. On the
other hand, VAT has gradually transmitted to more than 166 countries since it
was first formally adopted in France in the 1950s. It is now regarded as a key
source of tax revenue in many countries. The variation of VAT introduction over
time and across countries, along with the available tax revenue data, allow us
to implement reliable empirical strategy by combining spatial regressions and an
IV.
Many studies have pointed to the role of geography in the diffusion of VAT across
countries. These studies exploited the VAT adoption of neighbouring countries
as an exogenous variation for various empirical purposes. Keen and Lockwood
(2010) use the proportion of countries in the same region that implemented VAT
to capture the neighbourhood effect in their study to identify the causes of VAT
introduction and argue that the significant positive relationship could be where
countries noting the better performance of neighbours adopted VAT.8 A group of
geographically close countries may adopt VAT to replace the more distortionary
tariff and turnover tax following policy suggestions from the IMF or World Bank.
Despite the prevalence of VAT, its appropriateness to each country is ambiguous.
Many studies show that the effect of VAT on tax capacity and economic efficiency
varies tremendously across countries (Baunsgaard and Keen, 2010; Ahlerup et al.,
2015; Adhikari, 2020). Studies based on detailed micro data reveal loopholes
in the VAT compliance (Pomeranz, 2015; Naritomi, 2019; Waseem, 2020a,b).
However, there is limited research on the underlying factors that led to variations
in VAT performance across countries. We attempt to fill this gap by proposing
a method to measure the appropriateness of VAT and to evaluate the impact of
appropriateness on VAT performance.
8Christian and Helene (2011) and Alavuotunki et al. (2019) also use share of neighbouringcountries with VAT as the instrumental variable in their studies. Ahlerup et al. (2015) usenumber of neighbouring countries with VAT while estimating the impact of VAT on tax revenuein Sub-Saharan Africa.
48
Chapter 3 APPROPRIATENESS AND EFFECTIVENESS OF VAT
Following the aforementioned studies on VAT diffusion, we measure the appro-
priateness index of VAT based on the assumption that VAT diffusion is jointly
determined by two sets of factors: (1) geography9; and (2) country’s economic and
social conditions. In light of the original idea of Keen and Lockwood (2010), we
construct an appropriateness index of VAT based on a country’s economic and
social conditions such as agriculture share, trade openness, external debt and
democracy index. Technically, we disentangle the appropriateness of VAT from
geographic factors by using spatial regressions (Spatial Durbin Model). Then we
use the geographic neighbours as the IV of VAT introduction and IV’s interaction
with each country’s appropriateness index.
The data we use cover 154 countries over a period from 1980 to 2017 and are
drawn from several different sources including International Centre for Tax and
Development (ICTD), World Development Indicators, International Tax Dialogue
book edited by Alan Carter and Polity IV project. In keeping with the litera-
ture, our results show that VAT diffusion across countries is driven by geographic
distance between countries (Cızek et al., 2017). As a novel finding, our results
additionally suggest that the effect of VAT introduction on tax capacity depends
on its appropriateness to the host country. Countries with a greater appropriate-
ness index have a greater increase in tax capacity after the introduction of VAT.
These findings may contribute to the literature on institutions, tax capacity, and
tax administration.
The rest of the paper is organized as follows. Section 3.2 discusses the data,
variable and motivation while section 3.3 focuses on the empirical strategy. Sec-
tion 3.4 reports the main results including the appropriateness index. Section 3.5
discusses the policy implications and concludes.
9In the robustness analysis, we also extend it to more general factors including legal back-ground and religion.
49
APPROPRIATENESS AND EFFECTIVENESS OF VAT Chapter 3
3.2 Data, Spatial Matrices and Motivating Facts
3.2.1 Data Description
We use a panel data set of 154 countries for the period from 1980 to 2017. As
we are considering geographic neighbours as one of the spatial matrices we have
not included island nations in our panel. In this panel data set there are 126
countries that introduced VAT and 28 countries that have not introduced VAT.
Countries that introduced VAT, have both with VAT and without VAT years in
the sample period.
The study combines data from several different sources. VAT-related data is from
Annex 1 of the book edited by Alan Carter (Carter, 2013) from International Tax
Dialogue. Following Keen and Lockwood (2010), we use a set of control variables
that may affect VAT adoption decision including per capita GDP, agriculture
share, trade share, urban population, external debt, older population, democracy
index and lagged tax to GDP share. Except democracy index and lagged tax to
GDP share, data for other control variables is from World Development Indicators
(WDI). Democracy index data is from Polity IV Project by Center for Systemic
Peace. The Polity IV project provides a democracy index ranging from +10 which
is strongly democratic to -10 which is strongly autocratic. We have considered all
the negative values as zero which means non democratic countries and positive
values without any change to represent the democratic countries at different levels.
Tax-GDP ratio is from International Centre for Tax and Development (ICTD)
data set. Summary statistics of the main variables used in the regression are
reported in Table 3.1.
50
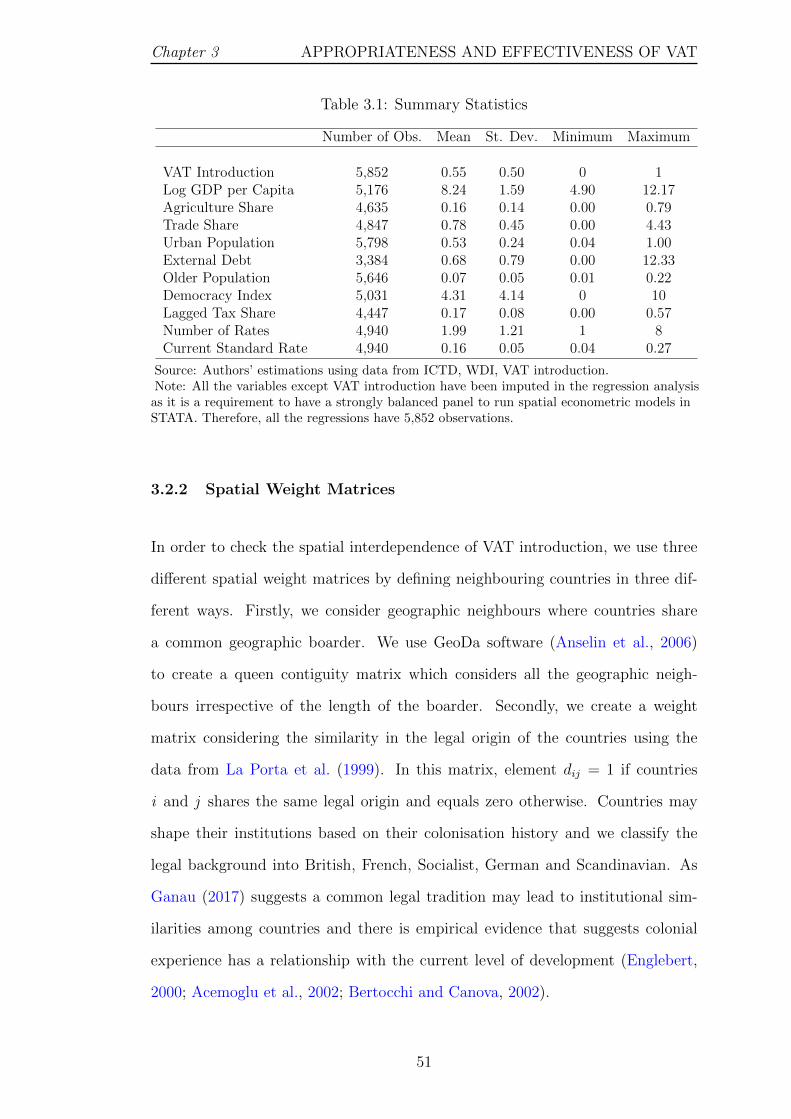
Chapter 3 APPROPRIATENESS AND EFFECTIVENESS OF VAT
Table 3.1: Summary Statistics
Number of Obs. Mean St. Dev. Minimum Maximum
VAT Introduction 5,852 0.55 0.50 0 1Log GDP per Capita 5,176 8.24 1.59 4.90 12.17Agriculture Share 4,635 0.16 0.14 0.00 0.79Trade Share 4,847 0.78 0.45 0.00 4.43Urban Population 5,798 0.53 0.24 0.04 1.00External Debt 3,384 0.68 0.79 0.00 12.33Older Population 5,646 0.07 0.05 0.01 0.22Democracy Index 5,031 4.31 4.14 0 10Lagged Tax Share 4,447 0.17 0.08 0.00 0.57Number of Rates 4,940 1.99 1.21 1 8Current Standard Rate 4,940 0.16 0.05 0.04 0.27
Source: Authors’ estimations using data from ICTD, WDI, VAT introduction.Note: All the variables except VAT introduction have been imputed in the regression analysis
as it is a requirement to have a strongly balanced panel to run spatial econometric models inSTATA. Therefore, all the regressions have 5,852 observations.
3.2.2 Spatial Weight Matrices
In order to check the spatial interdependence of VAT introduction, we use three
different spatial weight matrices by defining neighbouring countries in three dif-
ferent ways. Firstly, we consider geographic neighbours where countries share
a common geographic boarder. We use GeoDa software (Anselin et al., 2006)
to create a queen contiguity matrix which considers all the geographic neigh-
bours irrespective of the length of the boarder. Secondly, we create a weight
matrix considering the similarity in the legal origin of the countries using the
data from La Porta et al. (1999). In this matrix, element dij = 1 if countries
i and j shares the same legal origin and equals zero otherwise. Countries may
shape their institutions based on their colonisation history and we classify the
legal background into British, French, Socialist, German and Scandinavian. As
Ganau (2017) suggests a common legal tradition may lead to institutional sim-
ilarities among countries and there is empirical evidence that suggests colonial
experience has a relationship with the current level of development (Englebert,
2000; Acemoglu et al., 2002; Bertocchi and Canova, 2002).
51
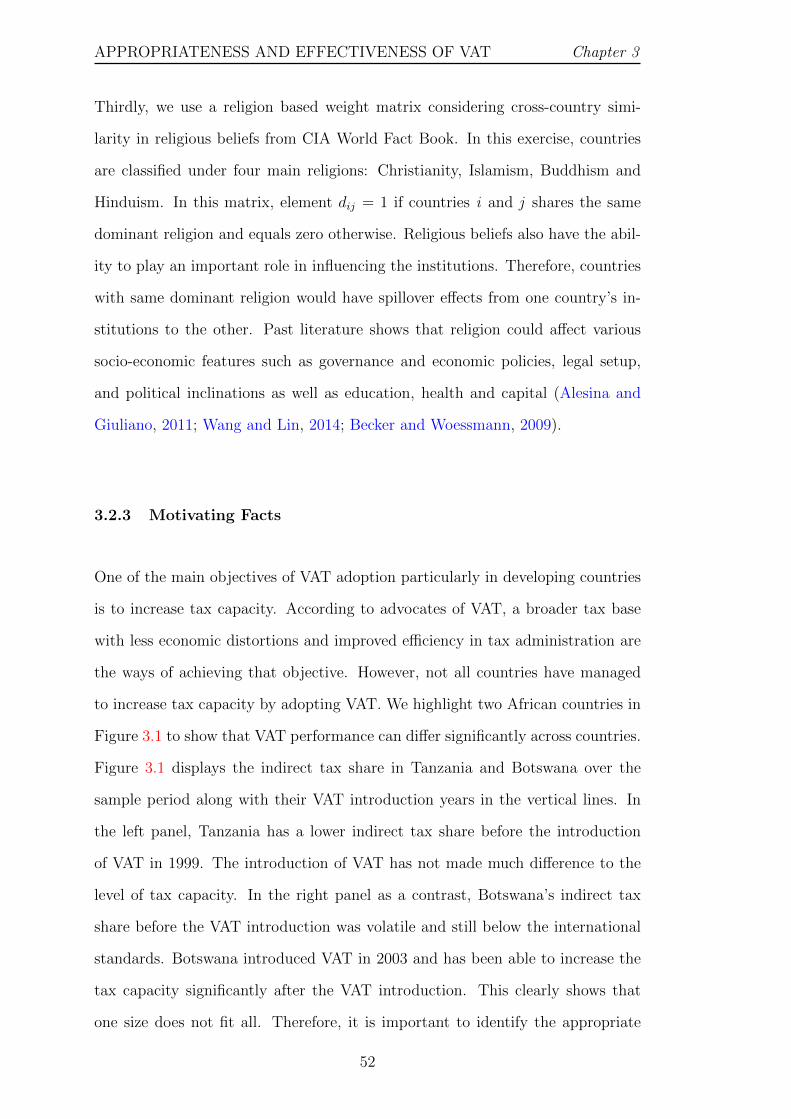
APPROPRIATENESS AND EFFECTIVENESS OF VAT Chapter 3
Thirdly, we use a religion based weight matrix considering cross-country simi-
larity in religious beliefs from CIA World Fact Book. In this exercise, countries
are classified under four main religions: Christianity, Islamism, Buddhism and
Hinduism. In this matrix, element dij = 1 if countries i and j shares the same
dominant religion and equals zero otherwise. Religious beliefs also have the abil-
ity to play an important role in influencing the institutions. Therefore, countries
with same dominant religion would have spillover effects from one country’s in-
stitutions to the other. Past literature shows that religion could affect various
socio-economic features such as governance and economic policies, legal setup,
and political inclinations as well as education, health and capital (Alesina and
Giuliano, 2011; Wang and Lin, 2014; Becker and Woessmann, 2009).
3.2.3 Motivating Facts
One of the main objectives of VAT adoption particularly in developing countries
is to increase tax capacity. According to advocates of VAT, a broader tax base
with less economic distortions and improved efficiency in tax administration are
the ways of achieving that objective. However, not all countries have managed
to increase tax capacity by adopting VAT. We highlight two African countries in
Figure 3.1 to show that VAT performance can differ significantly across countries.
Figure 3.1 displays the indirect tax share in Tanzania and Botswana over the
sample period along with their VAT introduction years in the vertical lines. In
the left panel, Tanzania has a lower indirect tax share before the introduction
of VAT in 1999. The introduction of VAT has not made much difference to the
level of tax capacity. In the right panel as a contrast, Botswana’s indirect tax
share before the VAT introduction was volatile and still below the international
standards. Botswana introduced VAT in 2003 and has been able to increase the
tax capacity significantly after the VAT introduction. This clearly shows that
one size does not fit all. Therefore, it is important to identify the appropriate
52
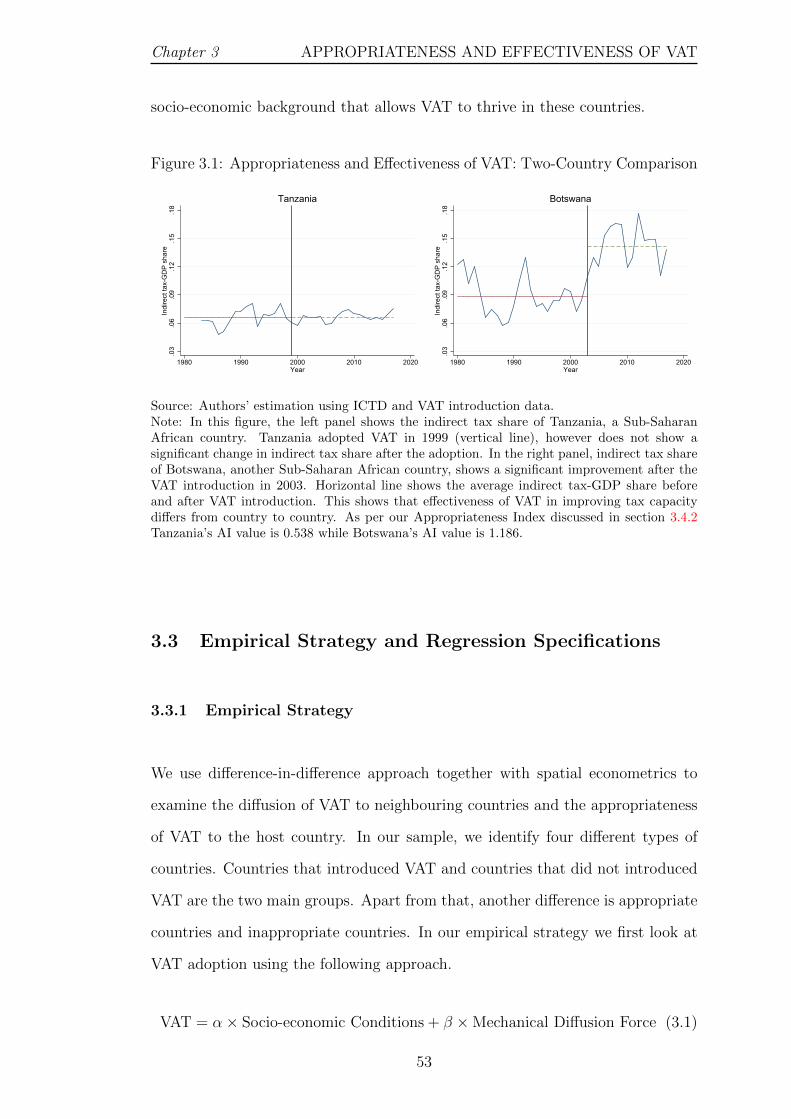
Chapter 3 APPROPRIATENESS AND EFFECTIVENESS OF VAT
socio-economic background that allows VAT to thrive in these countries.
Figure 3.1: Appropriateness and Effectiveness of VAT: Two-Country Comparison.0
3.0
6.0
9.1
2.1
5.1
8In
dire
ct ta
x-G
DP
shar
e
1980 1990 2000 2010 2020Year
Tanzania
.03
.06
.09
.12
.15
.18
Indi
rect
tax-
GD
P sh
are
1980 1990 2000 2010 2020Year
Botswana
Source: Authors’ estimation using ICTD and VAT introduction data.Note: In this figure, the left panel shows the indirect tax share of Tanzania, a Sub-SaharanAfrican country. Tanzania adopted VAT in 1999 (vertical line), however does not show asignificant change in indirect tax share after the adoption. In the right panel, indirect tax shareof Botswana, another Sub-Saharan African country, shows a significant improvement after theVAT introduction in 2003. Horizontal line shows the average indirect tax-GDP share beforeand after VAT introduction. This shows that effectiveness of VAT in improving tax capacitydiffers from country to country. As per our Appropriateness Index discussed in section 3.4.2Tanzania’s AI value is 0.538 while Botswana’s AI value is 1.186.
3.3 Empirical Strategy and Regression Specifications
3.3.1 Empirical Strategy
We use difference-in-difference approach together with spatial econometrics to
examine the diffusion of VAT to neighbouring countries and the appropriateness
of VAT to the host country. In our sample, we identify four different types of
countries. Countries that introduced VAT and countries that did not introduced
VAT are the two main groups. Apart from that, another difference is appropriate
countries and inappropriate countries. In our empirical strategy we first look at
VAT adoption using the following approach.
VAT = α× Socio-economic Conditions + β × Mechanical Diffusion Force (3.1)
53

APPROPRIATENESS AND EFFECTIVENESS OF VAT Chapter 3
Where V AT is a dummy variable indicating VAT adoption. Under this approach,
we regard spatial interdependence as the mechanical diffusion force in VAT adop-
tion. We measure the spatial interdependence using spatial weight matrices under
different definitions of neighbourhood: geography, legal background and religious
background. The main advantage of this approach is that it allows us to sepa-
rate the mechanical diffusion force from the appropriateness of VAT in different
countries that is determined by socio-economic conditions.
After estimating α and β from spatial regressions, we use ‘β × Mechanical Dif-
fusion Force’ as the IV for the VAT adoption decision and ‘α × Socio-economic
Conditions’ as the measurement of appropriateness in difference-in-difference re-
gression to identify the impact of appropriateness of VAT on the tax-GDP ratio.
3.3.2 Regression Specifications
We use Spatial Durbin (SD) model to capture the role of geography as a mechani-
cal force underlying VAT diffusion based on the study by Lee and Yu (2011). The
SD model assumes that, the dependent variable of the home country might be
related to both the dependent variable and independent variables in neighbour-
ing countries. Our regression equation using the SD model takes the following
specifications:
V ATit = ρ×WN × V ATit + α×Xit + β ×WN ×Xit + φ+ εit (3.2)
Where V ATit is the VAT introduction dummy in country i in year t. V ATit
= 1 after the VAT introduction and zero before the introduction. WN is a N
× N row-normalized binary contiguity matrix where N is the total number of
countries in the sample. In this matrix, Wij = 1 if two countries are neighbours
under different neighbourhood specifications (geographic, legal and religion) and
54

Chapter 3 APPROPRIATENESS AND EFFECTIVENESS OF VAT
Wij = 0 otherwise. Xit represents a vector of control variables and εit is the error
assumed to be iid.
After estimating the spatial interdependence we test the model selection to check
whether SD model is the best fix for our analysis compared to other different
spatial econometric models. Firstly, we test between Spatial Autoregressive model
(SAR) and SD model by testing whether β = 0 for all the control variables. If
the null hypothesis is accepted SAR model is a better fit our analysis than the
SD model. If the null hypothesis is rejected then it implies that the SD model is
a better fit for our data set. Secondly, we test between the Spatial Error model
(SE) and the SD model by testing whether β = -ρ × α. In this test as well, if
the null hypothesis is accepted then the SE model is a better fit and if the null
hypothesis is rejected then the SD model is suitable.
3.4 Empirical Results
3.4.1 Geography as Mechanical Diffusion Force
Table 3.2 reports the spatial regression results of the introduction of VAT based
on Eq. (3.2) with spatial fixed effects. Columns (1) to (3) show the results of
the three different weight matrices. Our main results show that income level has
a significant negative impact on the decision to adopt VAT. This means that
countries with higher income levels tend to focus on income tax revenue rather
than on indirect taxes such as VAT. Additionally, the effect of agriculture share
is also significantly negative. This result is similar to that obtained by Keen and
Lockwood (2010) who show that almost all taxes find it hard to reach agriculture
sector and VAT is no different. Urban population and democracy index are
positively associated with VAT adoption, showing that countries with democratic
governing systems as well as higher urban population have higher tendency to
adopt VAT. Conversely, external debt has a negative impact on VAT adoption.
55

APPROPRIATENESS AND EFFECTIVENESS OF VAT Chapter 3
This shows that if countries have access to low-cost credit from other countries
and multilateral organizations, then they are less motivated to introduce VAT.
Older population is a significant determinant of VAT adoption, however, it shows
a positive impact under geography and religion based weight matrices while a
negative impact under legal origin matrix. According to the results, trade share
is not a significant determinant of VAT introduction decision.
The most important result is that all three matrices show that there is a significant
spatial interdependence (ρ) at 1% level between the VAT adoption decision of the
home country and its neighbours. Effect of geographic neighbourhood has the
highest magnitude followed by legal origin and religious background. This shows
that geographic neighbours have a higher impact on diffusing taxation technology
compared to other types of neighbours.
As discussed in the empirical strategy section, we test the model selection firstly
by comparing between the SAR model and the SD model checking whether β =
0. Accordingly considering the geographic weight matrix, the chi value is 134.58
and Prob > chi2 = 0.0000 shows that we could strongly reject the null hypothesis
with p-value lower than 1%. Therefore, SD model fits better than the SAR model.
Then we test between SE model and SD model by checking whether β = -ρ ×
α. The test result shows that, chi value is 421.33 and Prob > chi2 = 0.0000
where we could again strongly reject the null hypothesis with p-value lower than
1%. Therefore, out of different spatial econometric models SD model best fits
our analysis.
56

Chapter 3 APPROPRIATENESS AND EFFECTIVENESS OF VAT
Table 3.2: Cross-Country Diffusion of VAT Introduction
Dependent Variable: VAT IntroductionGeo Legal Religion(1) (2) (3)
Spatialρ 0.402*** 0.337*** 0.177***
[0.000] [0.000] [0.000]Mainlog GDP per capita -0.058*** -0.075*** -0.096***
[0.000] [0.000] [0.000]Agriculture share -0.522*** -0.479*** -0.663***
[0.000] [0.000] [0.000]Trade share 0.026 0.009 0.013
[0.135] [0.582] [0.486]Urban population 0.725*** 0.599*** 0.191*
[0.000] [0.000] [0.082]External debt -0.019*** -0.022*** -0.026***
[0.003] [0.001] [0.000]Older Population 1.450*** -0.828** 0.832**
[0.003] [0.045] [0.042]Democracy Index 0.014*** 0.013*** 0.014***
[0.000] [0.000] [0.000]Lagged tax share -0.147 -0.087 -0.170*
[0.111] [0.328] [0.078]W × XW × log GDP per capita -0.115*** -0.197*** -0.207***
[0.000] [0.000] [0.002]W × Agriculture share -0.682*** -0.988** -1.503***
[0.000] [0.041] [0.005]W × Trade share 0.083** 0.376*** 0.225**
[0.017] [0.000] [0.019]W × Urban population 0.550*** 0.045 3.378***
[0.000] [0.870] [0.000]W × External debt -0.054*** -0.051* -0.054
[0.000] [0.057] [0.171]W × Older Population 2.111*** 5.760*** -0.248
[0.000] [0.000] [0.859]W × Democracy Index 0.006* 0.064*** 0.022**
[0.051] [0.000] [0.039]W × Lagged tax share -0.100 -0.920* -1.532**
[0.605] [0.070] [0.018]
Country FE Yes Yes YesYear FE Yes Yes YesNumber of Observations 5,852 5,852 5,852Number of Countries 154 154 154
Source: Authors’ estimations using data from ICTD, WDI and VAT introduction.Note: Standard errors are in brackets. *** p<0.01, ** p<0.05, * p<0.1. These resultsare based on the SD model specified in Eq (3.2). Results shows that there is a significantspatial interdependence between the home country and neighbouring countries whenintroducing VAT under all three definitions of neighbourhood (ρ value). However,geographic neighbours have more influence compared to others.
57
APPROPRIATENESS AND EFFECTIVENESS OF VAT Chapter 3
3.4.2 Measurement of Appropriateness Index (AI)
Even though countries introduce tax reforms such as VAT based on the influence
from neighbouring countries, those reforms may not be successful in the home
country due to different socio-economic conditions. That is why we could see
there are some countries that have not improved their revenue performances even
after VAT introduction (Figure 3.1).
Therefore, as suggested by Keen and Lockwood (2010), the appropriateness as
well as the effectiveness of a country’s policy reform is based on its specific socio-
economic conditions. In this section, we use results from the spatial econometric
model to develop an Appropriateness index and test whether VAT is an appro-
priate tax in terms of improving a country’s tax capacity. We use the regression
coefficients of control variables of the spatial econometric model Eq. (3.2) to
develop the appropriateness index.10 The mean value of α × Xit after VAT intro-
duction (V ATDummy = 1) is considered as the country specific time-invariant
Appropriateness Index (AI) for socio-economic conditions. Specifically, the AI
index is constructed as follows:
3.4.3 Effect of AI on Tax Capacity
In order to test the influence of Appropriateness index of VAT on tax capacity, we
used the following difference-in-difference regression equation with heterogeneity
in AI:
Taxit = ρ× V ATit + β × V ATit × AIi + εit (3.3)
where Taxit is the indirect tax-GDP ratio of country i at year t. V ATit is the
10We estimate the Appropriateness index by including all control variables as well as consid-ering only those variables with statistically significant coefficients.
58
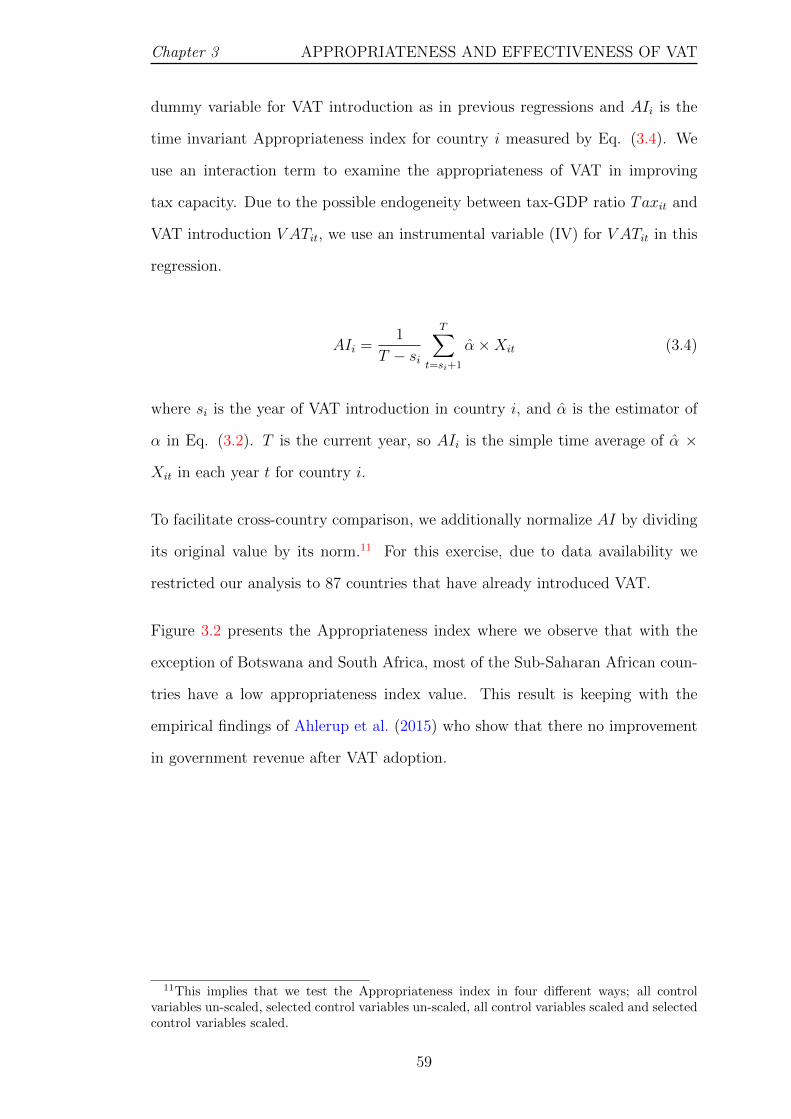
Chapter 3 APPROPRIATENESS AND EFFECTIVENESS OF VAT
dummy variable for VAT introduction as in previous regressions and AIi is the
time invariant Appropriateness index for country i measured by Eq. (3.4). We
use an interaction term to examine the appropriateness of VAT in improving
tax capacity. Due to the possible endogeneity between tax-GDP ratio Taxit and
VAT introduction V ATit, we use an instrumental variable (IV) for V ATit in this
regression.
AIi =1
T − si
T∑t=si+1
α×Xit (3.4)
where si is the year of VAT introduction in country i, and α is the estimator of
α in Eq. (3.2). T is the current year, so AIi is the simple time average of α ×
Xit in each year t for country i.
To facilitate cross-country comparison, we additionally normalize AI by dividing
its original value by its norm.11 For this exercise, due to data availability we
restricted our analysis to 87 countries that have already introduced VAT.
Figure 3.2 presents the Appropriateness index where we observe that with the
exception of Botswana and South Africa, most of the Sub-Saharan African coun-
tries have a low appropriateness index value. This result is keeping with the
empirical findings of Ahlerup et al. (2015) who show that there no improvement
in government revenue after VAT adoption.
11This implies that we test the Appropriateness index in four different ways; all controlvariables un-scaled, selected control variables un-scaled, all control variables scaled and selectedcontrol variables scaled.
59

APPROPRIATENESS AND EFFECTIVENESS OF VAT Chapter 3
Figure 3.2: Appropriateness Index Across Countries
0 .5 1 1.5Appropriateness
BGRRUSROUSRBMNEUKRARGBLRBRAVENZAF
MEXGEOBWALBNSLVTURCOLIRN
ARMPERGABTUNCRI
DOMKAZALBTHAJORDZAMDAPRYBOLECUCHN
DJIAZE
MNGMARLSOGTMCOG
INDEGYTKMIDN
HNDCMRSENCODGMBUZBZMBGUYVNMGHA
HTIZWEPAKNGABENNIC
BGDGIN
KGZCIV
LAOMRTMOZTJK
SDNCAFTZAMLI
TGOKENNPL
KHMSLEBFAUGARWAMWITCDETHNERBDI
Source: Authors’ estimation using spatial regression results.Note: This figure presents the Appropriateness index for each country developed based onspatial regression results from Table 3.2 using Eq.(3.2). We have used the regression coefficientsof statistically significant control variables from the spatial regression based on geographicneighbourhood. For comparison purposes, we have used the norm values. Vertical lines are thequintiles used in the regression results Table 3.4. The appropriateness index reveals that mostof the sub-Saharan African countries such as Burundi, Niger, Ethiopia, Chad and Malawi havea low AI value.
60
Chapter 3 APPROPRIATENESS AND EFFECTIVENESS OF VAT
Previous studies in this area have used either the number of neighbouring coun-
tries that have introduced VAT or the share of neighbouring countries with VAT
as the IV (Christian and Helene, 2011; Ahlerup et al., 2015; Alavuotunki et al.,
2019). We use a matrix of spatial interdependence coefficient (ρ - predicted value
based on spatial regression) from the previous regression results multiplied by
the geographic matrix as the IV. The previous spatial econometric regression re-
sults have shown that the VAT introduction of the home country is affected by
the VAT introduction decision of geographic neighbours and the ρ value repre-
sent the magnitude. However, the tax share of a country is not directly affected
by its geographic neighbours and its only possible through VAT introduction.
Therefore, our IV which is based on the spatial regression results is a better rep-
resentation of the interdependence between countries compared to the number or
share of neighbouring countries with VAT.
Table 3.3 shows the results of the IV regression using Eq (3.3). We have used
four different versions of appropriateness indices interacted with VAT introduc-
tion dummy to examine the appropriateness of VAT in improving tax capacity.
The AI (key variables) is constructed using only the controls variables that are
statistically significant in the spatial regression but without normalizing them.
The AI (all variables) include all the control variables in the spatial regression
without normalizing them. AI (key variables, normalized) and AI (all variables,
normalized) are the normalized versions of the above two variables. In order to
overcome potential endogeneity issues we have used a novel IV as discussed above.
According to these results, it is clear that higher the appropriateness index, the
higher the tax capacity and this result is robust under all different versions of the
appropriateness indices.
61
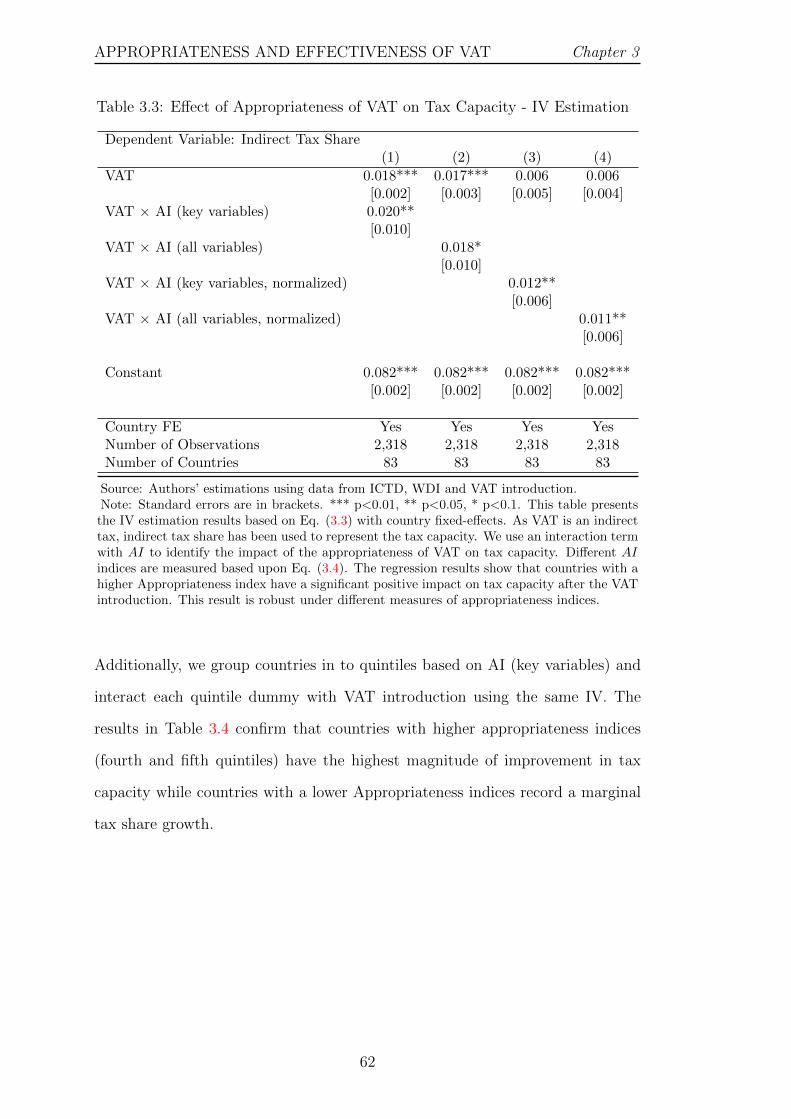
APPROPRIATENESS AND EFFECTIVENESS OF VAT Chapter 3
Table 3.3: Effect of Appropriateness of VAT on Tax Capacity - IV Estimation
Dependent Variable: Indirect Tax Share(1) (2) (3) (4)
VAT 0.018*** 0.017*** 0.006 0.006[0.002] [0.003] [0.005] [0.004]
VAT × AI (key variables) 0.020**[0.010]
VAT × AI (all variables) 0.018*[0.010]
VAT × AI (key variables, normalized) 0.012**[0.006]
VAT × AI (all variables, normalized) 0.011**[0.006]
Constant 0.082*** 0.082*** 0.082*** 0.082***[0.002] [0.002] [0.002] [0.002]
Country FE Yes Yes Yes YesNumber of Observations 2,318 2,318 2,318 2,318Number of Countries 83 83 83 83
Source: Authors’ estimations using data from ICTD, WDI and VAT introduction.Note: Standard errors are in brackets. *** p<0.01, ** p<0.05, * p<0.1. This table presentsthe IV estimation results based on Eq. (3.3) with country fixed-effects. As VAT is an indirecttax, indirect tax share has been used to represent the tax capacity. We use an interaction termwith AI to identify the impact of the appropriateness of VAT on tax capacity. Different AIindices are measured based upon Eq. (3.4). The regression results show that countries with ahigher Appropriateness index have a significant positive impact on tax capacity after the VATintroduction. This result is robust under different measures of appropriateness indices.
Additionally, we group countries in to quintiles based on AI (key variables) and
interact each quintile dummy with VAT introduction using the same IV. The
results in Table 3.4 confirm that countries with higher appropriateness indices
(fourth and fifth quintiles) have the highest magnitude of improvement in tax
capacity while countries with a lower Appropriateness indices record a marginal
tax share growth.
62
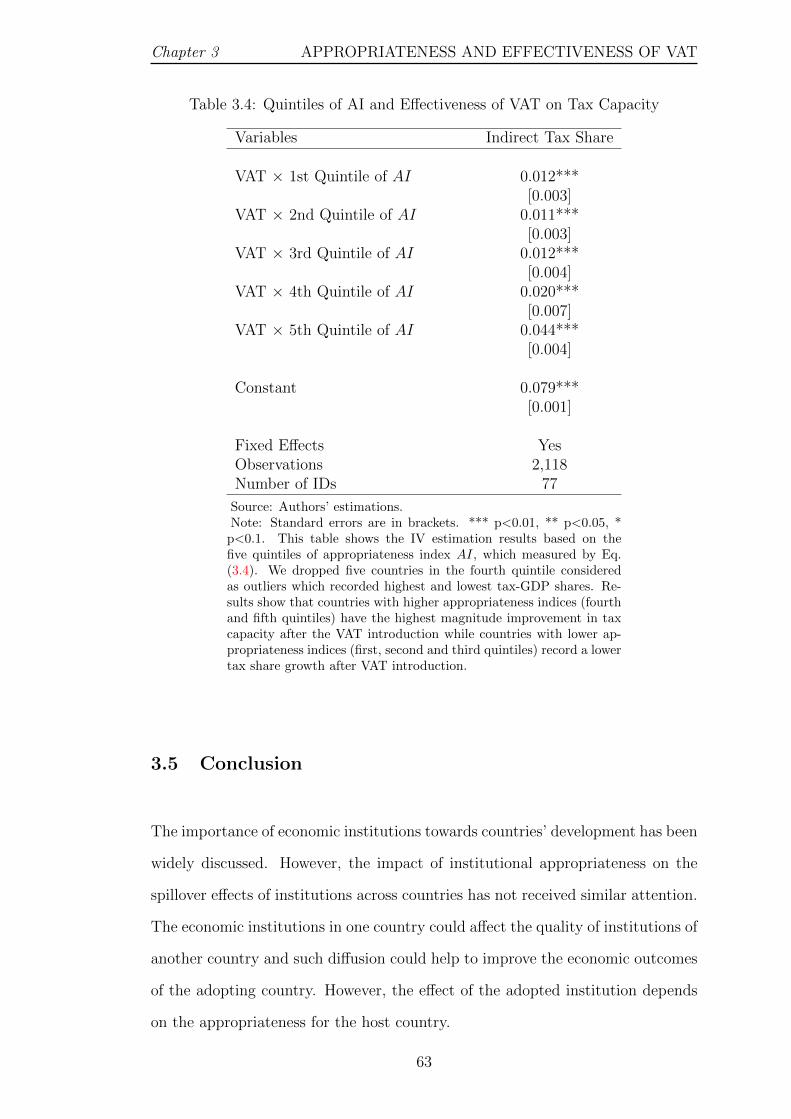
Chapter 3 APPROPRIATENESS AND EFFECTIVENESS OF VAT
Table 3.4: Quintiles of AI and Effectiveness of VAT on Tax Capacity
Variables Indirect Tax Share
VAT × 1st Quintile of AI 0.012***[0.003]
VAT × 2nd Quintile of AI 0.011***[0.003]
VAT × 3rd Quintile of AI 0.012***[0.004]
VAT × 4th Quintile of AI 0.020***[0.007]
VAT × 5th Quintile of AI 0.044***[0.004]
Constant 0.079***[0.001]
Fixed Effects YesObservations 2,118Number of IDs 77
Source: Authors’ estimations.Note: Standard errors are in brackets. *** p<0.01, ** p<0.05, *
p<0.1. This table shows the IV estimation results based on thefive quintiles of appropriateness index AI, which measured by Eq.(3.4). We dropped five countries in the fourth quintile consideredas outliers which recorded highest and lowest tax-GDP shares. Re-sults show that countries with higher appropriateness indices (fourthand fifth quintiles) have the highest magnitude improvement in taxcapacity after the VAT introduction while countries with lower ap-propriateness indices (first, second and third quintiles) record a lowertax share growth after VAT introduction.
3.5 Conclusion
The importance of economic institutions towards countries’ development has been
widely discussed. However, the impact of institutional appropriateness on the
spillover effects of institutions across countries has not received similar attention.
The economic institutions in one country could affect the quality of institutions of
another country and such diffusion could help to improve the economic outcomes
of the adopting country. However, the effect of the adopted institution depends
on the appropriateness for the host country.
63
APPROPRIATENESS AND EFFECTIVENESS OF VAT Chapter 3
Therefore, it is important to investigate the appropriateness of institutions and
whether spillover effects are truly generating the expected outcomes among re-
ceiving countries. In this study we use taxation, which is at the core of economic
institutions to test the effect of diffusion. More specifically, we study whether the
decision to introduce VAT by a particular country is affected by its neighbour’s
VAT introduction using a spatial econometric model. We define neighbours under
three different definitions: geographic neighbours, countries that share similar le-
gal origin and countries that share similar religious backgrounds. Using a panel
data set of 154 countries for a period from 1980 to 2017, we find that similar to
the findings of Cızek et al. (2017), there is a significant spatial interdependence
between neighbouring countries in the VAT introduction decision. Geographic
neighbours have the highest magnitude effect while religious neighbours have the
lowest magnitude effect. Moreover, spatial regression allows us to separate the
socio-economic appropriateness from the neighbouring country effect.
We then ask the question of how appropriate VAT is in improving tax capacity in
different countries. It is evident that some countries are successful in improving
revenue share after VAT introduction while some countries are struggling to in-
crease revenue share even after VAT introduction. To investigate the performance
of VAT under different socio-economic conditions, we develop an appropriateness
index based on the coefficients of the spatial regression results for different control
variables. Then we use the appropriateness index interacted with VAT introduc-
tion to check the effectiveness of VAT in improving indirect tax share of different
countries. Using the IV estimation, we find that countries with a higher Appropri-
ateness indices have a higher chance of improving tax capacity and these results
are robust with different classifications we used to estimate the Appropriateness
index.
Our findings explain why reforms suggested by international institutions such
as the World Bank and the IMF have failed in many countries. The results
64
Chapter 3 APPROPRIATENESS AND EFFECTIVENESS OF VAT
also emphasize that a country should take appropriateness in social, economic
and political conditions into consideration when introducing its own institutions
which may be successful in other countries.
REFERENCES
Acemoglu, D., Johnson, S., and Robinson, J. A. (2001). The Colonial Origins of
Comparative Development: An Empirical Investigation. The American Eco-
nomic Review, 91(5):1369–1401.
Acemoglu, D., Johnson, S., and Robinson, J. A. (2002). Reversal of Fortune:
Geography and Institutions in the Making of the Modern World Income Dis-
tribution. The Quarterly Journal of Economics, 117(4):1231–1294.
Acemoglu, D. and Zilibotti, F. (2001). Productivity Differences. The Quarterly
Journal of Economics, 116(2):563–606.
Adhikari, B. (2020). Does A Value-Added Tax Increase Economic Efficiency ?
Economic Inquiry, 58(1):496–517.
Ahlerup, P., Baskaran, T., and Bigsten, A. (2015). Tax Innovations and Pub-
lic Revenues in Sub-Saharan Africa. The Journal of Development Studies,
51(6):689–706.
Alavuotunki, K., Haapanen, M., and Pirttila, J. (2019). The Effects of the Value-
Added Tax on Revenue and Inequality. The Journal of Development Studies,
55(4):490–508.
Alesina, A. and Giuliano, P. (2011). Family Ties and Political Participation .
Journal of the European Economic Association, 9(5):817–839.
Anselin, L., Ibnu, S., and Youngihn, K. (2006). GeoDa: An Introduction to
Spatial Data Analysis. Geographical Analysis, 38(1):5–22.
Basu, S. and Weil, D. N. (1998). Appropriate Technology and Growth. The
Quarterly Journal of Economics, 113(4):1025–1054.
65
APPROPRIATENESS AND EFFECTIVENESS OF VAT Chapter 3
Baunsgaard, T. and Keen, M. (2010). Tax revenue and (or?) trade liberalization.
Journal of Public Economics, 94(9-10):563–577.
Becker, S. O. and Woessmann, L. (2009). Was Weber Wrong? A Human Capital
Theory of Protestant Economic History. The Quarterly Journal of Economics,
124(2):531–596.
Bertocchi, G. and Canova, F. (2002). Did colonization matter for growth? An
empirical exploration into the historical causes of Africa’s underdevelopment.
European Economic Review, 46(10):1851–1871.
Besley, T. and Persson, T. (2009). The Origins of State Capacity: Property
Rights, Taxation, and Politics. American Economic Review, 99(4):1244.
Besley, T. and Persson, T. (2011). Pillars of Prosperity. Princeton University
Press, Princeton.
Besley, T. and Persson, T. (2014). Why Do Developing Countries Tax So Little?
Journal of Economic Perspectives, 28(4):99–120.
Carmignani, F. and Chowdhury, A. (2012). The Geographical Dimension of
the Development Effects of Natural Resources. Environmental and Resource
Economics, 52(4):479–498.
Carter, A., editor (2013). International Tax Dialogue: Key Issues and Debates in
VAT, SME Taxation and the Tax Treatment of the Financial sector. European
Commission.
Caselli, F. and Coleman, W. J. (2006). The world technology frontier. American
Economic Review, 96(3):499–522.
Christian, E. and Helene, E. (2011). Does VAT reduce the instability of tax
revenues? CERDI Working Paper, E2011.24.
Cızek, P., Lei, J., and Ligthart, J. E. (2017). Do Neighbours Influence Value-
Added-Tax Introduction? A Spatial Duration Analysis. Oxford Bulletin of
Economics and Statistics, 79(1):25–54.
Dell, M. and Olken, B. A. (2020). The Development Effects of the Extractive
Colonial Economy: The Dutch Cultivation System in Java. The Review of
Economic Studies, 87(1):164–203.
66

Chapter 3 APPROPRIATENESS AND EFFECTIVENESS OF VAT
Diwan, I. and Rodrik, D. (1991). Patents, appropriate technology, and North-
South trade. Journal of International Economics, 30(1-2):27–47.
Englebert, P. (2000). Pre-Colonial Institutions, Post-Colonial States, and Eco-
nomic Development in Tropical Africa. Political Research Quarterly, 53(1):36.
Fan, H., Liu, Y., Qian, N., and Wen, J. (2018). Computerizing VAT Invoices in
China. National Bureau of Economic Research, Working Paper(24414).
Fjeldstad, O. H., Kagoma, C., Mdee, E., Sjursen, I. H., and Somville, V. (2020).
The customer is king: Evidence on VAT compliance in Tanzania. World De-
velopment, 128:1–12.
Gallup, J. L., Sachs, J. D., and Mellinger, A. (1999). Geography and Economic
Development. CID Working Paper, (1).
Ganau, R. (2017). Institutions and economic growth in Africa: a spatial econo-
metric approach. Economia Politica, 34.
Gerard, F. and Naritomi, J. (2018). Value Added Tax in developing countries:
Lessons from recent research. IGC Growth Brief Series 15.
Ghirmai, E., Logan, S., and Murray, S. (2014). The incidence and impact of
Electronic Billing Machines for VAT in Rwanda - IGC. Technical report, In-
ternational Growth Centre.
Hall, R. E. and Jones, C. I. (1999). Why Do Some Countries Produce So Much
More Output Per Worker Than Others? The Quarterly Journal of Economics,
114(1):83–116.
Keen, M. and Lockwood, B. (2010). The value added tax: Its causes and conse-
quences. Journal of Development Economics, 92(2):138–151.
Knoll, M. and Zloczysti, P. (2012). The Good Governance Indicators of the
Millennium Challenge Account: How Many Dimensions are Really Being Mea-
sured? World Development, 40(5):900–915.
La Porta, R., Lopez-de Silanes, F., Shleifer, A., and Vishny, R. (1999). The qual-
ity of government. Journal of Law, Economics and Organization, 15(1):222–
279.
67
APPROPRIATENESS AND EFFECTIVENESS OF VAT Chapter 3
Lee, L. F. and Yu, J. (2011). Estimation of Spatial Panels. Foundations and
Trends in Econometrics, 4(1-2):1–164.
Naritomi, J. (2019). Consumers as Tax Auditors. American Economic Review,
109(9):3031–3072.
North, D. C. (1981). Structure and Change in Economic History.
Pomeranz, D. (2015). No Taxation without Information: Deterrence and
Self-Enforcement in the Value Added Tax. American Economic Review,
105(8):2539–2569.
Rose, R. and Shin, D. C. (2001). Democratization backwards: The problem of
third-wave democracies. British Journal of Political Science, 31(2):331–354.
Wang, Q. and Lin, X. (2014). Does religious beliefs affect economic growth?
Evidence from provincial-level panel data in China. China Economic Review,
31:277–287.
Ward, H. and Dorussen, H. (2015). Public Information and Performance: The
Role of Spatial Dependence in the Worldwide Governance Indicators among
African Countries. World Development.
Waseem, M. (2020a). Overclaimed Refunds, Undeclared Sales, and Invoice Mills:
Nature and Extent of Noncompliance in a Value-Added Tax . CEPR Discussion
Paper, (DP14601).
Waseem, M. (2020b). The Role of Withholding in the Self-Enforcement of a
Value-Added Tax: Evidence from Pakistan. The Review of Economics and
Statistics, pages 1–44.
68

Chapter 4
VAT REGISTRATION THRESHOLD AND FIRM SALES
REPORTING: EVIDENCE FROM SRI LANKA
4.1 Introduction
Many developing countries are ailed with insufficient public goods due to weak
tax capacity. Their share of tax in GDP could be as low as 10%, while in some
developed countries it surpasses 50% (Gordon and Li, 2009; Kleven, 2014; Besley
and Persson, 2014). Previous research in this area finds that existence of a large
informal sector is one of the main causes for such weak tax performance particu-
larly in developing countries (Alm et al., 2004; Boadway and Sato, 2009; Alm and
Embaye, 2013; Annicchiarico and Cesaroni, 2018; Waseem, 2018).12 In the mean-
time, Value Added Tax (VAT) has become vastly popular among developing and
transitional economies in the past few decades, and is seen as a superior taxation
technology which helps to increase the tax base and government revenue by mov-
ing informal firms to formal sector (De Paula and Scheinkman, 2010). However,
it is evident that not all countries have successfully increased tax capacity and
economic efficiency by introducing VAT (Ahlerup et al., 2015; Adhikari, 2020).
In this study, we investigate a novel channel that can potentially constrain the
effectiveness of VAT on tax capacity: tax threshold on formal firms. We argue
that there could be significant under-reporting of sales by formal firms to stay
below the VAT threshold which will undermine the tax capacity of a country. The
12Joshi et al. (2014) discuss previous studies on tax and the informal sector.
69
VAT THRESHOLD AND FIRM SALES Chapter 4
VAT threshold is a size-based regulation that creates incentives for firms to stay
small and avoid the mandatory registration and payment of VAT (Best et al.,
2015; Harju et al., 2016). The incentive could be even stronger in response to
an increase in the statutory VAT rate. If the tax administration were unable to
identify this under-reporting it would erode the tax base and negatively impact
the tax revenue.
We particularly focus on Sri Lanka, a country that has been experiencing de-
terioration in tax capacity even after the VAT introduction in 2002. We use
firm-level survey data from Sri Lanka to study the response of firms’ reported
sales to changes in VAT rate and threshold from 1994 to 2017. Sri Lanka intro-
duced its first form of value added tax in 1998 named Goods and Services Tax
(GST). However, a sales tax: National Security Levy (NSL) was also operational
along with GST til 2002. VAT was introduced in 2002 replacing both GST and
NSL. There were several changes to the standard VAT rate and the threshold
since then. We consider two main policy changes: the introduction of VAT in
2002 and an increase in the standard VAT rate in 2005 to examine the response
from firms. We use a difference-in-difference regression approach by considering
Small and Medium Enterprises (SMEs) and non-SMEs to statistically estimate
the firms’ response to these policy changes. In addition, we also check whether
the parallel trends assumption holds for VAT introduction.
Our results show that changes in VAT policy were associated with significant
behavioural response in firms’ reported sales. We use the proportion of firms
below the VAT threshold to identify firms’ response. We find: (1) transition from
GST to VAT resulted in a significant drop of the proportion of SMEs below that
threshold even though there is no change in threshold value from GST to VAT.
This shows that firms welcome the transition to a fully value-added tax system
from a hybrid system which had both sales tax (NSL) and value added tax (GST).
(2) However, an increase in standard VAT rate from 10% to 15% in 2005 resulted
70
Chapter 4 VAT THRESHOLD AND FIRM SALES
in a significant increase in the proportion of SMEs below the threshold. This
indicates that SMEs responded actively to the increase in VAT rate by staying
below the threshold. This is in keeping with previous findings that a higher VAT
rate leads to lower compliance. Agha and Haughton (1996) show that a higher
VAT rate is associated with lower compliance in OCED countries and the trade-off
limits the revenue-maximising VAT rate to under 25%. Matthews (2003) shows
that the efficiency of VAT system declines with the increase in VAT rate due to
a combination of factors such as a decrease in VAT base, evasion and avoidance.
Compared to several other studies (Sow and Gebresilasse, 2020; Harju et al., 2016;
Boonzaaier et al., 2016) on VAT threshold that find bunching, our results are
different, as we do not see any shape bunching right at the threshold. Conversely,
we find that the overall firm distribution has changed significantly as a result of
a policy change. Most firms responded by reporting sales not uniformly right
around the threshold but further away from the threshold in a more random
pattern. Consequently, VAT introduction has lowered the firm distribution below
the VAT threshold and standard rate hike has increased the distribution below
threshold. The result may suggest that the under-reporting of sales does not
incur significant costs to the Sri Lankan firms, so they do not need to precisely
under-report right below the threshold.
Overall, our results strongly indicate that even firms in the formal sector actively
use the VAT threshold to avoid paying taxes. This constrains the feasibility of
revenue enhancing by raising the statutory tax rate. Although theoretically the
design of the VAT encourages small firms to register for VAT in order to stay in
the business, empirical results show otherwise. It may be due to the possibility
that the cost of compliance overweight the benefits of registration for small firms.
Faridy et al. (2014) also finds that higher compliance and administration cost de-
ter small firms from joining the tax system. This would affect smooth functioning
of the entire VAT system and finally result in generating insufficient revenue.
71

VAT THRESHOLD AND FIRM SALES Chapter 4
This paper contributes to several branches of the literature. Firstly, our study
adds to the empirical literature identifying VAT registration as a different channel
of weak tax capacity in developing countries. Our results expand the commonly
discussed idea of informal sector being the major contributor of poor tax capacity
in developing countries. We show that even the firms in the formal sector use
VAT threshold as a shield in reaction to VAT policy changes. Harju et al. (2016)
find that there is a bunching of firms just below the VAT threshold in Finland.
They show evidence that this response by firm is caused by the compliance cost
of VAT. Sow and Gebresilasse (2020) and Boonzaaier et al. (2016) also show the
same bunching effect below the threshold in Ethiopia and South Africa. Our
study extends these findings to show that especially small firms manipulate the
reported sales to move behind the VAT threshold in response to an increase in
standard VAT rate and avoid paying VAT. To the best of our knowledge this is
the first study which identifies this behaviour by firms in response to VAT rate
change. Given the inherent weaknesses of the tax administration in developing
countries, this behaviour of firms could lead to far serious repercussions in terms
of weakening the tax capacity compared to a developed country.
Secondly, our findings provide additional evidence on the firm-size distribution.
It is already established that institutional distortions create misallocations of re-
sources in developing counties (Restuccia and Rogerson, 2008; Hsieh and Klenow,
2009). Even though its undesirable, size-based regulations create incentives for
firms to stay small and can significantly distort firm-size distribution (Dharma-
pala et al., 2011; Gourio and Roys, 2014). Our results show that tax policy
parameters such as the VAT threshold are also size-based regulations that enor-
mously shape firm-size distribution.
The rest of the paper proceeds as follows. Section 4.2 provides a brief explanation
of the weak tax performance in Sri Lanka including a discussion of the changes
to the indirect tax system. Section 4.3 describes the data and motivation while
72
Chapter 4 VAT THRESHOLD AND FIRM SALES
section 4.4 presents the empirical strategy and results. Section 4.5 provides some
additional results and section 4.6 contains policy implications and conclusion.
4.2 Tax System and VAT Reforms in Sri Lanka
4.2.1 Background of the Tax System
Tax revenue in Sri Lanka accounts for more than 80% of total government rev-
enue. However, it has not kept pace with the rise in government expenditure and
macroeconomic developments. As a result, both total government revenue and
tax revenue as a percentage of GDP have declined since the early 1990s. A decline
in indirect tax share has been a significant contributor towards this poor tax per-
formance. Figure 4.1 shows the total tax, direct tax and indirect tax as a share
of GDP since 1990. According to Figure 4.1, it is clear that total tax and indirect
tax as a share of GDP have followed a declining path while direct tax share has
remained below the average at a stable level throughout the period. Given the
developments in the macroeconomic conditions and the tax policy changes over
this period, it is surprising that tax-GDP ratio exhibits a declining trend, as most
of the tax revenue determinants have changed positively within the same period.
Therefore, the main focus of this paper is to examine the underlying reasons for
such a decline by analysing micro level data.
There are several taxes operating in Sri Lanka. These include Income Tax (Per-
sonal and Corporate), Value Added Tax (VAT), Nation Building Tax (NBT),
Economic Service Charge (ESC), Excise Tax and Import Duties. The Inland
Revenue Department (IRD) established in 1932 is vested with the responsibility
of tax collection and administration in Sri Lanka. In addition to the IRD, the
Department of Customs and Excise Department also administers several duties
and levies.
73

VAT THRESHOLD AND FIRM SALES Chapter 4
Over the years, indirect taxes (taxes on production and expenditure) have gone
through several changes. Business Turnover Tax (BTT) was the first major in-
direct tax introduced in 1963. It was replaced by Turnover Tax (TT) in 1981.
For the purposes of financing the higher defence budget due to the war against
terrorism in Northern and Eastern provinces of the country, government was pro-
pelled to introduce another sales tax called the Defence Levy (DF) in 1992 which
was later called National Security Levy (NSL). The NSL was introduced at the
rate of 1% of taxable supply but gradually increased to 6.5% by the time it was
withdrawn. New government elected in 1994 with the purpose of moving towards
a VAT system, introduced Goods and Services Tax (GST) act in 1996. However,
GST came in to effect from 1st April 1998 and only replaced TT whereas NSL
continued to operate without change in order to maintain revenue targets in the
transition period. The GST was implemented at a flat rate of 12.5% and the
threshold for registration was LKR 1.8mn13 of taxable supply per year.
Figure 4.1 shows the total, direct and indirect taxes as a share of GDP in Sri
Lanka from 1990 to 2018. From this figure it is clear that the decline in tax share
is mainly driven by the decline in indirect tax share. Direct tax share is also low
compared to peer countries, however, it has remained consistent throughout the
period. Conversely, indirect tax share has declined continuously and the intro-
duction of GST in 1998 or the introduction of VAT in 2002 were not successful
in reversing the downward trend.
4.2.2 VAT Introduction and Reforms
Another change in the government in 2001 led to the introduction of VAT in
2002 by abolishing both GST and NSL. VAT threshold remained as LKR 1.8mn
of taxable supply per year but the standard VAT rate was changed from 12.5% to
10% and additionally two new rates were introduced. A 0% VAT rate was applied
13Around US$ 9,300 as per the current exchange rate
74

Chapter 4 VAT THRESHOLD AND FIRM SALES
for exports and deemed exports while a higher VAT rate of 20% was charged for
luxury goods.
Figure 4.1: Total, Direct and Indirect Tax Shares
GST VAT0
510
1520
Shar
e of
GD
P
1990 1992 1994 1996 1998 2000 2002 2004 2006 2008 2010 2012 2014 2016 2018
Year
Total Tax Direct TaxIndirect Tax
Source: Authors’ estimation using Central Bank of Sri Lanka annual reports.Note: This figure shows that main reason for the decline in tax-GDP ratio is the decline inindirect tax-GDP ratio. Direct tax-GDP ratio is low relative to peer countries but has remainedconsistent over the period. However, indirect tax share has declined continuously. Two verticallines show the GST and VAT introduction in 1998 and 2002 respectively. It is clear that eventhe introduction of value added taxes such as GST and VAT have not reversed the downwardtread.
VAT has also subject to several changes in terms of tax rates and tax threshold
since its introduction . The first major change was to increase the standard
VAT rate from 10% to 15% in November 2004. This increase in standard rate
resulted in a slight increase in tax-GDP share as shown in Figure 4.1. However,
this was short lived and reverted to a declining trend after 2006. Secondly in
2007, an optional VAT was introduced for firms with taxable supply below LKR
2.5mn per year. This allowed voluntary registration for those firms and pay
non-refundable 5% payment on taxable supply. After the end of war in 2009,
the government introduced tax reforms in order to promote local and foreign
investments. This included an increase in VAT threshold to LKR 2.5mn and a
decrease in standard VAT rate from 15% to 12%. In 2013, the VAT threshold was
75

VAT THRESHOLD AND FIRM SALES Chapter 4
increased significantly from LKR 2.5mn to LKR 12mn and in 2015 it was further
increased to LKR 15mn and the standard rate was reduced to 11%. Conversely,
the rate was increased to 15% again in 2017 due to the lackluster tax performance.
Sluggish economic growth recorded during the past few years again forced the
newly appointed government to decrease the VAT rate to 8% from December
2019. The list of changes to VAT over the period considered for this analysis is
included in Table 4.1.
Table 4.1: VAT Reforms in Sri Lanka from 1998 to 2019
Year Reform Rate / Threshold
1998 Introduction of GST Rate - 12.5%, Threshold - taxable supply aboveLKR 1.8mn per year
2002 Introduction of VAT Rates - 0%, 10%, 20%, Threshold - taxable supplyabove LKR 1.8mn per year
2004 Standard VAT rate 10% standard rate increased to 15% and introduceda new rate of 5% for essential food items
2007 Optional VAT 5% non-refundable rate for firms with a taxablesupply below LKR 2.5mn (Voluntary registration)
2009 Standard VAT rate and Threshold 15% standard rate decreased to 12% and thresholdincreased to LKR 2.5mn per year
2013 Threshold Threshold increased to LKR 12mn per year2015 Standard VAT rate and Threshold Standard rate 12% decreased to 11% and
threshold increased to LKR 15mn2017 Standard VAT rate Standard VAT rate increased from 11% to 15%2019 Standard VAT rate Standard VAT rate decreased from 15% to 8%
Source: Inland Revenue Department of Sri Lanka (IRD, 2019).Note: It is important to note that there were several political regime changes occurred duringthis period which might have an impact on tax policy change. In 2001, United National Party(UNP) which has right wing economic policies came into power and introduced VAT. In 2005,power shifted back to United National Freedom Alliance (UPFA) which has left wing economicpolicies. In 2015, again UNP won the election to establish a government however, in 2019 thegovernment shifted back to UPFA.
Government policy decision to decrease VAT rate to 8% at the end of 2019 along
with the current economic crisis due to Covid-19 pandemic, government tax share
has decreased significantly in 2020. Total tax revenue as a share of GDP has
come down to 8.1% in 2020 compared to 11.6% in 2019 (CBSL, 2020). As a
result of poor revenue performance central government debt as a share of GDP
has increased to 101% in 2020 compared to 86.8% in 2019 (CBSL, 2020). These
indicators highlight the magnitude of the economic crisis that Sri Lanka facing
in the current context.
76
Chapter 4 VAT THRESHOLD AND FIRM SALES
4.3 Data and Motivation
4.3.1 Data
We mainly use Annual Survey of Industries (ASI) conducted by the Department
of Census and Statistics of Sri Lanka (DCS). DCS has conducted the ASI since
1983 covering the following sectors: Mining and Quarrying, Manufacturing, Gen-
eration and Distribution of Electricity, Gas and Water industries. This survey
records firm-level data for around 110 industries under the International Stan-
dard Industrial Classification (ISIC) revision 4 of the United Nations. All private
and public sector establishments with more than 5 persons engaged have been
covered in the survey. Firms with 100 or more persons engaged are fully enumer-
ated while firms with persons engaged between 5 and 99 are covered in a sample.
Data in digital format is only available since ASI 1995 which contain the firm
level data reported for 1994 calendar year. Therefore, this analysis covers data
reported for the period from 1994 to 2017 (ASI 1995 to ASI 2018). However, it
does not include 2003 and 2013 (ASI 2004 and ASI 2014) as those were census
years.
4.3.2 Motivation
VAT has evolved to become a major source of government revenue over the past
few decades and is considered to be a significant improvement in terms of improv-
ing the revenue capacity as well as overall tax efficiency (Keen and Lockwood,
2010). It is argued that VAT from its design could resolve several problems in the
taxation system that weaken the tax capacity. However, empirical studies show
mixed results whereby some countries have improved their tax capacity while in
some countries VAT is not a success.14 When we examine the tax performance
14Keen and Lockwood (2010) find that adoption of VAT is associated with an increase ingovernment revenue in the long run while Ahlerup et al. (2015) find that there is no increasein government revenue in sub-Sahara Africa after VAT introduction.
77
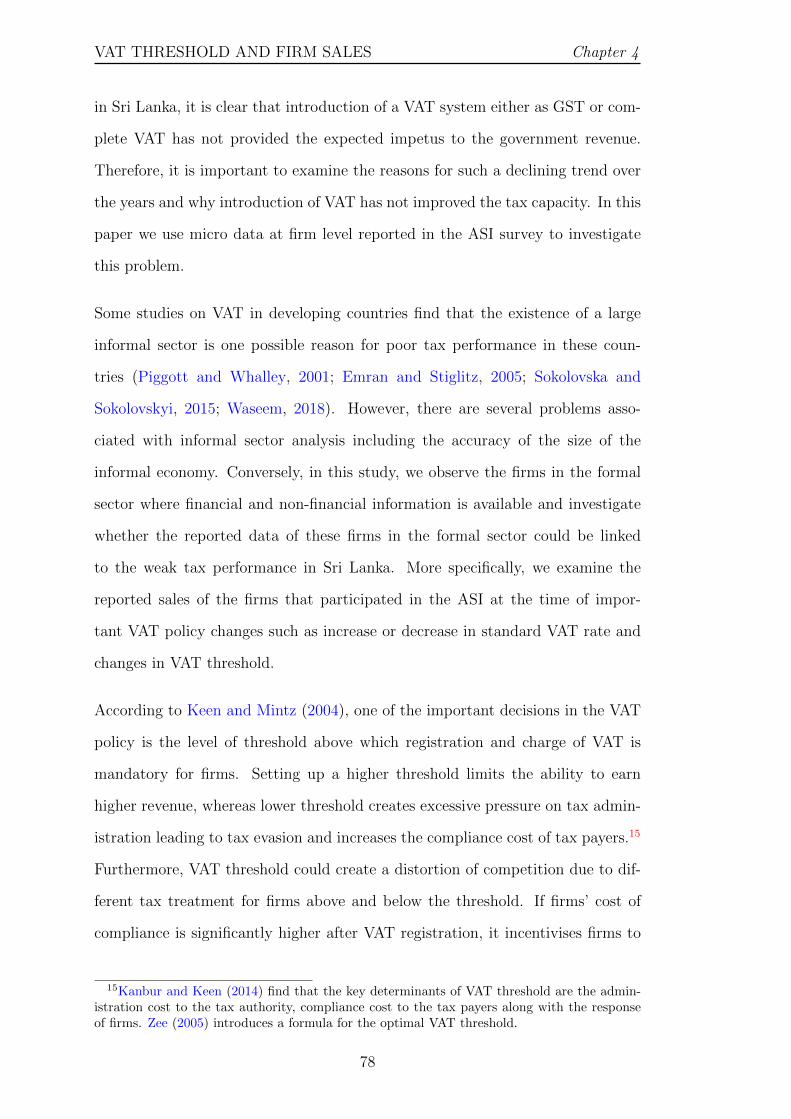
VAT THRESHOLD AND FIRM SALES Chapter 4
in Sri Lanka, it is clear that introduction of a VAT system either as GST or com-
plete VAT has not provided the expected impetus to the government revenue.
Therefore, it is important to examine the reasons for such a declining trend over
the years and why introduction of VAT has not improved the tax capacity. In this
paper we use micro data at firm level reported in the ASI survey to investigate
this problem.
Some studies on VAT in developing countries find that the existence of a large
informal sector is one possible reason for poor tax performance in these coun-
tries (Piggott and Whalley, 2001; Emran and Stiglitz, 2005; Sokolovska and
Sokolovskyi, 2015; Waseem, 2018). However, there are several problems asso-
ciated with informal sector analysis including the accuracy of the size of the
informal economy. Conversely, in this study, we observe the firms in the formal
sector where financial and non-financial information is available and investigate
whether the reported data of these firms in the formal sector could be linked
to the weak tax performance in Sri Lanka. More specifically, we examine the
reported sales of the firms that participated in the ASI at the time of impor-
tant VAT policy changes such as increase or decrease in standard VAT rate and
changes in VAT threshold.
According to Keen and Mintz (2004), one of the important decisions in the VAT
policy is the level of threshold above which registration and charge of VAT is
mandatory for firms. Setting up a higher threshold limits the ability to earn
higher revenue, whereas lower threshold creates excessive pressure on tax admin-
istration leading to tax evasion and increases the compliance cost of tax payers.15
Furthermore, VAT threshold could create a distortion of competition due to dif-
ferent tax treatment for firms above and below the threshold. If firms’ cost of
compliance is significantly higher after VAT registration, it incentivises firms to
15Kanbur and Keen (2014) find that the key determinants of VAT threshold are the admin-istration cost to the tax authority, compliance cost to the tax payers along with the responseof firms. Zee (2005) introduces a formula for the optimal VAT threshold.
78
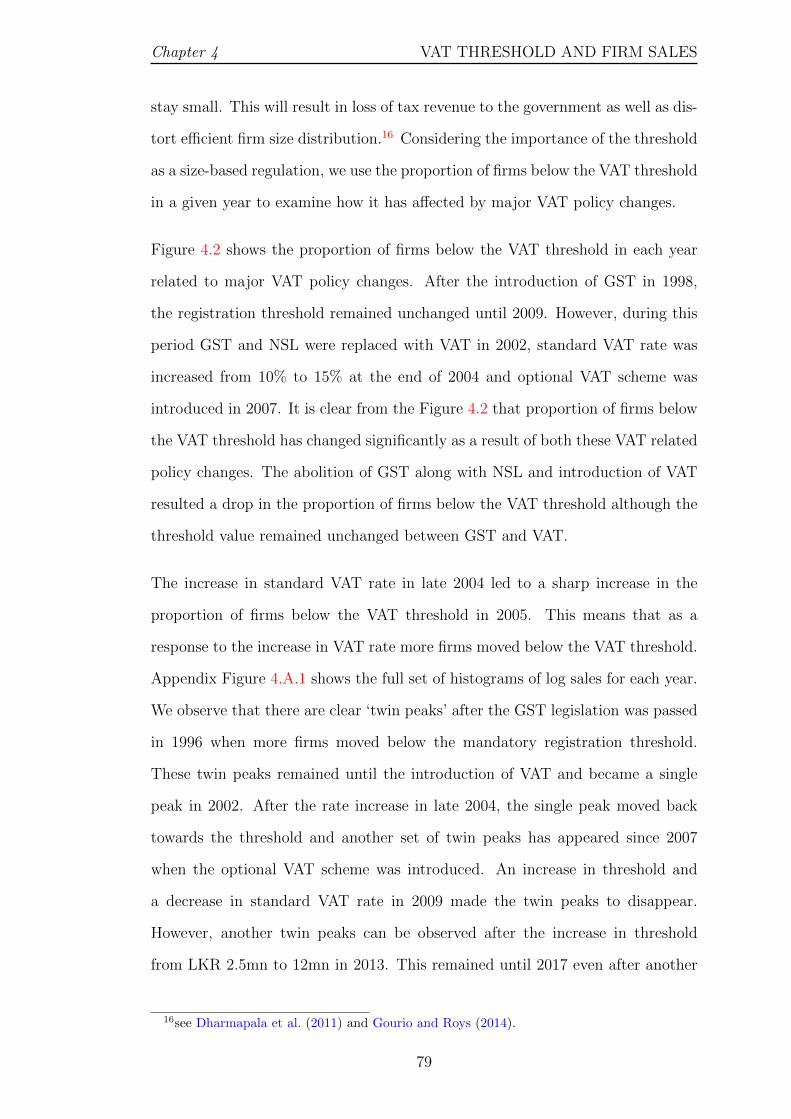
Chapter 4 VAT THRESHOLD AND FIRM SALES
stay small. This will result in loss of tax revenue to the government as well as dis-
tort efficient firm size distribution.16 Considering the importance of the threshold
as a size-based regulation, we use the proportion of firms below the VAT threshold
in a given year to examine how it has affected by major VAT policy changes.
Figure 4.2 shows the proportion of firms below the VAT threshold in each year
related to major VAT policy changes. After the introduction of GST in 1998,
the registration threshold remained unchanged until 2009. However, during this
period GST and NSL were replaced with VAT in 2002, standard VAT rate was
increased from 10% to 15% at the end of 2004 and optional VAT scheme was
introduced in 2007. It is clear from the Figure 4.2 that proportion of firms below
the VAT threshold has changed significantly as a result of both these VAT related
policy changes. The abolition of GST along with NSL and introduction of VAT
resulted a drop in the proportion of firms below the VAT threshold although the
threshold value remained unchanged between GST and VAT.
The increase in standard VAT rate in late 2004 led to a sharp increase in the
proportion of firms below the VAT threshold in 2005. This means that as a
response to the increase in VAT rate more firms moved below the VAT threshold.
Appendix Figure 4.A.1 shows the full set of histograms of log sales for each year.
We observe that there are clear ‘twin peaks’ after the GST legislation was passed
in 1996 when more firms moved below the mandatory registration threshold.
These twin peaks remained until the introduction of VAT and became a single
peak in 2002. After the rate increase in late 2004, the single peak moved back
towards the threshold and another set of twin peaks has appeared since 2007
when the optional VAT scheme was introduced. An increase in threshold and
a decrease in standard VAT rate in 2009 made the twin peaks to disappear.
However, another twin peaks can be observed after the increase in threshold
from LKR 2.5mn to 12mn in 2013. This remained until 2017 even after another
16see Dharmapala et al. (2011) and Gourio and Roys (2014).
79
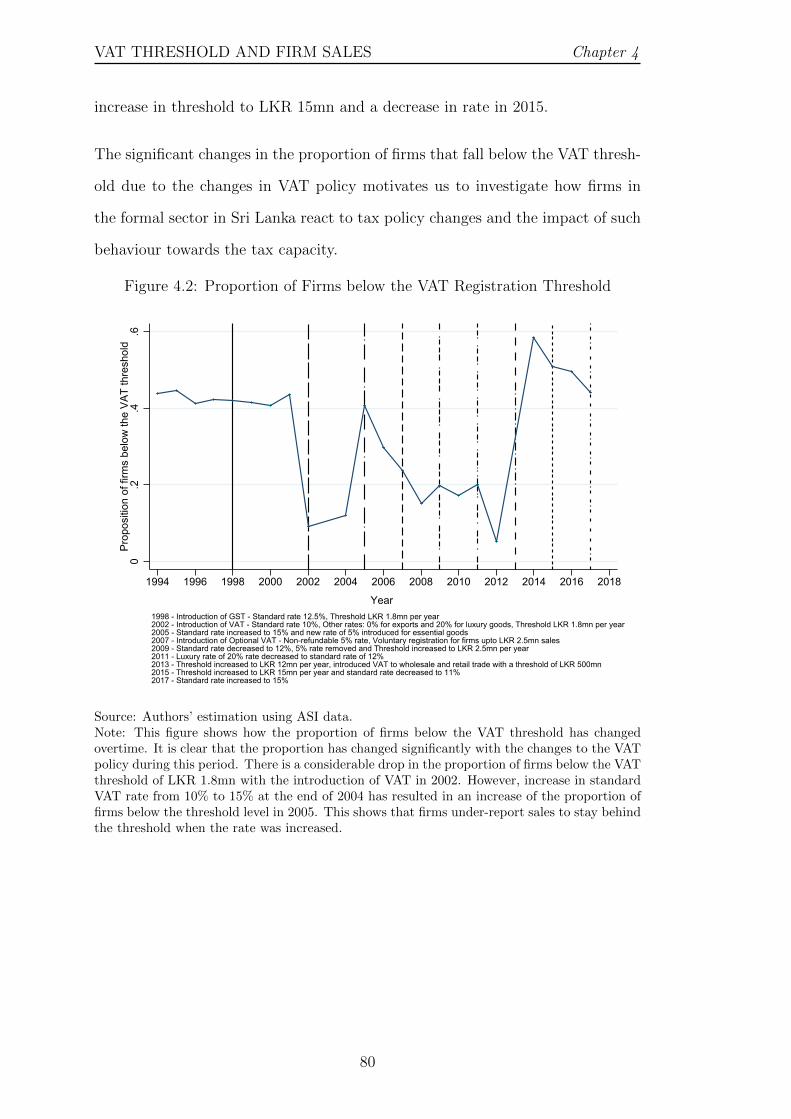
VAT THRESHOLD AND FIRM SALES Chapter 4
increase in threshold to LKR 15mn and a decrease in rate in 2015.
The significant changes in the proportion of firms that fall below the VAT thresh-
old due to the changes in VAT policy motivates us to investigate how firms in
the formal sector in Sri Lanka react to tax policy changes and the impact of such
behaviour towards the tax capacity.
Figure 4.2: Proportion of Firms below the VAT Registration Threshold
0.2
.4.6
Prop
ositi
on o
f firm
s be
low
the
VAT
thre
shol
d
1994 1996 1998 2000 2002 2004 2006 2008 2010 2012 2014 2016 2018
Year1998 - Introduction of GST - Standard rate 12.5%, Threshold LKR 1.8mn per year2002 - Introduction of VAT - Standard rate 10%, Other rates: 0% for exports and 20% for luxury goods, Threshold LKR 1.8mn per year2005 - Standard rate increased to 15% and new rate of 5% introduced for essential goods2007 - Introduction of Optional VAT - Non-refundable 5% rate, Voluntary registration for firms upto LKR 2.5mn sales2009 - Standard rate decreased to 12%, 5% rate removed and Threshold increased to LKR 2.5mn per year2011 - Luxury rate of 20% rate decreased to standard rate of 12%2013 - Threshold increased to LKR 12mn per year, introduced VAT to wholesale and retail trade with a threshold of LKR 500mn2015 - Threshold increased to LKR 15mn per year and standard rate decreased to 11%2017 - Standard rate increased to 15%
Source: Authors’ estimation using ASI data.Note: This figure shows how the proportion of firms below the VAT threshold has changedovertime. It is clear that the proportion has changed significantly with the changes to the VATpolicy during this period. There is a considerable drop in the proportion of firms below the VATthreshold of LKR 1.8mn with the introduction of VAT in 2002. However, increase in standardVAT rate from 10% to 15% at the end of 2004 has resulted in an increase of the proportion offirms below the threshold level in 2005. This shows that firms under-report sales to stay behindthe threshold when the rate was increased.
80

Chapter 4 VAT THRESHOLD AND FIRM SALES
4.4 Empirical Strategy and Results
4.4.1 Empirical Strategy
Although there have been several tax reforms during the sample period, our em-
pirical work only focuses on two policy changes that are relevant to our identifica-
tion: (1) The introduction of VAT in 2002; (2) The increase in standard VAT rate
in 2005. We use difference-in-difference approach to estimate firms’ behaviour of
under-reporting sales following the VAT policy changes. We consider SMEs as
treatment group and non-SMEs as control group in the difference-in-difference
analysis. In Sri Lanka, the Department of Small Industries defines Small and
Medium Enterprises (SMEs) as establishments with fewer than 50 people. We
use non-SMEs as the control group because they are immune to VAT policy
changes of interests to us. This is confirmed by Figure 4.3, which shows the pro-
portion of firms below the VAT threshold for SMEs and non-SMEs. Figure 4.3
clearly shows that the changes in the proportion of firms below the VAT thresh-
old has been driven by the SMEs.17 In contrast, the proportion of non-SMEs
below VAT threshold have not changed until the major increase in VAT thresh-
old from LKR 2.5mn to 12mn in 2013. Based on this, it is clear that SMEs and
non-SMEs are relatively good treatment and control groups for our analysis for
the period before 2013 when the threshold change took place and affected both
groups. Therefore, we only use the cleaner quasi-experimental period from 1994
to 2012 for the difference-in-difference regression analysis to identify the effect of
VAT policy changes while the threshold remains constant.
17This is in line with the findings of Faridy et al. (2014) who highlight that the complexityof law and higher cost influence the SMEs’ compliance to VAT law in Bangladesh.
81
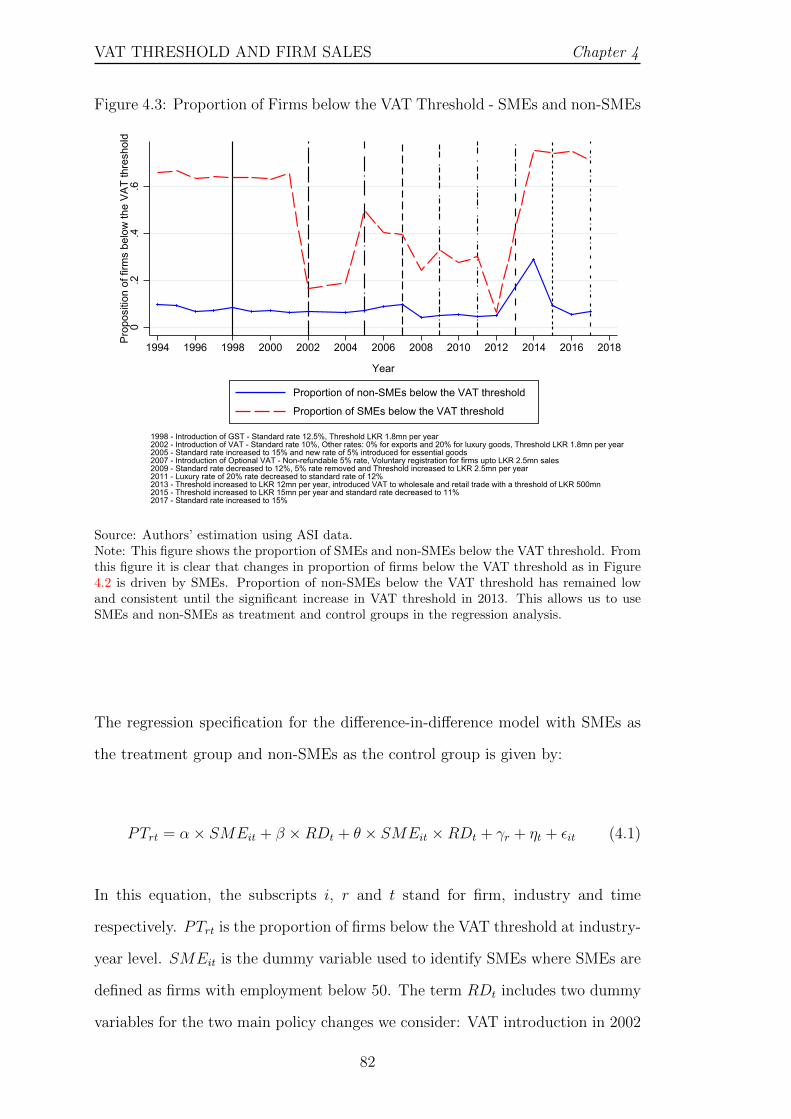
VAT THRESHOLD AND FIRM SALES Chapter 4
Figure 4.3: Proportion of Firms below the VAT Threshold - SMEs and non-SMEs
0.2
.4.6
Prop
ositi
on o
f firm
s be
low
the
VAT
thre
shol
d
1994 1996 1998 2000 2002 2004 2006 2008 2010 2012 2014 2016 2018
Year
Proportion of non-SMEs below the VAT threshold
Proportion of SMEs below the VAT threshold
1998 - Introduction of GST - Standard rate 12.5%, Threshold LKR 1.8mn per year2002 - Introduction of VAT - Standard rate 10%, Other rates: 0% for exports and 20% for luxury goods, Threshold LKR 1.8mn per year2005 - Standard rate increased to 15% and new rate of 5% introduced for essential goods2007 - Introduction of Optional VAT - Non-refundable 5% rate, Voluntary registration for firms upto LKR 2.5mn sales2009 - Standard rate decreased to 12%, 5% rate removed and Threshold increased to LKR 2.5mn per year2011 - Luxury rate of 20% rate decreased to standard rate of 12%2013 - Threshold increased to LKR 12mn per year, introduced VAT to wholesale and retail trade with a threshold of LKR 500mn2015 - Threshold increased to LKR 15mn per year and standard rate decreased to 11%2017 - Standard rate increased to 15%
Source: Authors’ estimation using ASI data.Note: This figure shows the proportion of SMEs and non-SMEs below the VAT threshold. Fromthis figure it is clear that changes in proportion of firms below the VAT threshold as in Figure4.2 is driven by SMEs. Proportion of non-SMEs below the VAT threshold has remained lowand consistent until the significant increase in VAT threshold in 2013. This allows us to useSMEs and non-SMEs as treatment and control groups in the regression analysis.
The regression specification for the difference-in-difference model with SMEs as
the treatment group and non-SMEs as the control group is given by:
PTrt = α× SMEit + β ×RDt + θ × SMEit ×RDt + γr + ηt + εit (4.1)
In this equation, the subscripts i, r and t stand for firm, industry and time
respectively. PTrt is the proportion of firms below the VAT threshold at industry-
year level. SMEit is the dummy variable used to identify SMEs where SMEs are
defined as firms with employment below 50. The term RDt includes two dummy
variables for the two main policy changes we consider: VAT introduction in 2002
82

Chapter 4 VAT THRESHOLD AND FIRM SALES
and standard VAT rate increase in 2005.18 Additionally, we include VAT reforms
that occurred in 2007, 2009 and 2011 as controls along with interaction terms
with SME. γr and ηt represent industry and year fixed effects respectively. εit is
the error term assumed to be iid.
To test the parallel trends assumption, we use the sum of interaction terms of pre-
VAT introduction years with SMEs added to our baseline regression Eq. (4.1).
The purpose of this exercise is to test whether the results of VAT introduction
has been affected by any prior tax policy change. The regression equation to test
the parallel trend assumption is:
PTrt = α× SMEit + β ×RDt + θ × SMEit ×RDt+
N∑s=1
φs × SMEit × PY st +
N∑s=1
ρs × PY st + γr + ηt + εit
(4.2)
In Eq. (4.2), PY st refers to the years before VAT introduction. The parallel
trends assumption requires φs = 0 for s=1, 2,....,N.
4.4.2 Baseline Results
Table 4.2 presents the results based on the regression specifications in Eq. (4.1).
Columns (1) and (2) present regression results with two main VAT policy changes
in consideration and adding other reforms as controls at a time. Column (3) shows
results considering two main policy changes and all the control reforms together.
The results show that VAT policy changes have a significant impact on the change
in proportion of firms below the VAT threshold and both the reforms considered
in the regression are statistically significant. As per the results in column (3),
SMEs have a positive significant relationship with proportion of firms below VAT
18The increase in standard VAT rate happened by the end of November 2004. Hence weconsider this as 2005.
83
VAT THRESHOLD AND FIRM SALES Chapter 4
threshold at 1% level (0.072) before the reforms. All the different regression
models include industry and year fixed effects and standard errors are clustered
at industry level.
The introduction of VAT has resulted in a decrease in the proportion of firms
below the VAT threshold by 11 percentage points, and it is statistically significant
at the 1% level. This confirms our hypothesis that the introduction of VAT
encourages small firms to join the VAT scheme resulting in broader tax base.
As claimed by its proponents, the design of the VAT itself makes it an effective
taxation technology in information revelation. However, the 2005 VAT reform
(where the standard VAT rate increased from 10% to 15%) has led to a rise
in the proportion of firms below the threshold by 5.9 percentage points with a
1% level of statistical significance. This shows that small firms have actively
responded to the increase in standard VAT rate by under-reporting sales and
moving below the threshold level. The regression results suggest that, if the
VAT rate increase by 1%, about 1.2% more firms would de-register and would
not pay VAT. Accordingly, if the standard VAT rate increased to 20% it would
wipe out almost all the increase in tax base established from VAT introduction.
This is a novel finding which has not been considered in previous research on
the VAT threshold. Furthermore, data on the VAT share of GDP in Sri Lanka
for both 2004 and 2005 shows that it has remained unchanged at the level of
5.9% (CBSL, 2005). This also confirms that even the increase in standard VAT
rate from 10% to 15% has not increased the VAT share of GDP. The additional
revenue expected from an increase of standard VAT rate could have been offset
by the under-reporting of firms to remain below the threshold after the increase
in standard VAT rate.
84
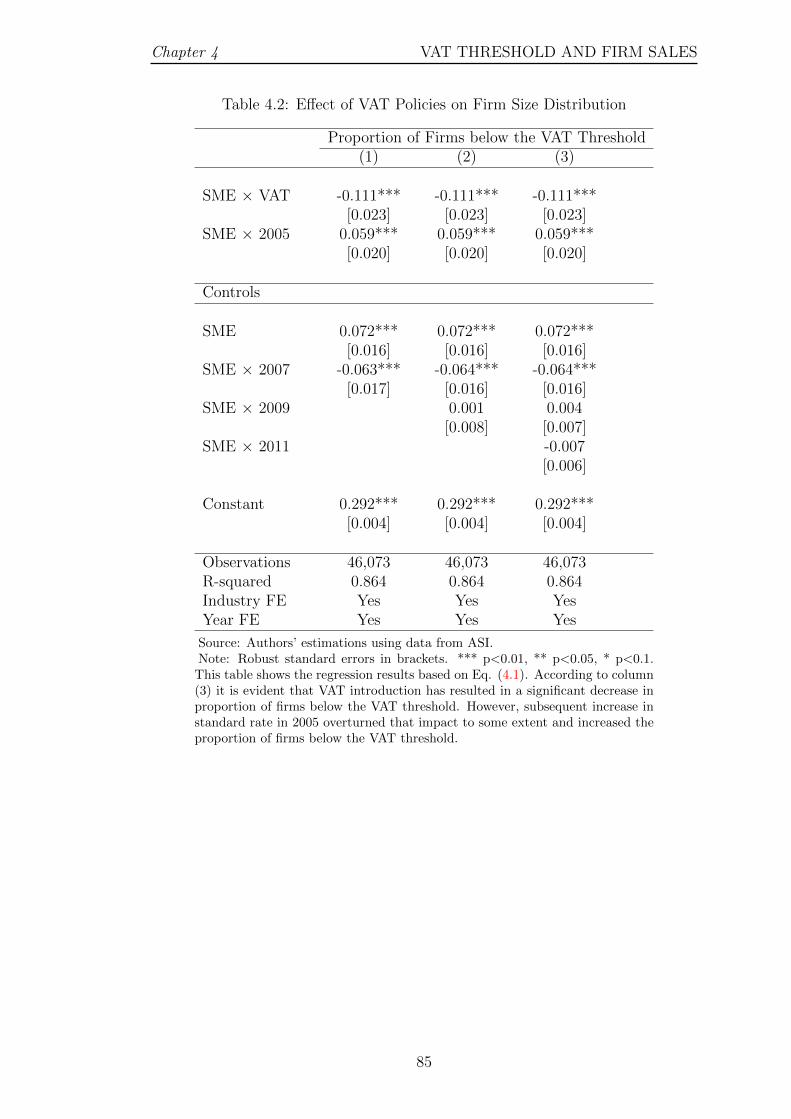
Chapter 4 VAT THRESHOLD AND FIRM SALES
Table 4.2: Effect of VAT Policies on Firm Size Distribution
Proportion of Firms below the VAT Threshold(1) (2) (3)
SME × VAT -0.111*** -0.111*** -0.111***[0.023] [0.023] [0.023]
SME × 2005 0.059*** 0.059*** 0.059***[0.020] [0.020] [0.020]
Controls
SME 0.072*** 0.072*** 0.072***[0.016] [0.016] [0.016]
SME × 2007 -0.063*** -0.064*** -0.064***[0.017] [0.016] [0.016]
SME × 2009 0.001 0.004[0.008] [0.007]
SME × 2011 -0.007[0.006]
Constant 0.292*** 0.292*** 0.292***[0.004] [0.004] [0.004]
Observations 46,073 46,073 46,073R-squared 0.864 0.864 0.864Industry FE Yes Yes YesYear FE Yes Yes Yes
Source: Authors’ estimations using data from ASI.Note: Robust standard errors in brackets. *** p<0.01, ** p<0.05, * p<0.1.
This table shows the regression results based on Eq. (4.1). According to column(3) it is evident that VAT introduction has resulted in a significant decrease inproportion of firms below the VAT threshold. However, subsequent increase instandard rate in 2005 overturned that impact to some extent and increased theproportion of firms below the VAT threshold.
85
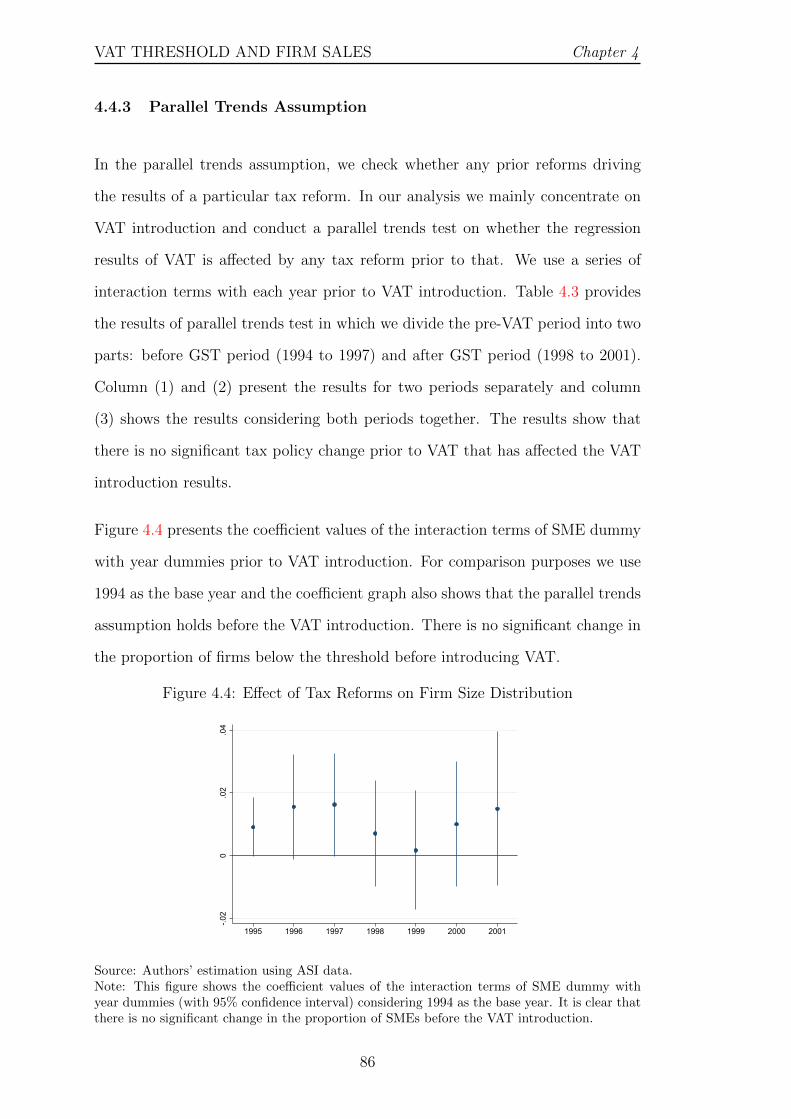
VAT THRESHOLD AND FIRM SALES Chapter 4
4.4.3 Parallel Trends Assumption
In the parallel trends assumption, we check whether any prior reforms driving
the results of a particular tax reform. In our analysis we mainly concentrate on
VAT introduction and conduct a parallel trends test on whether the regression
results of VAT is affected by any tax reform prior to that. We use a series of
interaction terms with each year prior to VAT introduction. Table 4.3 provides
the results of parallel trends test in which we divide the pre-VAT period into two
parts: before GST period (1994 to 1997) and after GST period (1998 to 2001).
Column (1) and (2) present the results for two periods separately and column
(3) shows the results considering both periods together. The results show that
there is no significant tax policy change prior to VAT that has affected the VAT
introduction results.
Figure 4.4 presents the coefficient values of the interaction terms of SME dummy
with year dummies prior to VAT introduction. For comparison purposes we use
1994 as the base year and the coefficient graph also shows that the parallel trends
assumption holds before the VAT introduction. There is no significant change in
the proportion of firms below the threshold before introducing VAT.
Figure 4.4: Effect of Tax Reforms on Firm Size Distribution
-.02
0.0
2.0
4
1995 1996 1997 1998 1999 2000 2001
Source: Authors’ estimation using ASI data.Note: This figure shows the coefficient values of the interaction terms of SME dummy withyear dummies (with 95% confidence interval) considering 1994 as the base year. It is clear thatthere is no significant change in the proportion of SMEs before the VAT introduction.
86
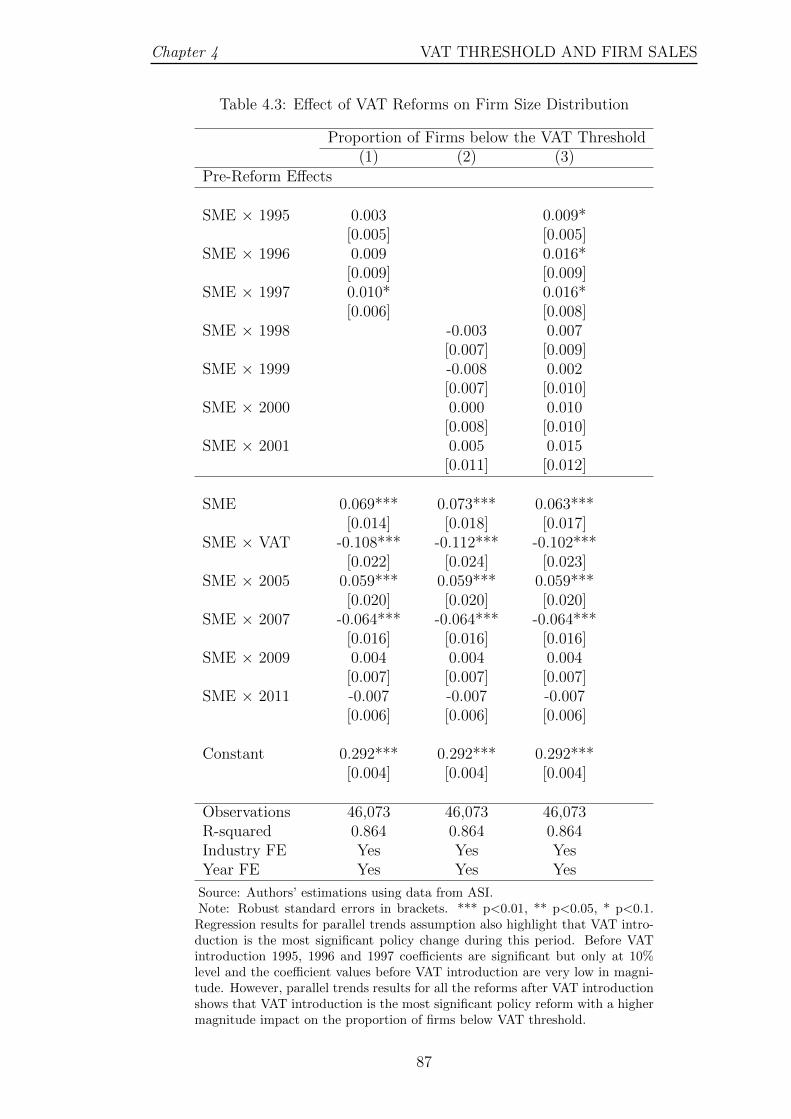
Chapter 4 VAT THRESHOLD AND FIRM SALES
Table 4.3: Effect of VAT Reforms on Firm Size Distribution
Proportion of Firms below the VAT Threshold(1) (2) (3)
Pre-Reform Effects
SME × 1995 0.003 0.009*[0.005] [0.005]
SME × 1996 0.009 0.016*[0.009] [0.009]
SME × 1997 0.010* 0.016*[0.006] [0.008]
SME × 1998 -0.003 0.007[0.007] [0.009]
SME × 1999 -0.008 0.002[0.007] [0.010]
SME × 2000 0.000 0.010[0.008] [0.010]
SME × 2001 0.005 0.015[0.011] [0.012]
SME 0.069*** 0.073*** 0.063***[0.014] [0.018] [0.017]
SME × VAT -0.108*** -0.112*** -0.102***[0.022] [0.024] [0.023]
SME × 2005 0.059*** 0.059*** 0.059***[0.020] [0.020] [0.020]
SME × 2007 -0.064*** -0.064*** -0.064***[0.016] [0.016] [0.016]
SME × 2009 0.004 0.004 0.004[0.007] [0.007] [0.007]
SME × 2011 -0.007 -0.007 -0.007[0.006] [0.006] [0.006]
Constant 0.292*** 0.292*** 0.292***[0.004] [0.004] [0.004]
Observations 46,073 46,073 46,073R-squared 0.864 0.864 0.864Industry FE Yes Yes YesYear FE Yes Yes Yes
Source: Authors’ estimations using data from ASI.Note: Robust standard errors in brackets. *** p<0.01, ** p<0.05, * p<0.1.
Regression results for parallel trends assumption also highlight that VAT intro-duction is the most significant policy change during this period. Before VATintroduction 1995, 1996 and 1997 coefficients are significant but only at 10%level and the coefficient values before VAT introduction are very low in magni-tude. However, parallel trends results for all the reforms after VAT introductionshows that VAT introduction is the most significant policy reform with a highermagnitude impact on the proportion of firms below VAT threshold.
87
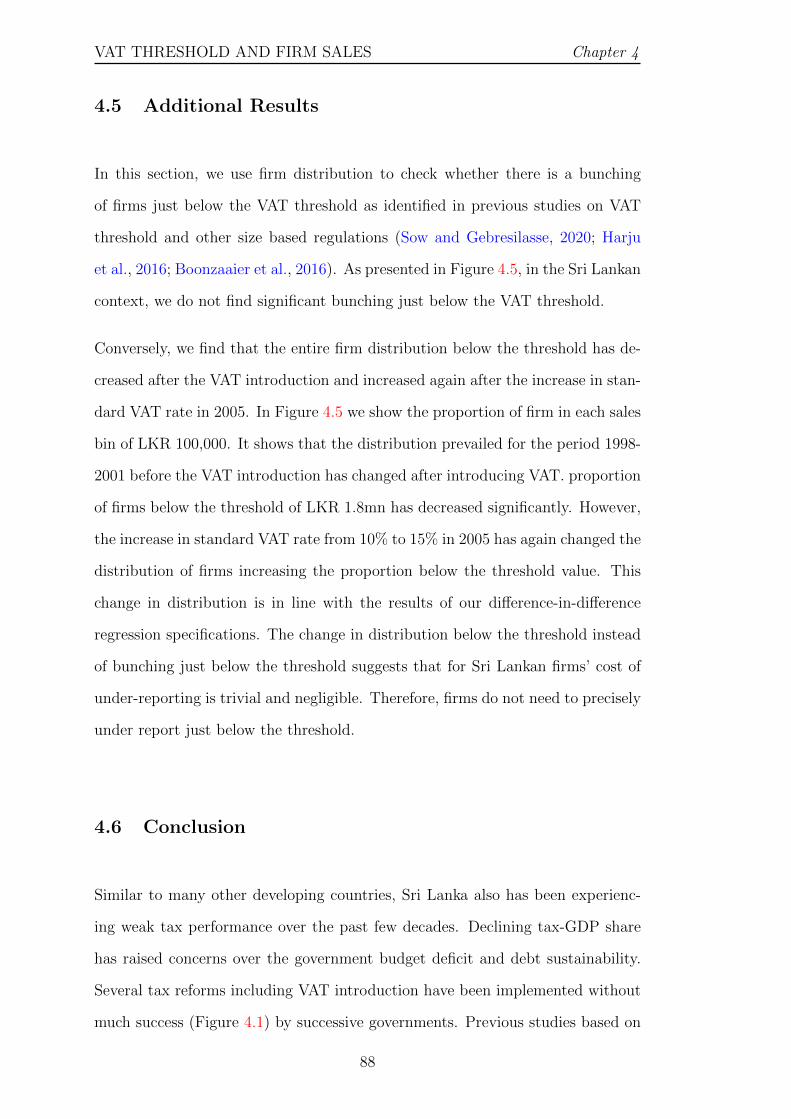
VAT THRESHOLD AND FIRM SALES Chapter 4
4.5 Additional Results
In this section, we use firm distribution to check whether there is a bunching
of firms just below the VAT threshold as identified in previous studies on VAT
threshold and other size based regulations (Sow and Gebresilasse, 2020; Harju
et al., 2016; Boonzaaier et al., 2016). As presented in Figure 4.5, in the Sri Lankan
context, we do not find significant bunching just below the VAT threshold.
Conversely, we find that the entire firm distribution below the threshold has de-
creased after the VAT introduction and increased again after the increase in stan-
dard VAT rate in 2005. In Figure 4.5 we show the proportion of firm in each sales
bin of LKR 100,000. It shows that the distribution prevailed for the period 1998-
2001 before the VAT introduction has changed after introducing VAT. proportion
of firms below the threshold of LKR 1.8mn has decreased significantly. However,
the increase in standard VAT rate from 10% to 15% in 2005 has again changed the
distribution of firms increasing the proportion below the threshold value. This
change in distribution is in line with the results of our difference-in-difference
regression specifications. The change in distribution below the threshold instead
of bunching just below the threshold suggests that for Sri Lankan firms’ cost of
under-reporting is trivial and negligible. Therefore, firms do not need to precisely
under report just below the threshold.
4.6 Conclusion
Similar to many other developing countries, Sri Lanka also has been experienc-
ing weak tax performance over the past few decades. Declining tax-GDP share
has raised concerns over the government budget deficit and debt sustainability.
Several tax reforms including VAT introduction have been implemented without
much success (Figure 4.1) by successive governments. Previous studies based on
88
Chapter 4 VAT THRESHOLD AND FIRM SALES
developing countries argue that the informal sector could be the main reason for
such poor tax performance. Given this background, our paper proposes a differ-
ent channel and looks at how formal sector firms respond to VAT introduction
and standard rate changes which is rarely discussed in the literature.
Figure 4.5: VAT Reforms and Sales Distribution Around VAT Threshold
0.0
05.0
1.0
15.0
2.0
25.0
3.0
35.0
4.0
45.0
5Pr
opor
tion
of fi
rms
1 2 3 4 5Sales in LKR mn
1998-2001 2002-2004
2005-2006
Source: Authors’ estimation using ASI data.Note: This figure shows the proportion of firms in each sales bins of LKR 100,000 for differenttime periods: before VAT, after VAT and after standard VAT rate increase. Accordingly there isno significant bunching just before the threshold as identified in other related studies. However,we find that distribution of firms below the threshold level has changed significantly with thepolicy changes. The higher proportion of firms below the threshold which prevailed before 2001has decreased considerably after the VAT introduction. However, standard rate increase in 2005has resulted in increase in distribution of firms below the threshold. This distribution changeis in line with the regression results discussed above.
Using a firm level survey in Sri Lanka from 1994 to 2017, we first show that
proportion of firms below the VAT threshold changes significantly after VAT in-
troduction and rate changes. This shows that firms under-report sales to stay
below the threshold where no VAT registration or payment is required. At the
next stage we use a difference-in-difference approach to statistically estimate how
the proportion of firms below VAT threshold change in response to VAT policy
89
VAT THRESHOLD AND FIRM SALES Chapter 4
changes between SMEs and non-SMEs. There we find that VAT introduction has
resulted in a significant drop in the proportion of SMEs below the VAT threshold.
However, a subsequent increase in the standard VAT rate has resulted in increas-
ing the proportion of SMEs below the threshold. This shows that SMEs have
significantly under-reported sales and move below the threshold as a response to
an increase in standard VAT rate. This has resulted in lower VAT base and obvi-
ously lower tax revenue from VAT. We also check the parallel trends assumption
and confirm that the results of VAT introduction has not been affected by any
prior tax policy reform.
Our paper also provide additional evidence on firm-size distribution. We show
that firm-size distribution in developing countries can be enormously shaped by
the tax policy parameters such as tax thresholds and rates. In the Sri Lankan case,
as opposed to bunching just below the threshold, the entire firm-size distribution
below the threshold changes significantly after VAT introduction and increase in
standard VAT rate.
VAT has no doubt delivered successful results in improving tax capacity and
efficiency for many countries. However, developing countries have not been able to
reap the full benefit of VAT introduction, due to several inherent weaknesses in the
tax system and poor design of the VAT policy as identified in the case of Sri Lanka.
As emphasised by Keen and Mintz (2004) setting up an appropriate threshold
level is one such important parameter in VAT policy. Tax administration should
also be capable enough to identify and prevent any deliberate under-reporting
by firms to stay below the threshold through their tax audit mechanism. Strong
auditing process would increase the cost for the SMEs compared to the benefits
of under-reporting and staying under the VAT threshold. This would lead to
a larger tax base and much-needed tax revenue for governments in developing
countries.
90

Chapter 4 VAT THRESHOLD AND FIRM SALES
REFERENCES
Adhikari, B. (2020). Does A Value-Added Tax Increase Economic Efficiency ?
Economic Inquiry, 58(1):496–517.
Agha, A. and Haughton, J. (1996). Designing Vat Systems: Some Efficiency
Considerations. The Review of Economics and Statistics, 78(2):303–308.
Ahlerup, P., Baskaran, T., and Bigsten, A. (2015). Tax Innovations and Pub-
lic Revenues in Sub-Saharan Africa. The Journal of Development Studies,
51(6):689–706.
Alm, J. and Embaye, A. (2013). Using Dynamic Panel Methods to Estimate
Shadow Economies Around the World, 1984–2006. Public Finance Review,
41(5):510–543.
Alm, J., Martinez-Vazquez, J., and Schneider, F. (2004). ‘Sizing’ the Problem of
the Hard-to-Tax. Contributions to Economic Analysis, 268:11–75.
Annicchiarico, B. and Cesaroni, C. (2018). Tax reforms and the underground
economy: a simulation-based analysis. International Tax and Public Finance,
25(2):458–518.
Besley, T. and Persson, T. (2014). Why Do Developing Countries Tax So Little?
Journal of Economic Perspectives, 28(4):99–120.
Best, M. C., Brockmeyer, A., Kleven, H. J., Spinnewijn, J., and Waseem, M.
(2015). Production versus Revenue Efficiency with Limited Tax Capacity: The-
ory and Evidence from Pakistan. Journal of Political Economy, 123(6):1311–
1355.
Boadway, R. and Sato, M. (2009). Optimal Tax Design and Enforcement with
an Informal Sector. American Economic Journal, 1(1):1–27.
Boonzaaier, W., Harju, J., Matikka, T., and LastNamePirttila, J. (2016). How
do small firms respond to tax schedule discontinuities? Evidence from South
African tax registers. WIDER Working Paper, 36.
CBSL (2005). Central Bank of Sri Lanka Annual Report. Technical report,
Central Bank of Sri Lanka.
91
VAT THRESHOLD AND FIRM SALES Chapter 4
CBSL (2020). Central Bank of Sri Lanka Annual Report. Technical report,
Central Bank of Sri Lanka.
De Paula, A. and Scheinkman, J. A. (2010). Value-Added Taxes, Chain Effects,
and Informality. American Economic Journal: Macroeconomics, 2:195–221.
Dharmapala, D., Slemrod, J., and Wilson, J. D. (2011). Tax policy and the
missing middle: Optimal tax remittance with firm-level administrative costs.
Journal of Public Economics, 95(9-10):1036–1047.
Emran, S. M. and Stiglitz, J. E. (2005). On selective indirect tax reform in
developing countries. Journal of Public Economics, 89:599–623.
Faridy, N., Copp, R., Freudenberg, B., and Sarker, T. (2014). Complexity, Com-
pliance Costs and Non-Compliance with VAT by Small and Medium Enter-
prises (SMEs) in Bangladesh: Is there a Relationship? Australian Tax Forum,
29(2):281–328.
Gordon, R. H. and Li, W. (2009). Tax structures in developing countries: Many
puzzles and a possible explanation. Journal of Public Economics, 93(7-8):855–
866.
Gourio, F. and Roys, N. (2014). Size-dependent regulations, firm size distribution,
and reallocation. Quantitative Economics, 5(2):377–416.
Harju, J., Matikka, T., and Rauhanen, T. (2016). The Effects of Size-Based
Regulation on Small Firms: Evidence from Vat Threshold. VATT Institute for
Economic Research Working Paper, 75.
Hsieh, C.-T. and Klenow, P. J. (2009). Misallocation and Manufacturing TFP in
China and India. Quarterly Journal of Economics, 124(4):1403–1448.
IRD (2019). Inland Revenue Department Annual Performance Report. Technical
report, Inland Revenue Department.
Joshi, A., Prichard, W., and Heady, C. (2014). Taxing the Informal Economy:
The Current State of Knowledge and Agendas for Future Research. The Journal
of Development Studies, 50(10):1325–1347.
Kanbur, R. and Keen, M. (2014). Thresholds, informality, and partitions of
compliance. International Tax and Public Finance, 21(4):536–559.
92
Chapter 4 VAT THRESHOLD AND FIRM SALES
Keen, M. and Lockwood, B. (2010). The value added tax: Its causes and conse-
quences. Journal of Development Economics, 92(2):138–151.
Keen, M. and Mintz, J. (2004). The optimal threshold for a value-added tax.
Journal of Public Economics, 88:559–576.
Kleven, H. J. (2014). How Can Scandinavians Tax So Much? Journal of Economic
Perspectives, 28(4):77–98.
Matthews, K. (2003). VAT Evasion and VAT Avoidance: Is there a European
Laffer curve for VAT? International Review of Applied Economics, 17(1):105–
114.
Piggott, J. and Whalley, J. (2001). VAT Base Broadening, Self Supply, and the
Informal Sector. American Economic Review, 91(4):1084–1094.
Restuccia, D. and Rogerson, R. (2008). Policy distortions and aggregate pro-
ductivity with heterogeneous establishments. Review of Economic Dynamics,
11(4):707–720.
Sokolovska, O. and Sokolovskyi, D. (2015). VAT efficiency in the countries world-
wide. Munich Personal RePEc Archive, MPRA 66422.
Sow, S. and Gebresilasse, M. (2020). Effect of VAT Adoption on Manufacturing
Firms in Ethiopia. International Journal of Economics and Finance, 12(10):85.
Waseem, M. (2018). Taxes, informality and income shifting: Evidence from a
recent Pakistani tax reform. Journal of Public Economics, 157:41–77.
Zee, H. H. (2005). Simple analytics of setting the optimal vat exemption thresh-
old. De Economist, 153(4):461–471.
93
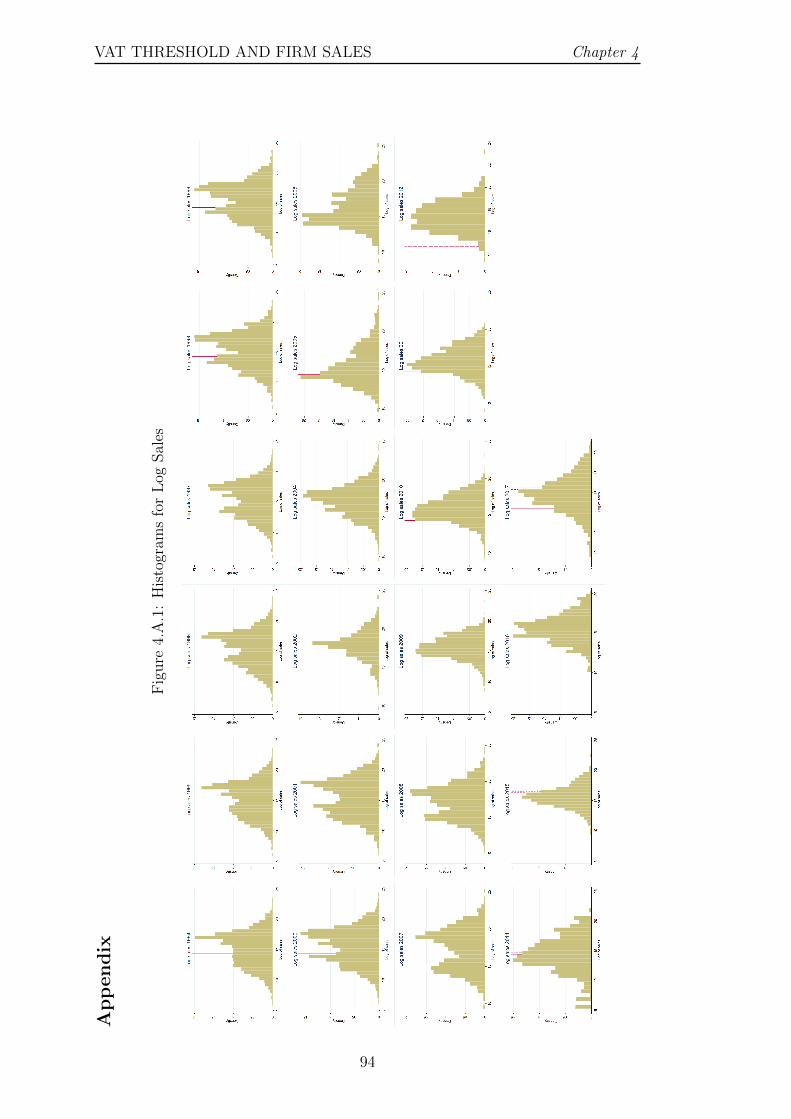
VAT THRESHOLD AND FIRM SALES Chapter 4
Ap
pen
dix
Fig
ure
4.A
.1:
His
togr
ams
for
Log
Sal
es
94
Chapter 5
CONCLUSION AND POLICY IMPLICATIONS
The final chapter provides a summary of major findings of the thesis and pol-
icy implications that emerge for a better VAT system that improves the overall
tax efficiency and generates sufficient revenue with minimal adverse impact on
economic activities.
Insufficient tax revenue is an important problem faced by governments in de-
veloping countries. This has limited the availability of much needed resources
for capital investment as well as welfare programs in these countries. Weak tax
performance has led to several macroeconomic problems such as higher budget
deficits and debt crisis in many developing countries. During the past few decades
most developing and transitional countries have adopted VAT in their search for
a solution to the weak tax problem. However, past studies show that especially
developing countries have not been able to improve tax capacity even after VAT
adoption. Given this background, the central focus of this thesis is to critically
analyze VAT system and tax capacity in developing countries.
5.1 Summary of Major Findings
Chapter 2 investigates the main channels that constrain the effectiveness of VAT
on tax capacity in developing countries. We use a novel method to measure tax
capacity by considering both conventional tax GDP share as well as the informal
economy. By employing a difference-in-difference model with an IV in a panel
95

CONCLUSION Chapter 5
data set of 127 countries from 1991 to 2015 we find that the presence of VAT has a
significant positive impact on both total tax and indirect tax shares in developing
counties. The decomposition of the positive effect into three different channels:
effective tax rate, tax base and informal sector reveals that the main contribution
of VAT introduction on tax capacity is through the increase in effective tax rate
while tax base has declined in response. More importantly the role of VAT as
an information source does not significantly contribute towards the increase in
tax capacity in developing countries. The findings of this study from a macro
perspective are in line with the ‘last mile problem’ discussed by Pomeranz (2015);
Naritomi (2019); Gerard and Naritomi (2018) in their analyses of the loopholes
of information revelation in the VAT system.
In Chapter 3, we construct a measurement of the appropriateness to explain the
degree of compatibility of VAT adoption to the host country. We argue that
similar to technological diffusion, VAT adoption might have followed a forceful
dynamic process driven by external forces. Building on the idea proposed by Keen
and Lockwood (2010), we measure the appropriateness of VAT based on the as-
sumption that diffusion of VAT is jointly determined by geography and countries’
socio-economic condition. This allows us to simultaneously identify the influence
of geographic neighbours on VAT adoption and measure the appropriateness of
VAT in the host country. Our findings are consistent with the literature showing
that VAT diffusion is driven by the geographic distance between countries (Cızek
et al., 2017). As an addition to the existing literature, we also find that even
though VAT adoption is affected by geographic neighbours, the effect of VAT on
tax capacity in the host country depends on its appropriateness. Countries with
higher appropriateness indices have achieved a greater increase in capacity after
VAT introduction.
In chapter 4, we examine tax evasion by misreporting with micro firm level data
in a developing country. We focus on one important parameter of VAT policy:
96

Chapter 5 CONCLUSION
registration threshold. Using firm level survey data from Sri Lanka, we investigate
the behavioural response of formal firms to VAT introduction and increase in
standard VAT rate. We use SMEs and non-SMEs as treatment and control groups
repectively in a difference-in-difference model and find that the proportion of
firms below the VAT threshold changes significantly in response to VAT policy
changes. We find that share of SMEs below the threshold decreases by around 11
percentage points in the Sri Lankan context immediately after VAT introduction
in 2002. However, the increase in the standard VAT rate from 10% to 15% in
2005 leads to an increase in share of SMEs below the threshold by around 5.9
percentage points. That suggests SMEs actively hide below the VAT threshold
in response to increase in standard VAT rate. This is a novel finding in this
literature whereas previous literature only finds bunching of firms just below the
VAT threshold and has not considered firms’ response to changes in standard
VAT rate. Our results show that even though VAT is effective in information
revelation through registration, its role is limited in Sri Lanka. Therefore, it is
hard to achieve higher tax capacity by increasing standard rate due to higher
de-registration.
5.2 Policy Implications
The findings of this thesis carry several important policy implications. First, we
identify the limitation of the information role of VAT in developing countries.
Self-information revelation is one important feature of the design of VAT which
compels firms to register for VAT leading to a larger tax base. However, our
findings show that developing countries have not been able to achieve a larger tax
base and instead governments rely on higher VAT rate to earn higher revenue.
This has resulted in even smaller tax base as firms try to remain below the
threshold by under-reporting. Therefore, tax reforms should target higher tax
revenue through a combination of larger tax base and lower rate.
97
CONCLUSION Chapter 5
The appropriateness index we developed (Chapter 3) highlights the importance
of the socio-economic conditions of the host country to achieving the objectives
of VAT adoption. It indicates that countries with higher appropriateness indices
achieve higher tax capacity after VAT introduction. VAT as a taxation tech-
nology is always interconnected with the general economic environment and the
performance of the general economy affects the performance of VAT. Therefore,
when governments design fiscal policies and conduct estimations on revenue tar-
gets, they need to understand both the impact of tax on economic outcomes and
vice-versa. That will enable them to develop more realistic estimations of tax
revenue and adjust fiscal policies in a more economically friendly manner.
Finally, our analysis on registration threshold shows the importance of different
parameters of the VAT policy. The design of the VAT policy should be conducted
with a careful research and should consider the possible response from the related
parties. As identified by Keen and Mintz (2004), the registration threshold is one
such important parameter of the VAT policy and policy makers should consider
the interaction between threshold and standard rate in the tax design. Setting
an excessively higher threshold would lower the revenue while a lower threshold
would lead to higher collection cost. As observed in the Sri Lankan context,
setting up a lower threshold with a weak tax administration capacity would lead
to tax evasion at the event of rate increase, leading to lower revenue.
98
Chapter 5 CONCLUSION
REFERENCES
Cızek, P., Lei, J., and Ligthart, J. E. (2017). Do Neighbours Influence Value-
Added-Tax Introduction? A Spatial Duration Analysis. Oxford Bulletin of
Economics and Statistics, 79(1):25–54.
Gerard, F. and Naritomi, J. (2018). Value Added Tax in developing countries:
Lessons from recent research. IGC Growth Brief Series 15.
Keen, M. and Lockwood, B. (2010). The value added tax: Its causes and conse-
quences. Journal of Development Economics, 92(2):138–151.
Keen, M. and Mintz, J. (2004). The optimal threshold for a value-added tax.
Journal of Public Economics, 88:559–576.
Naritomi, J. (2019). Consumers as Tax Auditors. American Economic Review,
109(9):3031–3072.
Pomeranz, D. (2015). No Taxation without Information: Deterrence and
Self-Enforcement in the Value Added Tax. American Economic Review,
105(8):2539–2569.
99
Related Documents