Valuation of California Rangeland Ecosystem Services Impacted by Climate/Land Use Change: Challenges and Opportunities Frank Casey, Ph.D. Science and Decisions Center US Geological Survey October 29, 2014 Webinar Hosted by Defenders of Wildlife and the California Rangeland Conservation Coalition

Welcome message from author
This document is posted to help you gain knowledge. Please leave a comment to let me know what you think about it! Share it to your friends and learn new things together.
Transcript

Valuation of California Rangeland Ecosystem Services Impacted by
Climate/Land Use Change: Challenges and Opportunities
Frank Casey, Ph.D. Science and Decisions Center
US Geological Survey
October 29, 2014Webinar Hosted by Defenders of Wildlife and
the California Rangeland Conservation Coalition
Topics– Goals
– Conceptual Framework and Approach
– Ecosystem Services Impacted
– Directional Changes in Ecosystem Service Values
– Economic Models
– Challenges
– Opportunities

Goals• Determine impacts on regulating and
supporting ecosystem services: carbon pools, water recharge/run-off, stream flows, wildlife habitat
• Provisional identification of directional changes of ecosystem service values: literature review
• Alameda Creek

Ecosystem services provided by rangelands
• Food, fiber and fuel• Wildlife habitat• Water • Carbon sequestration• Adaptation to climate
change• Open space, cultural
values

Integrated Threats to Rangelands
• In California 20,000 acres of rangelands are lost every year
• Privately owned• Cattle ranching: low profits• Low levels of protection
Land conversion and climate change lead to loss of grazing land, water availability, and altered species distribution

Project Scenarios
• Six spatially-explicit climate change/land use change scenarios from years 2000 – 2100 consistent with three IPCC emission scenarios and two global climate models –
• Assess potential threats to rangeland ecosystem services
1. wildlife habitat
2. water availability (Lorraine Flint and Alan Flint, USGS)
3. carbon sequestration
A1B (wealth and technology)
1. CSIRO Mark 3.5 GCM (warm, wet future)
2. MIROC 3.2 (medres) (hot, dry future)
A2 (population pressures)
1. PCM (warm, wet future)
2. GFDL CM 2.1 (hot, dry future)
B1 (sustainability)1. PCM (warm, wet future)
2. GFDL CM 2.1 (hot, dry future)

Integrated Scenarios

Case Study of Six Watersheds:
North:Upper StonyLower Butte
Central:Lower Cosumnes***Alameda Creek
South:Upper TuleEstrella
Changes in:• Wildlife habitat• Carbon• Runoff, recharge, streamflow
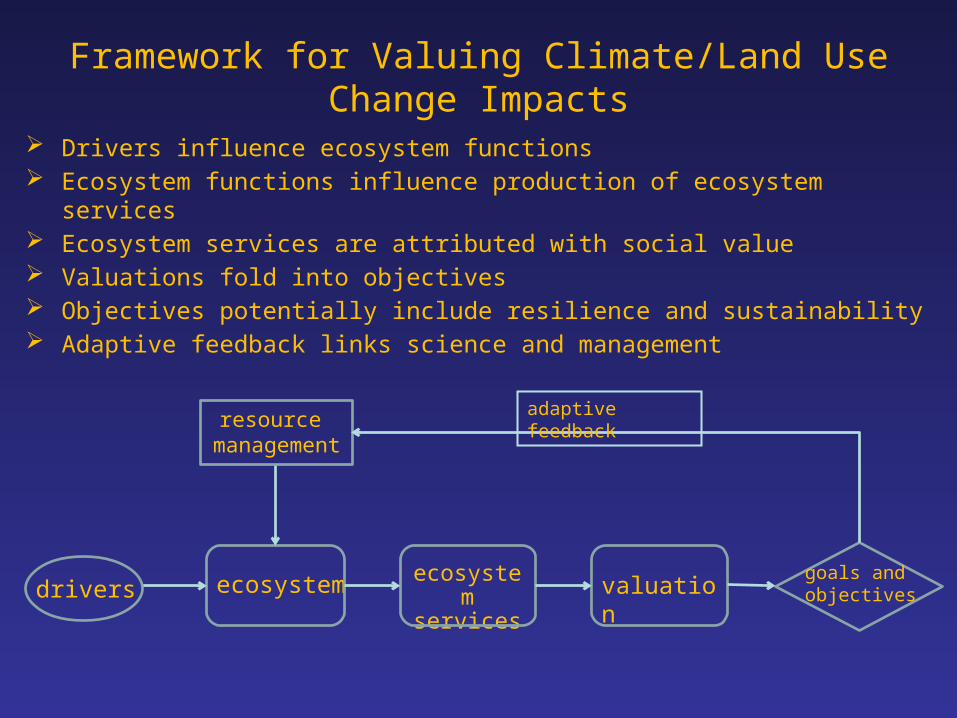
Framework for Valuing Climate/Land Use Change Impacts
Drivers influence ecosystem functions Ecosystem functions influence production of ecosystem services Ecosystem services are attributed with social value Valuations fold into objectives Objectives potentially include resilience and sustainability Adaptive feedback links science and management
ecosystem
resource managemen
t
driversecosyste
m services
valuationgoals and objectives
adaptive feedback

Ecosystem Functions vs. Ecosystem Services vs. Ecosystem Service Values
• Ecosystem Functions:
Biophysical processes in an ecosystem
• Ecosystem Services:
Outputs of ecosystem functions that directly or indirectly benefit humans
• Ecosystem Service Values:
Benefits humans receive
from ecosystem service outputs

ecosystem
• climate • land use•
disturbance factors
resource management
drivers
• structures• functions• processes•
distribution• dynamics• scale• resilience• monitoring
• goods• outputs• services•
attributes• metrics
• benefits•
discounting
• uncertainty
• species management • habitat alteration• ecosystem restoration• infrastructure develop.
• sustainability
• ecol. condition
• economic yield
• risk
ecosystem
services
valuation goals and objectives
What determines our economic analysis framework
• decision analysis• data assessment/display• adaptive feedback

Methods for Quantifying Economic Benefits
Total Economic Value =
Use value Direct use value + Indirect use value + Option value (“Ecosystem functional value”) Quantification approaches:
Travel Cost Method Production function approach Contingent Valuation Surrogate market valuation Damage costs avoided Conjoint Analysis Hedonic prices Preventive expenditures Individual Choice models Contingent Valuation Methods Travel Cost Method
Surrogate market valuation Contingent Valuation Methods [Replacement cost]
+ Passive use value
Existence value + Intrinsic value + Bequest/Stewardship value
Quantification approaches: Contingent Valuation Methods Source: Barbier (2000)
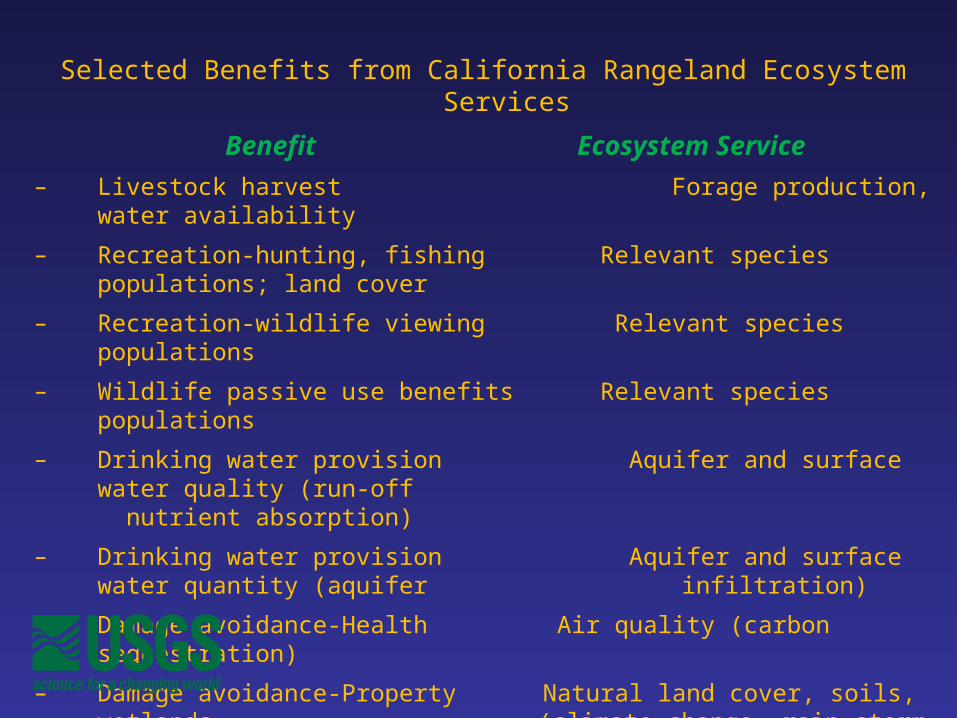
Selected Benefits from California Rangeland Ecosystem Services
Benefit Ecosystem Service
– Livestock harvest Forage production, water availability
– Recreation-hunting, fishing Relevant species populations; land cover
– Recreation-wildlife viewing Relevant species populations
– Wildlife passive use benefits Relevant species populations
– Drinking water provision Aquifer and surface water quality (run-off nutrient absorption)
– Drinking water provision Aquifer and surface water quantity (aquifer infiltration)
– Damage avoidance-Health Air quality (carbon sequestration)
– Damage avoidance-Property Natural land cover, soils, wetlands (climate change, rain storm events)
– Damage avoidance-Dredging Natural land cover
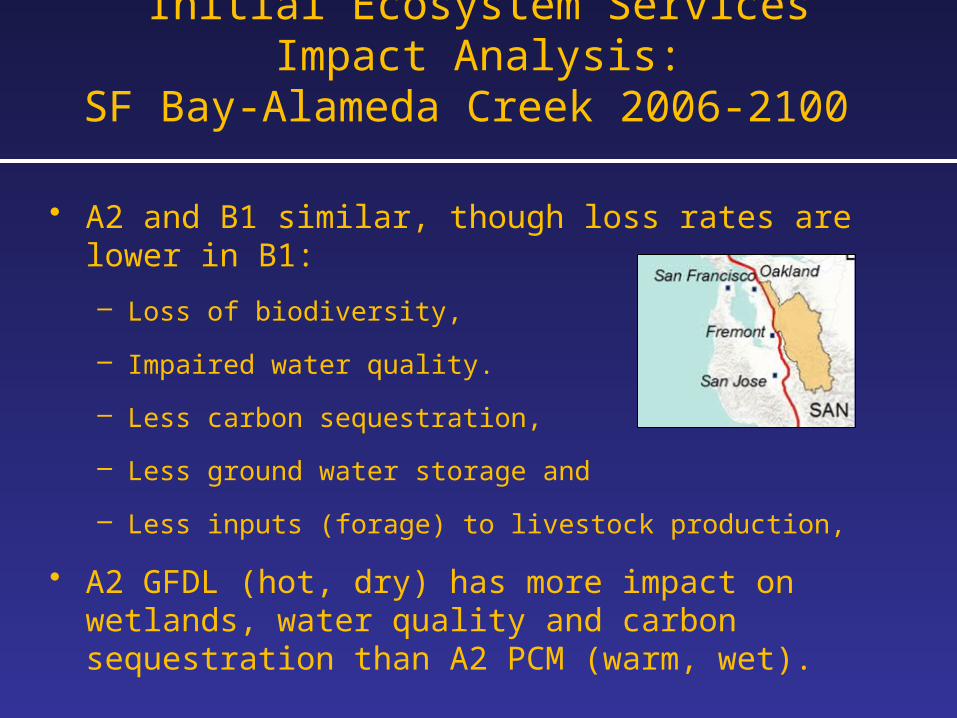
Initial Ecosystem Services Impact Analysis:SF Bay-Alameda Creek 2006-2100
• A2 and B1 similar, though loss rates are lower in B1:
– Loss of biodiversity,
– Impaired water quality.
– Less carbon sequestration,
– Less ground water storage and
– Less inputs (forage) to livestock production,
• A2 GFDL (hot, dry) has more impact on wetlands, water quality and carbon sequestration than A2 PCM (warm, wet).
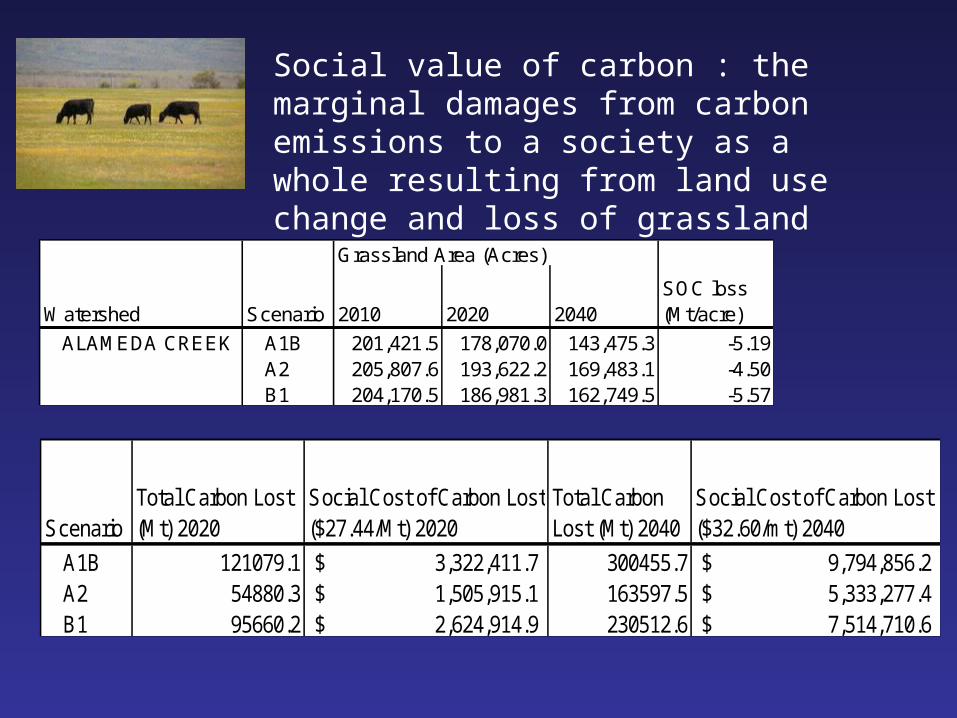
Grassland Area (Acres)
Watershed Scenario 2010 2020 2040SOC loss (Mt/acre)
ALAMEDA CREEK A1B 201,421.5 178,070.0 143,475.3 -5.19A2 205,807.6 193,622.2 169,483.1 -4.50B1 204,170.5 186,981.3 162,749.5 -5.57
ScenarioTotal Carbon Lost (Mt) 2020
Social Cost of Carbon Lost ($27.44/Mt) 2020
Total Carbon Lost (Mt) 2040
Social Cost of Carbon Lost ($32.60/mt) 2040
A1B 121079.1 3,322,411.7$ 300455.7 9,794,856.2$ A2 54880.3 1,505,915.1$ 163597.5 5,333,277.4$ B1 95660.2 2,624,914.9$ 230512.6 7,514,710.6$
Social value of carbon : the marginal damages from carbon emissions to a society as a whole resulting from land use change and loss of grassland

Economic Impacts of decreased groundwater recharge
• Groundwater integral to sustaining types of aquatic, terrestrial and coastal ecosystem functions, but poorly understood
• Hot/dry climate scenario: recharge levels would decrease 40% between 2040 and 2100 to about 95,000 m3 per year
• Alameda Creek: Groundwater overdraft leads to extended periods of zero flow
• Combined with overdrafts: Higher costs potentially related to reduced wildlife viewing and recreation, less wetland filtration of sediment and nutrients, more costly gray infrastructure, reduced fisheries
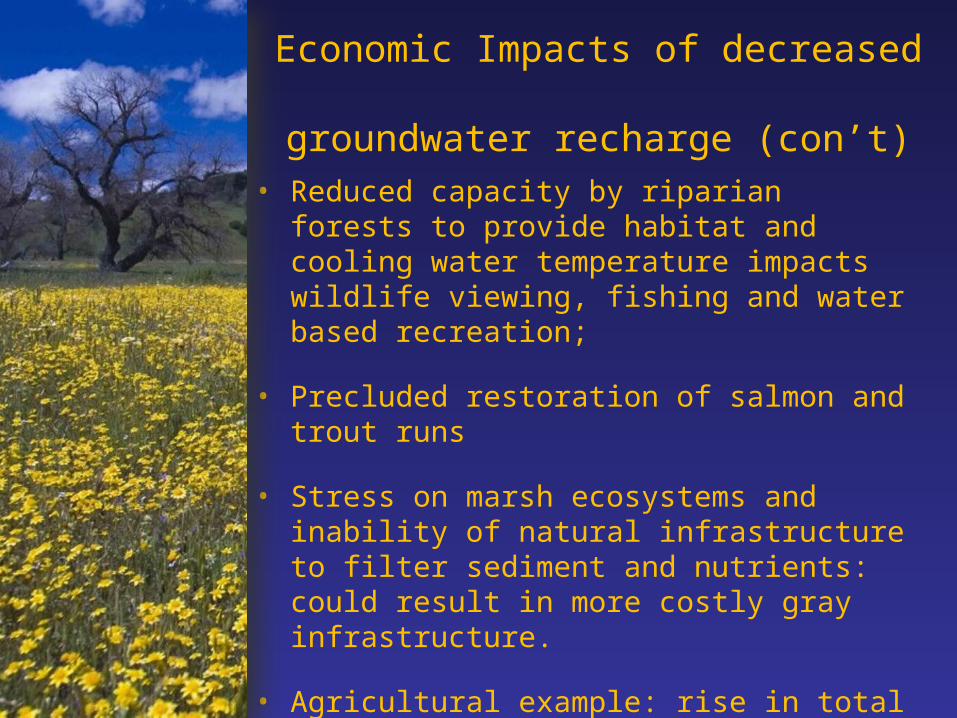
Economic Impacts of decreased groundwater recharge (con’t)
• Reduced capacity by riparian forests to provide habitat and cooling water temperature impacts wildlife viewing, fishing and water based recreation;
• Precluded restoration of salmon and trout runs
• Stress on marsh ecosystems and inability of natural infrastructure to filter sediment and nutrients: could result in more costly gray infrastructure.
• Agricultural example: rise in total water supply operating costs of $490 million/year by 2050 (Medellin-Azuara et al 2008).

Wildlife Habitat/Species Valuation
• Rangeland habitat for freshwater fish, wintering birds, pollinators, invertebrates and mammals (75 listed under the ESA).
• Existence values; recreational uses; production benefits; aesthetic values
• Freshwater fishing: Estimated $64-$267/person/day• Fishing licenses: $1.8 million 2012• Wetland habitats: $625-$261 acre/year• Vernal pool habitat: $30/person/year• Wildlife viewing: $80-$48/person/day• Hunting: 22,000 Alameda licenses
Challenges of Valuing Ecosystem Services
• Geographic and Time scales • Lack of site specific primary and secondary studies
(existence/habitat)• Baseline water infrastructure cost to provide
monetary impacts of reduced recharge/increase run-off
• Complete economic analysis will depend on water management strategies adopted (reservoir reoperation, water transfers, recharge protection, etc.)
Challenges with Valuing Costs and Benefits
Lack of research on baselines and changes in rangeland ecosystem service values: soil retention, nutrient recycling, run-off control, groundwater recharge and wildlife species, water quality improvement, compromised view sheds, pollination capacity
Remember: valuing marginal changes

Opportunities and Recommendations
Wildlife and Habitat: Apply the Habitat Benefits Tool Box or other Socio-Economic model
Basic ecological and economic research on rangeland ecosystem services impacted by changes in run-off and recharge
Basic research on climate change
impacts on rangeland functions and
productivity (done for crop agriculture,
but not rangelands).
•

Opportunities and Recommendations
Commission studies to understand the implications of climate change for flood, aquifer storage and water quality management on rangelands
Develop a case study to compare the ecosystem service and economic impacts of climate change under different water management strategies: reservoir reoperation, water transfers, etc.
Additional research on rangeland amenity values (oak woodlands, >$2,000/acre (Oviedo, et al 2012).
•
Opportunities and Recommendations
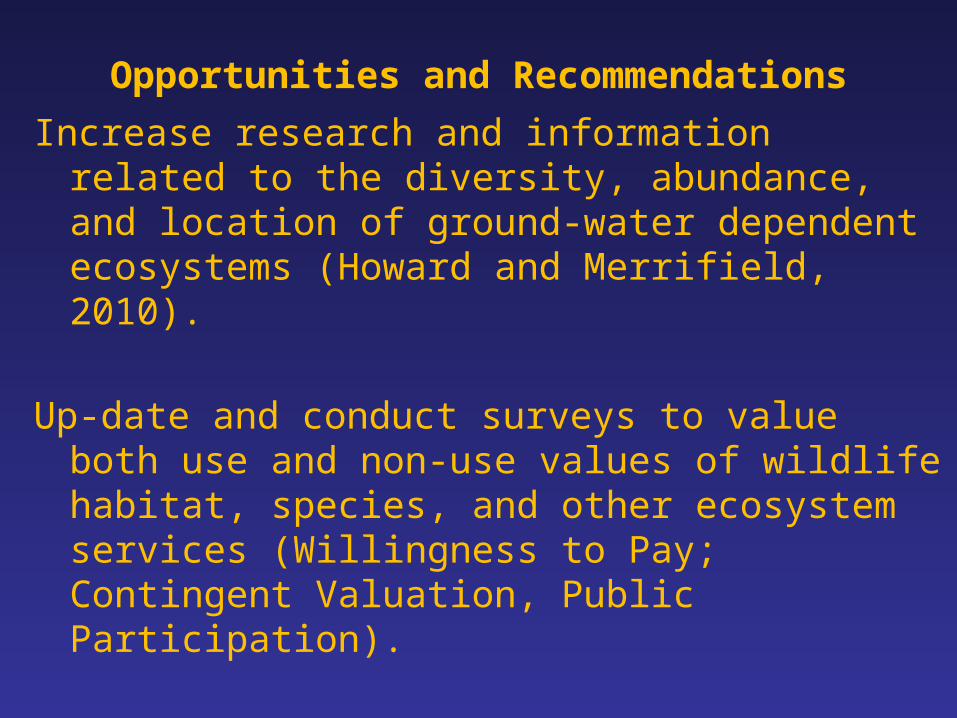
Increase research and information related to the diversity, abundance, and location of ground-water dependent ecosystems (Howard and Merrifield, 2010).
Up-date and conduct surveys to value both use and non-use values of wildlife habitat, species, and other ecosystem services (Willingness to Pay; Contingent Valuation, Public Participation).
Determine impacts of climate change on water delivery system management costs and consumer prices
•

Socio-Economic Valuation ToolsEcosystem Service Markets: Negotiations between buyers and sellers-water quality, CAR, habitat banking
Artificial Intelligence for Ecosystem Services (ARIES)
Integrated Valuation of Ecosystem Services and Trade-offs (InVest)
Habitat Benefits Toolbox: Habitats, Water, Open Space (Benefit Transfer).
Social Values for Ecosystem Services (SolVES)
Uses of the Benefits Toolbox
Quantify the potential gains/losses from land conversion
Compare value of alternative restoration and management practices
Identify conservation sites that generate the highest value per $
Property value premium estimator model
Instructions: Fill in all cells marked "ENTER >". (See accompanying user manual for detailed instructions and documentation.)
STEP 1: Select shape of area of analysis in which property value premiums are analyzed
ENTER > C Enter "C" for circular and "R" for rectangular shape of area
STEP 2: Enter the radius (circular area) or length and width (rectangular area) of the area of analysis
ENTER > 2640 Radius of area in feet
OUTPUT: 503 Size of study area (acres)
STEP 3: Enter the size of the open space
ENTER > 85 Size in acres of the open space whose property value impact is to be estimated
OUTPUT: 16.9 %OSChange. Percentage of the study area occupied by the open space of interest.
Example: A 20 percent share of open space in the area of interest is indicated as "20".
STEP 4: Enter the appropriate values for the indicator variables
ENTER > 1 FOR. Enter "1" if the open space is a forest. Otherwise, enter "0".
ENTER > 0 PARK. Enter "1" if the open space is a park. Otherwise, enter "0".
ENTER > 0 WET. Enter "1" if the open space is a wetland. Otherwise, enter "0".
ENTER > 1 PROT. Enter "1" if the open space is protected. Otherwise, enter "0". Protection is defined as the
absence of the possibility of development (i.e., easement, public ownership).
ENTER > 1 PRIV. Enter "1" if the open space is privately owned. Otherwise, enter "0".
P OS = 10.2 % increase in average residential property value from open space of interest
STEP 5: Enter the number of residential properties located in the area
ENTER > 150 Number of properties located in study area. NOTE: Include only single-family homes.
ENTER > $250,000 Average value of properties ($)
OUTPUT: $3,826,151 Estimated total property premium in study area attributable to open space of interest
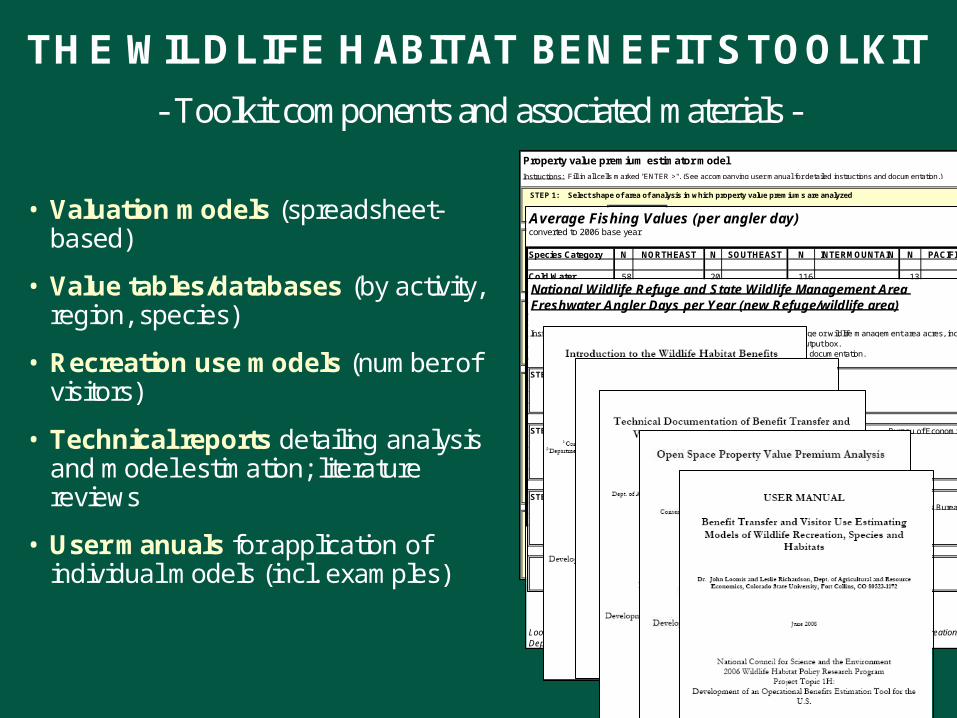
- Toolkit components and associated materials -
• Valuation models (spreadsheet-based)
• Value tables/databases (by activity, region, species)
• Recreation use models (number of visitors)
• Technical reports detailing analysis and model estimation; literature reviews
• User manuals for application of individual models (incl. examples)
THE WILDLIFE HABITAT BENEFITS TOOLKIT
Average Fishing Values (per angler day) converted to 2006 base year
Species Category N NORTHEAST N SOUTHEAST N INTERMOUNTAIN N PACIFIC N ALASKA N NATIONAL
Cold Water 58 20 116 13 4 3 Average $39.54 $51.25 $62.54 $54.10 $53.90 $38.53 Median $27.04 $51.19 $47.22 $45.31 $58.37 $31.47
Warm Water 119 63 38 3 7 Average $42.87 $54.37 $45.55 $28.59 $55.59 Median $27.18 $47.13 $32.84 $29.83 $55.93
Coastal 11 34 24 9 Average $68.47 $144.74 $140.09 $73.70 Median $7.34 $73.32 $102.10 $59.66
Anadromous 33 1 16 27 18 3 Average $39.41 $138.22 $51.20 $65.61 $40.76 $103.36 Median $4.69 $138.22 $49.21 $57.92 $38.90 $78.30
Mixed 30 1 16 16 Average $20.08 $134.24 $59.28 $213.13 Median $18.32 $134.24 $36.18 $206.87
Not Specified 112 16 48 14 2 1 Average $49.66 $93.47 $77.31 $39.10 $95.56 $67.12 Median $36.01 $34.20 $62.70 $43.12 $95.56 $67.12
ENTER appropriate value here for Summary Output sheet
1) ENTER the average or median value from the column in the above table that matches your location for the Summary Output Table: ► OR, ENTER a value from the Detailed Table (next tab) OR, ENTER a per-day value from the Database tab, if you think the characteristics in the study from which that value stems are a close match to those you wish to value.
Loomis, J. and L. Richardson, 2007. Benefit Transfer and Visitor Use Estimating Models of Wildlife Recreation, Species and Habitats. Department of Agricultural and Resource Economics, Colorado State University.
National Wildlife Refuge and State Wildlife Management Area Freshwater Angler Days per Year (new Refuge/wildlife area)
Instructions: Fill in relevant cells marked "ENTER >" associated with Refuge or wildlife management area acres, income and population of surrounding counties. Hit the enter key to get freshwater fishing visits per year in output box.See accompanying user manual for detailed instructions and documentation.
STEP 1: Enter the total acres within the Refuge/wildlife area
ENTER > 0.00
STEP 2: Enter the per capita income of surrounding counties. Can be found at: Bureau of Economic AnalysisClick on state at bottom of page to get per capita income by county
ENTER > $31,000
STEP 3: Enter the population of counties within a 60 mile radius of the Refuge/wildlife areaPopulation by county can be found at the following weblink: U.S. Census Bureau Fact Finder
ENTER > 0
OUTPUT 0 Freshwater Angler Days / year

Uses of the Habitat Benefits Toolbox
• Quantify the public value of a conservation area (recreation; ecosystem service values; property value premiums) to:
-Strengthen the case for public cost-share
-Request increased public funds for research and conservation

Payment for Ecosystem Services– Very little familiarity with terms Ecosystem Services or
Payments for Ecosystem Services (PES). BUT– Familiar with terms such as wildlife habitat management, water
quality improvement, vegetation management, invasive species control
– Interested in participating in PES programs: 77% Yes; and favor creation of PES programs
– PES contract length, payment level, and administrator all equally and very important to participation decision
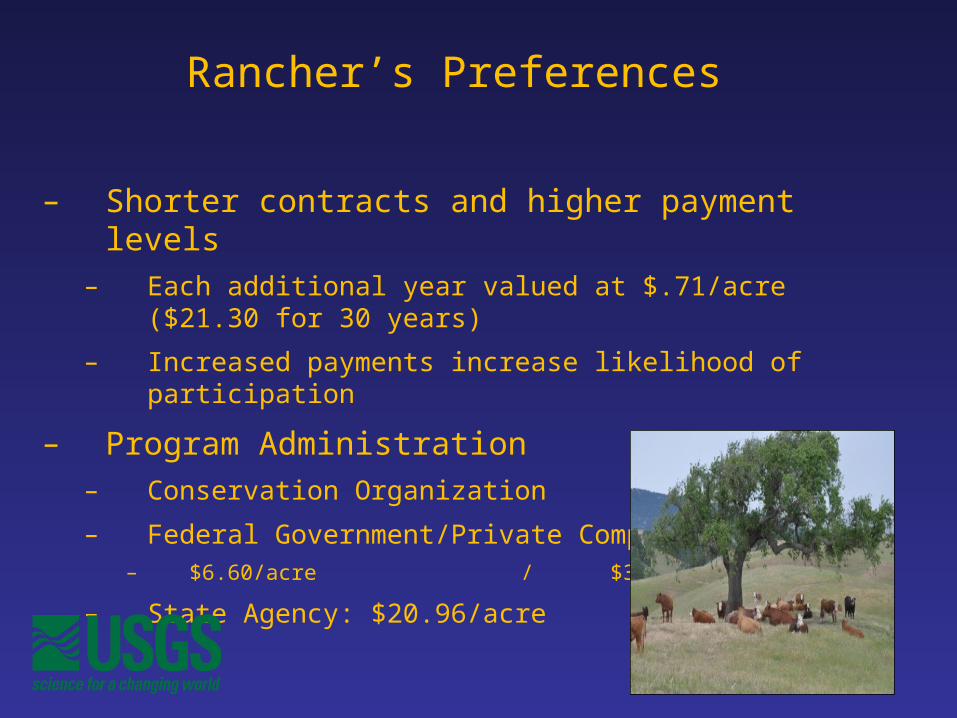
Rancher’s Preferences
– Shorter contracts and higher payment levels– Each additional year valued at $.71/acre ($21.30 for 30 years)
– Increased payments increase likelihood of participation
– Program Administration– Conservation Organization
– Federal Government/Private Company– $6.60/acre / $3.25/acre
– State Agency: $20.96/acre

Acknowledgements
Kristin Byrd, USGs Western Geographic Center
Lorraine and Alan Flint, California Water Center
Pelayo Alvarez, California Rangeland Conservation Coalition
Related Documents