Valuation Case Study on Technics Oil & Gas

Welcome message from author
This document is posted to help you gain knowledge. Please leave a comment to let me know what you think about it! Share it to your friends and learn new things together.
Transcript
Valuation Case Study on
Technics Oil & Gas
Disclaimer and Declaration
The objective of the presentation is for educational
purposes. The full content of the presentation is for
illustration purposes only and should not be used as
investment recommendations. AB Maximus and its
presenters are not responsible for all investment activities
conducted by the participants and cannot be held liable
for any investment loss.
The company and presenters may have personal interest
in the particular shares presented.
Agenda
Company Background 1
Industry Analysis 2
Valuation 3
Risk 4
Company Background
Technic Oil & Gas is in
the design and fabrication of process
modules and equipment
that are integrated
to form production and storage facilities for
O&G* exploration and production
Source: Company’s Annual Report 2012 *Oil & Gas
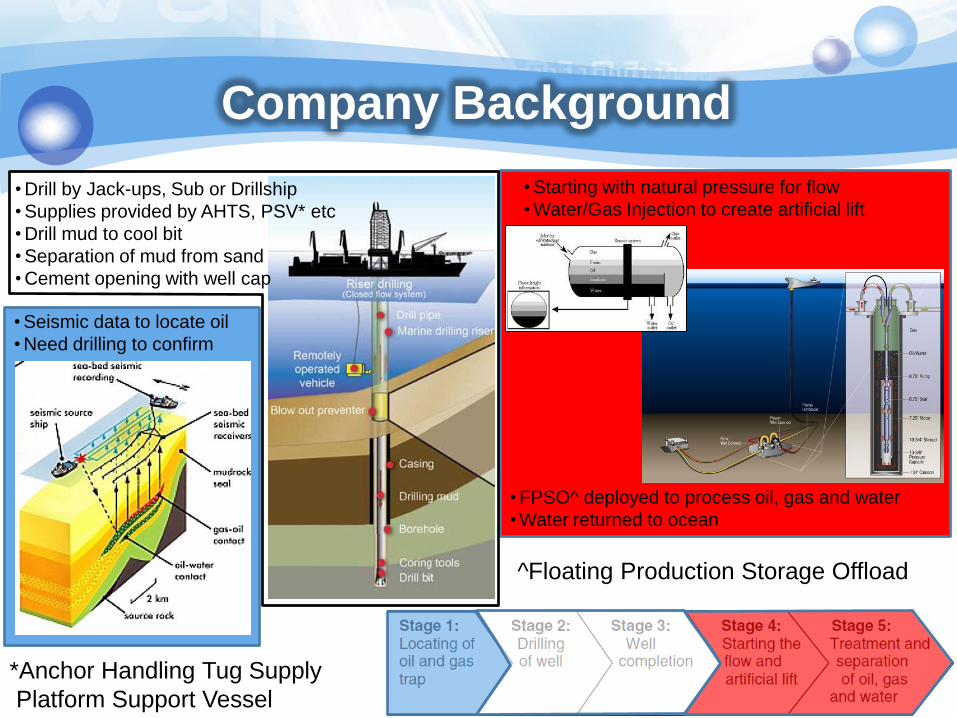
• Seismic data to locate oil
• Need drilling to confirm
• Drill by Jack-ups, Sub or Drillship
• Supplies provided by AHTS, PSV* etc
• Drill mud to cool bit
• Separation of mud from sand
• Cement opening with well cap
• Starting with natural pressure for flow
• Water/Gas Injection to create artificial lift
• FPSO^ deployed to process oil, gas and water
• Water returned to ocean
Company Background
^Floating Production Storage Offload
*Anchor Handling Tug Supply
Platform Support Vessel
Modules Source: Company’s Annual Report 2012
*
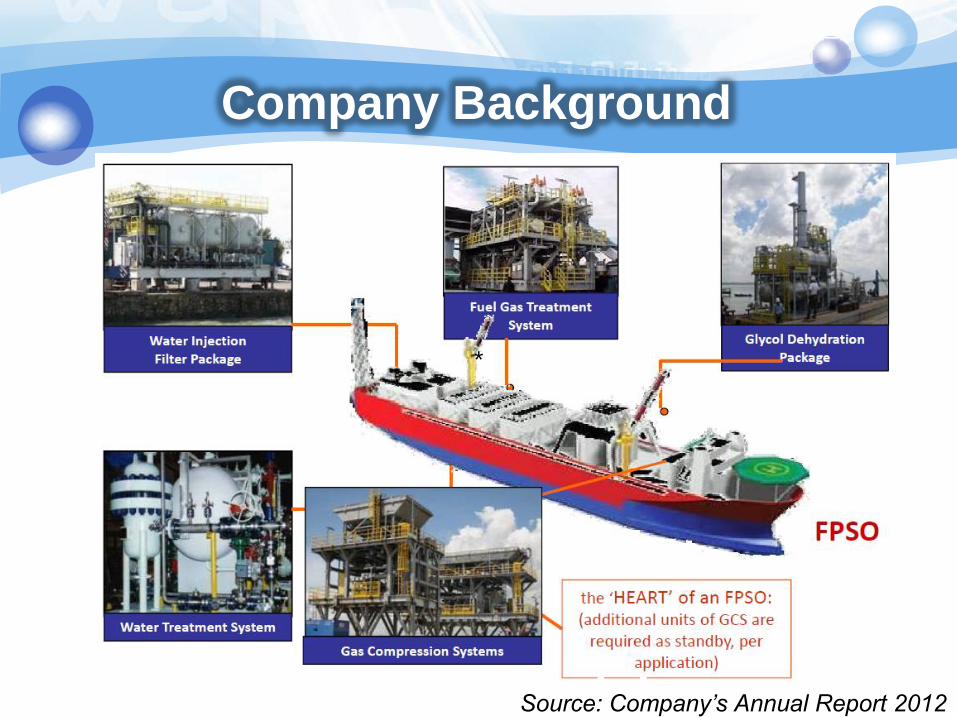
Company Background
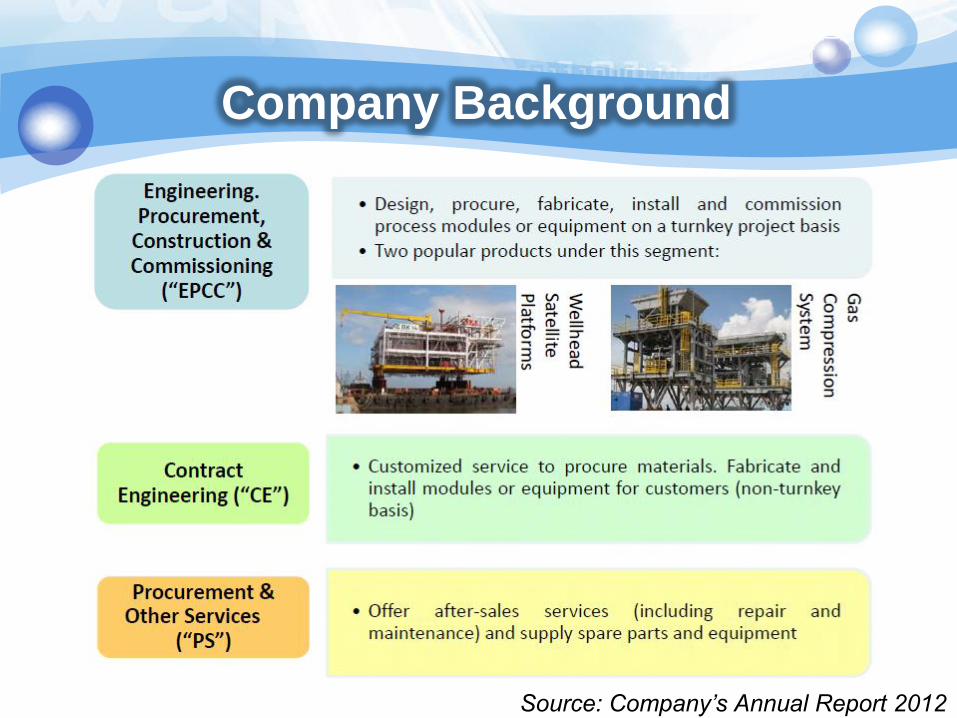
Company Background
Source: Company’s Annual Report 2012
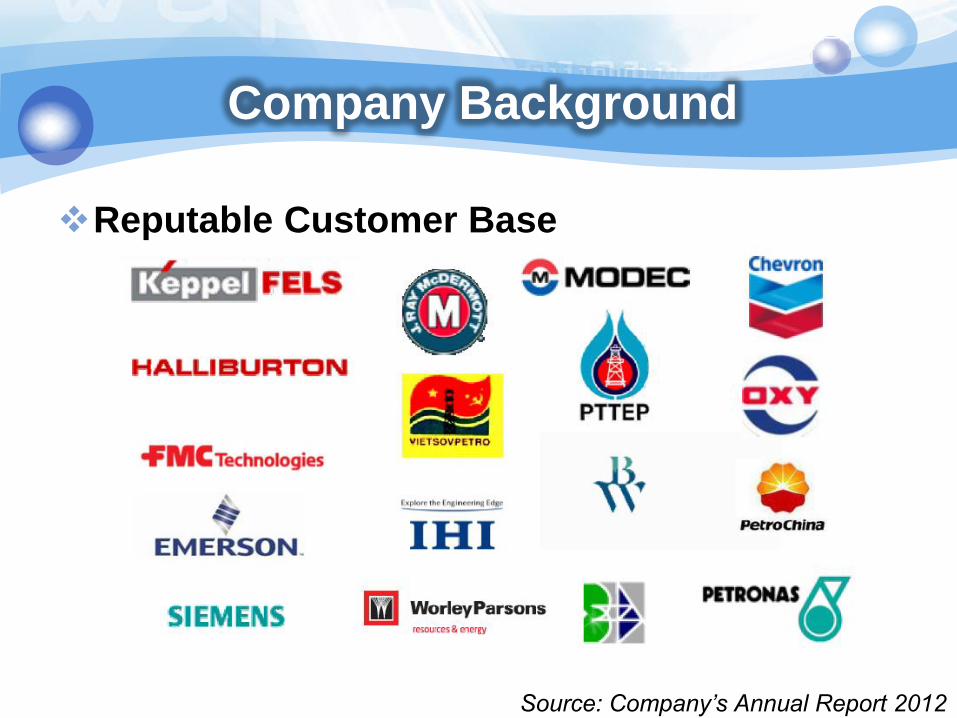
Company Background
Reputable Customer Base
Source: Company’s Annual Report 2012
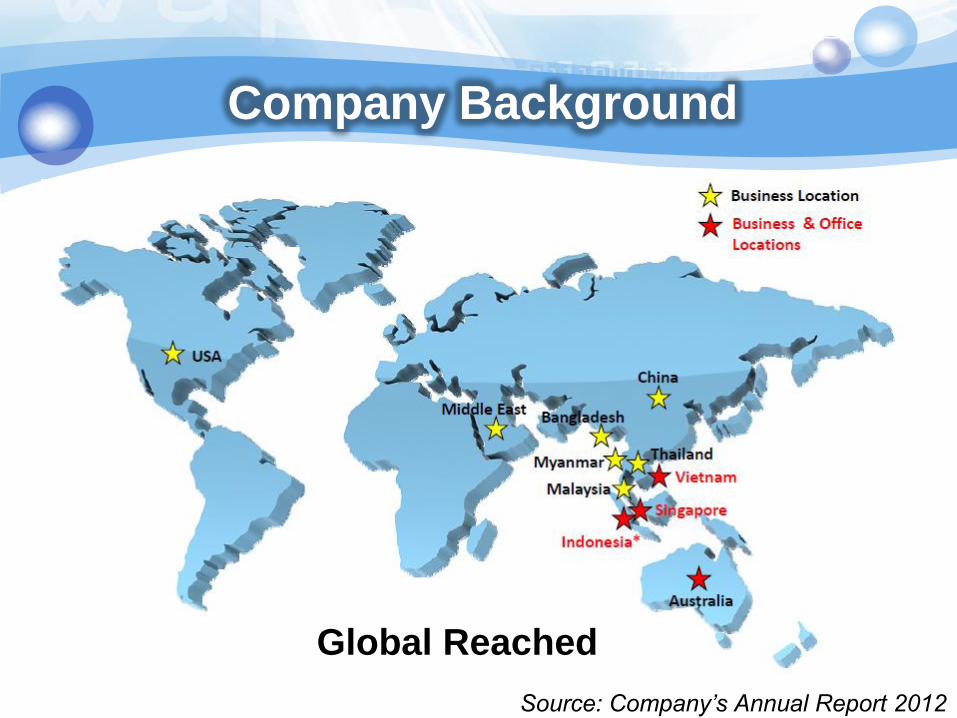
Company Background
Global Reached
Source: Company’s Annual Report 2012
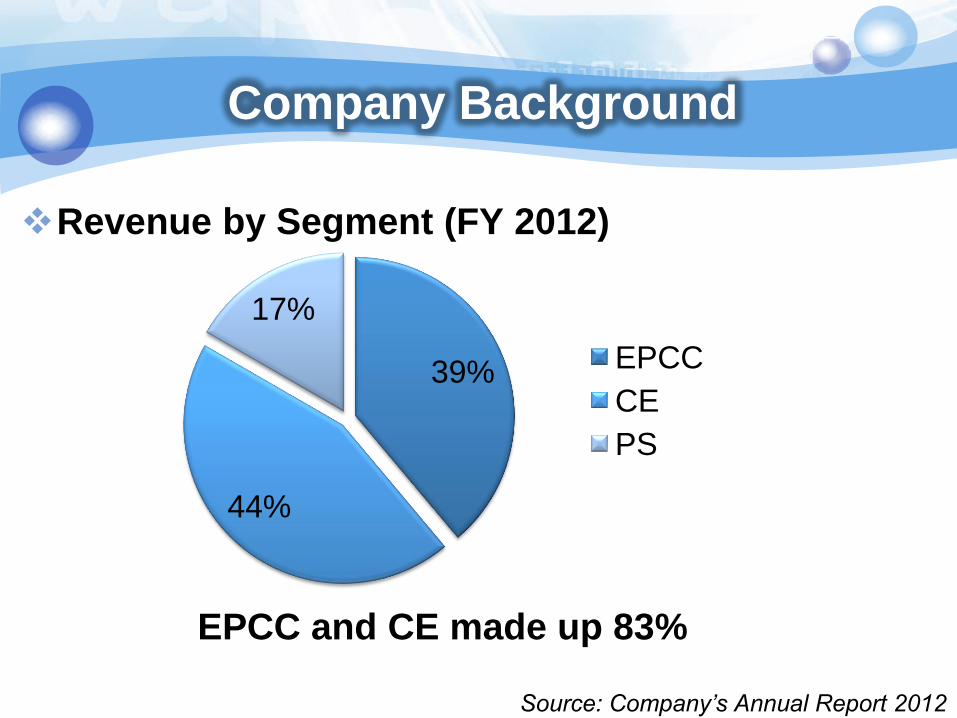
39%
44%
17%
EPCC
CE
PS
Company Background
Revenue by Segment (FY 2012)
EPCC and CE made up 83%
Source: Company’s Annual Report 2012
Company Background
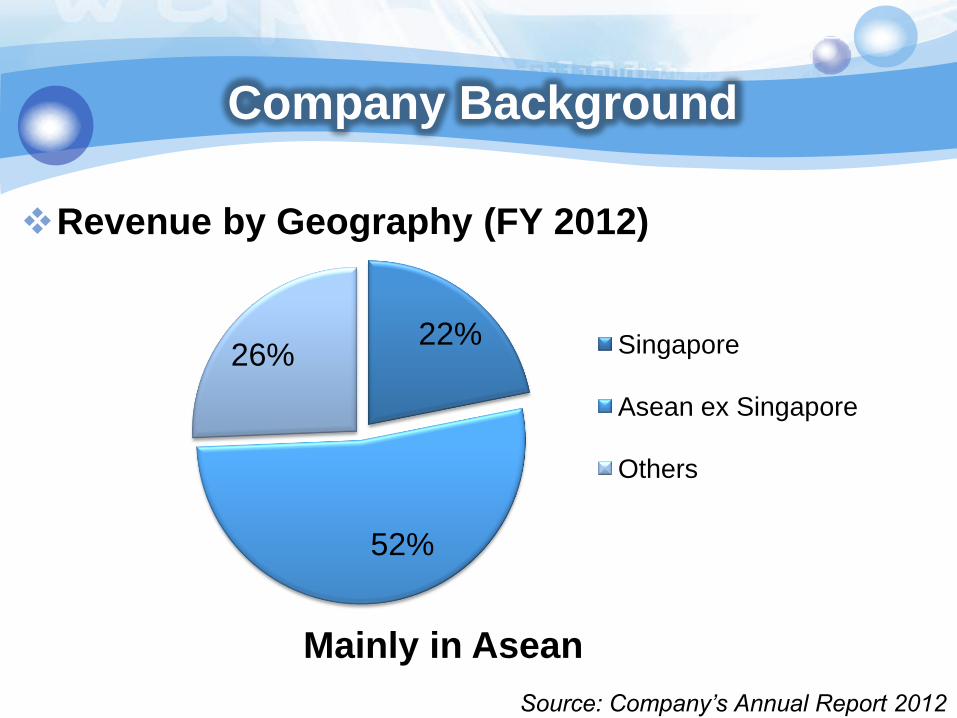
Revenue by Geography (FY 2012)
Mainly in Asean
Source: Company’s Annual Report 2012
22%
52%
26% Singapore
Asean ex Singapore
Others
Company Background
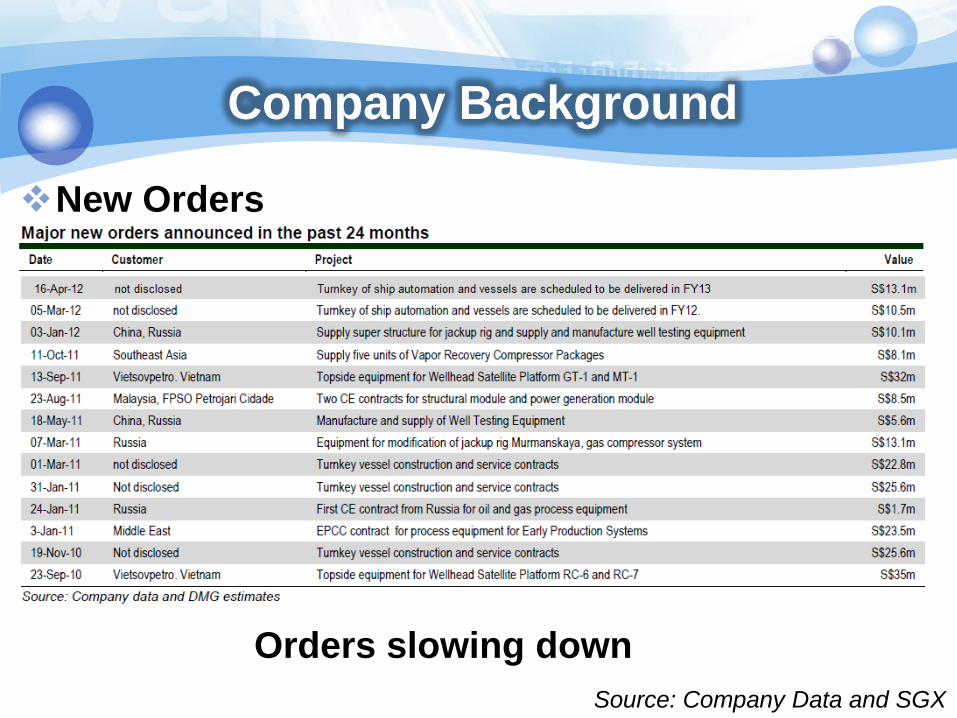
New Orders
Orders slowing down
Source: Company Data and SGX

Company Background
Potential synergy with Eversendai
Subcontracting of heavy jacket fabrication
Presence in Malaysia, tapping into Petronas capex
Strong business contact in Middle East
Acquisition of Vietnam yard (VOFE*)
Potential orders from Chevron, which has a 50-fixed-
platform investment plan there over the next 10 years
Source: Company Data and SGX *Vietnam Offshore Fabrication & Engineering Co
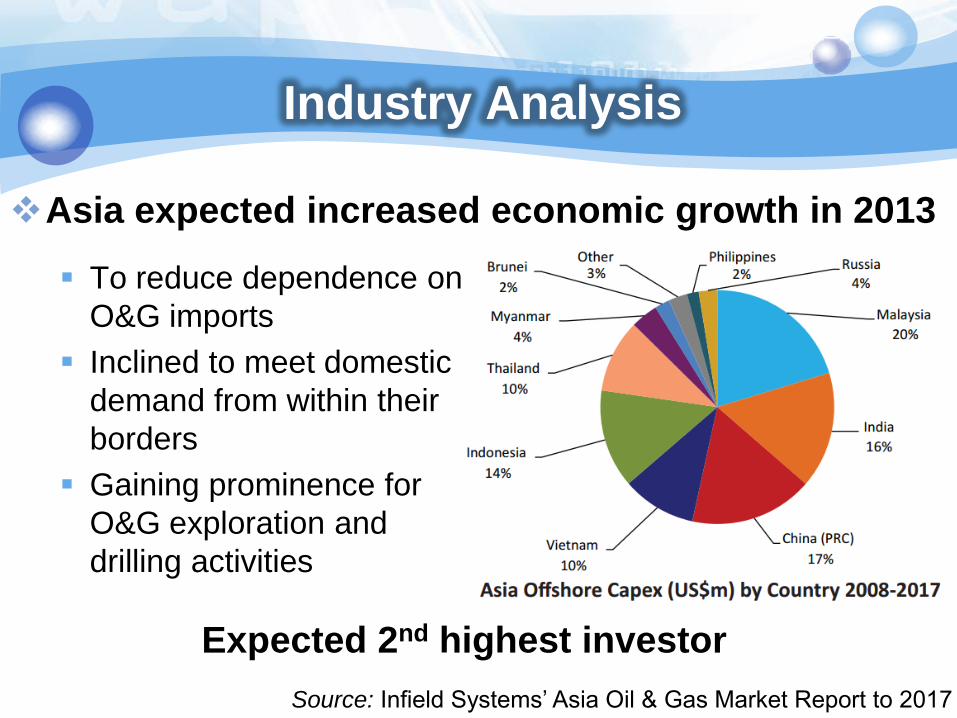
Industry Analysis
To reduce dependence on
O&G imports
Inclined to meet domestic
demand from within their
borders
Gaining prominence for
O&G exploration and
drilling activities
Source: Infield Systems’ Asia Oil & Gas Market Report to 2017
Expected 2nd highest investor
Asia expected increased economic growth in 2013
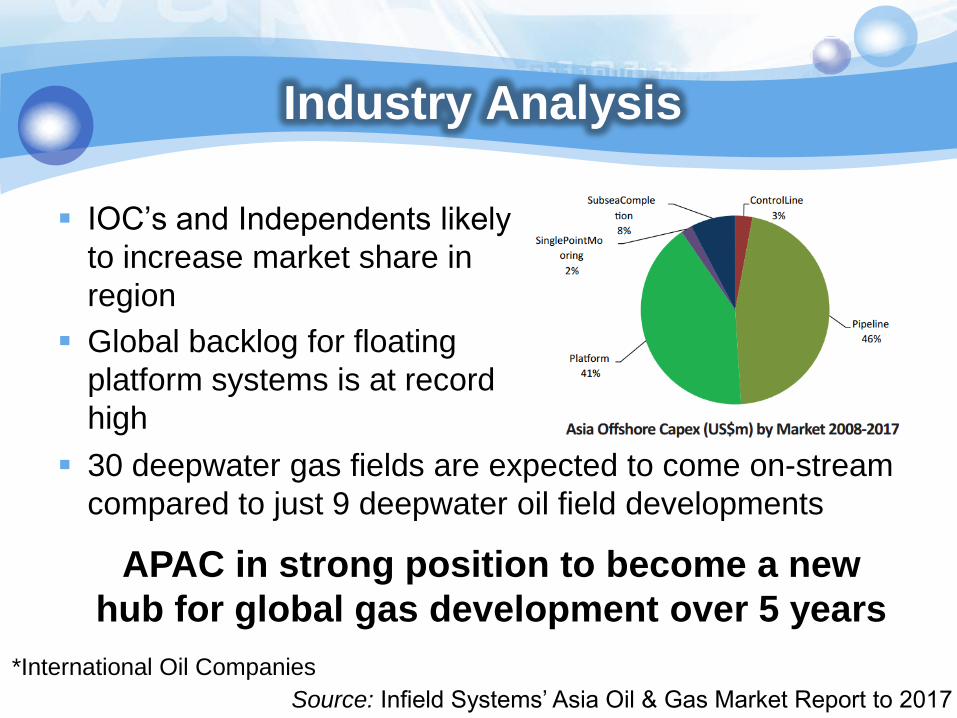
Industry Analysis
IOC’s and Independents likely
to increase market share in
region
Global backlog for floating
platform systems is at record
high
Source: Infield Systems’ Asia Oil & Gas Market Report to 2017
APAC in strong position to become a new
hub for global gas development over 5 years
30 deepwater gas fields are expected to come on-stream
compared to just 9 deepwater oil field developments
*International Oil Companies
Industry Analysis
Source: Company’s Annual Report 2012
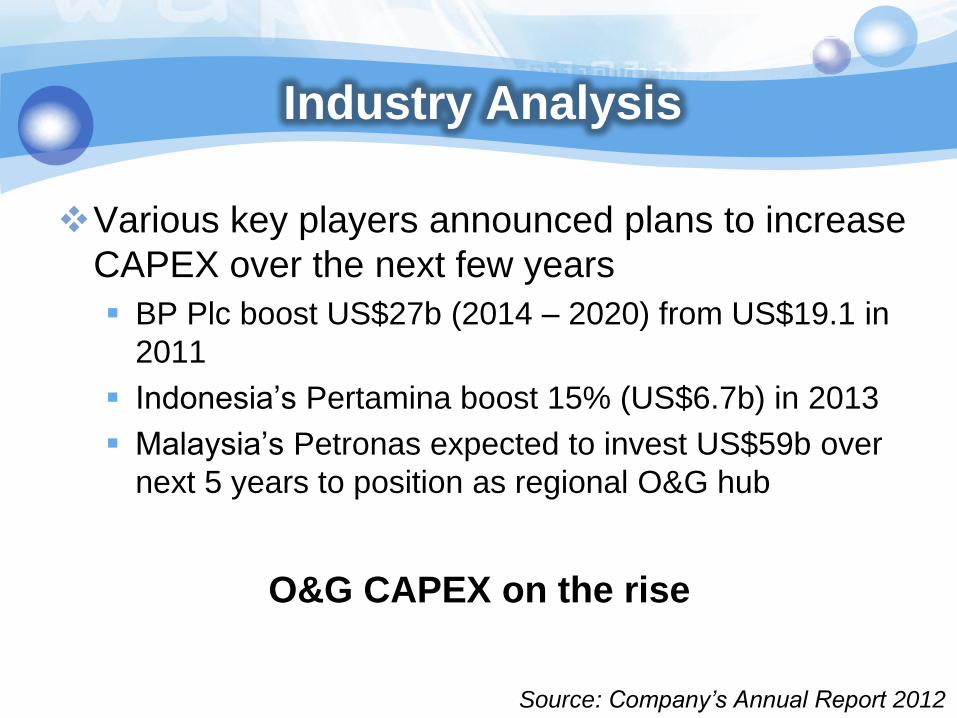
O&G CAPEX on the rise
Various key players announced plans to increase
CAPEX over the next few years
BP Plc boost US$27b (2014 – 2020) from US$19.1 in
2011
Indonesia’s Pertamina boost 15% (US$6.7b) in 2013
Malaysia’s Petronas expected to invest US$59b over
next 5 years to position as regional O&G hub
Valuation
Methodology
Discounted Free Cashflow to Firm (FCFF)*
Price to Earnings Ratio (PE)
Dividends Yield
* Project the future FCFF from business and discount to present value
Valuation
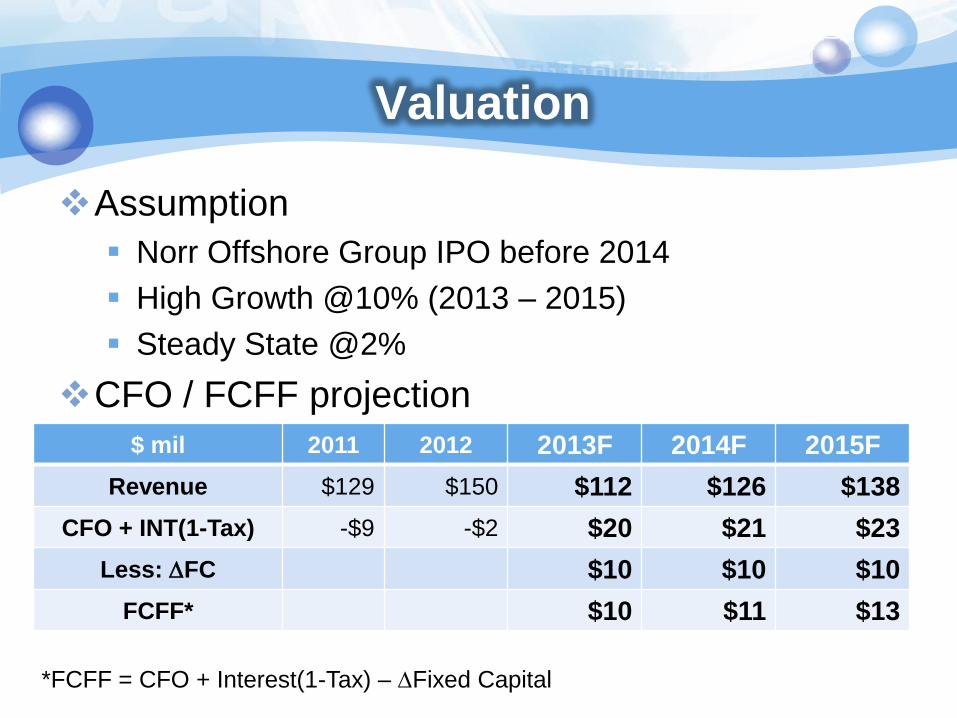
Assumption
Norr Offshore Group IPO before 2014
High Growth @10% (2013 – 2015)
Steady State @2%
CFO / FCFF projection
$ mil 2011 2012 2013F 2014F 2015F
Revenue $129 $150 $112 $126 $138
CFO + INT(1-Tax) -$9 -$2 $20 $21 $23
Less: DFC $10 $10 $10
FCFF* $10 $11 $13
*FCFF = CFO + Interest(1-Tax) – DFixed Capital
Valuation
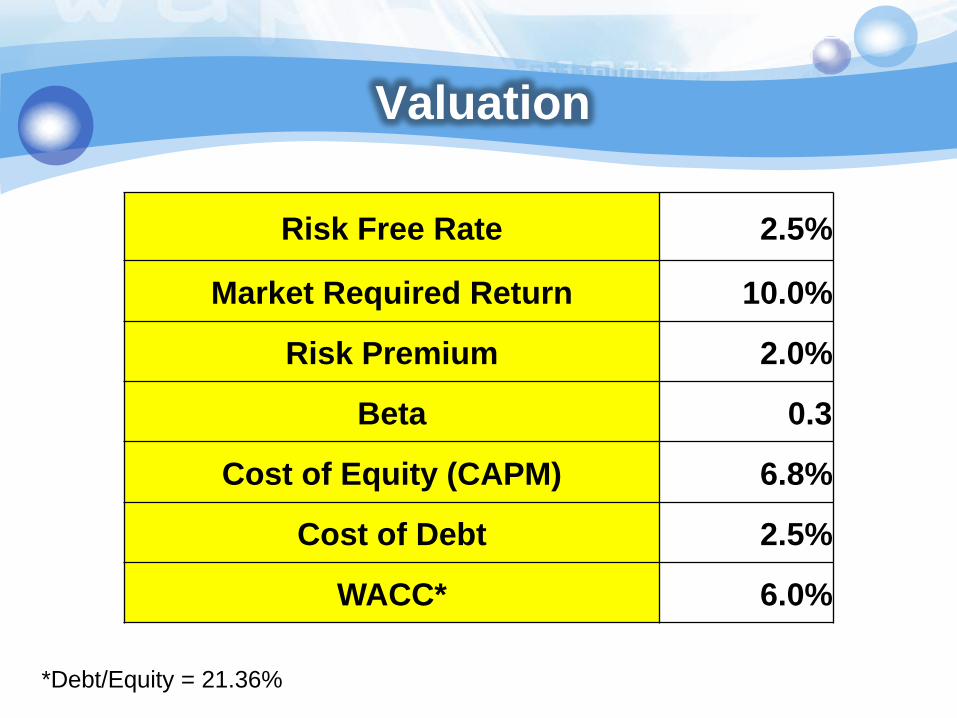
Risk Free Rate 2.5%
Market Required Return 10.0%
Risk Premium 2.0%
Beta 0.3
Cost of Equity (CAPM) 6.8%
Cost of Debt 2.5%
WACC* 6.0%
*Debt/Equity = 21.36%
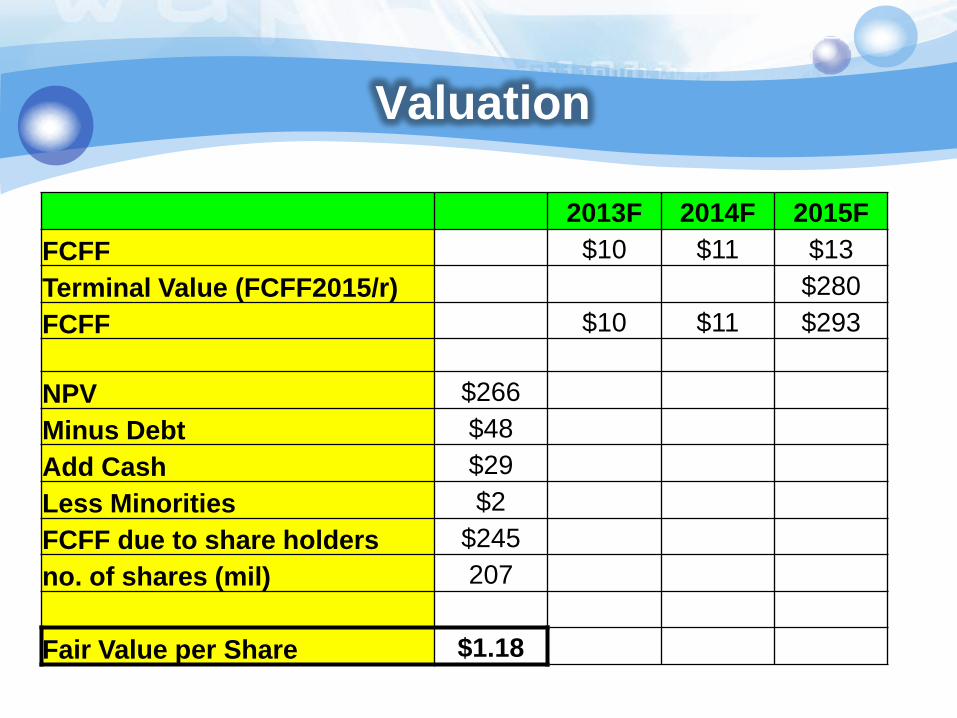
Valuation
2013F 2014F 2015F
FCFF $10 $11 $13
Terminal Value (FCFF2015/r) $280
FCFF $10 $11 $293
NPV $266
Minus Debt $48
Add Cash $29
Less Minorities $2
FCFF due to share holders $245
no. of shares (mil) 207
Fair Value per Share $1.18

Valuation
FCFF Valuation
Fair Value per share (est. at 1 Jan 2013)
$1.18
Current market value per share (as at 18 Jan 2013)
$1.035
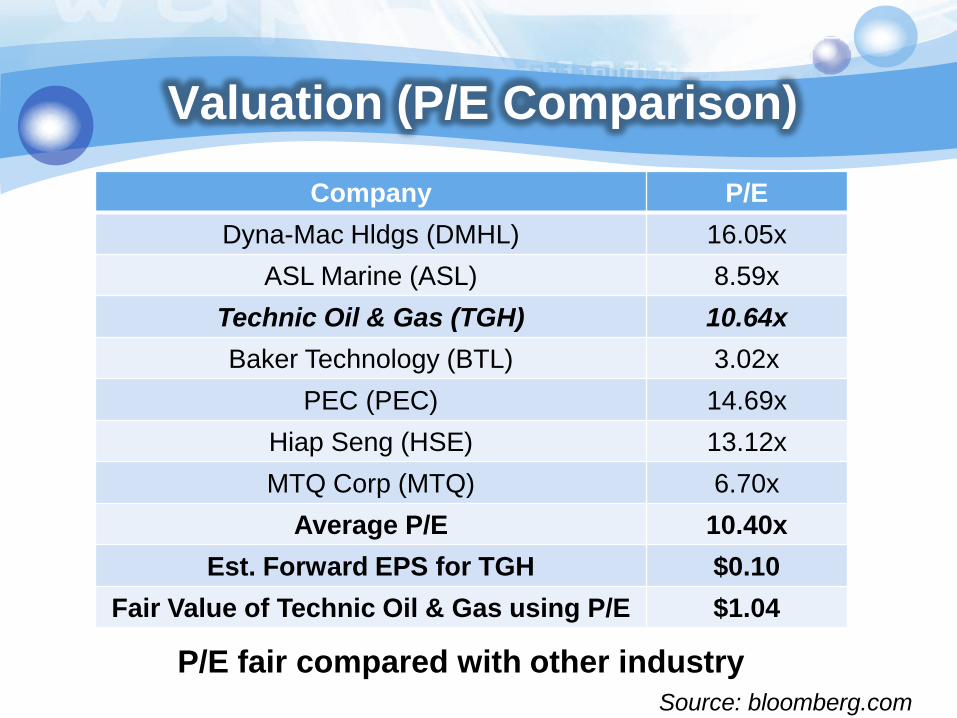
Valuation (P/E Comparison)
Company P/E
Dyna-Mac Hldgs (DMHL) 16.05x
ASL Marine (ASL) 8.59x
Technic Oil & Gas (TGH) 10.64x
Baker Technology (BTL) 3.02x
PEC (PEC) 14.69x
Hiap Seng (HSE) 13.12x
MTQ Corp (MTQ) 6.70x
Average P/E 10.40x
Est. Forward EPS for TGH $0.10
Fair Value of Technic Oil & Gas using P/E $1.04
Source: bloomberg.com
P/E fair compared with other industry
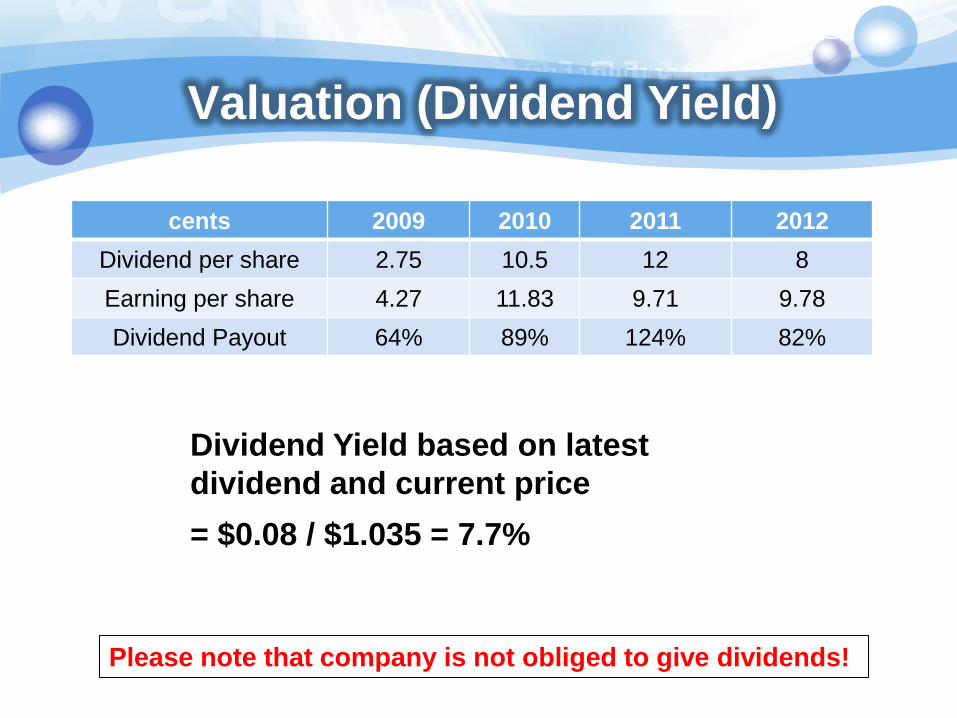
Valuation (Dividend Yield)
cents 2009 2010 2011 2012
Dividend per share 2.75 10.5 12 8
Earning per share 4.27 11.83 9.71 9.78
Dividend Payout 64% 89% 124% 82%
Dividend Yield based on latest
dividend and current price
= $0.08 / $1.035 = 7.7%
Please note that company is not obliged to give dividends!
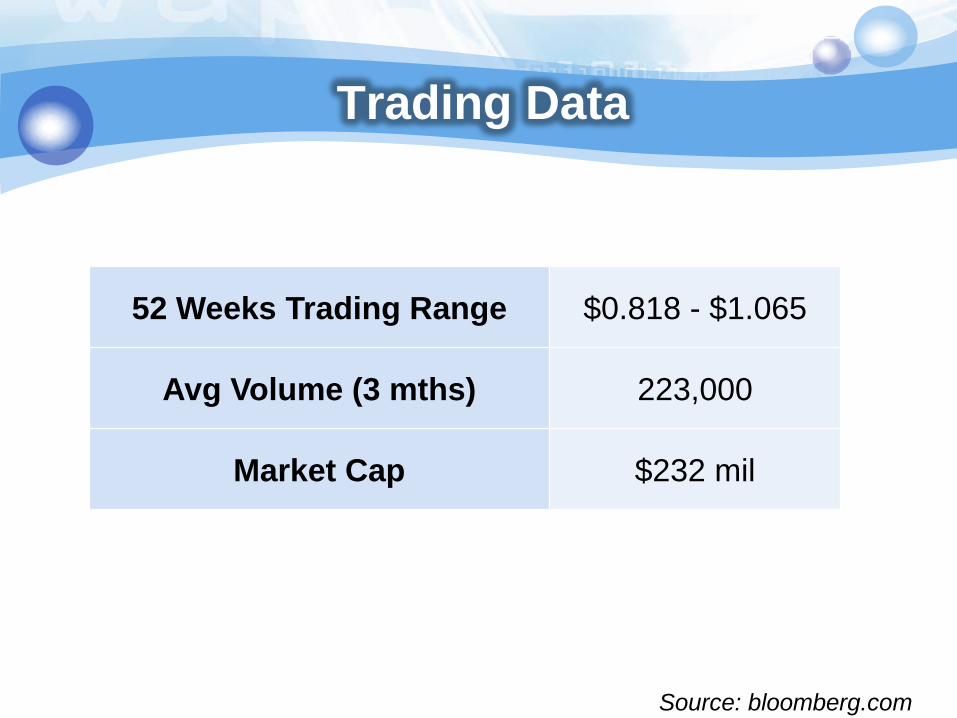
Trading Data
52 Weeks Trading Range $0.818 - $1.065
Avg Volume (3 mths) 223,000
Market Cap $232 mil
Source: bloomberg.com
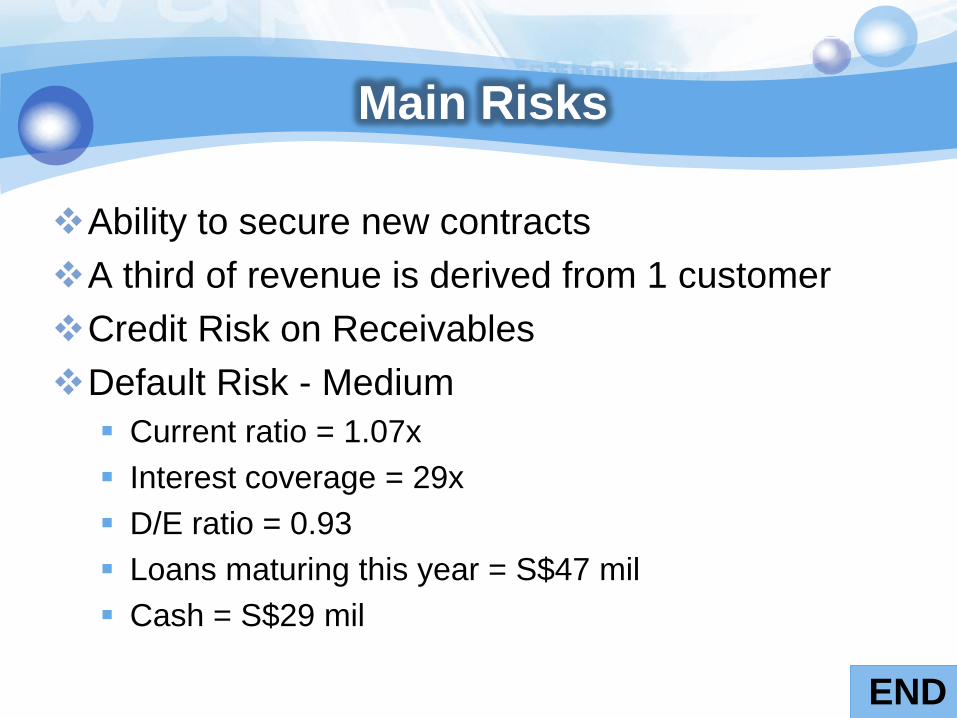
Main Risks
Ability to secure new contracts
A third of revenue is derived from 1 customer
Credit Risk on Receivables
Default Risk - Medium
Current ratio = 1.07x
Interest coverage = 29x
D/E ratio = 0.93
Loans maturing this year = S$47 mil
Cash = S$29 mil
END
Related Documents