OCTOBER 2003 1355 NICHOLSON ET AL. q 2003 American Meteorological Society Validation of TRMM and Other Rainfall Estimates with a High-Density Gauge Dataset for West Africa. Part II: Validation of TRMM Rainfall Products S. E. NICHOLSON, a B. SOME, b J. MCCOLLUM, c E. NELKIN, d D. KLOTTER, a Y. BERTE, e B. M. DIALLO, f I. GAYE, g G. KPABEBA, h O. NDIAYE, i J. N. NOUKPOZOUNKOU, j M. M. TANU, k A. THIAM, l A. A. TOURE, m, * AND A. K. TRAORE n a Department of Meteorology, The Florida State University, Tallabassee, Florida b Centre Re ´gional AGRHYMET, Niamey, Niger, and Service Me ´te ´orologique Nationale, Ouagadougou, Burkina Faso c NOAA/NESDIS/ORA, Camp Springs, Maryland d NASA Goddard Space Flight Center, Greenbelt, Maryland e SODEXAM/Direction Me ´te ´orologie Nationale, Abidjan, Ivory Coast f Direction Nationale de la Me ´te ´orologie, Conakry, Guinea g Department of Water Resources, Banjul, Gambia h Direction de la Me ´te ´orologie Nationale, Lome ´, Togo i Direction Nationale de la Me ´te ´orologie, Dakar, Senegal j Direction de la Me ´te ´orologie Nationale, Cotonou, Benin k Meteorological Services Department, Legon-Accra, Gbana l Arizona Remote Sensing Center, Office of Arid Lands Studies, The University of Arizona, Tucson, Arizona m Direction Nationale de la Me ´te ´orologie, Bamako, Mali n Service Climatologique, Direction de la Me ´te ´orologie Nationale, Niamey, Niger (Manuscript received 13 March 2002, in final form 15 March 2003) ABSTRACT Gauge data from a West African network of 920 stations are used to assess Tropical Rainfall Measuring Mission (TRMM) satellite and blended rainfall products for 1998. In this study, mean fields, scattergrams, and latitudinal transects for the months of May–September and for the 5-month season are presented. Error statistics are also calculated. This study demonstrates that both the TRMM-adjusted Geostationary Observational Envi- ronmental Satellite precipitation index (AGPI) and TRMM-merged rainfall products show excellent agreement with gauge data over West Africa on monthly-to-seasonal timescales and 2.583 2.58 latitude/longitude space scales. The root-mean-square error of both is on the order of 0.6 mm day 21 at seasonal resolution and 1 mm day 21 at monthly resolution. The bias of the AGPI is only 0.2 mm day 21 , whereas the TRMM-merged product shows no bias over West Africa. Performance at 1.083 1.08 latitude/longitude resolution is also excellent at the seasonal scale and good for the monthly scale. A comparison with standard rainfall products that predate TRMM shows that AGPI and the TRMM-merged product perform as well as, or better than, those products. The AGPI shows marked improvement when compared with the GPI, in reducing the bias and in the scatter of the estimates. The TRMM satellite-only products from the precipitation radar and the TRMM Microwave Imager do not perform well over West Africa. Both tend to overestimate gauge measurements. 1. Introduction This article is the second of two articles that describe a joint Africa–U.S. project to validate satellite rain es- timates and other rainfall products by using a high-res- olution gauge dataset for West Africa. The gauge data were assembled as a workshop, held at The Florida State University, which included representatives of 11 West African nations. Data were obtained for over 1000 gaug- * Deceased. Corresponding author address: Dr. Sharon Nicholson, Dept. of Meteorology, The Florida State University, Tallahassee, FL 32306. E-mail: [email protected] es, roughly 10 times the number that are available in standard archives such as the Global Precipitation Cli- matology Project (GPCP) or the National Climatic Data Center dataset. These data have demonstrated both the quantity and quality of West African climate data avail- able for research purposes. The state-of-the-art global precipitation estimates are those of the GPCP (Huffman et al. 1997). GPCP pro- duces a blended product in which Special Sensor Mi- crowave Imager (SSM/I) observations are used to adjust rainfall estimates from infrared (IR) measurements on geostationary satellites (geo-IR). The adjusted estimates are further combined with gauge data to produce the GPCP, version 1, blended product. The Global Precip- itation Climatology Center (GPCC) in Offenbach, Ger-

Welcome message from author
This document is posted to help you gain knowledge. Please leave a comment to let me know what you think about it! Share it to your friends and learn new things together.
Transcript
OCTOBER 2003 1355N I C H O L S O N E T A L .
q 2003 American Meteorological Society
Validation of TRMM and Other Rainfall Estimates with a High-Density Gauge Datasetfor West Africa. Part II: Validation of TRMM Rainfall Products
S. E. NICHOLSON,a B. SOME,b J. MCCOLLUM,c E. NELKIN,d D. KLOTTER,a Y. BERTE,e B. M. DIALLO,f I. GAYE,g
G. KPABEBA,h O. NDIAYE,i J. N. NOUKPOZOUNKOU,j M. M. TANU,k A. THIAM,l A. A. TOURE,m,*AND A. K. TRAOREn
aDepartment of Meteorology, The Florida State University, Tallabassee, FloridabCentre Regional AGRHYMET, Niamey, Niger, and Service Meteorologique Nationale, Ouagadougou, Burkina Faso
cNOAA/NESDIS/ORA, Camp Springs, MarylanddNASA Goddard Space Flight Center, Greenbelt, Maryland
eSODEXAM/Direction Meteorologie Nationale, Abidjan, Ivory CoastfDirection Nationale de la Meteorologie, Conakry, Guinea
gDepartment of Water Resources, Banjul, GambiahDirection de la Meteorologie Nationale, Lome, Togo
iDirection Nationale de la Meteorologie, Dakar, SenegaljDirection de la Meteorologie Nationale, Cotonou, Benin
kMeteorological Services Department, Legon-Accra, GbanalArizona Remote Sensing Center, Office of Arid Lands Studies, The University of Arizona, Tucson, Arizona
mDirection Nationale de la Meteorologie, Bamako, MalinService Climatologique, Direction de la Meteorologie Nationale, Niamey, Niger
(Manuscript received 13 March 2002, in final form 15 March 2003)
ABSTRACT
Gauge data from a West African network of 920 stations are used to assess Tropical Rainfall MeasuringMission (TRMM) satellite and blended rainfall products for 1998. In this study, mean fields, scattergrams, andlatitudinal transects for the months of May–September and for the 5-month season are presented. Error statisticsare also calculated. This study demonstrates that both the TRMM-adjusted Geostationary Observational Envi-ronmental Satellite precipitation index (AGPI) and TRMM-merged rainfall products show excellent agreementwith gauge data over West Africa on monthly-to-seasonal timescales and 2.58 3 2.58 latitude/longitude spacescales. The root-mean-square error of both is on the order of 0.6 mm day21 at seasonal resolution and 1 mmday21 at monthly resolution. The bias of the AGPI is only 0.2 mm day21, whereas the TRMM-merged productshows no bias over West Africa. Performance at 1.08 3 1.08 latitude/longitude resolution is also excellent atthe seasonal scale and good for the monthly scale. A comparison with standard rainfall products that predateTRMM shows that AGPI and the TRMM-merged product perform as well as, or better than, those products.The AGPI shows marked improvement when compared with the GPI, in reducing the bias and in the scatter ofthe estimates. The TRMM satellite-only products from the precipitation radar and the TRMM Microwave Imagerdo not perform well over West Africa. Both tend to overestimate gauge measurements.
1. Introduction
This article is the second of two articles that describea joint Africa–U.S. project to validate satellite rain es-timates and other rainfall products by using a high-res-olution gauge dataset for West Africa. The gauge datawere assembled as a workshop, held at The Florida StateUniversity, which included representatives of 11 WestAfrican nations. Data were obtained for over 1000 gaug-
* Deceased.
Corresponding author address: Dr. Sharon Nicholson, Dept. ofMeteorology, The Florida State University, Tallahassee, FL 32306.E-mail: [email protected]
es, roughly 10 times the number that are available instandard archives such as the Global Precipitation Cli-matology Project (GPCP) or the National Climatic DataCenter dataset. These data have demonstrated both thequantity and quality of West African climate data avail-able for research purposes.
The state-of-the-art global precipitation estimates arethose of the GPCP (Huffman et al. 1997). GPCP pro-duces a blended product in which Special Sensor Mi-crowave Imager (SSM/I) observations are used to adjustrainfall estimates from infrared (IR) measurements ongeostationary satellites (geo-IR). The adjusted estimatesare further combined with gauge data to produce theGPCP, version 1, blended product. The Global Precip-itation Climatology Center (GPCC) in Offenbach, Ger-

1356 VOLUME 42J O U R N A L O F A P P L I E D M E T E O R O L O G Y
FIG. 1. Grid boxes with adequate gauge data for select satellite–gauge comparisons. Light shading indicates 2.58 3 2.58 boxes withfive or more gauges; number of gauges in each box is indicated.
FIG. 2. Grid boxes with adequate gauge data for select satellite–gauge comparisons: 18 3 18 grid boxes with five or more gauges(dark shading), four gauges (medium shading), and two or three gaug-es per grid box (light shading).
many, provides the gauge data used for this product(Rudolf et al. 1994), but over Africa the sampling isvery limited spatially and reporting is erratic in time.Neither the GPCP, version 1, product nor the GPCCgauge analysis had been validated over Africa.
In Nicholson et al. (2003, hereinafter Part I), we usedthe high-resolution gauge dataset assembled at the work-shop to validate both the GPCP and the GPCC gaugeanalyses for 1998. A multiyear validation was also con-ducted using an archive with fewer stations than theworkshop provided but far more than are available inthe GPCC archive. Similar validation was done for theinfrared-based Geostationary Operational Environmen-tal Satellite precipitation index (GPI; Arkin and Meisner1987) and the microwave-based product derived fromthe SSM/I (Ferraro 1997).
Although Tropical Rainfall Measuring Mission(TRMM) precipitation products have been extensivelyvalidated at ground sites around the world, none of thesesites lies in Africa. The closest is in Israel, where theMediterranean climate contrasts strongly with the cli-mates over roughly 95% of Africa. In fact, the physical–dynamical processes that produce precipitation overmost of Africa are considerably different than those thatprevail at any of the ground validation sites. Thus, aspecific validation for Africa is needed to ensure con-fidence in the TRMM estimates for this region. Here,in this article, such validation is done by comparing theworkshop gauge data with five TRMM rainfall products.Because of the time lag caused by data assemblage andquality control in the national meteorological services,at the time of the workshop rainfall data were availableonly for 1998. Hence, the validation is limited to thisyear.
2. Data and method
a. Gauge data
Detailed information on the workshop, the thereby-acquired gauge dataset, and data processing is presentedin Part I. The workshop gauge dataset is used as a ref-erence in estimating the error in the rainfall estimates
from various TRMM products. It is acknowledged thatboth gauge- and satellite-based estimates have nonne-gligible errors (Morrissey and Greene 1993; Sevruk1982; Legates and Willmott 1990; Rudolf et al. 1994;Morrissey et al. 1995; Huffman et al. 1995, 1997). Xieand Arkin (1995), however, concluded that the randomerrors in the gauge data are small when compared withthe bias in satellite estimates, if an adequate number ofgauges is used. Their results suggested that when fiveor more gauges are available in a 2.58 3 2.58 latitude/longitude grid box, the error of the areal averages fromthe gauges is about 10% or less.
Using that as a criterion for validation, we have iden-tified 40 2.58 3 2.58 grid boxes with five or more ref-erence gauges. Figure 1 shows these, together with thetotal number of gauges in each grid. Most grid boxescontain 10–50 gauges, and some contain over 90 sta-tions, so that an excellent spatial average could be pro-duced. This permits us to make the assumption that thebias in the spatial averages of gauge data is relativelysmall, allowing the bias and random error of the sat-ellite-based rainfall estimates to be adequately approx-imated. This assumption is further justified in Part I.
To grid the data, a straightforward arithmetic averageof all stations in each grid box was used. Then twoinitial approaches to contouring of precipitation fieldswere considered, fast Fourier transform (FFT; NCAR1993) and a ‘‘nearest neighbor’’ method. The formerutilizes a curve-fitting program based on FFTs. The lat-ter interprets a grid box’s value based on a weightedsum of values at local, neighboring points. We testedthe sensitivity of the analysis to the method chosen byproducing latitudinal transects for a 7-yr period withlow station density and comparing these with a transectof the long-term mean derived from a far greater numberof stations. The transects derived from the FFT routineand the nearest-neighbor method were very similar.However, in both cases, there were problems at theboundaries and in areas of very high gradients. In gen-eral, the differences were relatively small except in areaswhere the station network is very sparse (or at theboundaries). The comparison with the long-term mean
OCTOBER 2003 1357N I C H O L S O N E T A L .
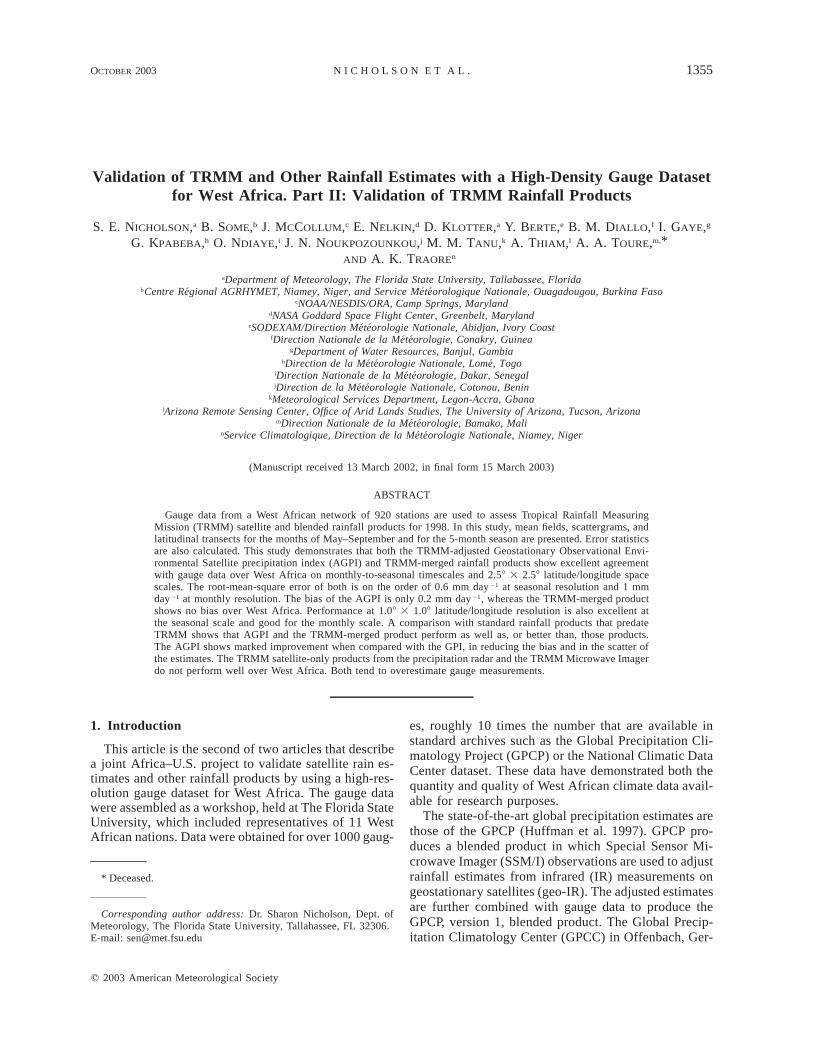
FIG. 3. Rainfall in (left) Aug 1998 and (right) for the May–Sep season of 1998, based on finescale (18 3 18) AGPI data.
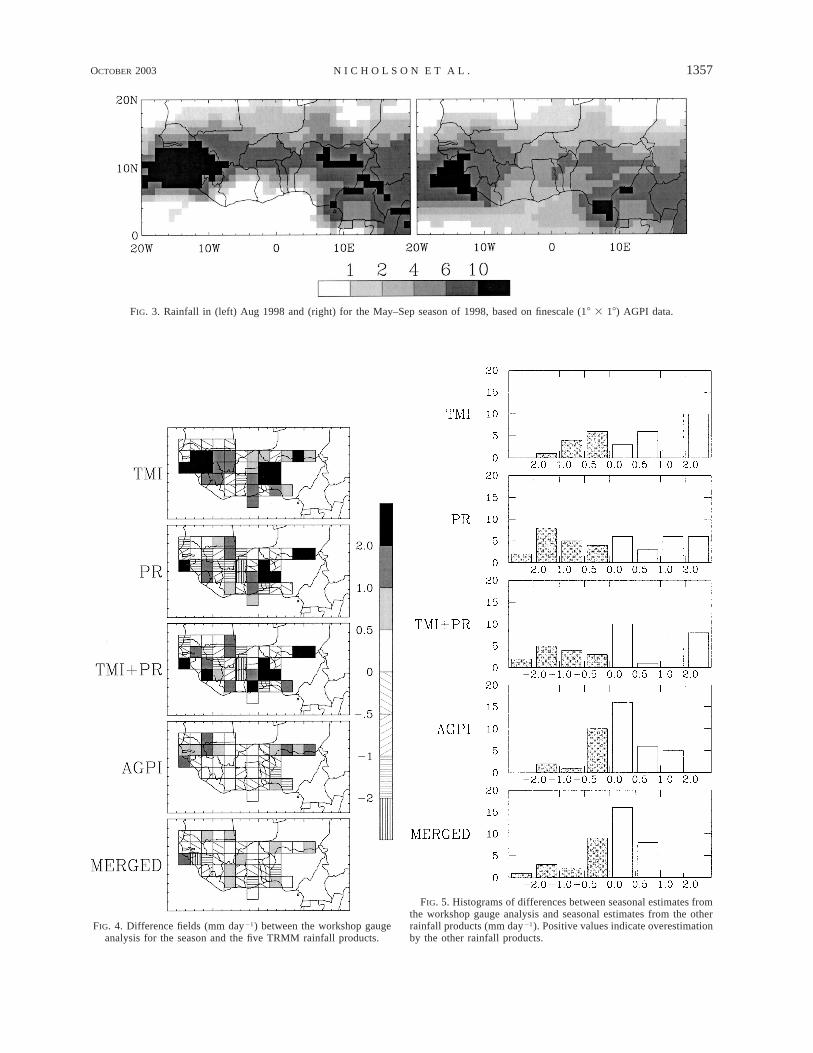
FIG. 4. Difference fields (mm day21) between the workshop gaugeanalysis for the season and the five TRMM rainfall products.
FIG. 5. Histograms of differences between seasonal estimates fromthe workshop gauge analysis and seasonal estimates from the otherrainfall products (mm day21). Positive values indicate overestimationby the other rainfall products.
1358 VOLUME 42J O U R N A L O F A P P L I E D M E T E O R O L O G Y
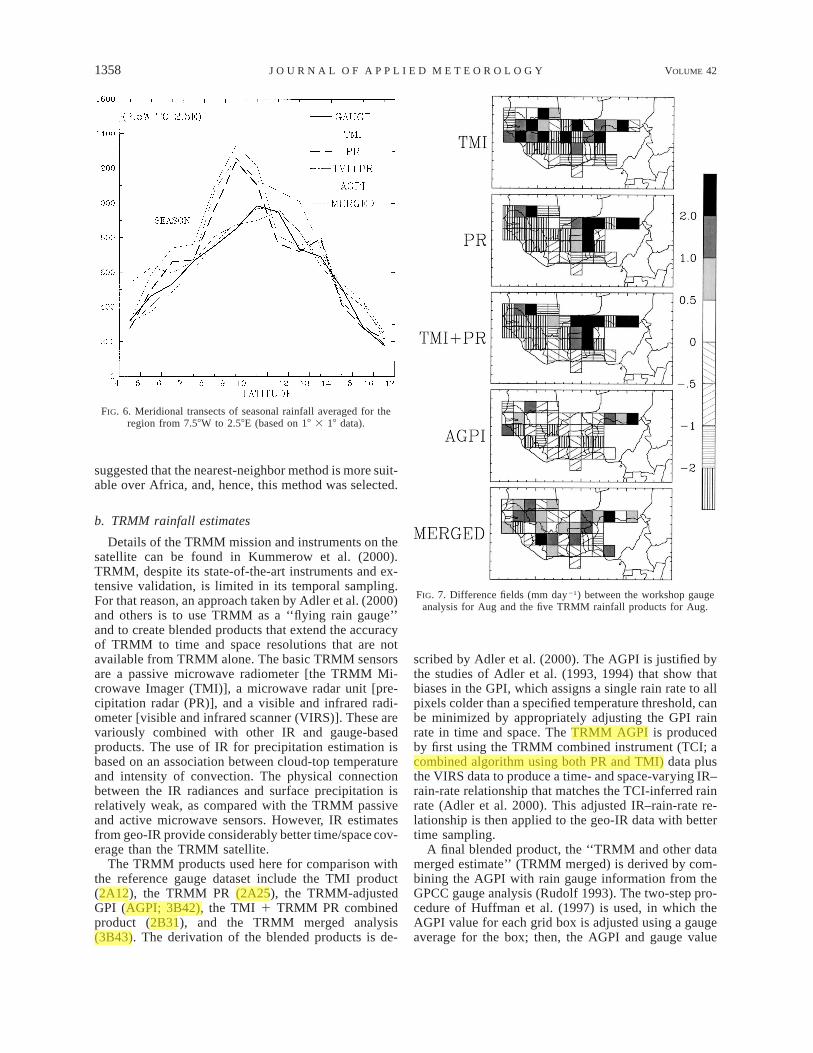
FIG. 6. Meridional transects of seasonal rainfall averaged for theregion from 7.58W to 2.58E (based on 18 3 18 data).
FIG. 7. Difference fields (mm day21) between the workshop gaugeanalysis for Aug and the five TRMM rainfall products for Aug.
suggested that the nearest-neighbor method is more suit-able over Africa, and, hence, this method was selected.
b. TRMM rainfall estimates
Details of the TRMM mission and instruments on thesatellite can be found in Kummerow et al. (2000).TRMM, despite its state-of-the-art instruments and ex-tensive validation, is limited in its temporal sampling.For that reason, an approach taken by Adler et al. (2000)and others is to use TRMM as a ‘‘flying rain gauge’’and to create blended products that extend the accuracyof TRMM to time and space resolutions that are notavailable from TRMM alone. The basic TRMM sensorsare a passive microwave radiometer [the TRMM Mi-crowave Imager (TMI)], a microwave radar unit [pre-cipitation radar (PR)], and a visible and infrared radi-ometer [visible and infrared scanner (VIRS)]. These arevariously combined with other IR and gauge-basedproducts. The use of IR for precipitation estimation isbased on an association between cloud-top temperatureand intensity of convection. The physical connectionbetween the IR radiances and surface precipitation isrelatively weak, as compared with the TRMM passiveand active microwave sensors. However, IR estimatesfrom geo-IR provide considerably better time/space cov-erage than the TRMM satellite.
The TRMM products used here for comparison withthe reference gauge dataset include the TMI product(2A12), the TRMM PR (2A25), the TRMM-adjustedGPI (AGPI; 3B42), the TMI 1 TRMM PR combinedproduct (2B31), and the TRMM merged analysis(3B43). The derivation of the blended products is de-
scribed by Adler et al. (2000). The AGPI is justified bythe studies of Adler et al. (1993, 1994) that show thatbiases in the GPI, which assigns a single rain rate to allpixels colder than a specified temperature threshold, canbe minimized by appropriately adjusting the GPI rainrate in time and space. The TRMM AGPI is producedby first using the TRMM combined instrument (TCI; acombined algorithm using both PR and TMI) data plusthe VIRS data to produce a time- and space-varying IR–rain-rate relationship that matches the TCI-inferred rainrate (Adler et al. 2000). This adjusted IR–rain-rate re-lationship is then applied to the geo-IR data with bettertime sampling.
A final blended product, the ‘‘TRMM and other datamerged estimate’’ (TRMM merged) is derived by com-bining the AGPI with rain gauge information from theGPCC gauge analysis (Rudolf 1993). The two-step pro-cedure of Huffman et al. (1997) is used, in which theAGPI value for each grid box is adjusted using a gaugeaverage for the box; then, the AGPI and gauge value
hongjie.xie
Highlight
hongjie.xie
Highlight
hongjie.xie
Highlight
hongjie.xie
Highlight
hongjie.xie
Highlight
hongjie.xie
Highlight
hongjie.xie
Highlight

OCTOBER 2003 1359N I C H O L S O N E T A L .
FIG. 8. Histograms of differences between Aug estimates from theworkshop gauge analysis and estimates from the other rainfall prod-ucts (mm day21). Positive values indicate overestimation by the otherrainfall products.
FIG. 9. Meridional transects of Aug rainfall averaged for the regionfrom 7.58W to 2.58E (based on 18 3 18 data).
are combined, using a weighting factor inversely pro-portional to the error of the two products. Here, thegauge data used as a reference are almost independentof that in the GPCC analysis, because the number ofstations in the former (roughly 920) is so much largerthan the number in the latter (roughly 75). Furthermore,many of the gauges used for the GPCC analysis did notreport every day of the month. Therefore, the gaugedataset assembled at the workshop provided a nearlyindependent validation of the TRMM-merged product.
The TRMM rainfall products evaluated here cannotbe expected to provide results that are identical to thegauge estimates because of differences in temporal andspatial sampling. The most obvious contrasts are thatgauges give point measurements while satellites producespatial averages and that TRMM actually ‘‘sees’’ each
site for only a limited period of time. The time is sobrief that TRMM alone cannot establish the diurnal cy-cle. These sampling issues are beyond the scope of thiswork, which takes an operational perspective. We aremerely answering the question, ‘‘Will product X giveme a reasonably good picture of the rainfall field overWest Africa, as assessed from gauge data?’’
3. Data processing and analysis
Validation was limited to the rainy-season months ofMay–September, because of limited data availability inthe remaining months. Two kinds of validation exerciseswere carried out. In the first, the mean rainfall fields forAugust and for the 5-month season were compared forvarious TRMM products. August was selected as anexample at the monthly scale, because it is the wettestmonth throughout most of the analysis region. The re-sults are presented as difference maps and latitudinaltransects. The latter, averaged over 108 of longitude andcentered on 2.58W, facilitated the comparison of gra-dients and magnitudes in the products. For these, thenumber of required gauges per grid was reduced to threeto provide an increased spatial coverage. A test of theinfluence of station number on grid average showed that,in most cases, the average based on three randomlychosen stations in the grid was not greatly different fromthat based on all stations in the grid.
The second exercise was calculation of error statisticsfor each month from May to September and for the 5-month season. Bias, root-mean-square error, and ratiosare derived using the workshop gauge dataset as a ref-erence. The bias is calculated as the difference between
hongjie.xie
Note
3B42
hongjie.xie
Note
3B43
hongjie.xie
Note
2A12
hongjie.xie
Note
2A25
hongjie.xie
Note
2B31
1360 VOLUME 42J O U R N A L O F A P P L I E D M E T E O R O L O G Y
the satellite mean and the gauge mean, and the rms erroris calculated after the bias is removed from the satelliteestimate. This analysis includes scattergrams of thegauge data versus the other products, which are pre-sented in section 4b. These graphically depict the degreeof error, which is quantified in section 4c. For the erroranalysis (including the scattergrams), only those gridboxes with five or more gauges were considered. Bothexercises were also carried out using 63 18 3 18 gridboxes, but only for the TRMM AGPI and the mergedproduct. Those grid boxes are shown in Fig. 2.
An initial comparison between the gauge data and theAGPI data showed, in general, superb agreement butwith a few extreme outliers. To determine whether thegauge data might be in error, the stations in the gridsrepresented by the outliers were examined to determinethe ‘‘problem’’ stations. This analysis suggested that thegauge data are good, because all of these stations (13in Guinea and 5 in Sierra Leone) were located alongthe coast where there is a strong degree of rainfall en-hancement by coastal effects. In some cases, rainfallexceeded 1000 mm month21. It appears that TRMMcould not capture the coastal effect, perhaps because ofthe intense rainfall from warm, stratiform clouds or apreset threshold to discard ‘‘ambiguous’’ data. Also,these grid boxes that contain these stations partially in-cluded the ocean, where no gauges existed to producea truly representative grid average. To provide a morerepresentative picture of the accuracy of TRMM, thetwo grid boxes containing these 18 stations were re-moved from the analyses.
4. Results: Spatial fields of seasonal and Augustrainfall
Figure 3 shows the mean rainfall in millimeters perday over West Africa during August and during theMay–September season of 1998. This is based on thefinescale 18 3 18 AGPI data. AGPI is used to depictthe rainbelt because it provides more extensive spatialcoverage than gauge data and, as will be shown later,it provides an excellent estimate of season totals.
The central core of the rainbelt is evident in the lat-itudes of roughly 68–148N. In this core, rainfall gen-erally exceeds 4 mm day21, or roughly 120 mmmonth21. The enhancement of rainfall by local topo-graphic features is also strongly apparent, particularlyin the highlands of Guinea (;108N, 128W), northernNigeria (;128N, 108E), and Cameroon (;68N, 108E).This map serves as a point of comparison for the TRMMproduct–gauge difference fields.
a. Mean seasonal rainfall
Figure 4 presents the difference fields for the fiveTRMM products minus gauge estimates for the May–September season. To facilitate a comparison of the per-formance of the various products, histograms showing
the number of grids in various difference categories arepresented in Fig. 5. Both figures clearly show that forthe pure TRMM products, TMI, PR, and TMI 1 PRcombined, the differences between satellite and gaugeare considerably larger than for AGPI and TRMM-merged products. For the PR and the TMI 1 PR com-bined, the differences appear to be random, with manygrid boxes indicating overestimation and many indi-cating underestimation. The TMI appears to overesti-mate seasonal rainfall. For both the PR and TMI, thereare only 19 of 40 grid boxes for which the differencesare less than 1 mm day21, and these are mostly in thenorth (where mean daily rainfall is generally less than6 mm day21). The combined product does somewhatbetter, although differences are less than 1 mm day21
in only 18 grid boxes, more cases fall within 60.5 mmday21 of the gauge analysis.
In contrast, the satellite–gauge differences for theAGPI and TRMM-merged products are considerablysmaller and appear to be very random. For the AGPIproduct, they exceed 0.5 mm day21 in only 14 of the40 grid boxes and exceed 1.0 mm day21 in only 7 gridboxes. For the TRMM-merged product, they exceed 0.5mm day21 in only 15 of the 40 grid boxes and exceed1.0 mm day21 in only 5 grid boxes. The histogramsclearly show the concentration of grid boxes with dif-ferences of less than 0.5 mm day21.
Meridional transects of seasonal rainfall during 1998were calculated for a 108 longitude band from 2.58E to7.58W, using for each dataset the grid boxes or stationswithin this area. In Fig. 6, a comparison is made betweena transect based on the workshop gauges and the TRMMsatellite products. There is remarkably good agreementbetween the AGPI, TRMM-merged, and gauge data atthe seasonal scale at all latitudes. Farther north, TRMMappears to overestimate rainfall by 50–100 mm. ThePR, TMI, and TMI 1 PR all show a similar pattern,with a core of the rainbelt that is 40% more intense andis shifted 18–28 southward of that indicated by the gaugedata.
b. Performance of the TRMM products at monthlyresolution
Figure 7 shows satellite–gauge difference fields forthe month of August, and Fig. 8 presents histogramsof these differences. August is selected for detailedanalysis because it is the rainiest month over most ofthe analysis sector, providing about 30%–40% of theannual rainfall in areas near 128N, but 50% or morein areas near 188N. Figures 7 and 8 can be comparedwith the seasonal differences in Figs. 4 and 5. For thePR and the TMI 1 PR combined, there appears to bemore random error during August than for the seasonas a whole. For both products, differences exceed 2mm day21 in more than one-half of the grid boxes, andboth clearly underestimate rainfall, especially in thewestern sectors. For the TMI, the differences appear
OCTOBER 2003 1361N I C H O L S O N E T A L .
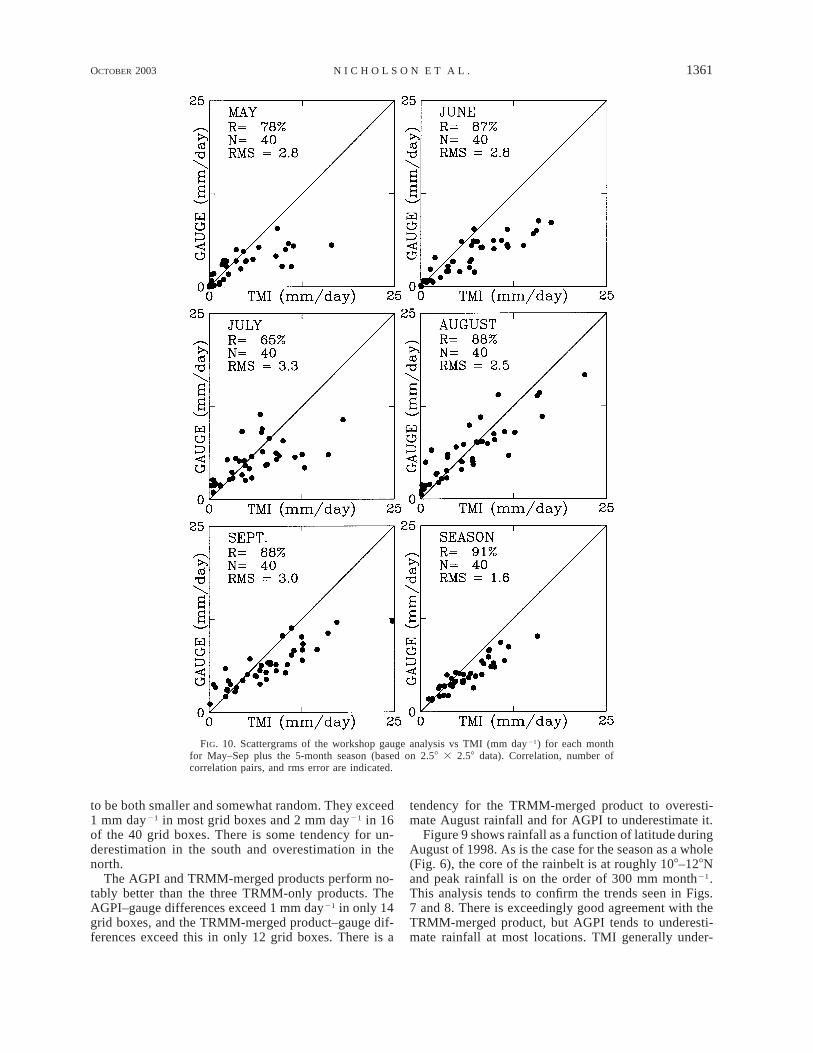
FIG. 10. Scattergrams of the workshop gauge analysis vs TMI (mm day21) for each monthfor May–Sep plus the 5-month season (based on 2.58 3 2.58 data). Correlation, number ofcorrelation pairs, and rms error are indicated.
to be both smaller and somewhat random. They exceed1 mm day21 in most grid boxes and 2 mm day21 in 16of the 40 grid boxes. There is some tendency for un-derestimation in the south and overestimation in thenorth.
The AGPI and TRMM-merged products perform no-tably better than the three TRMM-only products. TheAGPI–gauge differences exceed 1 mm day21 in only 14grid boxes, and the TRMM-merged product–gauge dif-ferences exceed this in only 12 grid boxes. There is a
tendency for the TRMM-merged product to overesti-mate August rainfall and for AGPI to underestimate it.
Figure 9 shows rainfall as a function of latitude duringAugust of 1998. As is the case for the season as a whole(Fig. 6), the core of the rainbelt is at roughly 108–128Nand peak rainfall is on the order of 300 mm month21.This analysis tends to confirm the trends seen in Figs.7 and 8. There is exceedingly good agreement with theTRMM-merged product, but AGPI tends to underesti-mate rainfall at most locations. TMI generally under-
1362 VOLUME 42J O U R N A L O F A P P L I E D M E T E O R O L O G Y
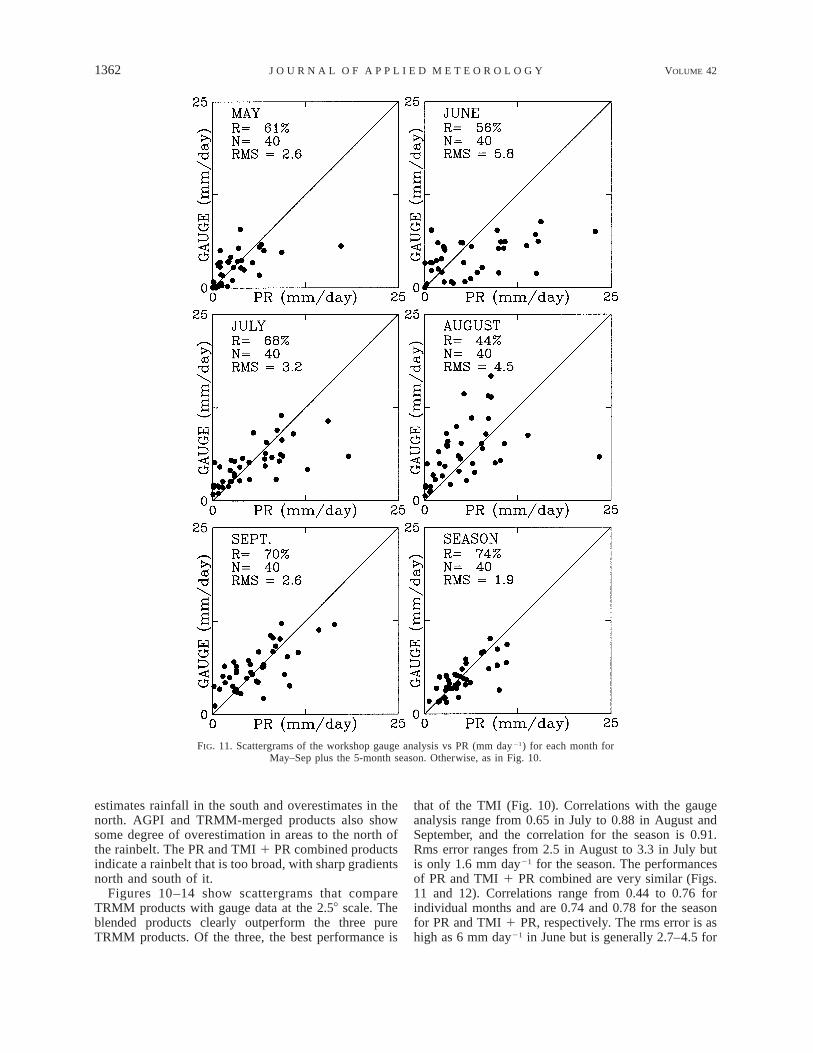
FIG. 11. Scattergrams of the workshop gauge analysis vs PR (mm day21) for each month forMay–Sep plus the 5-month season. Otherwise, as in Fig. 10.
estimates rainfall in the south and overestimates in thenorth. AGPI and TRMM-merged products also showsome degree of overestimation in areas to the north ofthe rainbelt. The PR and TMI 1 PR combined productsindicate a rainbelt that is too broad, with sharp gradientsnorth and south of it.
Figures 10–14 show scattergrams that compareTRMM products with gauge data at the 2.58 scale. Theblended products clearly outperform the three pureTRMM products. Of the three, the best performance is
that of the TMI (Fig. 10). Correlations with the gaugeanalysis range from 0.65 in July to 0.88 in August andSeptember, and the correlation for the season is 0.91.Rms error ranges from 2.5 in August to 3.3 in July butis only 1.6 mm day21 for the season. The performancesof PR and TMI 1 PR combined are very similar (Figs.11 and 12). Correlations range from 0.44 to 0.76 forindividual months and are 0.74 and 0.78 for the seasonfor PR and TMI 1 PR, respectively. The rms error is ashigh as 6 mm day21 in June but is generally 2.7–4.5 for
OCTOBER 2003 1363N I C H O L S O N E T A L .
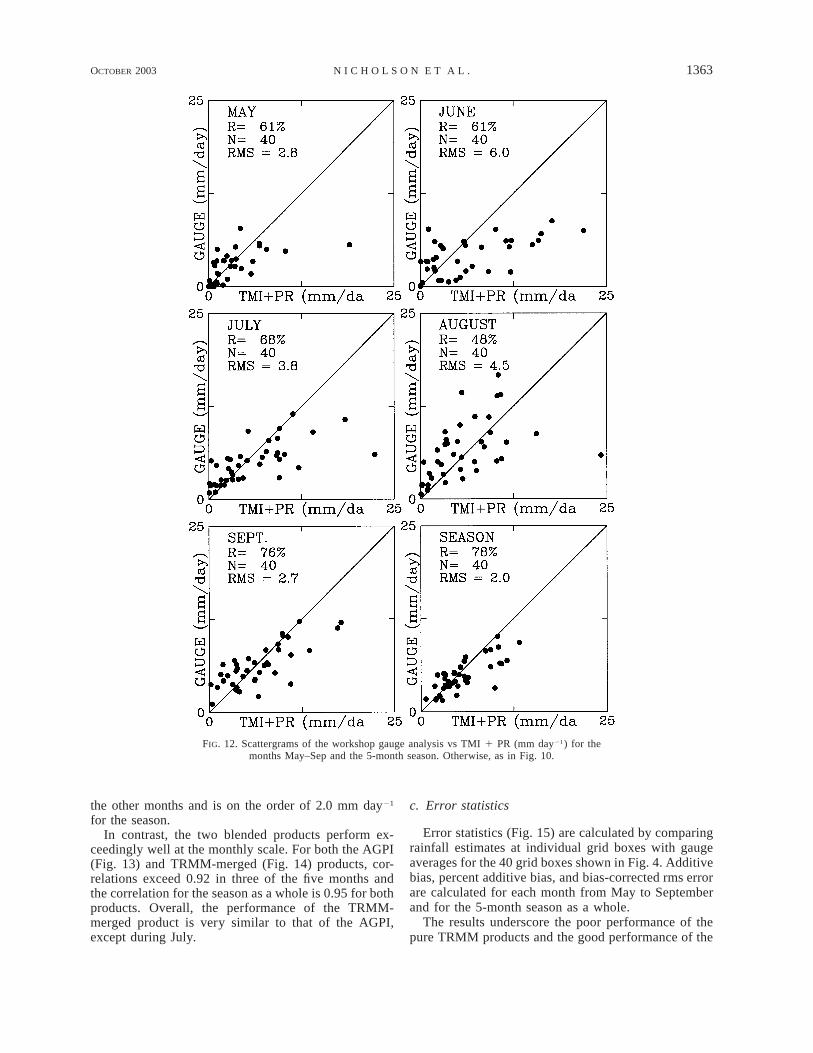
FIG. 12. Scattergrams of the workshop gauge analysis vs TMI 1 PR (mm day21) for themonths May–Sep and the 5-month season. Otherwise, as in Fig. 10.
the other months and is on the order of 2.0 mm day21
for the season.In contrast, the two blended products perform ex-
ceedingly well at the monthly scale. For both the AGPI(Fig. 13) and TRMM-merged (Fig. 14) products, cor-relations exceed 0.92 in three of the five months andthe correlation for the season as a whole is 0.95 for bothproducts. Overall, the performance of the TRMM-merged product is very similar to that of the AGPI,except during July.
c. Error statistics
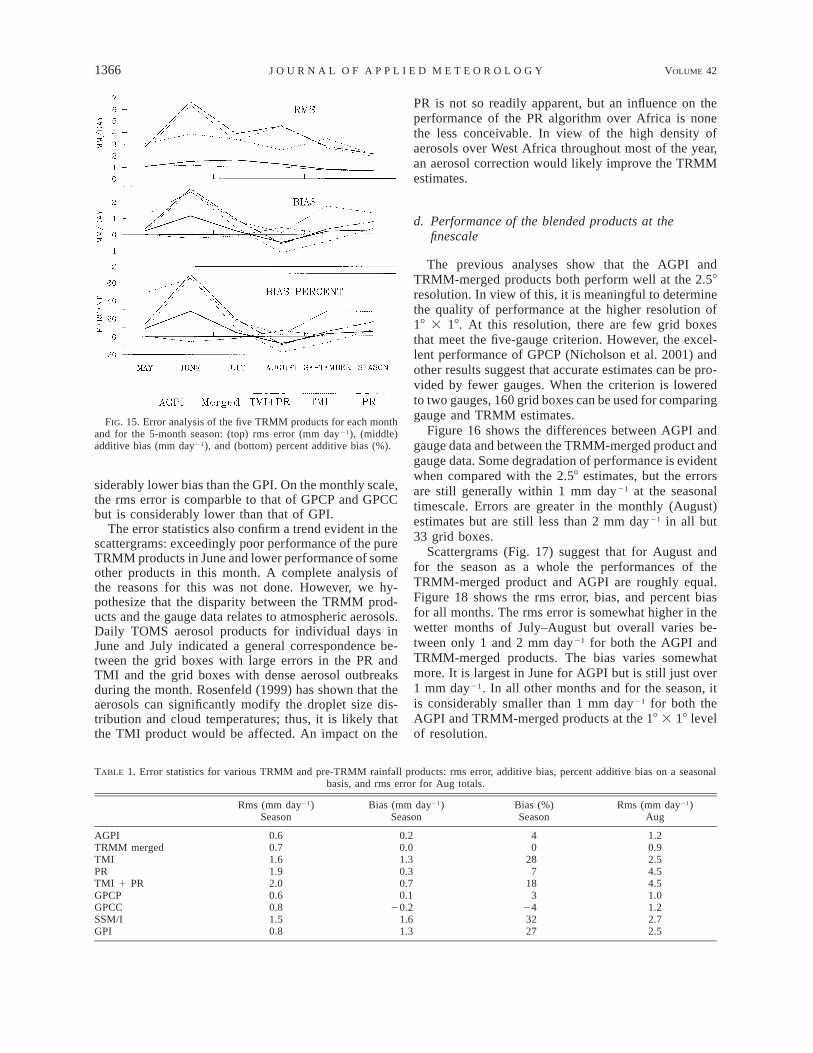
Error statistics (Fig. 15) are calculated by comparingrainfall estimates at individual grid boxes with gaugeaverages for the 40 grid boxes shown in Fig. 4. Additivebias, percent additive bias, and bias-corrected rms errorare calculated for each month from May to Septemberand for the 5-month season as a whole.
The results underscore the poor performance of thepure TRMM products and the good performance of the

1364 VOLUME 42J O U R N A L O F A P P L I E D M E T E O R O L O G Y
FIG. 13. Scattergrams of the workshop gauge analysis vs AGPI (mm day21) for each monthfor May–Sep plus the 5-month season. Otherwise, as in Fig. 10.
blended products. As noted earlier, the TMI performsbetter than the PR, a fact that might be explained bythe better sampling of the TMI. With the exception ofJune, the bias is much less than 1 mm day21 for AGPIand TRMM-merged products, or generally less than 5%.The rms error is on the order of 1 mm day21 for bothand is much less for the season as a whole. For TMIand PR, the bias is on the order of 1–2 mm day21 (exceptin June). It is positive for the TMI in all months, in-dicating that the TMI overestimates rainfall over Africa.The bias of the PR is positive in three of five cases but
is near zero for the season as a whole. The percent biasis variable and ranges from near zero for TMI in Augustto roughly 70% in June. The rms error of TMI and PRranges from about 2 to 6 mm day21. In all cases, theerror and bias of the TMI 1 PR is almost the same asthat of the PR alone.
Table 1 summarizes the error statistics and comparesthem with the statistics for the pre-TRMM estimatesdiscussed in Part I. For the season, the rms error is 0.6and 0.7 mm day21, respectively, for the AGPI andTRMM-merged products at 2.58 resolution. This is com-
OCTOBER 2003 1365N I C H O L S O N E T A L .
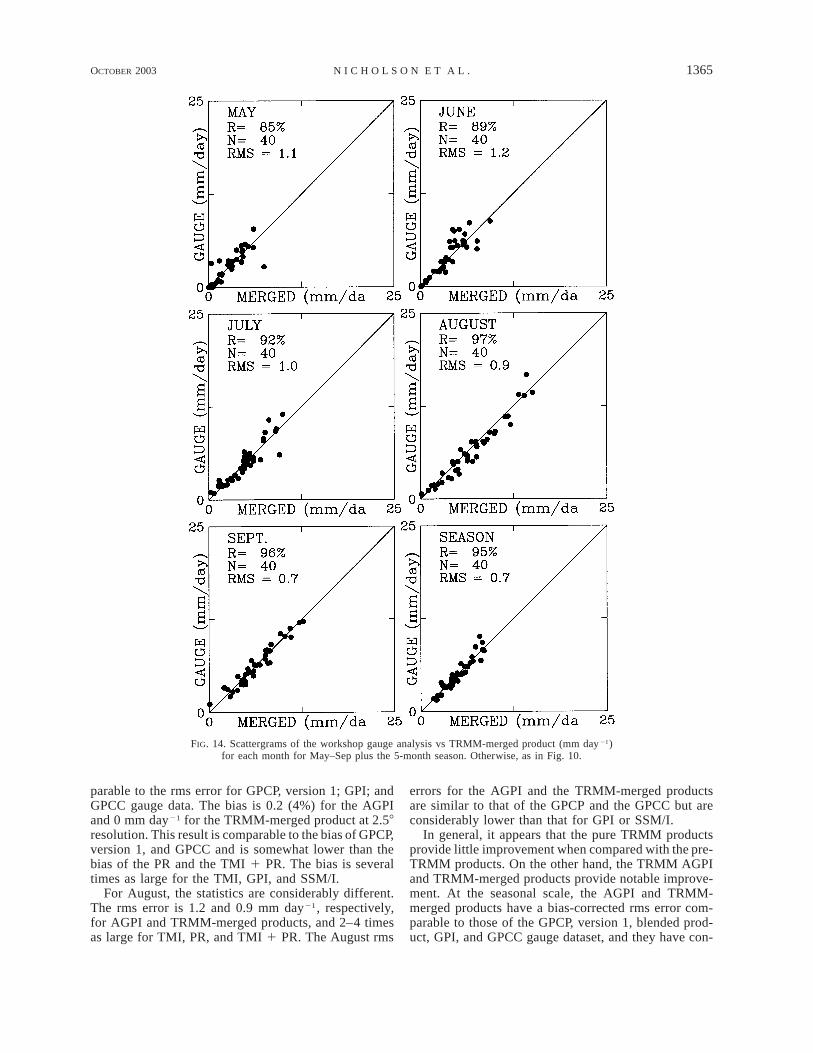
FIG. 14. Scattergrams of the workshop gauge analysis vs TRMM-merged product (mm day21)for each month for May–Sep plus the 5-month season. Otherwise, as in Fig. 10.
parable to the rms error for GPCP, version 1; GPI; andGPCC gauge data. The bias is 0.2 (4%) for the AGPIand 0 mm day21 for the TRMM-merged product at 2.58resolution. This result is comparable to the bias of GPCP,version 1, and GPCC and is somewhat lower than thebias of the PR and the TMI 1 PR. The bias is severaltimes as large for the TMI, GPI, and SSM/I.
For August, the statistics are considerably different.The rms error is 1.2 and 0.9 mm day21, respectively,for AGPI and TRMM-merged products, and 2–4 timesas large for TMI, PR, and TMI 1 PR. The August rms
errors for the AGPI and the TRMM-merged productsare similar to that of the GPCP and the GPCC but areconsiderably lower than that for GPI or SSM/I.
In general, it appears that the pure TRMM productsprovide little improvement when compared with the pre-TRMM products. On the other hand, the TRMM AGPIand TRMM-merged products provide notable improve-ment. At the seasonal scale, the AGPI and TRMM-merged products have a bias-corrected rms error com-parable to those of the GPCP, version 1, blended prod-uct, GPI, and GPCC gauge dataset, and they have con-
1366 VOLUME 42J O U R N A L O F A P P L I E D M E T E O R O L O G Y
FIG. 15. Error analysis of the five TRMM products for each monthand for the 5-month season: (top) rms error (mm day21), (middle)additive bias (mm day21), and (bottom) percent additive bias (%).
TABLE 1. Error statistics for various TRMM and pre-TRMM rainfall products: rms error, additive bias, percent additive bias on a seasonalbasis, and rms error for Aug totals.
Rms (mm day21)Season
Bias (mm day21)Season
Bias (%)Season
Rms (mm day21)Aug
AGPITRMM mergedTMIPRTMI 1 PRGPCPGPCCSSM/IGPI
0.60.71.61.92.00.60.81.50.8
0.20.01.30.30.70.1
20.21.61.3
40
287
183
243227
1.20.92.54.54.51.01.22.72.5
siderably lower bias than the GPI. On the monthly scale,the rms error is comparble to that of GPCP and GPCCbut is considerably lower than that of GPI.
The error statistics also confirm a trend evident in thescattergrams: exceedingly poor performance of the pureTRMM products in June and lower performance of someother products in this month. A complete analysis ofthe reasons for this was not done. However, we hy-pothesize that the disparity between the TRMM prod-ucts and the gauge data relates to atmospheric aerosols.Daily TOMS aerosol products for individual days inJune and July indicated a general correspondence be-tween the grid boxes with large errors in the PR andTMI and the grid boxes with dense aerosol outbreaksduring the month. Rosenfeld (1999) has shown that theaerosols can significantly modify the droplet size dis-tribution and cloud temperatures; thus, it is likely thatthe TMI product would be affected. An impact on the
PR is not so readily apparent, but an influence on theperformance of the PR algorithm over Africa is nonethe less conceivable. In view of the high density ofaerosols over West Africa throughout most of the year,an aerosol correction would likely improve the TRMMestimates.
d. Performance of the blended products at thefinescale
The previous analyses show that the AGPI andTRMM-merged products both perform well at the 2.58resolution. In view of this, it is meaningful to determinethe quality of performance at the higher resolution of18 3 18. At this resolution, there are few grid boxesthat meet the five-gauge criterion. However, the excel-lent performance of GPCP (Nicholson et al. 2001) andother results suggest that accurate estimates can be pro-vided by fewer gauges. When the criterion is loweredto two gauges, 160 grid boxes can be used for comparinggauge and TRMM estimates.
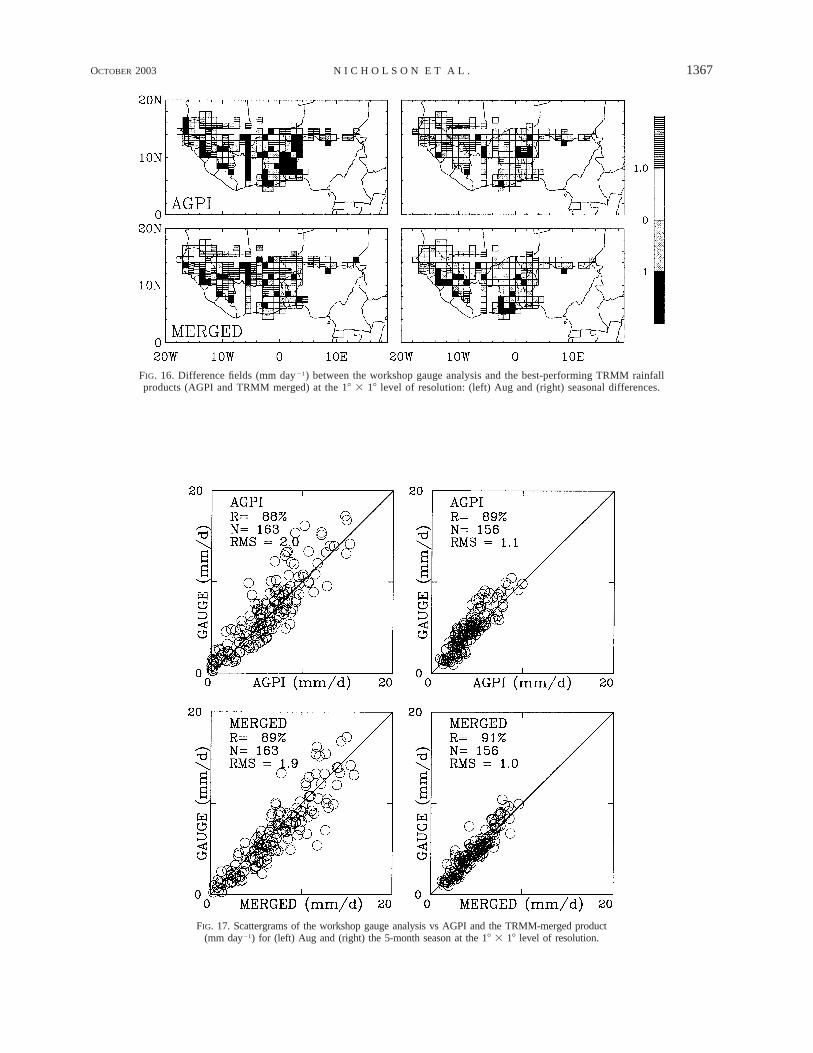
Figure 16 shows the differences between AGPI andgauge data and between the TRMM-merged product andgauge data. Some degradation of performance is evidentwhen compared with the 2.58 estimates, but the errorsare still generally within 1 mm day21 at the seasonaltimescale. Errors are greater in the monthly (August)estimates but are still less than 2 mm day21 in all but33 grid boxes.
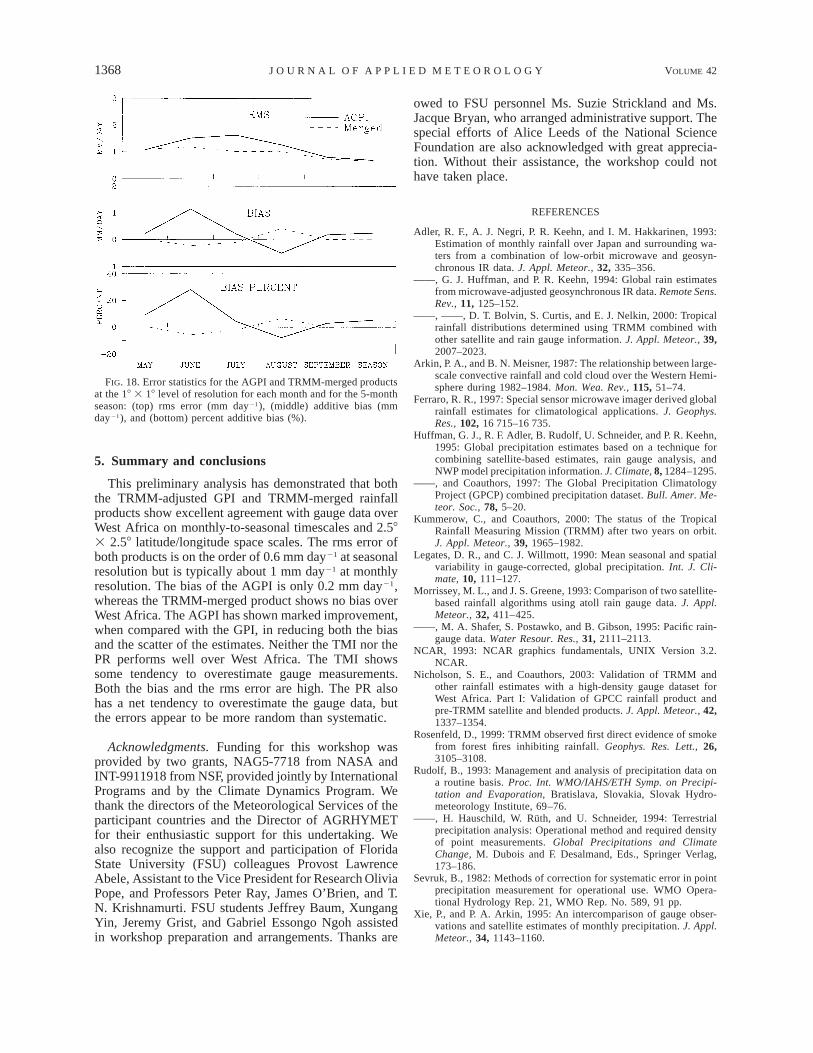
Scattergrams (Fig. 17) suggest that for August andfor the season as a whole the performances of theTRMM-merged product and AGPI are roughly equal.Figure 18 shows the rms error, bias, and percent biasfor all months. The rms error is somewhat higher in thewetter months of July–August but overall varies be-tween only 1 and 2 mm day21 for both the AGPI andTRMM-merged products. The bias varies somewhatmore. It is largest in June for AGPI but is still just over1 mm day21. In all other months and for the season, itis considerably smaller than 1 mm day21 for both theAGPI and TRMM-merged products at the 18 3 18 levelof resolution.
OCTOBER 2003 1367N I C H O L S O N E T A L .
FIG. 16. Difference fields (mm day21) between the workshop gauge analysis and the best-performing TRMM rainfallproducts (AGPI and TRMM merged) at the 18 3 18 level of resolution: (left) Aug and (right) seasonal differences.
FIG. 17. Scattergrams of the workshop gauge analysis vs AGPI and the TRMM-merged product(mm day21) for (left) Aug and (right) the 5-month season at the 18 3 18 level of resolution.
1368 VOLUME 42J O U R N A L O F A P P L I E D M E T E O R O L O G Y
FIG. 18. Error statistics for the AGPI and TRMM-merged productsat the 18 3 18 level of resolution for each month and for the 5-monthseason: (top) rms error (mm day21), (middle) additive bias (mmday21), and (bottom) percent additive bias (%).
5. Summary and conclusions
This preliminary analysis has demonstrated that boththe TRMM-adjusted GPI and TRMM-merged rainfallproducts show excellent agreement with gauge data overWest Africa on monthly-to-seasonal timescales and 2.583 2.58 latitude/longitude space scales. The rms error ofboth products is on the order of 0.6 mm day21 at seasonalresolution but is typically about 1 mm day21 at monthlyresolution. The bias of the AGPI is only 0.2 mm day21,whereas the TRMM-merged product shows no bias overWest Africa. The AGPI has shown marked improvement,when compared with the GPI, in reducing both the biasand the scatter of the estimates. Neither the TMI nor thePR performs well over West Africa. The TMI showssome tendency to overestimate gauge measurements.Both the bias and the rms error are high. The PR alsohas a net tendency to overestimate the gauge data, butthe errors appear to be more random than systematic.
Acknowledgments. Funding for this workshop wasprovided by two grants, NAG5-7718 from NASA andINT-9911918 from NSF, provided jointly by InternationalPrograms and by the Climate Dynamics Program. Wethank the directors of the Meteorological Services of theparticipant countries and the Director of AGRHYMETfor their enthusiastic support for this undertaking. Wealso recognize the support and participation of FloridaState University (FSU) colleagues Provost LawrenceAbele, Assistant to the Vice President for Research OliviaPope, and Professors Peter Ray, James O’Brien, and T.N. Krishnamurti. FSU students Jeffrey Baum, XungangYin, Jeremy Grist, and Gabriel Essongo Ngoh assistedin workshop preparation and arrangements. Thanks are
owed to FSU personnel Ms. Suzie Strickland and Ms.Jacque Bryan, who arranged administrative support. Thespecial efforts of Alice Leeds of the National ScienceFoundation are also acknowledged with great apprecia-tion. Without their assistance, the workshop could nothave taken place.
REFERENCES
Adler, R. F., A. J. Negri, P. R. Keehn, and I. M. Hakkarinen, 1993:Estimation of monthly rainfall over Japan and surrounding wa-ters from a combination of low-orbit microwave and geosyn-chronous IR data. J. Appl. Meteor., 32, 335–356.
——, G. J. Huffman, and P. R. Keehn, 1994: Global rain estimatesfrom microwave-adjusted geosynchronous IR data. Remote Sens.Rev., 11, 125–152.
——, ——, D. T. Bolvin, S. Curtis, and E. J. Nelkin, 2000: Tropicalrainfall distributions determined using TRMM combined withother satellite and rain gauge information. J. Appl. Meteor., 39,2007–2023.
Arkin, P. A., and B. N. Meisner, 1987: The relationship between large-scale convective rainfall and cold cloud over the Western Hemi-sphere during 1982–1984. Mon. Wea. Rev., 115, 51–74.
Ferraro, R. R., 1997: Special sensor microwave imager derived globalrainfall estimates for climatological applications. J. Geophys.Res., 102, 16 715–16 735.
Huffman, G. J., R. F. Adler, B. Rudolf, U. Schneider, and P. R. Keehn,1995: Global precipitation estimates based on a technique forcombining satellite-based estimates, rain gauge analysis, andNWP model precipitation information. J. Climate, 8, 1284–1295.
——, and Coauthors, 1997: The Global Precipitation ClimatologyProject (GPCP) combined precipitation dataset. Bull. Amer. Me-teor. Soc., 78, 5–20.
Kummerow, C., and Coauthors, 2000: The status of the TropicalRainfall Measuring Mission (TRMM) after two years on orbit.J. Appl. Meteor., 39, 1965–1982.
Legates, D. R., and C. J. Willmott, 1990: Mean seasonal and spatialvariability in gauge-corrected, global precipitation. Int. J. Cli-mate, 10, 111–127.
Morrissey, M. L., and J. S. Greene, 1993: Comparison of two satellite-based rainfall algorithms using atoll rain gauge data. J. Appl.Meteor., 32, 411–425.
——, M. A. Shafer, S. Postawko, and B. Gibson, 1995: Pacific rain-gauge data. Water Resour. Res., 31, 2111–2113.
NCAR, 1993: NCAR graphics fundamentals, UNIX Version 3.2.NCAR.
Nicholson, S. E., and Coauthors, 2003: Validation of TRMM andother rainfall estimates with a high-density gauge dataset forWest Africa. Part I: Validation of GPCC rainfall product andpre-TRMM satellite and blended products. J. Appl. Meteor., 42,1337–1354.
Rosenfeld, D., 1999: TRMM observed first direct evidence of smokefrom forest fires inhibiting rainfall. Geophys. Res. Lett., 26,3105–3108.
Rudolf, B., 1993: Management and analysis of precipitation data ona routine basis. Proc. Int. WMO/IAHS/ETH Symp. on Precipi-tation and Evaporation, Bratislava, Slovakia, Slovak Hydro-meteorology Institute, 69–76.
——, H. Hauschild, W. Ruth, and U. Schneider, 1994: Terrestrialprecipitation analysis: Operational method and required densityof point measurements. Global Precipitations and ClimateChange, M. Dubois and F. Desalmand, Eds., Springer Verlag,173–186.
Sevruk, B., 1982: Methods of correction for systematic error in pointprecipitation measurement for operational use. WMO Opera-tional Hydrology Rep. 21, WMO Rep. No. 589, 91 pp.
Xie, P., and P. A. Arkin, 1995: An intercomparison of gauge obser-vations and satellite estimates of monthly precipitation. J. Appl.Meteor., 34, 1143–1160.

Related Documents


