324 IEEE TRANSACTIONS ON MEDICAL IMAGING, VOL. 25, NO. 3, MARCH 2006 Validation of Bone Segmentation and Improved 3-D Registration Using Contour Coherency in CT Data Liping Ingrid Wang, Michael Greenspan*, Member, IEEE, and Randy Ellis, Member, IEEE Abstract—A method is presented to validate the segmentation of computed tomography (CT) image sequences, and improve the accuracy and efficiency of the subsequent registration of the three-dimensional surfaces that are reconstructed from the segmented slices. The method compares the shapes of contours extracted from neighborhoods of slices in CT stacks of tibias. The bone is first segmented by an automatic segmentation technique, and the bone contour for each slice is parameterized as a one-di- mensional function of normalized arc length versus inscribed angle. These functions are represented as vectors within a -di- mensional space comprising the first amplitude coefficients of their Fourier Descriptors. The similarity or coherency of neigh- boring contours is measured by comparing statistical properties of their vector representations within this space. Experimentation has demonstrated this technique to be very effective at identifying low-coherency segmentations. Compared with experienced human operators, in a set of 23 CT stacks (1,633 slices), the method cor- rectly detected 87.5% and 80% of the low-coherency and 97.7% and 95.5% of the high coherency segmentations, respectively from two different automatic segmentation techniques. Removal of the automatically detected low-coherency segmentations also significantly improved the accuracy and time efficiency of the registration of 3-D bone surface models. The registration error was reduced by over 500% (i.e., a factor of 5) and 280%, and the computational performance was improved by 540% and 791% for the two respective segmentation methods. Index Terms—Computed tomography, computer assisted surgery, contour analysis, image registration, image segmentation, image shape analysis. I. INTRODUCTION T HE automatic segmentation of bone tissue in a computed tomography (CT) image is an important component of image-based computer assisted orthopedic surgery. Despite the large volume of research into this problem [1]–[6], the develop- ment of a fully automated solution remains a significant chal- lenge. Factors such as the inhomogeneous structure of bone, pathologies, and the inherent blurring of CT data all contribute Manuscript received June 3, 2005; revised December 5, 2005. This work was supported in part by the Natural Sciences and Engineering Council of Canada, in part by The Institute for Robotics and Intelligent Systems, in part by the Ontario Research and Development Challenge Fund, in part by the Center for Innovative Technology for Medicine, and in part by the National Institutes of Health (NIH) under Contract U41RR019703. Asterisk indicates corresponding author. L. I. Wang is with the School of Computing, Queen’s University, Kingston, ON K7L 3N6, Canada, (e-mail: [email protected]). *M. Greenspan is with the Department of Electrical and Computer Engi- neering and the School of Computing, Queen’s University, Kingston, ON K7L 3N6, Canada (e-mail: [email protected]). R. Ellis is with the Department of Radiology, Harvard Medical School, Boston, MA 02115 USA and also with the School of Computing and De- partment of Surgery, Queen’s University, Kingston, ON K7L 3N6, Canada, (e-mail: [email protected]). Digital Object Identifier 10.1109/TMI.2005.863834 Fig. 1. (a) CT image of a tibia, near the knee. (b) Histograms of HU values for bone and nonbone regions overlapping. Peaks are identified for fat, water, muscle, and bone tissues. to the difficulty of fully automated segmentation of bone from other tissues. In cases where the output of segmentation is used to plan or even directly execute surgeries, segmentation errors could be critical. The fall back position has been to utilize manu- ally assisted, rather than fully automated segmentation methods, which is practical but time consuming. Segmentation is a difficult problem due to similarities in the radiological density of bone and surrounding tissues, as shown in Fig. 1. A CT slice of a knee region is illustrated in Fig. 1(a) and a histogram of sensed Hounsfield Unit (HU) values of the bone and other tissues is shown in Fig. 1(b). There is signifi- cant overlap between the HU values of the bone and other softer tissues, so classification based upon simple thresholds is infea- sible. This phenomenon is exacerbated in cancellous bone such as occurs near joints, where the porous structure of the bone tissue lowers its density. In diaphyseal regions, the cortical bone 0278-0062/$20.00 © 2006 IEEE

Welcome message from author
This document is posted to help you gain knowledge. Please leave a comment to let me know what you think about it! Share it to your friends and learn new things together.
Transcript
324 IEEE TRANSACTIONS ON MEDICAL IMAGING, VOL. 25, NO. 3, MARCH 2006
Validation of Bone Segmentation and Improved 3-DRegistration Using Contour Coherency in CT Data
Liping Ingrid Wang, Michael Greenspan*, Member, IEEE, and Randy Ellis, Member, IEEE
Abstract—A method is presented to validate the segmentationof computed tomography (CT) image sequences, and improvethe accuracy and efficiency of the subsequent registration ofthe three-dimensional surfaces that are reconstructed from thesegmented slices. The method compares the shapes of contoursextracted from neighborhoods of slices in CT stacks of tibias. Thebone is first segmented by an automatic segmentation technique,and the bone contour for each slice is parameterized as a one-di-mensional function of normalized arc length versus inscribedangle. These functions are represented as vectors within a -di-mensional space comprising the first amplitude coefficients oftheir Fourier Descriptors. The similarity or coherency of neigh-boring contours is measured by comparing statistical propertiesof their vector representations within this space. Experimentationhas demonstrated this technique to be very effective at identifyinglow-coherency segmentations. Compared with experienced humanoperators, in a set of 23 CT stacks (1,633 slices), the method cor-rectly detected 87.5% and 80% of the low-coherency and 97.7%and 95.5% of the high coherency segmentations, respectivelyfrom two different automatic segmentation techniques. Removalof the automatically detected low-coherency segmentations alsosignificantly improved the accuracy and time efficiency of theregistration of 3-D bone surface models. The registration errorwas reduced by over 500% (i.e., a factor of 5) and 280%, and thecomputational performance was improved by 540% and 791%for the two respective segmentation methods.
Index Terms—Computed tomography, computer assistedsurgery, contour analysis, image registration, image segmentation,image shape analysis.
I. INTRODUCTION
THE automatic segmentation of bone tissue in a computedtomography (CT) image is an important component of
image-based computer assisted orthopedic surgery. Despite thelarge volume of research into this problem [1]–[6], the develop-ment of a fully automated solution remains a significant chal-lenge. Factors such as the inhomogeneous structure of bone,pathologies, and the inherent blurring of CT data all contribute
Manuscript received June 3, 2005; revised December 5, 2005. This work wassupported in part by the Natural Sciences and Engineering Council of Canada, inpart by The Institute for Robotics and Intelligent Systems, in part by the OntarioResearch and Development Challenge Fund, in part by the Center for InnovativeTechnology for Medicine, and in part by the National Institutes of Health (NIH)under Contract U41RR019703. Asterisk indicates corresponding author.
L. I. Wang is with the School of Computing, Queen’s University, Kingston,ON K7L 3N6, Canada, (e-mail: [email protected]).
*M. Greenspan is with the Department of Electrical and Computer Engi-neering and the School of Computing, Queen’s University, Kingston, ON K7L3N6, Canada (e-mail: [email protected]).
R. Ellis is with the Department of Radiology, Harvard Medical School,Boston, MA 02115 USA and also with the School of Computing and De-partment of Surgery, Queen’s University, Kingston, ON K7L 3N6, Canada,(e-mail: [email protected]).
Digital Object Identifier 10.1109/TMI.2005.863834
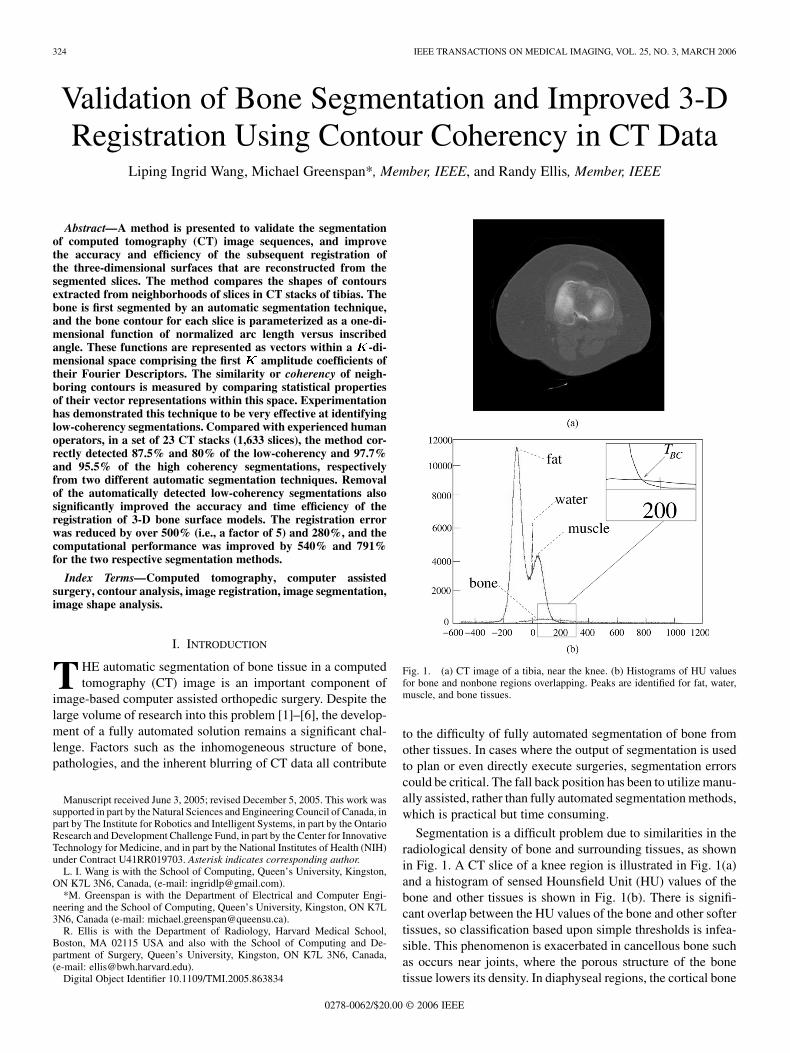
Fig. 1. (a) CT image of a tibia, near the knee. (b) Histograms of HU valuesfor bone and nonbone regions overlapping. Peaks are identified for fat, water,muscle, and bone tissues.
to the difficulty of fully automated segmentation of bone fromother tissues. In cases where the output of segmentation is usedto plan or even directly execute surgeries, segmentation errorscould be critical. The fall back position has been to utilize manu-ally assisted, rather than fully automated segmentation methods,which is practical but time consuming.
Segmentation is a difficult problem due to similarities in theradiological density of bone and surrounding tissues, as shownin Fig. 1. A CT slice of a knee region is illustrated in Fig. 1(a)and a histogram of sensed Hounsfield Unit (HU) values of thebone and other tissues is shown in Fig. 1(b). There is signifi-cant overlap between the HU values of the bone and other softertissues, so classification based upon simple thresholds is infea-sible. This phenomenon is exacerbated in cancellous bone suchas occurs near joints, where the porous structure of the bonetissue lowers its density. In diaphyseal regions, the cortical bone
0278-0062/$20.00 © 2006 IEEE

WANG et al.: VALIDATION OF BONE SEGMENTATION AND IMPROVED 3-D REGISTRATION USING CONTOUR COHERENCY IN CT DATA 325
tends to be much denser than the surrounding tissues, so that au-tomatic segmentation in these regions is feasible.
In this paper, we present an effective method to validate seg-mentation results. The method was based upon a comparison ofthe shapes of contours extracted from neighborhoods of slicesin CT stacks of tibias. We used Fourier Descriptors (FDs) as ametric to characterize the bone contour shapes. The bone wasfirst segmented by one of two automatic segmentation tech-niques; our subsequent validation method was independent ofthe specific segmentation used. The first segmentation methodwas an intensity-based technique that was a simplification of themethod of Kang et al. [1]. The second segmentation method wasan edge-based technique proposed by Yao et al., and was basedupon the estimation and correction of the normal direction ofbone edges [7]. Following segmentation, the bone contours foreach slice were then parameterized as a one-dimensional (1-D)function of normalized arc length versus inscribed angle. Thesefunctions were next represented as vectors within a -dimen-sional space comprising the first amplitude coefficients oftheir FDs.
Assuming contour coherency, we suspected that the shapes ofneighboring contours would vary gradually, and that this coher-ence could be used to validate the segmentation. Any deviationsfrom this assumption could be measured by the statistical prop-erties of the FDs of neighboring contours, and such segmen-tations were then flagged as having low-coherency. Low-co-herency segmentations could result from a number of sources,such as segmentation errors, bone pathologies (e.g., fractures),sensor errors (e.g., noise and blurring), and anatomical struc-tures (e.g., the merging or branching of two bones); whatevertheir source, such occurrences are difficult to segment. Whenlow-coherency segmentation is detected, there are a number ofpossible ameliorations, including using postprocessing routinesto attempt automatic classification and correction of the seg-mentation, simply removing the slice from further processing ofthe image sequence, or alerting a human operator that manualintervention is needed. Our experiments showed this techniqueto be very effective at identifying low-coherency segmentations.Compared with a human expert, in a set of 23 CT stacks (1,633slices), the method correctly detected 87.5% and 80% of thelow-coherency segmentations and 97.7% and 95.5% of the high-coherency segmentations, respectively, from the two segmenta-tion techniques. Removal of the automatically detected low-co-herency segmentations was also found to consistently and sig-nificantly improve both the accuracy and time efficiency of theregistration of 3-D bone surface models that were reconstructedfrom the data.
This paper continues in Section I-A with a review of pre-vious work in CT segmentation and segmentation validation. InSection II, we present a contour function that represented thecontour of a segmented region using Fourier descriptors. Anadaptive edge-based segmentation method based upon a sim-plification of Kang’s method is proposed in Section II-B; thismethod included the use of an a priori bone-contour thresholdand involved post processing to close gaps and remove noise.We also briefly describe an estimation/correction algorithm fordetecting bone edges in CT images developed by Yao et al. [7].
A set of experiments are presented in Section II-C which quan-titatively compare the effectiveness of the method with that ofexpert human operators. The effectiveness of the method at im-proving the accuracy and efficiency of registration results is alsopresented. The paper concludes in Section IV with a discussionand summary.
A. Previous Work
Medical image segmentation has proven to be a challengingtask, and most current automatic methods rely upon manualpostprocessing [1]–[4]. Previous work has shown that fullyautomatic segmentation sometimes fails due to constraints onimage quality and variations of the anatomy of the object ofinterest. CT slices provide cross-sectional images that clearlydistinguish dense cortical bones from soft tissues (mainlyfat and muscle). However, difficulties are encountered in ex-tracting contours near joints. This is because the bones mayhave injuries, calcium loss (osteoporosis), or inhomogeneousstructures that cause the bones to be nearly indistinguishablefrom nearby soft tissues. Furthermore, limitations in the res-olution (typically 512 512 pixels) of a CT scan can causecontours of adjacent bones to combine, as has been observedwith the tibia and fibula, and at the hip joint [5]. Sebastian etal. [4] pointed out that the close spacing of some bones andinherent blurring in the CT imaging process causes the inter-bone channel to often appear brighter than the background softtissue, thereby substantially reducing the boundary contrast.Finally, blood vessels that nourish the bone pass from the softtissues through the bone surface, creating gaps in the bonesurface.
Current approaches to bone segmentation in CT images canbe classified as intensity-based, edge-based, region-based, ordeformable. The simplest of the intensity-based methods aremanual segmentation, which has long been used to extractbone contours by manually selecting a HU-value threshold, andglobal thresholding, whereby the thresholds are determinedautomatically from an examination of the statistical distributionof the pixel values. The major drawback of global thresholdingis the lack of local adaptability. Due to variable tissue density,pixels of the same tissue may have different intensities betweenslices and even within the same slice. Locally adaptive thresh-olding techniques avoid this drawback, but occasionally thisresults in the merging of small gaps between bones [1].
Edge-based methods allow the separation of regions throughthe location of their contours as points of high values in an in-tensity gradient field. These methods have a high sensitivity tonoise, particularly between regions with small contrast differ-ences, and often require gap closing methods to link separatededges belonging to the same boundary [5]. Watershed segmen-tation is also based on the image gradient and, therefore, sharesmany of the problems of edge-based methods, such as overseg-mentation, sensitivity to noise, and poor detection of significantareas with low-contrast boundaries [2].
Region-based methods divide images into regions that satisfya given homogeneity criterion [1]. A region-growing methodtypically starts with an initialization seed (a small region) and

326 IEEE TRANSACTIONS ON MEDICAL IMAGING, VOL. 25, NO. 3, MARCH 2006
then examines the statistical properties of the seed’s neigh-borhood to decide if neighboring pixels have similar features.Seeded region-growing does not incorporate any geometricalinformation and a region can, therefore, “leak” through narrowgaps or weak edges. It also tends to merge bones that are close[4].
Lately, there has been much interest in segmentation algo-rithms that use active contours or surfaces, but these too havelimitations. In a snake-based approach, spurious edge points cantrap the contour which makes the final delineation of the con-tour sensitive to initial conditions. As classical snakes [8] arebased on gradient information, they share the limitations of edgedetectors [5]. Both Pardo et al. [5] and Sebastian et al. [4] ob-served that deformable models encounter such problems as im-practical initialization requirements, poor convergence on thebone boundary caused by noise or spongy bone texture, approx-imation due to injuries, and deformation.
Hybrid techniques that integrate elements of the aboveapproaches have recently been proposed [1], [2], [5], [6], [9].Images are initially segmented using either simple thresholds,adaptive thresholds, or a region-based technique, followingwhich the detected contours are refined using edge informationor deformable models. Hybrid methods improve the seg-mentation accuracy by combining the strength of the variousapproaches, but may still fail under certain situations.
Given the propensity of segmentation algorithms to fail undercommon conditions, it is important to check the outcome ofa segmentation method using automated segmentation valida-tion. Segmentation validation can be viewed in two ways: it canbe considered as a postprocessing stage, which would then befollowed by an error-correction stage, or validation could beconsidered as a phase within an iterative segmentation process.Rather than segmenting solely from first principles, the valida-tion method would identify where errors may have occurred sothat specialized segmentation routines could be applied to cor-rect these errors.
Most segmentation-validation algorithms follow a commonpattern, in that the output of an automatic or semiautomatic al-gorithm is compared to some baseline. They vary in the way thebaseline is estimated, the comparison metrics are selected, andthe degree of precision of the method is determined. Usually,the baseline is established by a human expert [10], [11], or agroup of experts [12]–[16]. To assemble a baseline, Yoo et al.suggested receiver operating characteristic (ROC) analysis [12],and Zou et al. used an expectation-maximization algorithm [14].
The most appropriate measure of the comparison of a seg-mentation to expert segmentation(s) is still an open question,although a number of measures have been proposed. Measure-ment of the volume of the segmentations has been proposed[10], [11], as has computation of overlapping voxels [13].Everingham et al. proposed an aggregate fitness function thatcombines multiple fitness measures into a general comparisonmethod [17]. Measurement in terms of the average tissue areadetected per slice and the correlation coefficients between areameasurements have been used [15]. Multiple metrics have beenapplied to examine segmentation accuracy [14], [16].
The precision of comparison methods has been obtained bystatistical analysis [12]. For example, a similarity measure de-rived from the kappa statistic has been used [15]. However,many different approaches have been used for this purpose, in-cluding comparing the results of automatic segmentation andmanual segmentation against that of manual segmentations [11],[13], optimal thresholds via maximization [14], and correlationcoefficients compared to other published methods [16].
II. MATERIALS AND METHODS
A. Contour Shape Description
Our objective is to compare the shapes of segmented boneregions in neighborhoods of slices, and to identify those con-tours that differ sharply from their neighbors. It is possible tocompare the segmented regions based solely upon their grossstatistics such as size, moments, autocorrelation, etc. [18]. Suchcomparisons tend, however, to be insensitive to the typical seg-mentation errors that we wish to identify, such as small gaps andchannel closings. Although these segmentation errors may besmall, they can cause the merger of two contours or the splittingof a single contour, and can have a large effect on the registra-tion accuracy of the reconstructed 3-D surfaces.
We base our technique on a representation of theshape of the contour of each segmented region. Let
be the bounding contour ofsegmented region . We assume that is thin (i.e., only 1pixel thick), and that the sequence of points has been permutedso that and lie adjacent on for alland . Visiting the points inorder, therefore, has the effect of traversing . The choice of
can be arbitrary but, once chosen, the order of the remainingpoints is distinct; we assume that the permutation describes aclockwise traversal. There are a number of effective algorithmsthat generate such an ordered contour from a connected region[19].
The contour function is defined as the relationship be-tween the distance of along the perimeter of , and theangle measured about the centroidof from to the positive -axis. By convention, is se-lected as the smallest point of intersection of and the pos-itive -axis. The contour function is similar to the cumulativeangular function introduced by Zahn and Roskies [20] that hasbeen applied recently by Peixoto et al. [21] and Wang et al. [22]for gesture recognition in video sequences.
The contour function is a 1-D representation of the two-di-mensional (2-D) region boundary that can be used to determinethe shape similarity between two regions. It is invariant to trans-lations, which do not affect the centroid of , and can be madeinvariant to scale by normalizing the circumference of . Anexample of for a segmented tibia is illustrated in Fig. 2. Theprotrusion at the bottom of the contour, boxed in Fig. 2(a), canbe seen as a distinct ripple in the corresponding box in Fig. 2(b).
1) Fourier Descriptor Representation: For the purpose ofshape comparison, it is desirable to represent the contour func-tion in a form that is both compact and convenient, and yet cap-tures the salient features of the shape. To this end we turn toFDs, which encode a signal as a series of its frequency domain
WANG et al.: VALIDATION OF BONE SEGMENTATION AND IMPROVED 3-D REGISTRATION USING CONTOUR COHERENCY IN CT DATA 327
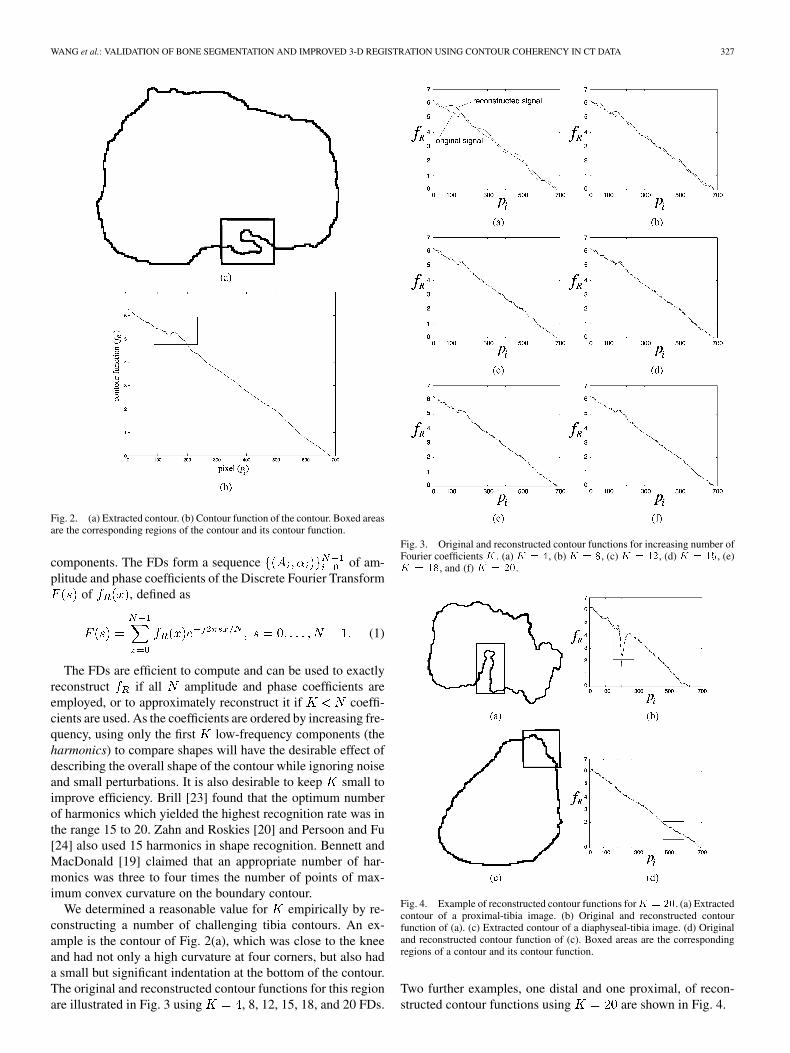
Fig. 2. (a) Extracted contour. (b) Contour function of the contour. Boxed areasare the corresponding regions of the contour and its contour function.
components. The FDs form a sequence of am-plitude and phase coefficients of the Discrete Fourier Transform
of , defined as
(1)
The FDs are efficient to compute and can be used to exactlyreconstruct if all amplitude and phase coefficients areemployed, or to approximately reconstruct it if coeffi-cients are used. As the coefficients are ordered by increasing fre-quency, using only the first low-frequency components (theharmonics) to compare shapes will have the desirable effect ofdescribing the overall shape of the contour while ignoring noiseand small perturbations. It is also desirable to keep small toimprove efficiency. Brill [23] found that the optimum numberof harmonics which yielded the highest recognition rate was inthe range 15 to 20. Zahn and Roskies [20] and Persoon and Fu[24] also used 15 harmonics in shape recognition. Bennett andMacDonald [19] claimed that an appropriate number of har-monics was three to four times the number of points of max-imum convex curvature on the boundary contour.
We determined a reasonable value for empirically by re-constructing a number of challenging tibia contours. An ex-ample is the contour of Fig. 2(a), which was close to the kneeand had not only a high curvature at four corners, but also hada small but significant indentation at the bottom of the contour.The original and reconstructed contour functions for this regionare illustrated in Fig. 3 using , 8, 12, 15, 18, and 20 FDs.
Fig. 3. Original and reconstructed contour functions for increasing number ofFourier coefficientsK . (a)K = 4, (b)K = 8, (c)K = 12, (d)K = 15, (e)K = 18, and (f) K = 20.
Fig. 4. Example of reconstructed contour functions forK = 20. (a) Extractedcontour of a proximal-tibia image. (b) Original and reconstructed contourfunction of (a). (c) Extracted contour of a diaphyseal-tibia image. (d) Originaland reconstructed contour function of (c). Boxed areas are the correspondingregions of a contour and its contour function.
Two further examples, one distal and one proximal, of recon-structed contour functions using are shown in Fig. 4.
328 IEEE TRANSACTIONS ON MEDICAL IMAGING, VOL. 25, NO. 3, MARCH 2006
We compared the similarity of two contour functions by con-sidering their first FDs as a vector in a -dimensional spaceand measuring the distance between them. Let and betwo contour functions for regions and , with respective FDs
and . The similarity betweenthe two contours was measured as the sum of the squared dif-ference
(2)
Although in general , the FDs are ordered by in-creasing frequency so a direct ordinal comparison of the se-quence is meaningful. The phase coefficients and are re-quired for signal reconstruction, but because they contributelittle to the discrimination of the overall shape of the contour,only the amplitude coefficients are used for the similarity mea-sure. The amplitude coefficients are also invariant to rotation,i.e., the choice of .
B. Segmentation
We have implemented two distinct segmentation methodswhich are used in the experimentation described below. Thefirst was a simplification of the method of Kang et al. [1], whichused both global thresholds and adaptive thresholds based uponthe statistics within a local region. The second method, pro-posed by Yao et al. [7], was an edge-based technique basedupon the estimation and correction of the normal direction ofbone edges.
1) Segmentation 1: Simplified Kang Method: The first seg-mentation method was similar to, albeit somewhat simpler than,the recently reported work of Kang et al. [1]. Kang et al. de-scribed a 4 step process, the first step of which classified eachvoxel as either bone or soft tissue by applying a combination ofadaptive local and global thresholding. In adaptive local thresh-olding, which was first proposed by Niblack [25], statistics weredrawn from a 3-D neighborhood of 26 voxels, and a distinctthreshold was determined for each neighborhood. In addition,a global lower threshold (LT) and upper threshold (HT) weredetermined by modeling the soft tissue and bone regions inthe histogram of CT values as the intersection of two Gaus-sians. The adaptive threshold was applied only within the regionbounded by LT and HT, and any voxel that exceeded the adap-tive threshold within its local neighborhood within this regionwas subsequently classified as bone.
Following this classification step, a 3-D morphologicalclosing operation was used to eliminate boundary discontinu-ities. Two subsequent steps involved adjusting the boundary toremove the smoothing effect from the morphological operator,and finally optional manual interaction to correct the estimateof the resulting periosteal and endosteal surfaces.
Our method was similar to the the first two steps of the abovedescribed method, the main difference being that the first stepwas executed on each 2-D slice separately, rather than in 3-D.The reason that we restricted ourselves to 2-D was that the CTdata that we were testing had an interslice spacing of 5 mm, so
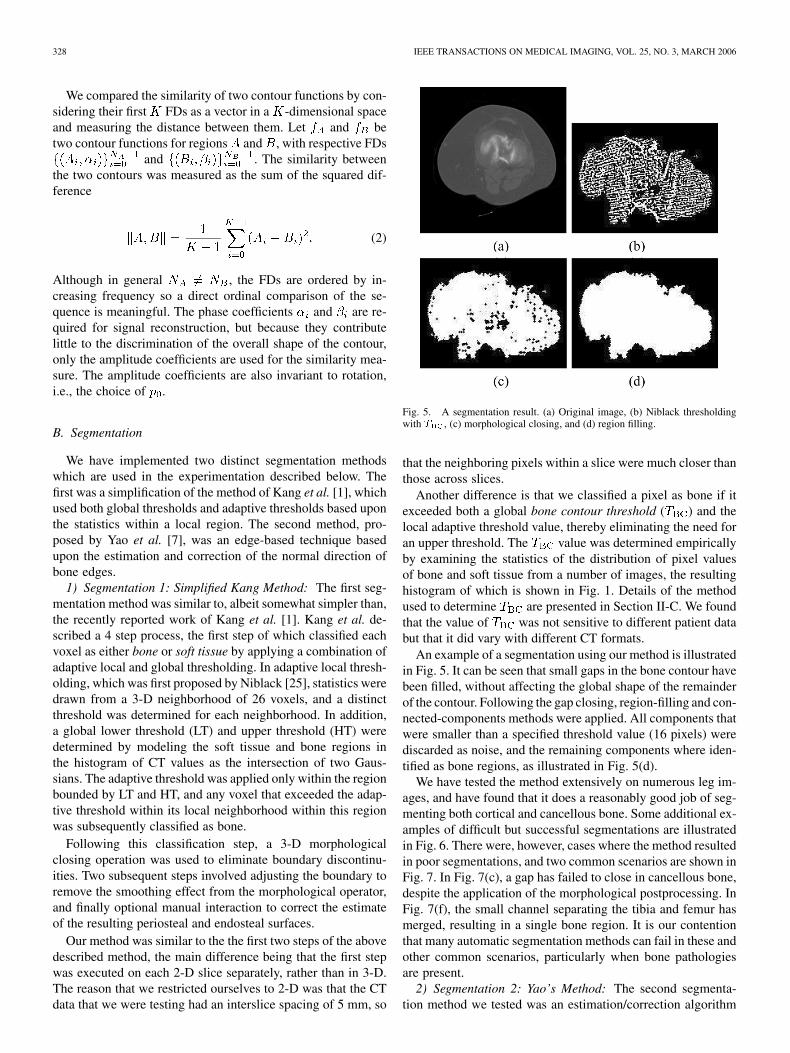
Fig. 5. A segmentation result. (a) Original image, (b) Niblack thresholdingwith T , (c) morphological closing, and (d) region filling.
that the neighboring pixels within a slice were much closer thanthose across slices.
Another difference is that we classified a pixel as bone if itexceeded both a global bone contour threshold ( ) and thelocal adaptive threshold value, thereby eliminating the need foran upper threshold. The value was determined empiricallyby examining the statistics of the distribution of pixel valuesof bone and soft tissue from a number of images, the resultinghistogram of which is shown in Fig. 1. Details of the methodused to determine are presented in Section II-C. We foundthat the value of was not sensitive to different patient databut that it did vary with different CT formats.
An example of a segmentation using our method is illustratedin Fig. 5. It can be seen that small gaps in the bone contour havebeen filled, without affecting the global shape of the remainderof the contour. Following the gap closing, region-filling and con-nected-components methods were applied. All components thatwere smaller than a specified threshold value (16 pixels) werediscarded as noise, and the remaining components where iden-tified as bone regions, as illustrated in Fig. 5(d).
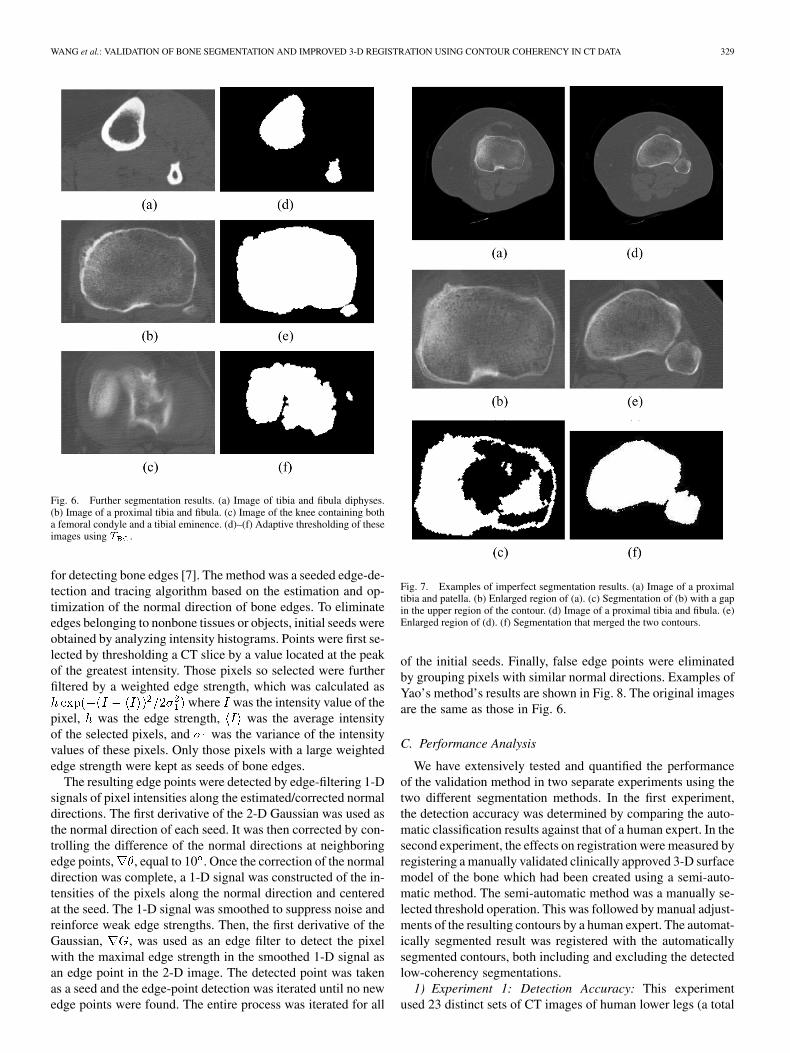
We have tested the method extensively on numerous leg im-ages, and have found that it does a reasonably good job of seg-menting both cortical and cancellous bone. Some additional ex-amples of difficult but successful segmentations are illustratedin Fig. 6. There were, however, cases where the method resultedin poor segmentations, and two common scenarios are shown inFig. 7. In Fig. 7(c), a gap has failed to close in cancellous bone,despite the application of the morphological postprocessing. InFig. 7(f), the small channel separating the tibia and femur hasmerged, resulting in a single bone region. It is our contentionthat many automatic segmentation methods can fail in these andother common scenarios, particularly when bone pathologiesare present.
2) Segmentation 2: Yao’s Method: The second segmenta-tion method we tested was an estimation/correction algorithm
WANG et al.: VALIDATION OF BONE SEGMENTATION AND IMPROVED 3-D REGISTRATION USING CONTOUR COHERENCY IN CT DATA 329
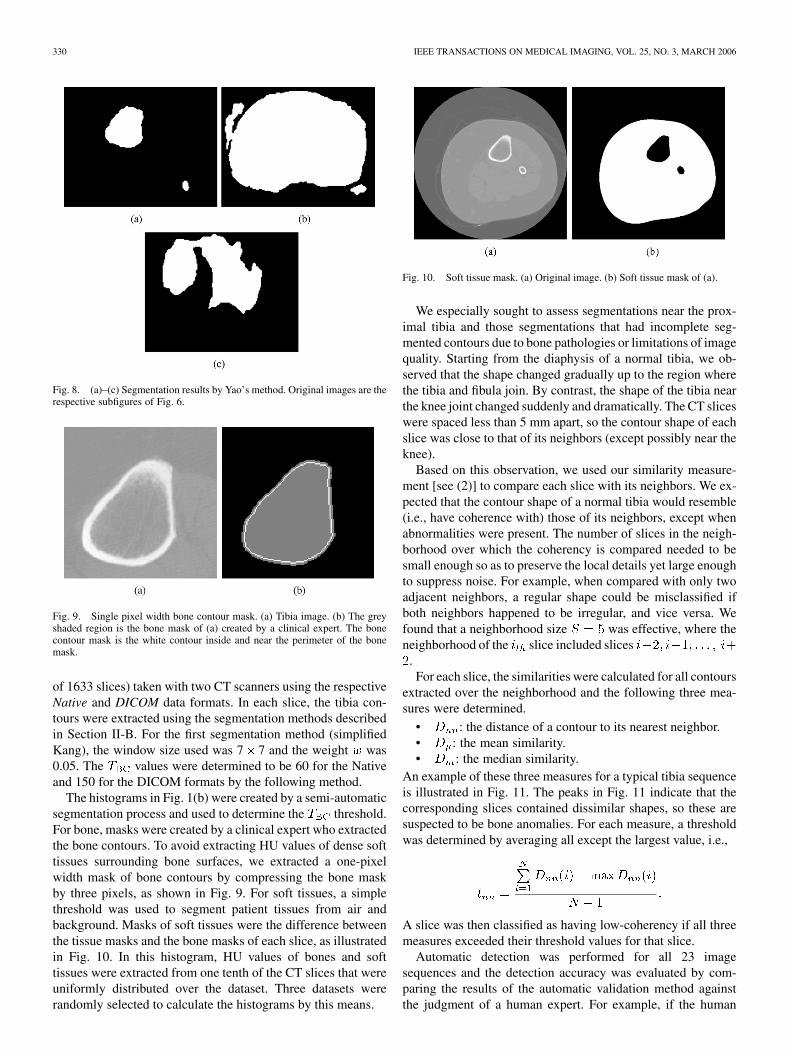
Fig. 6. Further segmentation results. (a) Image of tibia and fibula diphyses.(b) Image of a proximal tibia and fibula. (c) Image of the knee containing botha femoral condyle and a tibial eminence. (d)–(f) Adaptive thresholding of theseimages using T .
for detecting bone edges [7]. The method was a seeded edge-de-tection and tracing algorithm based on the estimation and op-timization of the normal direction of bone edges. To eliminateedges belonging to nonbone tissues or objects, initial seeds wereobtained by analyzing intensity histograms. Points were first se-lected by thresholding a CT slice by a value located at the peakof the greatest intensity. Those pixels so selected were furtherfiltered by a weighted edge strength, which was calculated as
where was the intensity value of thepixel, was the edge strength, was the average intensityof the selected pixels, and was the variance of the intensityvalues of these pixels. Only those pixels with a large weightededge strength were kept as seeds of bone edges.
The resulting edge points were detected by edge-filtering 1-Dsignals of pixel intensities along the estimated/corrected normaldirections. The first derivative of the 2-D Gaussian was used asthe normal direction of each seed. It was then corrected by con-trolling the difference of the normal directions at neighboringedge points, , equal to 10 . Once the correction of the normaldirection was complete, a 1-D signal was constructed of the in-tensities of the pixels along the normal direction and centeredat the seed. The 1-D signal was smoothed to suppress noise andreinforce weak edge strengths. Then, the first derivative of theGaussian, , was used as an edge filter to detect the pixelwith the maximal edge strength in the smoothed 1-D signal asan edge point in the 2-D image. The detected point was takenas a seed and the edge-point detection was iterated until no newedge points were found. The entire process was iterated for all
Fig. 7. Examples of imperfect segmentation results. (a) Image of a proximaltibia and patella. (b) Enlarged region of (a). (c) Segmentation of (b) with a gapin the upper region of the contour. (d) Image of a proximal tibia and fibula. (e)Enlarged region of (d). (f) Segmentation that merged the two contours.
of the initial seeds. Finally, false edge points were eliminatedby grouping pixels with similar normal directions. Examples ofYao’s method’s results are shown in Fig. 8. The original imagesare the same as those in Fig. 6.
C. Performance Analysis
We have extensively tested and quantified the performanceof the validation method in two separate experiments using thetwo different segmentation methods. In the first experiment,the detection accuracy was determined by comparing the auto-matic classification results against that of a human expert. In thesecond experiment, the effects on registration were measured byregistering a manually validated clinically approved 3-D surfacemodel of the bone which had been created using a semi-auto-matic method. The semi-automatic method was a manually se-lected threshold operation. This was followed by manual adjust-ments of the resulting contours by a human expert. The automat-ically segmented result was registered with the automaticallysegmented contours, both including and excluding the detectedlow-coherency segmentations.
1) Experiment 1: Detection Accuracy: This experimentused 23 distinct sets of CT images of human lower legs (a total
330 IEEE TRANSACTIONS ON MEDICAL IMAGING, VOL. 25, NO. 3, MARCH 2006
Fig. 8. (a)–(c) Segmentation results by Yao’s method. Original images are therespective subfigures of Fig. 6.
Fig. 9. Single pixel width bone contour mask. (a) Tibia image. (b) The greyshaded region is the bone mask of (a) created by a clinical expert. The bonecontour mask is the white contour inside and near the perimeter of the bonemask.
of 1633 slices) taken with two CT scanners using the respectiveNative and DICOM data formats. In each slice, the tibia con-tours were extracted using the segmentation methods describedin Section II-B. For the first segmentation method (simplifiedKang), the window size used was 7 7 and the weight was0.05. The values were determined to be 60 for the Nativeand 150 for the DICOM formats by the following method.
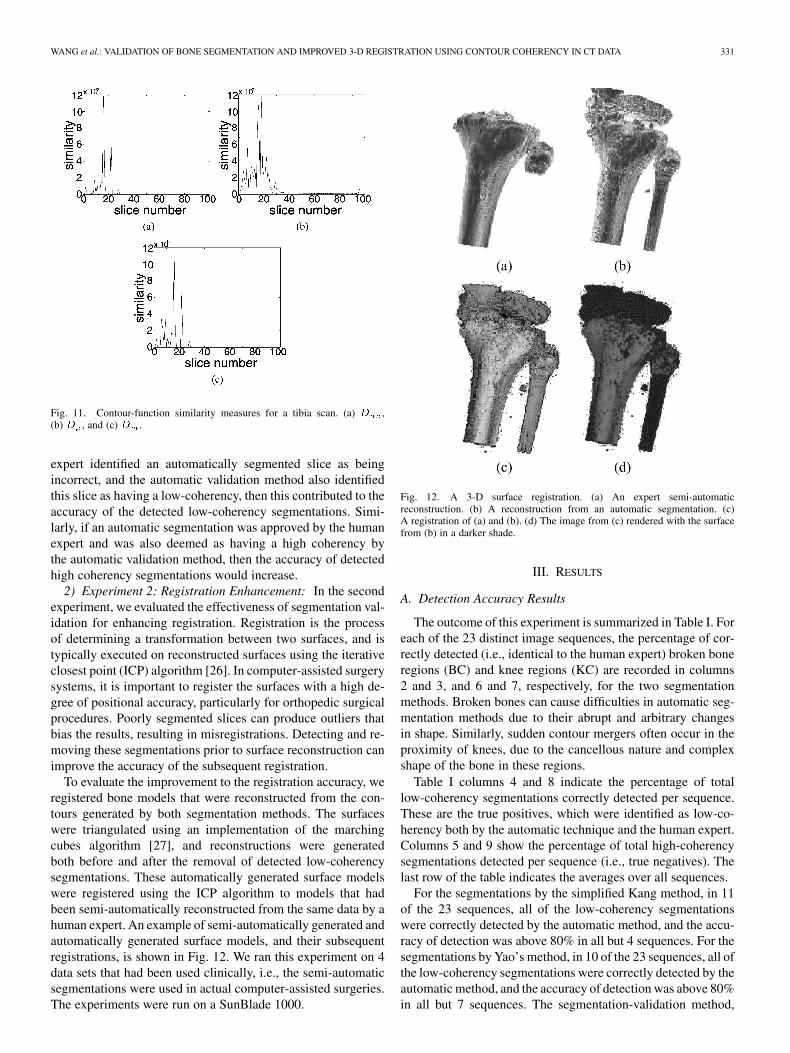
The histograms in Fig. 1(b) were created by a semi-automaticsegmentation process and used to determine the threshold.For bone, masks were created by a clinical expert who extractedthe bone contours. To avoid extracting HU values of dense softtissues surrounding bone surfaces, we extracted a one-pixelwidth mask of bone contours by compressing the bone maskby three pixels, as shown in Fig. 9. For soft tissues, a simplethreshold was used to segment patient tissues from air andbackground. Masks of soft tissues were the difference betweenthe tissue masks and the bone masks of each slice, as illustratedin Fig. 10. In this histogram, HU values of bones and softtissues were extracted from one tenth of the CT slices that wereuniformly distributed over the dataset. Three datasets wererandomly selected to calculate the histograms by this means.
Fig. 10. Soft tissue mask. (a) Original image. (b) Soft tissue mask of (a).
We especially sought to assess segmentations near the prox-imal tibia and those segmentations that had incomplete seg-mented contours due to bone pathologies or limitations of imagequality. Starting from the diaphysis of a normal tibia, we ob-served that the shape changed gradually up to the region wherethe tibia and fibula join. By contrast, the shape of the tibia nearthe knee joint changed suddenly and dramatically. The CT sliceswere spaced less than 5 mm apart, so the contour shape of eachslice was close to that of its neighbors (except possibly near theknee).
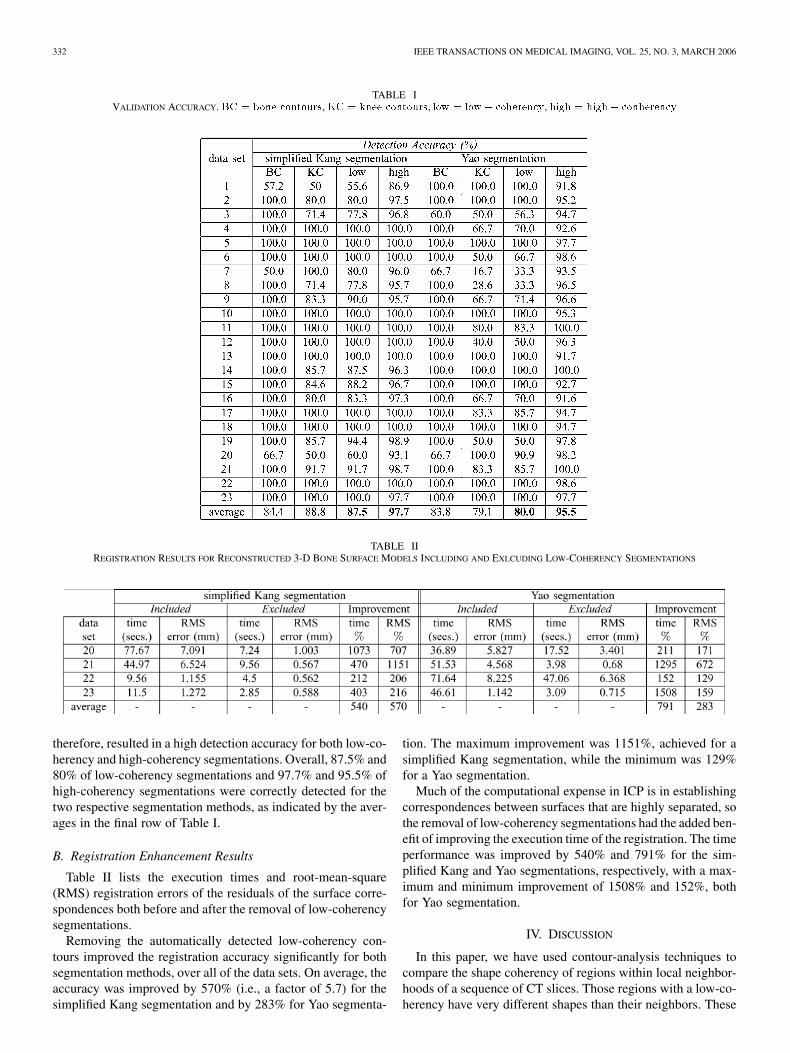
Based on this observation, we used our similarity measure-ment [see (2)] to compare each slice with its neighbors. We ex-pected that the contour shape of a normal tibia would resemble(i.e., have coherence with) those of its neighbors, except whenabnormalities were present. The number of slices in the neigh-borhood over which the coherency is compared needed to besmall enough so as to preserve the local details yet large enoughto suppress noise. For example, when compared with only twoadjacent neighbors, a regular shape could be misclassified ifboth neighbors happened to be irregular, and vice versa. Wefound that a neighborhood size was effective, where theneighborhood of the slice included slices
.For each slice, the similarities were calculated for all contours
extracted over the neighborhood and the following three mea-sures were determined.
• : the distance of a contour to its nearest neighbor.• : the mean similarity.• : the median similarity.
An example of these three measures for a typical tibia sequenceis illustrated in Fig. 11. The peaks in Fig. 11 indicate that thecorresponding slices contained dissimilar shapes, so these aresuspected to be bone anomalies. For each measure, a thresholdwas determined by averaging all except the largest value, i.e.,
A slice was then classified as having low-coherency if all threemeasures exceeded their threshold values for that slice.
Automatic detection was performed for all 23 imagesequences and the detection accuracy was evaluated by com-paring the results of the automatic validation method againstthe judgment of a human expert. For example, if the human
WANG et al.: VALIDATION OF BONE SEGMENTATION AND IMPROVED 3-D REGISTRATION USING CONTOUR COHERENCY IN CT DATA 331
Fig. 11. Contour-function similarity measures for a tibia scan. (a) D ,(b) D , and (c) D .
expert identified an automatically segmented slice as beingincorrect, and the automatic validation method also identifiedthis slice as having a low-coherency, then this contributed to theaccuracy of the detected low-coherency segmentations. Simi-larly, if an automatic segmentation was approved by the humanexpert and was also deemed as having a high coherency bythe automatic validation method, then the accuracy of detectedhigh coherency segmentations would increase.
2) Experiment 2: Registration Enhancement: In the secondexperiment, we evaluated the effectiveness of segmentation val-idation for enhancing registration. Registration is the processof determining a transformation between two surfaces, and istypically executed on reconstructed surfaces using the iterativeclosest point (ICP) algorithm [26]. In computer-assisted surgerysystems, it is important to register the surfaces with a high de-gree of positional accuracy, particularly for orthopedic surgicalprocedures. Poorly segmented slices can produce outliers thatbias the results, resulting in misregistrations. Detecting and re-moving these segmentations prior to surface reconstruction canimprove the accuracy of the subsequent registration.
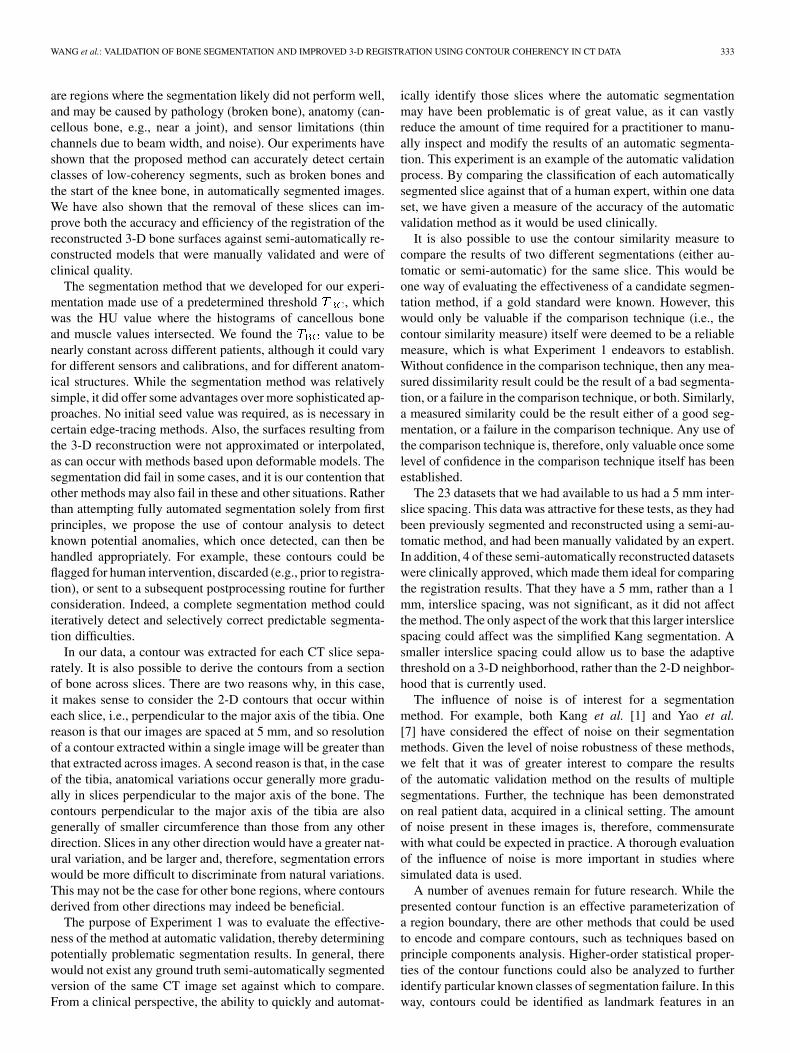
To evaluate the improvement to the registration accuracy, weregistered bone models that were reconstructed from the con-tours generated by both segmentation methods. The surfaceswere triangulated using an implementation of the marchingcubes algorithm [27], and reconstructions were generatedboth before and after the removal of detected low-coherencysegmentations. These automatically generated surface modelswere registered using the ICP algorithm to models that hadbeen semi-automatically reconstructed from the same data by ahuman expert. An example of semi-automatically generated andautomatically generated surface models, and their subsequentregistrations, is shown in Fig. 12. We ran this experiment on 4data sets that had been used clinically, i.e., the semi-automaticsegmentations were used in actual computer-assisted surgeries.The experiments were run on a SunBlade 1000.
Fig. 12. A 3-D surface registration. (a) An expert semi-automaticreconstruction. (b) A reconstruction from an automatic segmentation. (c)A registration of (a) and (b). (d) The image from (c) rendered with the surfacefrom (b) in a darker shade.
III. RESULTS
A. Detection Accuracy Results
The outcome of this experiment is summarized in Table I. Foreach of the 23 distinct image sequences, the percentage of cor-rectly detected (i.e., identical to the human expert) broken boneregions (BC) and knee regions (KC) are recorded in columns2 and 3, and 6 and 7, respectively, for the two segmentationmethods. Broken bones can cause difficulties in automatic seg-mentation methods due to their abrupt and arbitrary changesin shape. Similarly, sudden contour mergers often occur in theproximity of knees, due to the cancellous nature and complexshape of the bone in these regions.
Table I columns 4 and 8 indicate the percentage of totallow-coherency segmentations correctly detected per sequence.These are the true positives, which were identified as low-co-herency both by the automatic technique and the human expert.Columns 5 and 9 show the percentage of total high-coherencysegmentations detected per sequence (i.e., true negatives). Thelast row of the table indicates the averages over all sequences.
For the segmentations by the simplified Kang method, in 11of the 23 sequences, all of the low-coherency segmentationswere correctly detected by the automatic method, and the accu-racy of detection was above 80% in all but 4 sequences. For thesegmentations by Yao’s method, in 10 of the 23 sequences, all ofthe low-coherency segmentations were correctly detected by theautomatic method, and the accuracy of detection was above 80%in all but 7 sequences. The segmentation-validation method,
332 IEEE TRANSACTIONS ON MEDICAL IMAGING, VOL. 25, NO. 3, MARCH 2006
TABLE IVALIDATION ACCURACY. BC = bone contours, KC = knee contours, low = low� coherency, high = high� conherency
TABLE IIREGISTRATION RESULTS FOR RECONSTRUCTED 3-D BONE SURFACE MODELS INCLUDING AND EXLCUDING LOW-COHERENCY SEGMENTATIONS
therefore, resulted in a high detection accuracy for both low-co-herency and high-coherency segmentations. Overall, 87.5% and80% of low-coherency segmentations and 97.7% and 95.5% ofhigh-coherency segmentations were correctly detected for thetwo respective segmentation methods, as indicated by the aver-ages in the final row of Table I.
B. Registration Enhancement Results
Table II lists the execution times and root-mean-square(RMS) registration errors of the residuals of the surface corre-spondences both before and after the removal of low-coherencysegmentations.
Removing the automatically detected low-coherency con-tours improved the registration accuracy significantly for bothsegmentation methods, over all of the data sets. On average, theaccuracy was improved by 570% (i.e., a factor of 5.7) for thesimplified Kang segmentation and by 283% for Yao segmenta-
tion. The maximum improvement was 1151%, achieved for asimplified Kang segmentation, while the minimum was 129%for a Yao segmentation.
Much of the computational expense in ICP is in establishingcorrespondences between surfaces that are highly separated, sothe removal of low-coherency segmentations had the added ben-efit of improving the execution time of the registration. The timeperformance was improved by 540% and 791% for the sim-plified Kang and Yao segmentations, respectively, with a max-imum and minimum improvement of 1508% and 152%, bothfor Yao segmentation.
IV. DISCUSSION
In this paper, we have used contour-analysis techniques tocompare the shape coherency of regions within local neighbor-hoods of a sequence of CT slices. Those regions with a low-co-herency have very different shapes than their neighbors. These
WANG et al.: VALIDATION OF BONE SEGMENTATION AND IMPROVED 3-D REGISTRATION USING CONTOUR COHERENCY IN CT DATA 333
are regions where the segmentation likely did not perform well,and may be caused by pathology (broken bone), anatomy (can-cellous bone, e.g., near a joint), and sensor limitations (thinchannels due to beam width, and noise). Our experiments haveshown that the proposed method can accurately detect certainclasses of low-coherency segments, such as broken bones andthe start of the knee bone, in automatically segmented images.We have also shown that the removal of these slices can im-prove both the accuracy and efficiency of the registration of thereconstructed 3-D bone surfaces against semi-automatically re-constructed models that were manually validated and were ofclinical quality.
The segmentation method that we developed for our experi-mentation made use of a predetermined threshold , whichwas the HU value where the histograms of cancellous boneand muscle values intersected. We found the value to benearly constant across different patients, although it could varyfor different sensors and calibrations, and for different anatom-ical structures. While the segmentation method was relativelysimple, it did offer some advantages over more sophisticated ap-proaches. No initial seed value was required, as is necessary incertain edge-tracing methods. Also, the surfaces resulting fromthe 3-D reconstruction were not approximated or interpolated,as can occur with methods based upon deformable models. Thesegmentation did fail in some cases, and it is our contention thatother methods may also fail in these and other situations. Ratherthan attempting fully automated segmentation solely from firstprinciples, we propose the use of contour analysis to detectknown potential anomalies, which once detected, can then behandled appropriately. For example, these contours could beflagged for human intervention, discarded (e.g., prior to registra-tion), or sent to a subsequent postprocessing routine for furtherconsideration. Indeed, a complete segmentation method coulditeratively detect and selectively correct predictable segmenta-tion difficulties.
In our data, a contour was extracted for each CT slice sepa-rately. It is also possible to derive the contours from a sectionof bone across slices. There are two reasons why, in this case,it makes sense to consider the 2-D contours that occur withineach slice, i.e., perpendicular to the major axis of the tibia. Onereason is that our images are spaced at 5 mm, and so resolutionof a contour extracted within a single image will be greater thanthat extracted across images. A second reason is that, in the caseof the tibia, anatomical variations occur generally more gradu-ally in slices perpendicular to the major axis of the bone. Thecontours perpendicular to the major axis of the tibia are alsogenerally of smaller circumference than those from any otherdirection. Slices in any other direction would have a greater nat-ural variation, and be larger and, therefore, segmentation errorswould be more difficult to discriminate from natural variations.This may not be the case for other bone regions, where contoursderived from other directions may indeed be beneficial.
The purpose of Experiment 1 was to evaluate the effective-ness of the method at automatic validation, thereby determiningpotentially problematic segmentation results. In general, therewould not exist any ground truth semi-automatically segmentedversion of the same CT image set against which to compare.From a clinical perspective, the ability to quickly and automat-
ically identify those slices where the automatic segmentationmay have been problematic is of great value, as it can vastlyreduce the amount of time required for a practitioner to manu-ally inspect and modify the results of an automatic segmenta-tion. This experiment is an example of the automatic validationprocess. By comparing the classification of each automaticallysegmented slice against that of a human expert, within one dataset, we have given a measure of the accuracy of the automaticvalidation method as it would be used clinically.
It is also possible to use the contour similarity measure tocompare the results of two different segmentations (either au-tomatic or semi-automatic) for the same slice. This would beone way of evaluating the effectiveness of a candidate segmen-tation method, if a gold standard were known. However, thiswould only be valuable if the comparison technique (i.e., thecontour similarity measure) itself were deemed to be a reliablemeasure, which is what Experiment 1 endeavors to establish.Without confidence in the comparison technique, then any mea-sured dissimilarity result could be the result of a bad segmenta-tion, or a failure in the comparison technique, or both. Similarly,a measured similarity could be the result either of a good seg-mentation, or a failure in the comparison technique. Any use ofthe comparison technique is, therefore, only valuable once somelevel of confidence in the comparison technique itself has beenestablished.
The 23 datasets that we had available to us had a 5 mm inter-slice spacing. This data was attractive for these tests, as they hadbeen previously segmented and reconstructed using a semi-au-tomatic method, and had been manually validated by an expert.In addition, 4 of these semi-automatically reconstructed datasetswere clinically approved, which made them ideal for comparingthe registration results. That they have a 5 mm, rather than a 1mm, interslice spacing, was not significant, as it did not affectthe method. The only aspect of the work that this larger interslicespacing could affect was the simplified Kang segmentation. Asmaller interslice spacing could allow us to base the adaptivethreshold on a 3-D neighborhood, rather than the 2-D neighbor-hood that is currently used.
The influence of noise is of interest for a segmentationmethod. For example, both Kang et al. [1] and Yao et al.[7] have considered the effect of noise on their segmentationmethods. Given the level of noise robustness of these methods,we felt that it was of greater interest to compare the resultsof the automatic validation method on the results of multiplesegmentations. Further, the technique has been demonstratedon real patient data, acquired in a clinical setting. The amountof noise present in these images is, therefore, commensuratewith what could be expected in practice. A thorough evaluationof the influence of noise is more important in studies wheresimulated data is used.
A number of avenues remain for future research. While thepresented contour function is an effective parameterization ofa region boundary, there are other methods that could be usedto encode and compare contours, such as techniques based onprinciple components analysis. Higher-order statistical proper-ties of the contour functions could also be analyzed to furtheridentify particular known classes of segmentation failure. In thisway, contours could be identified as landmark features in an
334 IEEE TRANSACTIONS ON MEDICAL IMAGING, VOL. 25, NO. 3, MARCH 2006
anatomical atlas. We have given one example of a particular seg-mentation method and the failures that can result, but differentsegmentation methods will likely fail in different situations anddifferent ways. The relationship between a specific segmenta-tion method and the statistical properties of its resulting con-tours needs to be established. Finally, the notion of shape anal-ysis can be extended directly to the evaluation and comparisonof 3-D surfaces, following reconstruction.
REFERENCES
[1] Y. Kang, K. Engelke, and W. A. Kalender, “A new accurate and precise3-D segmentation method for skeletal structures in volumetric CT data,”IEEE Trans. Med. Imag., vol. 22, no. 5, pp. 586–598, May 2003.
[2] V. Grau, U. U. J. Mewes, M. Alcaniz, R. Kikinis, and S. K. Warfield,“Improved watershed transform for medical image segmentation usingprior information,” IEEE Trans. Med. Imag., vol. 23, no. 4, pp. 447–458,Apr. 2004.
[3] A. Elmoutaouakkil, E. Peyrin, J. Elkafi, and A. Laval-Jeantet, “Segmen-tation of cancellous bone from high-resolution computed tomographyimages: Influence on trabecular bone measurements,” IEEE Trans. Med.Imag., vol. 21, no. 4, pp. 354–362, Apr. 2002.
[4] T. B. Sebastian, H. Tek, J. J. Crisco, and B. B. Kimia, “Segmentationof carpal bones from CT images using skeletally coupled deformablemodels,” Med. Image Anal., vol. 7, pp. 21–45, 2003.
[5] X. M. Pardo, M. J. Carreira, A. Mosquera, and D. Cabello, “A snake forCT image segmentation integrating region and edge information,” ImageVis. Comput., vol. 19, pp. 461–475, 2001.
[6] K. Haris, S. Efstratiadis, and A. Katsaggelos, “Hybrid image segmen-tation using watersheds and fast region merging,” IEEE Trans. ImageProcess., vol. 7, no. 12, pp. 1684–1699, Dec. 1998.
[7] W. Yao, P. Abolmaesumi, M. Greenspan, and R. E. Ellis, “An estima-tion/correction algorithm for detecting bone edges in CT images,” IEEETrans. Med. Imag., pp. 997–1010, Jan. 2004, submitted for publication.
[8] M. Kass, A. Witkin, and D. Terzopoulos, “Snakes: Active contourmodels,” Int. J. Comput. Vis., vol. 17, no. 4, 1988.
[9] S. Shiffman, G. D. Rubin, and S. Napel, “Medical image segmentationusing analysis of isolable-contour maps,” IEEE Trans. Med. Imag., vol.19, pp. 1064–1074, Nov. 2000.
[10] D. V. Iosifescu, M. E. Shenton, S. K. Warfield, J. D. R. Kiki-nis, F.A. Jolesz, and R. W. McCarley, “An automated registration algorithmfor measuring mri subcortical brain structures,” NeuroImage, vol. 6, pp.12–25, 1997.
[11] S. Warfield, R. Mulkern, C. Winalski, F. Jolesz, and R. Kikinis, “Animage processing strategy for the quantification and visualization of ex-ercise induced muscle mri signal enhancement,” J. Magn. Reson. Imag.,vol. 11, no. 5, pp. 525–531, 2000.
[12] T. S. Yoo, M. J. Ackerman, and M. Vannier, “Toward a common val-idation methodology for segmentation and registration algorithms,” inProc. MICCAI 2000: 3rd Int. Conf. Medical Image Computing and Com-puter-Assisted Intervention, A. M. DiGioia and S. Delp, Eds., 2000, pp.422–431.
[13] R. E. Hagan, K. E. Mark, L. Wang, S. Joshi, M. I. Miller, and R. D. Bu-cholz, “Mesial temporal sclerosis and templobe epilepsy: MR imagingdeformation-based segmentation of the hippocampus in five patients,”Radiology, vol. 216, pp. 291–297, 2000.
[14] K. H. Zou, W. M. Wells, R. Kikinis, and S. K. Warfield, “Three vali-dation metrics for automated probabilistic image segmentation in braintumors,” Statist. Med., vol. 23, pp. 1259–1282, 2003.
[15] A. P. Zijdenbos, B. M. Dawant, R. A. Margolin, and A. C. Palmer, “Mor-phometric analysis of white matter lesions in MR images: Method andvalidation,” IEEE Trans. Med. Imag., vol. 13, pp. 716–724, Dec. 1994.
[16] G. Gerig, M. Jomier, and M. Chakos, “Valmet: A new validation toolfor assessing and improving 3D object segmentation,” in Proc 4th Int.Conf. Medical Image Computing and Computer-Assisted Intervention(MICCAI 2001), M. A. Viergever, Ed., 2001, pp. 516–523.
[17] M. Everingham, H. Muller, and B. Thomas, “Evaluating image seg-mentation algorithms using the Pareto fron,” in Lecture notes in Com-puter Science. Berlin, Germany: Springer-Verlag, 2002, vol. 2353, pp.34–48.
[18] R. C. Gonzales and R. E. Woods, Digital Image Prossing, 2nded. Upper Saddle River, NJ: Prentice-Hall, 2002, ch. 11.
[19] J. R. Bennett and J. S. Mac Donald, “On the measurement of curvature ina quantized environment,” IEEE Trans. Comput., vol. C-24, Aug. 1975.
[20] C. T. Zahn and R. Z. Roskies, “Fourier descriptors for plane closedcurves,” IEEE Trans. Comput., vol. C-21, Mar. 1972.
[21] P. Peixoto, J. Goncalves, and H. Araujo, “Real-time gesture recognitionsystem based on contour signatures,” in Proc. Int. Conf. Pattern Recog-nition, vol. 1, 2002, pp. 447–450.
[22] L. Wang, T. Tan, H. Ning, and W. Hu, “Silhouette analysis-based gaitrecognition for human identification,” IEEE Trans. Pattern Anal. Mach.Intell., vol. 35, no. 12, pp. 1505–1518, 2003.
[23] E. L. Brill, “Character recognition via Fourier descriptors,” in WESCONDig. Tech., Papers, Qualitative Pattern Recognition Through ImageShaping. WESCON, 1968, Session 25.
[24] E. Persoon and K.-S. Fu, “Shape discrimination using Fourier descrip-tors,” IEEE Trans. Pattern Anal. Mach. Intell., vol. PAMI-8, no. 3, May1986.
[25] W. Niblack, An Introduction to Digital Image Prossing. Upper SaddleRiver, NJ: Prentice-Hall, 1986, ch. 5.
[26] P. J. Besl and N. D. McKay, “A method for registration of 3-D shapes,”IEEE Trans. Pattern Anal. Mach. Intell., vol. 14, no. 2, pp. 239–256,Feb. 1992.
[27] W. E. Lorensen and H. E. Cline, “Marching cubes: A high resolution 3Dsurface construction algorithm,” in Proc. SIGGRAPH ’87, vol. 21, 1987,pp. 163–169.
Related Documents