UTILIZATION OF FRICTION STIR PROCESSING TO IMPROVE THE MECHANICAL PROPERTIES OF GAS METAL ARC WELDED 5083 ALUMINUM ALLOY PLATES A THESIS SUBMITTED TO THE GRADUATE SCHOOL OF NATURAL AND APPLIED SCIENCES OF MIDDLE EAST TECHNICAL UNIVERSITY BY SHAHIN TAKHT FIROUZEH IN PARTIAL FULFILLMENT OF THE REQUIREMENTS FOR THE DEGREE OF MASTER OF SCIENCE IN METALLURGICAL AND MATERIALS ENGINEERING FEBRUARY 2016

Welcome message from author
This document is posted to help you gain knowledge. Please leave a comment to let me know what you think about it! Share it to your friends and learn new things together.
Transcript

UTILIZATION OF FRICTION STIR PROCESSING TO IMPROVE THE
MECHANICAL PROPERTIES OF GAS METAL ARC WELDED 5083
ALUMINUM ALLOY PLATES
A THESIS SUBMITTED TO
THE GRADUATE SCHOOL OF NATURAL AND APPLIED SCIENCES
OF
MIDDLE EAST TECHNICAL UNIVERSITY
BY
SHAHIN TAKHT FIROUZEH
IN PARTIAL FULFILLMENT OF THE REQUIREMENTS
FOR
THE DEGREE OF MASTER OF SCIENCE
IN
METALLURGICAL AND MATERIALS ENGINEERING
FEBRUARY 2016


Approval of the thesis:
UTILIZATION OF FRICTION STIR PROCESSING TO IMPROVE THE
MECHANICAL PROPERTIES OF GAS METAL ARC WELDED 5083
ALUMINUM ALLOY PLATES
submitted by SHAHIN TAKHT FIROUZEH in partial fulfillment of the requirements
for the degree of Master of Science in Metallurgical and Materials Engineering
Department, Middle East Technical University by,
Prof. Dr. Gülbin Dural Ünver __________
Dean, Graduate School of Natural and Applied Sciences
Prof. Dr. C. Hakan Gür __________
Head of Department, Metallurgical and Materials Engineering
Prof. Dr. C. Hakan Gür __________
Supervisor, Metallurgical and Materials Engineering Dept. METU
Examining Committee Members:
Prof. Dr. Rıza Gürbüz ______________
Metallurgical and Materials Eng. Dept. METU
Prof. Dr. Bilgehan Ögel ______________
Metallurgical and Materials Eng. Dept. METU
Prof. Dr. C. Hakan Gür ______________
Metallurgical and Materials Eng. Dept. METU
Assist. Prof. Dr. Kazım Tur ______________
Metallurgical and Materials Eng. Dept. Atılım University
Assist. Prof. Dr. Mert Efe ______________
Metallurgical and Materials Eng. Dept. METU
Date: 04.02.2016

iv
I hereby declare that all information in this document has been obtained and
presented in accordance with academic rules and ethical conduct. I also declare
that, as required by these rules and conduct, I have fully cited and referenced all
material and results that are not original to this work.
Name, Last name: Shahin TAKHT FIROUZEH
Signature
v
ABSTRACT
UTILIZATION OF FRICTION STIR PROCESSING TO IMPROVE THE
MECHANICAL PROPERTIES OF GAS METAL ARC WELDED 5083
ALUMINUM ALLOY PLATES
Takht Firouzeh, Shahin
M. S., Department of Metallurgical and Materials Engineering
Supervisor: Prof. Dr. C. Hakan GÜR
February 2016, 85 pages
Fatigue failure of the welded structures is a major problem in engineering applications.
It is known that the heat affected zone (HAZ) of the welded Al-alloys is prone to fail
due to coarse microstructure and poor mechanical properties. Therefore, any
improvement in HAZ may extend the service life of the welded component. The
hypothesis of this study is that localized application of friction stir processing (FSP)
before welding may improve the mechanical properties of HAZ, and thus, may reduce
the fatigue crack growth rate. The 5083 Al-alloy plates were joined by following two
different routes: application of gas metal arc welding in a conventional way, and
application of gas metal arc welding after FSP of the bevel zones of the plates which
are going to be affected by heat input. To investigate the improvements, hardness,
tensile and fatigue crack propagation tests were performed, and microstructures and
fracture surfaces were investigated by optical and electron microscopy.
Keywords: Friction Stir Processing, Gas Metal Arc Welding, Heat Affected Zone,
Mechanical Properties, Fatigue Crack Growth Rate

vi
ÖZ
GAZ METAL ARK KAYNAĞI İLE BİRLEŞTİRİLMİŞ 5083 ALÜMİNYUM
ALAŞIMI PLAKALARIN MEKANİK ÖZELLİKLERİNİN GELİŞTİRİLMESİ İÇİN
SÜRTÜNME KARIŞTIRMA PROSESİNİN KULLANILMASI
Takht Firouzeh, Shahin
Yüksek Lisans, Metalurji ve Malzeme Mühendisliği Bölümü
Tez Yöneticisi: Prof. Dr. C. Hakan Gür
Şubat 2016, 85 sayfa
Kaynaklı yapılardaki yorulma hasarı, mühendislik uygulamalarında karşılaşılan temel
sorunlardan biridir. Kaynaklanan Al-alaşımlarında ısıdan etkilenen bölgenin iri taneli
içyapısı ve zayıf mekanik özellikleri nedeniyle yorulma hasarlarına yatkın olduğu
bilinmektedir. Bu nedenle, ısıdan etkilenen bölgede yapılacak herhangi bir iyileştirme,
kaynaklı yapının kullanım ömrünü uzatacaktır. Bu çalışma, kaynak öncesinde
plakaların kaynak hazırlık bölgelerine sürtünme karıştırma işlemi uygulanarak, kaynak
sonrasında oluşan ısıdan etkilenen bölgenin mekanik özelliklerinin iyileşeceği ve
yorulma çatlağı ilerleme hızının düşürülebileceği hipotezine dayanmaktadır. Deneysel
çalışmalarda, 5083 alüminyum alaşımı plakalara iki farklı yöntem uygulandı: birinci
yöntemde plakalar gaz metal ark kaynağı ile birleştirildi, ikinci yöntemde ise kaynak ısı
girdisinden etkilenecek kaynak ağzı bölgesine sürtünme karıştırma işlemi
uygulandıktan sonra gaz metal ark kaynağı yapıldı. Özelliklerdeki iyileşmeleri tespit
etmek için sertlik, çekme ve yorulma çatlağı ilerleme testleri gerçekleştirildi;
mikroyapılar ve kırılma yüzeyleri optik mikroskop ve elektron mikroskobu ile
incelendi.
Anahtar Kelimeler: Sürtünme Karıştırma Prosesi, Gaz Metal Ark Kaynağı, Isıdan
Etkilenen Bölge, Mekanik Özellikler, Yorulma Çatlağı İlerleme Hızı

vii
To My Teachers

viii
ACKNOWLEDGMENTS
I am deeply thankful to my supervisor Prof. Dr. C. Hakan GÜR, for his generous
efforts, trust and guidance.
Invaluable directions, motivations and positive attitude of Dr. Süha TİRKEŞ and Dr.
Koray YURTIŞIK is highly appreciated.
Without precious efforts and sincere support of Mrs. Günseli AKÇAY, Mr. Göksu
GÜRER, Mr. Mertcan BAŞKAN, Mr. Tolga ERTÜRK, Mrs. Burcu TOLUNGUÇ,
Mrs. Mine KALKANLI, Mr. Atalay ÖZDEMİR, Mr. Cemal YANARDAĞ and Mr.
Orhan AYDIN, progression within the study would not be possible. It was a pleasure to
cooperate with them.
I am grateful for supports of METU Welding Technology and NDT Center, and
NOKSEL Boru Sanayi A.Ş.
The fellowship of METU Rugby teammates and METU swimming pool athletes was
one of the most delightful assets in this period.
My Family was my strongest motivation source to accomplish my studies.

ix
TABLE OF CONTENTS
ABSTRACT..................................................................................................................... v
ÖZ .................................................................................................................................... v
ACKNOWLEDGMENTS ............................................................................................ viii
LIST OF TABLES .......................................................................................................... xi
LIST OF FIGURES ....................................................................................................... xii
CHAPTERS ..................................................................................................................... 1
1. INTRODUCTION ....................................................................................................... 1
2. THEORY ..................................................................................................................... 3
2.1. Properties of 5083, Aluminum Alloy .................................................................... 3
2.2. Joining of Aluminum Alloys ................................................................................. 6
2.3. Friction Stir Processing ......................................................................................... 7
2.3.1 Forces .............................................................................................................. 9
2.3.2 Material Flow ................................................................................................ 10
2.3.3. Stresses and Strains ...................................................................................... 12
2.3.4 Defects ........................................................................................................... 13
2.3.5 Residual Stresses ........................................................................................... 15
2.3.6 Microstructure ............................................................................................... 16
2.4. Crack Growth ...................................................................................................... 18
2.5. Effects of Multi-pass FSP and Heat Treatment of FSPed Plates ........................ 21
3. EXPERIMENTAL ..................................................................................................... 27
3.1. Base Metal ........................................................................................................... 27
3.2. Methods Used ..................................................................................................... 27
3.3. Friction Stir Processing ....................................................................................... 28
3.3.1. Operational Procedures ................................................................................ 28
3.3.2. Selection of FSP tool and Optimization of Process Parameters ................... 29

x
3.3.3. Measurement of Temperature ...................................................................... 30
3.4. Gas Metal Arc Welding....................................................................................... 31
3.4.1. Welding of Friction Stir Processed Plates .................................................... 32
3.5. Radiographic Testing .......................................................................................... 33
3.6. Microstructural Analysis ..................................................................................... 33
3.7. Mechanical Testing ............................................................................................. 34
3.7.1. Tensile Test................................................................................................... 34
3.7.2. Hardness Test ............................................................................................... 35
3.7.3. Fatigue Crack Propagation Test ................................................................... 35
4. RESULTS AND DISCUSSION ................................................................................ 41
4.1. FSP Applications ................................................................................................. 41
4.1.1. Trials with A01 Tool .................................................................................... 41
4.1.2. Trials with Triflute Tool ............................................................................... 47
4.1.3. Trials with Triflat Tool ................................................................................. 48
4.2. Microstructural Analysis ..................................................................................... 50
4.2.1. Base Metal .................................................................................................... 50
4.2.2. Friction Stir Processed Metal ....................................................................... 52
4.2.2. Heat Affected Zone of Base Metal ............................................................... 56
4.2.3. Heat Affected Zone of the FSPed and Welded Metal .................................. 57
4.3. Mechanical Tests ................................................................................................. 61
4.3.1. Hardness Tests .............................................................................................. 61
4.3.2. Tensile Test................................................................................................... 67
4.3.3. Fatigue Crack Propagation Test ................................................................... 69
5. CONCLUSIONS .................................................................................................... 79
REFERENCES .............................................................................................................. 81

xi
LIST OF TABLES
TABLES
Table 2.1. Mechanical properties of 5083 Al-alloy at different tempers; O: As-cast and
Annealed, H1: Strain Hardened Only, H3: Strain Hardened and Stabilized [8] ............. 5
Table 2.2. Mechanical properties of 5083 Al-alloy at various temperatures [8] ............. 5
Table 3.1. Chemical analysis of the base metal ............................................................. 27
Table 3.2. Overview of the experiments ........................................................................ 28
Table 3.3. Process parameters of GMAW ..................................................................... 32
Table 4.1. FSP parameters conducted with A01 tool .................................................... 42
Table 4.2. Parameter set performed with Triflute Tool ................................................. 47
Table 4.3 Parameter sets performed by Truncated 3-f Tool .......................................... 48
Table 4.4 Hardness values of the base metal ................................................................. 61
Table. 4.5. Results of the tensile tests ............................................................................. 67
Table 4.6. Results of notch tensile tests ......................................................................... 69
Table 4.7. Results of the crack growth studies .............................................................. 74
Table 4.8. The summary of the results........................................................................... 78

xii
LIST OF FIGURES
FIGURES
Figure 2-1. Binary Aluminum-Magnesium Phase Diagram [7] ...................................... 4
Figure 2-2 Effect of Magnesium addition on Strength of Al 5xxx [8] ............................ 4
Figure 2-3 Directions in FSW/P ...................................................................................... 8
Figure 2-4. Force and torque vs. time measurements for FSP [19] ................................. 9
Figure 2-5. Magnitudes of force and torque for different speed parameters [15] .......... 10
Figure 2-6. Marker study to observe the final flow after passing of probe [17] ............ 11
Figure 2-7. Instantaneous temperature profile during fsp, and shear zone around the pin
[19] ................................................................................................................................. 12
Figure 2-8. Analogy between chip morphology in machining and material flow in FSW
[11] ................................................................................................................................. 14
Figure 2-9. A typical residual stress vs. distance diagram for FSP/W [25] ................... 15
Figure 2-10. Variation of residual stresses with travel speed and rotational speed [25] 16
Figure 2-11. Recrystallization of microstructure after tool stirring the region [11] ...... 17
Figure 2-12. Change of grain size during FSP [19] ....................................................... 18
Figure 2-13. S-N curves - Crack growth rates for different load amplitudes [28]......... 19
Figure 2-14. Logarithmic crack growth rate [32] .......................................................... 20
Figure 2-15. The evolution of nugget zone microstructure during multi-passing ......... 22
Figure 2-16. The change of dislocation density during the multi-pass FSP (a) First pass,
(b) Second pass, (c) Final pass [33] ............................................................................... 23
Figure 2-17. Conditions for discontinuous growth as a function of the relative size,
boundary energies and mobilities of the grains [34] ...................................................... 23
Figure 2-18. Conditions for which discontinuous growth is predicted [34] .................. 24

xiii
Figure 2-19. The effect of particles on abnormal grain growth of grain with various size
ratios............................................................................................................................... 25
Figure 2-20. Stability prediction based on Humphrey model [33] ................................ 26
Figure 3-1. Macrograph of the FSPed plate with the overlapping technique ................ 29
Figure 3-2. Photographs of the tools used in the experiments ....................................... 30
Figure 3-3. Positions of the thermocouples. (a) Top view, (b) Side view. .................... 31
Figure 3-4. Bevel geometry for GMAW ....................................................................... 32
Figure 3-5. Macrograph of the joint (FSPed and welded) ............................................. 32
Figure 3-6. Radiographs (a) welded plates, (b) FSPed plate ......................................... 33
Figure 3-7. Sketch of tensile test specimens .................................................................. 35
Figure 3-8. Schematic view of the compact tension specimen ...................................... 36
Figure 3-9. Notch location at HAZ for compact tension specimen ............................... 36
Figure 3-10. Crack size versus number of cycles curve for the HAZ of the FSPed +
welded metal after data elimination. .............................................................................. 38
Figure 3-11. log (da/dK) versus log (ΔK) curves of FSPed and welded specimen ....... 39
Figure 4-1. Top view of the plates FSPed with A01 tool .............................................. 43
Figure 4-2. Effect of rotational speed of FSP on the maximum temperature, measured
in the sample (traveling speed = 2.1 cm/min) ................................................................ 44
Figure 4-3. Effect of travelling speed of FSP on the maximum temperature measured in
the samples (rotational speed = 355 rpm) ...................................................................... 44
Figure 4-4. Variation of temperature: ............................................................................ 45
Figure 4-5. Radiographs and side views of the single pass FSPed plates ..................... 46
Figure 4-6. Top View of the plate on which the cold and hot parameter sets were
applied ............................................................................................................................ 49
Figure 4-7. Top view of the plates FSPed with the overlapping technique ................... 49
Figure 4-8. (a) Macro 3-D view of base metal plate ...................................................... 50
Figure 4-9. Optical view of the polished specimens ...................................................... 51
Figure 4-10. EDS results of the intermetallic particles .................................................. 52

xiv
Figure 4-11. Microstructures after FSP by the hot parameter set .................................. 52
Figure 4-12. Microstructures after FSP by the cold parameter set ................................ 53
Figure 4-13. Cross-sectional view of the FSPed plate ................................................... 54
Figure 4-14. The extended microstructural view of passage from neighboring metal to
the FSPed region (a) Advancing side, (b) Retreating side ............................................. 54
Figure 4-15. Radiograph of the plate having overlapped FSP lines (290 rpm, 100
mm/min) ......................................................................................................................... 55
Figure 4-16. EBSD image of the plate after application of the overlapped FSP (290rpm,
100mm/min) ................................................................................................................... 56
Figure 4-17. Macro view of the welded plate ................................................................ 56
Figure 4-18 Extended microstructure view of the welded plate .................................... 57
Figure 4-19. Micrograph of HAZ (50x) ......................................................................... 57
Figure 4-20. Cross-sectional view of FSPed + welded plates ....................................... 58
Figure 4-21. Extended microstructure view of the FSPed and welded plates ............... 58
Figure 4-22. Micrographs of HAZ of the FSPed + welded region ................................ 59
Figure 4-23. The fractions of misorientation angle among grains of overlapped FSPed
plate, prior to welding process ....................................................................................... 60
Figure 4-24. A comparison of the HAZ in CT specimens: ............................................ 61
Figure 4-25 Vertical and horizontal hardness profiles of the sample FSPed with the
overlapping technique (720 RPM – 100 mm/min) ........................................................ 63
Figure 4-26. Vertical and horizontal hardness profiles of the sample FSPed with the
overlapping technique (290 RPM – 185 mm/min) ........................................................ 63
Figure 4-27. Hardness profile of the specimens after overlapping FSP process from the
retreating side to advancing side of base metal ............................................................. 64
Figure 4-28. Hardness profile of the welded plate (2 mm below the surface) ............... 65
Figure 4-29. Hardness profile of the welded material (7 mm below the surface) ......... 66
Figure 4-30. Hardness profile of the FSPed and welded plate (2 mm below surface) .. 66
xv
Figure 4-31. Hardness profile of the FSPed and welded plate (7 mm below the surface)
....................................................................................................................................... 67
Figure 4-32. Stress-Strain curves of the samples ........................................................... 68
Figure 4-33. Fracture surfaces of tensile specimens ...................................................... 69
Figure 4-34. Fracture surface of the FSPed CT specimen ............................................. 70
Figure 4-35. Striations and their length at a distance of ................................................ 70
Figure 4-36. Crack length versus number of cycles curves for the base metal ............. 71
Figure 4-37. Crack growth rate versus stress intensity factor curves for the base metal71
Figure 4-38. Crack length versus number of cycles curves for HAZ ............................ 72
Figure 4-39. Crack growth rate versus stress intensity factor curves for the HAZ ....... 72
Figure 4-40. Crack length versus number of cycles curves for the HAZ of FSPed and
welded plate ................................................................................................................... 73
Figure 4-41. Crack growth rate versus stress intensity factor curves for the HAZ of pre-
FSPed plate .................................................................................................................... 73
Figure 4-42. Crack growth rate versus stress intensity factor curves of the samples .... 74
Figure 4-43. Comparison of crack growth rate versus stress intensity factor curves for
HAZ of base metal (HAZ1, HAZ2) and HAZ of FSPed and welded metal(PW1, PW5)
....................................................................................................................................... 75
Figure 4-44. Fracture surface at the vicinity of the ΔKth for ......................................... 76
Figure 4-45. Side cracks in the fracture surface of the FSPed and welded metal at the
vicinity of ΔKth .............................................................................................................. 76
Figure 4-46. Intermetallic particle in the plastic deformation zone of the crack tip ...... 77

xvi

1
CHAPTER 1
CHAPTER
1. INTRODUCTION
Aluminum is a commonly used material in industry because of its lightweight,
corrosion resistance, recyclability and strength. Among its alloys, 5083-H111 is an
ideal alloy for production of armor and marine vehicles because of its weldability,
reduced sensitivity to hot cracking and moderate strength. For joining of the parts gas
metal arc welding (GMAW) is a preferred technique because of its feasibility.
However, the drawbacks of this method such as coarsening of grains and precipitation
in HAZ, limit the mechanical properties of the weldments. When the dynamic loads on
the on the welded structures are taken into account, crack initiation and propagation is
likely to happen at HAZ.
Better mechanical properties can be achieved, maintaining finer grains and equiaxed
microstructure (high-angle grain boundaries) [1]. These properties are obtainable with
means of continuous dynamic recrystallization. Utilization of conventional thermo
mechanical processes is not an asset for this purpose. This is due to the high stacking
fault energy of aluminum which ease the cross slip of screw dislocation being caused to
occurrence of recovery in expense of recrystallization [2].
Friction stir processing (FSP), is an adaptation of friction stir welding (FSW) [2]. It has
been applied of as an improvement technique in this study. FSP is a severe
deformation process which modifies the microstructure by means of dynamic
recrystallization. Trials of FSP on cast aluminum alloys have shown a tremendous
decrease in grain and precipitation size [3]. The final microstructure is observed to be
equiaxed. The strain energy obtained from mechanical work of tool rotation and
2
travelling is used up for recovery and recrystallization of the former grains facilitating
the temperatures above the recrystallization temperature of material [2].
While such a microstructure is obtained, the effect of weld heat on its mechanical
properties is expected to be less than the effect on mechanical properties of H111
temper. An MSc. thesis on post FSP of weld metal using the same material has already
been completed, and a remarkable improvement in mechanical properties was obtained
[4].
The theory topics of this study are presented in Chapter 2. The procedures of FSP and
GMAW which were applied on the 20 mm thick plates of 5083-H111 aluminum alloy
are given. Optimization trials, microstructural investigations, tensile, hardness and
crack propagation tests were performed. The methodology is explained in Chapter 3.
Images from the microstructure of specimens, stress-strain diagrams, hardness profiles,
crack size versus number of cycle curves and da/dN versus ΔK curves are presented.
Fractured surfaces were investigated using scanning electron microscopy. The
improvements are pointed out and the results are discussed in Chapter 4.

3
CHAPTER 2
2. THEORY
2.1. Properties of 5083, Aluminum Alloy
In Aluminum alloy system, the first digit is to illustrate the alloying element. Second
digit shows the variation in original basic alloy. The third and fourth digit designates
the specific alloy within the series.
The main alloying element of the 5083-H111 Aluminum alloy is magnesium. It is the
83rd
variation of the basic alloy which has been subjected to some work hardening but,
not as much as required for H11 (Table 2.1). The number following H1 indicates
degree of strain hardening [5].
Considering the binary phase diagram of aluminum and magnesium, (Figure 2-1) the
slope of the solvus line is positive. Although this makes 5xxx series suitable for
precipitation hardening, the problem of formation face centered cubic Al3Mg2, prevents
the commercialization [6]. Therefore, it is categorized as non-heat treatable alloys.
The effect of Magnesium addition on tensile yield strength and elongation amount is
illustrated in Figure 2-2. Magnesium in 5xxx improves corrosion resistance and
strength via solution strengthening. Addition of Manganese, also presents good amount
of formability. Besides, formation of Al6(Mn, Fe) and Al12(Mn, Fe)3Si by eutectic
reaction, retard the recrystallization and controls the grain size [6].
The most observed second-phase particles are stated to be Mg2Si and Al6(Mn, Fe).

4
Figure 2-1. Binary Aluminum-Magnesium Phase Diagram [7]
Figure 2-2 Effect of Magnesium addition on Strength of Al 5xxx [8]
5
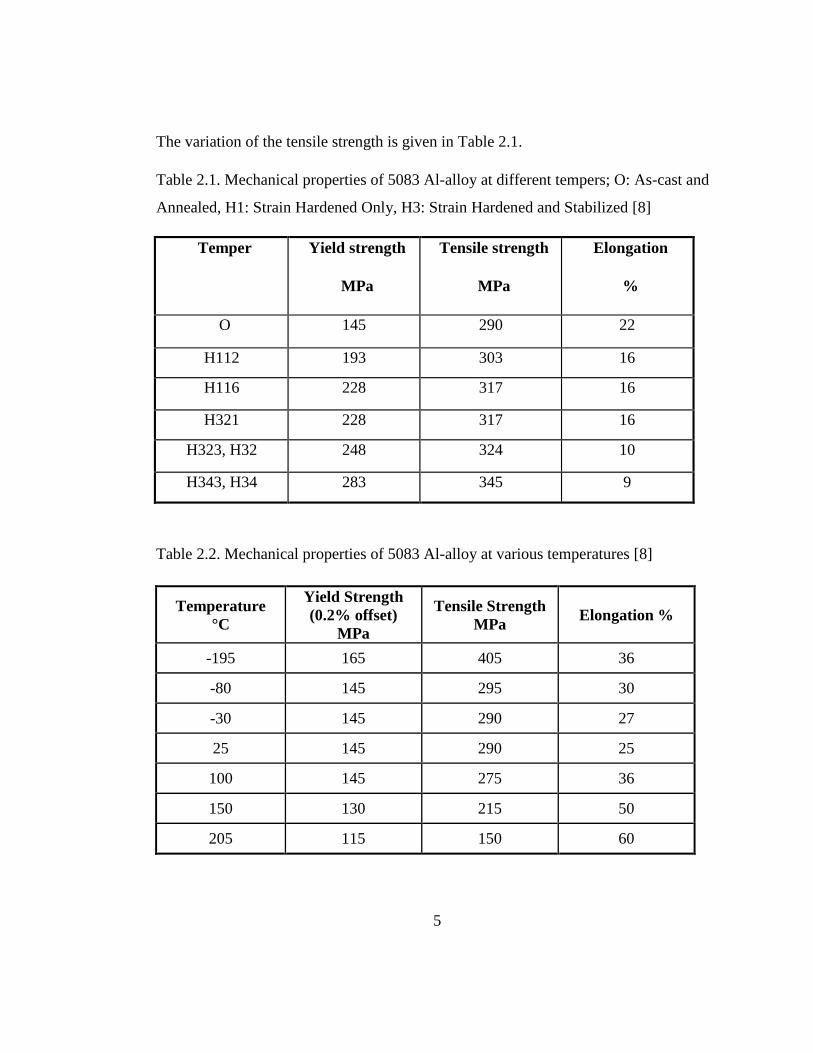
The variation of the tensile strength is given in Table 2.1.
Table 2.1. Mechanical properties of 5083 Al-alloy at different tempers; O: As-cast and
Annealed, H1: Strain Hardened Only, H3: Strain Hardened and Stabilized [8]
Temper Yield strength
MPa
Tensile strength
MPa
Elongation
%
O
145
21
290
42
22
H112 193
28
303
44
16
H116 228
33
317
46
16
H321 228
33
317
46
16
H323, H32 248
36
324
47
10
H343, H34 283
41
345
50
9
Table 2.2. Mechanical properties of 5083 Al-alloy at various temperatures [8]
Temperature
°C
Yield Strength
(0.2% offset)
MPa
Tensile Strength
MPa Elongation %
-195 165 405 36
-80 145 295 30
-30 145 290 27
25 145 290 25
100 145 275 36
150 130 215 50
205 115 150 60

6
2.2. Joining of Aluminum Alloys
Heat input during welding of aluminum alloys, remarkably affects the microstructure
and mechanical properties of the heat affected zone (HAZ) due to excellent heat
conductivity [6]. Although formation of the HAZ is inevitable, some modifications
such as formation of fine and equiaxed grains, breaking-up and uniform distribution of
precipitates, are required to minimize the negative effects.
Generally, the heat is applied locally to edges that are going to be welded. The energy
input (H), is in arc welding is calculated as follows:
H = EI/V ( 1 )
where: E = volts, I = amperes, V = Travel velocity of heat source (mm/sec)
To calculate the Hnet, H has to be multiplied with the heat transfer efficiency, which is
between 0.8 and 1.0. In order to melt the filler and base metal during the arc welding,
an amount of heat Q is needed. This quantity is the sum of heat needed to elevate the
metal temperature to melting temperature and the heat needed to melt the solid:
Q = (Tm+273)2 / 300000 [J/mm3] ( 2 )
where Tm is the melting temperature of the welded material in °C.
Because of heat input three regions exist:
Volume of the weld metal, which consists of molten base metal and the filler
metal (WM),
Heat affected zone (HAZ),
Un-effected base metal (BM).
In most of the arc welding methods the arc is used as the source of the heat. This arc is
normally formed with a current of 250 A and voltage of 25 V. The efficiency of arc
welding methods is between 20% and 85%.
7
Gas metal arc welding (GMAW) utilizes a continuous filler wire which is fed by nozzle
into the weld pool. The shielded gas is also blown by the nozzle. The energy is
provided by power supply, which produces the arc and heat needed to melt the filler
wire and base metal. In order to maintain a stable, spatter free and axial spray, spray arc
transfer is used for welding of thick pieces. In this method, a portion of molten metal is
taken by spray arc and it is sprayed to the base metal from the electrode wire. Argon-
helium remix gas is used in this method for aluminum and its alloys due to large pool
size. The choice of electrode is an important matter. The filler material has to match the
base metal or even enhance its properties.
While heat treatable alloys are more sensitive to the heat of fusion welding, according
to previous studies, dramatic drops of tensile strength and endurance of alloys in HAZ
region of non-heat treatable alloys are observed [9] [10]. Hadadzadeh et al, measured a
drop up to 50 MPa in both tensile and yield strengths of HAZ region in Aluminum
5083-H111.
2.3. Friction Stir Processing
Friction stir processing (FSP) was invented a decade after invention of friction stir
welding (FSW) in 1991. FSW is a complex solid-state welding technique which is
favorable in many terms. It is mostly applicable to metals with superplastic behaviors
during butt welding. However it is not commonly used because of higher cost and
difficulty in application. FSP is a modification of FSW, with the same methodology,
which is a regional refinement method. It is conducted to maintain better properties,
due to the changes on microstructure.
In these processes (FSW and FSP), there is a rapidly rotating tool plunged into the
material, until the shoulder is in firm contact with the surface of material. Then, the tool
starts to travel in the process/ weld line. This contact and also the flow of the material
around the tool cause the formation of heat, which decreases the flow stress of the

8
material. The softened, plasticized material is easily transported from upfront of the
tool into its backward, where material is forged to the elderly transported material. The
temperature of the material does not reach to its melting temperature, as this hot-shear
deformation process happens. This process causes the formation of an asymmetric
profile of the process/weld line. Therefore, advancing and retreating sides are defined
and formed in process/ weld profile. Both sides differ by the heat transfer from them,
their material flow characteristics and somehow hardness values. Also, three different
regions observed in this process are nugget zone (NZ), thermo-mechanically affected
zone (TMAZ) and the HAZ. Dramatic changes in the microstructure of these regions
are observed (especially NZ).
Figure 2-3 Directions in FSW/P
Obtaining fine and equi-axed grains and broke-up of precipitations uniformly dispersed
in structure, are the main and desired results observed. Friction stir processing of cast
aluminium alloys results in refinement of matrix grains, break-up of coarse dendrites,
fragmentation of secondary phases and uniform distribution of secondary particles [11]
[12]. All of these provide enough motivation to maintaining such a microstructure that
will omit the main post-welding problems in HAZ of arc welded specimens. FSP,
generally speaking, is a process including forging and extrusion with higher rates of
strain during which, dynamic recrystallization phenomena is happening. There are

9
many parameters which affect the quality of the process in different manners. The most
important parameters are rotational and transverse speeds and tool geometry [13] [14].
2.3.1 Forces
During FSP, three forces are applied on the tool. These are the forces in the x, y and z
direction as shown in Figure 2-3. Studying the magnitude, direction and the changes of
these forces is important to get familiar with the deformational characteristics of the
process. In their study, Zimmer and others [15] have measured the amount of forces
created during FSW of 6mm thick 6000 series aluminum plate. The generated torque
has also been measured and it is stated that there are six steps in which force and torque
amounts are subjected to change. These measurements and steps are illustrated in
Figure 2-4. It is obvious that the maximum force amount is measured in z-direction
which explain the urge of the material to flow out. However, the increase in the cross-
section are of the shoulder may prevents this issue.
Figure 2-4. Force and torque vs. time measurements for FSP [19]

10
The plate thickness in this study is 20mm, which is going to be processed from both
sides by a 9mm long pin. Therefore, it is roughly approximated that, these forces are
going to be doubled in this case. In addition, the experiments at Zimmer’s work has
done using a simple geometry tool design which has not as much sharp corners and
threads as the Triflat tool used in this study. Thus, even higher force magnitudes is
expected.
Also, the forces are directly affected by the rotational speed and travel speed of the
tool. As the travel speed increases and rotational speed decreases the force magnitudes
are increased [16]. Also in Figure 2-5, for different plunging speeds and travel speeds
the axial force and torque amount is illustrated.
Figure 2-5. Magnitudes of force and torque for different speed parameters [15]
2.3.2 Material Flow
The flow of material around the tool is probably the most important phenomenon that
defines the characteristics of the process. For different friction coefficients, various
flow patterns can be observed, and stress and strain amounts are directly related to

11
material flow. Most of the occuring defects during the FSP is due to material flow
behavior.
Most of the material flow studies were pusued by the marker method as Figure 2-6 or
simulation methods.
Figure 2-6. Marker study to observe the final flow after passing of probe [17]
In their work, Schmidt et al. have concluded that the thickness of the shear zone around
the tool is equal to advancing distance per evolution of the pin [18]. It can be stated
that maximum backward material transport (at the weld/ process centerline) is
approximately equal to the probe diameter. Also, shear zone must contain a greater
volume of material than it is needed to be transferred in each revolution. Most of the
material flow occurs through the retreating side and the transport of the plasticized
material behind the tool forms the united joint.

12
Figure 2-7. Instantaneous temperature profile during fsp, and shear zone around the pin
[19]
In the studies that have been mentioned above, only the two dimensional flows are
studied and illustrated. During the process, however, there are different kinds of flows
of plasticized material when the plate is taken to the account as a three dimensional
process. First, near the tool, a slug of plasticized material rotates around the tool. This
motion is driven by the rotation of the tool and the resulted friction between the tool
and the work-piece. Second, rotational motion of the threaded pin tends to push
material downward close to the pin which drives an upward motion of an equivalent
amount of material somewhat farther away. Finally, there is a relative motion between
the tool and the work piece [17].
Characteristics of the material flow are worth to study since, it is responsible for heat
formation and strain amounts. Therefore it will give enough knowledge to control the
process in order to get adequate results.
2.3.3. Stresses and Strains
The forces applied on the material can vary vastly with respect to stages of process or
weld. Measuring stress and strains in the processed zone is the main prequisite to
determine the deformation processing of material. In FSP, extrusion and forging are the
main issues for processing of the metal at high strain rates. Strain rates can vary also,

13
with respect to variation of FSP parameters and tool geometry. Amount of strain rate is
one of the important factors in grain size of stirred zone during the dynamic
recrystallization process. In their study for instance, Jata and Semiatin estimated a
typical deformation strain rate of 10 s-1
by measuring grain-size and using a correlation
between grain-size and Zener–Holloman parameter which is temperature compensated
strain rate [20]. Kokawa et al. estimated an effective strain rate in stir zone in the range
of 2–3 s-1
[10].
The strain rate was found to correlate with the flow stress and temperature as given in
[21]:
( 3 )
Where A, n and α, are material constants. Although they are functions of strain during
the work-hardening, these values get independent of it when a steady state of strain is
maintained and work hardening gets balanced with the recovery mechanism and
softening effect is maintained. This phenomena happens before the strain is equal to a
low value of 1. Since in FSP strain is much higher, a single set of material constant
with the assumption of being independent of strain can be used. Also, the apparent
activation energy Q are derived by fitting the equation to experimental data, and are all
independent of temperature. R is the gas constant and T stands for temperature.
Rearranging this expression effective stress can be written as
( 4 )
Where, Z=Ɛexp(Q/RT) is known as the Zener–Holloman temperature compensated
strain rate [22] [23] [24].
2.3.4 Defects
The main defects in FSW/P are porosities or surface defects. As two of the most
affecting parameters of FSW/P, rotational and travel speeds have a big role in

14
formation of these defects. For example keeping the rotational speed constant,
increasing the travel speed can cause wormholes created behind the pin in bottom
regions. As, the travel speed is increased, the number of wormholes are also increased.
It is because of the weak joining of the material resulted from inadequate material flow.
Generally, lower rotational over travel speed may cause formation of Wormholes near
the bottom.
Also in order to prevent the changes in microstructure, heat flow should be
homogeneous around the tool in order to have the same heat treatment all over the
processed area.
Another important fact is that, most of the cracks and porosities are observed around
the advancing side of the tool. An analogy with machining process of different metals
which is shown in Figure 2-8, can explain this issues. If the material has enough
ductility and a flow stress below the needed value created by heat, a proper and
continuous joining can happen.
Figure 2-8. Analogy between chip morphology in machining and material flow in FSW
[11]

15
2.3.5 Residual Stresses
Residual stresses can be advantageous and hazardous. In FSP/W residual stresses are
created by mechanical and thermal effects. In the worst case, up to half of the ultimate
tensile strength is observed along the stirred line. Which necessiates some small
amount of compressive residual stresses at HAZ of the workpiece.
In Figure 2-9, a typical surface residual stress distribution after FSW/ P is illustrated.
Application of tensioning during the process may result in compressive residual
stresses at the processed/ welded line. Richards et al. has shown that stretching at a
level of 50% tensile strength during FSP/ W created compressive residual stresses and
therefore, improvement in the crack propagation behavior [25] [26].
Generally, higher rotational speeds and lower transverse speeds, both increase residual
stresses.
Figure 2-9. A typical residual stress vs. distance diagram for FSP/W [25]
16
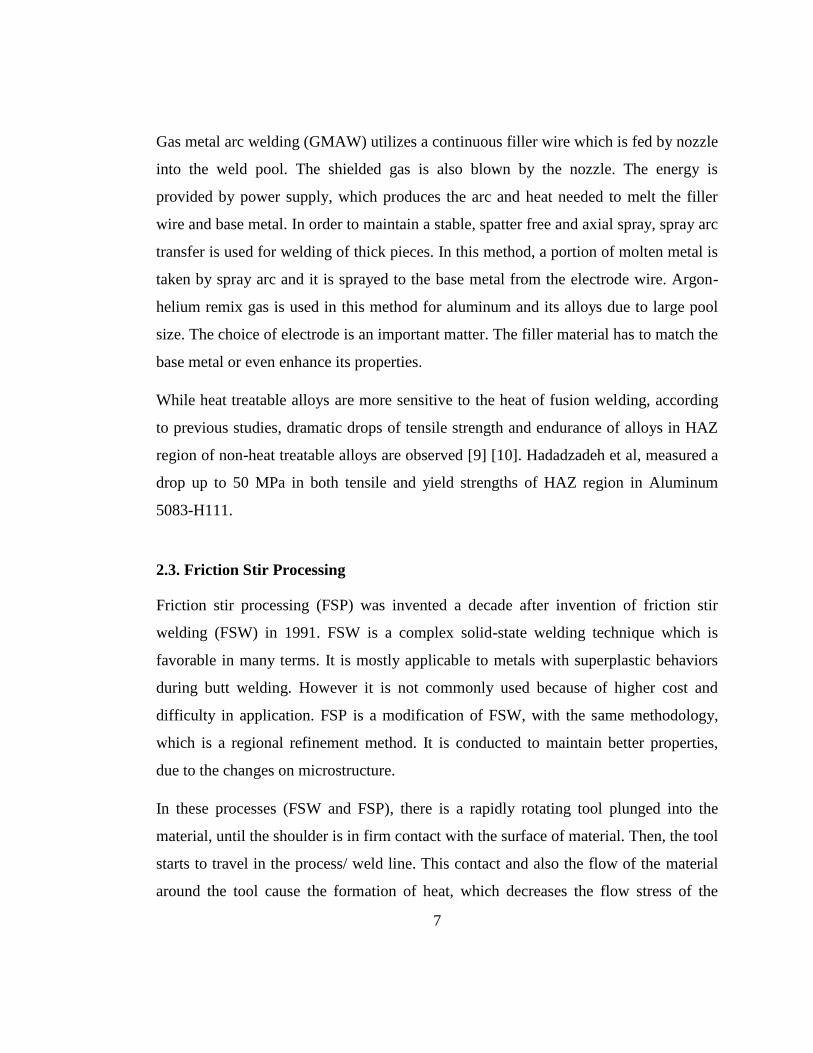
Figure 2-10. Variation of residual stresses with travel speed and rotational speed [25]
2.3.6 Microstructure
During FSP/W, dynamic recrystallization occurs. Thus, the final recrysalized
microstructure is finer than the original microstructure (Figure 2-11). As the tool
reaches the region of processing, at first high amount of plastic work is applied on
microstructure. This leaves the material with a highly deformed microstructure and
high stored energy inside. This energy is the driving force for further steps. Since
recovery and recrystallization is time and temperature dependant, elevated tempratures
makes the driving force to proceed the recovery of the deformed microstructure. At this
period subgrains are formed. As time passes, these subgrains get rid of the dislocations.
Subsequently, growth can happen. At final steps of recrystallization, new strain free
and fine grains are formed. In case, the temprature is enough and material is kept at
moderately elevated temperatures for some time, further continuos growth of grains
takes place and coarsening happens.

17
Figure 2-11. Recrystallization of microstructure after tool stirring the region [11]
Final grain size - although it is not the most important issue in FSW - is the main
characteristic and goal of the FSPed product. It is depended on many different factors
such as tool geometry, reached temperature and number of passes. Within optimum
conditions, 3 micron equiaxed grains are obtained in earlier studies and primary coarse
intermetallics are reported to get finer and dispersed more homogeneously [27]. In
Figure 2-12, a diagram of the grain boundary size vs. temperature of process is shown.

18
Figure 2-12. Change of grain size during FSP [19]
As a microstructure property, superplasticity of the FSP/W-ed material is another
outcome of the process. Briefly speaking, the criteria for superplastic material is
provided when fine grain size, equiaxed grains and strain free microstructure is
existing. FSP/W is a process which provides all of these properties at once when
performed at adequate conditions.
2.4. Crack Growth
The cracking is normally started at discontinuities or plastic strain accumulations in the
form of slip bands on the surface. Amount of stress concentration is an important factor
in initiation of the crack. Although in some cases the life of a material only consists of
crack propagation, because of the pre-existing defects, normally the service life is the
sum of crack initiation and propagation stages.
When the stress at tip of the crack is in a specific range, the crack will grow at each
cycle. These cycles form microscopic footprints on the fracture surface, which are
called striations. Striations are mostly observed in ductile metals. The amount of the
load and the amplitude amount are the most important factors in determination of the
cycle numbers, Nf, before failure.

19
Figure 2-13. S-N curves - Crack growth rates for different load amplitudes [28]
To investigate the behavior of the crack, different approaches are utilized. One of these
analytical procedures is the linear elastic fracture mechanics (LEFM). The stress in the
crack tip is correlated to nominal stress on the specimen, crack geometry, growth rate
and the resistance of the material. To find the stress state in vicinity of crack, therefore,
a factor of stress intensity K has been defined. Based on assumptions of LEFM, the
stress amount is leaded to infinite values in the crack tip. On a given constant load
amplitude (ΔP), load ratio (R) and cyclic frequency (ν), the crack size (a) will increase
with the number of the cycles (N). On their work Paris and Erdogan [29], revealed the
correlation between da/dN and the stress intensity parameter of the cycles. It was
suggested that ΔK determines the stresses in crack tip and it includes the ΔP and a.
Therefore following equation was derived:
(
)R,ν=f(ΔP, a) ( 5 )
( 6 )

20
When the log-log graph of ΔK and da/dN is drawn (Figure 2-14), C and m values can
be calculated from the linear second region which is called power law region. In region
I, the crack does not grow until ΔK reaches the threshold value. At the initiation, the
crack propagates at high shear stress planes which have a 45 degrees orientation to the
axial load. At these stages the refined grains and secondary particles are very helpful to
block the crack. They act as microstructural barriers. Then crack size changes rapidly
until it is calmed down in the second region, where the slips start to form in other
planes close to crack tip. This results in growth of crack perpendicular to load direction.
The third region is where crack has enlarged and crack is leaded to failure [30] [31].
Figure 2-14. Logarithmic crack growth rate [32]
The linear equation of the stage II, according to Paris law can be written as below:
( 7 )
According to equation 7, the values of m and C can be easily calculated by finding the
slope of the da/dN versus ΔK curve for m and the interception at y-axis to find the
value of C.

21
Another important factor in crack initiation and growth is the stress ratio value
(R=Pmin/Pmax). Since R is directly related to Kmax and Kmin values, it defines the
effective ΔK (ΔKeff) amount. ΔKeff also, has a critical role in crack closure mechanism,
which can happen through different situations. Plastic deformation at crack tip or
contact point of fracture surface, i.e. secondary particles are two instances. The
common characteristic of crack closure mechanism is reducing the ΔKeff. When the
crack surfaces are touching each other before the Kmin value is reached, the ΔK range is
simply derogated [31].
2.5. Effects of Multi-pass FSP and Heat Treatment of FSPed Plates
The consequences of multi-passing FSP technique have been investigated in study of
Chen et al. [33]. In this study, usage of overlapping technique caused one third of the
FSPed region to be subjected to double-passing. The effect of three consecutive FSP
passes (100% overlap) on 3.5mm thick Al-5083 plates was studied for two parameter
sets with constant travelling speed of 360 mm/min and rotational speeds of 600 rpm
and 1200 rpm. Slightly coarser grains have been observed for higher heat input (1200
rpm, 360 mm/min). However, a significant change has not been occurred in the grain
size of the nugget zone after the third pass (Figure 2-15).

22
Figure 2-15. The evolution of nugget zone microstructure during multi-passing
(a) First pass, (b) Second pass (c) Final pass, (d ) EBSD grain boundary map of final
pass [33]
While both specimens have lower dislocation densities with respect to the base metal,
the sample processed with hot parameter set had the least dislocation density.
Moreover, the dislocation density decreased dramatically by consecutive passes, due to
the heat provided for annealing and dynamic recrystallization (Figure 2-16).

23
Figure 2-16. The change of dislocation density during the multi-pass FSP (a) First pass,
(b) Second pass, (c) Final pass [33]
According to the Humphrey model [34], grain growth may happen in continuous or
discontinuous manner. While continuous growth takes place uniformly, in
discontinuous growth, abnormal grain growth (AGG) in a portion of the grains occurs.
In his model, the mean radius of grains and boundary type (misorientation θ, energy ɤ
and mobility M) are considered as the effective variables in growth (Figure 2-17).
Figure 2-17. Conditions for discontinuous growth as a function of the relative size,
boundary energies and mobilities of the grains [34]

24
As a conclusion of this model, applicable for materials with high stacking fault energy
such as aluminum, a scheme for discontinuous growth of a specific grain with respect
to average grain size is presented at Figure 2-18.
Figure 2-18. Conditions for which discontinuous growth is predicted [34]
Humphreys’ second study [35] focuses on effect of second phase particles for grain
growth. Adding the dimensionless pinning term, Z.
Z =
in which fv is fraction of particles with diameter of, d.
In Figure 2-19, the pinning effect of the particles with respect to size ratio of a specific
grain is shown. It is seen that with small value of Z, even low size ratios may cause
abnormal grain growth.

25
Figure 2-19. The effect of particles on abnormal grain growth of grain with various size
ratios [35]
There are a few recent studies on heat treatment of FSW/Ped heat treatable Aluminum
alloys [36] [37] [38]. It has been concluded that, at the temperatures above the
recrystallization temperature, annealing process results in instability of microstructure
and AGG. This issue may seriously affect the superplasticity of nugget zone obtained
through fine microstructure.
The stability of microstructure after the FSP is observed to be higher when the hot
parameter sets were used [33]. While annealing process (10 minutes at 465°C) of the
plates FSPed using the cold parameter set results in a high amount of AGG, the same
annealing process leaves the FSPed plates of hot parameter set with only a few
coarsened regions (8.1%). The AGG is observed mostly in the roots of the nugget zone.
Furthermore, increasing the annealing time from 10 minutes to one hour has increased
the AGG region up to 23.3%. Thus, the cold parameter sets are not efficient to keep the
stability of the FSPed region when the plate is going to be subjected to elevated
temperatures i.e. the heat of the fusion welding. Chen et al. have applied Humphreys’

26
model [35] to the FSPed Al-5083 plates, and have discovered different grain growth
behavior for each of the parameter sets in the nugget zone (Figure 2-20).
Figure 2-20. Stability prediction based on Humphrey model [33]

27
CHAPTER 3
3. EXPERIMENTAL
3.1. Base Metal
20 mm thick 5083-H111 Al-alloy plates (rolled and work hardened) were used. Prior
to spectrometry, the samples were ground with 400 grid abrasive papers. Standard and
experimental chemical compositions of base metal are given in Table 3.1.
Table 3.1. Chemical analysis of the base metal
* Maximum Amount
3.2. Methods Used
Conducted Test methods and the Test Equipment:
Chemical Analysis; Optical Emission Spectrometry (WAS Foundry
Spectrometer)
Micro-structural Evaluation; Polarized Optical Microscopy (Olympus) &
Scanning Electron Microscopy (FEI)
Hardness Test; Micro Hardness Test (Shimadzu Micro Hardness Tester)
Tensile Test; Uniaxial Tensile Test (Instron Universal Testing Machine)
5083 H111 Si Fe Cu Mn Mg Zn Cr Ti
Experimental 0.17 0.4 0.04 0.56 4.79 0.04 0.09 0.05
Standard 0.4-
0.7 0.4* 0.1* 0.4-1 4-4.9 0.25*
0.05-
0.25 0.15*

28
Crack Propagation Test; (Servo Hydraulic Machine (MTS), Crack Mouth
Opening Displacement Clip on Gage, Mobile Optical Microscope, MATLAB
Scripts)
Table 3.2 summarizes the overall methods and tests performed in this study.
Table 3.2. Overview of the experiments
Characterization
Method
Base Metal FSPed Base
Metal
GMAW
Weldment
GMAW of
FSPed Bevel
Chemical
Analysis
Microstructure
Investigation
Hardness Test
Tensile Test
Crack
Propagation
Test
Radiographic
Test
3.3. Friction Stir Processing
3.3.1. Operational Procedures
The process was done on plates of 170 mm x 300 mm x 20 mm, with penetration of the
pin to the surface of the plates. A volume of 50 mm x 250 mm x 20 mm was FSPed.
Depth of the operation was varying according to applied parameter set. Tool

29
penetration depth was about 11 mm, while applying the optimized parameter set. In
order to maintain a processed plate with thickness of 20 mm, both sides of plate had to
be processed. Since at each pass only a portion of cross-section area was processed, the
overlapping technique was employed, i.e., FSP is performed several times on the plates
side by side so that the whole volume is processed. Performing 10 passes at each side
of the plate, a volume with width of 45 mm was totally FSP-ed. The cross-sectional
macro illustration of overlapping passes is demonstrated in Figure 3-1. The overlapping
was done symmetrically for both of the rolling surfaces. The probable defects were
mostly observed at the advancing side. Therefore, overlapping were conducted,
considering this fact. The first pass was initiated from one side and since the rotational
direction was only allowed in counter clock-wise direction, it had to travel in such a
direction which the next pass will overlap with its advancing side. Selection of
overlapping direction eliminated the possible defects of the advancing sides. This
process was continued until the tenth pass.
Figure 3-1. Macrograph of the FSPed plate with the overlapping technique
3.3.2. Selection of FSP tool and Optimization of Process Parameters
In order to decide the most appropriate tool, three FSP tools were tried; A01, Triflude
and Triflat (Figure 3-2). Furthermore, in order to decide the optimum FSP parameter
set, trial and error was applied. First, considering the available facilities, some variables
were fixed. Secondly, variations on rotational and travelling speed of the tool were
studied. After a few trials with variations in tilt angle, it was decided to be fixed at 0°.

30
The tool used for FSP had a length of 9mm and 9mm upper diameter. The shoulder
diameter of the tool was 20 mm. Fixing the parameter set and the tool design,
overlapping trials were conducted.
Figure 3-2. Photographs of the tools used in the experiments
3.3.3. Measurement of Temperature
To investigate the change of heat input by FSP with respect to change of parameters,
temperature was measured during the FSP trials. The K-type thermocouples were
placed in 4 different spots. These thermo-couples were buried inside the plates in a way
that pin touches them on its traveling path. Data was taken with SCXI-1112 module of
National Instruments with a frequency of 20Hz to detect sudden temperature changes.
(a)

31
Figure 3-3. Positions of the thermocouples (a) Top view, (b) Side view
3.4. Gas Metal Arc Welding
Direction of welding was chosen to be parallel to the rolling direction. AWS ER5356
rods of 1.2 mm diameter were used as the filler material. Welding-grade argon as the
shielding gas with at least 99.998% purity was used. The plates were beveled from both
sides to form a double-V groove (Figure 3-4). The welding parameters are given in
Table 3.3. The same parameters and material were used for both base metal plates and
FSPed plates. Plenty of trials were performed to find the appropriate parameter.

32
Figure 3-4. Bevel geometry for GMAW
Table 3.3. Process parameters of GMAW
Wire Feed
Rate
(m/min)
Arc
Voltage
(V)
Average
Welding
Current
(A)
Average
Linear
Welding Speed
(mm/s)
Gas Flow
Rate
(lt/min)
Average
Heat Input
(kJ/mm)
Root pass 10.5 22.5 170 5.3 18 0.5
Filler passes 12 25 185 5.7 18 0.6
3.4.1. Welding of Friction Stir Processed Plates
The FSPed plates were cut from the middle such that two plates with the FSP-ed edges
are beveled in the same manner for subsequent GMAW process. The macro graph is
illustrated in Figure 3-5.
Figure 3-5. Macrograph of the joint (FSPed and welded)

33
3.5. Radiographic Testing
The radiographic tests were done according to EN ISO 17636-1 using Eresco (200kV)
and D4 type films. The exposure time was 80 seconds with 80 kV and 4.6 mA. Optical
density of the radiographs was in the range of 1.50-2.00.
The radiographic tests were used to evaluate the soundness of FSP and welding. The
results were also used in sampling procedures for the mechanical tests.
Figure 3-6. Radiographs (a) welded plates, (b) FSPed plate
The porosities formed during the GMAW process are seen as the black points in
Figure 3-6 (a). Radiograph of the FSPed plate, is presented in Figure 3-6 (b).
3.6. Microstructural Analysis
For microstructural analysis, optical microscope (OM), scanning electron microscopy
(SEM), EBSD and EDS were used. Prior to investigations, grinding and polishing were
carried out. The samples for metallographic examination were ground with grit
(a)
(b)
34
numbers of 120, 400, 800 and 1200 abrasives, respectively. Next, polishing were done
by 3 and 1 µm size diamond and final polishing was completed with colloidal silica.
The surfaces of the samples were etched electrically for 80-90 seconds with a direct
current power supply with potential difference of 20V in Barkers electrolyte solution
(195ml H2O+5ml HB4F+5ml H2O2). For EBSD investigations, Struers Lectropol-5
electrolytic polishing/ etching equipment and the %5 perchloric acid and %95 ethanol
solution were used to prepare the samples.
Fracture surfaces of the polished samples were cleaned with alcohol, and then,
examined using FEI brand scanning electron microscope. The surfaces of the samples
for EDS analysis were prepared by mechanical polishing.
Average grain size was measured according to ASTM E112 by the intercept method.
3.7. Mechanical Testing
3.7.1. Tensile Test
Tensile tests samples were prepared according to ISO 15614-2. The samples from the
base metal and multi-pass FSPed base metal were prepared as illustrated in Figure 3-7
(a).
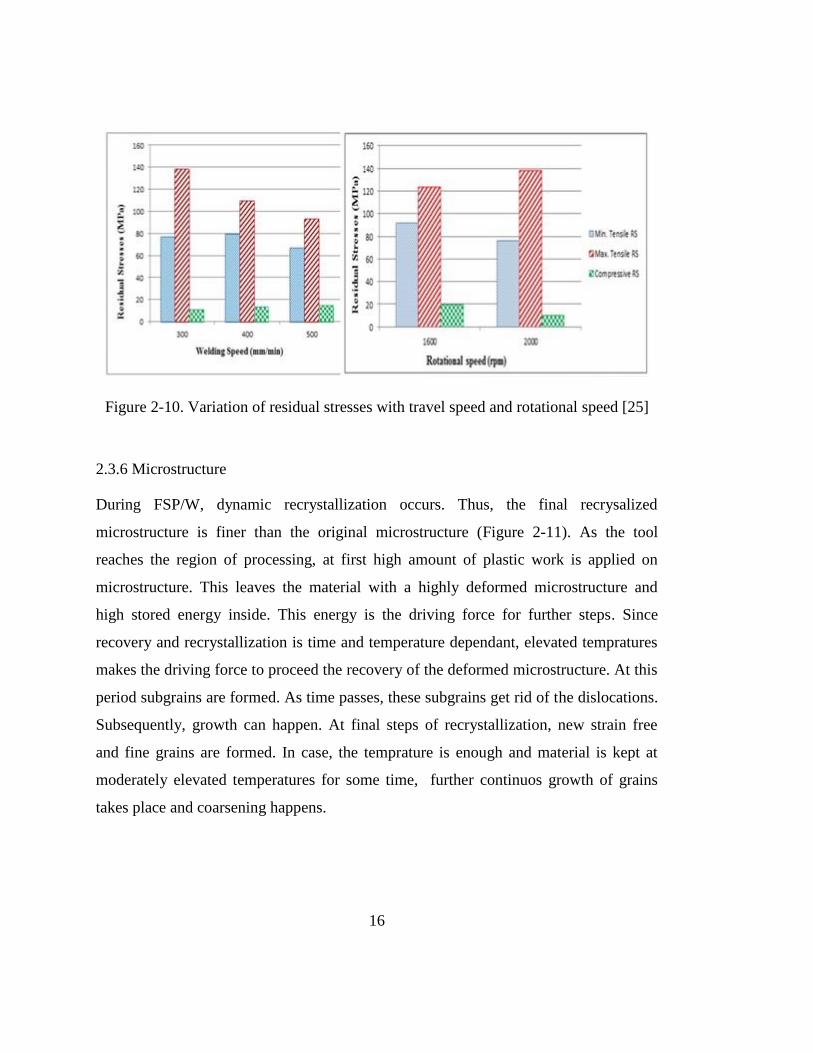
Because of weld defects, HAZ of welded and FSPed welds were tested by creating a
curvature of R=112 mm and the narrowest part of specimen was the region of study,
where a 2 mm notch was created at each side as illustrated in (Figure 3-7 (b)).
35
Figure 3-7. Sketch of tensile test specimens
(a) cylindrical specimen, (b) notched specimen
The tensile test specimens were loaded perpendicular to rolling direction. Since, the
directions of the welding and FSP were parallel to the rolling direction.
3.7.2. Hardness Test
Measurement loads of 9.807 N and 19.613 N was used for HV1 and HV2 values,
respectively. The loading time was 10 seconds. While some measurements were taken
randomly on the base metal surface, the other measurements were taken along the lines
from base metal through the HAZ to weld metal with specific spacing between each
indentation. Then horizontal and vertical hardness profiles were obtained. In order to
compare the change of hardness values according to the depth from the surface,
hardness profile lines were constructed at 2mm and 7mm below the surface.
3.7.3. Fatigue Crack Propagation Test
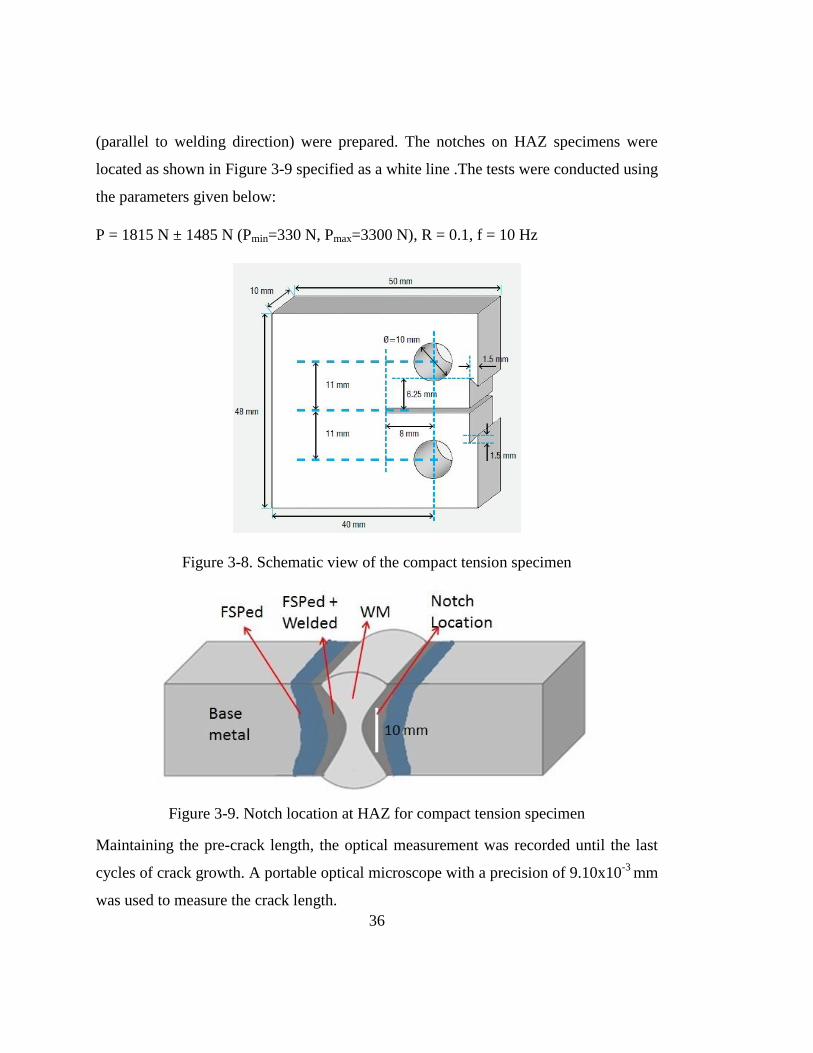
The test specimens were prepared according to ASTM E647 (Figure 3-8). Crack
initiation and growth measurements were performed at room temperature by means of
optical meter and Crack Opening Displacement (COD) transducer. Three samples for
the base metal (parallel to the rolling direction), three samples for the HAZ (parallel to
the welding direction) and five samples for the HAZ of the FSPed and welded metal
36
(parallel to welding direction) were prepared. The notches on HAZ specimens were
located as shown in Figure 3-9 specified as a white line .The tests were conducted using
the parameters given below:
P = 1815 N ± 1485 N (Pmin=330 N, Pmax=3300 N), R = 0.1, f = 10 Hz
Figure 3-8. Schematic view of the compact tension specimen
Figure 3-9. Notch location at HAZ for compact tension specimen
Maintaining the pre-crack length, the optical measurement was recorded until the last
cycles of crack growth. A portable optical microscope with a precision of 9.10x10⁻³
mm
was used to measure the crack length.

37
In order to convert the data received from COD transducer, MATLAB scripts were
written. First, the opening displacements were converted to crack sizes specified for
each cycle by calculating the slope of P versus Vm graph for that cycle. Six points on P
versus Vm graph were recorded for each cycle. The slope for each cycle was converted
into crack size utilizing the formula (8) given in ASTM E399, Appendix A4.5.5.
Second, using the incremental polynomial method given in ASTM E647 Appendix
X1.2, the stress intensity factor (ΔK), versus crack growth rate was plotted. Finally, the
constants of Paris-Erdoğan equation were calculated. The second and third processes
were repeated for optical data, as well.
( 8 )
where,
√
Vm = crack mouth opening displacement, (m),
P = applied force, (N),
B = specimen thickness,
Be = (B-BN)2/B,
E’=elastic constraint modulus (Pa) (E for plane stress; E/(1-ν
2) for plain strain),
ν = Poisson’s ratio
For each cycle the crack size was maintained using the MATLAB script. However,
because of scattered data for some of the cycles, data elimination process was applied.
In this stage, starting from calculation of average of first 41 crack sizes, the value of
21st crack size was considered. The data which deviated more than 0.0005 mm of the
average of neighboring 20 values, were eliminated. This process was repeated until the
last 20th
cycle. Figure 3-10 is an example of data elimination process following the
conversion of Vm to a.

38
Figure 3-10. Crack size versus number of cycles curve for the HAZ of the FSPed +
welded metal after data elimination.
In order to calculate the stress intensity factor range in a given crack growth rate the
incremental polynomial method in ASTM E647 was used. The derivative of each
polynomial fitted to a data, is equal to crack growth rate. Stress intensity factor range
was also found for each given crack size. Incremental polynomial method was applied
using a second order polynomial which was fitted to each data together with n
neighbors around it. Therefore, this method was applied on each 2n+1 data points. In
optical data n was taken as 3. In CMOD data, n was equal to 500.
√
( 9 )
Where , and this expression is valid for .
The results of these processes for optic and CMOD data are illustrated in Figure 3-11.

39
Figure 3-11. log (da/dK) versus log (ΔK) curves of FSPed and welded specimen
(a) Full range CMOD data, (b) Full range optical data,
Best fit line of steady state zone (c) CMOD data, (d) Optical data

40

41
CHAPTER 4
4. RESULTS AND DISCUSSION
4.1. FSP Applications
For friction stir processing, tool geometry, rotational speed, traveling speed, nominal
force, material thickness, material temperature and tilt angles are the main variables. In
this study the tool geometry, rotational speed, travelling speed and tilt angle were
selected as the variable parameters. A series of trials were performed using A01,
Triflude and Triflat tools (Figure 3-2). A01 were used mostly for temperature variation
measurements, whereas Triflude and Triflat were used for the overlapping processes.
The result of the trials showed that Triflat tool gives the best performance for
maintaining a continuous and sound pass.
4.1.1. Trials with A01 Tool
Using the department abilities, the A01 tool was designed and manufactured for the
first FSP trials. H13 steel was the used material for this tool which is illustrated in
Figure 3-2 (a).
Since, during the FSP, plates are subjected to large amount of forces, they had to be
fixed firmly before the process. Therefore, after finalizing the fixing process, FSP trials
with the parameters illustrated in Table 4.1 were performed. For the sake of saving
material, three passes were applied to each plate. The sizing of plates was 30x17x2cm.
The travelling direction of the tool was parallel to the rolling direction. The top views
of the FSPed plates are given in Figure 4-1.

42
Table 4.1. FSP parameters conducted with A01 tool
Test
Number
Rotational
Speed
(rpm)
Travelling Speed
(cm/minute)
1st
Tilt
Angle
x°
2nd
Tilt
angle
y°
Temperature
(°C)
Reached
Temperature
(°C)
DN1 900 2.1 - - 446 474
DN2 900 2.1 2 - 459 480
DN3 900 2.1 2 2 454 485
DN4 1120 1.7 -2 -2 425 459
DN5 1400 1.7 2 2 424 458
DN6 560 1.7 2 2 410 426
DN7 560 2.1 2 2 413 422
DN8 560 2.7 2 2 419 467
DN9 355 4.3 2 -2 341 360
DN10 355 6.8 2 -3 368 397
DN11 355 2.1 2 2 432 457
DN12 355 4.3 2 -3 313 336
DN13 224 4.3 2.5 -2 351 367

43
Figure 4-1. Top view of the plates FSPed with A01 tool
In the first experiment set, the rotational speed was the variable (355, 560 and 900 rpm)
while the travelling speed was fixed to 2.1 cm/min. Figure 4-2 shows that, as the
rotational speed increases, the maximum temperature increases due to the heat input
created by frictional forces. In the second experiment set, the rotational speed was fixed
to 355 rpm, and the maximum temperatures were measured at three different travelling
speeds (2.1, 4.3, 6.8 cm/min). Figure 4-3 shows that, the decrease in travelling speed
causes the increase of FSP temperature. Since the plate is subjected to the frictional
forces for a longer period in lower travelling speed, the temperature can increase
further.

44
Figure 4-2. Effect of rotational speed of FSP on the maximum temperature, measured
in the sample (traveling speed = 2.1 cm/min)
Figure 4-3. Effect of travelling speed of FSP on the maximum temperature measured in
the samples (rotational speed = 355 rpm)

45
In Figure 4-4 these phenomena are even more obvious by comparing two extreme
conditions at each experiment.
Figure 4-4. Variation of temperature:
(a) constant travel speed, (b) constant rotational speed
To sum up, during the first trials the continuity of the FSPed material could not be
maintained because of the insufficient tool design. However, invaluable data was
maintained by studying the temperature variations. These data were utilized to explain
the grain structure of the specimens FSPed by other tools. In Figure 4-5, the
radiographs and macrographs of the FSPed plates are displayed.
Tem
pra
ture
(°C
)

46
Figure 4-5. Radiographs and side views of the single pass FSPed plates

47
4.1.2. Trials with Triflute Tool
Because of the helical threads of the Triflute tool, the only possible rotation was
counter clock-wise. This creates a material flow towards the bottom layers of the
passes. Handful of trials were made with Triflute tools after they were delivered.
However, their delicate structure didn’t handle the loads applied on them during some
if the extreme parameters. Due to the failures in the pin of the tools during trials, it was
decided to not consider them as the main tool for the FSP applications. The parameters
used in the trials are given in Table 4.2. The FSP passes with Triflute tool, were sound
for most of the parameters.
Table 4.2. Parameter set performed with Triflute Tool
Trial Number Rotational Speed (rpm) Travelling Speed (mm/minute)
N19 210 285
N20 210 185
N21 110 185
N22 150 185
N23 980 40
N24*) 720 -
N25*) 530 -
N26 530 65
N27 530 100
N28 530 185
N29 390 65
N30 390 100
N31 210 285

48
4.1.3. Trials with Triflat Tool
Following adequate number of trials with two previous tools, the optimized parameters
were almost clear. First experiments with Triflat tool is listed in Table 4.3. Obtaining
those results, two feasible (in terms of soundness and limits of the machining device)
extreme parameters, as the upper and lower parameters from temperature point of view
were applied. Exceeding these limits would end up to discontinuities in the passes.
Therefore, a hot and a cold pass were applied on a plate in order to examination and
comparison of the microstructures. The plate is exhibited in Figure 4-6.
Table 4.3 Parameter sets performed by Truncated 3-f Tool
Test Number Rotational Speed
(rpm)
Travelling Speed
(mm/min.)
N32 210 185
N33 530 185
N34 530 100
N35 720 65
N36 720 100
N37 290 100

49
Figure 4-6. Top View of the plate on which the cold and hot parameter sets were
applied
As it is observable from Figure 4-6 and Figure 4-7, the hot parameter (720 rpm, 100
mm/min.) was obtainable by more penetration of the tool pin. Because of the high heat
input of the hot parameter, softening of the FSPed region is observed to be more than
that of cold parameter. That’s why more axial forces (more penetration) of the tool is
needed to maintain a sound pass. These two sets of parameter (720 rpm-100 mm/min.
and 290 rpm-185 mm/min.), were then used for overlapping experiment by multi
passing. The two overlapped FSP samples are shown in Figure 4-7.
.
Figure 4-7. Top view of the plates FSPed with the overlapping technique
(a) cold parameter set, (b) hot parameter set

50
Finally, the optimum parameter set was decided as 290 rpm-100 mm/min. Subsequent
overlapping processes were conducted using this parameter set.
4.2. Microstructural Analysis
4.2.1. Base Metal
The microstructures of the base metal for three perpendicular directions are shown in
Figure 4-8. The effect of rolling can be easily seen from the grain orientation of the
grains.
Figure 4-8. (a) Macro 3-D view of base metal plate,
(b) 3-D Optical microstructural view of base metal
The average grain size of the base metal on the XY, XZ and YZ surfaces were
determined as 58, 92 and 25 μm with the maximum standard deviation of 6 μm.
Intermetallic particles of two kinds exist (Figure 4-9). The area fraction of particles on
the XY, XZ and YZ planes were measured as 0.4, 0.6 and 0.4 for the black particles
and 1.4, 1.2 and 1.4 for the grey particles.
Y
X
Z
(a) (b)

51
Figure 4-9. Optical view of the polished specimens
(a) Perpendicular to the rolling direction, (b) Rolling surface,
(c) Parallel to the rolling direction.
The results of energy dispersive X-ray spectroscopy reveal the difference between the
black and grey colored intermetallics. As illustrated in Figure 4-10, the black particles
contain Al, Mg and Si whereas the grey ones contain Al, Si, Mn and Fe.
(a) (a) (b)
(c)

52
Figure 4-10. EDS results of the intermetallic particles
4.2.2. Friction Stir Processed Metal
Microstructure investigations on FSDed plates indicated differences among the hot
parameter and cold parameter sets and the top and bottom parts (Figure 4-11,
Figure 4-12). The hot parameter set resulted in coarser grain sizes. The average grain
size of the sample FSPed using the hot parameters set is 6±1 μm, while that of sample
FSPed using the cold parameter set is 1 μm. For both sets, the grains became coarser it
is approached to the plate surface.
Figure 4-11. Microstructures after FSP by the hot parameter set
(a) near the plate surface, (b) near the plate center
(a) (b)

53
Figure 4-12. Microstructures after FSP by the cold parameter set
(a) near the plate surface, (b) neat the plate center
The differences in the microstructure can be explained by recrystallization
phenomenon. First, higher rotational speed, and therefore, higher heat input of the hot
parameter set associates the further growth of the grains. Second, the lower travelling
speed of the tool, provides the grains longer time spent at elevated temperatures which
assists the grain growth.
Downward material flow, created by the threads on the pin, provides more amount of
mechanical work towards the below layers of the FSPed zone and leaves material with
higher amount of strains and tangles which somehow complicates the recrystallization
process and creates more obstacles for grain growth. This is the reason for smaller
grains at the bottom levels of the FSPed zone.
The difference between two advancing and retreating sides of FSPed cross-section was
also investigated. The magnifications of two marked regions in Figure 4-13, are shown
in Figure 4-14 (a) and (b), respectively from left to right. It is well observed that, while
there is a sudden passage from TMAZ to nugget zone in advancing side, this passage is
smoother in retreating side.
(a) (b)
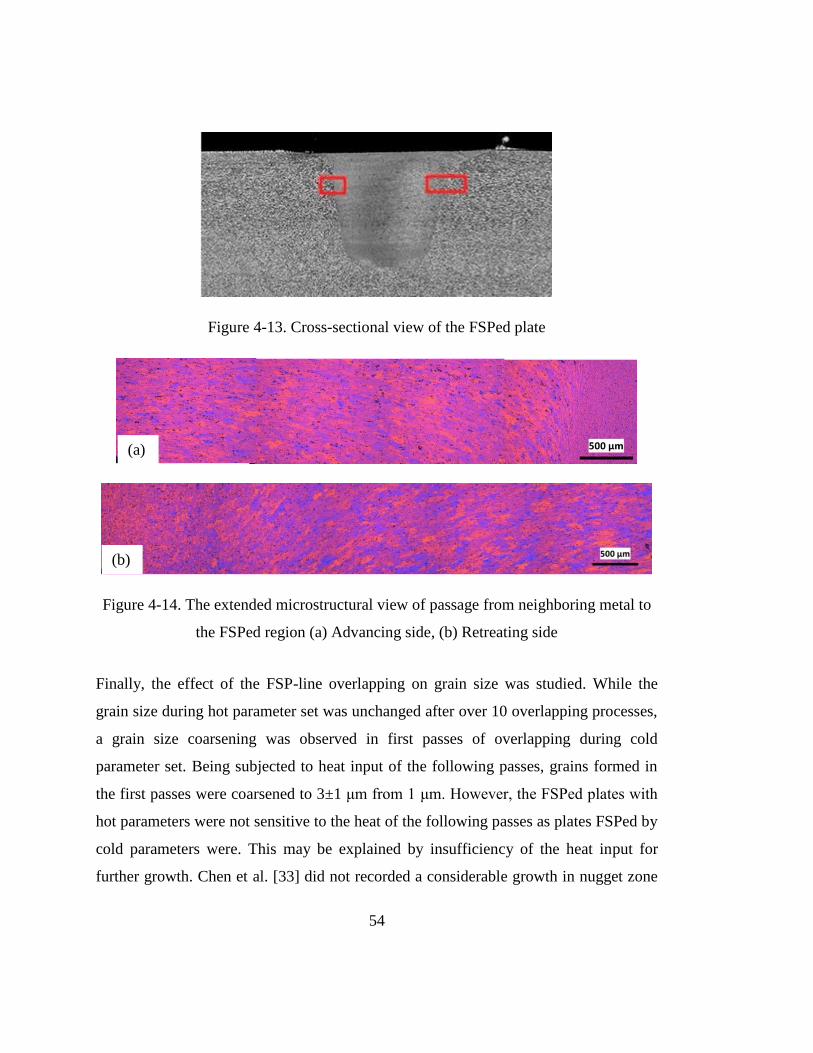
54
Figure 4-13. Cross-sectional view of the FSPed plate
Figure 4-14. The extended microstructural view of passage from neighboring metal to
the FSPed region (a) Advancing side, (b) Retreating side
Finally, the effect of the FSP-line overlapping on grain size was studied. While the
grain size during hot parameter set was unchanged after over 10 overlapping processes,
a grain size coarsening was observed in first passes of overlapping during cold
parameter set. Being subjected to heat input of the following passes, grains formed in
the first passes were coarsened to 3±1 μm from 1 μm. However, the FSPed plates with
hot parameters were not sensitive to the heat of the following passes as plates FSPed by
cold parameters were. This may be explained by insufficiency of the heat input for
further growth. Chen et al. [33] did not recorded a considerable growth in nugget zone
(a)
(b)

55
of hot parameter of their study. They stated, cold parameters are more prone to growth
with subsequent heat treatment. Therefore, it may be stated that the growth of the grains
is limited in the temperature range which FSP is capable to elevate.
The radiograph of the plate having overlapped FSP lines is presented in Figure 4-15.
Figure 4-15. Radiograph of the plate having overlapped FSP lines
(290 rpm, 100 mm/min)
In Figure 4-16, electron backscatter diffraction (EBSD) image of the overlapped plate
is illustrated. The image is taken from side which has FSPed first.
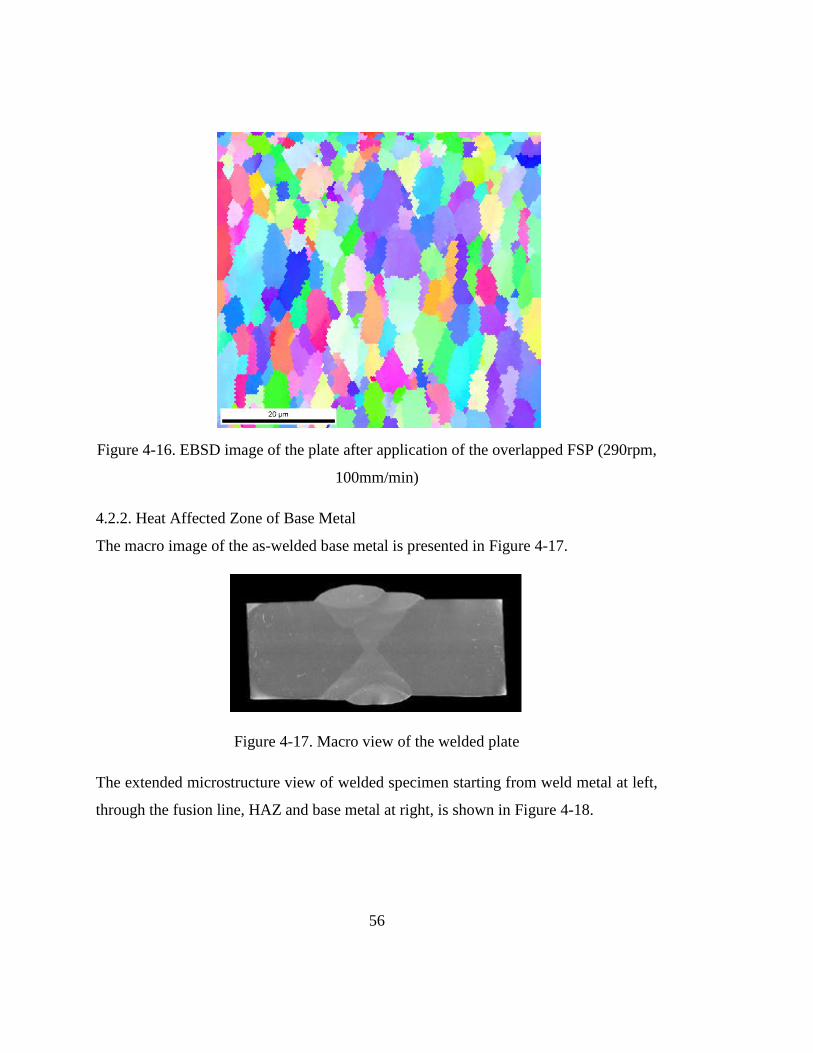
56
Figure 4-16. EBSD image of the plate after application of the overlapped FSP (290rpm,
100mm/min)
4.2.2. Heat Affected Zone of Base Metal
The macro image of the as-welded base metal is presented in Figure 4-17.
Figure 4-17. Macro view of the welded plate
The extended microstructure view of welded specimen starting from weld metal at left,
through the fusion line, HAZ and base metal at right, is shown in Figure 4-18.

57
Figure 4-18 Extended microstructure view of the welded plate
A more detailed view of HAZ is also illustrated in Figure 4-19. Because of high heat
input, growth of the grains is observable in HAZ region.
Figure 4-19. Micrograph of HAZ (50x)
H111 tempered alloys are not subjected to high amounts of strain hardening. Although
a significant grain coarsening is observed in the HAZ of base metal, existence of more
work hardening and therefore, more strain energy, would result in more growth in
HAZ.
4.2.3. Heat Affected Zone of the FSPed and Welded Metal
Following the FSP, the beveled plates were butt welded. The macro view of the
specimen is presented in Figure 4-20.
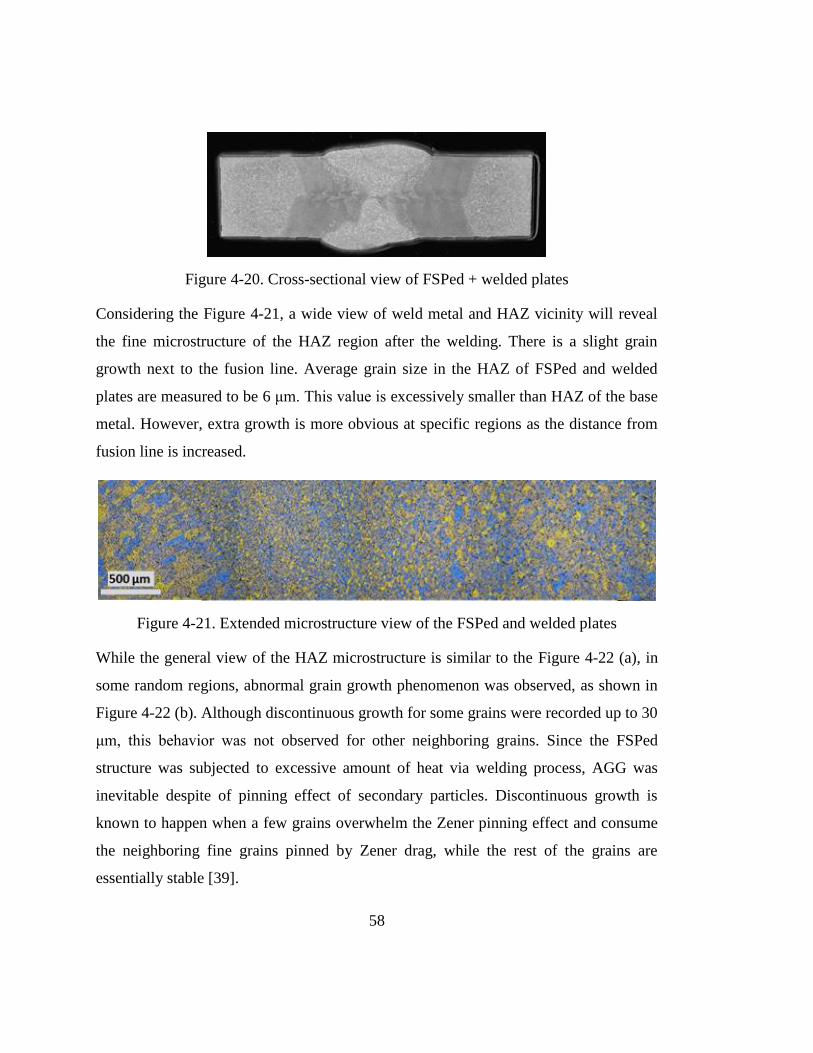
58
Figure 4-20. Cross-sectional view of FSPed + welded plates
Considering the Figure 4-21, a wide view of weld metal and HAZ vicinity will reveal
the fine microstructure of the HAZ region after the welding. There is a slight grain
growth next to the fusion line. Average grain size in the HAZ of FSPed and welded
plates are measured to be 6 μm. This value is excessively smaller than HAZ of the base
metal. However, extra growth is more obvious at specific regions as the distance from
fusion line is increased.
Figure 4-21. Extended microstructure view of the FSPed and welded plates
While the general view of the HAZ microstructure is similar to the Figure 4-22 (a), in
some random regions, abnormal grain growth phenomenon was observed, as shown in
Figure 4-22 (b). Although discontinuous growth for some grains were recorded up to 30
μm, this behavior was not observed for other neighboring grains. Since the FSPed
structure was subjected to excessive amount of heat via welding process, AGG was
inevitable despite of pinning effect of secondary particles. Discontinuous growth is
known to happen when a few grains overwhelm the Zener pinning effect and consume
the neighboring fine grains pinned by Zener drag, while the rest of the grains are
essentially stable [39].

59
Figure 4-22. Micrographs of HAZ of the FSPed + welded region
(a) Adjacent to the fusion line, (b) HAZ
However, providing more heat to the FSPed region during the GMAW could result in
coarsening of the finer neighbor grains, as well [40].
According to model of Humphreys [34], abnormal grain growth (AGG) is an expected
formation for the grain boundaries with misorientation between 5° and 10°. These
grains are instable which may get affected by any kind of heat treatment after FSP.
Works of Chen et al. [33], also admits that AGG takes place at roots of the nugget zone
during the annealing process after FSP. Also in previous works it has been observed
that, the FSPed region is not uniform in terms of microstructural properties which are
important criteria for growth. For instance, he values of stress concentration and
residual stresses are found to be greater in advancing side of the nugget zone [41].
Non-uniformity of the grains in FSPed zone is due to heat input of the GMAW. The
misoreintation angles of the grains that are seen in Figure 4-16 is given in Figure 4-23.
The fraction of grains within the misorientation range of 5°-10° is about 3% of the all
grains. AGG is expected to occur for these grains.
(a) (b)
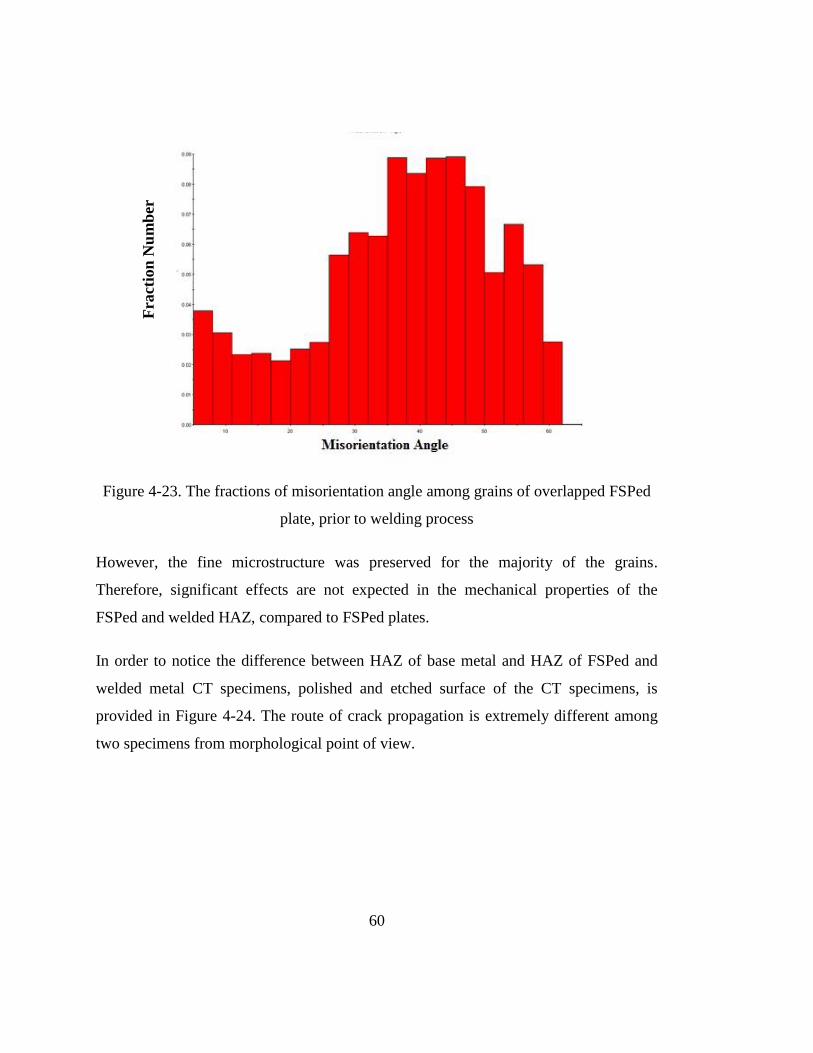
60
Figure 4-23. The fractions of misorientation angle among grains of overlapped FSPed
plate, prior to welding process
However, the fine microstructure was preserved for the majority of the grains.
Therefore, significant effects are not expected in the mechanical properties of the
FSPed and welded HAZ, compared to FSPed plates.
In order to notice the difference between HAZ of base metal and HAZ of FSPed and
welded metal CT specimens, polished and etched surface of the CT specimens, is
provided in Figure 4-24. The route of crack propagation is extremely different among
two specimens from morphological point of view.
Fra
ctio
n N
um
ber

61
Figure 4-24. A comparison of the HAZ in CT specimens:
(a) The base metal, (b) The FSPed metal
4.3. Mechanical Tests
4.3.1. Hardness Test
The hardness values of the base metal are given in Table 4.4. Higher hardness values
were expected at the surfaces which have been subjected to strain hardening. This
validates the results maintained from the hardness values of the base metal.
Table 4.4 Hardness values of the base metal
BM
Surface Perpendicular
to the Rolling Direction
HV1
Surface Parallel to
the Rolling Direction
HV1
Rolling Surface
HV1
#1 91.4 95.3 85.7
#2 91.3 101.0 89.8
#3 94.6 92.0 89.4
#4 97.1 93.0 89.0
#5 94.7 94.7 85.3
#6 91.9 90.5 90.2
#7 91.0 94.0 90.0
#8 93.6 90.3 88.3
#9 89.2 91.9 90.9
#10 93.1 91.1 87.0
Average 92.8±2.2 92.9±3.0 88.6±1.8

62
4.3.1.1. Hardness of the Base Metal after Friction Stir Processing
The hardness profiles for the two extreme FSP parameters (i.e. 720 rpm – 100 mm/min,
and 290 rpm – 185 mm/min) are illustrated in Figure 4-25 and Figure 4-26. The most
effective phenomena of the parameters on the hardness is the heat input. Since the heat
input is in direct relation with parameter with higher RPM/speed, the hardness of
specimens processed under 720 RPM – 100 mm/min differed dramatically with respect
to the colder parameter.
Hardness values are taken both in horizontal and vertical directions. In the vertical
direction, hardness increases towards the center because of the microstructural
differences between top and bottom of the nugget zone. In the horizontal direction, the
order of overlapping is more significant for hardness. Since every pass of FSP acts as a
heat treatment, the hardness after the first pass is lower than that after the last pass.
The average of vertical and horizontal hardness values for the parameter of 720 RPM –
100 mm/min was measured to be 88±2 HV2 and for the parameter of 290 RPM -185
mm/min was measured as 92±4 HV2.

63
Figure 4-25. Vertical and horizontal hardness profiles of the sample FSPed with the
overlapping technique (720 RPM – 100 mm/min)
Figure 4-26. Vertical and horizontal hardness profiles of the sample FSPed with the
overlapping technique (290 RPM – 185 mm/min)
In Figure 4-27-a, the difference among morphology of retreating side and advancing
side is shown by hardness values. Because of the higher amount of strain hardening in
advancing side higher hardness values is obtained. This phenomenon is not obvious in

64
Figure 4-27 (b), because of the higher heat input of the process and relatively softening
of the material, subsequently. However, this heat input results in formation of heat
affected zone adjacent to the overlapped nugget zone.
Figure 4-27. Hardness profile of the specimens after overlapping FSP process from the
retreating side to advancing side of base metal
a) 290 rpm – 185 mm/min, b) 720 rpm – 100 mm/min
(b)
(a)

65
4.3.1.2. Hardness after Welding
Hardness profiles from the cross-section of the as-welded plate taken are shown in
Figure 4-28 and Figure 4-29. The measurement line was located 2 mm below the
surface of welded specimen in Figure 4-28. While the profile in Figure 4-29 is taken
from the depth of 7 mm. The hardness values of the base metal, heat affected zone and
weld metal 2 mm below the weld cap was recorded as 89±7 HV2, 81±3 HV2 and 75±5
HV2, respectively. The width of HAZ region was inspected to be 3mm in both sides of
the fusion line of weld when measure in Figure 4-28. Considering the low level of
strain hardening amount of the H111 condition, the narrowness of the HAZ is not an
unexpected outcome.
Figure 4-28. Hardness profile of the welded plate (2 mm below the surface)
The hardness values of these three regions, 7 mm under the surface, were measured as
88±1, 84±2 and 79±1 respectively for the base metal, HAZ and weld metal of the as-
welded specimen. An obvious change of HAZ width towards the center of specimen
was observed as it was measured to be 8 mm in Figure 4-29. The difference in HAZ
width according to the thickness of the plate is explained through the cooling rate of
these layers. Since the surface layers are cooled faster, the effect of heat is limited.
However, for the center of the plate heat is conserved for a longer time, which results in
a wide HAZ.

66
Figure 4-29. Hardness profile of the welded material (7 mm below the surface)
4.3.1.3. Hardness Profile of the FSPed and welded plate
The hardness of the FSPed and welded specimen were measured with the same
methodology. In Figure 4-30 the hardness values were collected 2 mm below the
surface as illustrated by the black dotted line. The hardness values are 90±6, 96±5,
91±4 and 76±4 HV2 for base metal, pre-FSPed metal, pre-FSPed HAZ and weld metal,
respectively.
Figure 4-30. Hardness profile of the FSPed and welded plate (2 mm below surface)

67
As seen in Figure 4-31 the hardness values are 85±3, 89±3, 82±4 and 75±5 HV1 for the
base metal, pre-FSPed metal, pre-FSPed HAZ and weld metal, respectively.
Figure 4-31. Hardness profile of the FSPed and welded plate (7 mm below the surface)
The hardness drop in the base metal is about 9 HV2, while that for the FSPed metal is
less than 6 HV2. Also, towards the center of the plate, similar to welded specimen,
widening of the HAZ is observed. However, in the same depth, while the HAZ of
welded base metal was more than 8 mm, HAZ of FSPed metal is barely 6 mm.
4.3.2. Tensile Test
The tensile test results of the base metal and FSPed samples are given in Table. 4.5.
Table. 4.5. Results of the tensile tests
Material of Specimen Yield Strength at 0.2 strain UTS(MPa)
Base Metal Prependicular to the Rolling
Direction
195±1 334±1
Base Metal Parallel to the Rolling
Direction
226±0 331±1
FSPed Base Metal
720 rpm- 100 mm/min
180±4 342±1
FSPed Base Metal
290 rpm - 185 mm/min
208 343

68
The stress-strain curves of the specimens are shown in Figure 4-32. As it is seen from
the graphs, FSPed specimens have higher tensile strengths, while their yield strengths
are slightly lower than those of the base metal perpendicular to rolling direction. Since
the FSP and welding were applied in the rolling direction, the comparisons were made
by considering the direction perpendicular to the rolling direction.
Figure 4-32. Stress-Strain curves of the samples
The tensile strength of the notched specimens in HAZ regions are presented in
Table 4.6. An improvement of tensile strength is observed in the HAZ region of the
FSPed plate. Investigating on the fracture surface of the specimens have shown the
effect of fine grains on the formation of the dimples (Figure 4-33).

69
Table 4.6. Results of notch tensile tests
Specimen
Number
σy (MPa) Average±Standard
Deviation (MPa)
HAZ of Base Metal 1 227
235±18 2 231
3 264
4 216
HAZ of FSPed Metal 1 267
265±13 2 244
3 219
4 276
Figure 4-33. Fracture surfaces of tensile specimens
(a) HAZ of base metal, (b) HAZ of FSPed and welded metal
4.3.3. Fatigue Crack Propagation Test
Fracture surface of a compact tension specimen is illustrated in Figure 4-34. The darker
grey area, starting from the notch, belongs to the pre-crack loadings, which had higher
values with respect to crack loadings. The change of load caused formation of a beach
mark on fracture surface.
(a) (b)

70
Figure 4-34. Fracture surface of the FSPed CT specimen
The data collected by CMOD and optical method were similar to each other. For each
test, C and m values were calculated in the steady state region in crack growth rate
versus stress intensity factor graphs. The crack length (a) versus cycle number (N)
graphs for three base material, three HAZ of base metal and five HAZ of FSPed and
welded plate are given in Figure 4-36, Figure 4-38 and Figure 4-40, respectively. Crack
growth rate (da/dN) versus stress intensity (ΔK) graphs are given in
Figure 4-37,Figure 4-39 and Figure 4-41. Both optical and CMOD data were used to
maintain two graphs for each specimen. In spite of data elimination procedure,
scattering of the results was still observed in a few of specimens. Figure 4-35, shows
SEM images of fracture surface of FCP tests (BM3 specimen).
Figure 4-35. Striations and their length at a distance of
(a) 8 mm, (b) 12 mm from the pre-crack
(a) (b)

71
Visual and numerical results of the crack propagation tests are presented in Figures
Figure 4-36 to Figure 4-41.
Figure 4-36. Crack length versus number of cycles curves for the base metal
Figure 4-37. Crack growth rate versus stress intensity factor curves for the base metal

72
Figure 4-38. Crack length versus number of cycles curves for HAZ8888888888888888
Figure 4-39. Crack growth rate versus stress intensity factor curves for the HAZ

73
Figure 4-40. Crack length versus number of cycles curves for the HAZ of FSPed and
welded plate
Figure 4-41. Crack growth rate versus stress intensity factor curves for the HAZ of
FSPed and welded plate
da/dN versus ΔK graph of the first sample for each group is plotted for comparison
purpose. Two graphs for optic and CMOD data are plotted in Figure 4-42.

74
Figure 4-42. Crack growth rate versus stress intensity factor curves of the samples
The constants of Paris-Erdoğan law and the crack growth rate for the stress intensity
factor of 15 for each data of each sample are stated in Table 4.7.
Table 4.7. Results of the crack growth studies
Base Metal HAZ of Base Metal
HAZ of pre-FSPed
Metal
Optical CMOD Optical CMOD Optical CMOD
Cx10-10
[m] 4.5±2.6
5.8±0.8 1.0±0.7
0.8±0.3 11.8±6.8 13.3±2.7
m 2.9±0.3 2.8±0.1 3.6±0.5 3.5±0.1 2.4±0.2 2.4±0.1
da/dNx10-6
[m/cycle] @
ΔK=15
1.1 1.0 1.1 1.2 0.81 0.82
In previous studies effect of the ultra-fine grains has been observed to reduce the ΔKth
value and provide faster FCP rates. This has been related to the roughnes induces crack
closure mechanisms [42] [43]. Although in this study ΔKth values were not calculated,
improvement was maintained in crack growth behavoir of the specimens at second and

75
third stages of crack growth maintaining better values for Paris-Erdoğan law constants.
Providing sufficient heat input to the plates via welding process caused moderately fine
microstructure rather than ultra-fine grains.
The optimum size of the grains improved the fatigue crack propagation behavior of
FSPed and welded specimens. The illustration of this manner is provided in
Figure 4-43.
Figure 4-43. Comparison of crack growth rate versus stress intensity factor curves for
HAZ of base metal (HAZ1, HAZ2) and HAZ of FSPed and welded metal(PW1, PW5)
The comparison of the grain structure for both of the HAZ specimens in the ΔKth
vicinity, also admits the proper size of the grains in FSPed and welded metal. Also, the
illustrated side cracks in Figure 4-45 may clarify the resistance of the material against
the growth of the crack.

76
Figure 4-44. Fracture surface at the vicinity of the ΔKth for
(a) HAZ of base metal, (b) HAZ of FSPed and welded metal
Figure 4-45. Side cracks in the fracture surface of the FSPed and welded metal at the
vicinity of ΔKth
Although the coarse grains and intermetallics in the HAZ of base metal assist the
specimens to resist against propagation at first stage, it is a remarkable disadvantage in
the second and third stages of FCP. According to previous studies, relatively fine grains

77
and dispersed intermetallic provide a noticeable advantage in the second and third
stages. This creates more obstacles in front of the crack tip to overcome [44].
In Figure 4-46, an agglomerated brittle intermetallic particle is observed in the plastic
deformation zone of the crack in the CT specimen prepared from HAZ. In the CT
specimens prepared from the HAZ of FSPed welded specimens, such a formation was
not encountered.
Figure 4-46. Intermetallic particle in the plastic deformation zone of the crack tip
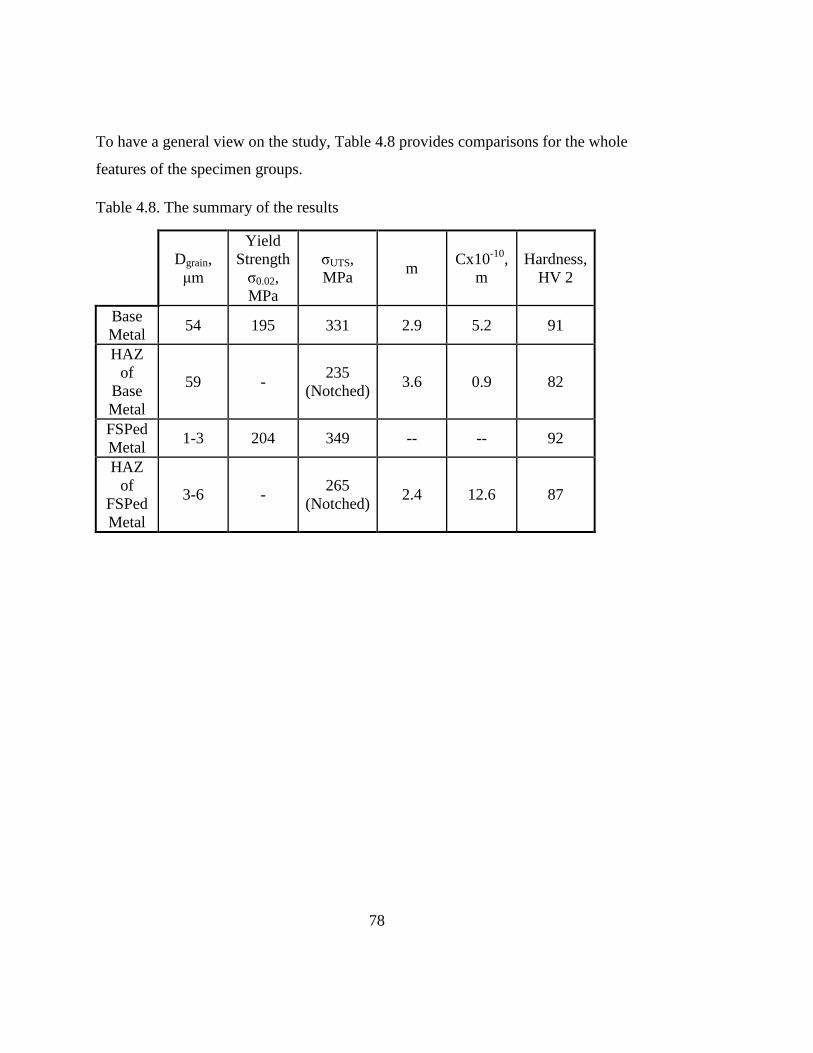
78
To have a general view on the study, Table 4.8 provides comparisons for the whole
features of the specimen groups.
Table 4.8. The summary of the results
Dgrain,
μm
Yield
Strength
σ0.02,
MPa
σUTS,
MPa m
Cx10-10
,
m
Hardness,
HV 2
Base
Metal 54 195 331 2.9 5.2 91
HAZ
of
Base
Metal
59 - 235
(Notched) 3.6 0.9 82
FSPed
Metal 1-3 204 349 -- -- 92
HAZ
of
FSPed
Metal
3-6 - 265
(Notched) 2.4 12.6 87

79
CHAPTER 5
5. CONCLUSIONS
To minimize the losses in hardness and strength and to improve the fatigue behavior in
the heat affected zone (HAZ) of the welded 5083 Al-alloy plates, friction stir
processing (FSP) was applied to the bevels of the plates before welding. Initially, the
FSP parameters were optimized after selecting the appropriate tool. For the
experimental investigations, two sample sets were prepared by gas metal arc welding in
a conventional way and by gas metal arc welding after FSP. Microstructures were
investigated, and average grain size, hardness, yield strength, ultimate tensile strength,
and the constants of the Paris-Erdoğan equation were determined for the specimens
prepared from the base metal and the HAZs of the welded plates. The following
conclusions can be drawn from this particular study:
Application of FSP with hot parameters (high rotational and low traveling speeds)
causes higher heat input, and thus, coarser grains and lower hardness in
comparison to the samples FSPed with cold parameters (low rotational and high
travelling speeds). However, the microstructure of the sample FSPed using hot
parameters is more stable under the effect of subsequent heating.
Application of FSP before welding improves the properties of HAZ of the welded
5083 Al-alloy plates. For instance, microstructure consists of finer grains, the
drops in hardness and strength are avoided, and the fatigue crack growth rate
decreases in comparison to the HAZ of the conventionally welded plates.
In the HAZ of the plates prepared by combined application of FSP and welding,
the heat input to the FSPed region during welding causes local abnormal grain
growth at few places, which might be affected by misorientation of grains, amount

80
and size of dispersed second phase particles, internal energy level of the grains,
and FSP parameters. However, it does not result in a significant drop in
mechanical properties if the number of exceptionally coarse grains is low.
If fusion welding is a part of the manufacturing route of 5083 Al-alloy, FSP of the
bevel regions of the plates prior to welding may significantly improve the
mechanical properties of the HAZ and fatigue life of the welded component.
81
REFERENCES
[1] A. Ghosh and T. Bieler, Superplasticity and superplastic forming, Pennsylvania:
Warrendale, 1995.
[2] R. Mishra and M. Mahoney, Friction Stir Wleding and Processing, Ohio: ASM
International, 2007.
[3] S. Jana, R. Mishra, J. Baumann and G. Grant, "Effect of friction stir processing
on fatigue behavior of an investment cast Al-7Si-0.6 Mg alloy," Acta Materiala,
vol. 58, pp. 989-1003, 2010.
[4] G. Akçay, "Effect of Friction Stir Processing on Fracture Toughnes and Crack
Growth Behaviour on Welded 5083 Grade Aluminum Plates," METU, Ankara,
2015.
[5] G. Kaufman, Aluminum alloys and Tempers, Materials Park O.H.: ASM
International, 2000.
[6] R. Singh, Applied Welding Engineering, Butterworth-Heinemann: Elsevier,
2012.
[7] M. Ashby and D. Jones, Engineering Material 2 An Introduction to
Microstructure, Processing and Design, Cambridge: Butterworth-Heinemann,
1999.
[8] J. Adams and e. al, "Volume 2 Properties and Selction of Non-ferrous Alloys," in
ASM Handbook, Ohio, ASM International, 1992.
[9] A. Haddadzadeh, M. Ghaznavi and A. Kokabi, The effect of gas tungsten arc
welding and pulsed-gas tungsten arc welding processes’ parameters on the heat
affected zone-softening behavior of strain-hardened Al–6.7Mg alloy, Waterloo:
Elsevier, 2013.
[10] C. Dorum, O. Lademo, O. Myhr, T. Berstad and O. Hopperstad, "Finite element
analysis of plastic failure in heat-affected zone of welded aluminium
82
connections," Elsevier, Trondheim, 2009.
[11] R. Nandan, T. DebRoy and H. Bhadeshia, "Recent advances in friction-stir
welding – Process,weldment structure and properties," Progress in Materials
Science, vol. 53, p. 980–1023, 2008.
[12] Z. Ma, S. Sharma and R. Mishra, "Effect of friction stir processing on the
microstructure of cast A356 aluminum," Materials Science and Engineering , vol.
A 433, p. 269–278, 2006.
[13] F. Lefebvre, S. Ganguly and I. Sinclair, "Micromechanical aspects of fatigue in a
MIG welded aluminium airframe alloy," Materials Science and Engineering, vol.
397, p. 338–345, 2005.
[14] S. Rajakumar, C. Muralidharan and V. Balasubramanian, "Predicting tensile
strength, hardness and corrosion rate of friction stir welded AA6061-T6
aluminium alloy joints," Materials and Design, vol. 32, p. 2878–2890, 2011.
[15] S. Zimmer, L. Langlois, J. Laye and J. Claude, "Using the plunging and welding
process windows to determine a FSW means of production," Advanced Materials
Research, Vols. 89-91, pp. 697-702, 2010.
[16] M. Vukčević, S. Savićević, M. Janjić and N. Šibalić, "Measurement in friction
stir welding process," in Trends in the Development of Machinery and
Associated Technology”, Prague, 2011.
[17] A. Reynolds, "Flow visualization and simulation in FSW," Scripta Materialia,
vol. 58, p. 338–342, 2008.
[18] H. Schmidt, T. Dickerson and J. Hattel, "Material flow in butt friction stir welds
in AA2024-T3," Acta Materialia , vol. 54 , p. 1199–1209, 2006.
[19] P. Surendrababu, A. G. Krishna and C. S. Rao, "Material Flow Behaviour in
Friction Stir Welding Process-A Critical Review on Process Parameters and
Modeling Methodologies," International Journal of Emerging Technology and
Advanced Engineering, vol. 3, no. 6, 2013.
[20] K. Jata and S. Semiatin, "Continuous dynamic recrystallization during friction
stir welding of high strength aluminum alloys," Scripta material, vol. 43, p. 743–
749, 2000.

83
[21] C. Sellars and W. McTegart, "On the mechanism of hot deformation," Acta
Metalurgica, vol. 14, no. 9, pp. 1136-1138, 1966.
[22] T. Sheppard and D. S. Wright, "Determination of flow stress: Part 1 constitutive
equation for aluminium alloys at elevated temperatures," Metals Technology,
vol. 9, no. 1, pp. 215-223, 1979.
[23] T. Sheppard and D. S. Wright, "Determination of flow stress: Part 2 radial and
axial temperature distribution during torsion testing," Metals Technology, vol. 6,
no. 1, pp. 224-229, 79.
[24] C. Zener and J. H. Hollomon, "Effect of Strain Rate upon Plastic Flow of Steel,"
Applied Physics, vol. 15, pp. 22-32, 1944.
[25] O. Dada, C. Polese and L. Cornish, "Relationship between Residual Stresses and
Welding Rates in Friction Stir Welded AA6056-T4," in International
MultiConference of Engineers and Computer Scientists, Hong Kong, 2013.
[26] D. Richards, P. Prangnell, S. Williams and P. Withers, "Global mechanical
tensioning for the management of residual stresses in welds," Materials Science
and Engineering: A, vol. 489, no. 1-2, p. 351–362, 2008.
[27] H. Lombard, D. Hattingh, A. Steuwer and M. James, "Optimising FSW process
parameters to minimise defects and maximise fatigue life in 5083-H321
aluminium alloy," Engineering Fracture Mechanics, vol. 75, no. 3-4, p. 341–354,
2008.
[28] "Engineering Edge," Engineering Supples and Book Store , 2000. [Online].
Available:
http://www.engineersedge.com/material_science/fatigue_crack_growth_analysis
_review_10071.htm. [Accessed 22 11 2015].
[29] P. Paris and F. Erdogan, "A Critical Analysis of Crack Propagation Laws," Basic
Engineering, vol. 85, no. 4, pp. 528-533, 1963.
[30] R. Smith, Basic Fracture Mechanics : Including and Introduction to Fatigue,
Oxford: Butterworth-Heinemann Ltd, 1991.
[31] L. Canale, R. Mesquita and G. Totten, Failure Analysis of Heat Treated Steel
Components, Ohio: ASM International, 2008.

84
[32] R. Ambriz and D. Jaramillo, "Mechanical Behavior of Precipitation Hardened
Aluminum Alloys Welds," in Light Metal Applications, Catarina,, Instituto
Politécnico Nacional CIITEC-IPN, 2014.
[33] Y. Chena, H. Dinga, J. Lib, Z. Caia, J. Zhaoc and W. Yanga, "Influence of multi-
pass friction stir processing on the microstructure and mechanical properties of
Al-5083 alloy," Materials Science and Engineering: A, vol. 650, p. 281–289,
2016.
[34] F. Humphreys, "A unified theory of recovery, recrystallization and grain growth,
based on the stability and growth of cellular microstructures—I. The basic
model," Acta Materialia, vol. 45, no. 10, p. 4231–4240, 1997.
[35] F. Humphreys, "A unified theory of recovery, recrystallization and grain growth,
based on the stability and growth of cellular microstructures—II. The effect of
second-phase particles," Acta Materialia, vol. 45, no. 12, p. 5031–5039, 1997.
[36] P. Sivaraja, D. Kanagarajana and V. Balasubramanianb, "Effect of post weld heat
treatment on tensile properties and microstructure characteristics of friction stir
welded armour grade AA7075-T651 aluminium alloy," Defence Technology,
vol. 10, no. 1, p. Pages 1–8, 2014.
[37] A. El-Danaf and M. M. El-Rayes, "Microstructure and mechanical properties of
friction stir welded 6082 AA in as welded and post weld heat treated conditions,"
Materials & Design, vol. 46, p. 561–572, 2013.
[38] Y. Chen, H. Ding, J. Li, J. Zhao, M. Fu and X. Li, "Effect of welding heat input
and post-welded heat treatment on hardness of stir zone for friction stir-welded
2024-T3 aluminum alloy," Transactions of Nonferrous Metals Society of China,
vol. 25, no. 8, p. 2524–2532, 2015.
[39] J. D. Verhoeven, Fundamentals of Physical Metallurgy, New York: John Wiley
and Sons, 1975.
[40] P. Edwards and M. Ramulu, "Fatigue performance of Friction Stir Welded Ti–
6Al–4V subjected to various post weld heat treatment temperatures,"
International Journal of Fatigue, vol. 75, pp. 19-27, 2015.
[41] M. Peel, A. Steuwer, M. Preuss and P. Withers, "Microstructure, mechanical
properties and residual stresses as a function of welding speed in aluminium
85
AA5083 friction stir welds," Acta Materialia, vol. 51, p. 4791–4801, 2003.
[42] P. S. Pao et al., "Fatigue Crack Propagation in Ultrafine Al-Mg Alloy,"
International Journal of Fatigue, vol. 27, pp. 1164-1169, 2005.
[43] T. Hanlon, T. Kwon and Y. Suresh, "Grain Size Effects on the Fatigue Response
of Nano-Crystalline Metals," Scripta Materiala, vol. 49, pp. 675-680, 2003.
[44] J. Donald, G. Bray and R. Bush, "An evaluation of the Adjusted Compliance
Ratio Technique for Determining the Effective Stress Intensity Factor,"
American Society for Testing and Materials, vol. 29, pp. 674-695, 1999.
[45] W. Hosford, Physical Metallurgy, Boca Raton: Taylor and Francis, 2005.
[46] E. K. Center, "http://www.esab.ca/ca/en/education/blog/understanding-the-
aluminum-alloy-designation-system.cfm," ESAB, 26 March 2014. [Online].
[47] "EN ISO 17636-1 Non-destructive testing of welds - Radiographic testing - Part
1: X- and gamma-ray techniques with film," 2013.
[48] A. Orozco-Caballeroa, S. Menonb, C. Cepeda-Jiméneza, P. Hidalgo-Manriquea,
T. McNelleyb, O. Ruanoa and F. Carreñoa, "Influence of microstructural stability
on the creep mechanism of Al–7 wt% Si alloy processed by equal channel
angular pressing," Materials Science and Engineering: A, vol. 712, p. 162–171,
2014.
[49] T. Anderson, "Fracture Mechanics Fundamentals and Applications," CRC Press,
1995.
[50] J. Barsom and S. Rolfe, Fracture and Fatigue Control in Structures, Prentice Hall,
1987.
[51] S. J. Yuan, Z. L. Hu and X. S. Wang, "Formability and microstructural stability
of friction stir welded Al alloy tube during subsequent spinning and post weld
heat treatment," Materials Science&Engineering, vol. A558, p. 586–591, 2012.
Related Documents