Perspectives on Utah’s Economy January/February 2011 Department of Workforce Services Looking Forward to 2011 Utah's New OCCUPATIONAL PROJECTIONS 2008-2018 Part Deux The Education and Training Face of Utah JOBS Now and in 2018

Welcome message from author
This document is posted to help you gain knowledge. Please leave a comment to let me know what you think about it! Share it to your friends and learn new things together.
Transcript

Perspectives on Utah’s Economy
January/February 2011
Department of Workforce Services
Looking Forward to
2011Utah's New OccUpatiONal prOjectiONs 2008-2018part Deux
the education and training Face of Utah
jObsNow and
in 2018
2 January/February 2011
DWS-03-44-0111
Trendlines
jobs.utah.gov
Utah Department of Workforce Services
Executive Director
Kristen Cox
Workforce Research and Analysis
Rick Little, Director
Kimberley Bartel, Editor
Contributors
Mark Knold
John Mathews
Nate Talley
Jim Robson
Lecia Langston
Linda Marling Church
Jane Gardner
Juan Pelaez-Gary
Designer
Pat Swenson
Trendlinesis published every other month by the
Utah Department of Workforce Services,
Workforce Research and Analysis. To read,
download, or print this publication (free),
see our Internet site: http://jobs.utah.gov/wi.
Click on “Publications” then select the one
you want from the list.
To obtain additional printed copies or to
subscribe to Trendlines contact:
Department of Workforce ServicesAttn: WRA
140 East 300 South
Salt Lake City, UT 84111
Telephone: (801) 526-9462
Fax: (801) 526-9238
Email: [email protected]
The Workforce Research and Analysis
Division generates accurate, timely, and
understandable data and analyses to
provide knowledge of ever-changing
workforce environments that support
sound planning and
decision-making.
Equal Opportunity Employer/ProgramAuxiliary aids and services are available upon request to individuals with
disabilities by calling (801) 526-9240. Individuals with speech and/or hearing impairments may call the Relay Utah by dialing 711.
Spanish Relay Utah: 1-888-346-3162.
jobs.utah.gov/wi Trendlines 3
4 Is Washington County Reawakening? Wasatch Front and Statewide
6What is the American Community Survey?
The Outlook
8 A Look at 2011 Economic Insight
10 New Job Growth—Slow andHopefully Steady National News
12 State of Utah Green Jobs Survey Insider News
14Utah's New Occupational Projections
2008-2018—Part Deux Economic News
18The Education and Training Face of
Utah Jobs, Now and in 2018What's Happening
21Registered Apprenticeship:
What Was Old is New Again DWS News
22Medical Imaging Technology: Peering
Inside the Human Body Occupations
24Housing Permit Data—Separate and
Unequal—and Surprising The Outskirts
26 Cache County County Highlight
27 Just the Facts... Rate Update
contents
A Look Forward to 2011
Perspectives on Utah’s Economy
January/February 2011
Department of Workforce Services
Looking Forward to
2011Utah's New OCCUPATIONAL PROJECTIONS 2008-2018Part Deux
The Education and Training Face of Utah
JOBSNow and
in 2018
pg. 22
pg. 18
Reawakening? Is Washington County
4 January/February 2011
wasatch front and statewide | by mark knold, chief economist
Washington County (the St. George area) has been Utah’s high flyer in the economic circus. But the recent recession even knocked
Washington County off of its high wire, meaning even it has to re-gather itself and climb back up the ladder to lofty economic heights. For several years this seemed a far off task. Washington County was Utah’s first county to slide into recession (a direct result of being Utah’s most high-flying housing market), and the depths of its fall made it both dramatic and anticipated that it would stay down longer than other parts of Utah.
But anecdotal evidence may suggest Washington County’s employment growth is just about ready to reawaken. The housing market was the number one casualty of this recession (actually it can be argued as the cause), and Washington County is probably Utah’s most sensitive county when following housing as an economic indicator and signaler of future employment performance.
Washington County housing permits had fallen more than any other county, but through the first eight months of 2010, its housing permit approvals are up

jobs.utah.gov/wi Trendlines 5
Sometimes anecdotal evidence sends telling signals.
61 percent relative to the same period in 2009. Compare that to a nearly 10 percent decline statewide.
Here comes the antidotal evidence. Workforce Services economist Lecia Langston lives in Washington County. She has observed firsthand the recession’s impact upon the Washington County new home market and undeveloped subdivisions. She observes that even though it is small, subdivisions that had no new home building in them for several years are now starting to see a few new homes built here and there. Sometimes anecdotal evidence can send telling signals. Its value is it does it sooner than the resulting statistics.
The wait for Washington County’s economy to reawaken may be over. This would be both welcome and slightly ahead of previous forecasts.
Wind Power: Tapping a New Job Market
In 2009, wind energy made up 1.8 percent of U.S. power generation, an increase from 1.3 percent in 2008. However, wind power accounts for about 50 percent of renewable energy, which includes wind, solar, hydroelectric, and geothermal power, as well as energy from biomass and wood or wood-derived products.
According to the American Wind Energy Association (AWEA) an estimated 85,000 Americans are employed in the wind power industry and its related fields.
According to AWEA, in 2000, installed wind energy capacity in the United States was under 3,000 megawatts. It is now over 35,000 megawatts, enough electricity to power approximately 9.7 million homes.
Resources:•http://bls.gov/green/wind_energy/
BLS Definition of Green Jobs Green jobs either produce goods or provide services that benefit the environment or conserve natural resources or make an establishment’s production processes more environmentally friendly or use fewer natural resources.
FYIF
or y
our i
nfor
mat
ion
6 January/February 2011
the outlook | by jane gardner, labor market information specialist
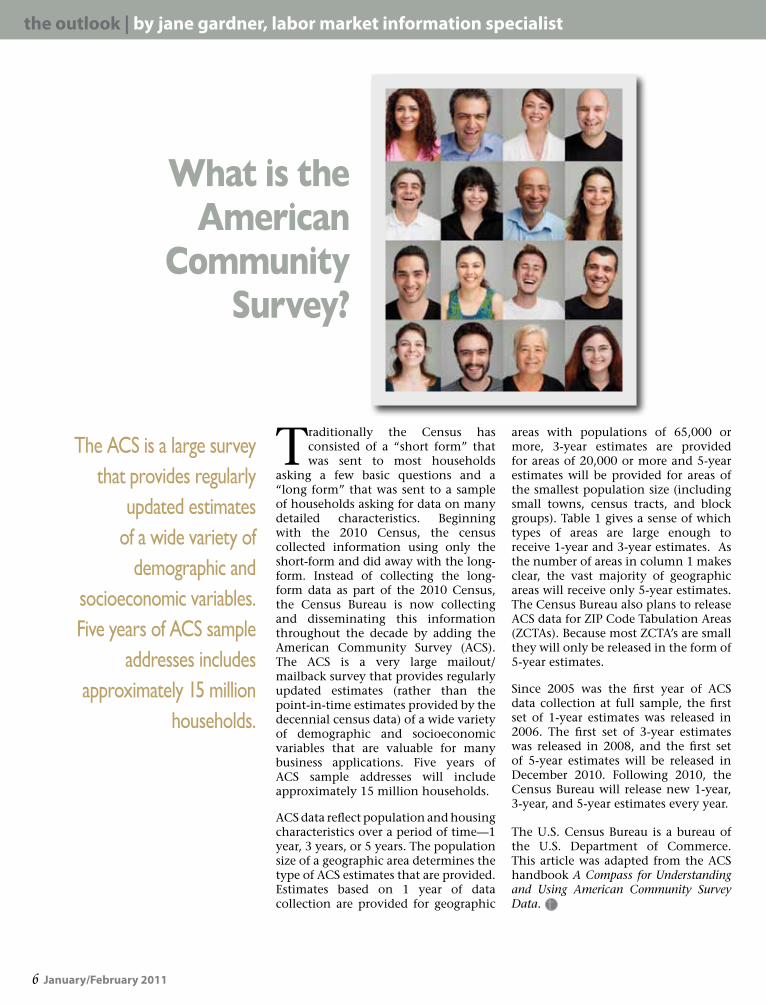
Traditionally the Census has consisted of a “short form” that was sent to most households
asking a few basic questions and a “long form” that was sent to a sample of households asking for data on many detailed characteristics. Beginning with the 2010 Census, the census collected information using only the short-form and did away with the long-form. Instead of collecting the long-form data as part of the 2010 Census, the Census Bureau is now collecting and disseminating this information throughout the decade by adding the American Community Survey (ACS). The ACS is a very large mailout/mailback survey that provides regularly updated estimates (rather than the point-in-time estimates provided by the decennial census data) of a wide variety of demographic and socioeconomic variables that are valuable for many business applications. Five years of ACS sample addresses will include approximately 15 million households.
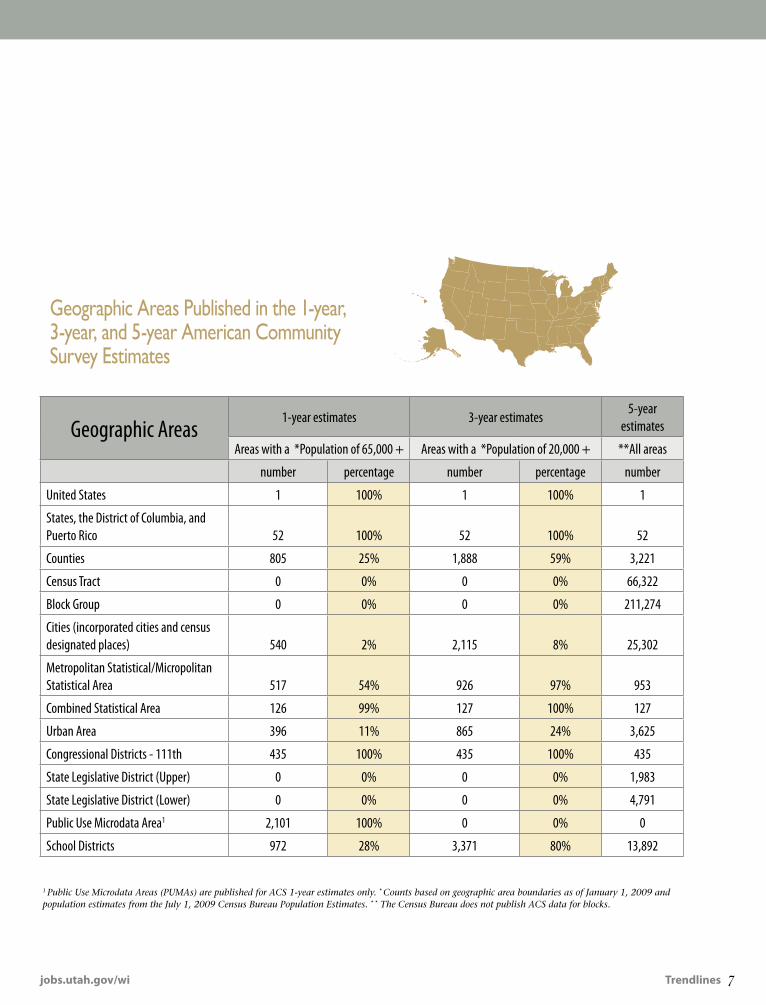
ACS data reflect population and housing characteristics over a period of time—1 year, 3 years, or 5 years. The population size of a geographic area determines the type of ACS estimates that are provided. Estimates based on 1 year of data collection are provided for geographic
areas with populations of 65,000 or more, 3-year estimates are provided for areas of 20,000 or more and 5-year estimates will be provided for areas of the smallest population size (including small towns, census tracts, and block groups). Table 1 gives a sense of which types of areas are large enough to receive 1-year and 3-year estimates. As the number of areas in column 1 makes clear, the vast majority of geographic areas will receive only 5-year estimates. The Census Bureau also plans to release ACS data for ZIP Code Tabulation Areas (ZCTAs). Because most ZCTA’s are small they will only be released in the form of 5-year estimates.
Since 2005 was the first year of ACS data collection at full sample, the first set of 1-year estimates was released in 2006. The first set of 3-year estimates was released in 2008, and the first set of 5-year estimates will be released in December 2010. Following 2010, the Census Bureau will release new 1-year, 3-year, and 5-year estimates every year.
The U.S. Census Bureau is a bureau of the U.S. Department of Commerce. This article was adapted from the ACS handbook A Compass for Understanding and Using American Community Survey Data.
What is the American
Community Survey?
The ACS is a large survey that provides regularly
updated estimates of a wide variety of
demographic and socioeconomic variables. Five years of ACS sample
addresses includes approximately 15 million
households.
jobs.utah.gov/wi Trendlines 7
Geographic Areas1-year estimates 3-year estimates
5-year estimates
Areas with a *Population of 65,000 + Areas with a *Population of 20,000 + **All areas
number percentage number percentage number
United States 1 100% 1 100% 1
States, the District of Columbia, and Puerto Rico 52 100% 52 100% 52
Counties 805 25% 1,888 59% 3,221
Census Tract 0 0% 0 0% 66,322
Block Group 0 0% 0 0% 211,274
Cities (incorporated cities and census designated places) 540 2% 2,115 8% 25,302
Metropolitan Statistical/Micropolitan Statistical Area 517 54% 926 97% 953
Combined Statistical Area 126 99% 127 100% 127
Urban Area 396 11% 865 24% 3,625
Congressional Districts - 111th 435 100% 435 100% 435
State Legislative District (Upper) 0 0% 0 0% 1,983
State Legislative District (Lower) 0 0% 0 0% 4,791
Public Use Microdata Area1 2,101 100% 0 0% 0
School Districts 972 28% 3,371 80% 13,892
Geographic Areas Published in the 1-year, 3-year, and 5-year American Community Survey Estimates
1 Public Use Microdata Areas (PUMAs) are published for ACS 1-year estimates only. * Counts based on geographic area boundaries as of January 1, 2009 and population estimates from the July 1, 2009 Census Bureau Population Estimates. * * The Census Bureau does not publish ACS data for blocks.
Bore
dom Risk
8 January/February 2011
economic insight | by mark knold, chief economist
Bore
dom Risk
jobs.utah.gov/wi Trendlines 9jobs.utah.gov/wi Trendlines 9
Another year is upon us, and it’s time to forecast how the eco-nomic picture may develop
as the next 12 months unfold. In a nutshell, I believe 2011 will be much of a repeat of 2010. The worst of the economic downturn is behind us, re-covery will continue being slow and methodical, with low job growth and high unemployment keeping the re-cession’s impact fresh upon people’s minds. The possibility of falling into another recession remains in the pic-ture, yet is not perceived as the most likely scenario.
I see several factors conspiring to keep employment activity on a sub-par pace in 2011—continued housing woes, low Gross Domestic Product (GDP) growth rate forecasts prompt-ing the business community to believe it can continue using only productiv-ity gains to keep pace, and the CEO community remaining risk averse and not anxious to embrace risky econom-ic-enhancement projects.
It was the housing market that set off this whole economic slide, and it
will be the housing market that sig-nals when its effects end. With the amount of foreclosures still on the market, with legal questions now arising as to who has the authority and the title to do the foreclosing, and the expected slow job market again in 2011, the negative factors weighing upon the housing market will still have life in 2011. There is a level of pent up housing demand brewing in Utah, but 2011 still does not look like the year when that de-mand can be released.
If the low level of forecasted GDP growth occurs in 2011 (something around the 2 to 2.5 percent range), business leader comments speculat-ing that level of growth can probably be met with productivity gains and not worker additions is not only dis-couraging, but unfortunately valid. Productivity gains have been consis-tent of late, and low GDP growth can be met largely by just squeezing more productivity out of current workers. High business profit margins suggest that businesses have the wherewithal to hire, but until convinced of no
other option but to hire, businesses will be reluctant to hire.
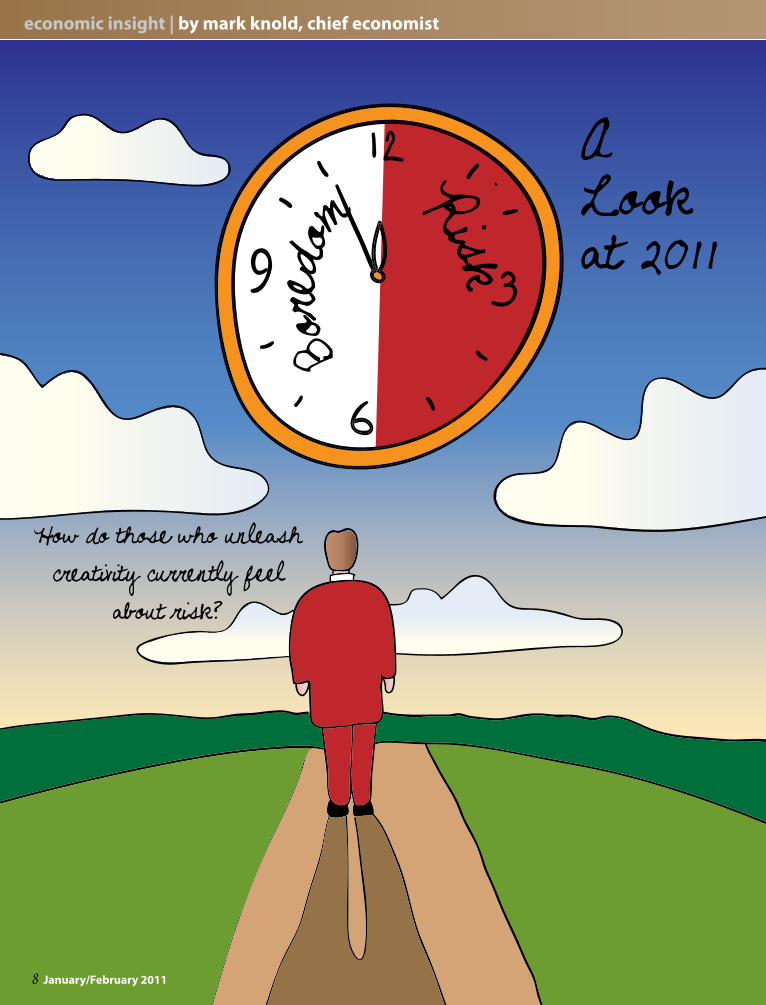
Capitalism rewards creativity, creativ-ity breeds risk. Risk introduces psy-chology to the picture. How do those who unleash creativity currently feel about risk? The unfortunate answer is many business leaders feel gun-shy toward risk. The recent reces-sion swung the pendulum from little respect of risk to a loathing of risk. Alan Greenspan recently commented upon this phenomenon, opining that the business community needs a pe-riod of boredom before they are again willing to unleash the excitement of meeting risk head-on. The idea is that the pain of the recent recession is still fresh upon their minds, and that only time will erase that pain (which only a period of boredom can do). This seems to be a valid argument, and is another reason why 2011 is anticipated to be a “boring” year.
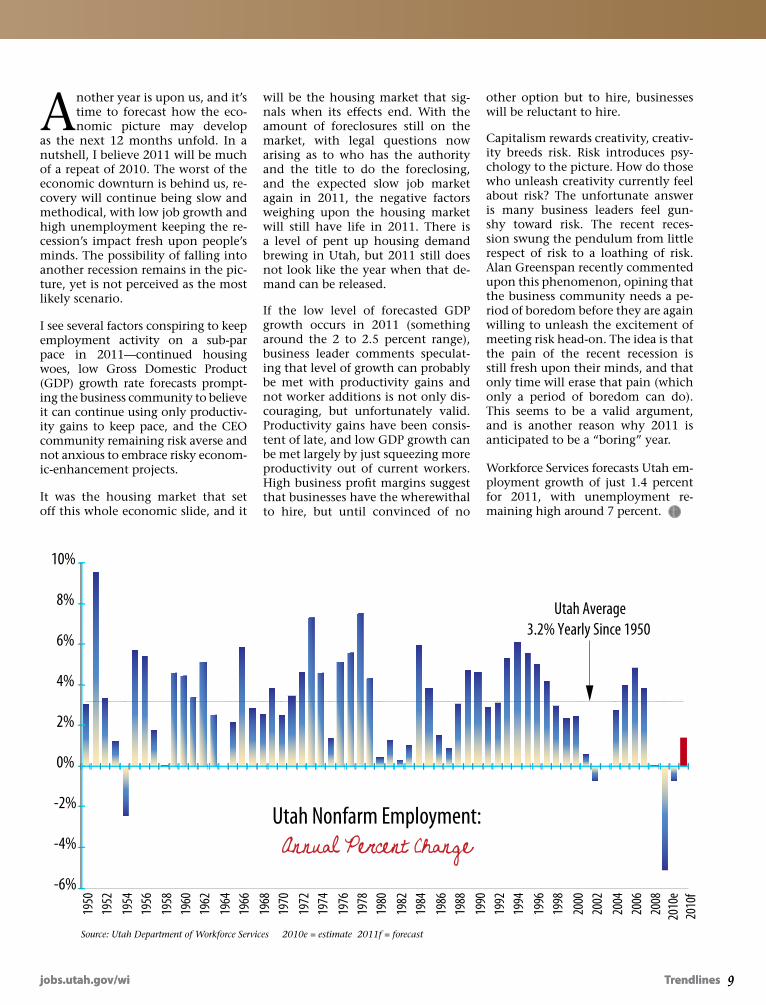
Workforce Services forecasts Utah em-ployment growth of just 1.4 percent for 2011, with unemployment re-maining high around 7 percent.
-6%
-4%
-2%
0%
2%
4%
6%
8%
10%
1950
1952
1954
1956
1958
1960
1962
1964
1966
1968
1970
1972
1974
1976
1978
1980
1982
1984
1986
1988
1990
1992
1994
1996
1998
2000
2002
2004
2006
2008
2010
e20
10f
Utah Average3.2% Yearly Since 1950
Source: Utah Department of Workforce Services 2010e = estimate 2011f = forecast
10 January/February 2011
national news | by jim robson, economist
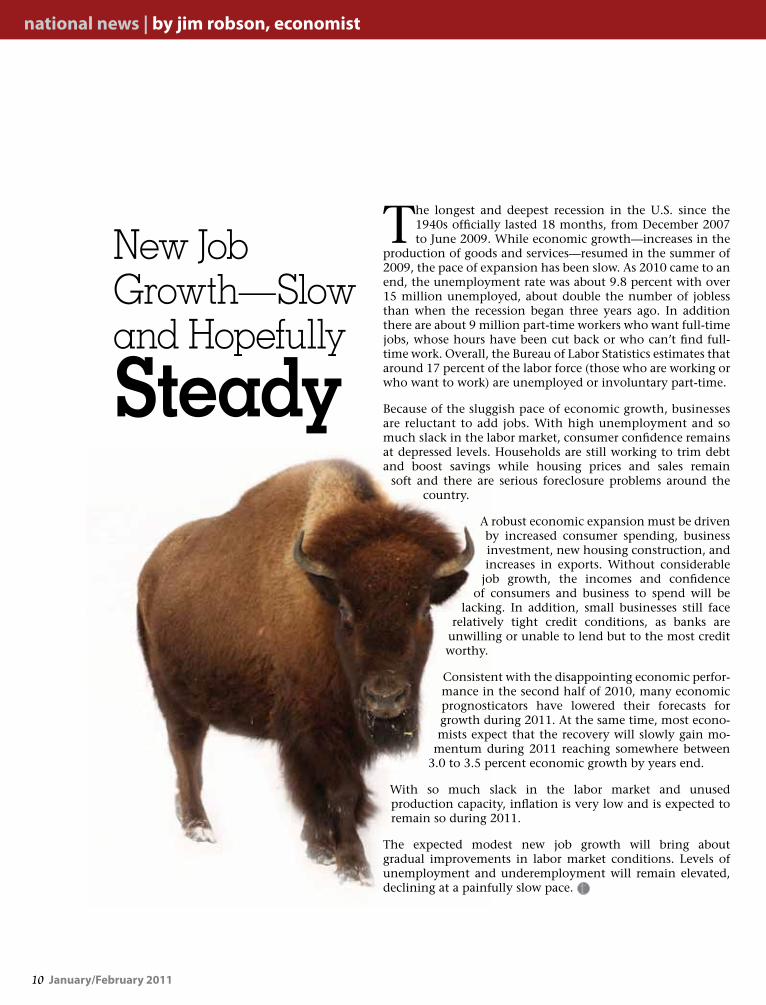
The longest and deepest recession in the U.S. since the 1940s officially lasted 18 months, from December 2007 to June 2009. While economic growth—increases in the
production of goods and services—resumed in the summer of 2009, the pace of expansion has been slow. As 2010 came to an end, the unemployment rate was about 9.8 percent with over 15 million unemployed, about double the number of jobless than when the recession began three years ago. In addition there are about 9 million part-time workers who want full-time jobs, whose hours have been cut back or who can’t find full-time work. Overall, the Bureau of Labor Statistics estimates that around 17 percent of the labor force (those who are working or who want to work) are unemployed or involuntary part-time.
Because of the sluggish pace of economic growth, businesses are reluctant to add jobs. With high unemployment and so much slack in the labor market, consumer confidence remains at depressed levels. Households are still working to trim debt and boost savings while housing prices and sales remain
soft and there are serious foreclosure problems around the country.
A robust economic expansion must be driven by increased consumer spending, business investment, new housing construction, and increases in exports. Without considerable
job growth, the incomes and confidence of consumers and business to spend will be
lacking. In addition, small businesses still face relatively tight credit conditions, as banks are
unwilling or unable to lend but to the most credit worthy.
Consistent with the disappointing economic perfor-mance in the second half of 2010, many economic prognosticators have lowered their forecasts for growth during 2011. At the same time, most econo-mists expect that the recovery will slowly gain mo-
mentum during 2011 reaching somewhere between 3.0 to 3.5 percent economic growth by years end.
With so much slack in the labor market and unused production capacity, inflation is very low and is expected to remain so during 2011.
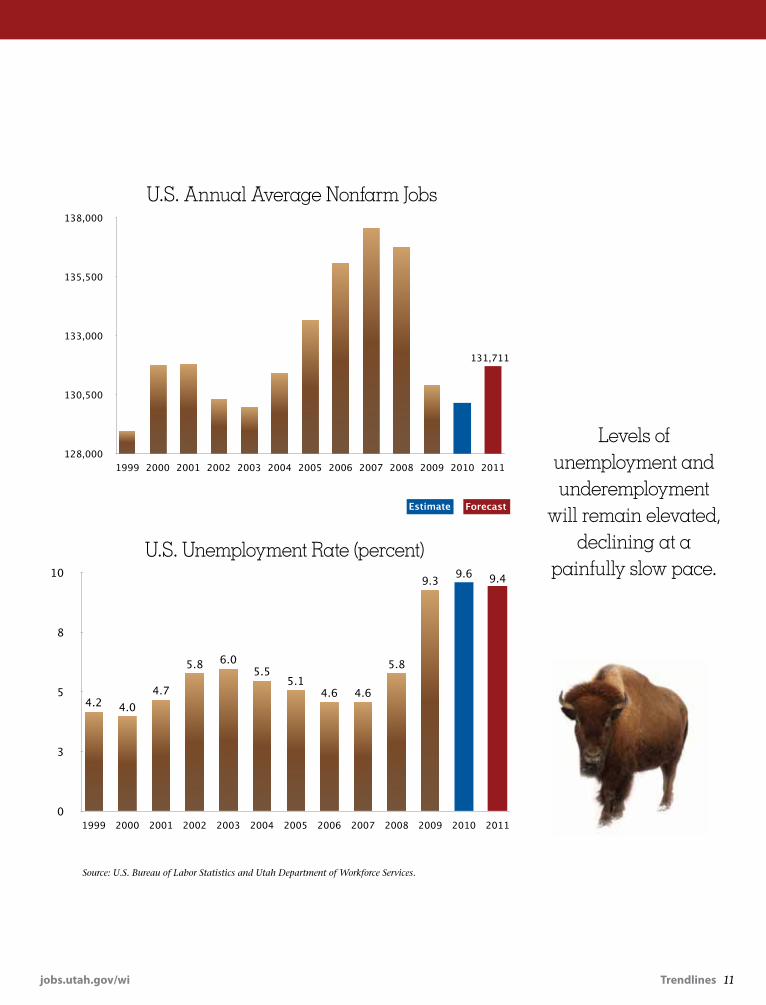
The expected modest new job growth will bring about gradual improvements in labor market conditions. Levels of unemployment and underemployment will remain elevated, declining at a painfully slow pace.
New Job Growth—Slow and Hopefully
Steady
jobs.utah.gov/wi Trendlines 11
Source: U.S. Bureau of Labor Statistics and Utah Department of Workforce Services.
128,000
130,500
133,000
135,500
138,000
1999 2000 2001 2002 2003 2004 2005 2006 2007 2008 2009 2010 2011
131,711
Estimate Forecast
0
3
5
8
10
1999 2000 2001 2002 2003 2004 2005 2006 2007 2008 2009 2010 2011
9.49.69.3
5.8
4.64.65.1
5.56.05.8
4.74.04.2
U.S. Annual Average Nonfarm Jobs
U.S. Unemployment Rate (percent)
Levels of unemployment and underemployment
will remain elevated, declining at a
painfully slow pace.
12 January/February 2011
insider news | by nate talley, economist
Nowadays, the word “green” is commonly used to describe how economic activities positively im-pact the environment. From internal business
practices to the global market place, the green label is being applied to economic inputs and outputs alike. But what does being green actually mean? And how is Utah’s economy affected by the green movement?
In an effort to answer these questions, Utah’s Depart-ment of Workforce Services (DWS) partnered with five other states (Montana, Wyoming, South Dakota, Nebras-ka and Iowa) to form the Rocky Mountain & Northern
Plains Green Job Consortium. The consortium was commis-sioned by the Federal Depart-ment of Labor to research the green economy by geographic
area, industry and occupation. To obtain information under those strata, it was determined that each state in the consortium would conduct a green jobs survey within their respective state. In Utah, DWS sampled over 11,000 establishments across 19 major industry sectors.
Prior to launching a survey, however, the consortium needed to construct an appropriate definition for green as it related to jobs and business activities. Was a secretary who put waste paper in a recycle bin a “green secretary”? If a business replaced old light bulbs with more energy efficient ones, was that a “green business”?
It turns out, what we really wanted to measure through a green jobs survey were economic activities that were different because they were green. A secretary’s job is the same whether he/she recycles waste or throws it in the garbage, and a bakery is going to engage in baking goods regardless of what type of light bulbs are in use. Converse-
ly, an electrician who knows how to repair a wind turbine might have a very different set of knowledge, skills and abilities than an electrician who wires residential build-ings. Moreover, a business that operates to manufacture energy efficient light bulbs is specialized in a green area, whereas almost any business that uses light bulbs can upgrade to energy efficient ones. In short, for the pur-poses of this study, we defined a green job as one where the employee is directly performing green-related activi-ties as part of their core-job duties. We defined a green business as a firm that primarily operates to produce a green economic product or service. The consortium then needed to classify what constituted a green-related activ-ity. We came up with six green economic categories as shown at the right.
In the end, the Utah green jobs survey witnessed a sta-tistically valid response rate of 47 percent. Over 400 companies reported having at least one green job and over 500 companies reported being engaged in a prima-ry green activity. Some of the most commonly reported green jobs were environmental engineers, building con-tractors who specialize in green construction and energy managers. The most frequently reported green econom-ic categories were Energy efficiency and conservation, sustainable agriculture and natural resource conserva-tion and pollution, waste, and greenhouse gas manage-ment, prevention, and reduction.
Although the Rocky Mountain & Northern Plains Green Jobs Consortium is just beginning to interpret the ma-jor findings of the Green Jobs Survey, the research has proved encouraging. We are gaining a better understand-ing of what “green” means for Utah, its economy and its workforce, and we look forward to be able to report more information as it is uncovered.
green jobs
The Northern Plains & Rocky MountainConsortium: researching the green economyIowa, Montana, Nebraska, South Dakota, Utah, & Wyoming
State of Utah
GREEN JOBS SURVEY

Trendlines 13jobs.utah.gov/wi
CAtEGORY ExAmplES
Renewable Energy and Alternative Fuels Manufacturing, construction, research, or delivery of wind, solar, biomass, hydro, geothermal, methane and waste incineration as a fuel source.
Energy efficiency and conservation Manufacturing, construction or installation of energy efficient products such as weatherization, retrofitting and transportation technology.
Pollution, waste, and greenhouse gas (GHG) management, prevention, and reduction
Reducing greenhouse gas emissions, waste water and other pollutants.
Environmental cleanup and restoration, and waste clean-up and mitigation
Clean-up and disposal of waste, hazardous materials and landfill restoration.
Education, regulation, compliance, public awareness, training and energy trading
Activities that educate on energy efficiency, energy rating system certifications, enforcement of compliance requirements and training on effective use of energy related products and processes.
Sustainable agriculture and natural resource conservation
Low carbon and organic agriculture, land management, water management and conservation, wetlands restoration and environmental conservation.
The consortium needed to classify what constituted a green-related activity and developed six green economic categories as shown below.
14 January/February 2011
economic news | by lecia parks langston, economist
In last month’s issue of TrendLines magazine, I wrote an article outlining our recently re-leased occupational projections. Since we do
projections for roughly 780 in-dividual occupations, you know I didn’t get very detailed in that two-page article. Hopefully, this article will add a little “meat” to the “bones” of the previous re-port. If you missed that discus-sion, I’d suggest you take a few moments to read it( http://jobs.utah.gov/wi/pubs/trendlines/novdec10/theoutlook.pdf) so you can understand some of the nuances of the data.
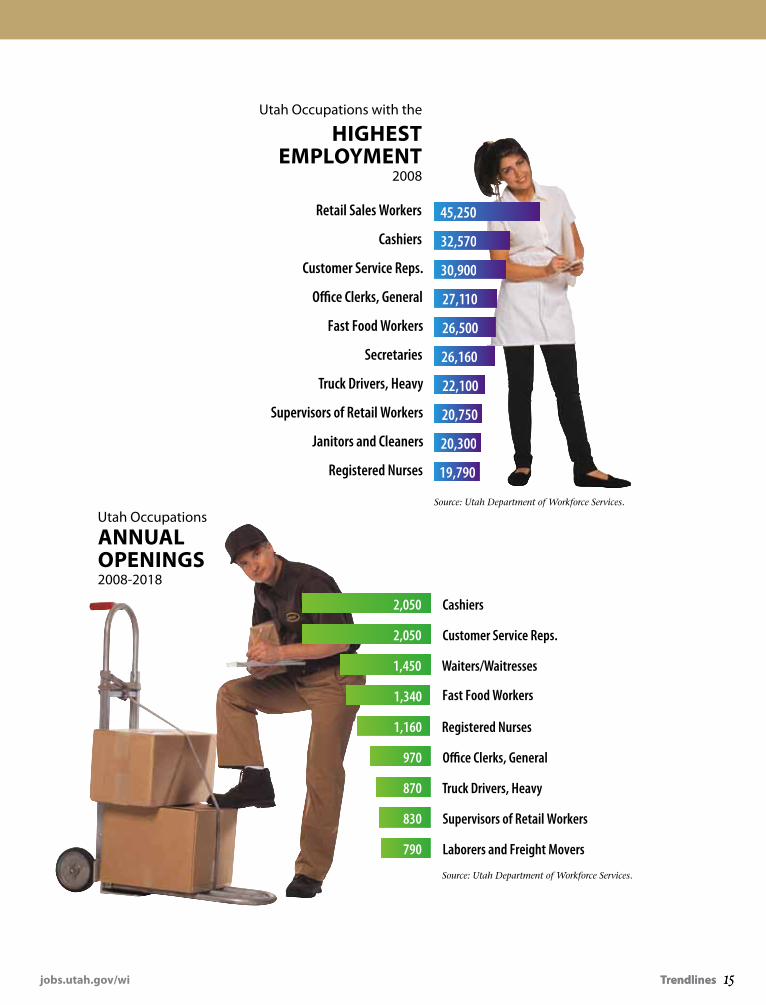
Not Much Glamour HereUnderstanding where we are helps us understand where we are going. Occupations with high em-ployment today will likely show high employ-ment in the future. We’re talking about signifi-cant portions of the labor market—they don’t change quickly. It just might make sense to take a moment to look at the chart with the most com-mon occupations in Utah. Typically they aren’t the “glamour jobs” or the high-paying jobs—they are the cashiers, the fast food workers, the secretaries, the truck drivers, the nurses and the janitors that we meet almost every day. However, together these top-ten occupations account for
a whopping 19 percent of total employment in Utah.
Not only are these occupations large, but many of them also have high replacement rates. You’ll notice that many of the occupations in the top-ten most common occupations are ALSO among those with the most projected openings. These top-ten opening producers are expected to account for 22 percent of all the new openings in Utah between 2008 and 2018. Again, for the most part, they are not particularly exciting or “sexy.” But, they are an integral part of Utah’s labor market.
Show me the fast growing jobs! The number of openings an occupation pro-duces is the best indicator of demand. However, growth rates can also quickly reveal how our la-bor market is changing. In this case, we’ll look at occupations with at least 100 annual average openings to exclude small occupations where minute employment gains can result in huge per-cent changes. (For example, an occupation with one job adds another and suddenly you’ve got 100-percent growth.)
In total, employment in Utah is expected to show a 2.1 percent average annual growth rate between 2008 and 2018. The top-ten fastest growing oc-cupations all show expansion rates that at least
6 November/December 2010
the outlook | by lecia parks langston, economist
One of the most difficult parts of my job is making occupational projections. After all, I don’t
really know the future and projecting
economic outcomes is as much art as
science. However, having said that,
I’m aided by lots of current data,
long-term trends, a time-honored
methodology, and the chance to renew
my projections every two years. We’re
currently releasing the most recent
occupational projections.
A few things to remember:
•Demand but no supply. Projection numbers represent only the “demand” side of the demand/supply equation. An occupation may produce lots of openings but still have even more workers willing to work in that particular career.
•Growth and replacements. Openings come from two sources—growth and the need to replace workers who have left the occupation for any reason (retirement, changing careers, leaving the labor force, promotion, etc.)
•Large occupations—large number of openings. Large occupations typically have large numbers of projected openings. In Utah the occupations with the highest employment levels are retail sales workers, customer service representatives, cashiers, and fast food workers.
•Growth rates versus number of openings. A fast-growing occupation may not necessarily have many
New Occupational Projections—2008-2018
openings. For example, an occupation that showed employment of 10 in 2008 and projected employment of 20 in 2018 would display a 10-year growth rate of 100 percent. However, it would have created only 10 additional jobs. It’s important to look at both growth rates and the number of openings.
•Wages are important, too. An occupation could have absolutely tons of openings, but pay a relatively low wage. That might make it a poor career choice. Check out the star ratings for individual occupations
on our website for a measure that combines employment outlook and wage information.
A picture (graph to an economist) is
worth a thousand words. So, take time
to look at the graphs included with
this article and then wend your way to
our website. Until then, here are some
of the points I think are important to
understand about the current set of
occupational projections:
•Current projections indicate that on average each year between 2008 and 2018, Utah will grow about 2 percent
Utah’s
Part one in last issue.
New Occupational Projections 2008-2018—Part Deux
Utah’sIF you doN’T WaNT
To geT a loT oF TraININg, you’ll Probably FINd a
Job, alThough IT May NoT Pay The
TyPe oF Wages you’d lIke.
jobs.utah.gov/wi Trendlines 15Trendlines 15
Utah Occupations with the
hIghesT eMPloyMeNT
2008
Retail Sales Workers
Cashiers
Customer Service Reps.
O�ce Clerks, General
Fast Food Workers
Secretaries
Truck Drivers, Heavy
Supervisors of Retail Workers
Janitors and Cleaners
Registered Nurses 19,790
20,300
20,750
22,100
26,160
26,500
27,110
30,900
32,570
45,250
Cashiers
Customer Service Reps.
Waiters/Waitresses
Fast Food Workers
Registered Nurses
O�ce Clerks, General
Truck Drivers, Heavy
Supervisors of Retail Workers
Laborers and Freight Movers790
830
870
970
1,160
1,340
1,450
2,050
2,050
Source: Utah Department of Workforce Services.
Source: Utah Department of Workforce Services.
Utah Occupations
aNNual oPeNINgs 2008-2018
16 January/February 2011
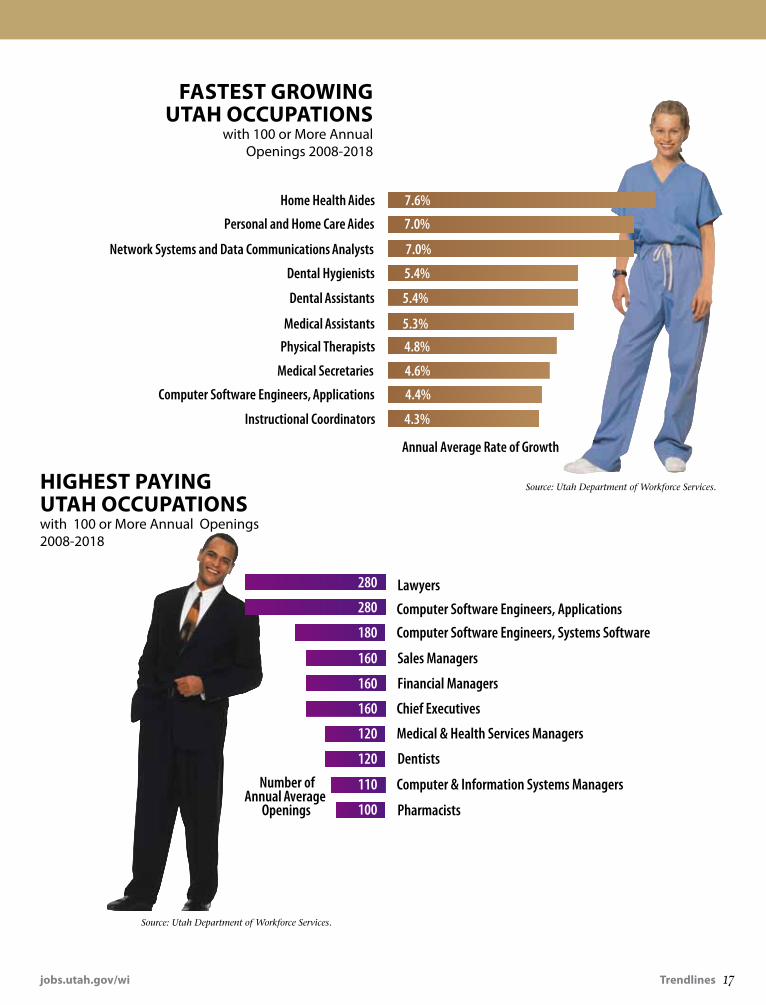
double the average. In this chart you’ll notice that almost all the fastest grow-ing jobs are related to healthcare. Nev-ertheless, a number of these healthcare positions are relatively low-skilled. Computer-related occupations also show relatively high rates of growth.
High-Pay; High Demand You’ve surely noticed that the occupations with the most projected openings in Utah are generally far from the highest-paying. What are the best-paying occupations which also show a respectable level of demand? For this chart, we’ve used the same group of occupations with at least 100 average annual openings and then ranked the top-ten highest paying of those occupations.
Lawyers come out on top—but, re-member over-supply may be an issue in a small state with two law schools. Again, computer-related and healthcare jobs make up a notable share of these positions. However, in this case, they are jobs with high education levels and analytic/technical skills. Your mom was right—education pays.
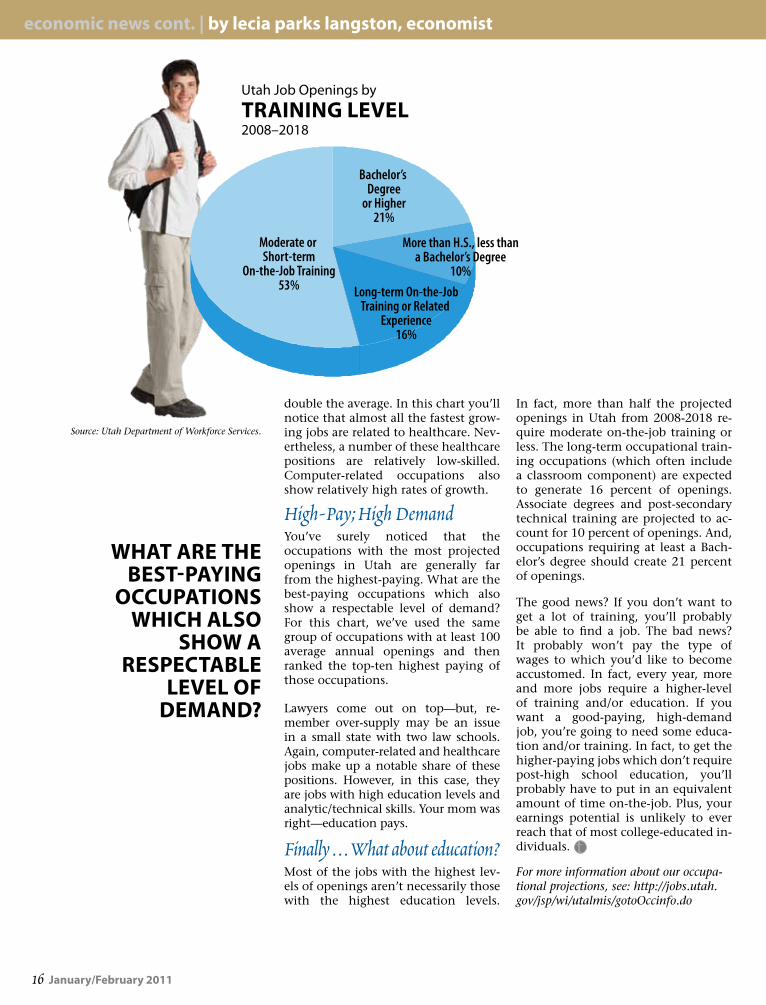
Finally . . . What about education? Most of the jobs with the highest lev-els of openings aren’t necessarily those with the highest education levels.
In fact, more than half the projected openings in Utah from 2008-2018 re-quire moderate on-the-job training or less. The long-term occupational train-ing occupations (which often include a classroom component) are expected to generate 16 percent of openings. Associate degrees and post-secondary technical training are projected to ac-count for 10 percent of openings. And, occupations requiring at least a Bach-elor’s degree should create 21 percent of openings.
The good news? If you don’t want to get a lot of training, you’ll probably be able to find a job. The bad news? It probably won’t pay the type of wages to which you’d like to become accustomed. In fact, every year, more and more jobs require a higher-level of training and/or education. If you want a good-paying, high-demand job, you’re going to need some educa-tion and/or training. In fact, to get the higher-paying jobs which don’t require post-high school education, you’ll probably have to put in an equivalent amount of time on-the-job. Plus, your earnings potential is unlikely to ever reach that of most college-educated in-dividuals.
For more information about our occupa-tional projections, see: http://jobs.utah.gov/jsp/wi/utalmis/gotoOccinfo.do
economic news cont. | by lecia parks langston, economist
Utah Job Openings by
TraININg level 2008–2018
Moderate or Short-term
On-the-Job Training53%
More than H.S., less thana Bachelor’s Degree
10%Long-term On-the-Job
Training or Related Experience
16%
Bachelor’s Degree
or Higher21%
Source: Utah Department of Workforce Services.
WhaT are The besT-PayINg
occuPaTIoNs WhIch also
shoW a resPecTable
level oF deMaNd?
jobs.utah.gov/wi Trendlines 17
Source: Utah Department of Workforce Services.
Source: Utah Department of Workforce Services.
FasTesT groWINg uTah occuPaTIoNs
with 100 or More Annual Openings 2008-2018
Home Health Aides
Personal and Home Care Aides
Network Systems and Data Communications Analysts
Dental Hygienists
Dental Assistants
Medical Assistants
Physical Therapists
Medical Secretaries
Computer Software Engineers, Applications
Instructional Coordinators
Annual Average Rate of Growth
4.3%
4.4%
4.6%
4.8%
5.3%
5.4%
5.4%
7.0%
7.0%
7.6%
Number ofAnnual Average
Openings
Computer Software Engineers, Applications
280
280
180
160
160
160
120
120
110
100
Computer Software Engineers, Systems Software
Sales Managers
Financial Managers
Lawyers
Chief Executives
Medical & Health Services Managers
Dentists
Computer & Information Systems Managers
Pharmacists
hIghesT PayINg
uTah occuPaTIoNs with 100 or More Annual Openings 2008-2018
18 January/February 2011
what's happening | by john mathews, economist
One in five Utah jobs requires at least a bachelor’s degree or higher. You have heard this statistic
before, but how do we know? On the other end of the scale, what proportion of jobs in the state require virtually no training past a “short demonstration?” Is the pay different for different training levels? In this edition of Trendlines under Economic News you will find an article on the Utah Job Outlook. It presents job demand information about occupations in Utah between 2008 and 2018. Education and training requirements of these occupations are another dimension of the job outlook data.
Education and training levels – DefinedThe U.S. Bureau of Labor Statistics uses a training classification system that assigns one of eleven training codes to all the 700+ occupations in the system. The assignment is based on “the most significant source” of education and training for the occupation based on research conducted by the Bureau. The 11 classifications of training are listed at the right.
the DataDWS produces occupational projections biennially. That means every other year we spend months creating industry and occupational projections that describe the Utah job market. The current set of projections includes the 2008 to 2018 period. Estimates of employment and job openings are generated for each of the some 750 occupations in the State. These data include the employment or number of jobs in the base year—2008, the projected year—2018, new jobs created between 2008 and 2018, and the number of annual average job openings expected over that period. A training code is assigned to each occupation, as well as the 2009 median occupational wage. These
Now and in 2018
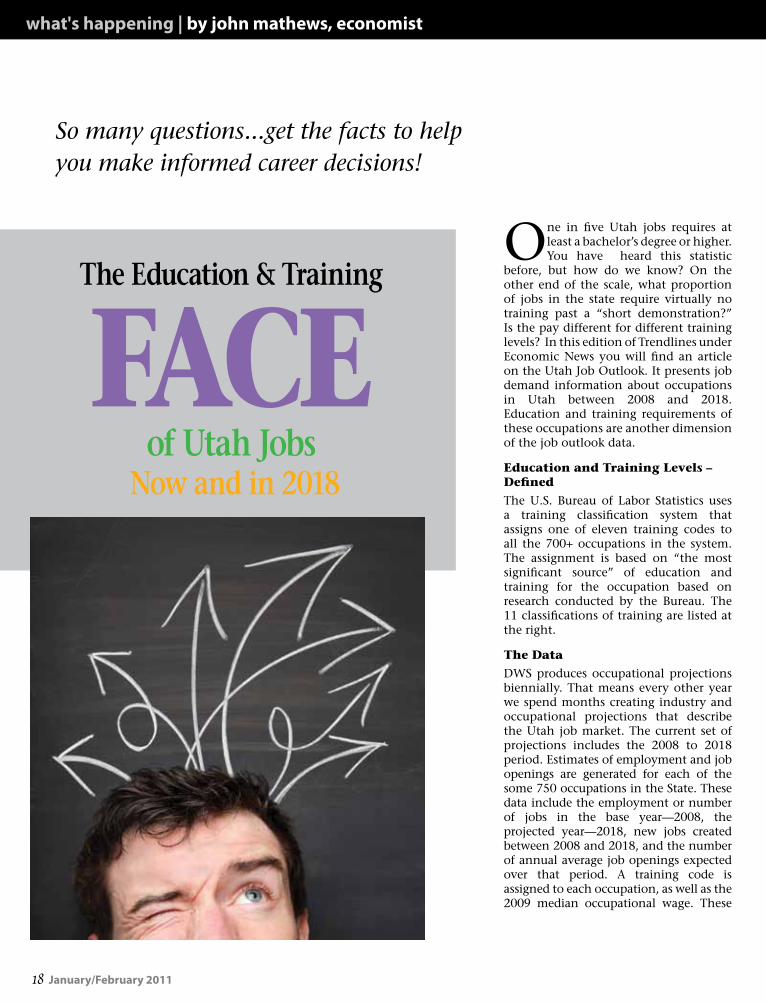
The Education & Training
FACEof Utah Jobs
So many questions...get the facts to help you make informed career decisions!
Trendlines 19jobs.utah.gov/wi
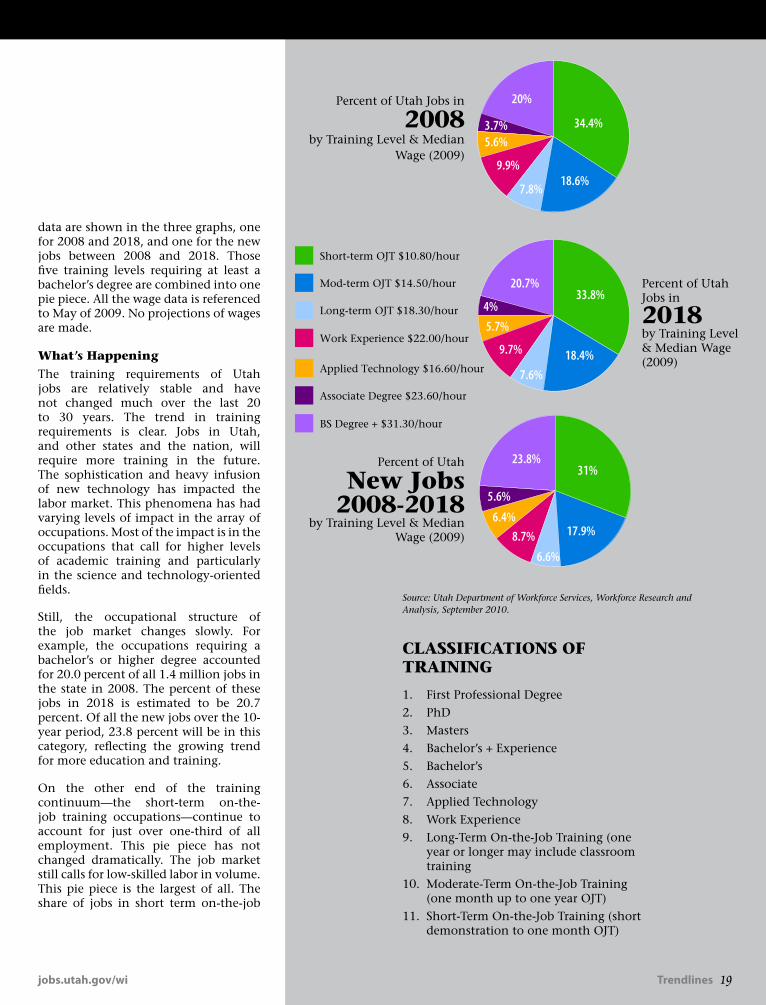
data are shown in the three graphs, one for 2008 and 2018, and one for the new jobs between 2008 and 2018. Those five training levels requiring at least a bachelor’s degree are combined into one pie piece. All the wage data is referenced to May of 2009. No projections of wages are made.
What’s HappeningThe training requirements of Utah jobs are relatively stable and have not changed much over the last 20 to 30 years. The trend in training requirements is clear. Jobs in Utah, and other states and the nation, will require more training in the future. The sophistication and heavy infusion of new technology has impacted the labor market. This phenomena has had varying levels of impact in the array of occupations. Most of the impact is in the occupations that call for higher levels of academic training and particularly in the science and technology-oriented fields.
Still, the occupational structure of the job market changes slowly. For example, the occupations requiring a bachelor’s or higher degree accounted for 20.0 percent of all 1.4 million jobs in the state in 2008. The percent of these jobs in 2018 is estimated to be 20.7 percent. Of all the new jobs over the 10-year period, 23.8 percent will be in this category, reflecting the growing trend for more education and training.
On the other end of the training continuum—the short-term on-the-job training occupations—continue to account for just over one-third of all employment. This pie piece has not changed dramatically. The job market still calls for low-skilled labor in volume. This pie piece is the largest of all. The share of jobs in short term on-the-job
ClASSiFiCAtiONS OF tRAiNiNG
1. First Professional Degree 2. PhD 3. Masters 4. Bachelor’s + Experience 5. Bachelor’s 6. Associate 7. Applied Technology8. Work Experience 9. Long-Term On-the-Job Training (one
year or longer may include classroom training
10. Moderate-Term On-the-Job Training (one month up to one year OJT)
11. Short-Term On-the-Job Training (short demonstration to one month OJT)
Percent of Utah Jobs in
2018by Training Level & Median Wage (2009)
Source: Utah Department of Workforce Services, Workforce Research and Analysis, September 2010.
18.6%7.8%
9.9%
5.6%3.7% 34.4%
20%
17.9%
6.6%8.7%
6.4%
5.6%
31%23.8%
18.4%7.6%
9.7%
5.7%4%
33.8%20.7%
Mod-term OJT $14.50/hour
Long-term OJT $18.30/hour
Work Experience $22.00/hour
Applied Technology $16.60/hour
Associate Degree $23.60/hour
BS Degree + $31.30/hour
Short-term OJT $10.80/hour
18.6%7.8%
9.9%
5.6%3.7% 34.4%
20%
17.9%
6.6%8.7%
6.4%
5.6%
31%23.8%
18.4%7.6%
9.7%
5.7%4%
33.8%20.7%
Mod-term OJT $14.50/hour
Long-term OJT $18.30/hour
Work Experience $22.00/hour
Applied Technology $16.60/hour
Associate Degree $23.60/hour
BS Degree + $31.30/hour
Short-term OJT $10.80/hour
Percent of Utah Jobs in
2008by Training Level & Median
Wage (2009)
Percent of Utah
New Jobs 2008-2018
by Training Level & Median Wage (2009)
20 January/February 2011
training is, however, shrinking. Note on the graph in 2008 the proportion is 34.4 percent compared to a smaller 33.8 percent share in 2018. Just because these unskilled jobs don’t require much more than short demonstration to become proficient doesn’t mean the workers in these jobs are uneducated. Most of the applicants and workers have high school diplomas.
The job market in occupations re-quiring more education and training is expanding and the market for oc-cupations calling for work experience and less training is shrinking. Bache-lor’s and higher-degreed occupations and associate and applied technology occupations are experiencing higher than average (2.1 percent per year) growth as compared to the occupa-tions requiring less training. These other jobs with lower training re-quirements are not declining in abso-lute terms, but slipping in their share of total jobs.
Wages and Education and trainingYes, there is a relationship between higher training required and higher wages. The graphs show the median hourly rate (in 2009 dollars) for each of the pie pieces. Higher than the state median of $18.10 per hour rates are evident for all four of six of the more education and training categories. The highest paid was for the Bachelor’s or
higher with an hourly median wage of $31.30. Wages for occupations requiring an associates degree or applied technology education were $19.40 per hour and $22.00 per hour, respectively.
Over-Educated?About 28 percent of Utahns age 25 and over have a bachelor’s degree or higher. Twenty percent of Utah jobs require a bachelor’s degree or higher. Is this a massive mis-match in the job market and Utah’s population? Here two different data sources are at play. Utah’s population is educated and the emphasis in our society, schools, legislature, and in general is to promote education. Education for education’s sake is a real positive attribute in our society. The more education our citizenry has the better the society and standard of living is. On the other hand, some say we need to train our young people in just the skill they need to get a job. The answer is not simple and our state has been debating this question for decades, but that’s food for thought for another time.
what's happening cont. | by john mathews, economist
About 28 percent of Utahns age 25 and over have a
bachelor's degree or higher, yet only 20 percent of Utah
jobs require a bachelor's degree or higher. Is this a
massive mis-match?
Trendlines 21
dws news | by juan pelaez-gary, state director for utah office of apprenticeship
• Occupations and industries are classified quite differently. An industry refers to a set of like business activities through which establishments can be grouped. An occupation refers to a set of like job duties through which workers can be grouped. For instance, a restaurant is in the Accommodation and Food Services industry, whereas a waiter is in the Waiters and Waitresses occupation.
• The majority of occupations are common to many different industries. Consider the following: While it is certainly common that an accounting firm in the professional, scientific, and technical service industry would employ accountants, firms like hospitals, manufacturing plants and construction companies do as well.
To see how statistics differ by industry and occupation, see the tables below.
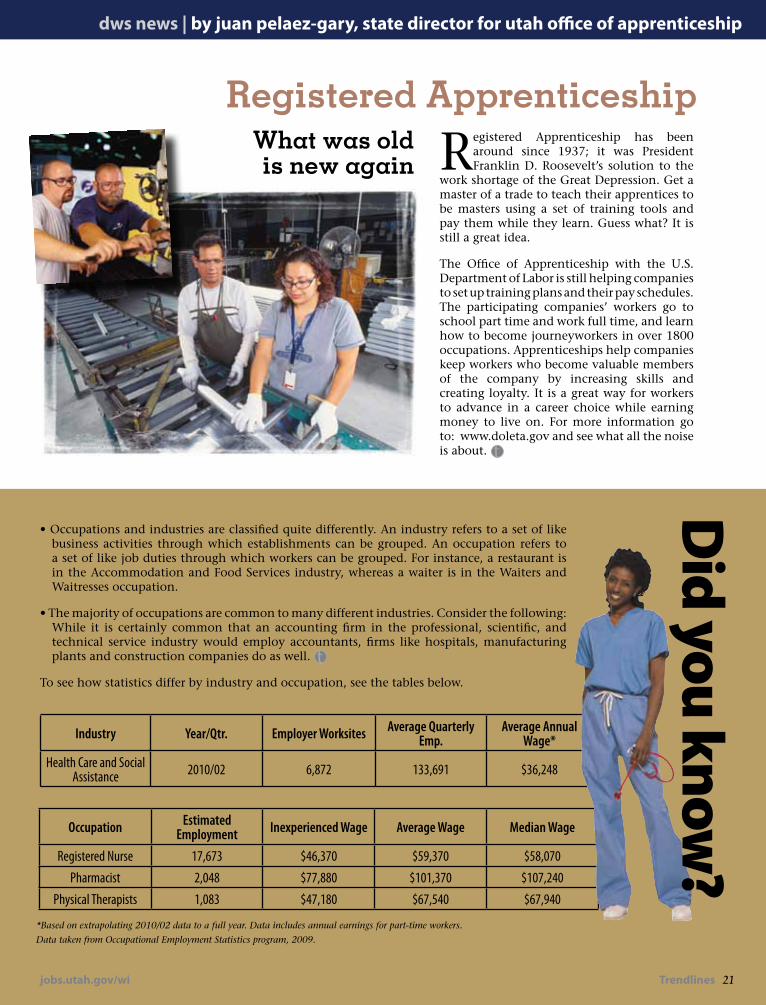
Registered Apprenticeship has been around since 1937; it was President Franklin D. Roosevelt’s solution to the
work shortage of the Great Depression. Get a master of a trade to teach their apprentices to be masters using a set of training tools and pay them while they learn. Guess what? It is still a great idea.
The Office of Apprenticeship with the U.S. Department of Labor is still helping companies to set up training plans and their pay schedules. The participating companies’ workers go to school part time and work full time, and learn how to become journeyworkers in over 1800 occupations. Apprenticeships help companies keep workers who become valuable members of the company by increasing skills and creating loyalty. It is a great way for workers to advance in a career choice while earning money to live on. For more information go to: www.doleta.gov and see what all the noise is about.
Industry Year/Qtr. Employer Worksites Average Quarterly Emp.
Average Annual Wage*
Health Care and Social Assistance 2010/02 6,872 133,691 $36,248
What was old is new again
Registered Apprenticeship
*Based on extrapolating 2010/02 data to a full year. Data includes annual earnings for part-time workers. Data taken from Occupational Employment Statistics program, 2009.
Occupation Estimated Employment Inexperienced Wage Average Wage Median Wage
Registered Nurse 17,673 $46,370 $59,370 $58,070Pharmacist 2,048 $77,880 $101,370 $107,240
Physical Therapists 1,083 $47,180 $67,540 $67,940
jobs.utah.gov/wi
Did you know
?

22 January/February 2011
occupations | by linda marling church, research analyst
Medical Imaging Technology:Peering Inside the Human Body
jobs.utah.gov/wi Trendlines 23
Prior to the 1970s, physicians had only X-rays to rely on for examination of the interiors of their patients’ bodies. After
that time, new technology was developed that allowed physicians to access three-dimensional images of the body, its organs and tissues and provide early diagnoses for many illnesses. With the new technologies came the technologists and technicians who administer the procedures and report findings to physicians.
Cardiovascular technologists conduct tests on pulmonary function, lung capacity, cardiac (heart) and peripheral vascular (blood vessel) ailments. Treatments involve both invasive procedures (those that require incision into the body or removal of tissue) such as cardiac catheterization and angioplasty and non-invasive procedures such as echocardiography. Cardiovascular technicians take EKGs which trace electrical impulses in the heart.
Nuclear medicine technologists prepare and administer radiopharmaceuticals to patients and then monitor the characteristics and functions of tissues or organs in which the drugs localize. Nuclear medicine differs from other diagnostic imaging technologies because it determines the presence of disease on the basis of metabolic changes rather than changes in organ structure.
Radiological technologists specialize in the use of computed tomography (CT), X-rays, Computed Axial Tomography (CAT), Magnetic Resonance Imaging (MRI) or mammography. CT/CAT/MRI scans process cross-sectional
x-rays of an area which yield a three-dimensional image. Mammography uses low dose x-ray systems to produce images.
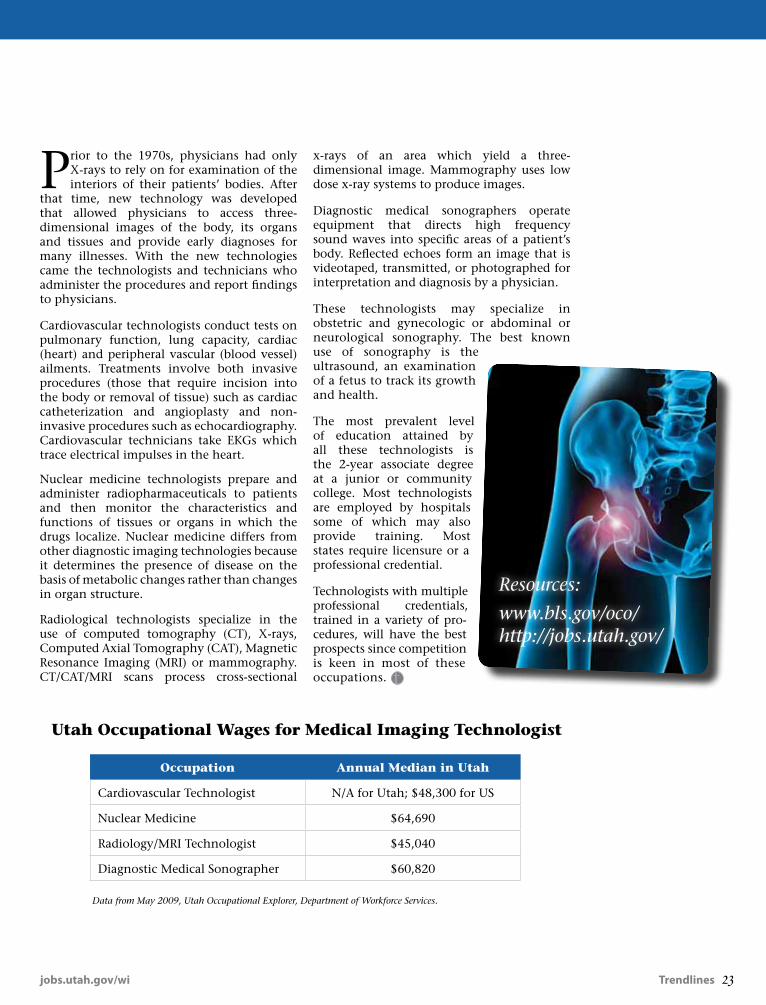
Diagnostic medical sonographers operate equipment that directs high frequency sound waves into specific areas of a patient’s body. Reflected echoes form an image that is videotaped, transmitted, or photographed for interpretation and diagnosis by a physician.
These technologists may specialize in obstetric and gynecologic or abdominal or neurological sonography. The best known use of sonography is the ultrasound, an examination of a fetus to track its growth and health.
The most prevalent level of education attained by all these technologists is the 2-year associate degree at a junior or community college. Most technologists are employed by hospitals some of which may also provide training. Most states require licensure or a professional credential.
Technologists with multiple professional credentials, trained in a variety of pro-cedures, will have the best prospects since competition is keen in most of these occupations.
Resources:
www.bls.gov/oco/ http://jobs.utah.gov/
Occupation Annual median in Utah
Cardiovascular Technologist N/A for Utah; $48,300 for US
Nuclear Medicine $64,690
Radiology/MRI Technologist $45,040
Diagnostic Medical Sonographer $60,820
Utah Occupational Wages for medical imaging technologist
Data from May 2009, Utah Occupational Explorer, Department of Workforce Services.

24 January/February 2011
the outskirts | by lecia parks langston, economist
Since the collapse of the housing-market bubble, pun-dits have engaged in their fair share of hand-wringing over the construction industry—and rightly so. Here
in Utah, we’ve lost thousands and thousands of construc-tion jobs since the housing market began its long, slow deflation. (However, you might want to keep in mind that the levels of construction employment during the height of the boom were over-inflated due to artificial demand.) But, should the hand-wringing continue? Is building ac-tivity still plummeting?
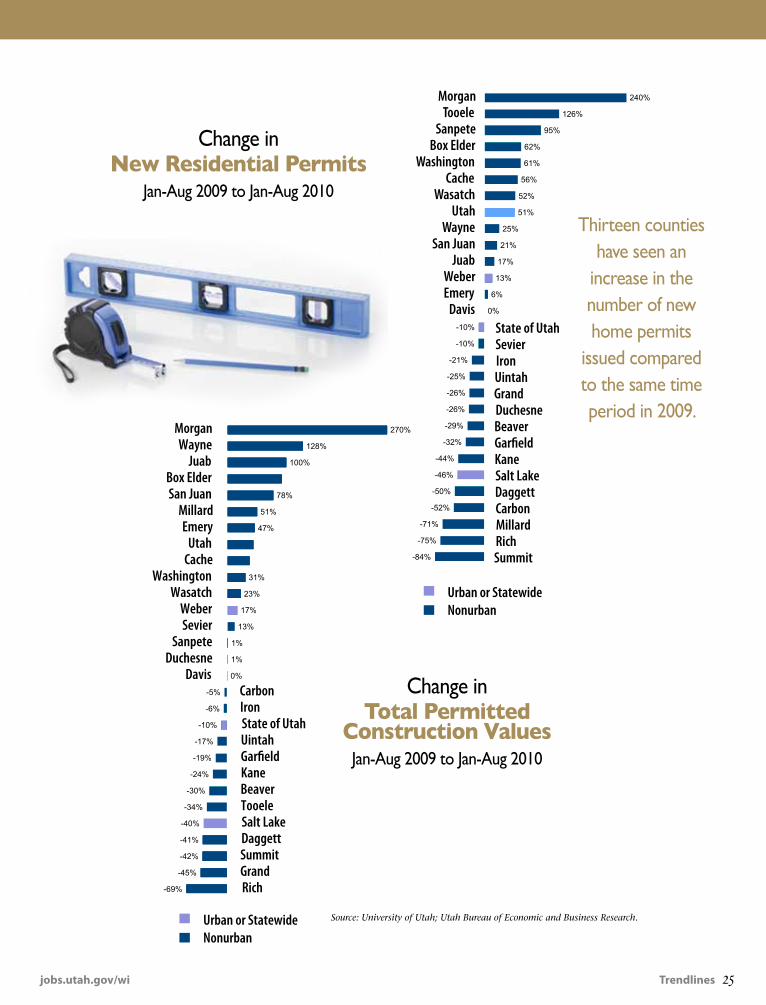
Location, Location, LocationWell, the answer to that question has a lot to do with where in Utah you live. Now keep in mind that 2008 and 2009 were indeed very dismal construction years, but. . . According to construction permit data released by the Utah Bureau of Economic and Business Research, so far this year (January to August), thirteen counties have seen an increase in the number of new home permits issued compared to the same time period in 2009. In Morgan, Tooele, and Sanpete counties, permits have basically dou-bled or tripled. Of course, that is an improvement from a low level, but improvement nonetheless. In Washing-
ton County (undoubtedly the biggest past participator in housing speculation in Utah), dwelling permits are up 61 percent. And two of the big-four urban counties—Utah and Weber—show more home permits to-date this year than last.
Who is to Blame?Statewide, the number of permits is down 10 percent. You can mostly blame Salt Lake County with its 40-percent decrease for that state of affairs. However, remember that Salt Lake County was late to the housing boom and late to the housing collapse. Its current poor showing may be just a question of timing. And, as you can see from the chart, urban or nonurban categorization is no predictor of a county’s current residential permit situation.
Residential DominatesFor most counties, residential building does seem to dom-inate their performance when it comes to the total value of permitted construction. (Remember that most public projects are not permitted.) A good ranking in residential permitting in 2010 typically translates into a good posi-tion for overall permit values.
Housing Permit Data
For more information on construction permit data, go to: http://www.bebr.utah.edu/CIDB.html
and SurprisingSepArAte And UneqUAl
jobs.utah.gov/wi Trendlines 25
Change in total permitted
Construction Values Jan-Aug 2009 to Jan-Aug 2010
Source: University of Utah; Utah Bureau of Economic and Business Research.
MorganTooele
SanpeteBox Elder
WashingtonCache
WasatchUtah
WayneSan Juan
JuabWeberEmery
DavisState of UtahSevierIronUintahGrandDuchesneBeaverGar�eldKaneSalt LakeDaggett CarbonMillardRichSummit-84%
-75%
-71%
-52%
-50%
-46%
-44%
-32%
-29%
-26%
-26%
-25%
-21%
-10%
-10%
0%
6%
13%
17%
21%
25%
51%
52%
56%
61%
62%
95%
126%
240%
Urban or StatewideNonurban
Urban or StatewideNonurban
MorganWayne
JuabBox ElderSan Juan
MillardEmery
UtahCache
WashingtonWasatch
WeberSevier
SanpeteDuchesne
DavisCarbonIronState of UtahUintahGar�eldKaneBeaverTooeleSalt LakeDaggett SummitGrandRich-69%
-45%
-42%
-41%
-40%
-34%
-30%
-24%
-19%
-17%
-10%
-6%
-5%
0%
1%
1%
13%
17%
23%
31%
47%
51%
78%
100%
128%
270%
Thirteen counties have seen an
increase in the number of new home permits
issued compared to the same time period in 2009.
Change in new residential permits
Jan-Aug 2009 to Jan-Aug 2010
26 January/February 2011
county highlight | by john mathews, economist
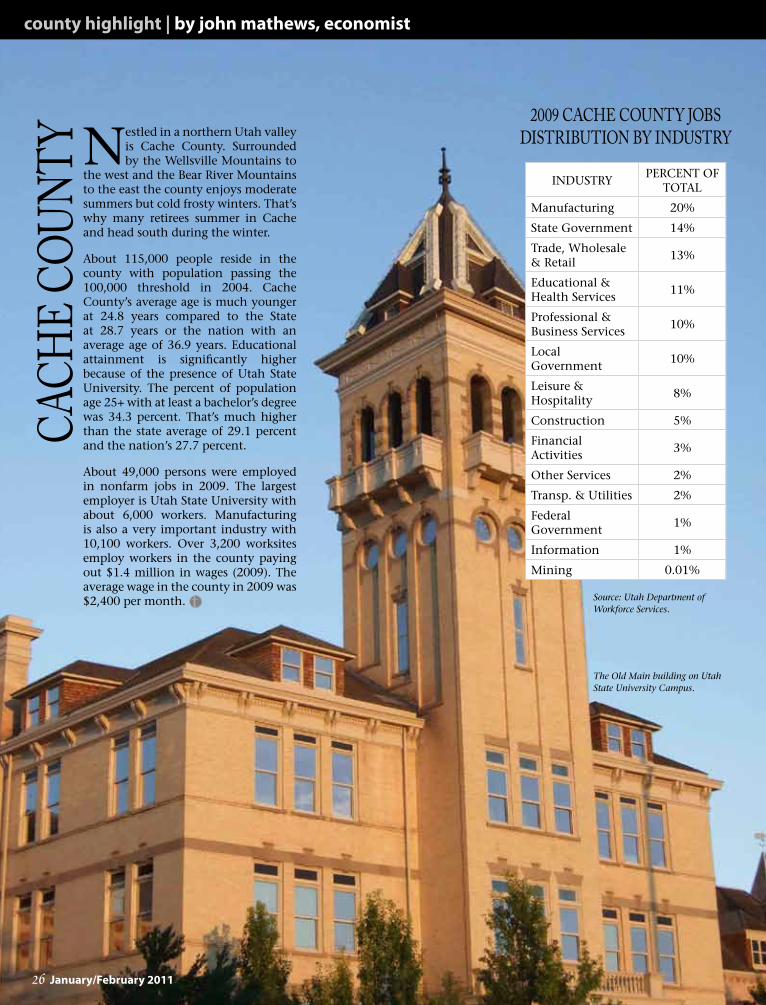
Nestled in a northern Utah valley is Cache County. Surrounded by the Wellsville Mountains to
the west and the Bear River Mountains to the east the county enjoys moderate summers but cold frosty winters. That’s why many retirees summer in Cache and head south during the winter.
About 115,000 people reside in the county with population passing the 100,000 threshold in 2004. Cache County’s average age is much younger at 24.8 years compared to the State at 28.7 years or the nation with an average age of 36.9 years. Educational attainment is significantly higher because of the presence of Utah State University. The percent of population age 25+ with at least a bachelor’s degree was 34.3 percent. That’s much higher than the state average of 29.1 percent and the nation’s 27.7 percent.
About 49,000 persons were employed in nonfarm jobs in 2009. The largest employer is Utah State University with about 6,000 workers. Manufacturing is also a very important industry with 10,100 workers. Over 3,200 worksites employ workers in the county paying out $1.4 million in wages (2009). The average wage in the county in 2009 was $2,400 per month.
CaCh
e Co
unty
2009 CaChe County Jobs Distribution by inDustry
Source: Utah Department of Workforce Services.
INDUSTRY PERCENT OF TOTAL
Manufacturing 20%
State Government 14%
Trade, Wholesale & Retail 13%
Educational & Health Services 11%
Professional & Business Services 10%
Local Government 10%
Leisure & Hospitality 8%
Construction 5%
Financial Activities 3%
Other Services 2%
Transp. & Utilities 2%
Federal Government 1%
Information 1%
Mining 0.01%
The Old Main building on Utah State University Campus.
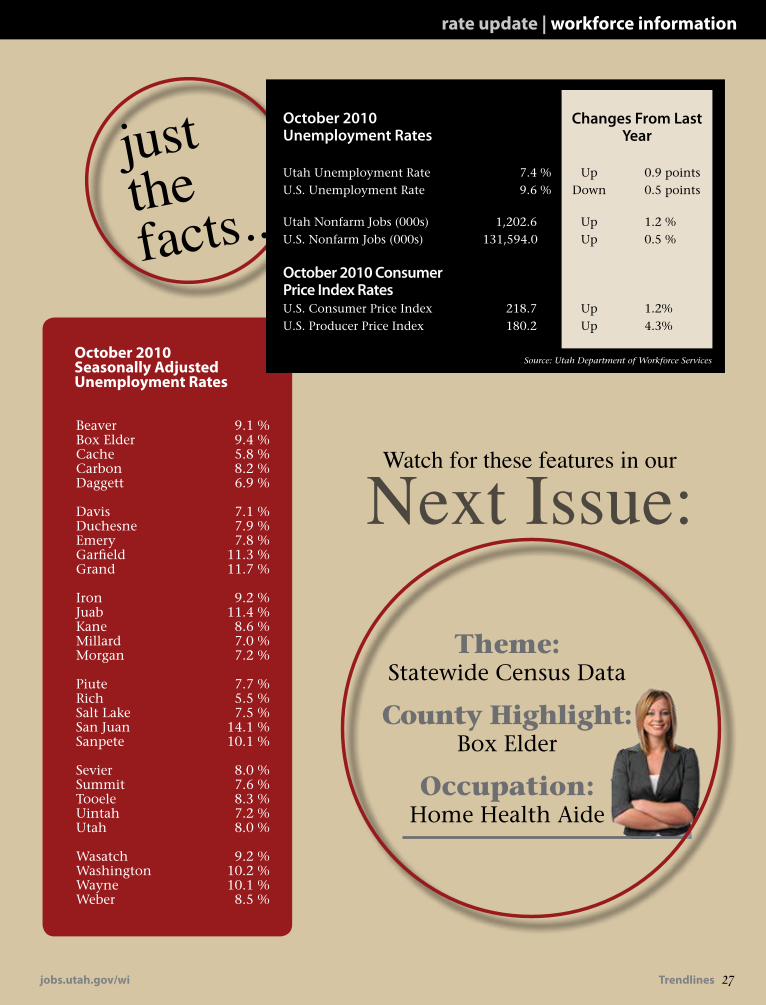
Beaver 9.1 % Box Elder 9.4 % Cache 5.8 % Carbon 8.2 % Daggett 6.9 %
Davis 7.1 % Duchesne 7.9 % Emery 7.8 % Garfield 11.3 % Grand 11.7 %
Iron 9.2 % Juab 11.4 % Kane 8.6 % Millard 7.0 % Morgan 7.2 %
Piute 7.7 % Rich 5.5 % Salt Lake 7.5 % San Juan 14.1 % Sanpete 10.1 %
Sevier 8.0 % Summit 7.6 % Tooele 8.3 % Uintah 7.2 % Utah 8.0 %
Wasatch 9.2 % Washington 10.2 % Wayne 10.1 % Weber 8.5 %
october 2010 seasonally adjusted unemployment rates
October 2010 Unemployment Rates
Changes From Last
Year
Utah Unemployment Rate 7.4 % Up 0.9 pointsU.S. Unemployment Rate 9.6 % Down 0.5 points
Utah Nonfarm Jobs (000s) 1,202.6 Up 1.2 %U.S. Nonfarm Jobs (000s) 131,594.0 Up 0.5 %
October 2010 Consumer Price Index RatesU.S. Consumer Price Index 218.7 Up 1.2%U.S. Producer Price Index 180.2 Up 4.3%
Source: Utah Department of Workforce Services
jobs.utah.gov/wi Trendlines 27
rate update | workforce information
theme: Statewide Census Data
County Highlight: Box Elder
Occupation: Home Health Aide
Next Issue:Watch for these features in our
justthe facts...

Presorted Standard US Postage
PAID SLC, UT
Permit # 4621
Utah Department of Workforce Services Workforce Research and Analysis Division 140 E. 300 S. Salt Lake City, UT 84111
Most high school freshmen in Utah plan to go
to college, but less than 20% graduate. While
most jobs (65.8%) require some post-secondary
training, only 20.8% require at least a bachelor's
degree. Apprenticeship provides an excellent
alternative to secure training and credentials.
For more information go to
http://www.utahtraining.org/.
Did you know...
http://jobs.utah.gov
Related Documents