Eidgenössisches Departement für Umwelt, Verkehr, Energie und Kommunikation UVEK Bundesamt für Energie BFE F:\SFOE_FinalReport_08July2014.docx Schlussbericht 08. Juli 2014 Using Subjective Well-Being Data for Energy Policy Analysis Energy for Well-Being

Welcome message from author
This document is posted to help you gain knowledge. Please leave a comment to let me know what you think about it! Share it to your friends and learn new things together.
Transcript
Eidgenössisches Departement für Umwelt, Verkehr, Energie und Kommunikation UVEK
Bundesamt für Energie BFE
F:\SFOE_FinalReport_08July2014.docx
Schlussbericht 08. Juli 2014
Using Subjective Well-Being Data for Energy Policy Analysis
Energy for Well-Being
2/47
F:\SFOE_FinalReport_08July2014.docx
Auftraggeber: Bundesamt für Energie BFE Sektion Marktregulierung CH-3003 Bern www.bfe.admin.ch Auftragnehmer: Ecoplan AG Monbijoustrasse 14 CH-3011 Bern www.ecoplan.ch Autoren: Prof. Dr. Heinz Welsch, University of Oldenburg, Germany, [email protected] Prof. Susana Ferreira, PhD University of Georgia, USA, [email protected] Philipp Biermann, University of Oldenburg, Germany, [email protected] Dr. Finbarr Brereton, University College Dublin, Ireland, [email protected] Dr. Mirko Moro, University of Stirling, UK, [email protected] André Müller, Ecoplan AG, Berne, Switzerland, [email protected] Dr. Tine Ningal, University College Dublin, Irleand, [email protected] BFE-Bereichsleiter Matthias Gysler / BFE-Programmleiter Anne-Katrin Faust BFE-Vertrags- und Projektnummer : SI/500802-01 Für den Inhalt und die Schlussfolgerungen ist ausschliesslich der Autor dieses Berichts verantwortlich.

3/47
F:\SFOE_FinalReport_08July2014.docx
4/47
F:\SFOE_FinalReport_08July2014.docx
Abstract
Several European countries are currently undertaking fundamental revisions of their energy policies. Many of these activities are motivated by concerns about environmental sustainability (in particular with respect to climate change), energy security (in particular in relation to import dependence), energy costs (in particular the costs and prices of electricity), and nuclear safety (in particular after the nuclear disaster at Fukushima, Japan). The project entitled “Using Subjective Well-Being Data for Energy Policy Analysis – Energy for Well-Being” aims at an assessment of such concerns in terms of citizens’ individual welfare or utility. The specific approach pursued in this project is to operationalize utility as subjective well-being (SWB) or ‘happiness’. The encompassing question is what utility people derive from energy. More specific research questions include the following: How do the costs of energy consumption affect SWB? What are citizens’ preferences for alternative configurations of the energy supply system in terms of SWB? What are the consequences for SWB of living close to energy facilities? Are there effects of the Fukushima accident on European/Swiss citizens’ SWB? The project has addressed such questions by means of SWB regressions with energy costs and parameters of the energy system as independent variables. It has used Geographic Information Systems (GIS) to combine regionally disaggregated micro data from five rounds of the European Social Survey (ESS) and the Swiss Statistics on Income and Living Conditions (SILC) with data on energy prices, the energy mix, and the location of energy facilities from the International Energy Agency (IEA) and the International Atomic Energy Agency (IAEA). It was found that citizens’ SWB is systematically and significantly related that energy prices, the energy mix, the proximity to energy facilities and that the relationship between SWB and the electricity mix changed at the time of the Fukushima nuclear accident.
Abstract
Eine Reihe europäischer Länder unternehmen gegenwärtig eine grundlegende Revision ihrer Energiepolitik. Diese Maßnahmen sind durch ein Zielsystem begründet, welches die Dimensionen der ökologischen Nachhaltigkeit (insbesondere in Bezug auf den Klimawandel), der Versorgungssicherheit (insbesondere in Bezug auf Importabhängigkeit), der Energiekosten (insbesondere die Kosten der Elektrizitätsversorgung), und der nuklearen Sicherheit (insbesondere nach dem Atomunfall im japanischen Fukushima) umfasst. Das Projekt mit dem Titel “Using Subjective Well-Being Data for Energy Policy Analysis – Energy for Well-Being” zielt auf eine Beurteilung dieser energiepolitischen Dimensionen anhand ihrer Relevanz für die individuelle Wohlfahrt der Bürger ab. Der spezifische Ansatz des Projektes besteht darin, Wohlfahrt (oder Nutzen) durch „subjektives Wohlergehen“ (SWE) oder „Glück“ zu operationalisieren. Die übergeordnete Fragestellung des Projektes lautet, welchen Nutzen die Bürger in Europa und der Schweiz den verschiedenen Dimensionen der Energieversorgung beimessen. Zu den Forschungsfragen im Einzelnen gehören die folgenden: Welche Auswirkungen haben Energiekosten auf das SWE? Welche Präferenzen, gemessen am SWE, haben die Bürger für unterschiedliche Strukturen des Energieversorgungssystems? Welche Auswirkungen auf das SWE hat die Nähe zu Energieversorgungsanlagen? Hatte der Atomunfall in Fukushima Auswirkungen auf das SWE in Europa und der Schweiz? Zur Beantwortung solcher Fragen wurden in dem Projekt ökonometrische Regressionsanalysen eingesetzt, bei denen SWE-Daten die abhängige Variable darstellen und Energiekosten sowie verschiedene Parameter des Energiesystems die unabhängigen Variablen. Dabei wurden Geografische Informationssysteme (GIS) eingesetzt, um räumlich identifizierte Personendaten aus fünf Runden des European Social Survey (ESS) und der Schweizer Statistik über Einkommen und Lebensbedingungen (SILC) mit Daten über Energiepreise, den Energiemix sowie die Standorte von Energieanlagen der Internationalen Energieagentur (IEA) und Internationalen Atomenergieagentur zu verknüpfen. Zu den wesentlichen Ergebnissen gehört, dass das SWE der Bürger systematisch und signifikant mit den Energiepreisen, dem Energiemix und der Nähe zu

5/47
F:\SFOE_FinalReport_08July2014.docx
Energieanlagen im Zusammenhang steht und dass sich der Zusammenhang zwischen dem SWE und dem Elektrizitätsmix nach dem Atomunfall in Fukushima geändert hat.
6/47
F:\SFOE_FinalReport_08July2014.docx
Executive summary
Several European countries are currently undertaking fundamental revisions of their energy policies. Switzerland is working on a new Energiestrategie 2050. Similarly, Germany has proclaimed the Ener-giewende, which entails an accelerated phase-out of nuclear power and an ambitious goal for phas-ing-in renewable energies. Contrary to this, France has announced to extend the lifetime of its nuclear power stations and the United Kingdom is planning to build new ones. These and other activities in the field of energy policy are mainly motivated by concerns about envi-ronmental sustainability (in particular with respect to climate change), energy security (in particular in relation to import dependence), energy costs (in particular the costs and prices of electricity), and nu-clear safety (in particular after the nuclear disaster at Fukushima, Japan). The project entitled “Using Subjective Well-Being Data for Energy Policy Analysis – Energy for Well-Being” aims at an assessment of such concerns in terms of citizens’ individual welfare or utility. The specific approach pursued in this project is to operationalize utility as subjective well-being (SWB) or ‘happiness’. The encompassing question is what utility people derive from energy. More specific re-search questions include the following:
– How do the costs of energy consumption affect SWB? – What are citizens’ preferences for alternative configurations of the energy supply system
in terms of SWB? – What are the consequences for SWB of living close to energy facilities? – Are there effects of the Fukushima accident on European/Swiss citizens’ SWB?
The project has addressed such questions by means of SWB regressions with energy costs and pa-rameters of the energy system as independent variables. It has used Geographic Information Systems (GIS) to combine regionally disaggregated micro data from five rounds of the European Social Survey (ESS) and the Swiss Statistics on Income and Living Conditions (SILC) with data on energy prices, the energy mix, and the location of energy facilities from the International Energy Agency (IEA) and the International Atomic Energy Agency (IAEA). Using subjective well-being data for energy policy analysis
Initially being a tool of psychological research, data on SWB are increasingly used in economic analy-sis to study the welfare significance of social and economic factors. In these studies, SWB is taken to be a proxy of ‘experienced utility’ or individual welfare. SWB data are typically elicited from self-reports. Practically all large-scale social surveys include ques-tions on SWB questions, usually specified as ‘happiness’ or ‘life satisfaction’. A typical life satisfaction question is: “All things considered, how satisfied are you with your life as a whole nowadays?” with response options on a scale from 0 = extremely dissatisfied to 10 = extremely satisfied. The properties of SWB data have been studied in a large validation literature. The overall conclusion from these studies is that SWB data are valid, reliable, and comparable and meet the standards re-quired for use in social and economic research. The production of energy is expected to affect individual welfare, operationalized as SWB, through the dimensions of costs, security, safety and pollution. Using regression analysis, this project identifies the relationship between SWB and those dimensions of the energy system. Being based on experienced utility, the identified relationships are taken to indicate ‘experienced preferences’. In contrast to stated preference methods of preference elicitation, this approach does not rely on potentially biased state-ments concerning the issues under study, but on statistical associations between SWB and those issues. SWB and the costs of energy consumption
The research question addressed in this analysis is: What is the impact of residential prices of electric-ity, oil, and gas on consumer welfare, proxied by SWB? The residential consumption of fuel and power is often considered a basic need whose satisfaction is necessary for an acceptable quality of life. This character of energy consumption as a basic need has spurred an interest in studying so-called energy
7/47
F:\SFOE_FinalReport_08July2014.docx
poverty or, likewise, fuel poverty, and the issue has recently gained increasing attention in the context of rising residential energy prices. The empirical analysis is framed within a demand theoretic framework which features a minimum (re-quired) level of energy consumption. The framework implies the prediction that the marginal disutility of energy prices is greater at higher levels of energy poverty, i.e., when the cost share of required energy consumption in income is higher. The empirical analysis studies the relationship between SWB and household energy prices using sur-vey data from the ESS for more than 100,000 individuals in 21 European countries, 2002-2011. It is found that the prices of electricity, heating oil, and gas have statistically and economically significant negative effects on SWB. Effects above average are found in individuals from the lowest income quar-tile. Effects are strongest at those times of the year when required energy costs can be expected to be highest. These results are consistent with the hypothesized relationship between energy poverty and the welfare effects of energy prices. SWB and the structure of energy supply
This analysis studies the relationship between SWB and the electricity mix in a multi-country setting. It is based on the assumption that people have preferences over attributes of the electricity supply sys-tem (security and cost of supply, safety of electricity facilities, environmental impacts) and that those attributes correlate with different configurations of the system, that is, the electricity mix. The relation-ship between SWB and the electricity mix is taken to represent preferences over the welfare-relevant attributes of the electricity supply system. The analysis uses survey data from ESS for 139,517 individuals in 25 European countries, 2002-2011, combined with the supply shares of electricity from coal, oil, gas, nuclear power, hydro power, solar & wind power, and biofuels. It is found that SWB varies systematically and significantly with differences in the electricity mix across countries and across time. It is found that neither electricity from fossil fuels (coal, oil, gas) nor from renewable sources (hydro power, solar & wind power, biofuels) are ho-mogeneous from an SWB perspective. While electricity from biofuels is less preferred than any other supply technology, electricity from gas as well as solar & wind power are preferred over nuclear pow-er. The latter applies at all levels of income, but the intensity of that preference is less when the level of electricity prices is higher. The preference for solar & wind power over nuclear power has risen drastically after the Fukushima nuclear accident. Overall, the results obtained indicate a preference of European citizens for a safe and environmentally benign electricity supply.
SWB and proximity to energy facilities
This analysis studies the relationship between SWB and proximity to nuclear power plants (NPP). This relationship is assumed to involve a trade-off between economic factors related to the proximity to NPPs (e.g. employment opportunities) and concerns about nuclear safety. The relationship between SWB and NPPs was considered both from a European wide perspective, and with respect to Switzerland as a case study. In the analysis for Switzerland we used data from the Swiss “Statistics on Income and Living Conditions” (SILC) 2009-2011, where survey respondents are characterized by their distance to the nearest NPP. Regression analysis differentiated SILC respondents into three categories of distance to the nearest NPP: Ring 1 (<40 km), Ring 2 (40-85 km) and Ring3 (>85 km). In a first specification of regressions, SWB in Ring 3 areas was found to be significantly lower than in Ring 1 and Ring 2, while there was no significant difference between the latter two. By including, in a second specification, distance-specific unemployment rates and indicators of the language region in which persons live, SWB in Ring 2 was found to be significantly greater than in Ring 1 and Ring 3, while no significant difference was found between the latter two. SWB and the Fukushima nuclear accident
This analysis is concerned with the question of whether there was a change in the relationship be-tween SWB and nuclear power after the nuclear accident in Fukushima in March 2011. This general
8/47
F:\SFOE_FinalReport_08July2014.docx
question was addressed in a European wide perspective and with respect to Switzerland as a case study. The European wide analysis used survey data for over 100,000 individuals in 23 European countries to study the relationship between SWB and (i) the supply share of nuclear power in those countries, and (ii) the proximity to NPPs. It was found that European citizens’ SWB was statistically unrelated to the share of nuclear power before the Fukushima nuclear disaster, but negatively related to the nucle-ar share after the disaster. Similarly, preliminary results suggest that proximity to NPPs had a negative impact on SWB only after the Fukushima accident. This suggests the existence of an induced change in experienced preference concerning nuclear power. The analysis for Switzerland builds upon the research on the relationship between SWB and the prox-imity to NPPs. Consistent with the European wide analysis, preliminary results suggest that the rela-tionship between SWB and proximity to NPPs changed after Fukushima. In particular, after the acci-dent SWB of citizens living more remote from NPPs increased relative to that of people living closer to NPPs. This change was more marked in German speaking regions than in Switzerland overall. The latter may reflect geographic aspects of perceived nuclear safety, such as those related to topography (the Alps) and the prevailing wind direction (westerly wind). These factors may imply a higher level of perceived safety in the southern and the western parts of the country.
9/47
F:\SFOE_FinalReport_08July2014.docx
Zusammenfassung
Eine Reihe europäischer Länder unternehmen gegenwärtig eine grundlegende Revision ihrer Ener-giepolitik. In der Schweiz wird an der Energiestrategie 2050 gearbeitet. In Deutschland wurde die so-genannte Energiewende eingeleitet, die einen beschleunigten Ausstieg aus der Kernenergie und ein ehrgeiziges Ziel für den Ausbau erneuerbarer Energien vorsieht. Im Gegensatz dazu hat Frankreich angekündigt, die Laufzeit seiner Kernkraftwerke zu verlängern, und Großbritannien plant den Ausbau der Kernenergie. Diese und weitere Maßnahmen der Energiepolitik sind durch ein Zielsystem begründet, welches die Dimensionen der ökologischen Nachhaltigkeit (insbesondere in Bezug auf den Klimawandel), der Ver-sorgungssicherheit (insbesondere in Bezug auf Importabhängigkeit), der Energiekosten (insbesondere die Kosten der Elektrizitätsversorgung), und der nuklearen Sicherheit (insbesondere nach dem Ato-munfall im japanischen Fukushima) umfasst. Das Projekt mit dem Titel “Using Subjective Well-Being Data for Energy Policy Analysis – Energy for Well-Being” zielt auf eine Beurteilung dieser energiepolitischen Dimensionen anhand ihrer Relevanz für die individuelle Wohlfahrt der Bürger ab. Der spezifische Ansatz des Projektes besteht darin, Wohl-fahrt (oder Nutzen) durch „subjektives Wohlergehen“ (SWE) oder „Glück“ zu operationalisieren. Die übergeordnete Fragestellung des Projektes lautet, welchen Nutzen die Bürger in Europa und der Schweiz den verschiedenen Dimensionen der Energieversorgung beimessen. Zu den Forschungsfra-gen im Einzelnen gehören die folgenden:
– Welche Auswirkungen haben Energiekosten auf das SWE? – Welche Präferenzen, gemessen am SWE, haben die Bürger für unterschiedliche
Strukturen des Energieversorgungssystems? – Welche Auswirkungen auf das SWE hat die Nähe zu Energieversorgungsanlagen? – Hatte der Atomunfall in Fukushima Auswirkungen auf das SWE in Europa und der
Schweiz?
Zur Beantwortung solcher Fragen wurden in dem Projekt ökonometrische Regressionsanalysen ein-gesetzt, bei denen SWE-Daten die abhängige Variable darstellen und Energiekosten sowie verschie-dene Parameter des Energiesystems die unabhängigen Variablen. Dabei wurden Geografische Infor-mationssysteme (GIS) eingesetzt, um räumlich identifizierte Personendaten aus fünf Runden des Eu-ropean Social Survey (ESS) und der Schweizer Statistik über Einkommen und Lebensbedingungen (SILC) mit Daten über Energiepreise, den Energiemix sowie die Standorte von Energieanlagen der Internationalen Energieagentur (IEA) und Internationalen Atomenergieagentur zu verknüpfen.
Daten zum subjektiven Wohlergehen und energiepoliti sche Analyse
Daten zum SWE wurden ursprünglich in der psychologischen Forschung eingesetzt und werden seit einiger Zeit in der Wirtschaftswissenschaft genutzt, um die Wohlfahrtswirkungen sozialer und ökono-mischer Faktoren zu untersuchen. In diesen Studien wird SWE als empirisches Maß für „Erfahrungs-nutzen” (manifestierten Nutzen) oder individuelle Wohlfahrt verwendet. SWE-Daten werden typischerweise durch Personenbefragungen gewonnen. Praktisch alle großen Sozialbefragungen auf nationaler und internationaler Ebene enthalten Fragen zum SWE, welches üblicherweise als „Glück“ oder als „Lebenszufriedenheit“ spezifiziert wird. Eine Lebenszufriedenheits-frage lautet typischerweise wie folgt: „Alles in allem, wie zufrieden sind Sie gegenwärtig mit Ihrem Leben?“, wobei Antwortmöglichkeiten auf einer Skala von 0 = „äußerst unzufrieden“ bis 10 = „äußerst zufrieden“ angeboten werden. Die Eigenschaften von SWE-Daten wurden in einer umfangreichen Validierungsliteratur geprüft. Diese kann dahingehend zusammengefasst werden, dass SWE-Daten valide, verlässlich und vergleichbar sind und die qualitativen Voraussetzungen für einen Einsatz in der sozial- und wirtschaftswissen-schaftlichen Forschung erfüllen. Die Erzeugung und Bereitstellung von Energie wirkt auf die individuelle Wohlfahrt, operationalisiert als SWE, über die Dimensionen durch die Dimensionen Energiekosten, Versorgungssicherheit, techni-sche Sicherheit und Umweltbelastung. Mit Hilfe von Regressionsanalysen hat dieses Projekt Zusam-menhänge zwischen dem SWE und diesen Dimensionen der Energieversorgung identifiziert. Da die
10/47
F:\SFOE_FinalReport_08July2014.docx
Untersuchung sich auf ein Maß für manifestierten Nutzen stützt, werden die gefundenen Zusammen-hänge als Ausdruck von manifestierten Präferenzen aufgefasst. Im Gegensatz zu geäußerten Präfe-renzen, basiert dieser Ansatz nicht auf Äußerungen zum Gegenstand der Untersuchung, welche ver-zerrt sein können, sondern auf statistischen Zusammenhängen zwischen dem SWE und dem jeweili-gen Untersuchungsgegenstand.
SWE und die Kosten des Energiekonsums
Der private Konsum von Brennstoffen und Elektrizität wird vielfach als Grundbedürfnis aufgefasst, dessen Erfüllung notwendig für eine angemessene Lebensqualität ist. Diese Eigenschaft von Energie-konsum als Grundbedürfnis hat in der Vergangenheit zu einem Interesse an der Frage der sogenann-ten Energiearmut geführt, welches in letzter Zeit im Zusammenhang mit steigenden Energiepreisen zugenommen hat. In der vorliegenden Untersuchung wurde der Frage nachgegangen: Welche Aus-wirkungen haben die Preise von Strom, Heizöl und Gas auf die Konsumentenwohlfahrt, gemessen durch das SWE? Die empirische Untersuchung erfolgte in einem nachfragetheoretischen Rahmen, der ein unverzicht-bares Mindestniveau an Energiekonsum beinhaltet. Dieses Modell impliziert die Aussage, dass der marginale Nutzenverlust durch höhere Energiepreise bei höherer Energiearmutsquote größer ist, d. h. wenn der Ausgabenanteil des Mindestenergiekonsums am Einkommen höher ist. Die empirische Analyse hat den Zusammenhang zwischen dem SWE und den Haushaltsenergieprei-sen anhand von Daten der ESS für mehr als 100.000 Personen in 21 europäischen Ländern im Zeit-raum 2002-2011 untersucht. Es ergab sich, dass die Preise von Strom, Heizöl und Gas statistisch und ökonomisch signifikante negative Auswirkungen auf das SWE haben. Überdurchschnittlich starke Effekte betreffen Personen aus dem untersten Einkommensviertel. Ferner sind die Effekte in jenen Jahreszeiten am stärkten, in denen die erforderlichen Mindestausgaben für Energie mutmaßlich am höchsten sind. Diese empirischen Ergebnisse entsprechen dem theoretisch erwarteten Zusammen-hang zwischen der Energiearmutsquote und den Nutzeneffekten höherer Energiepreise.
SWE und Energieversorgungsstruktur
Diese Untersuchung analysierte den Zusammenhang zwischen dem SWE und dem Elektrizitätsmix in einem Mehr-Länder-Rahmen. Die empirische Untersuchung basiert auf der Annahme, dass Individuen Präferenzen für bestimmte Attribute des Stromversorgungssystems haben (Versorgungssicherheit und Versorgungskosten, Sicherheit der Stromversorgungsanlagen, Umweltauswirkungen) und dass diese Attribute mit der Struktur des Stromversorgungssystems variieren, d.h. mit dem Elektrizitätsmix. Der Zusammenhang zwischen dem SWE und dem Elektrizitätsmix wird somit als Ausdruck von Präferen-zen bezüglich der relevanten Attribute des Stromversorgungssystems interpretiert. In der Untersuchung wurden Daten für 139.517 Personen in 25 europäischen Ländern für den Zeit-raum 2002-2011 verwendet und mit den Erzeugungsanteilen von Strom aus Kohle, Öl, Gas, Kern-energie, Wasserkraft, Solar & Windenergie und Biomasse kombiniert. Es wurde festgestellt, dass das SWE systematisch und signifikant mit Unterschieden im Strommix zwischen den Ländern und über die Zeit variiert. Es zeigte sich, dass in Hinblick auf das SWE weder Strom aus fossilen Energieträgern (Kohle, Öl, Gas) noch aus regenerativen Quellen (Wasserkraft, Solar & Windenergie, Biomasse)als homogen anzusehen sind. Vielmehr zeigte sich, dass Strom aus Biomasse weniger geschätzt wird als Strom aus jeder anderen Erzeugungsform. Ferner erwiesen sich die Stromerzeugung aus Gas sowie Solar & Windenergie als bevorzugt gegenüber der Kernenergie. Letzteres gilt für Personen aller Ein-kommensstufen; allerdings nimmt die Intensität dieser Präferenz mit höheren Strompreisen ab. Des Weiteren stieg die Präferenz für Solar & Windenergie nach dem Atomunfall in Fukushima deutlich an. Insgesamt weisen die empirischen Ergebnisse auf eine hohe Wertschätzung der Bürger für eine si-chere und saubere Stromversorgung hin. SWE und die Nähe zu Energieversorgungsanlagen
In dieser Untersuchung wurde der Zusammenhang zwischen dem SWE und der Nähe zu Kernkraft-werken (KKW) untersucht. Es wurde dabei davon ausgegangen, dass dieser Zusammenhang einen
11/47
F:\SFOE_FinalReport_08July2014.docx
Trade-off zwischen wirtschaftlichen Faktoren (bspw. Beschäftigungsmöglichkeiten im Umfeld von KKW) und Erwägungen zur nuklearen Sicherheit beinhaltet. Der Zusammenhang zwischen dem SWE und KKWs wurde sowohl in einem gesamteuropäischen Rahmen als auch speziell mit Bezug auf die Schweiz untersucht. In der gesamteuropäischen Betrach-tung wurden mit Hilfe Geografischer Informationssysteme (GIS) Befragungsdaten zum SWE aus den European Social Surveys mit Daten zu KKW-Standorten verknüpft, um Informationen über die Entfer-nung der Befragten zum nächsten KKW zu generieren. Es ergab sich, dass Personen in größerer Nähe zu KKW ein höheres SWE aufweisen. Eine Analyse der dahinter stehenden Faktoren steht noch aus. In der Untersuchung für die Schweiz wurden Daten der “Statistik über Einkommen und Lebensbedin-gungen“ (SILC) für die Jahre 2009-2011 verwendet, wobei die Befragten durch ihre Nähe zum jeweils nächsten KKW charakterisiert waren. Bei der Wurden die Befragten in drei Entfernungskategorien eingeteilt: Ring 1 (<40 km), Ring 2 (40-85 km) und Ring3 (>85 km). Anhand einer ersten Spezifikation der Regressionsgleichung ergab sich, dass das SWE in Ring 3 signifikant niedriger war als in Ring 1 und Ring 2, wohingegen sich die letzteren nicht signifikant unterscheiden. In einer zweiten Spezifikati-on wurden Arbeitslosenraten, differenziert nach der Entfernung zum nächsten KKW, sowie die Sprachregion berücksichtigt. Dabei ergab sich dass das SWE in Ring 2 signifikant höher als in Ring 1 und Ring 3 ist, wohingegen sich die letzteren nicht signifikant unterscheiden. Diese Ergebnisse legen die Vermutung nahe, dass das niedrige SWE-Niveau in Ring 3 im Vergleich zu Ring 1 laut erster Spezifikation auf ungünstigeren wirtschaftlichen Bedingungen beruht, da die Ar-beitslosenraten in Ring 3 erheblich höher sind. Filtert man diesen Faktor heraus, ist das SWE in der äußersten Entfernungskategorie (Ring 3) so hoch wie in der innersten Kategorie (Ring 1). Dieses Er-gebnis stützt die Idee eines Trade-off zwischen wirtschaftlichen Faktoren und wahrgenommener nuk-learer Sicherheit und unterstreicht darüber hinaus die Bedeutung der Berücksichtigung potentieller dritter Faktoren bei der Regressionsanalyse. SWE und der Atomunfall in Fukushima
Diese Untersuchung beschäftigt sich mit der Frage, ob es nach dem Atomunfall in Fukushima zu einer Änderung im Zusammenhang zwischen dem SWE und der Nutzung der Kernenergie kam. Diese Fra-ge wurde sowohl auf gesamteuropäischer Ebene als auch speziell für die Schweiz untersucht Bei der gesamteuropäischen Analyse wurden Umfragedaten für mehr als 100,000 Personen in 23 europäischen Ländern verwendet, um den Zusammenhang zwischen dem SWE und (i) dem Erzeu-gungsanteil der Kernenergie in diesen Ländern sowie (ii) der Nähe zu KKWs zu untersuchen. Es ergab sich, dass auf europäischer Ebene das SWE vor dem AtomunfaIl keinen statistisch signifikanten Zusammenhang mit dem Kernenergieanteil aufwies, nach dem Unfall hingegen einen signifikant nega-tiven Zusammenhang. Ferner zeigen erste Ergebnisse, dass die Nähe zu KKWs nur nach dem Unfall in Fukushima einen negative Effekt auf das SWE hatte. Dies deutet auf eine induzierte Änderung der manifestierten Präferenz für Kernenergie hin. Die diesbezügliche Untersuchung für die Schweiz baut auf der Analyse des Zusammenhangs zwi-schen dem SWE und der Nähe zu KKW auf. Ähnlich wie die europaweite Untersuchung zeigen vor-läufige Ergebnisse eine Änderung im Zusammenhang zwischen dem SWE und der Nähe zu KKW nach Fukushima. Insbesondere stieg das relative SWE von Personen in größerer Entfernung zu KKW im Vergleich mit Personen, die näher an KKW leben. Diese Änderung war stärker im deutschsprachi-gen Teil der Schweiz als in der Schweiz insgesamt. Letzteres könnte mit geografischen Gesichtspunk-ten bei der subjektiven Wahrnehmung nuklearer Sicherheit im Zusammenhang stehen. Insbesondere könnten topographischen Gegebenheiten (die Alpen) und die vorherrschende Windrichtung (West-wind) zu einem höheren Sicherheitsgefühl im Tessin bzw. der Westschweiz führen.
12/47
F:\SFOE_FinalReport_08July2014.docx
1 Introduction
Several European countries are currently undertaking fundamental revisions of their energy policies. Switzerland is working on a new Energiestrategie 2050. Similarly, Germany has proclaimed the Ener-giewende, which entails an accelerated phase-out of nuclear power and an ambitious goal for phas-ing-in renewable energies. Contrary to this, France has announced to extend the lifetime of its nuclear power stations and the United Kingdom is planning to build new ones. These and other activities in the field of energy policy are mainly motivated by concerns related to environmental sustainability (in particular with respect to climate change), energy security (in particular in relation to import dependence), energy costs (in particular the costs and prices of electricity), and nuclear safety (in particular after the nuclear disaster at Fukushima, Japan). The project entitled “Using Subjective Well-Being Data for Energy Policy Analysis – Energy for Well-Being” aims at an assessment of such concerns in terms of citizens’ individual welfare or utility. The specific approach pursued in this project is to operationalize utility as subjective well-being (SWB) or ‘happiness’. The encompassing question is what utility people derive from energy. More specific re-search questions - include the following:
– How do the costs of energy consumption affect SWB?
– What are citizens’ preferences for alternative configurations of the energy supply system in terms of SWB?
– What are the consequences for SWB of living close to energy facilities?
– Are there effects of the Fukushima accident on European/Swiss citizens’ SWB?
The project has addressed such questions by means of SWB regressions with energy costs and pa-rameters of the energy system as independent variables. It has used Geographic Information Systems (GIS) to combine regionally disaggregated micro data from five rounds of the European Social Survey (ESS) and the Swiss Statistics on Income and Living Conditions (SILC) with data on energy prices, the energy mix, and the location of energy facilities from the International Energy Agency (IEA) and the International Atomic Energy Agency (IAEA). This report
Section 2 presents an introduction of the use of SWB for energy policy analysis. The rest of the report is structured around the specific research questions. Section 3 (work package 2): SWB and the cost of energy consumption. Section 4 (work package 3): SWB and the structure of energy supply. Section 5 (work package 1): Measurement of proximity to energy facilities: the case of nuclear power plants. Section 6 (work package 4): SWB and the location of energy facilities: the case of nuclear power plants. Section 7 (work package 5): SWB and the Fukushima accident. Section 8 (work package 6): Dissemination.
13/47
F:\SFOE_FinalReport_08July2014.docx
2 Using subjective well-being data for energy polic y analysis ∗
Initially being a tool of psychological research, data on SWB are increasingly used in economic analy-sis to study the welfare significance of economic factors such as income, employment status, econom-ic growth, the rates of unemployment and inflation etc. In these studies, SWB is taken to be a proxy of ‘experienced utility’ or individual welfare. SWB data have been used, in particular, in environmental and resource economics, where the number of pertinent articles indexed in EconLit quintupled from 2002-2005 to 2010-2013. The focus of these studies is the contribution of environmental amenities to SWB. By yielding estimates of the marginal rate of substitution of income for amenities, SWB regressions have been used as a novel tool for non-market valuation. SWB data are typically elicited from self-reports. Practically all large-scale social surveys (such as the World Values Survey, the Eurobarometer, the European Social Survey, the German Socio-Economic Panel, the Swiss Statistics on Income and Living Conditions and the British Household Panel Study) include SWB questions. SWB is usually specified as ‘happiness’ or ‘life satisfaction’, where the former refers to the affective and the latter to the cognitive and evaluative aspect of SWB. A typical life satis-faction question, asked in the ESS, is: “All things considered, how satisfied are you with your life as a whole nowadays?” (with response options on an 11-point scale where 0 = extremely dissatisfied and 10 = extremely satisfied). Assessment of SWB data
A large validation literature has studied the properties of SWB data (see Diener et al. 1999, Frey and Stutzer 2002 for reviews). In these studies the following has been found:
– Self-reported SWB is associated with health status (e.g. hypertension) and objective circumstances and events.
– Self-reported SWB is correlated with physiological responses and electrical readings in the brain.
– SWB scores are correlated with rates of suicide.
– Different measures of self-reported well-being exhibit high correlations with one another.
– Self-reported SWB is correlated with assessments of persons’ SWB by friends, family, and spouse.
From this validation research it is concluded that SWB data are valid, reliable and (at least ordinally) comparable.
Use of SWB in this project
The production of energy has impacts on individual welfare beyond the satisfaction of demands for heating, cooling, cooking and the operation of appliances. Additional welfare-relevant dimensions of energy supply are costs, security, safety and pollution. Using regression analysis, this project identifies the relationship between SWB and those dimensions of the energy system. Taking those relationships as indicators of preferences, SWB regressions serve as a tool for preference elicitation which can inform policy-making. By not relying on statements of preference but on statistical analysis of how energy impacts on individual welfare, the SWB approach represents an alternative source of infor-mation, in addition to more traditional approaches based on attitudes and opinions.
∗ The discussion in this section is partially based on the working paper “Environment, Well-Being, and Ex-
perienced Preference” (Heinz Welsch & Susana Ferreira 2014) produced as a deliverable for this project, and
publicly available at http://ideas.repec.org/p/old/dpaper/367.html. This paper has been invited for publication in
the International Review of Environmental and Resource Economics where it is currently under review.
14/47
F:\SFOE_FinalReport_08July2014.docx
3 SWB and the costs of energy consumption ∗
The residential consumption of fuel and power contributes to well-being through heating and cooling, lighting, cooking, and the operation of appliances. Fuel and power consumption are often considered a basic need whose satisfaction is necessary for an acceptable quality of life. This character of energy consumption as a basic need has spurred an interest in studying so-called energy poverty or, likewise, fuel poverty (Boardman 1991). Energy poverty has gained increasing attention in the context of rising residential energy prices (e.g., Hills 2012, Moore 2012, Thomson and Snell 2013). The research question addressed in this analysis is: What is the impact of residential energy prices on consumer welfare, proxied by SWB? Conceptual Framework: Energy Poverty, Energy Prices , and Welfare
Measures of energy poverty typically rely on the energy poverty ratio (EPR). EPR is the ratio between the costs of “required” energy consumption R and income Y:
Definitions of energy poverty usually relate the EPR to some threshold level (poverty line). The welfare significance of energy poverty can be illustrated using a simple framework, in which the individual derives utility from the consumption of energy E, non-energy N (assumed to be the nu-meraire), and where a certain minimum (subsistence) level R of energy has to be consumed. Denoting by p and Y the energy price and income, respectively, the individual solves the following optimization problem:
Max E, N u = U(E-R,N) s.t. p*E + N = Y
This implies the indirect utility function u = V(p,Y,R). With some additional assumptions on the (direct) utility function, the following result can be estab-lished: Proposition: The marginal disutility )/( pV ∂−∂ from a rise in the energy price increases in the EPR. The empirical task in this research is to estimate the marginal disutility of energy prices using SWB as a proxy for utility. Based on the proposition above, the hypothesis is that the SWB effect of energy prices is greater at greater EPR, that is, at higher p and R and at lower Y.
Empirical Strategy and Data
We consider the following estimating equation:
icttcctict timecountryeenergypricLS εγ +++++= ctict macroβ'microα'.
In this formulation, LSict denotes life satisfaction of individual i in country c at time t, and time t refers to the quarters 2002.I to 2011.IV. The vector micro comprises the usual individual-level correlates of SWB (in particular gender, age, household size and income, marital status and employment status), whereas the vector macro comprises controls at the country level (in particular per capita income and the rates of unemployment and inflation). The estimating equation controls for unobserved time-invariant country-specific factors through country-fixed effects and for unobserved time-specific factors
∗ The discussion in this section is based on H. Welsch, P. Biermann (2014) “Energy Prices, Energy Poverty,
and Subjective Well-Being” mimeo, produced as a deliverable for this project within work package 2.
Y
pREPR =
15/47
F:\SFOE_FinalReport_08July2014.docx
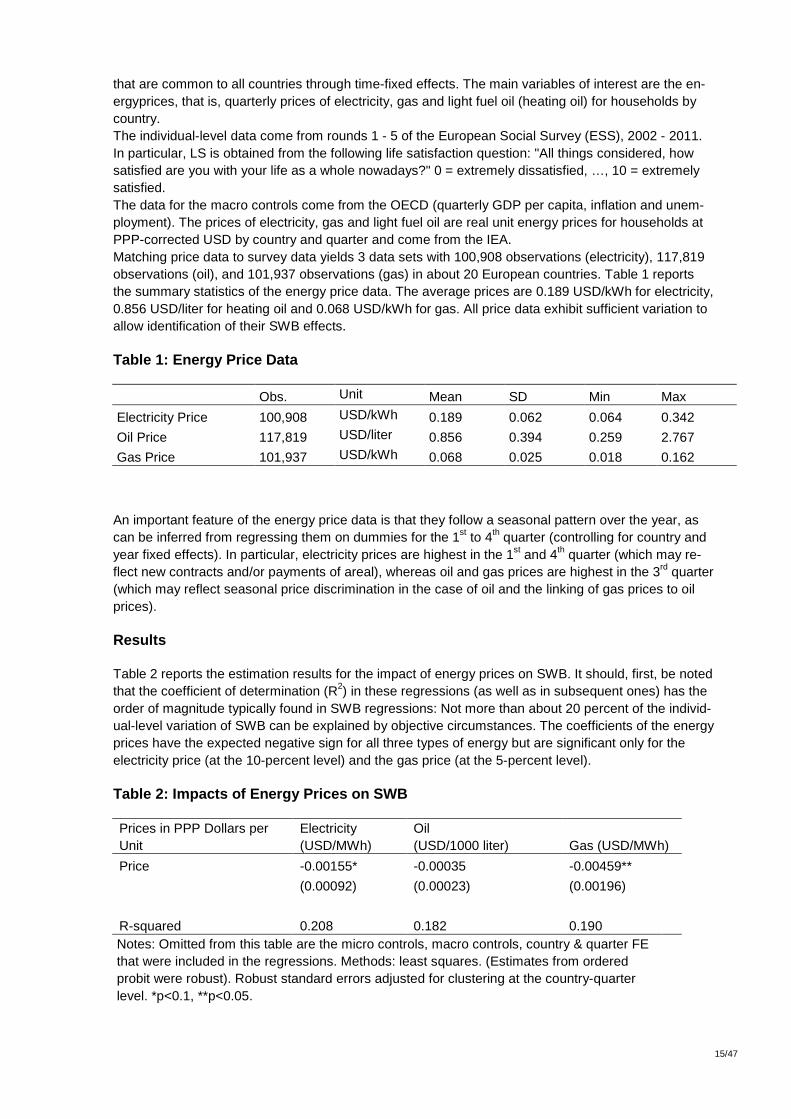
that are common to all countries through time-fixed effects. The main variables of interest are the en-ergyprices, that is, quarterly prices of electricity, gas and light fuel oil (heating oil) for households by country. The individual-level data come from rounds 1 - 5 of the European Social Survey (ESS), 2002 - 2011. In particular, LS is obtained from the following life satisfaction question: "All things considered, how satisfied are you with your life as a whole nowadays?" 0 = extremely dissatisfied, …, 10 = extremely satisfied. The data for the macro controls come from the OECD (quarterly GDP per capita, inflation and unem-ployment). The prices of electricity, gas and light fuel oil are real unit energy prices for households at PPP-corrected USD by country and quarter and come from the IEA. Matching price data to survey data yields 3 data sets with 100,908 observations (electricity), 117,819 observations (oil), and 101,937 observations (gas) in about 20 European countries. Table 1 reports the summary statistics of the energy price data. The average prices are 0.189 USD/kWh for electricity, 0.856 USD/liter for heating oil and 0.068 USD/kWh for gas. All price data exhibit sufficient variation to allow identification of their SWB effects. Table 1: Energy Price Data
Obs. Unit Mean SD Min Max
Electricity Price 100,908 USD/kWh 0.189 0.062 0.064 0.342
Oil Price 117,819 USD/liter 0.856 0.394 0.259 2.767
Gas Price 101,937 USD/kWh 0.068 0.025 0.018 0.162
An important feature of the energy price data is that they follow a seasonal pattern over the year, as can be inferred from regressing them on dummies for the 1st to 4th quarter (controlling for country and year fixed effects). In particular, electricity prices are highest in the 1st and 4th quarter (which may re-flect new contracts and/or payments of areal), whereas oil and gas prices are highest in the 3rd quarter (which may reflect seasonal price discrimination in the case of oil and the linking of gas prices to oil prices). Results
Table 2 reports the estimation results for the impact of energy prices on SWB. It should, first, be noted that the coefficient of determination (R2) in these regressions (as well as in subsequent ones) has the order of magnitude typically found in SWB regressions: Not more than about 20 percent of the individ-ual-level variation of SWB can be explained by objective circumstances. The coefficients of the energy prices have the expected negative sign for all three types of energy but are significant only for the electricity price (at the 10-percent level) and the gas price (at the 5-percent level). Table 2: Impacts of Energy Prices on SWB
Prices in PPP Dollars per Unit
Electricity (USD/MWh)
Oil (USD/1000 liter) Gas (USD/MWh)
Price -0.00155* -0.00035 -0.00459**
(0.00092) (0.00023) (0.00196)
R-squared 0.208 0.182 0.190 Notes: Omitted from this table are the micro controls, macro controls, country & quarter FE that were included in the regressions. Methods: least squares. (Estimates from ordered probit were robust). Robust standard errors adjusted for clustering at the country-quarter level. *p<0.1, **p<0.05.
16/47
F:\SFOE_FinalReport_08July2014.docx
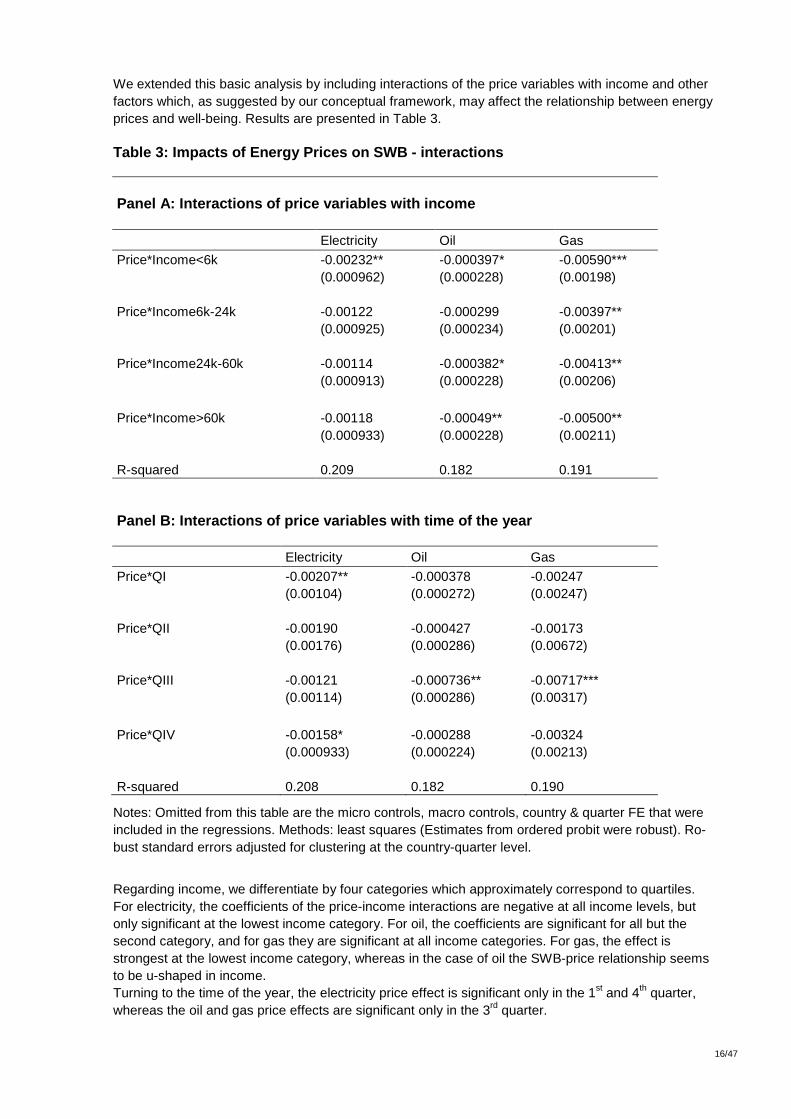
We extended this basic analysis by including interactions of the price variables with income and other factors which, as suggested by our conceptual framework, may affect the relationship between energy prices and well-being. Results are presented in Table 3. Table 3: Impacts of Energy Prices on SWB - interact ions
Panel A: Interactions of price variables with incom e
Electricity Oil Gas
Price*Income<6k
-0.00232** (0.000962)
-0.000397* (0.000228)
-0.00590*** (0.00198)
Price*Income6k-24k
-0.00122 (0.000925)
-0.000299 (0.000234)
-0.00397** (0.00201)
Price*Income24k-60k
-0.00114 (0.000913)
-0.000382* (0.000228)
-0.00413** (0.00206)
Price*Income>60k
-0.00118 (0.000933)
-0.00049** (0.000228)
-0.00500** (0.00211)
R-squared
0.209
0.182
0.191
Panel B: Interactions of price variables with time of the year
Electricity Oil Gas
Price*QI
-0.00207** (0.00104)
-0.000378 (0.000272)
-0.00247 (0.00247)
Price*QII
-0.00190 (0.00176)
-0.000427 (0.000286)
-0.00173 (0.00672)
Price*QIII
-0.00121 (0.00114)
-0.000736** (0.000286)
-0.00717*** (0.00317)
Price*QIV
-0.00158* (0.000933)
-0.000288 (0.000224)
-0.00324 (0.00213)
R-squared
0.208
0.182
0.190
Notes: Omitted from this table are the micro controls, macro controls, country & quarter FE that were included in the regressions. Methods: least squares (Estimates from ordered probit were robust). Ro-bust standard errors adjusted for clustering at the country-quarter level.
Regarding income, we differentiate by four categories which approximately correspond to quartiles. For electricity, the coefficients of the price-income interactions are negative at all income levels, but only significant at the lowest income category. For oil, the coefficients are significant for all but the second category, and for gas they are significant at all income categories. For gas, the effect is strongest at the lowest income category, whereas in the case of oil the SWB-price relationship seems to be u-shaped in income. Turning to the time of the year, the electricity price effect is significant only in the 1st and 4th quarter, whereas the oil and gas price effects are significant only in the 3rd quarter.
17/47
F:\SFOE_FinalReport_08July2014.docx
Discussion
Energy prices affect SWB negatively and significantly. Differentiating by income and season leads to results broadly consistent with expectation: Effects are significant and strong at low income and at times when energy requirements and/or bills are high. In particular, the electricity price effect is strong in the 1st and 4th quarter, when bills may be high because of contract changes, payments of areas or (if applicable) heating requirements. The oil and gas price effect is strong before the start of the heating period, when tanks need to be filled and prices are high. Overall, consistent with our conceptual framework, effects are stronger when the energy poverty ratio p*R/Y may be expected to be higher. Quantitatively, a 1-standard-deviation change in the electricity price is associated with a change in the 11-point life satisfaction scale by 0.096 for the average person and 0.144 for a person from the lowest income group. For a 1-standard-deviation change in the gas price, the effects are 0.119 (average) and 0.153 (low income). For the oil price the effect is 0.157 at low income and insignificant for the average person. The effects thus correspond to 10-15 percent of one life-satisfaction category.
18/47
F:\SFOE_FinalReport_08July2014.docx
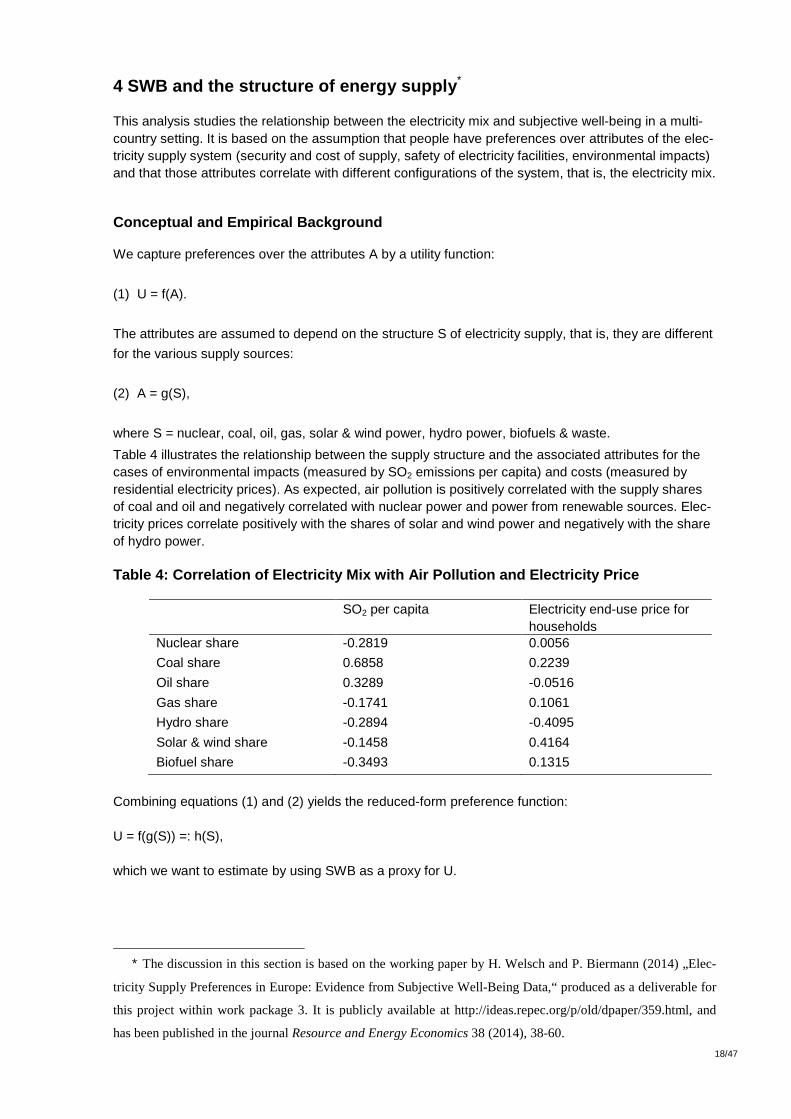
4 SWB and the structure of energy supply ∗
This analysis studies the relationship between the electricity mix and subjective well-being in a multi-country setting. It is based on the assumption that people have preferences over attributes of the elec-tricity supply system (security and cost of supply, safety of electricity facilities, environmental impacts) and that those attributes correlate with different configurations of the system, that is, the electricity mix.
Conceptual and Empirical Background
We capture preferences over the attributes A by a utility function:
(1) U = f(A).
The attributes are assumed to depend on the structure S of electricity supply, that is, they are different
for the various supply sources:
(2) A = g(S),
where S = nuclear, coal, oil, gas, solar & wind power, hydro power, biofuels & waste.
Table 4 illustrates the relationship between the supply structure and the associated attributes for the cases of environmental impacts (measured by SO2 emissions per capita) and costs (measured by residential electricity prices). As expected, air pollution is positively correlated with the supply shares of coal and oil and negatively correlated with nuclear power and power from renewable sources. Elec-tricity prices correlate positively with the shares of solar and wind power and negatively with the share of hydro power. Table 4: Correlation of Electricity Mix with Air Po llution and Electricity Price
SO2 per capita Electricity end-use price for households
Nuclear share -0.2819 0.0056
Coal share 0.6858 0.2239
Oil share 0.3289 -0.0516
Gas share -0.1741 0.1061
Hydro share -0.2894 -0.4095
Solar & wind share -0.1458 0.4164
Biofuel share -0.3493 0.1315
Combining equations (1) and (2) yields the reduced-form preference function: U = f(g(S)) =: h(S), which we want to estimate by using SWB as a proxy for U.
∗ The discussion in this section is based on the working paper by H. Welsch and P. Biermann (2014) „Elec-
tricity Supply Preferences in Europe: Evidence from Subjective Well-Being Data,“ produced as a deliverable for
this project within work package 3. It is publicly available at http://ideas.repec.org/p/old/dpaper/359.html, and
has been published in the journal Resource and Energy Economics 38 (2014), 38-60.
19/47
F:\SFOE_FinalReport_08July2014.docx
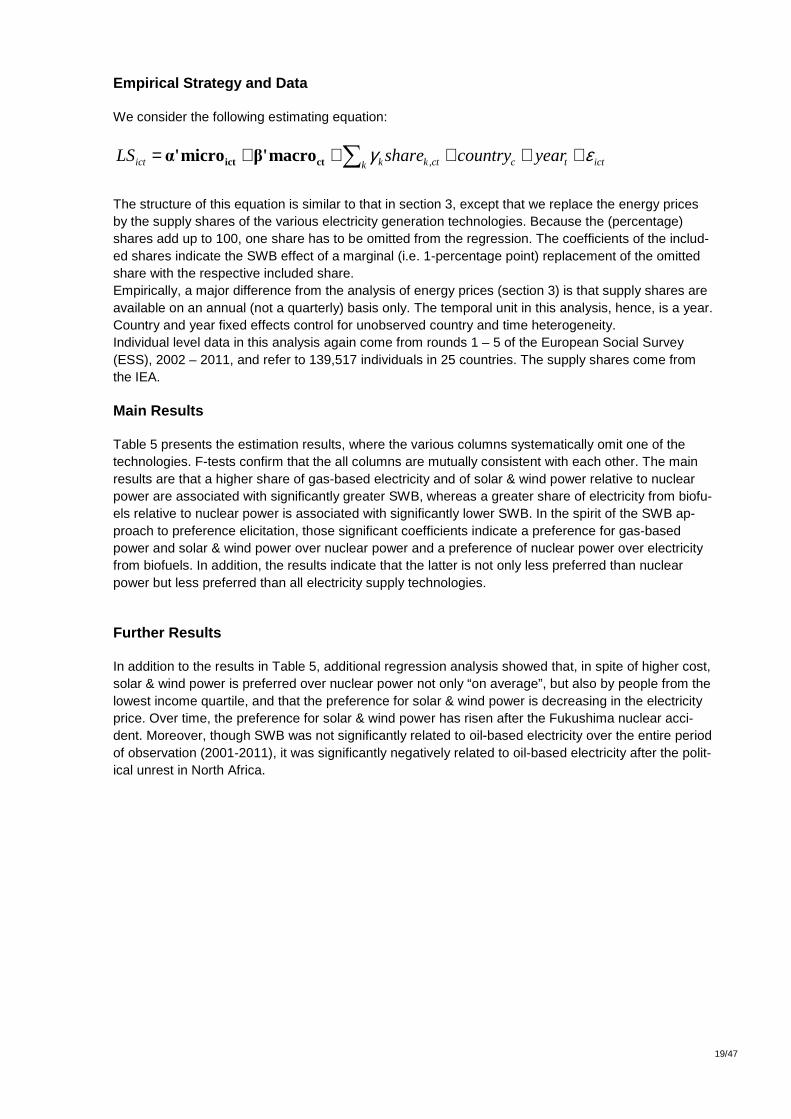
Empirical Strategy and Data
We consider the following estimating equation:
icttcctkk kict yearcountryshareLS εγ +++++= ∑ ,ctict macroβ'microα'
The structure of this equation is similar to that in section 3, except that we replace the energy prices by the supply shares of the various electricity generation technologies. Because the (percentage) shares add up to 100, one share has to be omitted from the regression. The coefficients of the includ-ed shares indicate the SWB effect of a marginal (i.e. 1-percentage point) replacement of the omitted share with the respective included share. Empirically, a major difference from the analysis of energy prices (section 3) is that supply shares are available on an annual (not a quarterly) basis only. The temporal unit in this analysis, hence, is a year. Country and year fixed effects control for unobserved country and time heterogeneity. Individual level data in this analysis again come from rounds 1 – 5 of the European Social Survey (ESS), 2002 – 2011, and refer to 139,517 individuals in 25 countries. The supply shares come from the IEA. Main Results
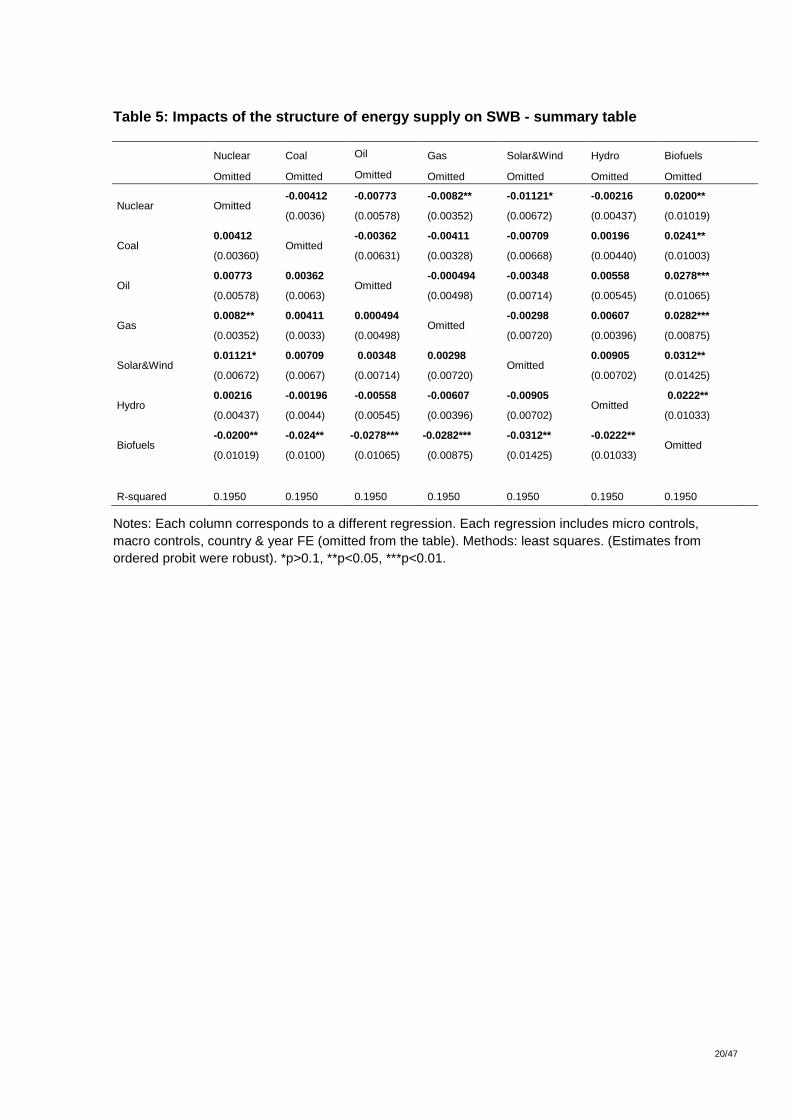
Table 5 presents the estimation results, where the various columns systematically omit one of the technologies. F-tests confirm that the all columns are mutually consistent with each other. The main results are that a higher share of gas-based electricity and of solar & wind power relative to nuclear power are associated with significantly greater SWB, whereas a greater share of electricity from biofu-els relative to nuclear power is associated with significantly lower SWB. In the spirit of the SWB ap-proach to preference elicitation, those significant coefficients indicate a preference for gas-based power and solar & wind power over nuclear power and a preference of nuclear power over electricity from biofuels. In addition, the results indicate that the latter is not only less preferred than nuclear power but less preferred than all electricity supply technologies.
Further Results
In addition to the results in Table 5, additional regression analysis showed that, in spite of higher cost, solar & wind power is preferred over nuclear power not only “on average”, but also by people from the lowest income quartile, and that the preference for solar & wind power is decreasing in the electricity price. Over time, the preference for solar & wind power has risen after the Fukushima nuclear acci-dent. Moreover, though SWB was not significantly related to oil-based electricity over the entire period of observation (2001-2011), it was significantly negatively related to oil-based electricity after the polit-ical unrest in North Africa.
20/47
F:\SFOE_FinalReport_08July2014.docx
Table 5: Impacts of the structure of energy supply on SWB - summary table
Nuclear Coal Oil Gas Solar&Wind Hydro Biofuels
Omitted Omitted Omitted Omitted Omitted Omitted Omitted
Nuclear Omitted -0.00412 -0.00773 -0.0082** -0.01121* -0.00216 0.0200**
(0.0036) (0.00578) (0.00352) (0.00672) (0.00437) (0.01019)
Coal 0.00412
Omitted -0.00362 -0.00411 -0.00709 0.00196 0.0241**
(0.00360) (0.00631) (0.00328) (0.00668) (0.00440) (0.01003)
Oil 0.00773 0.00362
Omitted -0.000494 -0.00348 0.00558 0.0278***
(0.00578) (0.0063) (0.00498) (0.00714) (0.00545) (0.01065)
Gas 0.0082** 0.00411 0.000494
Omitted -0.00298 0.00607 0.0282***
(0.00352) (0.0033) (0.00498) (0.00720) (0.00396) (0.00875)
Solar&Wind 0.01121* 0.00709 0.00348 0.00298
Omitted 0.00905 0.0312**
(0.00672) (0.0067) (0.00714) (0.00720) (0.00702) (0.01425)
Hydro 0.00216 -0.00196 -0.00558 -0.00607 -0.00905
Omitted 0.0222**
(0.00437) (0.0044) (0.00545) (0.00396) (0.00702) (0.01033)
Biofuels -0.0200** -0.024** -0.0278*** -0.0282*** -0.0312** -0.0222**
Omitted
(0.01019) (0.0100) (0.01065) (0.00875) (0.01425) (0.01033)
R-squared 0.1950 0.1950 0.1950 0.1950 0.1950 0.1950 0.1950
Notes: Each column corresponds to a different regression. Each regression includes micro controls, macro controls, country & year FE (omitted from the table). Methods: least squares. (Estimates from ordered probit were robust). *p>0.1, **p<0.05, ***p<0.01.
21/47
F:\SFOE_FinalReport_08July2014.docx
5 Measurement of proximity to energy facilities: th e case of nuclear power plants ∗
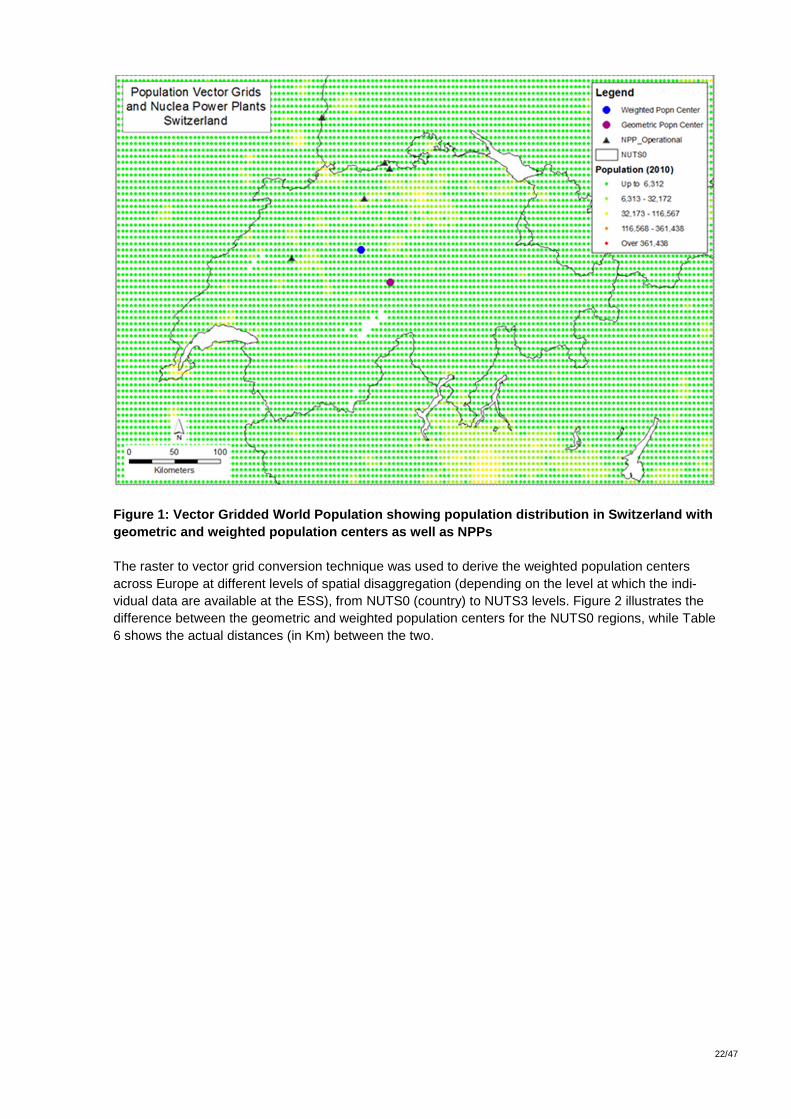
The creation of a geo-referenced nuclear power plant (NPP) database for Europe uses two types of information. One is the location of ESS respondents in terms of the NUTS regions where they live. This information is available at different levels of disaggregation (NUTS0, NUTS1, NUTS2, NUTS3), and the available level of disaggregation differs from country to country. The other type of information is the location of NPPs in terms of their geographic coordinates, which required the creation of a GIS NNP database to facilitate geospatial processing and computations. In addition, information is availa-ble on the distribution of the population within NUTS regions. To assess the proximity of population centers to NPPs, a first step involves the spatial assignment of respondents to the center of their NUTS region using GIS analysis. Several definitions of the center are available. The analysis in this project is based on (i) the geographic center (centroid) at the re-spective level of disaggregation and (ii) the weighted population center. The idea of this work is to represent the distance of the NPP to the ‘spatially representative individual’, i.e. the individual located at the center. The distance will depend on the chosen definition of the center. Determining the population centers
The default approach in determining the population center of a NUTS region is the geomet-ric/geographic centre. The geometric center places a point in the geographic centre of the NUTS re-gion implicitly assuming that the population of a NUTS region is equally distributed in that region. The weighted population center uses the values of an attribute (variable) as weights to determine the most likely population centre. That is, instead of using the geographic locations (x,y coordinates) to determine the mean location of the population in an area, a weight such as the actual population count is used to determine its likely spatial location. We used a raster population dataset to create regular population grid points, each point representing a population value. These grid points are then catego-rized by NUTS regions to subsequently compute the weighted population centers within the NUTS regions. Figure 1 illustrates both the geometric centre and weighted population centers for Switzer-land.
∗ The discussion in this section is based on the technical report: “GIS Methodology in Determining Popula-
tion Centers and Distances to Nuclear Power Plants” (Tine Ningal & Finbarr Brereton) produced as a delivera-
ble for this project within work package 1 and publicly available at http://www.uni-oldenburg.de/energy-for-
well-being/.
22/47
F:\SFOE_FinalReport_08July2014.docx
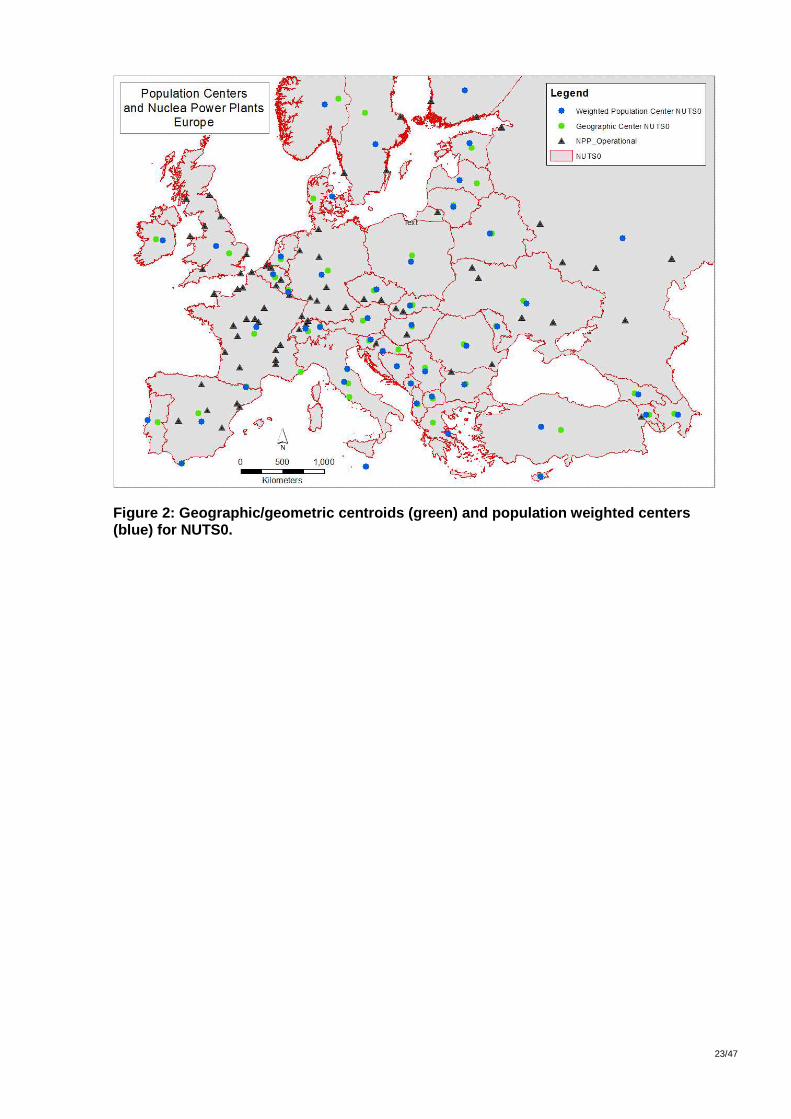
Figure 1: Vector Gridded World Population showing p opulation distribution in Switzerland with geometric and weighted population centers as well a s NPPs The raster to vector grid conversion technique was used to derive the weighted population centers across Europe at different levels of spatial disaggregation (depending on the level at which the indi-vidual data are available at the ESS), from NUTS0 (country) to NUTS3 levels. Figure 2 illustrates the difference between the geometric and weighted population centers for the NUTS0 regions, while Table 6 shows the actual distances (in Km) between the two.
23/47
F:\SFOE_FinalReport_08July2014.docx
Figure 2: Geographic/geometric centroids (green) an d population weighted centers (blue) for NUTS0.
24/47
F:\SFOE_FinalReport_08July2014.docx
Table 6: Distances between geometric and population weighted centers at NUTS0 (country) level
NUTS Code NAME
Population in 2010
Distance between Geometric and Weighted Population Centres (km)
AL Albania 3293417 19
AT Österreich 7990654 62
BE Belgique-België 10282738 43
BG Bulgaria 7130081 18
BY Belarus 9783533 26
CH Schweiz/Suisse/Svizzera 7012097 48
CY Kypros / Kibris 760682 10
CZ Ceska Republika 10157525 34
DE Deutschland 81138644 90
DK Danmark 5070912 228
EE Eesti 1200296 61
ES España 36519524 103
FI Suomi / Finland 4998692 693
FR France 60327620 87
GR Ellada 9886216 228
HU Magyarorszag 9495212 20
IE Ireland 4076898 82
IT Italia 55184139 56
LT Lietuva 3592180 22
LU Luxembourg (Grand-Duché) 489533 22
LV Latvija 2262272 214
NL Nederland 16125699 37
NO Norge 4274026 175
PL Polska 38118288 76
PT Portugal 9291428 120
RO Romania 21690934 38
SE Sverige 8457175 398
SI Slovenija 2176370 20
SK Slovenska Republika 5437742 35
TR Turkiye 73170303 238
UA Ukraina 45061659 47
UK United Kingdom 58175209 182
RU Russia 98863672 1,066 Notes: Population values for 2010. Generating buffer distances from population points
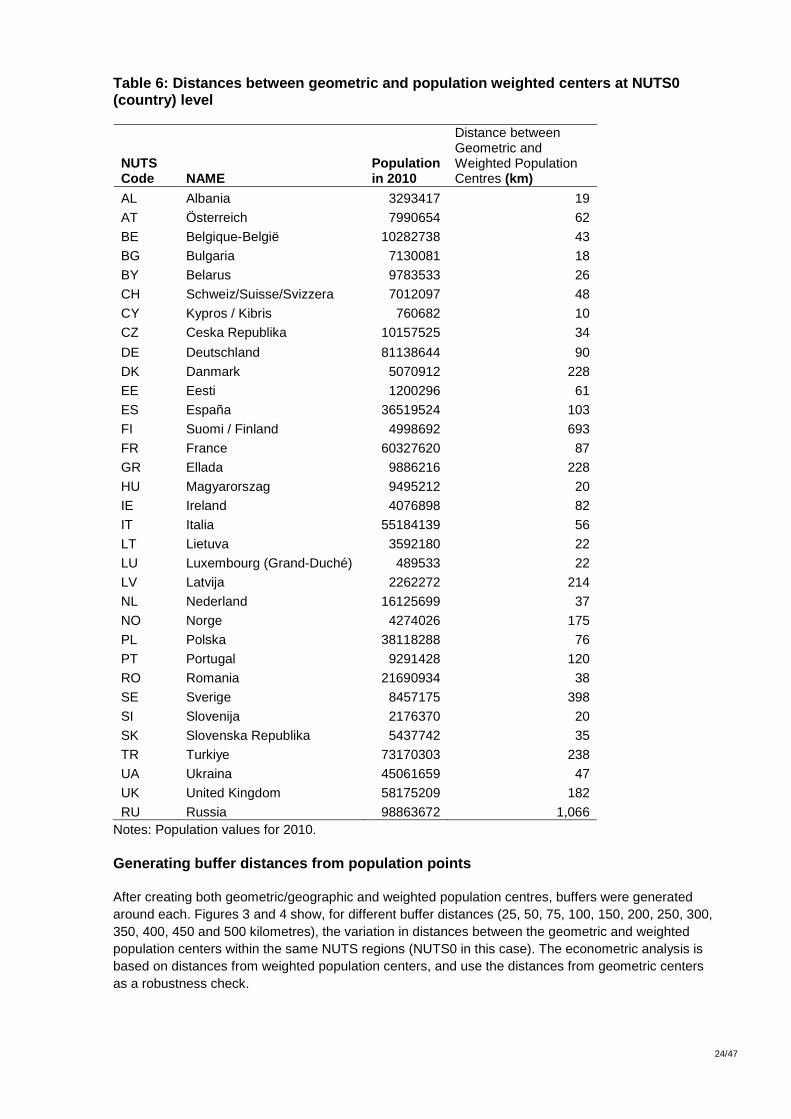
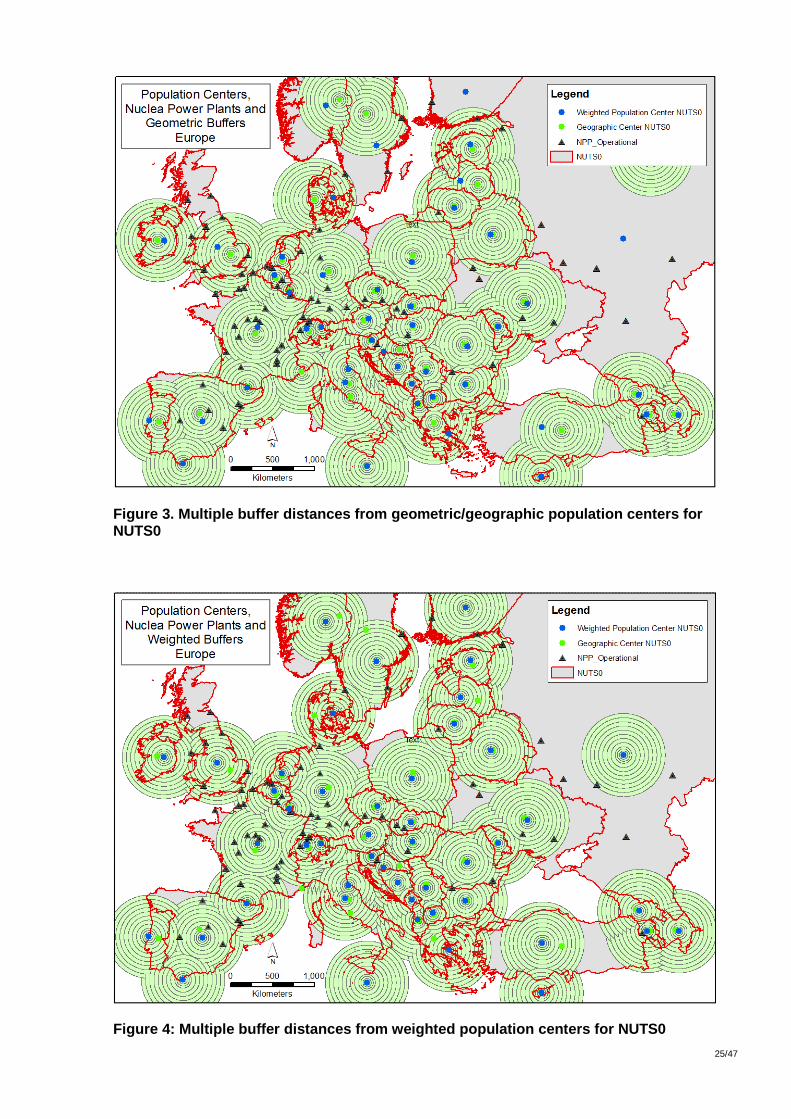
After creating both geometric/geographic and weighted population centres, buffers were generated around each. Figures 3 and 4 show, for different buffer distances (25, 50, 75, 100, 150, 200, 250, 300, 350, 400, 450 and 500 kilometres), the variation in distances between the geometric and weighted population centers within the same NUTS regions (NUTS0 in this case). The econometric analysis is based on distances from weighted population centers, and use the distances from geometric centers as a robustness check.
25/47
F:\SFOE_FinalReport_08July2014.docx
Figure 3. Multiple buffer distances from geometric/ geographic population centers for NUTS0
Figure 4: Multiple buffer distances from weighted p opulation centers for NUTS0
26/47
F:\SFOE_FinalReport_08July2014.docx
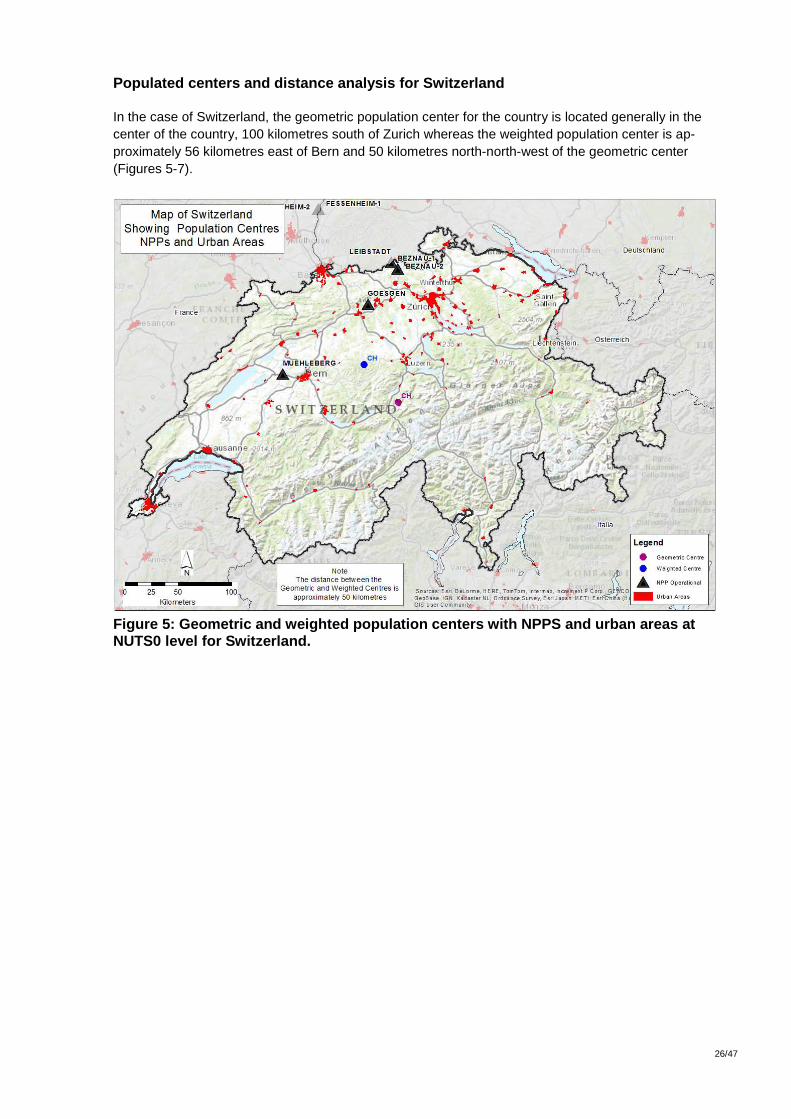
Populated centers and distance analysis for Switzer land
In the case of Switzerland, the geometric population center for the country is located generally in the center of the country, 100 kilometres south of Zurich whereas the weighted population center is ap-proximately 56 kilometres east of Bern and 50 kilometres north-north-west of the geometric center (Figures 5-7).
Figure 5: Geometric and weighted population centers with NPPS and urban areas at NUTS0 level for Switzerland.
27/47
F:\SFOE_FinalReport_08July2014.docx
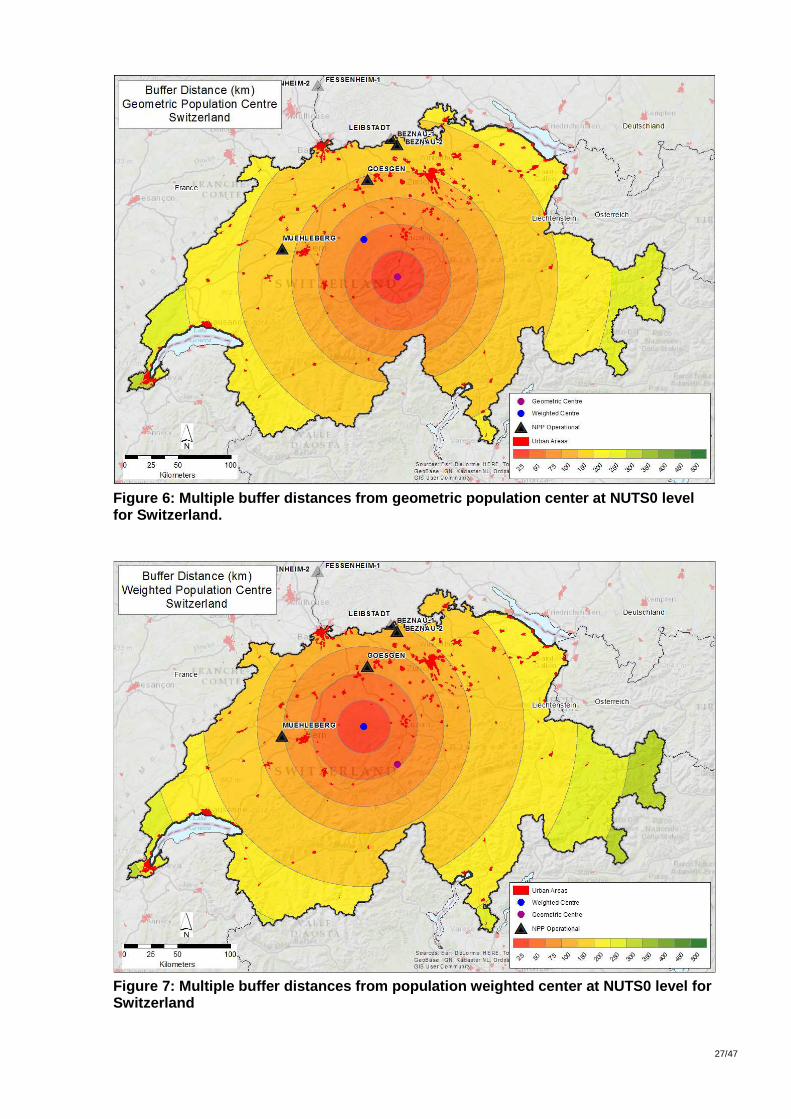
Figure 6: Multiple buffer distances from geometric population center at NUTS0 level for Switzerland.
Figure 7: Multiple buffer distances from population weighted center at NUTS0 level for Switzerland
28/47
F:\SFOE_FinalReport_08July2014.docx
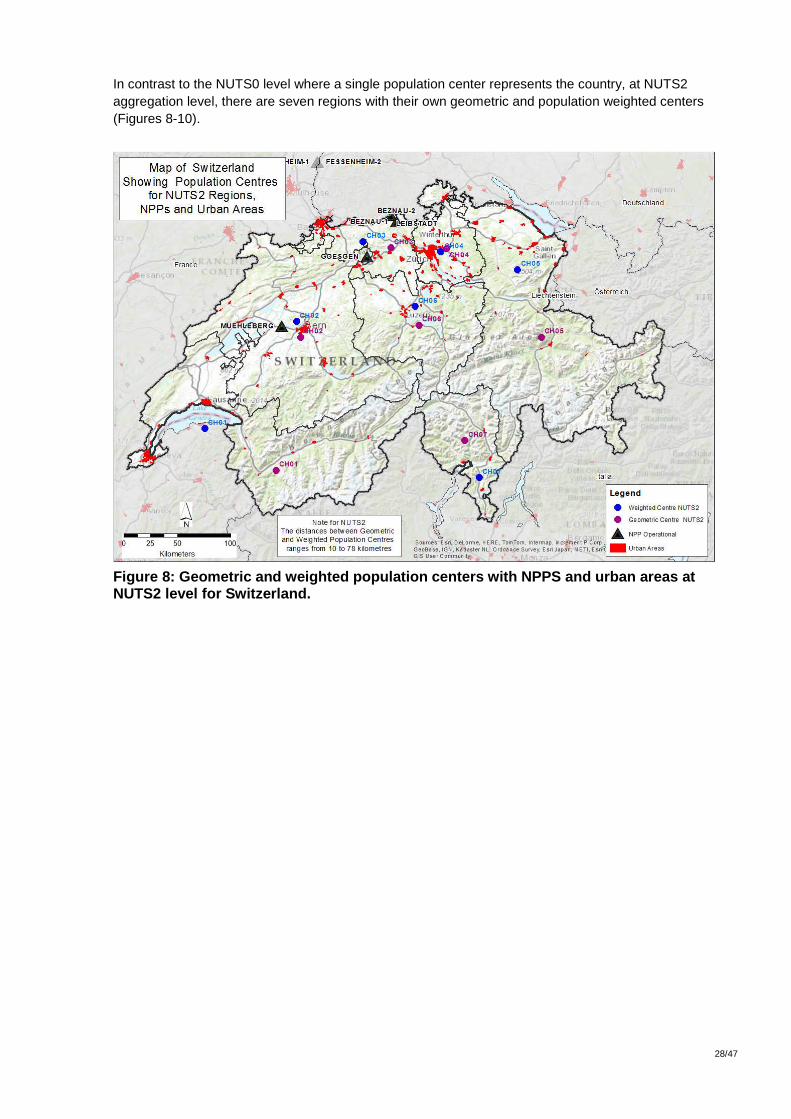
In contrast to the NUTS0 level where a single population center represents the country, at NUTS2 aggregation level, there are seven regions with their own geometric and population weighted centers (Figures 8-10).
Figure 8: Geometric and weighted population centers with NPPS and urban areas at NUTS2 level for Switzerland.
29/47
F:\SFOE_FinalReport_08July2014.docx
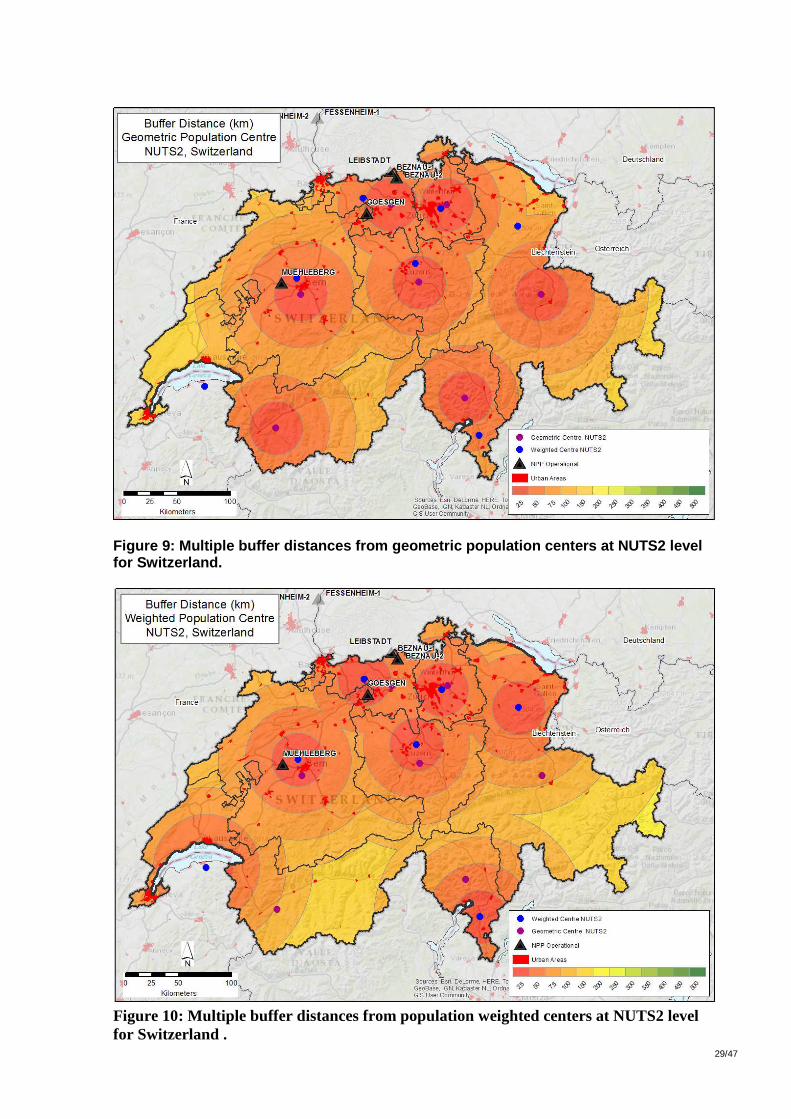
Figure 9: Multiple buffer distances from geometric population centers at NUTS2 level for Switzerland.
Figure 10: Multiple buffer distances from population weighted centers at NUTS2 level for Switzerland .
30/47
F:\SFOE_FinalReport_08July2014.docx
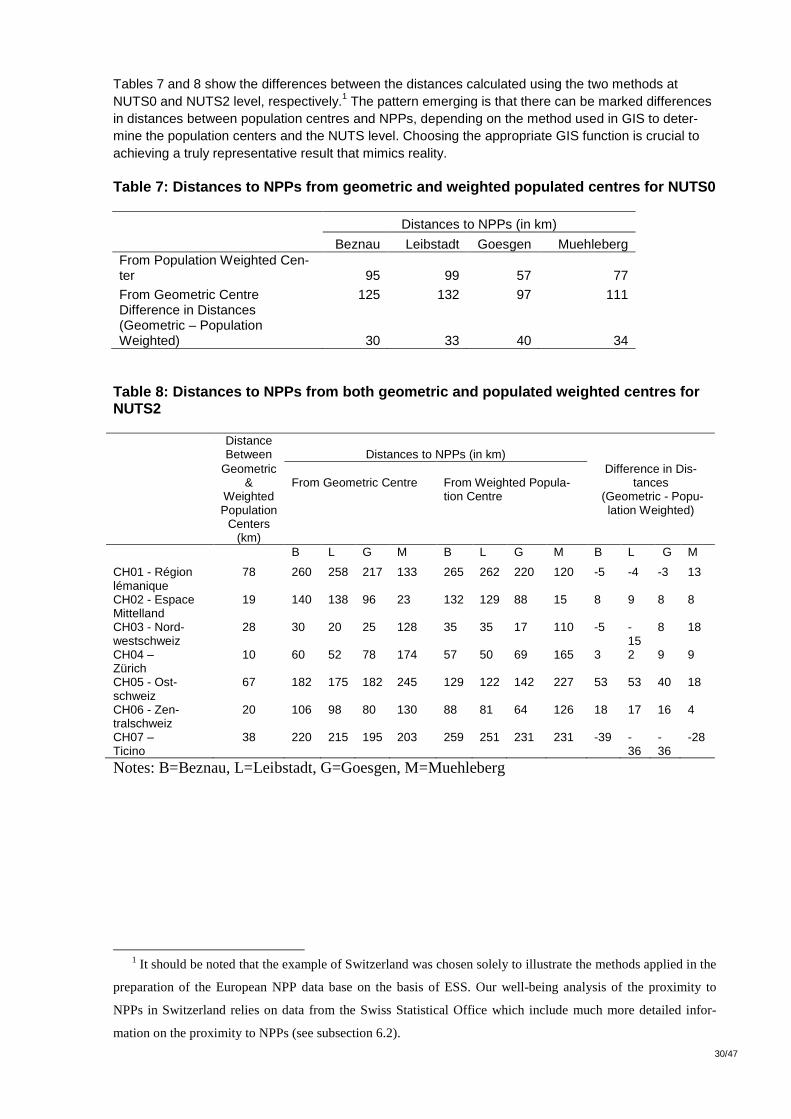
Tables 7 and 8 show the differences between the distances calculated using the two methods at NUTS0 and NUTS2 level, respectively.1 The pattern emerging is that there can be marked differences in distances between population centres and NPPs, depending on the method used in GIS to deter-mine the population centers and the NUTS level. Choosing the appropriate GIS function is crucial to achieving a truly representative result that mimics reality. Table 7: Distances to NPPs from geometric and weigh ted populated centres for NUTS0
Distances to NPPs (in km)
Beznau Leibstadt Goesgen Muehleberg From Population Weighted Cen-ter 95 99 57 77
From Geometric Centre 125 132 97 111 Difference in Distances (Geometric – Population Weighted) 30 33 40 34
Table 8: Distances to NPPs from both geometric and populated weighted centres for NUTS2
Distance Between
Distances to NPPs (in km)
Geometric &
Weighted Population
Centers (km)
From Geometric Centre
From Weighted Popula-tion Centre
Difference in Dis-tances
(Geometric - Popu-lation Weighted)
B L G M B L G M B L G M
CH01 - Région lémanique
78 260 258 217 133 265 262 220 120 -5 -4 -3 13
CH02 - Espace Mittelland
19 140 138 96 23 132 129 88 15 8 9 8 8
CH03 - Nord-westschweiz
28 30 20 25 128 35 35 17 110 -5 -15
8 18
CH04 – Zürich
10 60 52 78 174 57 50 69 165 3 2 9 9
CH05 - Ost-schweiz
67 182 175 182 245 129 122 142 227 53 53 40 18
CH06 - Zen-tralschweiz
20 106 98 80 130 88 81 64 126 18 17 16 4
CH07 – Ticino
38 220 215 195 203 259 251 231 231 -39 -36
-36
-28
Notes: B=Beznau, L=Leibstadt, G=Goesgen, M=Muehleberg
1 It should be noted that the example of Switzerland was chosen solely to illustrate the methods applied in the
preparation of the European NPP data base on the basis of ESS. Our well-being analysis of the proximity to
NPPs in Switzerland relies on data from the Swiss Statistical Office which include much more detailed infor-
mation on the proximity to NPPs (see subsection 6.2).
31/47
F:\SFOE_FinalReport_08July2014.docx
6 SWB and proximity to energy facilities
This analysis studies the relationship between SWB and proximity to nuclear power plants (NPP). This relationship is assumed to involve a trade-off between economic factors related to the proximity to NPPs (e.g. employment opportunities) and concerns about nuclear safety. We investigated the relationship between SWB and NPPs both from a European wide perspective, and with respect to Switzerland as a case study. In the European wide analysis we used data from the European Social Survey (rounds 1-5) and GIS matching to distance from NPP from work package1 (see section 5). In the analysis for Switzerland we used data from the Swiss “Statistics on Income and Living Conditions” (SILC) 2009-2011, where survey respondents are characterized by their distance to the nearest NPP in steps of 5 km.
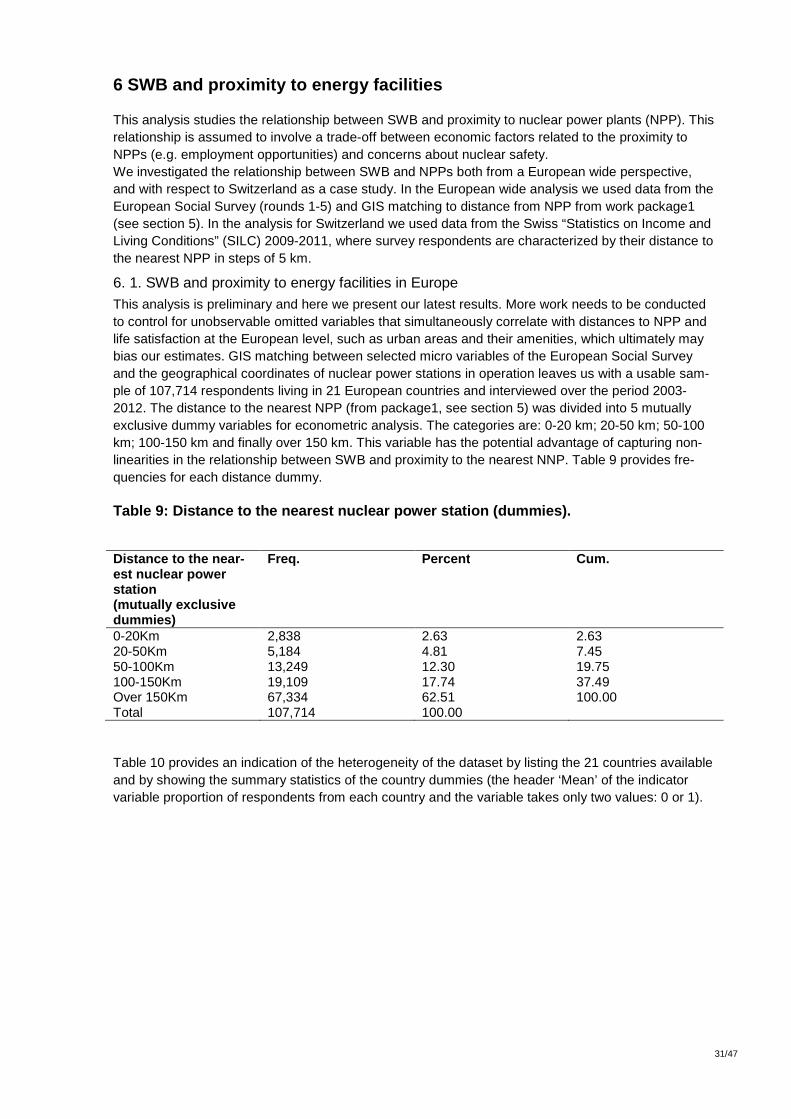
6. 1. SWB and proximity to energy facilities in Europe This analysis is preliminary and here we present our latest results. More work needs to be conducted to control for unobservable omitted variables that simultaneously correlate with distances to NPP and life satisfaction at the European level, such as urban areas and their amenities, which ultimately may bias our estimates. GIS matching between selected micro variables of the European Social Survey and the geographical coordinates of nuclear power stations in operation leaves us with a usable sam-ple of 107,714 respondents living in 21 European countries and interviewed over the period 2003-2012. The distance to the nearest NPP (from package1, see section 5) was divided into 5 mutually exclusive dummy variables for econometric analysis. The categories are: 0-20 km; 20-50 km; 50-100 km; 100-150 km and finally over 150 km. This variable has the potential advantage of capturing non-linearities in the relationship between SWB and proximity to the nearest NNP. Table 9 provides fre-quencies for each distance dummy. Table 9: Distance to the nearest nuclear power stat ion (dummies).
Distance to the nea r-est nuclear power station (mutually exclusive dummies)
Freq. Percent Cum.
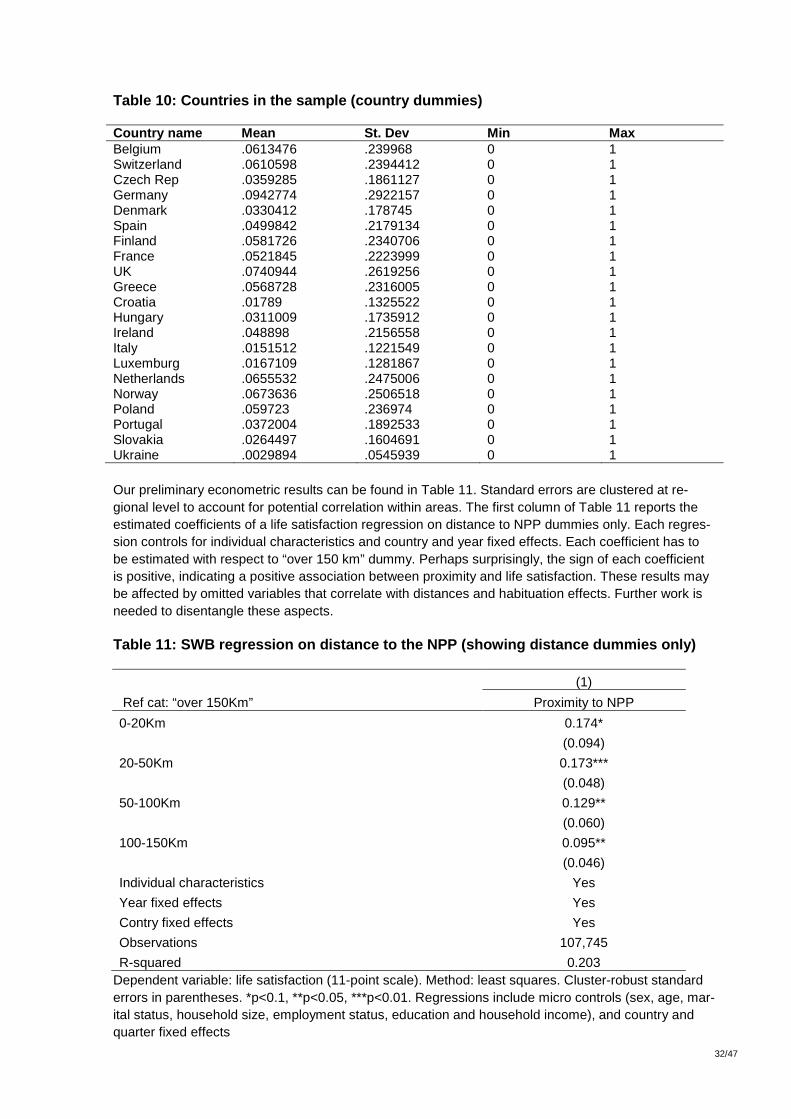
0-20Km 2,838 2.63 2.63 20-50Km 5,184 4.81 7.45 50-100Km 13,249 12.30 19.75 100-150Km 19,109 17.74 37.49 Over 150Km 67,334 62.51 100.00 Total 107,714 100.00 Table 10 provides an indication of the heterogeneity of the dataset by listing the 21 countries available and by showing the summary statistics of the country dummies (the header ‘Mean’ of the indicator variable proportion of respondents from each country and the variable takes only two values: 0 or 1).
32/47
F:\SFOE_FinalReport_08July2014.docx
Table 10: Countries in the sample (country dummies)
Country name Mean St. Dev Min Max Belgium .0613476 .239968 0 1 Switzerland .0610598 .2394412 0 1 Czech Rep .0359285 .1861127 0 1 Germany .0942774 .2922157 0 1 Denmark .0330412 .178745 0 1 Spain .0499842 .2179134 0 1 Finland .0581726 .2340706 0 1 France .0521845 .2223999 0 1 UK .0740944 .2619256 0 1 Greece .0568728 .2316005 0 1 Croatia .01789 .1325522 0 1 Hungary .0311009 .1735912 0 1 Ireland .048898 .2156558 0 1 Italy .0151512 .1221549 0 1 Luxemburg .0167109 .1281867 0 1 Netherlands .0655532 .2475006 0 1 Norway .0673636 .2506518 0 1 Poland .059723 .236974 0 1 Portugal .0372004 .1892533 0 1 Slovakia .0264497 .1604691 0 1 Ukraine .0029894 .0545939 0 1 Our preliminary econometric results can be found in Table 11. Standard errors are clustered at re-gional level to account for potential correlation within areas. The first column of Table 11 reports the estimated coefficients of a life satisfaction regression on distance to NPP dummies only. Each regres-sion controls for individual characteristics and country and year fixed effects. Each coefficient has to be estimated with respect to “over 150 km” dummy. Perhaps surprisingly, the sign of each coefficient is positive, indicating a positive association between proximity and life satisfaction. These results may be affected by omitted variables that correlate with distances and habituation effects. Further work is needed to disentangle these aspects. Table 11: SWB regression on distance to the NPP (sh owing distance dummies only)
(1)
Ref cat: “over 150Km” Proximity to NPP
0-20Km 0.174*
(0.094)
20-50Km 0.173***
(0.048)
50-100Km 0.129**
(0.060)
100-150Km 0.095**
(0.046)
Individual characteristics Yes
Year fixed effects Yes
Contry fixed effects Yes
Observations 107,745
R-squared 0.203 Dependent variable: life satisfaction (11-point scale). Method: least squares. Cluster-robust standard errors in parentheses. *p<0.1, **p<0.05, ***p<0.01. Regressions include micro controls (sex, age, mar-ital status, household size, employment status, education and household income), and country and quarter fixed effects
33/47
F:\SFOE_FinalReport_08July2014.docx
6. 2. SWB and proximity to energy facilities: the case of Switzerland
This analysis is based on a version of the SILC database for 2009-2011 that includes information on people’s distance to the nearest NPP and which was created and supplied on purpose by the Swiss Statistical Office. As a downside of this useful feature, person identifiers were randomized in this data base for purposes of data protection (anonymity). Therefore, though SILC is in principle a panel, we were unable to use person fixed effects in our analysis.
Empirical background and research strategy
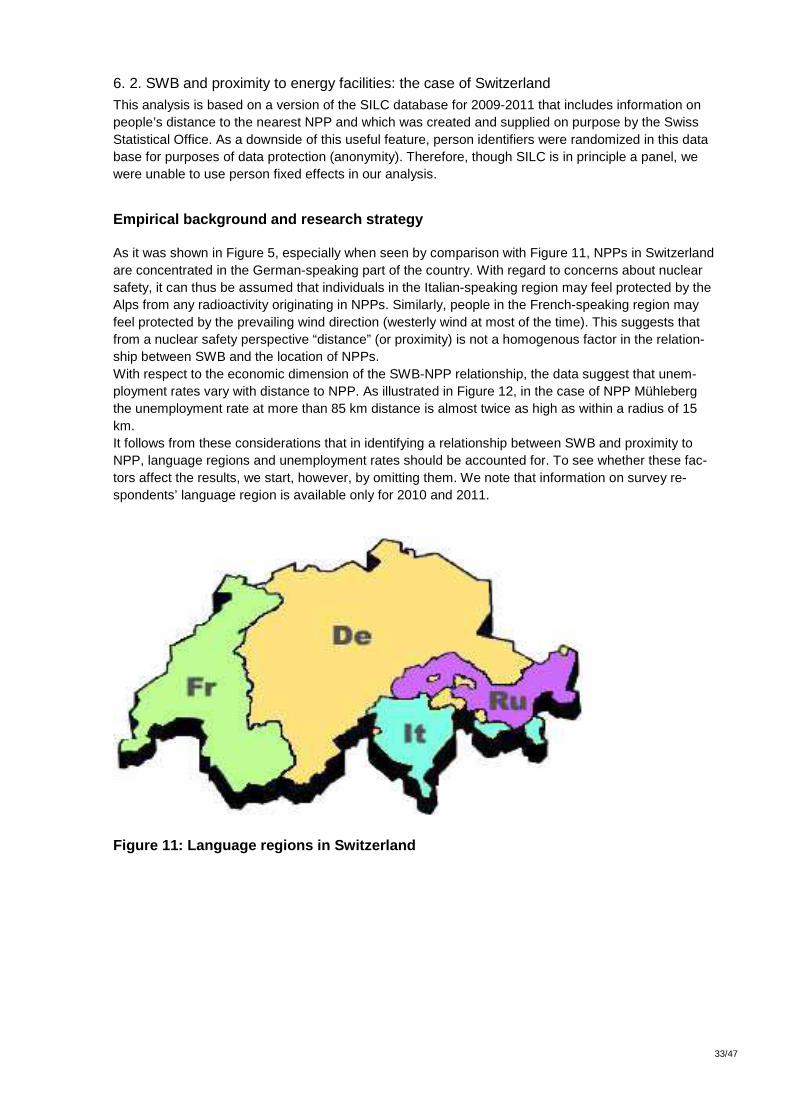
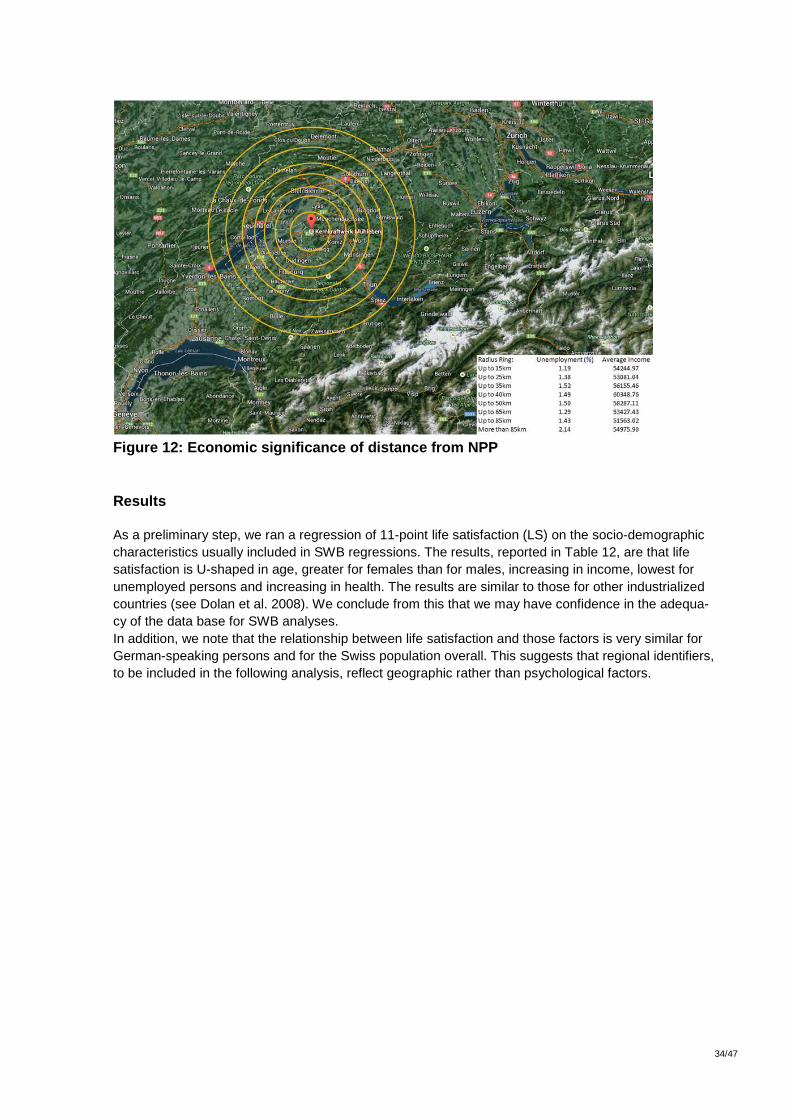
As it was shown in Figure 5, especially when seen by comparison with Figure 11, NPPs in Switzerland are concentrated in the German-speaking part of the country. With regard to concerns about nuclear safety, it can thus be assumed that individuals in the Italian-speaking region may feel protected by the Alps from any radioactivity originating in NPPs. Similarly, people in the French-speaking region may feel protected by the prevailing wind direction (westerly wind at most of the time). This suggests that from a nuclear safety perspective “distance” (or proximity) is not a homogenous factor in the relation-ship between SWB and the location of NPPs. With respect to the economic dimension of the SWB-NPP relationship, the data suggest that unem-ployment rates vary with distance to NPP. As illustrated in Figure 12, in the case of NPP Mühleberg the unemployment rate at more than 85 km distance is almost twice as high as within a radius of 15 km. It follows from these considerations that in identifying a relationship between SWB and proximity to NPP, language regions and unemployment rates should be accounted for. To see whether these fac-tors affect the results, we start, however, by omitting them. We note that information on survey re-spondents’ language region is available only for 2010 and 2011.
Figure 11: Language regions in Switzerland
34/47
F:\SFOE_FinalReport_08July2014.docx
Figure 12: Economic significance of distance from N PP
Results
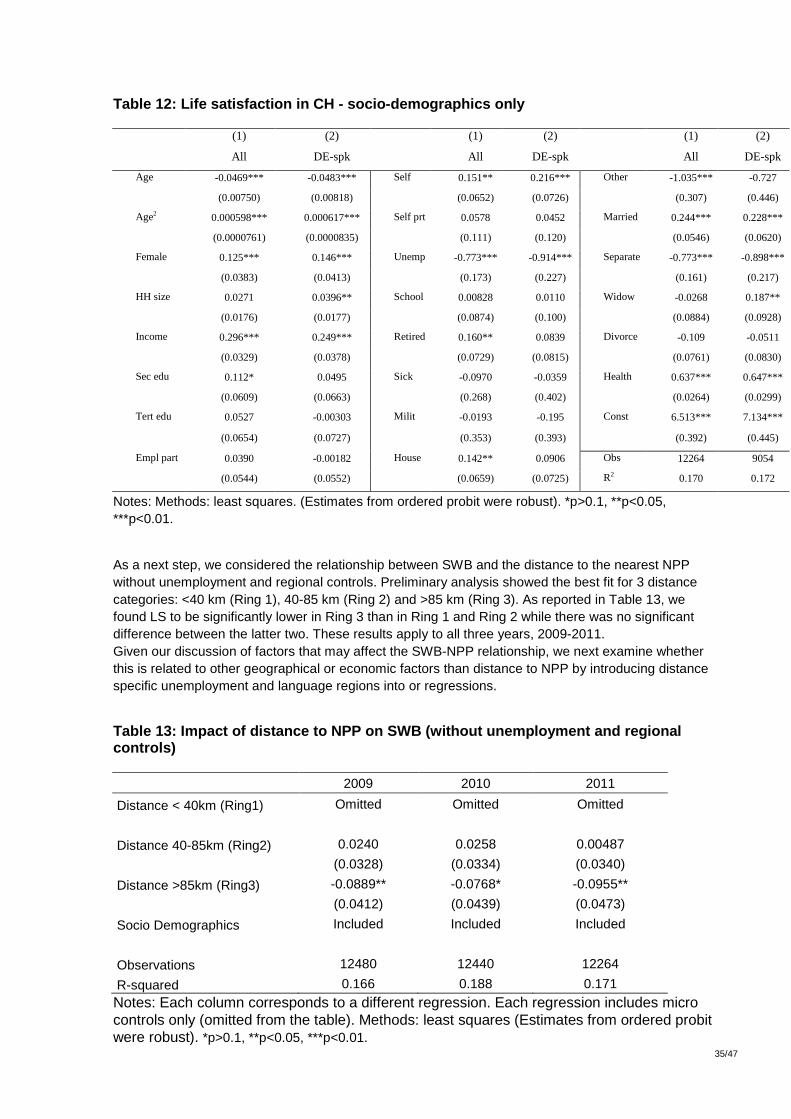
As a preliminary step, we ran a regression of 11-point life satisfaction (LS) on the socio-demographic characteristics usually included in SWB regressions. The results, reported in Table 12, are that life satisfaction is U-shaped in age, greater for females than for males, increasing in income, lowest for unemployed persons and increasing in health. The results are similar to those for other industrialized countries (see Dolan et al. 2008). We conclude from this that we may have confidence in the adequa-cy of the data base for SWB analyses. In addition, we note that the relationship between life satisfaction and those factors is very similar for German-speaking persons and for the Swiss population overall. This suggests that regional identifiers, to be included in the following analysis, reflect geographic rather than psychological factors.
35/47
F:\SFOE_FinalReport_08July2014.docx
Table 12: Life satisfaction in CH - socio-demograph ics only
(1) (2) (1) (2) (1) (2)
All DE-spk All DE-spk All DE-spk
Age -0.0469*** -0.0483*** Self 0.151** 0.216*** Other -1.035*** -0.727
(0.00750) (0.00818) (0.0652) (0.0726) (0.307) (0.446)
Age2 0.000598*** 0.000617*** Self prt 0.0578 0.0452 Married 0.244*** 0.228***
(0.0000761) (0.0000835) (0.111) (0.120) (0.0546) (0.0620)
Female 0.125*** 0.146*** Unemp -0.773*** -0.914*** Separate -0.773*** -0.898***
(0.0383) (0.0413) (0.173) (0.227) (0.161) (0.217)
HH size 0.0271 0.0396** School 0.00828 0.0110 Widow -0.0268 0.187**
(0.0176) (0.0177) (0.0874) (0.100) (0.0884) (0.0928)
Income 0.296*** 0.249*** Retired 0.160** 0.0839 Divorce -0.109 -0.0511
(0.0329) (0.0378) (0.0729) (0.0815) (0.0761) (0.0830)
Sec edu
0.112* 0.0495 Sick -0.0970 -0.0359 Health 0.637*** 0.647***
(0.0609) (0.0663) (0.268) (0.402) (0.0264) (0.0299)
Tert edu
0.0527 -0.00303 Milit -0.0193 -0.195 Const 6.513*** 7.134***
(0.0654) (0.0727) (0.353) (0.393) (0.392) (0.445)
Empl part
0.0390 -0.00182 House 0.142** 0.0906 Obs 12264 9054
(0.0544) (0.0552) (0.0659) (0.0725) R2 0.170 0.172
Notes: Methods: least squares. (Estimates from ordered probit were robust). *p>0.1, **p<0.05, ***p<0.01.
As a next step, we considered the relationship between SWB and the distance to the nearest NPP without unemployment and regional controls. Preliminary analysis showed the best fit for 3 distance categories: <40 km (Ring 1), 40-85 km (Ring 2) and >85 km (Ring 3). As reported in Table 13, we found LS to be significantly lower in Ring 3 than in Ring 1 and Ring 2 while there was no significant difference between the latter two. These results apply to all three years, 2009-2011. Given our discussion of factors that may affect the SWB-NPP relationship, we next examine whether this is related to other geographical or economic factors than distance to NPP by introducing distance specific unemployment and language regions into or regressions.
Table 13: Impact of distance to NPP on SWB (without unemployment and regional controls)
2009 2010 2011
Distance < 40km (Ring1) Omitted Omitted Omitted
Distance 40-85km (Ring2) 0.0240 0.0258 0.00487
(0.0328) (0.0334) (0.0340)
Distance >85km (Ring3) -0.0889** -0.0768* -0.0955**
(0.0412) (0.0439) (0.0473)
Socio Demographics Included Included Included
Observations 12480 12440 12264
R-squared 0.166 0.188 0.171
Notes: Each column corresponds to a different regression. Each regression includes micro controls only (omitted from the table). Methods: least squares (Estimates from ordered probit were robust). *p>0.1, **p<0.05, ***p<0.01.
36/47
F:\SFOE_FinalReport_08July2014.docx
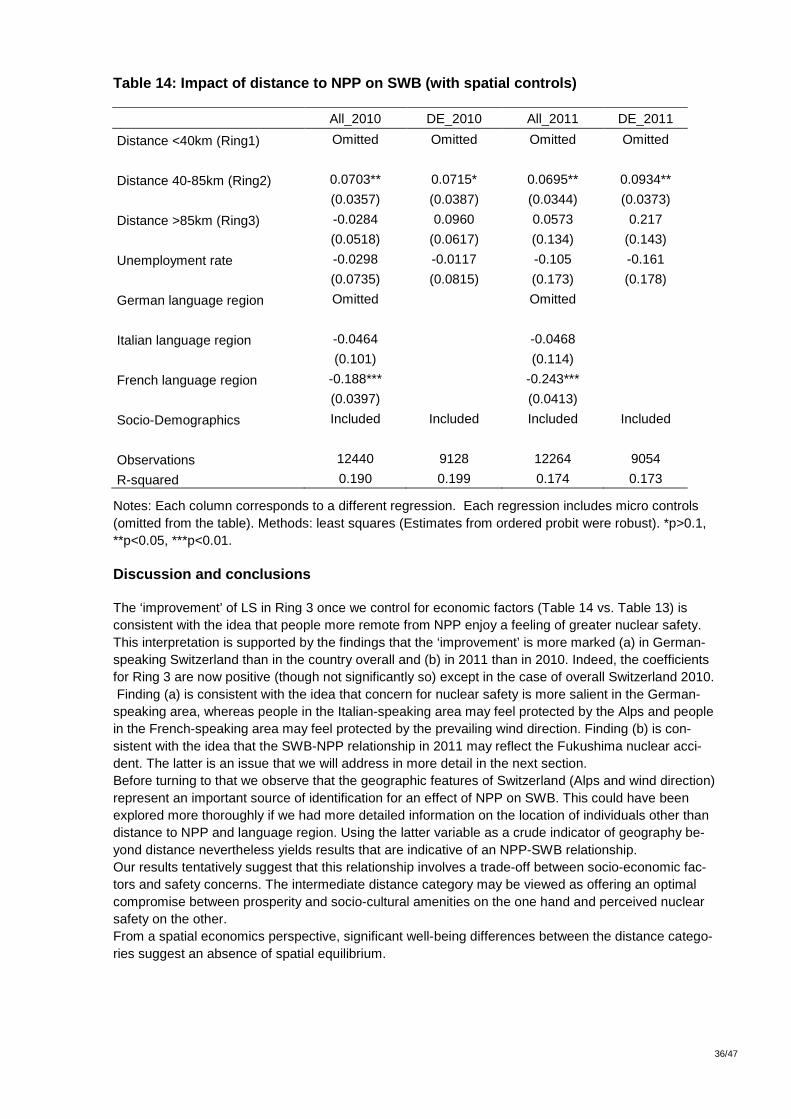
Table 14: Impact of distance to NPP on SWB (with sp atial controls)
All_2010 DE_2010 All_2011 DE_2011
Distance <40km (Ring1) Omitted Omitted Omitted Omitted
Distance 40-85km (Ring2) 0.0703** 0.0715* 0.0695** 0.0934**
(0.0357) (0.0387) (0.0344) (0.0373)
Distance >85km (Ring3) -0.0284 0.0960 0.0573 0.217
(0.0518) (0.0617) (0.134) (0.143)
Unemployment rate -0.0298 -0.0117 -0.105 -0.161
(0.0735) (0.0815) (0.173) (0.178)
German language region Omitted
Omitted
Italian language region -0.0464 -0.0468
(0.101) (0.114)
French language region -0.188*** -0.243***
(0.0397) (0.0413)
Socio-Demographics Included Included Included Included
Observations 12440 9128 12264 9054
R-squared 0.190 0.199 0.174 0.173
Notes: Each column corresponds to a different regression. Each regression includes micro controls (omitted from the table). Methods: least squares (Estimates from ordered probit were robust). *p>0.1, **p<0.05, ***p<0.01. Discussion and conclusions
The ‘improvement’ of LS in Ring 3 once we control for economic factors (Table 14 vs. Table 13) is consistent with the idea that people more remote from NPP enjoy a feeling of greater nuclear safety. This interpretation is supported by the findings that the ‘improvement’ is more marked (a) in German-speaking Switzerland than in the country overall and (b) in 2011 than in 2010. Indeed, the coefficients for Ring 3 are now positive (though not significantly so) except in the case of overall Switzerland 2010. Finding (a) is consistent with the idea that concern for nuclear safety is more salient in the German-speaking area, whereas people in the Italian-speaking area may feel protected by the Alps and people in the French-speaking area may feel protected by the prevailing wind direction. Finding (b) is con-sistent with the idea that the SWB-NPP relationship in 2011 may reflect the Fukushima nuclear acci-dent. The latter is an issue that we will address in more detail in the next section. Before turning to that we observe that the geographic features of Switzerland (Alps and wind direction) represent an important source of identification for an effect of NPP on SWB. This could have been explored more thoroughly if we had more detailed information on the location of individuals other than distance to NPP and language region. Using the latter variable as a crude indicator of geography be-yond distance nevertheless yields results that are indicative of an NPP-SWB relationship. Our results tentatively suggest that this relationship involves a trade-off between socio-economic fac-tors and safety concerns. The intermediate distance category may be viewed as offering an optimal compromise between prosperity and socio-cultural amenities on the one hand and perceived nuclear safety on the other. From a spatial economics perspective, significant well-being differences between the distance catego-ries suggest an absence of spatial equilibrium.
37/47
F:\SFOE_FinalReport_08July2014.docx
7. SWB and the Fukushima accident
The purpose of this analysis is to study whether SWB in Europe in general and in Switzerland in par-ticular was affected by the nuclear accident at Fukushima on March 11, 2011. More specifically, we also study whether a ‘Fukushima effect’ (if any) was mediated by the proximity to nuclear power plants (NPP) in Europe and in Switzerland. As in the analysis reported in the preceding section, the European wide analysis used data from the European Social Survey (rounds 1-5) and GIS matching to distance from NPP from work package 1. In the analysis for Switzerland we used data from the Swiss “Statistics on Income and Living Condi-tions” (SILC) 2009-2011, where survey respondents are characterized by their distance to te nearest NPP in steps of 5 km.
7. 1. The Fukushima accident and SWB in Europe∗∗∗∗
This work builds on the estimation in work package 5 and analyzes whether there was a ‘Fukushima effect’ that varied with distance to NPPs. The hypothesis is that the Fukushima accident acted like an information shock making the risk of nuclear power more salient to those in close proximity to NPPs. Proximity to NPPs is defined by using the distance variables calculated in work package 1. However, in a broader sense, at the national level the perceived distance may depend on the share of nuclear energy in a particular country. While regression analysis involving the distance variables from work package 1 is in a preliminary state, we have analyzed the relationship between European citi-zens’ SWB and the share of nuclear power before and after the Fukushima nuclear disaster. As de-tailed below, we found that European citizens’ SWB was statistically unrelated to the share of nuclear power before the Fukushima nuclear disaster, but that SWB was negatively related to the nuclear share after the disaster. In the sense of section 3, this suggests the existence of an induced prefer-ence change.
Hypotheses
The Fukushima nuclear accident may have changed European citizens’ relationship between nuclear power and SWB through several channels:
– The subjective assessment of accident probabilities, – The subjective assessment of the damage potential of an accident, – The utility weights people place on nuclear safety relative to other attributes of electricity
supply.
These potential changes may have altered the relationship between SWB and the share of nuclear power. Put differently, a hypothesized effect of Fukushima on a country’s SWB may be positively re-lated to this country’s nuclear power share. Empirical Approach: Difference-in-Difference Specif ication
Using survey data for 123,675 individuals i in 23 European countries c in 10 years
t, we estimated the
following life satisfaction regression
icttcictctictictctict timecountrycontrolsnukepostpostnukeLS εδγβα ++++++= *****
∗ The discussion in this section is partially based on the working paper “Induced Transnational Preference
Change: Fukushima and Nuclear Power in Europe” by Heinz Welsch & Philipp Biermann (2013), produced as a
deliverable for this project within work package 5, and publicly available at
http://ideas.repec.org/p/zen/wpaper/27.html. A short version of the paper: "Measuring Induced Preference
Change: Fukushima and Nuclear Power in Europe“, has been invited to be revised and resubmitted at the journal
Economics Letters.
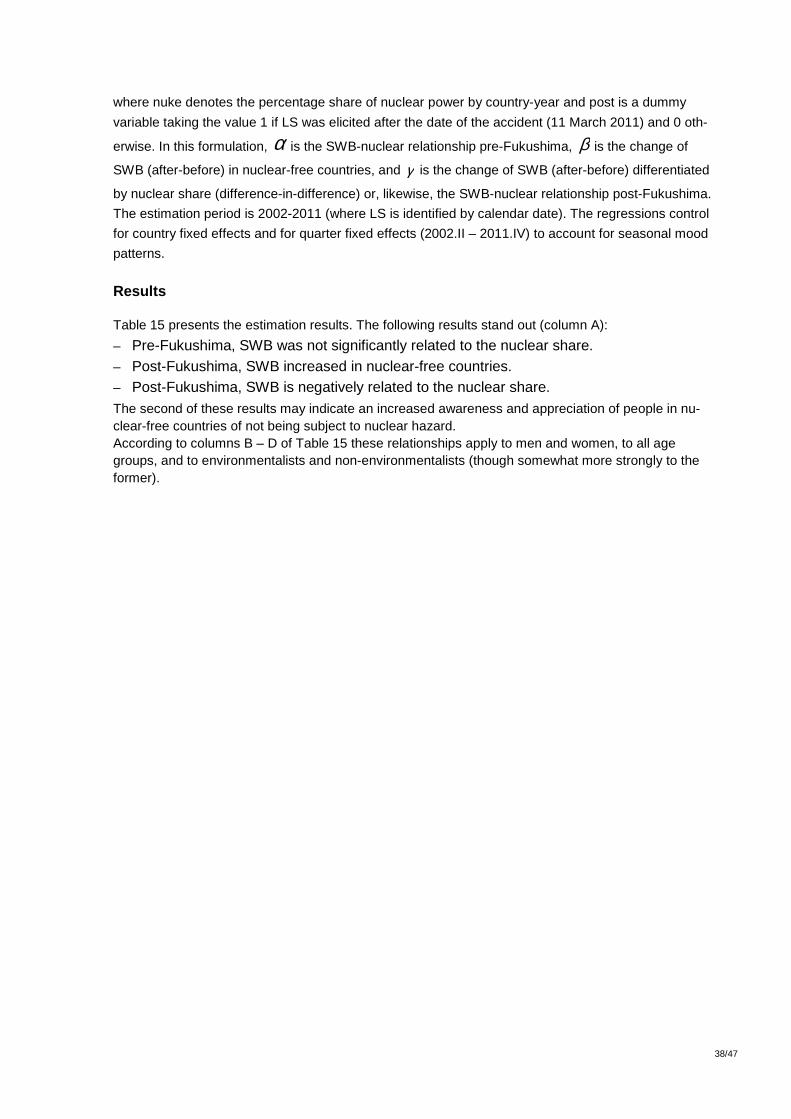
38/47
F:\SFOE_FinalReport_08July2014.docx
where nuke denotes the percentage share of nuclear power by country-year and post is a dummy
variable taking the value 1 if LS was elicited after the date of the accident (11 March 2011) and 0 oth-
erwise. In this formulation, α is the SWB-nuclear relationship pre-Fukushima, β is the change of
SWB (after-before) in nuclear-free countries, and γ is the change of SWB (after-before) differentiated
by nuclear share (difference-in-difference) or, likewise, the SWB-nuclear relationship post-Fukushima.
The estimation period is 2002-2011 (where LS is identified by calendar date). The regressions control
for country fixed effects and for quarter fixed effects (2002.II – 2011.IV) to account for seasonal mood
patterns.
Results
Table 15 presents the estimation results. The following results stand out (column A):
– Pre-Fukushima, SWB was not significantly related to the nuclear share. – Post-Fukushima, SWB increased in nuclear-free countries. – Post-Fukushima, SWB is negatively related to the nuclear share. The second of these results may indicate an increased awareness and appreciation of people in nu-clear-free countries of not being subject to nuclear hazard. According to columns B – D of Table 15 these relationships apply to men and women, to all age groups, and to environmentalists and non-environmentalists (though somewhat more strongly to the former).
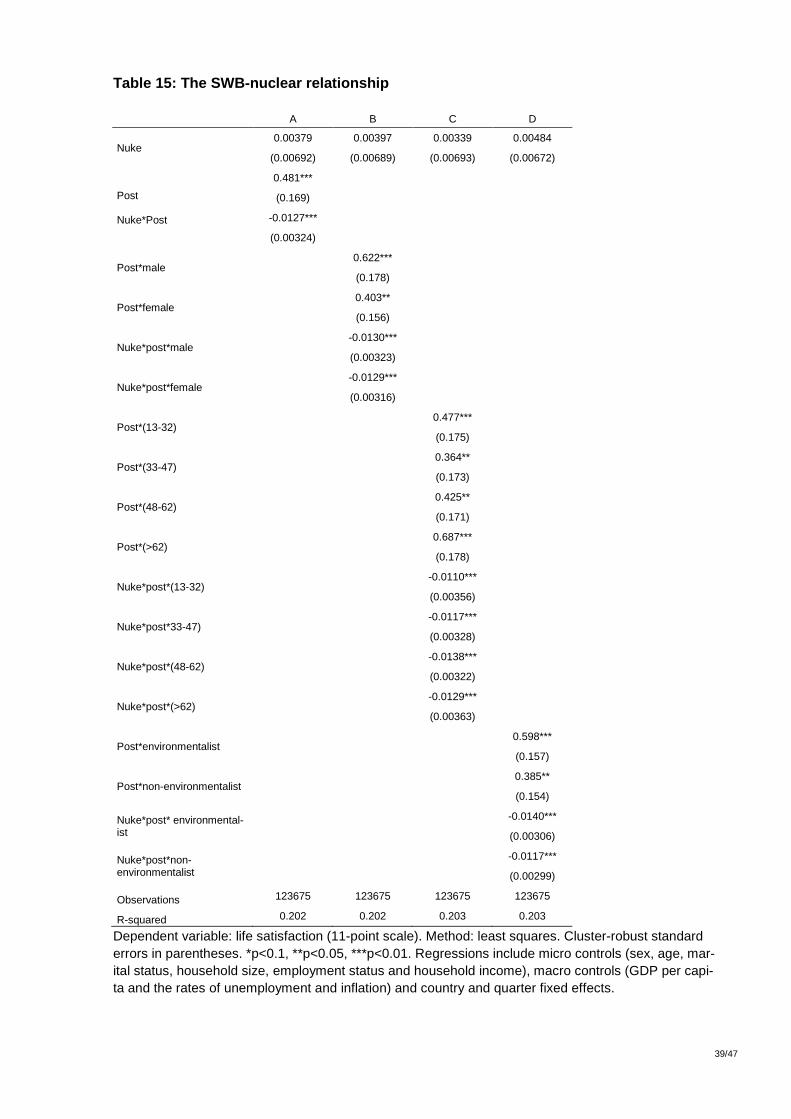
39/47
F:\SFOE_FinalReport_08July2014.docx
Table 15: The SWB-nuclear relationship
A B C D
Nuke 0.00379 0.00397 0.00339 0.00484
(0.00692) (0.00689) (0.00693) (0.00672)
Post Nuke*Post
0.481***
(0.169)
-0.0127***
(0.00324)
Post*male 0.622***
(0.178)
Post*female 0.403**
(0.156)
Nuke*post*male -0.0130***
(0.00323)
Nuke*post*female -0.0129***
(0.00316)
Post*(13-32) 0.477***
(0.175)
Post*(33-47) 0.364**
(0.173)
Post*(48-62) 0.425**
(0.171)
Post*(>62) 0.687***
(0.178)
Nuke*post*(13-32) -0.0110***
(0.00356)
Nuke*post*33-47) -0.0117***
(0.00328)
Nuke*post*(48-62) -0.0138***
(0.00322)
Nuke*post*(>62) -0.0129***
(0.00363)
Post*environmentalist 0.598***
(0.157)
Post*non-environmentalist 0.385**
(0.154)
Nuke*post* environmental-ist
-0.0140***
(0.00306)
Nuke*post*non-environmentalist
-0.0117***
(0.00299)
Observations 123675 123675 123675 123675
R-squared 0.202 0.202 0.203 0.203
Dependent variable: life satisfaction (11-point scale). Method: least squares. Cluster-robust standard errors in parentheses. *p<0.1, **p<0.05, ***p<0.01. Regressions include micro controls (sex, age, mar-ital status, household size, employment status and household income), macro controls (GDP per capi-ta and the rates of unemployment and inflation) and country and quarter fixed effects.
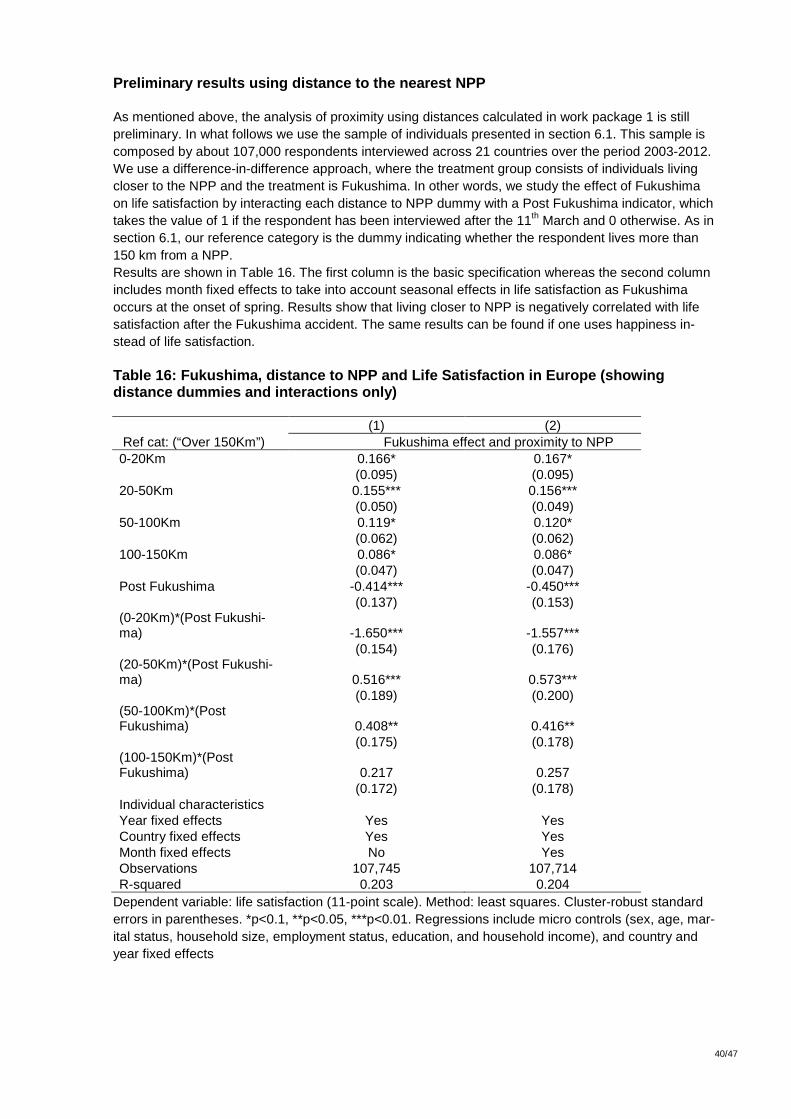
40/47
F:\SFOE_FinalReport_08July2014.docx
Preliminary results using distance to the nearest N PP
As mentioned above, the analysis of proximity using distances calculated in work package 1 is still preliminary. In what follows we use the sample of individuals presented in section 6.1. This sample is composed by about 107,000 respondents interviewed across 21 countries over the period 2003-2012. We use a difference-in-difference approach, where the treatment group consists of individuals living closer to the NPP and the treatment is Fukushima. In other words, we study the effect of Fukushima on life satisfaction by interacting each distance to NPP dummy with a Post Fukushima indicator, which takes the value of 1 if the respondent has been interviewed after the 11th March and 0 otherwise. As in section 6.1, our reference category is the dummy indicating whether the respondent lives more than 150 km from a NPP. Results are shown in Table 16. The first column is the basic specification whereas the second column includes month fixed effects to take into account seasonal effects in life satisfaction as Fukushima occurs at the onset of spring. Results show that living closer to NPP is negatively correlated with life satisfaction after the Fukushima accident. The same results can be found if one uses happiness in-stead of life satisfaction. Table 16: Fukushima, distance to NPP and Life Satis faction in Europe (showing distance dummies and interactions only)
(1) (2) Ref cat: (“Over 150Km”) Fukushima effect and proximity to NPP 0-20Km 0.166* 0.167* (0.095) (0.095) 20-50Km 0.155*** 0.156*** (0.050) (0.049) 50-100Km 0.119* 0.120* (0.062) (0.062) 100-150Km 0.086* 0.086* (0.047) (0.047) Post Fukushima -0.414*** -0.450*** (0.137) (0.153) (0-20Km)*(Post Fukushi-ma) -1.650*** -1.557*** (0.154) (0.176) (20-50Km)*(Post Fukushi-ma) 0.516*** 0.573*** (0.189) (0.200) (50-100Km)*(Post Fukushima) 0.408** 0.416** (0.175) (0.178) (100-150Km)*(Post Fukushima) 0.217 0.257 (0.172) (0.178) Individual characteristics Year fixed effects Yes Yes Country fixed effects Yes Yes Month fixed effects No Yes Observations 107,745 107,714 R-squared 0.203 0.204
Dependent variable: life satisfaction (11-point scale). Method: least squares. Cluster-robust standard errors in parentheses. *p<0.1, **p<0.05, ***p<0.01. Regressions include micro controls (sex, age, mar-ital status, household size, employment status, education, and household income), and country and year fixed effects
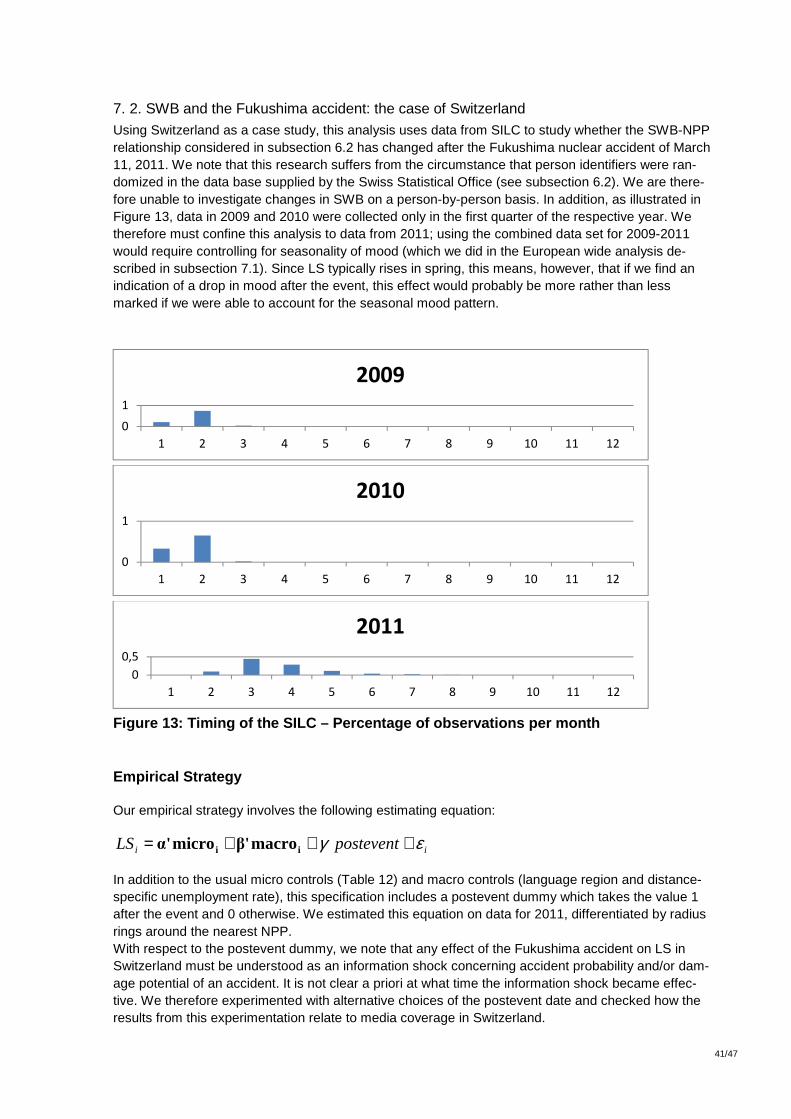
41/47
F:\SFOE_FinalReport_08July2014.docx
7. 2. SWB and the Fukushima accident: the case of Switzerland Using Switzerland as a case study, this analysis uses data from SILC to study whether the SWB-NPP relationship considered in subsection 6.2 has changed after the Fukushima nuclear accident of March 11, 2011. We note that this research suffers from the circumstance that person identifiers were ran-domized in the data base supplied by the Swiss Statistical Office (see subsection 6.2). We are there-fore unable to investigate changes in SWB on a person-by-person basis. In addition, as illustrated in Figure 13, data in 2009 and 2010 were collected only in the first quarter of the respective year. We therefore must confine this analysis to data from 2011; using the combined data set for 2009-2011 would require controlling for seasonality of mood (which we did in the European wide analysis de-scribed in subsection 7.1). Since LS typically rises in spring, this means, however, that if we find an indication of a drop in mood after the event, this effect would probably be more rather than less marked if we were able to account for the seasonal mood pattern.
Figure 13: Timing of the SILC – Percentage of obser vations per month
Empirical Strategy
Our empirical strategy involves the following estimating equation:
ii posteventLS εγ +++= ii macroβ'microα' In addition to the usual micro controls (Table 12) and macro controls (language region and distance-specific unemployment rate), this specification includes a postevent dummy which takes the value 1 after the event and 0 otherwise. We estimated this equation on data for 2011, differentiated by radius rings around the nearest NPP. With respect to the postevent dummy, we note that any effect of the Fukushima accident on LS in Switzerland must be understood as an information shock concerning accident probability and/or dam-age potential of an accident. It is not clear a priori at what time the information shock became effec-tive. We therefore experimented with alternative choices of the postevent date and checked how the results from this experimentation relate to media coverage in Switzerland.
0
1
1 2 3 4 5 6 7 8 9 10 11 12
2009
0
1
1 2 3 4 5 6 7 8 9 10 11 12
2010
0
0,5
1 2 3 4 5 6 7 8 9 10 11 12
2011
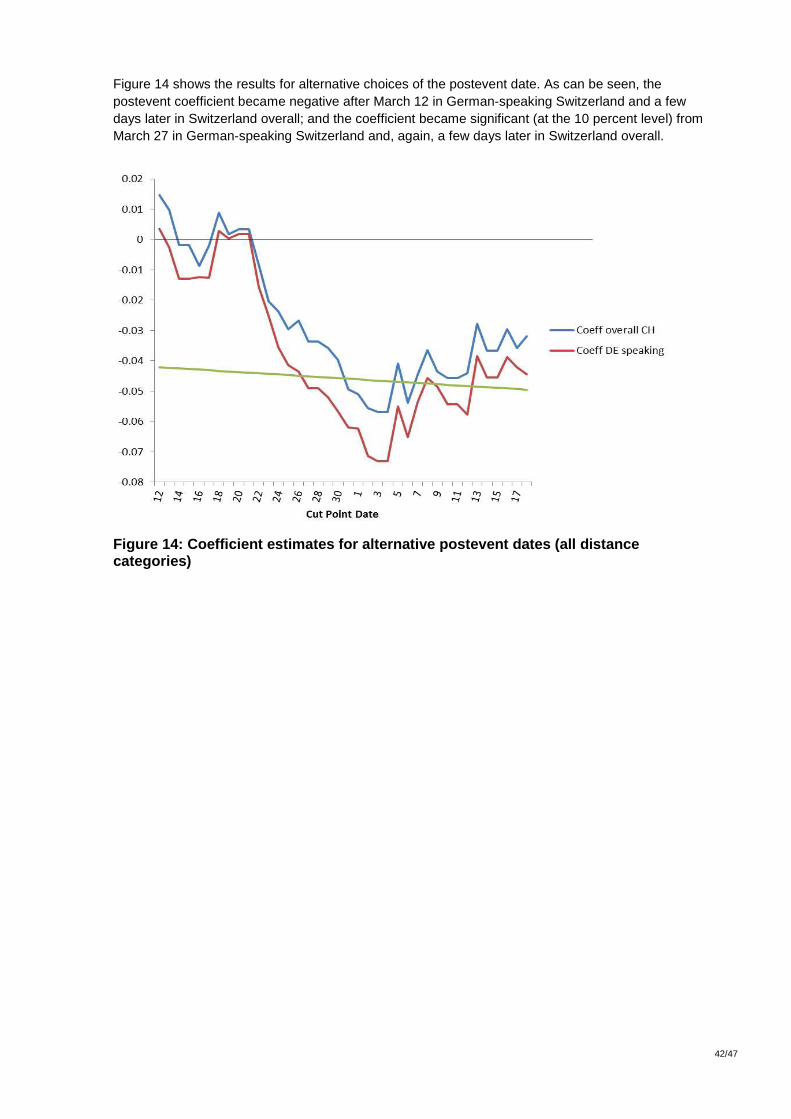
42/47
F:\SFOE_FinalReport_08July2014.docx
Figure 14 shows the results for alternative choices of the postevent date. As can be seen, the postevent coefficient became negative after March 12 in German-speaking Switzerland and a few days later in Switzerland overall; and the coefficient became significant (at the 10 percent level) from March 27 in German-speaking Switzerland and, again, a few days later in Switzerland overall.
Figure 14: Coefficient estimates for alternative postevent dates (all distance categories)
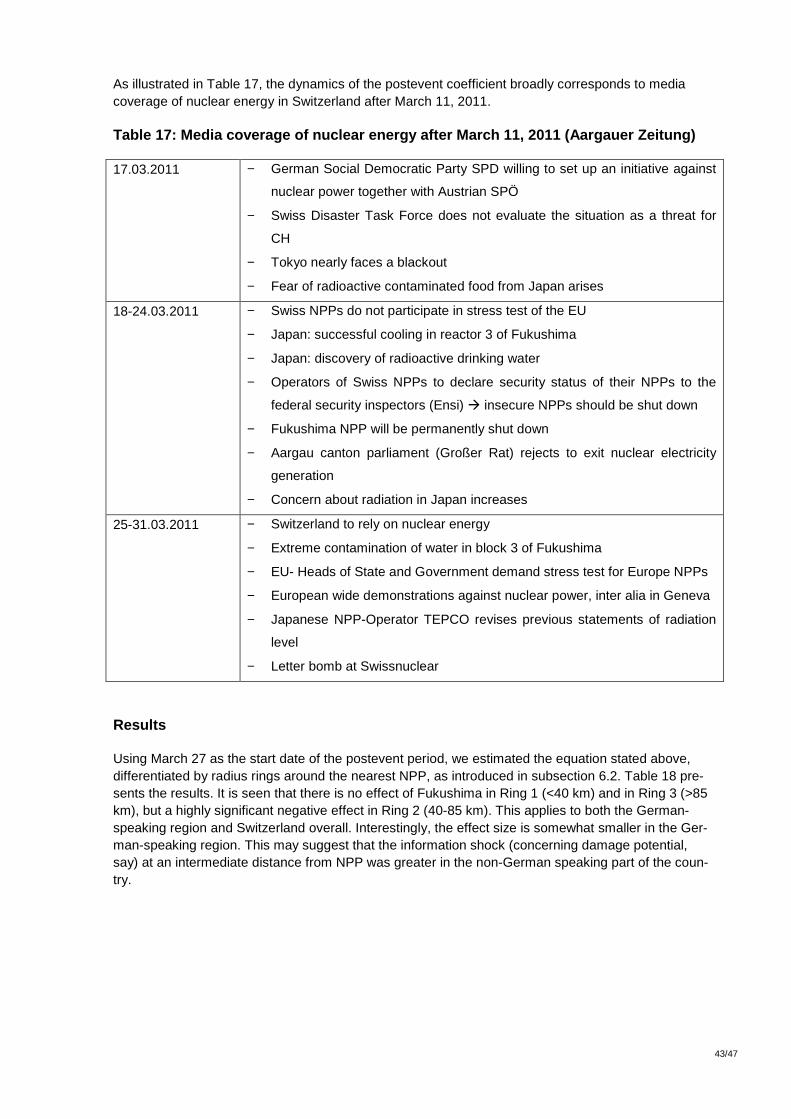
43/47
F:\SFOE_FinalReport_08July2014.docx
As illustrated in Table 17, the dynamics of the postevent coefficient broadly corresponds to media coverage of nuclear energy in Switzerland after March 11, 2011.
Table 17: Media coverage of nuclear energy after Ma rch 11, 2011 (Aargauer Zeitung)
17.03.2011 − German Social Democratic Party SPD willing to set up an initiative against
nuclear power together with Austrian SPÖ
− Swiss Disaster Task Force does not evaluate the situation as a threat for
CH
− Tokyo nearly faces a blackout
− Fear of radioactive contaminated food from Japan arises
18-24.03.2011 − Swiss NPPs do not participate in stress test of the EU
− Japan: successful cooling in reactor 3 of Fukushima
− Japan: discovery of radioactive drinking water
− Operators of Swiss NPPs to declare security status of their NPPs to the
federal security inspectors (Ensi) � insecure NPPs should be shut down
− Fukushima NPP will be permanently shut down
− Aargau canton parliament (Großer Rat) rejects to exit nuclear electricity
generation
− Concern about radiation in Japan increases
25-31.03.2011 − Switzerland to rely on nuclear energy
− Extreme contamination of water in block 3 of Fukushima
− EU- Heads of State and Government demand stress test for Europe NPPs
− European wide demonstrations against nuclear power, inter alia in Geneva
− Japanese NPP-Operator TEPCO revises previous statements of radiation
level
− Letter bomb at Swissnuclear
Results
Using March 27 as the start date of the postevent period, we estimated the equation stated above, differentiated by radius rings around the nearest NPP, as introduced in subsection 6.2. Table 18 pre-sents the results. It is seen that there is no effect of Fukushima in Ring 1 (<40 km) and in Ring 3 (>85 km), but a highly significant negative effect in Ring 2 (40-85 km). This applies to both the German-speaking region and Switzerland overall. Interestingly, the effect size is somewhat smaller in the Ger-man-speaking region. This may suggest that the information shock (concerning damage potential, say) at an intermediate distance from NPP was greater in the non-German speaking part of the coun-try.
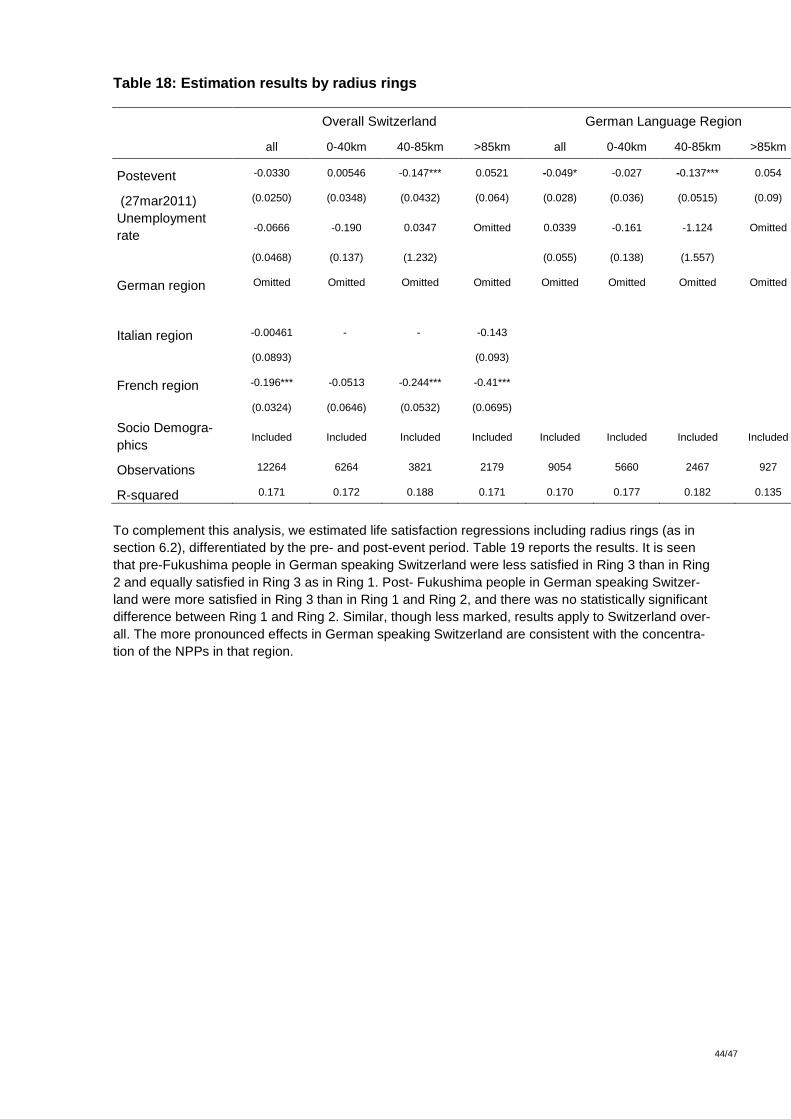
44/47
F:\SFOE_FinalReport_08July2014.docx
Table 18: Estimation results by radius rings
Overall Switzerland German Language Region
all 0-40km 40-85km >85km all 0-40km 40-85km >85km
Postevent -0.0330 0.00546 -0.147*** 0.0521 -0.049* -0.027 -0.137*** 0.054
(27mar2011) (0.0250) (0.0348) (0.0432) (0.064) (0.028) (0.036) (0.0515) (0.09)
Unemployment rate
-0.0666 -0.190 0.0347 Omitted 0.0339 -0.161 -1.124 Omitted
(0.0468) (0.137) (1.232) (0.055) (0.138) (1.557)
German region Omitted Omitted Omitted Omitted Omitted Omitted Omitted Omitted
Italian region -0.00461 - - -0.143
(0.0893) (0.093)
French region -0.196*** -0.0513 -0.244*** -0.41***
(0.0324) (0.0646) (0.0532) (0.0695)
Socio Demogra-phics
Included Included Included Included Included Included Included Included
Observations 12264 6264 3821 2179 9054 5660 2467 927
R-squared 0.171 0.172 0.188 0.171 0.170 0.177 0.182 0.135
To complement this analysis, we estimated life satisfaction regressions including radius rings (as in section 6.2), differentiated by the pre- and post-event period. Table 19 reports the results. It is seen that pre-Fukushima people in German speaking Switzerland were less satisfied in Ring 3 than in Ring 2 and equally satisfied in Ring 3 as in Ring 1. Post- Fukushima people in German speaking Switzer-land were more satisfied in Ring 3 than in Ring 1 and Ring 2, and there was no statistically significant difference between Ring 1 and Ring 2. Similar, though less marked, results apply to Switzerland over-all. The more pronounced effects in German speaking Switzerland are consistent with the concentra-tion of the NPPs in that region.
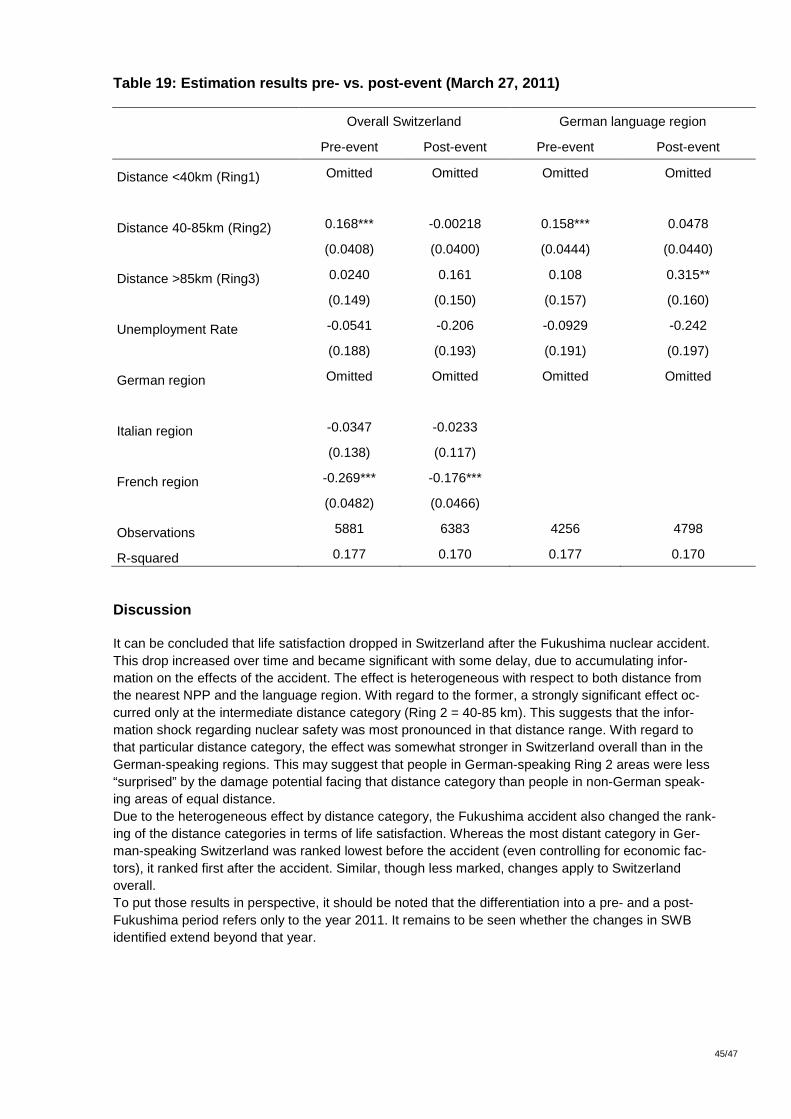
45/47
F:\SFOE_FinalReport_08July2014.docx
Table 19: Estimation results pre- vs. post-event (M arch 27, 2011)
Overall Switzerland German language region
Pre-event Post-event Pre-event Post-event
Distance <40km (Ring1) Omitted Omitted Omitted Omitted
Distance 40-85km (Ring2) 0.168*** -0.00218 0.158*** 0.0478
(0.0408) (0.0400) (0.0444) (0.0440)
Distance >85km (Ring3) 0.0240 0.161 0.108 0.315**
(0.149) (0.150) (0.157) (0.160)
Unemployment Rate -0.0541 -0.206 -0.0929 -0.242
(0.188) (0.193) (0.191) (0.197)
German region Omitted Omitted Omitted Omitted
Italian region -0.0347 -0.0233
(0.138) (0.117)
French region -0.269*** -0.176***
(0.0482) (0.0466)
Observations 5881 6383 4256 4798
R-squared 0.177 0.170 0.177 0.170
Discussion
It can be concluded that life satisfaction dropped in Switzerland after the Fukushima nuclear accident. This drop increased over time and became significant with some delay, due to accumulating infor-mation on the effects of the accident. The effect is heterogeneous with respect to both distance from the nearest NPP and the language region. With regard to the former, a strongly significant effect oc-curred only at the intermediate distance category (Ring 2 = 40-85 km). This suggests that the infor-mation shock regarding nuclear safety was most pronounced in that distance range. With regard to that particular distance category, the effect was somewhat stronger in Switzerland overall than in the German-speaking regions. This may suggest that people in German-speaking Ring 2 areas were less “surprised” by the damage potential facing that distance category than people in non-German speak-ing areas of equal distance. Due to the heterogeneous effect by distance category, the Fukushima accident also changed the rank-ing of the distance categories in terms of life satisfaction. Whereas the most distant category in Ger-man-speaking Switzerland was ranked lowest before the accident (even controlling for economic fac-tors), it ranked first after the accident. Similar, though less marked, changes apply to Switzerland overall. To put those results in perspective, it should be noted that the differentiation into a pre- and a post-Fukushima period refers only to the year 2011. It remains to be seen whether the changes in SWB identified extend beyond that year.
46/47
F:\SFOE_FinalReport_08July2014.docx
8. Dissemination
8.1 Deliverables The following deliverables were produced as part of the project’s dissemination strategy.
– „Electricity Supply Preferences in Europe: Evidence from Subjective Well-Being Data“ (Heinz Welsch & Philipp Bierman 2013), working paper, publicly available at http://ideas.repec.org/p/old/dpaper/359.html. The paper has been published in the journal Resource and Energy Economics 38 (2014), pp. 38-60. DOI information: 10.1016/j.reseneeco.2014.05.003.
– “Induced Transnational Preference Change: Fukushima and Nuclear Power in Europe” (Heinz Welsch & Philipp Biermann 2013), working paper, publicly available at http://ideas.repec.org/p/zen/wpaper/27.html. A short version of the paper: "Measuring Induced Preference Change: Fukushima and Nuclear Power in Europe“, has been invited to be revised and resubmitted at the journal Economics Letters.
– “Well-Being Effects of a Major Negative Externality: The Case of Fukushima” (Katrin Rehdanz, Heinz Welsch, Daiju Narita & Toshihiro Okubo 2013), working paper, publicly available at http://ideas.repec.org/p/kie/kieliw/1855.html. This paper has been invited to be revised and resubmitted at the Journal of Economic Behavior and Organization.
– “GIS Methodology in Determining Population Centers and Distances to Nuclear Power Plants“ (Tine Ningal & Finbarr Brereton 2013), technical report, publicly available at http://www.uni-oldenburg.de/energy-for-well-being/
– “Environment, Well-Being, and Experienced Preference” (Heinz Welsch & Susana Ferreira 2014), working paper, publicly available at http://ideas.repec.org/p/old/dpaper/367.html. This paper has been invited for publication in the International Review of Environmental and Resource Economics where it is currently under review.
– “Energy Prices, Energy Poverty, and Subjective Well-Being” (Heinz Welsch & Philipp Bierman 2014), mimeo.
8.2 Presentations
Preliminary results of the project were presented at the following events.
– Second Workshop in Applied Economics, Hanover, May 17, 2013.
– Annual Meeting of the Swiss Society for Economics and Statistics, Neuchatel, June 20-21, 2013.
– Energy 2013 Conference of the Center for European Economic Research (ZEW), June 24, 2013.
– Seminar: University College Dublin, June 8, 2013
– Poster Session at 15th workshop of GEE Student Chapter in Berlin, November 29, 2013.
– Panel discussion: The future of renewable energy and sustainability, Oldenburg, April 5, 2014.
– Energy 2014 Conference of the Center for European Economic Research (ZEW), May 5-6, 2014.
– Workshop "Energy, Environment, and Well-Being", Institute of Advanced Studies (HWK), Delmenhorst, June 5-6, 2014.
– Poster presentation at the World Conference of Environmental and Resource Economists (WCERE), Istanbul, June 28 - July 2, 2014.
8.3 Website
A project website has been created. It is accessible at http://www.uni-oldenburg.de/energy-for-well-being/.
47/47
F:\SFOE_FinalReport_08July2014.docx
References
Boardman, B. (1991), Fuel Poverty: From Cold Homes to Affordable Warmth, London: Belhaven Press.
Diener, E., Suh, E., Lucas, R., Smith, H. (1999), Subjective Well-Being: Three Decades of Progress, Psychological Bulletin 125, 276-302.
Dolan, P., Peasgood, T., White, M. (2008). “Do we really know what makes us happy? A review of the economic literature on the factors associated with subjective well-being”, Journal of Economic Psy-chology 29, 94-122.
Frey, B.S., Stutzer, A. (2002), What Can Economists Learn from Happiness Research?, Journal of Economic Literature 40(2), 402-435.
Hills, J. (2012), Getting the Measure of Fuel Poverty: Final report of the Fuel Poverty Review, Centre for Analysis of Social Exclusion, London.
Moore, R. (2012), Definitions of Fuel Poverty: Implications for Policy, Energy Policy 49, 27-32. Thomson, H, Snell, C. (2013), Quantifying the Prevalence of Fuel Poverty Across the European Union,
Energy Policy 52, 563-572.
Related Documents