Using Sensitive Plants as Bioindicators of Ground Level Ozone Pollution Implementation Guide Authors Irene Ladd, Education Co-PI, Surface Ozone Project, NASA Langley Research Center, VA Susan Sachs, Education Coordinator, Appalachian Highlands Science Learning Center, Great Smoky Mountains National Park, NC

Welcome message from author
This document is posted to help you gain knowledge. Please leave a comment to let me know what you think about it! Share it to your friends and learn new things together.
Transcript

1
Using Sensitive Plants as Bioindicators of Ground Level Ozone Pollution
Implementation Guide
AuthorsIrene Ladd, Education Co-PI, Surface Ozone Project, NASA Langley Research Center, VA
Susan Sachs, Education Coordinator, Appalachian Highlands Science Learning Center, Great Smoky Mountains National Park, NC

2
About the Authors
Dr.IreneLaddhasbeeninvolvedineducationalreformbothlocallyandstatewideforthepast25years.Sheisaretiredteacherof33yearsandservedonNewHampshire’sScienceCurriculumFrameworksCommittee.ShejoinedtheSurfaceOzoneMeasurementforGLOBE(SMOG)Teamtodevelopthesurfaceozoneprotocolandfieldtesttheinstrumentsusedformeasuringsurfaceozone.Shehasdevelopededucationalmaterialstointegratethestudyofsurfaceozonewithcorecurriculum,andthetrainingtoimplementtheprogram.Dr.Laddcontinuestoprovidetrainingnationallyandinternationallyandprovidingguidancetowardtheimplementationofinquiryintheclassroomthroughauthenticscienceandstudentresearch.ThecollaborationtoincorporatetheuseofozonesensitiveplantswiththeSurfaceOzoneProtocolisanaturalextensiontotakingsurfaceozonemeasurementsfortheGLOBE(GlobalLearningandObservationstoBenefittheEnvironment)Program.IrenewaseducatedatKeeneStateCollege,NH,UniversityofNH,andVanderbiltUniversity,TN.
SusanSachsisaNationalParkRangerandtheeducationcoordinatoroftheAppalachianHighlandsScienceLearningCenterlocatedinGreatSmokyMountainsNationalPark.Abigpartofherjobinvolvescreatingedu-cationalopportunitiesfromtheresearchthatoccursintheparksoftheAppalachianHighlandsmonitoringnet-work(besidesGreatSmokyMountainsNationalParkshecoversBigSouthForkNationalRiver&RecreationArea,ObedWildandScenicRiverandtheBlueRidgeParkway).Herpersonaleducationphilosophyisthatpeoplelearnbestwhentheyareinvolvedinlearningactivitiesthatarebothmeaningfulandrelevantsomanyoftheeducationprogramsathercenterinvolvestudents,teachersandothersincollectingdataforactualresearchprojects.Theozonebio-monitoringprojectisoneexampleofseveralcitizenscienceprojectsongoingattheAppalachianHighlandsScienceLearningCenter.SusanwaseducatedattheUniversityofMaryland,CollegeParkandhaslivedandworkedinNationalParksinWashington,DC,Alaska,Arizona,andCalifornia.SusancurrentlyresidesinthebiologicallydiversemountainsofNorthCarolina.
3
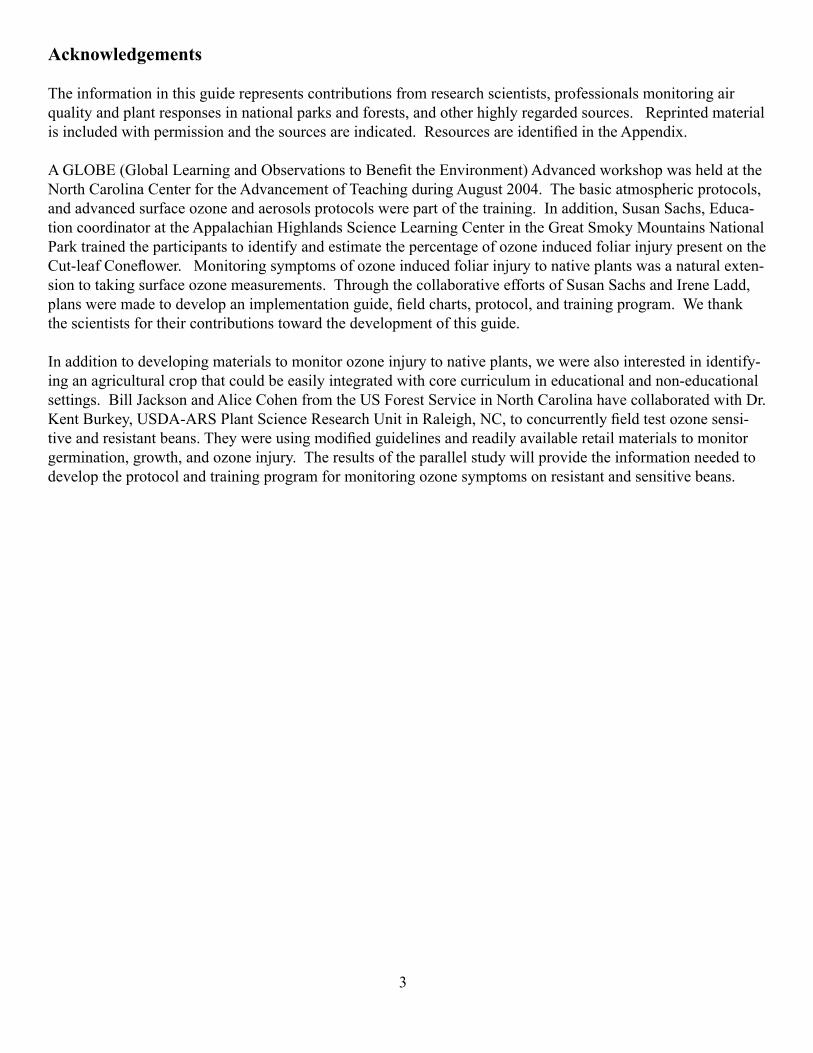
Acknowledgements
Theinformationinthisguiderepresentscontributionsfromresearchscientists,professionalsmonitoringairqualityandplantresponsesinnationalparksandforests,andotherhighlyregardedsources.Reprintedmaterialisincludedwithpermissionandthesourcesareindicated.ResourcesareidentifiedintheAppendix.
AGLOBE(GlobalLearningandObservationstoBenefittheEnvironment)AdvancedworkshopwasheldattheNorthCarolinaCenterfortheAdvancementofTeachingduringAugust2004.Thebasicatmosphericprotocols,andadvancedsurfaceozoneandaerosolsprotocolswerepartofthetraining.Inaddition,SusanSachs,Educa-tioncoordinatorattheAppalachianHighlandsScienceLearningCenterintheGreatSmokyMountainsNationalParktrainedtheparticipantstoidentifyandestimatethepercentageofozoneinducedfoliarinjurypresentontheCut-leafConeflower.Monitoringsymptomsofozoneinducedfoliarinjurytonativeplantswasanaturalexten-siontotakingsurfaceozonemeasurements.ThroughthecollaborativeeffortsofSusanSachsandIreneLadd,plansweremadetodevelopanimplementationguide,fieldcharts,protocol,andtrainingprogram.Wethankthescientistsfortheircontributionstowardthedevelopmentofthisguide.
Inadditiontodevelopingmaterialstomonitorozoneinjurytonativeplants,wewerealsointerestedinidentify-inganagriculturalcropthatcouldbeeasilyintegratedwithcorecurriculumineducationalandnon-educationalsettings.BillJacksonandAliceCohenfromtheUSForestServiceinNorthCarolinahavecollaboratedwithDr.KentBurkey,USDA-ARSPlantScienceResearchUnitinRaleigh,NC,toconcurrentlyfieldtestozonesensi-tiveandresistantbeans.Theywereusingmodifiedguidelinesandreadilyavailableretailmaterialstomonitorgermination,growth,andozoneinjury.Theresultsoftheparallelstudywillprovidetheinformationneededtodeveloptheprotocolandtrainingprogramformonitoringozonesymptomsonresistantandsensitivebeans.
4
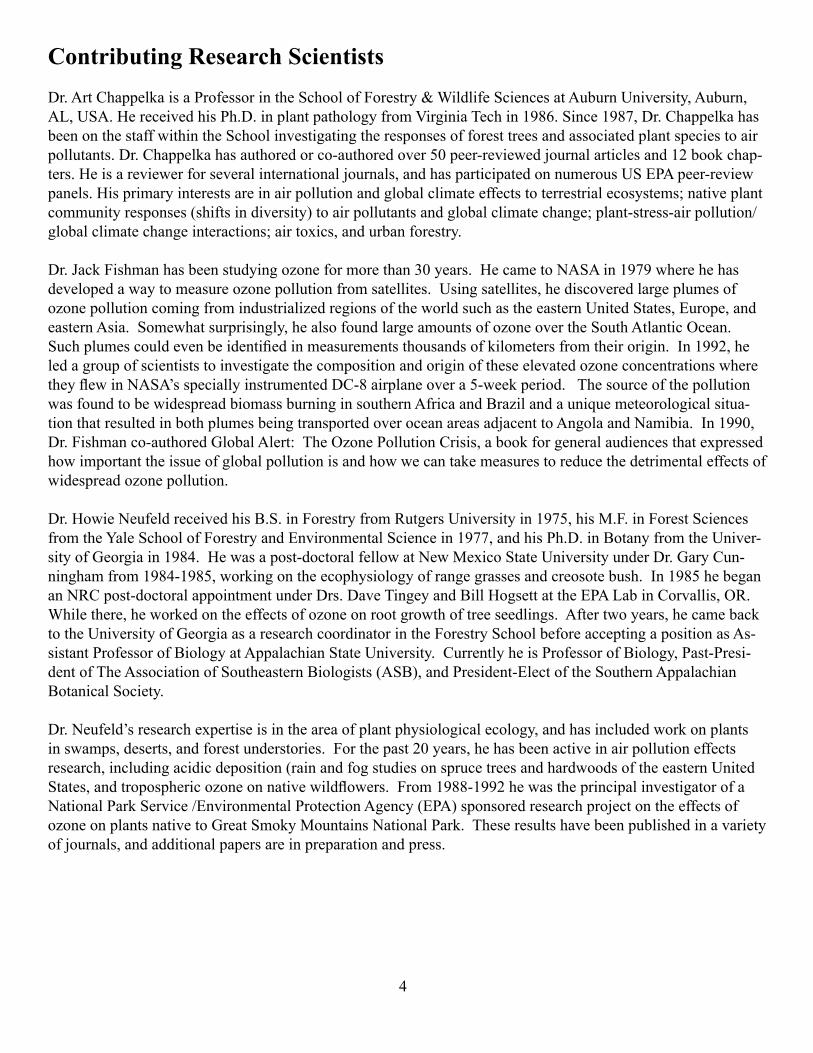
Contributing Research ScientistsDr.ArtChappelkaisaProfessorintheSchoolofForestry&WildlifeSciencesatAuburnUniversity,Auburn,AL,USA.HereceivedhisPh.D.inplantpathologyfromVirginiaTechin1986.Since1987,Dr.ChappelkahasbeenonthestaffwithintheSchoolinvestigatingtheresponsesofforesttreesandassociatedplantspeciestoairpollutants.Dr.Chappelkahasauthoredorco-authoredover50peer-reviewedjournalarticlesand12bookchap-ters.Heisareviewerforseveralinternationaljournals,andhasparticipatedonnumerousUSEPApeer-reviewpanels.Hisprimaryinterestsareinairpollutionandglobalclimateeffectstoterrestrialecosystems;nativeplantcommunityresponses(shiftsindiversity)toairpollutantsandglobalclimatechange;plant-stress-airpollution/globalclimatechangeinteractions;airtoxics,andurbanforestry.
Dr.JackFishmanhasbeenstudyingozoneformorethan30years.HecametoNASAin1979wherehehasdevelopedawaytomeasureozonepollutionfromsatellites.Usingsatellites,hediscoveredlargeplumesofozonepollutioncomingfromindustrializedregionsoftheworldsuchastheeasternUnitedStates,Europe,andeasternAsia.Somewhatsurprisingly,healsofoundlargeamountsofozoneovertheSouthAtlanticOcean.Suchplumescouldevenbeidentifiedinmeasurementsthousandsofkilometersfromtheirorigin.In1992,heledagroupofscientiststoinvestigatethecompositionandoriginoftheseelevatedozoneconcentrationswheretheyflewinNASA’sspeciallyinstrumentedDC-8airplaneovera5-weekperiod.ThesourceofthepollutionwasfoundtobewidespreadbiomassburninginsouthernAfricaandBrazilandauniquemeteorologicalsitua-tionthatresultedinbothplumesbeingtransportedoveroceanareasadjacenttoAngolaandNamibia.In1990,Dr.Fishmanco-authoredGlobalAlert:TheOzonePollutionCrisis,abookforgeneralaudiencesthatexpressedhowimportanttheissueofglobalpollutionisandhowwecantakemeasurestoreducethedetrimentaleffectsofwidespreadozonepollution.
Dr.HowieNeufeldreceivedhisB.S.inForestryfromRutgersUniversityin1975,hisM.F.inForestSciencesfromtheYaleSchoolofForestryandEnvironmentalSciencein1977,andhisPh.D.inBotanyfromtheUniver-sityofGeorgiain1984.Hewasapost-doctoralfellowatNewMexicoStateUniversityunderDr.GaryCun-ninghamfrom1984-1985,workingontheecophysiologyofrangegrassesandcreosotebush.In1985hebegananNRCpost-doctoralappointmentunderDrs.DaveTingeyandBillHogsettattheEPALabinCorvallis,OR.Whilethere,heworkedontheeffectsofozoneonrootgrowthoftreeseedlings.Aftertwoyears,hecamebacktotheUniversityofGeorgiaasaresearchcoordinatorintheForestrySchoolbeforeacceptingapositionasAs-sistantProfessorofBiologyatAppalachianStateUniversity.CurrentlyheisProfessorofBiology,Past-Presi-dentofTheAssociationofSoutheasternBiologists(ASB),andPresident-ElectoftheSouthernAppalachianBotanicalSociety.
Dr.Neufeld’sresearchexpertiseisintheareaofplantphysiologicalecology,andhasincludedworkonplantsinswamps,deserts,andforestunderstories.Forthepast20years,hehasbeenactiveinairpollutioneffectsresearch,includingacidicdeposition(rainandfogstudiesonsprucetreesandhardwoodsoftheeasternUnitedStates,andtroposphericozoneonnativewildflowers.From1988-1992hewastheprincipalinvestigatorofaNationalParkService/EnvironmentalProtectionAgency(EPA)sponsoredresearchprojectontheeffectsofozoneonplantsnativetoGreatSmokyMountainsNationalPark.Theseresultshavebeenpublishedinavarietyofjournals,andadditionalpapersareinpreparationandpress.

5
Dr.MargaretPippinisaResearchScientistinAtmosphericSciencesatNASALangleyResearchCenter.Mar-garetcametoLangleyin2001aftercompletingpost-doctoralresearchatWesternMichiganUniversity,whereshespecializedinmakingmeasurementsoforganicnitratesattheUniversityofMichiganBiologicalStation.Shecomesfromabackgroundofbothmodelingandfieldmeasurements,withanemphasisondataanalysis.Sheisinterestedintheanalysisofobservationaldatasetstobetterunderstandthechemistryoftheatmospherewithaparticularinterestinthechemistryofbiogenichydrocarbonsandtheirozoneproductionpotential.Mar-garethasbeenactiveinscienceeducationforovertwentyyearsandenjoysworkingwithstudentsofallages.
Dr.PippinhasspentthepastseveralyearsimprovingthequalityoftheGLOBEsurfaceozonemeasurements.Shehasperformedextensivelaboratorytestingtodeterminetherelationshipbetweentheabsorbance(colorchange)oftheEco-Badgetestcardsandtheozoneconcentration,andthedependenceofthiscolorchangeupontemperatureandhumidity.MargaretisalsoinvolvedinGLOBEteachertrainingfortheSurfaceOzoneProtocolandoftenvisitsGLOBEschoolstodiscussatmosphericscienceandmethodsofanalysiswiththestudents.
Dr.JohnM.SkellyisRetired’04,ProfessorEmeritusPlantPathologyfromtheDepartmentofPlantPathology,PennsylvaniaStateUniversity.BSForestry’62;MS’64andPh.D’68,PlantPathologyPennState.HetaughtatVirginiaTech1968-82;andreturnedtoPennState1982-2004.Hisexpertiseinforestpathologywithspecial-izationinairpollutioncausedeffectstoforesttreesandnativeplantswithinNorthTemperateregions.JohnhasbeeninvolvedinwritingtheCriteriaDocumentsfortheUSE.P.A.andasaconsultanttotheU.S.Dept.OfJus-ticeandtheUnitedNationsondiagnosingairpollutioncausedinjurytoplants.Internationalcooperativeproj-ectshavebeenheldwithcolleaguesinCanada,Mexico,Switzerland,Spain,Germany,andItaly.
Contributing Research Scientists
6
Organization of this guideThisguideisdesignedasaresourceandfieldmanualtoimplementtheobservationandrecordingofozonein-ducedfoliarinjurytoCut-leafconeflower(Rudbeckialaciniata)andCommonmilkweed(Asclepiassyriaca).
Section Iprovidesbackgroundinformationontheformationofozoneairpollutionandtheimportanceofunderstandingthetransportpatternsoflocal,regionalandgloballevelsofozoneairpollutionanditsimpactonvegetationasitistransportedfromurbanindustrialcenterstomoreruralandforesteddownwindregions.
Section IIprovidesageneralintroductiontothecharacteristicsofozone’sinducedfoliarinjurytotheleavesofbroadleafspeciesandtheprocessesusedtoidentifyozonesensitiveplants.Theguidealsodescribesthescien-tificprocessesusedtoidentifyozone-inducedfoliarsymptomsonplantsintheenvironmentandincontrolledopentopchambers.
Section IIIdescribesmethodstobeusedinsettingupabioindicatorgardenfordetectingozone-inducedinju-ries,andtheprotocolforgatheringandsubmittingdataonCut-leafconeflower(Rudbeckialacinata),andCom-monmilkweed(Asclepiassyriaca)totheHandsontheLandWebsite,hosttotheinteractivedatabase.
7
Using Sensitive Plants as Bioindicators of Ozone Air Pollution
Table of Contents
SectionI: FormationofSurfaceOzoneAirPollution IntroductiontoOzone QualityofAir OzonePollutionCycle InfluenceofWeatheronOzoneFormationandEpisodicEvents
SectionII: InvestigatingFoliarInjuryonOzoneSensitivePlants OzoneAirPollutionisHarmfultoHumans StudiesofOzone-sensitivePlants FumigationStudies
SectionIII: OzoneBioindicatorGarden BackgroundInformation OzoneMeasurementsandPlantObservations Planningthe“Ozone”Garden OrganizingthePlantsforStudy PreparingtoObserve TrainingtoAssessFoliarInjury RegisteringYourSite EnteringData RetrievingData LookingAtData AretheDatareasonable? WhatDoPeopleLookforinTheseData AnExampleofaStudentResearchInvestigation IntroductiontoLessonPlans LeafGame O3SkillsWorksheet RatingOzone-InducedFoliarInjuryonOzone-sensitivePlants SiteDefinition SiteDefinitionWorksheet FieldInstruction RatingOzoneInjury InjuryGuideforMilkweed DataSheets OzoneGardenFieldGuide WebSites References
888810
12121516
191919202021222222232424252730313234363738384243485456
8
Introduction to Ozone Formation
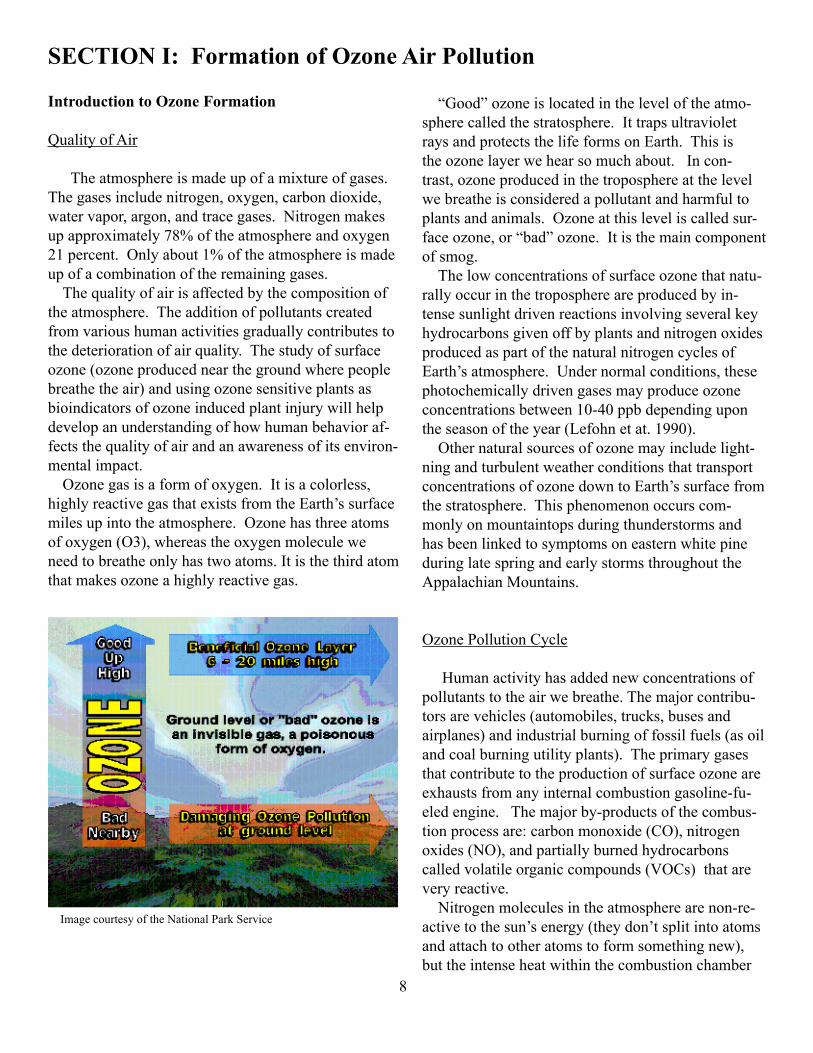
QualityofAir Theatmosphereismadeupofamixtureofgases.Thegasesincludenitrogen,oxygen,carbondioxide,watervapor,argon,andtracegases.Nitrogenmakesupapproximately78%oftheatmosphereandoxygen21percent.Onlyabout1%oftheatmosphereismadeupofacombinationoftheremaininggases. Thequalityofairisaffectedbythecompositionoftheatmosphere.Theadditionofpollutantscreatedfromvarioushumanactivitiesgraduallycontributestothedeteriorationofairquality.Thestudyofsurfaceozone(ozoneproducednearthegroundwherepeoplebreathetheair)andusingozonesensitiveplantsasbioindicatorsofozoneinducedplantinjurywillhelpdevelopanunderstandingofhowhumanbehavioraf-fectsthequalityofairandanawarenessofitsenviron-mentalimpact. Ozonegasisaformofoxygen.Itisacolorless,highlyreactivegasthatexistsfromtheEarth’ssurfacemilesupintotheatmosphere.Ozonehasthreeatomsofoxygen(O3),whereastheoxygenmoleculeweneedtobreatheonlyhastwoatoms.Itisthethirdatomthatmakesozoneahighlyreactivegas.
“Good”ozoneislocatedintheleveloftheatmo-spherecalledthestratosphere.IttrapsultravioletraysandprotectsthelifeformsonEarth.Thisistheozonelayerwehearsomuchabout.Incon-trast,ozoneproducedinthetroposphereatthelevelwebreatheisconsideredapollutantandharmfultoplantsandanimals.Ozoneatthisleveliscalledsur-faceozone,or“bad”ozone.Itisthemaincomponentofsmog. Thelowconcentrationsofsurfaceozonethatnatu-rallyoccurinthetroposphereareproducedbyin-tensesunlightdrivenreactionsinvolvingseveralkeyhydrocarbonsgivenoffbyplantsandnitrogenoxidesproducedaspartofthenaturalnitrogencyclesofEarth’satmosphere.Undernormalconditions,thesephotochemicallydrivengasesmayproduceozoneconcentrationsbetween10-40ppbdependingupontheseasonoftheyear(Lefohnetat.1990). Othernaturalsourcesofozonemayincludelight-ningandturbulentweatherconditionsthattransportconcentrationsofozonedowntoEarth’ssurfacefromthestratosphere.Thisphenomenonoccurscom-monlyonmountaintopsduringthunderstormsandhasbeenlinkedtosymptomsoneasternwhitepineduringlatespringandearlystormsthroughouttheAppalachianMountains.
OzonePollutionCycle
Humanactivityhasaddednewconcentrationsofpollutantstotheairwebreathe.Themajorcontribu-torsarevehicles(automobiles,trucks,busesandairplanes)andindustrialburningoffossilfuels(asoilandcoalburningutilityplants).Theprimarygasesthatcontributetotheproductionofsurfaceozoneareexhaustsfromanyinternalcombustiongasoline-fu-eledengine.Themajorby-productsofthecombus-tionprocessare:carbonmonoxide(CO),nitrogenoxides(NO),andpartiallyburnedhydrocarbonscalledvolatileorganiccompounds(VOCs)thatareveryreactive. Nitrogenmoleculesintheatmospherearenon-re-activetothesun’senergy(theydon’tsplitintoatomsandattachtootheratomstoformsomethingnew),buttheintenseheatwithinthecombustionchamber
SECTION I: Formation of Ozone Air Pollution
ImagecourtesyoftheNationalParkService
9
causesthenitrogenmoleculestosplitintotwonitro-genatoms.Thesesplitnitrogenatomslinkupwithoxygenatomsandformabyproductcallednitrogenoxide(NO). Theairtakenintotheenginecombineswiththegasoline(hydrocarbons)beforeenteringthecombus-tioncylinders.Iftherewerecompletecombustion,asthehydrocarbonorgasmoleculesigniteandsplitandproduceenergyintheengine,thebyproductswouldbecarbondioxide(CO2)andwatervapor.However,completecombustiondoesnotoccurandsomehydro-carbonsremainasVOCs.
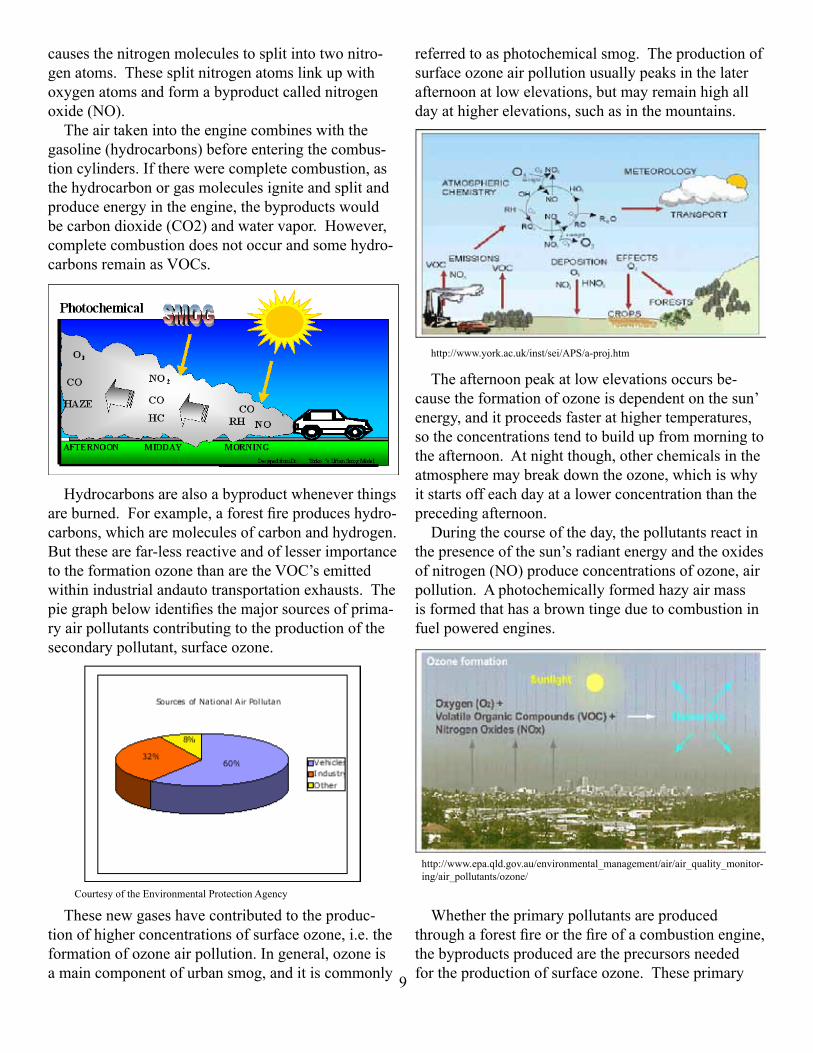
Hydrocarbonsarealsoabyproductwheneverthingsareburned.Forexample,aforestfireproduceshydro-carbons,whicharemoleculesofcarbonandhydrogen.Butthesearefar-lessreactiveandoflesserimportancetotheformationozonethanaretheVOC’semittedwithinindustrialandautotransportationexhausts.Thepiegraphbelowidentifiesthemajorsourcesofprima-ryairpollutantscontributingtotheproductionofthesecondarypollutant,surfaceozone.
Thesenewgaseshavecontributedtotheproduc-tionofhigherconcentrationsofsurfaceozone,i.e.theformationofozoneairpollution.Ingeneral,ozoneisamaincomponentofurbansmog,anditiscommonly
CourtesyoftheEnvironmentalProtectionAgency
referredtoasphotochemicalsmog.Theproductionofsurfaceozoneairpollutionusuallypeaksinthelaterafternoonatlowelevations,butmayremainhighalldayathigherelevations,suchasinthemountains.
Theafternoonpeakatlowelevationsoccursbe-causetheformationofozoneisdependentonthesun’energy,anditproceedsfasterathighertemperatures,sotheconcentrationstendtobuildupfrommorningtotheafternoon.Atnightthough,otherchemicalsintheatmospheremaybreakdowntheozone,whichiswhyitstartsoffeachdayatalowerconcentrationthantheprecedingafternoon. Duringthecourseoftheday,thepollutantsreactinthepresenceofthesun’sradiantenergyandtheoxidesofnitrogen(NO)produceconcentrationsofozone,airpollution.Aphotochemicallyformedhazyairmassisformedthathasabrowntingeduetocombustioninfuelpoweredengines.
Whethertheprimarypollutantsareproducedthroughaforestfireorthefireofacombustionengine,thebyproductsproducedaretheprecursorsneededfortheproductionofsurfaceozone.Theseprimary
http://www.york.ac.uk/inst/sei/APS/a-proj.htm
http://www.epa.qld.gov.au/environmental_management/air/air_quality_monitor-ing/air_pollutants/ozone/
10
pollutantsreactwiththeenergyofthesuntoproduceasecondarypollutant,surfaceozone. SurfaceconcentrationsofozoneairpollutionbegintoincreaseseasonallyfromAprilthroughSeptemberintheeasternregionsoftheUnitedStates.Thisisthetimeperiodofincreasedamountsofsunlight,highertemperatures,andcommonlyoccurringstagnatinghigh-pressuresystems(BurmudaHighs)overvastregionsoftheMidwestandMid-AtlanticStates.Un-dertheseatmosphericconditionsozoneairpollutionreachesitshighestlevelsduringthehottestandmostsunlitmonthsoftheyear.Dependinguponweatherpatterns,theconcentrationsofozoneairpollutionthoughusuallyhigherinthesummer,canvaryyeartoyear.Forexample,duringthehot,dryyearsofthemid-tolate1990s,ozonereachedrecordlevelsintheGreatSmokyMountainsNationalPark,butin2004,awetandcoolyear,ozonelevelsweregreatlyreduced.Theamountofozoneformedeachyearishighlydependentonweatherconditions,andlesssoonvariationsinpollutantemission,whicharerelativelyconstantfromyeartoyear.
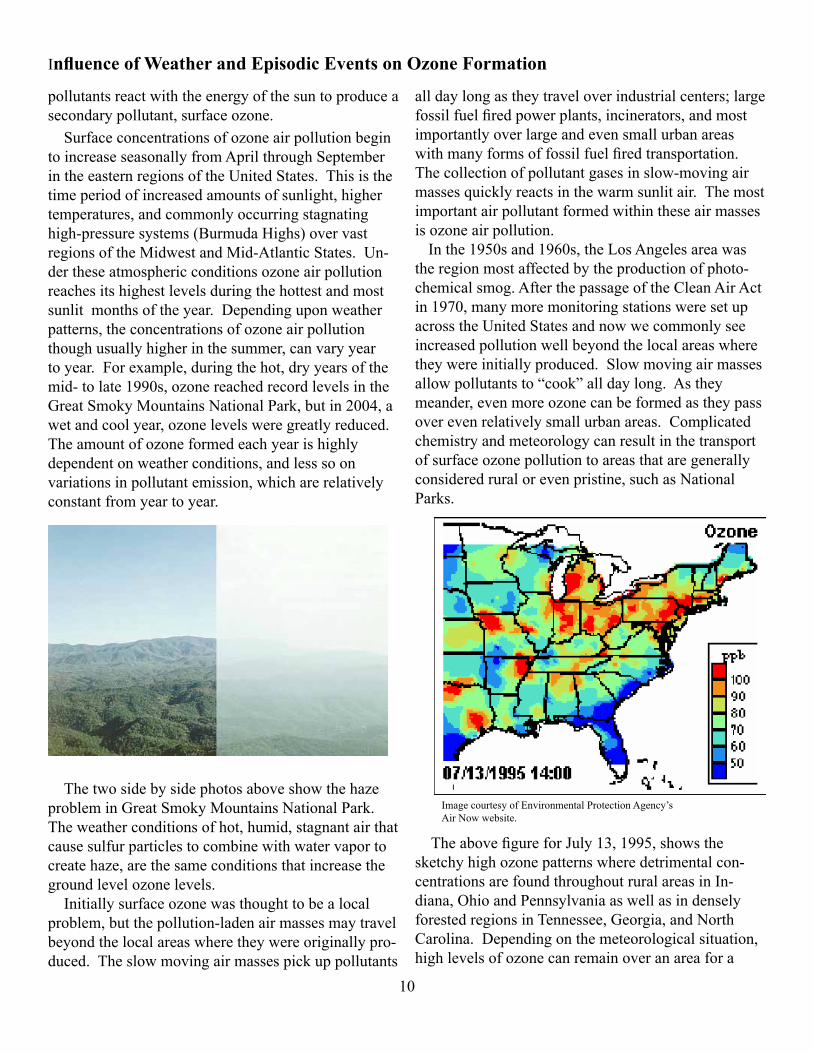
ThetwosidebysidephotosaboveshowthehazeprobleminGreatSmokyMountainsNationalPark.Theweatherconditionsofhot,humid,stagnantairthatcausesulfurparticlestocombinewithwatervaportocreatehaze,arethesameconditionsthatincreasethegroundlevelozonelevels. Initiallysurfaceozonewasthoughttobealocalproblem,butthepollution-ladenairmassesmaytravelbeyondthelocalareaswheretheywereoriginallypro-duced.Theslowmovingairmassespickuppollutants
Influence of Weather and Episodic Events on Ozone Formation
alldaylongastheytraveloverindustrialcenters;largefossilfuelfiredpowerplants,incinerators,andmostimportantlyoverlargeandevensmallurbanareaswithmanyformsoffossilfuelfiredtransportation.Thecollectionofpollutantgasesinslow-movingairmassesquicklyreactsinthewarmsunlitair.Themostimportantairpollutantformedwithintheseairmassesisozoneairpollution. Inthe1950sand1960s,theLosAngelesareawastheregionmostaffectedbytheproductionofphoto-chemicalsmog.AfterthepassageoftheCleanAirActin1970,manymoremonitoringstationsweresetupacrosstheUnitedStatesandnowwecommonlyseeincreasedpollutionwellbeyondthelocalareaswheretheywereinitiallyproduced.Slowmovingairmassesallowpollutantsto“cook”alldaylong.Astheymeander,evenmoreozonecanbeformedastheypassoverevenrelativelysmallurbanareas.Complicatedchemistryandmeteorologycanresultinthetransportofsurfaceozonepollutiontoareasthataregenerallyconsideredruralorevenpristine,suchasNationalParks.
TheabovefigureforJuly13,1995,showsthesketchyhighozonepatternswheredetrimentalcon-centrationsarefoundthroughoutruralareasinIn-diana,OhioandPennsylvaniaaswellasindenselyforestedregionsinTennessee,Georgia,andNorthCarolina.Dependingonthemeteorologicalsituation,highlevelsofozonecanremainoveranareafora
ImagecourtesyofEnvironmentalProtectionAgency’sAirNowwebsite.

11
periodoftimeandplantswillbeexposedtoozoneairpollution. Slowmovinghigh-pressureairmassesarecommonoccurrencesintheeasternUnitedStates.Theseairmassestransportsignificantconcentrationsofozoneairpollutiontotheplantcommunitiesofmountainous,forested,andruralareasdownwindoftheindustrialurbanareas.
ThemapaboveisasatelliteimagethatidentifiesthelocationofindustrialemissionsintheU.S..Duetothecontinuingphotochemicallydrivenprocessesastheairmassslowlymovesdownwind,thesemoreremoteareasoftenhavegreaterozoneexposuresforlongerperiodsoftime.Ifthehighairpressuremassstag-natesandremainsoveranareaforaperiodoftime,
LocationofIndustrialEmissionsinU.S.derivedfromasatellite.Itistheclimatologyfortheyear2003.
thepollutioncanbuildupandexposeplantstomoreseverelevelsofozone. Althoughsomecontrolshavebeenimplementedthathavehelpedtodecreasethelevelofprimarypol-lutantgasesenteringtheatmospherethatcontributetotheproductionofozoneairpollution,thelargeincreaseinthenumbersofvehiclesandtheincreaseinthemilesdrivenhaveoffsetmanyofthegainsthathavebeenmadethroughtheimplementationofpol-lutioncontrols.NewsatelliteinstrumentscannowmapozonepollutionandtheglobaldepictionaboveshowsthathighozoneconcentrationsarenotuniquetotheeasternU.S.orCalifornia.Inthesummertime,evenhigherconcentrationsarenowfoundoverChinaandIndia,wherepollutioncontrolsarenotasrigidasintheU.S.Furthermore,scientistsalsobelievethatemissionsfromtheseregionswillcontinuetogrowasthesecountriescontinuetodevelop.
12
SECTION II: Investigation of Ozone Injury Induced Foliar Injury to PlantsSurface Ozone is Harmful
OzoneAirPollutionisHarmfultoHumans Highconcentrationsofozoneairpollutionareharmfultobothanimalsandplants.Concernforairqualityisreflectedmostduringhotsummerdaysas“ozonealertdays”orsomeotherphraseisusedtowarnchildrenandtheelderlytorestrictoutsideactiv-ityduetothelikelihoodofhigherexposurestoozone.Why?Becauseexposuretoelevatedconcentrationsofsurfaceozoneoverextendedperiodsoftimecauseshealthproblems.Itdamagestheimmunesystem’sdefensesmakingonesusceptibletolunginfections.Ozonecausesacuterespiratoryirritation,breathingproblems,andaggravatesasthma.Thepollutantde-creaseslungcapacityby15%toover20%.Thisisbe-causeozone“sunburns”yourlungs.Ozonedamagesthecellsthatlinetheairspacesinthelung. Withinafewdays,thedamagedcellsarereplacedandtheoldcellsareshed-muchinthewaythatskinpeelsafterasunburn.Ifthiskindofdamageoccursrepeat-edly,thelungmaychangepermanentlyinawaythatcouldcauselong-termhealtheffectsandalowerqual-ityoflife.Childrenareatgreatestriskfromsurfaceozoneexposure,becausetheyspendmoretimeout-sideinvolvedinvigorousactivitiesandhaveagreaterdemandforintakeofair.Theirrespiratorysystemsaredevelopingandaremostsusceptibletopermanentdamage.Theelderlyarealsomoresensitivetozonebecausetheirimmunesystemisnotasgoodasitusedtobe.Formoreinformation,visittheEPAwebsiteandviewtheirpublicationcalled“WhatYouNeedtoKnowAboutOzoneandYourHealth”athttp://www.airnow.gov/index.cfm?action=health2.smog1#3
Thephotosaboveshowahealthylungairway(left)andaninflamedlungairway(right).Ozonecaninflamethelung’slin-ing,andrepeatedepisodesofinflammationmaycauseperma-nentchangesinthelung.(EPAphotosfrom“WhatYouNeedtoKnowAboutOzoneandYourHealth”)
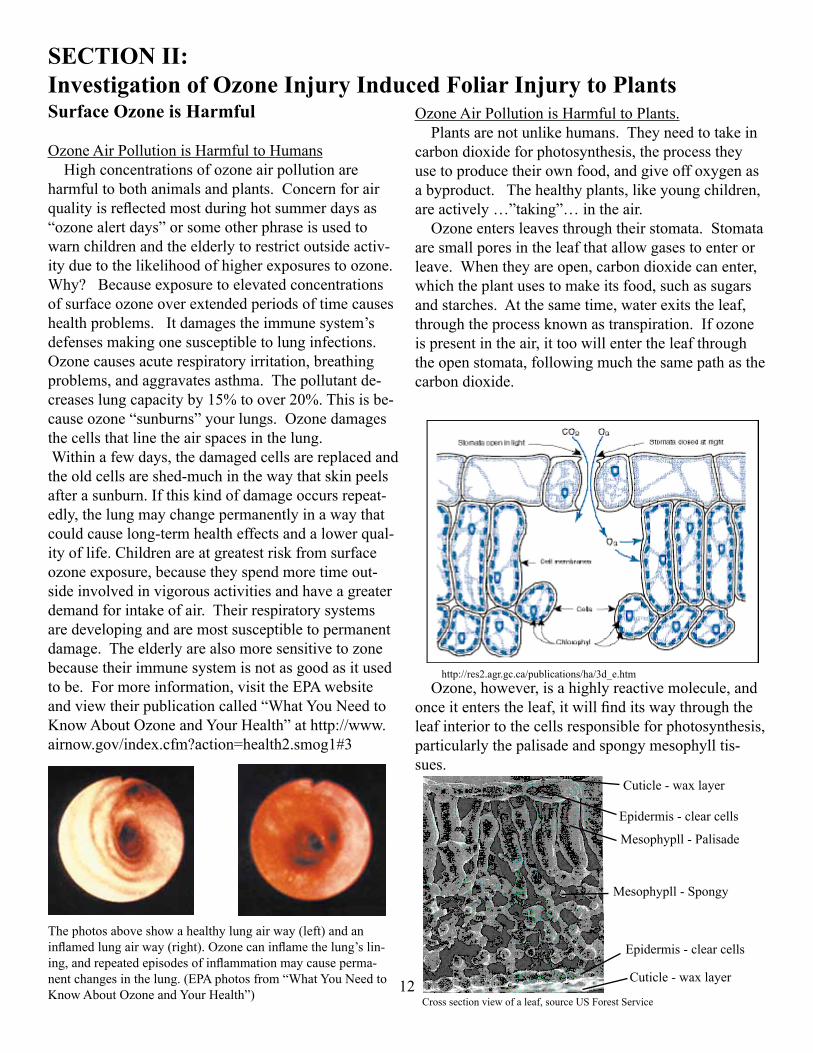
OzoneAirPollutionisHarmfultoPlants. Plantsarenotunlikehumans.Theyneedtotakeincarbondioxideforphotosynthesis,theprocesstheyusetoproducetheirownfood,andgiveoffoxygenasabyproduct.Thehealthyplants,likeyoungchildren,areactively…”taking”…intheair. Ozoneentersleavesthroughtheirstomata.Stomataaresmallporesintheleafthatallowgasestoenterorleave.Whentheyareopen,carbondioxidecanenter,whichtheplantusestomakeitsfood,suchassugarsandstarches.Atthesametime,waterexitstheleaf,throughtheprocessknownastranspiration.Ifozoneispresentintheair,ittoowillentertheleafthroughtheopenstomata,followingmuchthesamepathasthecarbondioxide.
Ozone,however,isahighlyreactivemolecule,andonceitenterstheleaf,itwillfinditswaythroughtheleafinteriortothecellsresponsibleforphotosynthesis,particularlythepalisadeandspongymesophylltis-sues.
http://res2.agr.gc.ca/publications/ha/3d_e.htm
Cuticle-waxlayer
Epidermis-clearcells
Mesophypll-Palisade
Mesophypll-Spongy
Epidermis-clearcells
Cuticle-waxlayer
Crosssectionviewofaleaf,sourceUSForestService
13
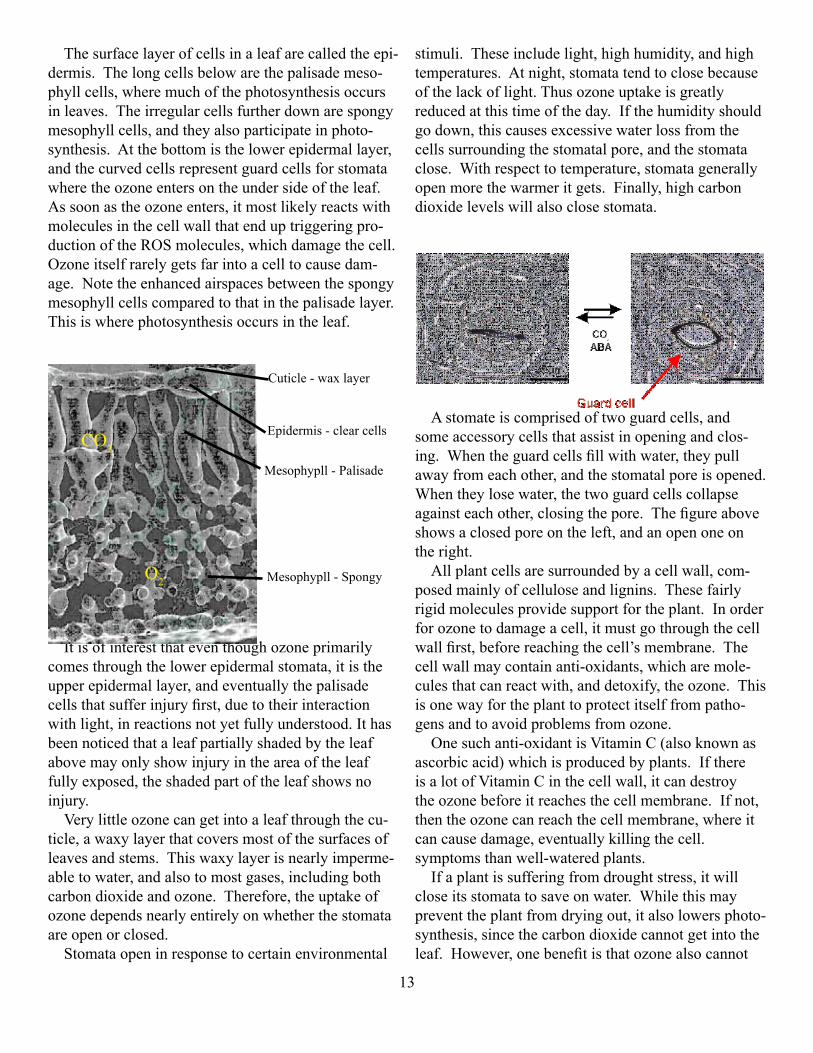
Thesurfacelayerofcellsinaleafarecalledtheepi-dermis.Thelongcellsbelowarethepalisademeso-phyllcells,wheremuchofthephotosynthesisoccursinleaves.Theirregularcellsfurtherdownarespongymesophyllcells,andtheyalsoparticipateinphoto-synthesis.Atthebottomisthelowerepidermallayer,andthecurvedcellsrepresentguardcellsforstomatawheretheozoneentersontheundersideoftheleaf.Assoonastheozoneenters,itmostlikelyreactswithmoleculesinthecellwallthatenduptriggeringpro-ductionoftheROSmolecules,whichdamagethecell.Ozoneitselfrarelygetsfarintoacelltocausedam-age.Notetheenhancedairspacesbetweenthespongymesophyllcellscomparedtothatinthepalisadelayer.Thisiswherephotosynthesisoccursintheleaf.
Itisofinterestthateventhoughozoneprimarilycomesthroughthelowerepidermalstomata,itistheupperepidermallayer,andeventuallythepalisadecellsthatsufferinjuryfirst,duetotheirinteractionwithlight,inreactionsnotyetfullyunderstood.Ithasbeennoticedthataleafpartiallyshadedbytheleafabovemayonlyshowinjuryintheareaoftheleaffullyexposed,theshadedpartoftheleafshowsnoinjury. Verylittleozonecangetintoaleafthroughthecu-ticle,awaxylayerthatcoversmostofthesurfacesofleavesandstems.Thiswaxylayerisnearlyimperme-abletowater,andalsotomostgases,includingbothcarbondioxideandozone.Therefore,theuptakeofozonedependsnearlyentirelyonwhetherthestomataareopenorclosed. Stomataopeninresponsetocertainenvironmental
CO2
O2
Cuticle-waxlayer
Epidermis-clearcells
Mesophypll-Palisade
Mesophypll-Spongy
stimuli.Theseincludelight,highhumidity,andhightemperatures.Atnight,stomatatendtoclosebecauseofthelackoflight.Thusozoneuptakeisgreatlyreducedatthistimeoftheday.Ifthehumidityshouldgodown,thiscausesexcessivewaterlossfromthecellssurroundingthestomatalpore,andthestomataclose.Withrespecttotemperature,stomatagenerallyopenmorethewarmeritgets.Finally,highcarbondioxidelevelswillalsoclosestomata.
Astomateiscomprisedoftwoguardcells,andsomeaccessorycellsthatassistinopeningandclos-ing.Whentheguardcellsfillwithwater,theypullawayfromeachother,andthestomatalporeisopened.Whentheylosewater,thetwoguardcellscollapseagainsteachother,closingthepore.Thefigureaboveshowsaclosedporeontheleft,andanopenoneontheright. Allplantcellsaresurroundedbyacellwall,com-posedmainlyofcelluloseandlignins.Thesefairlyrigidmoleculesprovidesupportfortheplant.Inorderforozonetodamageacell,itmustgothroughthecellwallfirst,beforereachingthecell’smembrane.Thecellwallmaycontainanti-oxidants,whicharemole-culesthatcanreactwith,anddetoxify,theozone.Thisisonewayfortheplanttoprotectitselffrompatho-gensandtoavoidproblemsfromozone. Onesuchanti-oxidantisVitaminC(alsoknownasascorbicacid)whichisproducedbyplants.IfthereisalotofVitaminCinthecellwall,itcandestroytheozonebeforeitreachesthecellmembrane.Ifnot,thentheozonecanreachthecellmembrane,whereitcancausedamage,eventuallykillingthecell.symptomsthanwell-wateredplants. Ifaplantissufferingfromdroughtstress,itwillcloseitsstomatatosaveonwater.Whilethismaypreventtheplantfromdryingout,italsolowersphoto-synthesis,sincethecarbondioxidecannotgetintotheleaf.However,onebenefitisthatozonealsocannot
14
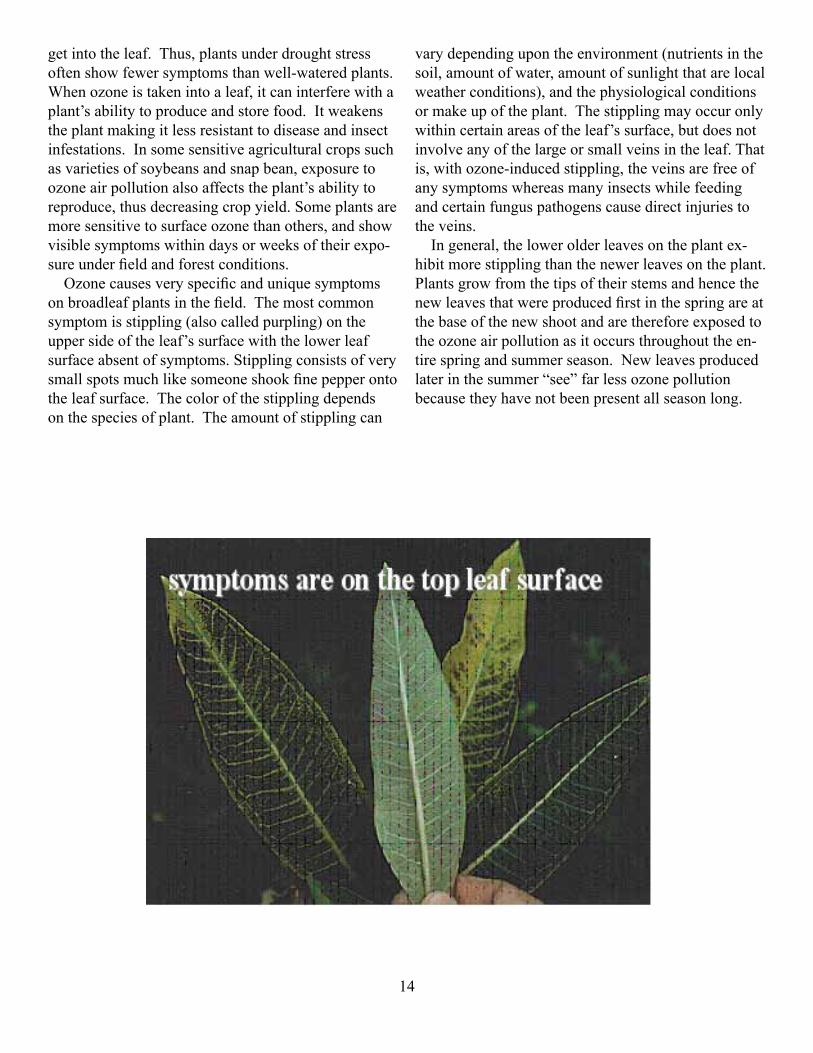
getintotheleaf.Thus,plantsunderdroughtstressoftenshowfewersymptomsthanwell-wateredplants.Whenozoneistakenintoaleaf,itcaninterferewithaplant’sabilitytoproduceandstorefood.Itweakenstheplantmakingitlessresistanttodiseaseandinsectinfestations.Insomesensitiveagriculturalcropssuchasvarietiesofsoybeansandsnapbean,exposuretoozoneairpollutionalsoaffectstheplant’sabilitytoreproduce,thusdecreasingcropyield.Someplantsaremoresensitivetosurfaceozonethanothers,andshowvisiblesymptomswithindaysorweeksoftheirexpo-sureunderfieldandforestconditions. Ozonecausesveryspecificanduniquesymptomsonbroadleafplantsinthefield.Themostcommonsymptomisstippling(alsocalledpurpling)ontheuppersideoftheleaf’ssurfacewiththelowerleafsurfaceabsentofsymptoms.Stipplingconsistsofverysmallspotsmuchlikesomeoneshookfinepepperontotheleafsurface.Thecolorofthestipplingdependsonthespeciesofplant.Theamountofstipplingcan
varydependingupontheenvironment(nutrientsinthesoil,amountofwater,amountofsunlightthatarelocalweatherconditions),andthephysiologicalconditionsormakeupoftheplant.Thestipplingmayoccuronlywithincertainareasoftheleaf’ssurface,butdoesnotinvolveanyofthelargeorsmallveinsintheleaf.Thatis,withozone-inducedstippling,theveinsarefreeofanysymptomswhereasmanyinsectswhilefeedingandcertainfunguspathogenscausedirectinjuriestotheveins. Ingeneral,thelowerolderleavesontheplantex-hibitmorestipplingthanthenewerleavesontheplant.Plantsgrowfromthetipsoftheirstemsandhencethenewleavesthatwereproducedfirstinthespringareatthebaseofthenewshootandarethereforeexposedtotheozoneairpollutionasitoccursthroughouttheen-tirespringandsummerseason.Newleavesproducedlaterinthesummer“see”farlessozonepollutionbecausetheyhavenotbeenpresentallseasonlong.
15
Studies of Ozone-Sensitive Plants
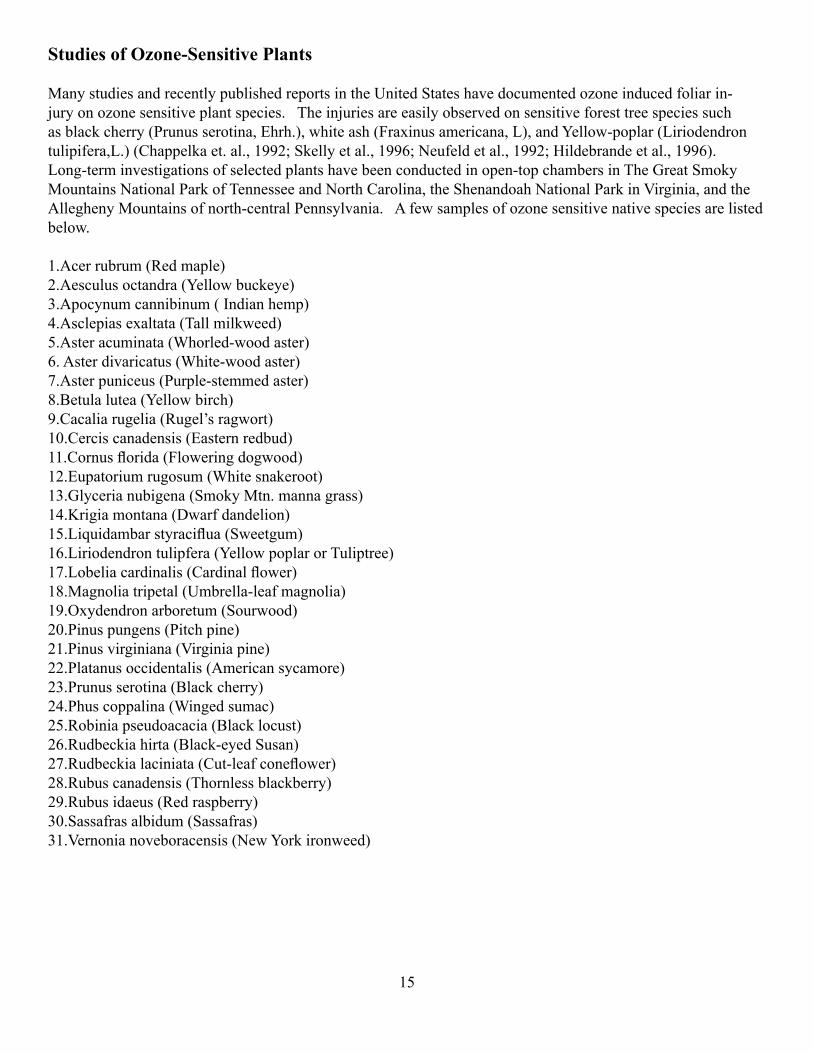
ManystudiesandrecentlypublishedreportsintheUnitedStateshavedocumentedozoneinducedfoliarin-juryonozonesensitiveplantspecies.Theinjuriesareeasilyobservedonsensitiveforesttreespeciessuchasblackcherry(Prunusserotina,Ehrh.),whiteash(Fraxinusamericana,L),andYellow-poplar(Liriodendrontulipifera,L.)(Chappelkaet.al.,1992;Skellyetal.,1996;Neufeldetal.,1992;Hildebrandeetal.,1996).Long-terminvestigationsofselectedplantshavebeenconductedinopen-topchambersinTheGreatSmokyMountainsNationalParkofTennesseeandNorthCarolina,theShenandoahNationalParkinVirginia,andtheAlleghenyMountainsofnorth-centralPennsylvania.Afewsamplesofozonesensitivenativespeciesarelistedbelow. 1.Acerrubrum(Redmaple)2.Aesculusoctandra(Yellowbuckeye)3.Apocynumcannibinum(Indianhemp)4.Asclepiasexaltata(Tallmilkweed)5.Asteracuminata(Whorled-woodaster)6.Asterdivaricatus(White-woodaster)7.Asterpuniceus(Purple-stemmedaster)8.Betulalutea(Yellowbirch)9.Cacaliarugelia(Rugel’sragwort)10.Cerciscanadensis(Easternredbud)11.Cornusflorida(Floweringdogwood)12.Eupatoriumrugosum(Whitesnakeroot)13.Glycerianubigena(SmokyMtn.mannagrass)14.Krigiamontana(Dwarfdandelion)15.Liquidambarstyraciflua(Sweetgum)16.Liriodendrontulipfera(YellowpoplarorTuliptree)17.Lobeliacardinalis(Cardinalflower)18.Magnoliatripetal(Umbrella-leafmagnolia)19.Oxydendronarboretum(Sourwood)20.Pinuspungens(Pitchpine)21.Pinusvirginiana(Virginiapine)22.Platanusoccidentalis(Americansycamore)23.Prunusserotina(Blackcherry)24.Phuscoppalina(Wingedsumac)25.Robiniapseudoacacia(Blacklocust)26.Rudbeckiahirta(Black-eyedSusan)27.Rudbeckialaciniata(Cut-leafconeflower)28.Rubuscanadensis(Thornlessblackberry)29.Rubusidaeus(Redraspberry)30.Sassafrasalbidum(Sassafras)31.Vernonianoveboracensis(NewYorkironweed)
16
Using Ozone Sensitive Plants as Bioindicators of Ozone InjuryTheuseofbiologicalindicatorstodetectthepresenceofozoneinjurytoplantsisalongstandingandeffec-tivemethodology.Abioindicatorcanbedefinedasavascularornon-vascularplantexhibitingatypicalandverifiableresponsewhenexposedtoaplantstresssuchasozone.Tobeconsideredagoodindicatorspeciesplantsmust:1)exhibitadistinct,verifiedresponse,2)havefewornoconfoundingdiseaseorpestproblems,and3)exhibitgeneticstability. Thesesensitiveplantscanbeusedtodetectthepresenceofozoneataspecificlocationorregion,andprovideuniqueinformationregardingambientairqualityinaparticulararea.Plantindicatorsofozoneinjurycanbeeitherintroduced(BelW3tobaccoforexample)ornative(CommonmilkweedandCut-leafconeflower).Indicatorspeciesaremosteffectivewhenrelatedtoambientozoneconditions.
Fumigation Experiments
Commonmilkweed(Asclepiassyriaca)CommonmilkweedisanativeperennialfoundthroughouttheeasternhalfoftheUnitedStates,ex-ceptalongsomeareasoftheGulfCoast.Thespeciesspreadsnaturallybyseedandfromlongundergroundrhizomes.DuringtheozoneseasonintheBlueRidgeMountainsofVirginia,Commonmilkweedswereobservedtodeveloppurplestippling(adiscreteandveryfinepurplecoloredspotsoftheupperleafsur-facesoftheolderleaves)andeventualoverallchlo-rosis(theyellowingoftheleafcausedbythelossofchlorophyllneededforphotosynthesis).Thequestionraisedwas:Issurfaceozoneresponsibleforthefoliar(plant)injury?Astudywasdevelopedtodeterminewhetherlong-rangetransportedozoneairpollutionintototheBlueRidgeMountainsandtheShenan-doahNationalParkwasresponsiblefortheobservedsymptoms.Eleven-week-oldmilkweedplantswererandomlyplacedintochambersandexposedtooneofthreefollowingozonelevels:0.00ppb,50ppb,and150ppbforsixhoursadayforsevendays.Withinthefumigationchambersthetemperaturerangedfrom20o-27oCandtherelativehumiditybetween70%-80%.Foliarsymptomsdevelopedontheupperleafsurfacesofmilkweedplantsinthechamberswithin2-5daysaftertheywerefumigatedwith(exposedto)thediffer-entlevelsofozone.
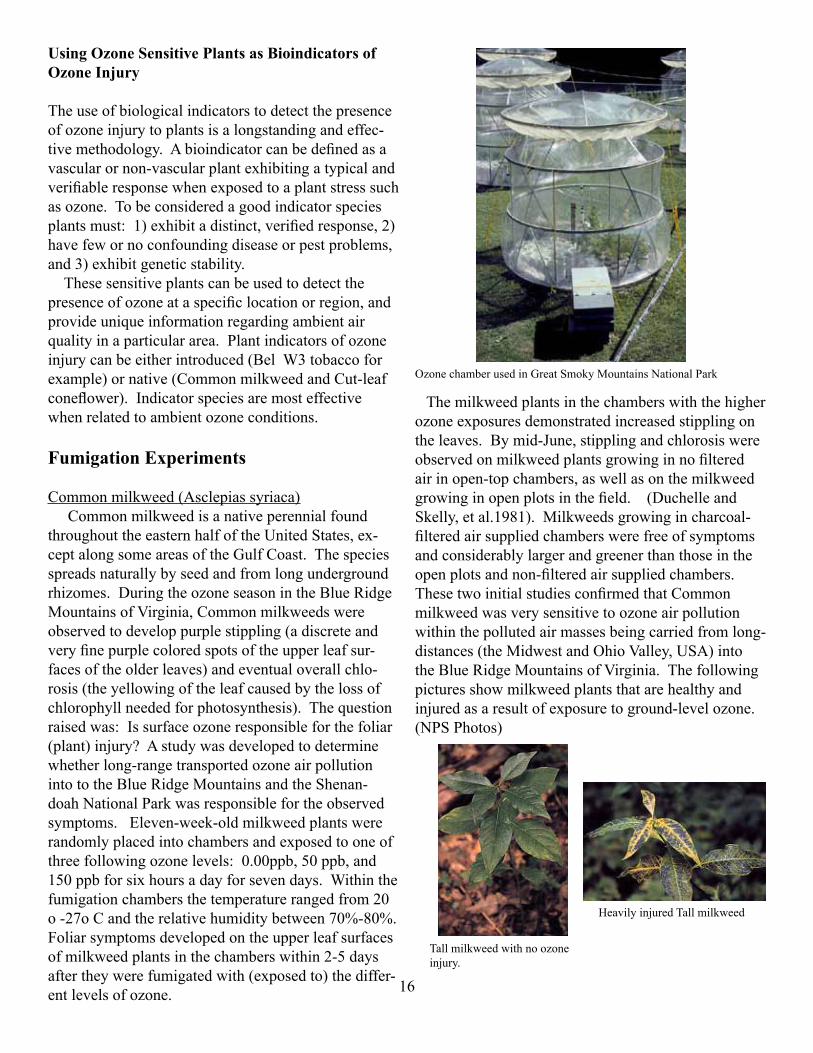
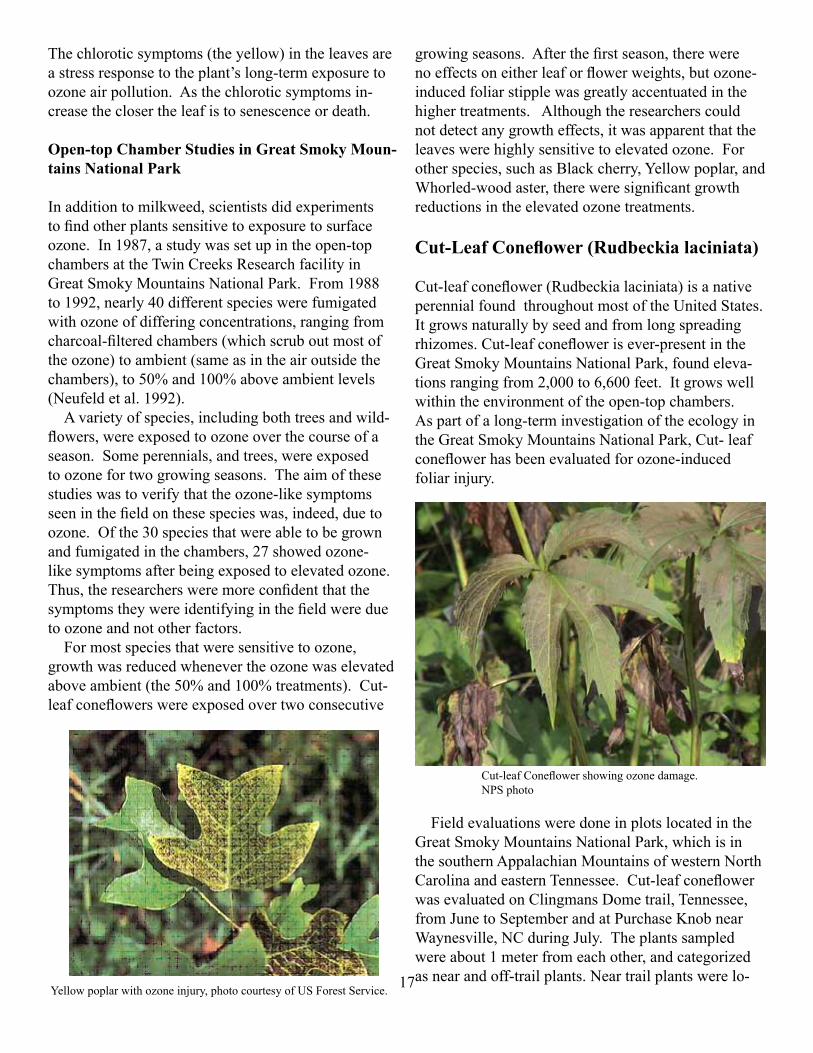
Themilkweedplantsinthechamberswiththehigherozoneexposuresdemonstratedincreasedstipplingontheleaves.Bymid-June,stipplingandchlorosiswereobservedonmilkweedplantsgrowinginnofilteredairinopen-topchambers,aswellasonthemilkweedgrowinginopenplotsinthefield.(DuchelleandSkelly,etal.1981).Milkweedsgrowingincharcoal-filteredairsuppliedchamberswerefreeofsymptomsandconsiderablylargerandgreenerthanthoseintheopenplotsandnon-filteredairsuppliedchambers.ThesetwoinitialstudiesconfirmedthatCommonmilkweedwasverysensitivetoozoneairpollutionwithinthepollutedairmassesbeingcarriedfromlong-distances(theMidwestandOhioValley,USA)intotheBlueRidgeMountainsofVirginia.Thefollowingpicturesshowmilkweedplantsthatarehealthyandinjuredasaresultofexposuretoground-levelozone.(NPSPhotos)
OzonechamberusedinGreatSmokyMountainsNationalPark
Tallmilkweedwithnoozoneinjury.
HeavilyinjuredTallmilkweed
17
Thechloroticsymptoms(theyellow)intheleavesareastressresponsetotheplant’slong-termexposuretoozoneairpollution.Asthechloroticsymptomsin-creasetheclosertheleafistosenescenceordeath.
Open-top Chamber Studies in Great Smoky Moun-tains National ParkInadditiontomilkweed,scientistsdidexperimentstofindotherplantssensitivetoexposuretosurfaceozone.In1987,astudywassetupintheopen-topchambersattheTwinCreeksResearchfacilityinGreatSmokyMountainsNationalPark.From1988to1992,nearly40differentspecieswerefumigatedwithozoneofdifferingconcentrations,rangingfromcharcoal-filteredchambers(whichscruboutmostoftheozone)toambient(sameasintheairoutsidethechambers),to50%and100%aboveambientlevels(Neufeldetal.1992). Avarietyofspecies,includingbothtreesandwild-flowers,wereexposedtoozoneoverthecourseofaseason.Someperennials,andtrees,wereexposedtoozonefortwogrowingseasons.Theaimofthesestudieswastoverifythattheozone-likesymptomsseeninthefieldonthesespecieswas,indeed,duetoozone.Ofthe30speciesthatwereabletobegrownandfumigatedinthechambers,27showedozone-likesymptomsafterbeingexposedtoelevatedozone.Thus,theresearchersweremoreconfidentthatthesymptomstheywereidentifyinginthefieldwereduetoozoneandnototherfactors. Formostspeciesthatweresensitivetoozone,growthwasreducedwhenevertheozonewaselevatedaboveambient(the50%and100%treatments).Cut-leafconeflowerswereexposedovertwoconsecutive
growingseasons.Afterthefirstseason,therewerenoeffectsoneitherleaforflowerweights,butozone-inducedfoliarstipplewasgreatlyaccentuatedinthehighertreatments.Althoughtheresearcherscouldnotdetectanygrowtheffects,itwasapparentthattheleaveswerehighlysensitivetoelevatedozone.Forotherspecies,suchasBlackcherry,Yellowpoplar,andWhorled-woodaster,thereweresignificantgrowthreductionsintheelevatedozonetreatments.
Cut-Leaf Coneflower (Rudbeckia laciniata)
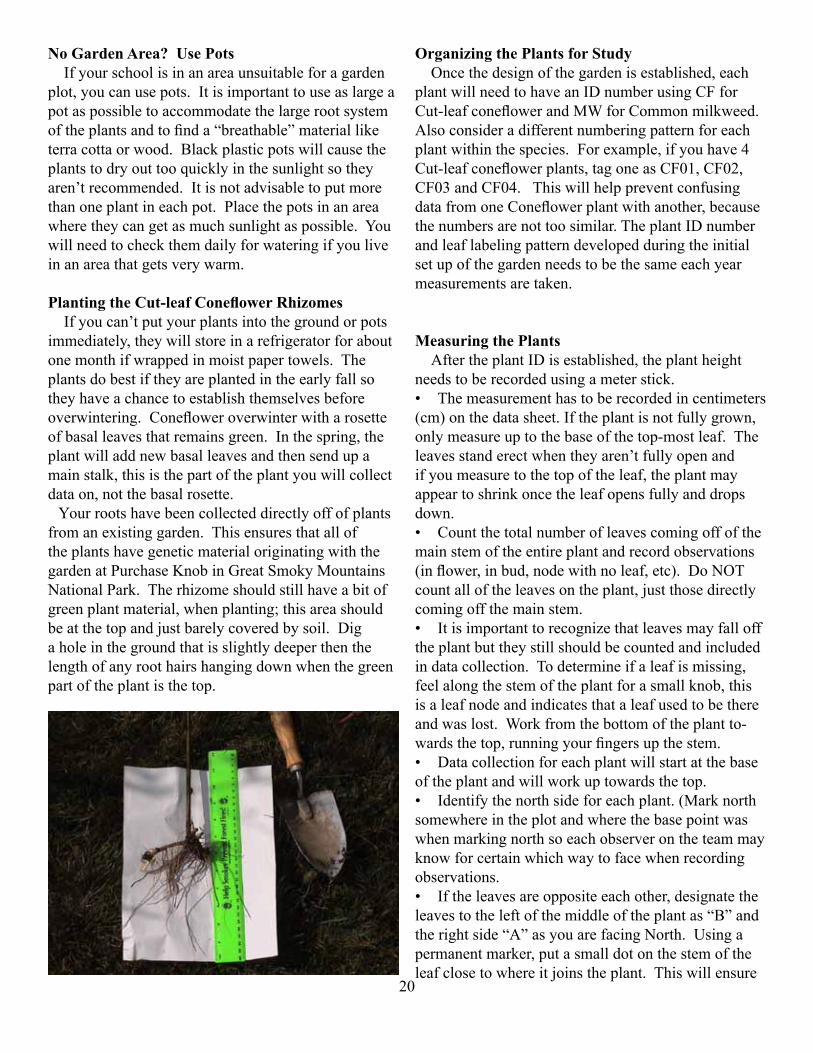
Cut-leafconeflower(Rudbeckialaciniata)isanativeperennialfoundthroughoutmostoftheUnitedStates.Itgrowsnaturallybyseedandfromlongspreadingrhizomes.Cut-leafconeflowerisever-presentintheGreatSmokyMountainsNationalPark,foundeleva-tionsrangingfrom2,000to6,600feet.Itgrowswellwithintheenvironmentoftheopen-topchambers.Aspartofalong-terminvestigationoftheecologyintheGreatSmokyMountainsNationalPark,Cut-leafconeflowerhasbeenevaluatedforozone-inducedfoliarinjury.
FieldevaluationsweredoneinplotslocatedintheGreatSmokyMountainsNationalPark,whichisinthesouthernAppalachianMountainsofwesternNorthCarolinaandeasternTennessee.Cut-leafconeflowerwasevaluatedonClingmansDometrail,Tennessee,fromJunetoSeptemberandatPurchaseKnobnearWaynesville,NCduringJuly.Theplantssampledwereabout1meterfromeachother,andcategorizedasnearandoff-trailplants.Neartrailplantswerelo-
Yellowpoplarwithozoneinjury,photocourtesyofUSForestService.
Cut-leafConeflowershowingozonedamage.NPSphoto

18
catedlessthan5metersfromthetrail.Offtrailplantsweremorethat5metersfromthetrail.Therewerefoursamplingperiodsforozoneinjuryatapproximate-ly3-5weekintervalsfromJunetoSeptemberduring2000.Cut-leafconeflowerswerealsoexaminedonandoff-trailatPurchaseKnobintheGreatSmokyMountainsnearWaynesville,NCduringJuly.Thelevelofozone-inducedinjurywasassessedusingtwomethods:thenumberofinjuredleavesandthepercentageofleafareainjured.ThefindingsofthestudyatClingmansDometrailidentified50%oftheoverallpopulationoftheplantsstudiedhadozoneairpollutioninjury.Plantsgrowingnearthetrailhadsig-nificantlygreaterinjuryand3.5timesgreaterleafareainjurythanthosegrowingoff-trail.Theleavesonthelowerhalfoftheplanthad95%oftheleafinjury.Thepatternofinjurywassimilarforplantsnearandoff-trail.Theresultswithonandoff-trailatPurchaseKnobshowednodifferencesinthelevelofinjurybe-tweentheplants.However,ozoneinjurywasgreaterfortheClingmansDomeplantsthanthoseatPurchaseKnob.(Chappelka,Neufeld,Davison,Somers,andRenfroetal.2003). Ground-levelozonehasbeenidentifiedasthemajorpollutantcausingfoliarinjurytoplants.Thetwonativeozone-sensitiveplantsthatcaneasilybeincor-poratedintoa“BioindicatorGardenfortheDetectionofOzoneAirPollution”andusedasindicatorsofthepresenceofozoneareCut-leafconeflower(Rudbeckialacinata)andCommonmilkweed(Asclepiassyriaca).Theyareperennialsthatarerelativelyeasytotrans-plantandmaintain.Organizinganozonebioindicatorsiteusingtheseplantswillprovideawaytoobserveozone-inducedfoliarinjuryandtoobserveandmea-sureitsimpactonplantgrowthovertime.Thein-volvementofdifferentgeographicsitesinalong-terminvestigationwillprovidequantitativedatarelativetothesensitivityofthesetwospeciestoambientaircontainingozoneairpollution.Inaddition,theob-servationsbythestudentsinvolvedwithinthisuniqueprojectwilldevelopandincreasetheirawarenessoftheeffectsofozoneairpollutiononsensitiveplantswithinournaturalplantcommunitiesasanimportantpartofourNationalParks.
AstudentchecksCrownbeardplantsinthe“OzoneGarden”atPurchaseKnob,GSMNP,NC.
Dr.HowieNeufeldmeasurestherateofphotosynthesisonozoneinjuredCut-leafconeflowerleavesinGreatSmokyMountainsNationalPark.

19
SECTION III: The Ozone Bioindicator GardenBackground Information
OzoneMeasurementsandPlantObservations Participantsineducationalandnon-educationalsettingshavebeentrainedtotakesurfaceozonemeasure-mentswithahand-heldopticalscannerandtogathercloudcoverandtype,humidity,winddirectionandcurrenttemperature.ThesurfaceozoneandmeteorologicaldataaresubmittedtotheGLOBEStudentDataServer(www.globe.gov)atColoradoStateUniversity,FortCollins,CO.Thesurfaceozonedatacanberetrievedinrawformoringraphicvisualizationsenablingthecitizenscientisttoanalyzetheirowndataforpatternsand/orcomparetheirfindingstoothersitescollectingozonedata.OrganizinganOzoneBioindicatorGardencontain-ingozone-sensitiveplantspeciesisanaturalextensiontogatheringsurfaceozonedataandenablestheobservertodevelopanawarenessofhowsurfaceozoneaffectsvegetation. AnOzoneBioindicatorGardenisawayforeducators,students,andcitizenscientistsfromeducationalandnon-educationalsettingstotakepartinanimportantstudytodeterminetheeffectsofozoneairpollutiononplantpopulations.Thestudyofozoneandozone-inducedfoliarinjurywillaidinunderstandingtherelation-shipbetweenfoliarinjury,airquality,andplantgrowth.OzoneBioindicatorGardendataaresubmittedtothe“HandsontheLand”website.http://www.handsontheland.org/environmental-monitoring/ozone-bio-monitoring.html
ItisimportanttoplantCut-leafconeflowerandCommonmilkweedinthenaturalsoilsoftheareawithenoughwalkwayareatopreventdamagingtheplants.Thegardenmustbelocatedawayfromanyareaswherepesticides,herbicides,fertilizers,etcmightbeused.Theobjectiveistomaintainanaturalhabitatforeachoftheozonesensitiveplants.DoNOTuseanyoftheabovechemicalsinyourgardenplotastheymayaffecttheresults.Forexample,somefungicidesarepotentanti-oxidants,andwillkeepplantsfromdevelopinganyozonesymptoms.
ThelayoutofthegardenattheUSForestService’sCradleofForestryinAmericaislinerwithspacebetweenthebedssodatacanbeeasilycollectedwithouttramplingplants.
ThegardenatPurchaseKnobinGreatSmokyMountainsNationalParkisarrangedinrowswith2feetbetweeneachplantand3feetbetweeneachrow.
20
No Garden Area? Use Pots Ifyourschoolisinanareaunsuitableforagardenplot,youcanusepots.Itisimportanttouseaslargeapotaspossibletoaccommodatethelargerootsystemoftheplantsandtofinda“breathable”materialliketerracottaorwood.Blackplasticpotswillcausetheplantstodryouttooquicklyinthesunlightsotheyaren’trecommended.Itisnotadvisabletoputmorethanoneplantineachpot.Placethepotsinanareawheretheycangetasmuchsunlightaspossible.Youwillneedtocheckthemdailyforwateringifyouliveinanareathatgetsverywarm.
Planting the Cut-leaf Coneflower Rhizomes Ifyoucan’tputyourplantsintothegroundorpotsimmediately,theywillstoreinarefrigeratorforaboutonemonthifwrappedinmoistpapertowels.Theplantsdobestiftheyareplantedintheearlyfallsotheyhaveachancetoestablishthemselvesbeforeoverwintering.Conefloweroverwinterwitharosetteofbasalleavesthatremainsgreen.Inthespring,theplantwilladdnewbasalleavesandthensendupamainstalk,thisisthepartoftheplantyouwillcollectdataon,notthebasalrosette. Yourrootshavebeencollecteddirectlyoffofplantsfromanexistinggarden.ThisensuresthatalloftheplantshavegeneticmaterialoriginatingwiththegardenatPurchaseKnobinGreatSmokyMountainsNationalPark.Therhizomeshouldstillhaveabitofgreenplantmaterial,whenplanting;thisareashouldbeatthetopandjustbarelycoveredbysoil.Digaholeinthegroundthatisslightlydeeperthenthelengthofanyroothairshangingdownwhenthegreenpartoftheplantisthetop.
Organizing the Plants for Study Oncethedesignofthegardenisestablished,eachplantwillneedtohaveanIDnumberusingCFforCut-leafconeflowerandMWforCommonmilkweed.Alsoconsideradifferentnumberingpatternforeachplantwithinthespecies.Forexample,ifyouhave4Cut-leafconeflowerplants,tagoneasCF01,CF02,CF03andCF04.ThiswillhelppreventconfusingdatafromoneConeflowerplantwithanother,becausethenumbersarenottoosimilar.TheplantIDnumberandleaflabelingpatterndevelopedduringtheinitialsetupofthegardenneedstobethesameeachyearmeasurementsaretaken.
Measuring the Plants AftertheplantIDisestablished,theplantheightneedstoberecordedusingameterstick.• Themeasurementhastoberecordedincentimeters(cm)onthedatasheet.Iftheplantisnotfullygrown,onlymeasureuptothebaseofthetop-mostleaf.Theleavesstanderectwhentheyaren’tfullyopenandifyoumeasuretothetopoftheleaf,theplantmayappeartoshrinkoncetheleafopensfullyanddropsdown.• Countthetotalnumberofleavescomingoffofthemainstemoftheentireplantandrecordobservations(inflower,inbud,nodewithnoleaf,etc).DoNOTcountalloftheleavesontheplant,justthosedirectlycomingoffthemainstem.• Itisimportanttorecognizethatleavesmayfallofftheplantbuttheystillshouldbecountedandincludedindatacollection.Todetermineifaleafismissing,feelalongthestemoftheplantforasmallknob,thisisaleafnodeandindicatesthataleafusedtobethereandwaslost.Workfromthebottomoftheplantto-wardsthetop,runningyourfingersupthestem.• Datacollectionforeachplantwillstartatthebaseoftheplantandwillworkuptowardsthetop.• Identifythenorthsideforeachplant.(Marknorthsomewhereintheplotandwherethebasepointwaswhenmarkingnorthsoeachobserverontheteammayknowforcertainwhichwaytofacewhenrecordingobservations.• Iftheleavesareoppositeeachother,designatetheleavestotheleftofthemiddleoftheplantas“B”andtherightside“A”asyouarefacingNorth.Usingapermanentmarker,putasmalldotonthestemoftheleafclosetowhereitjoinstheplant.Thiswillensure
21
thatyoudonotassign“A”toaleafoneweekand“B”tothesameleafthenextweek.Theplantmaytwistasitgrowssothisisanimportantstep.• Iftheleavesalternateonthestem,numbertheleavesinsequencebeginningwithleaf#1-thefirstleafatthebottom,justabovethefloretteofbasalleaves.Ifanyleafhasfallenoff(feelforaleafscarremainonthemainstem),continuetoincludeitinyourcount.
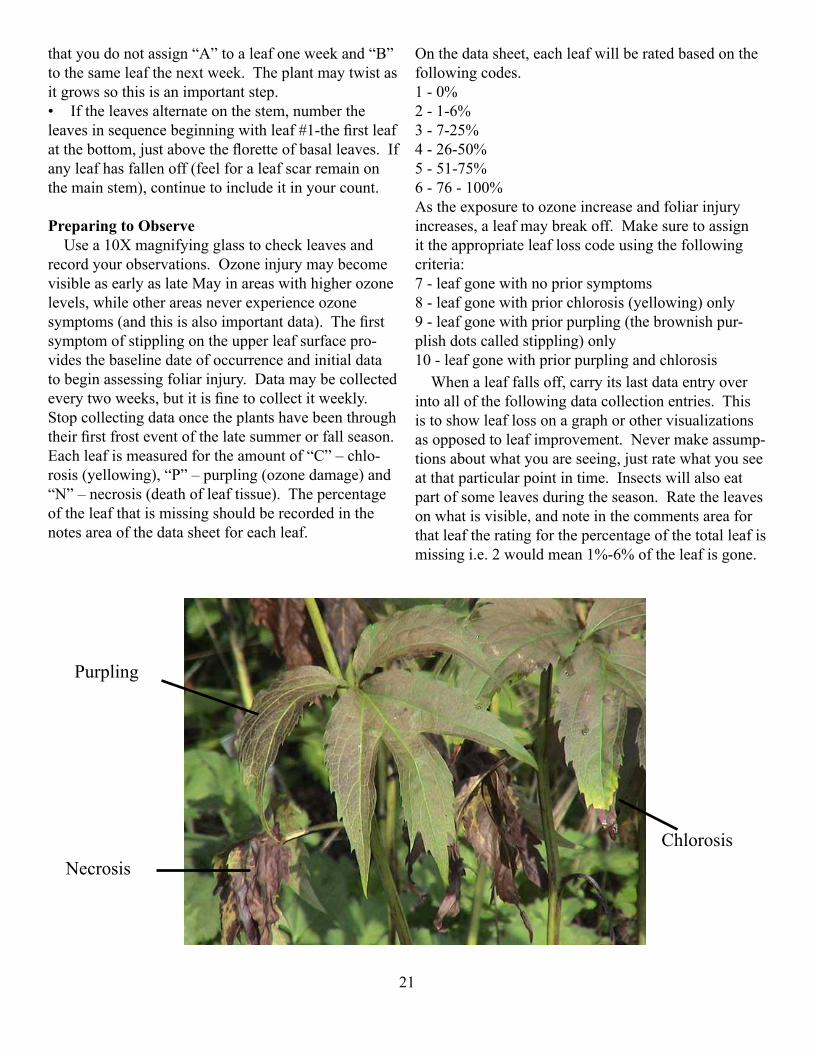
Preparing to Observe Usea10Xmagnifyingglasstocheckleavesandrecordyourobservations.OzoneinjurymaybecomevisibleasearlyaslateMayinareaswithhigherozonelevels,whileotherareasneverexperienceozonesymptoms(andthisisalsoimportantdata).Thefirstsymptomofstipplingontheupperleafsurfacepro-videsthebaselinedateofoccurrenceandinitialdatatobeginassessingfoliarinjury.Datamaybecollectedeverytwoweeks,butitisfinetocollectitweekly. Stopcollectingdataoncetheplantshavebeenthroughtheirfirstfrosteventofthelatesummerorfallseason.Eachleafismeasuredfortheamountof“C”–chlo-rosis(yellowing),“P”–purpling(ozonedamage)and“N”–necrosis(deathofleaftissue).Thepercentageoftheleafthatismissingshouldberecordedinthenotesareaofthedatasheetforeachleaf.
Onthedatasheet,eachleafwillberatedbasedonthefollowingcodes.1-0%2-1-6%3-7-25%4-26-50%5-51-75%6-76-100%Astheexposuretoozoneincreaseandfoliarinjuryincreases,aleafmaybreakoff.Makesuretoassignittheappropriateleaflosscodeusingthefollowingcriteria:7-leafgonewithnopriorsymptoms8-leafgonewithpriorchlorosis(yellowing)only9-leafgonewithpriorpurpling(thebrownishpur-plishdotscalledstippling)only10-leafgonewithpriorpurplingandchlorosis Whenaleaffallsoff,carryitslastdataentryoverintoallofthefollowingdatacollectionentries.Thisistoshowleaflossonagraphorothervisualizationsasopposedtoleafimprovement.Nevermakeassump-tionsaboutwhatyouareseeing,justratewhatyouseeatthatparticularpointintime.Insectswillalsoeatpartofsomeleavesduringtheseason.Ratetheleavesonwhatisvisible,andnoteinthecommentsareaforthatleaftheratingforthepercentageofthetotalleafismissingi.e.2wouldmean1%-6%oftheleafisgone.
Purpling
NecrosisChlorosis

22
Training to Assess Foliar Injury An“OzoneBioindicatorGarden”providestheopportunitytomeasuretheamountofozoneinducedinjurytoplantsandtoobservetheimpactofozoneairpollutiononozone-sensitiveplantspeciesovertime.Forthisstudy,weareusingaratingscaledevelopedbytheNationalParkServicetoassessthepercent-ageoffoliarorleafinjurycausedbyozone.AnyoneobservingandrecordingfoliardamageandsubmittingdatatoHandsontheLandwebsitemustparticipateinaformaltrainingtoassessfoliarinjury.Accuracyinassessingfoliarinjuryrequirespracticeandanob-servercanpracticeandrefinehisorherskillsat:http://www.nature.nps.gov/air/edu/O3Training/index.cfm
• Selectthenumberofleafimagesfortraining.Youmaywanttochangethenumberofspecimensto10ratherthan20.• Clickselectifyoumadechanges.• Clickontheimageoftheleafyouwouldliketopracticewith,wesuggestCommonMilkweed.• Selecttheproperpercentrangeandclick“okay”• Anobservermustscoreatleast80%correctwitherrorsbeingnomorethan+or–oneinjuryclassbe-foreproceedingtothefield.• Practiceestimatingfoliainjuryonspeciesforwhichyouwillbecollectingdata.• Youmaywanttopracticeestimatingfoliarinjuryonthewebsiteusingyouridentificationchart.• Haveeachstudentdothisexerciseatleastthreetimesoruntiltheyscore80%.
Registering Your SiteIfyouareaneducatorandarealreadyinvolvedinapartnershipwithapubliclandmanagementagencythatmeetsHOLmembershipcriteria,weencourageyoutoworkwithyouragencycontact(s)tofilloutandsubmittheMembershipApplication.NOTE:Applica-tionsmustbereceivedfromtheagencyprovider.
AgenciesinvolvedintheHandsontheLandnetworkincludetheNationalParkService,NationalFishandWildlifeService,USForestService,BureauofLandManagement,NOAA,EPA,andNRCS.Withineachofthoseagencies,therearemembersites.YoucancontactSusan_Sachs@nps.govforyourapplicationsponsorship.
Entering Data into the Hands on the Land Website
(Note:YouwillneedtobearegisteredmembertoenterdataontheHandsontheLandwebsite)
Gotothedataentrywebsite:http://www.handsontheland.org/environmental-moni-toring/ozone-bio-monitoring.html
1) UnderDatasheet a. Selectyoursite b. ClickonPOST2) Logintoaccessyourdatapage-atthepasswordprompt,enterthefollowing:UserName:youremailaddress Password:selectedbyyouwhenyouinitiallyreg-isteredyoursite.3) Youshouldnowhaveablankdatasheetforyourgarden,checkthegardennameandlocation.Ifyouhavethewrongdatasheet,gobacktothebeginningandmakesureyouhavethepropergardennamese-lectedfromthedropdownmenu4) Writeinthenameofthecollectors,andforgroupsofstudentsteamnamesworkwell.5) Changethedatetothedaydatawerecollected,notthedatetheyareentered.6) Selectthespeciesinitialsfromthedropdownlist BB=Blackberry CB=Crownbeard CF=Cut-leafconeflower CFD=Cut-leafConeflower(var.Digitalis) EB=Elderberry MW=Commonmilkweed WS=Wingstem7) Entertheplantheightincentimeters8) Enterthetotalleafsets(includemissingleaves)9) Enterdataforeachleaf(orleafset).Leaf1isthelowestleafontheplant.Onlyenterdataforthelow-est8leaves.Foralternateleafplants,onlyenterdatacodesinthe“A”column.10)Whenalldatahavebeenchecked,clickthe“In-sert”button.Youwillbeabletoeditandmakecorrec-tionsusingthelinkatthebottomofthepage.
23
Ifyouhaveanyproblemswiththissection,contactSusanSachsat(828)[email protected]
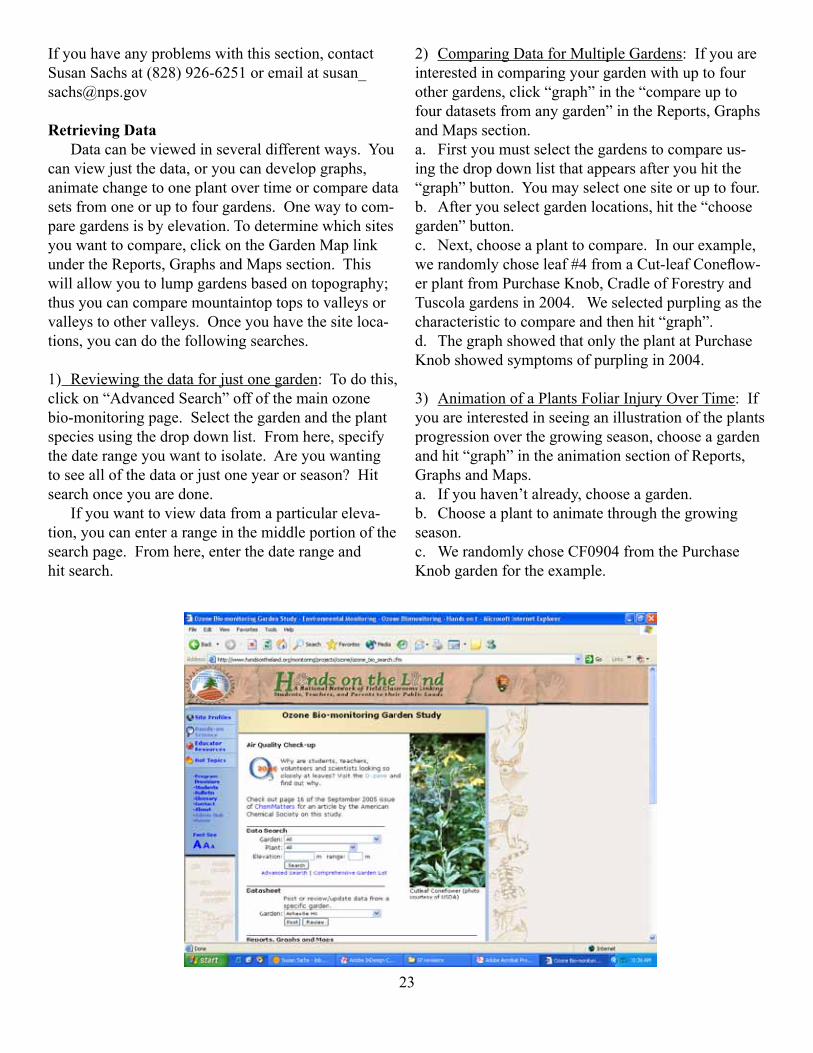
Retrieving Data Datacanbeviewedinseveraldifferentways.Youcanviewjustthedata,oryoucandevelopgraphs,animatechangetooneplantovertimeorcomparedatasetsfromoneoruptofourgardens.Onewaytocom-paregardensisbyelevation.Todeterminewhichsitesyouwanttocompare,clickontheGardenMaplinkundertheReports,GraphsandMapssection.Thiswillallowyoutolumpgardensbasedontopography;thusyoucancomparemountaintoptopstovalleysorvalleystoothervalleys.Onceyouhavethesiteloca-tions,youcandothefollowingsearches.
1) Reviewingthedataforjustonegarden:Todothis,clickon“AdvancedSearch”offofthemainozonebio-monitoringpage.Selectthegardenandtheplantspeciesusingthedropdownlist.Fromhere,specifythedaterangeyouwanttoisolate.Areyouwantingtoseeallofthedataorjustoneyearorseason?Hitsearchonceyouaredone. Ifyouwanttoviewdatafromaparticulareleva-tion,youcanenterarangeinthemiddleportionofthesearchpage.Fromhere,enterthedaterangeandhitsearch.
2) ComparingDataforMultipleGardens:Ifyouareinterestedincomparingyourgardenwithuptofourothergardens,click“graph”inthe“compareuptofourdatasetsfromanygarden”intheReports,GraphsandMapssection.a. Firstyoumustselectthegardenstocompareus-ingthedropdownlistthatappearsafteryouhitthe“graph”button.Youmayselectonesiteoruptofour.b. Afteryouselectgardenlocations,hitthe“choosegarden”button.c. Next,chooseaplanttocompare.Inourexample,werandomlychoseleaf#4fromaCut-leafConeflow-erplantfromPurchaseKnob,CradleofForestryandTuscolagardensin2004.Weselectedpurplingasthecharacteristictocompareandthenhit“graph”.d. ThegraphshowedthatonlytheplantatPurchaseKnobshowedsymptomsofpurplingin2004.
3) AnimationofaPlantsFoliarInjuryOverTime:Ifyouareinterestedinseeinganillustrationoftheplantsprogressionoverthegrowingseason,chooseagardenandhit“graph”intheanimationsectionofReports,GraphsandMaps.a. Ifyouhaven’talready,chooseagarden.b. Chooseaplanttoanimatethroughthegrowingseason.c. WerandomlychoseCF0904fromthePurchaseKnobgardenfortheexample.
24
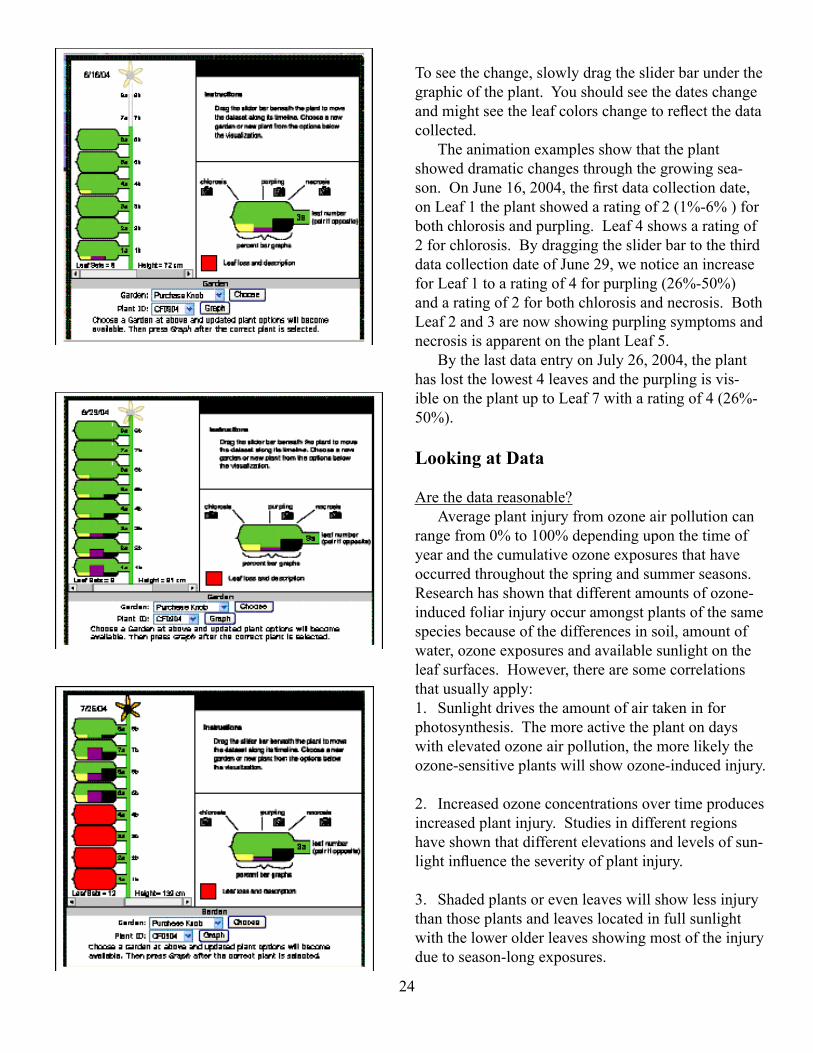
Toseethechange,slowlydragthesliderbarunderthegraphicoftheplant.Youshouldseethedateschangeandmightseetheleafcolorschangetoreflectthedatacollected. Theanimationexamplesshowthattheplantshoweddramaticchangesthroughthegrowingsea-son.OnJune16,2004,thefirstdatacollectiondate,onLeaf1theplantshowedaratingof2(1%-6%)forbothchlorosisandpurpling.Leaf4showsaratingof2forchlorosis.BydraggingthesliderbartothethirddatacollectiondateofJune29,wenoticeanincreaseforLeaf1toaratingof4forpurpling(26%-50%)andaratingof2forbothchlorosisandnecrosis.BothLeaf2and3arenowshowingpurplingsymptomsandnecrosisisapparentontheplantLeaf5. BythelastdataentryonJuly26,2004,theplanthaslostthelowest4leavesandthepurplingisvis-ibleontheplantuptoLeaf7witharatingof4(26%-50%).
Looking at Data
Arethedatareasonable? Averageplantinjuryfromozoneairpollutioncanrangefrom0%to100%dependinguponthetimeofyearandthecumulativeozoneexposuresthathaveoccurredthroughoutthespringandsummerseasons.Researchhasshownthatdifferentamountsofozone-inducedfoliarinjuryoccuramongstplantsofthesamespeciesbecauseofthedifferencesinsoil,amountofwater,ozoneexposuresandavailablesunlightontheleafsurfaces.However,therearesomecorrelationsthatusuallyapply:1. Sunlightdrivestheamountofairtakeninforphotosynthesis.Themoreactivetheplantondayswithelevatedozoneairpollution,themorelikelytheozone-sensitiveplantswillshowozone-inducedinjury.
2. Increasedozoneconcentrationsovertimeproducesincreasedplantinjury.Studiesindifferentregionshaveshownthatdifferentelevationsandlevelsofsun-lightinfluencetheseverityofplantinjury.
3. Shadedplantsorevenleaveswillshowlessinjurythanthoseplantsandleaveslocatedinfullsunlightwiththelowerolderleavesshowingmostoftheinjuryduetoseason-longexposures.
25
Studentstakingbi-weeklymeasurementsoftheper-centageofplantinjuryshouldobserveageneralincreaseintheamountofdamageovertime.Theyshouldtakeparticularnoteoftheweatherconditions(temperature,dayswithintensesunlight,cloudcoverandtype,winddirection,andhumidity).Thesefac-torsinfluencetheconcentrationsofsurfaceozonepresent.Arethereseveralconsecutivedayswhentheozonelevelishigh?Werethereanydramaticchangesrecordedintheamountsofinjurytotheplants?Onalongertimescale,howdidtheozoneinducedplantinjuryvaryeachmonth?Whatcanbelearnedabouttheeffectsofozoneairpollutionfromtheobservationsmadeoftheincidenceandseverityoffoliarinjurytoplants? Additionalinformationaboutsurfaceozoneandozonedatamaybefoundat:www.epa.gov.Therewillbeadailyairqualitymap.Clickon“Ozone”in
theheadingofthehomepageanditwillprovideback-groundinformationandasitetoclickonforozonelevelswhereyoulive.ThiswilltakeyoutoAIRNOW.Thissiteprovidestoday’sforcastandarchivestore-searchdifferentmonthsandyears.Itdoesnotproviderawdata.YouwillneedtogotoyourstateEnviron-mentalProtectionOfficeorAirQualityofficetogetrawdata.Somestatespostit,butothersdonot.
What do people look for in the data? Onemethodofcollectingdataistoestimatefoliarinjuryonceaweekonthesamedayofeachweek.However,bi-weeklyisalsoacceptable.AsampleofoneseasonofdataforonepairofleavesisrecordedandpresentedinTableI.(Dataispostedonhttp://www.handsontheland.org/environmental-monitoring/ozone-bio-monitoring.html)
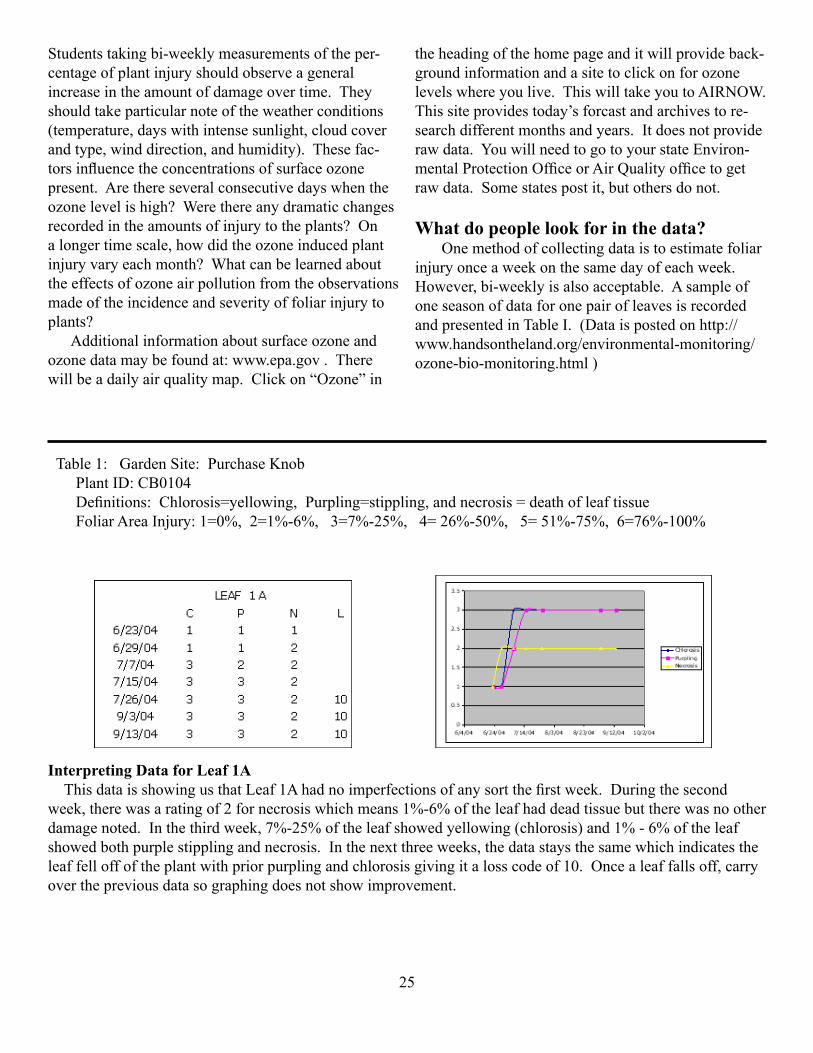
Table1:GardenSite:PurchaseKnobPlantID:CB0104Definitions:Chlorosis=yellowing,Purpling=stippling,andnecrosis=deathofleaftissueFoliarAreaInjury:1=0%,2=1%-6%,3=7%-25%,4=26%-50%,5=51%-75%,6=76%-100%
Interpreting Data for Leaf 1A ThisdataisshowingusthatLeaf1Ahadnoimperfectionsofanysortthefirstweek.Duringthesecondweek,therewasaratingof2fornecrosiswhichmeans1%-6%oftheleafhaddeadtissuebuttherewasnootherdamagenoted.Inthethirdweek,7%-25%oftheleafshowedyellowing(chlorosis)and1%-6%oftheleafshowedbothpurplestipplingandnecrosis.Inthenextthreeweeks,thedatastaysthesamewhichindicatestheleaffelloffoftheplantwithpriorpurplingandchlorosisgivingitalosscodeof10.Oncealeaffallsoff,carryoverthepreviousdatasographingdoesnotshowimprovement.
26
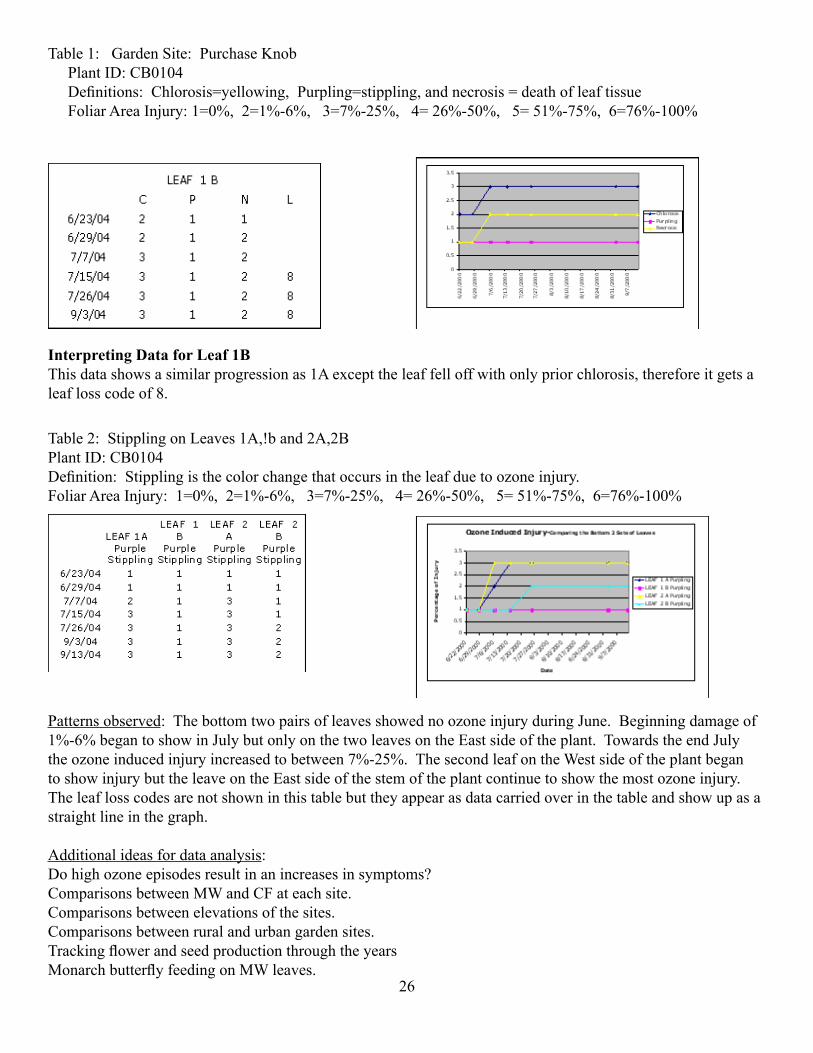
Table1:GardenSite:PurchaseKnobPlantID:CB0104Definitions:Chlorosis=yellowing,Purpling=stippling,andnecrosis=deathofleaftissueFoliarAreaInjury:1=0%,2=1%-6%,3=7%-25%,4=26%-50%,5=51%-75%,6=76%-100%
Interpreting Data for Leaf 1BThisdatashowsasimilarprogressionas1Aexcepttheleaffelloffwithonlypriorchlorosis,thereforeitgetsaleaflosscodeof8.
Table2:StipplingonLeaves1A,!band2A,2BPlantID:CB0104Definition:Stipplingisthecolorchangethatoccursintheleafduetoozoneinjury.FoliarAreaInjury:1=0%,2=1%-6%,3=7%-25%,4=26%-50%,5=51%-75%,6=76%-100%
Patternsobserved:ThebottomtwopairsofleavesshowednoozoneinjuryduringJune.Beginningdamageof1%-6%begantoshowinJulybutonlyonthetwoleavesontheEastsideoftheplant.TowardstheendJulytheozoneinducedinjuryincreasedtobetween7%-25%.ThesecondleafontheWestsideoftheplantbegantoshowinjurybuttheleaveontheEastsideofthestemoftheplantcontinuetoshowthemostozoneinjury.Theleaflosscodesarenotshowninthistablebuttheyappearasdatacarriedoverinthetableandshowupasastraightlineinthegraph.
Additionalideasfordataanalysis:Dohighozoneepisodesresultinanincreasesinsymptoms?ComparisonsbetweenMWandCFateachsite.Comparisonsbetweenelevationsofthesites.Comparisonsbetweenruralandurbangardensites.TrackingflowerandseedproductionthroughtheyearsMonarchbutterflyfeedingonMWleaves.
27
An Example of a Student Research Investigation
Forming a Hypothesis AstudentenrolledwithinaMilanschoolinItalyhasdecidedtofocusontheinterconnectionbetweentheexposuresofozoneairpollutionontheamountofozone-inducedinjurytotheCut-leafconeflower.Shehasdecidedtobeginherresearchprocessbylookingatthevisualizationsofhermeasurementsoftheozoneexposuresandthepatternofozone-inducedplantinjuryduringthemonthsofJulythroughSeptember.Herhypothesisis,theseverityofozone-inducedplantinjuryisdirectlyrelatedtospecificeventsofhighozonelevels.
Collecting and Analyzing Data MonitoringthelevelofozoneinducedplantinjuryatMilanSchoolisanewprotocol,butHandsontheLandpostsseveralmonthsofdatagatheredatvariousgardenlocationsduringthepastyear.ShedecidestorandomlypickaplantfromPurchaseKnob,NCinGreatSmokyMountainsNationalParkandcorrelatetherateofdamagetothe1-hourozoneaverageinppb.Whiledoinganinternetsearch,shediscoversthatthestateofNorthCarolinapostsozonelevelsmeasuredbyprofessionalequipmentthroughoutthestateathttp://daq.state.nc.us/monitor/data/. Shebeginsbyorganizingaspreadsheetofozonemeasurementsfromtheweekpriortoeachdatacol-lectioneventandtheamountsofozone-inducedplantinjuryforPurchaseKnob.ShegeneratesaplotoftheozonemeasurementsusingthecurrentU.S.Environ-mentalProtectionAgencyIndexValuestodeterminehealthyandunhealthyexposurestoozoneairpollu-tion.
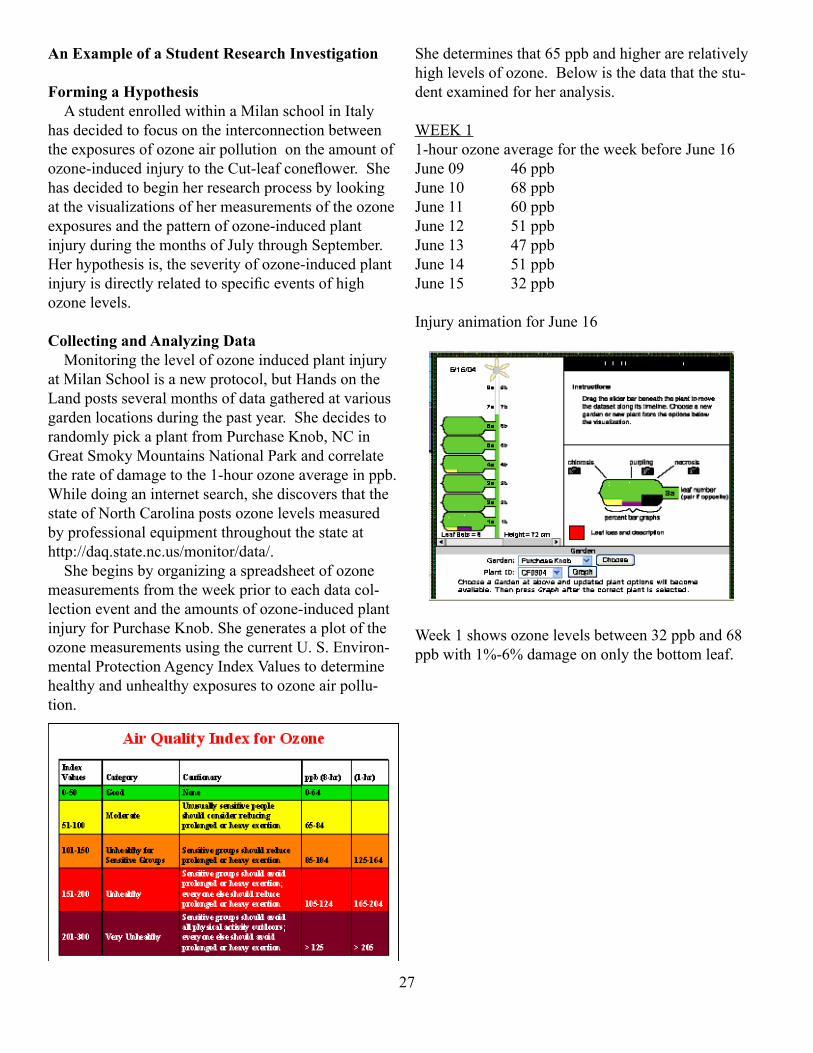
Shedeterminesthat65ppbandhigherarerelativelyhighlevelsofozone.Belowisthedatathatthestu-dentexaminedforheranalysis.
WEEK11-hourozoneaveragefortheweekbeforeJune16June09 46ppbJune10 68ppbJune11 60ppbJune12 51ppbJune13 47ppbJune14 51ppbJune15 32ppb
InjuryanimationforJune16
Week1showsozonelevelsbetween32ppband68ppbwith1%-6%damageononlythebottomleaf.
28
WEEK21-hourozoneaveragefortheweekbeforeJune22June16 31ppbJune17 34ppbJune18 56ppbJune19 52ppbJune20 59ppbJune21 47ppbJune22 49ppb
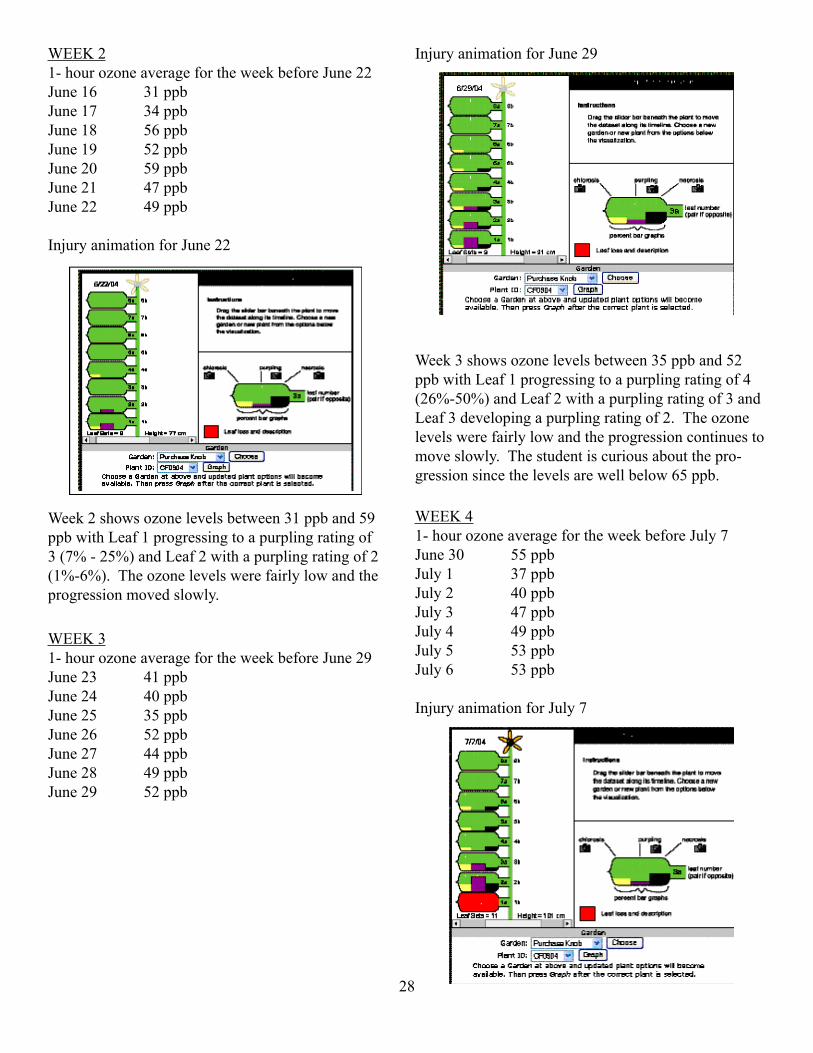
InjuryanimationforJune22
Week2showsozonelevelsbetween31ppband59ppbwithLeaf1progressingtoapurplingratingof3(7%-25%)andLeaf2withapurplingratingof2(1%-6%).Theozonelevelswerefairlylowandtheprogressionmovedslowly.
WEEK31-hourozoneaveragefortheweekbeforeJune29June23 41ppbJune24 40ppbJune25 35ppbJune26 52ppbJune27 44ppbJune28 49ppbJune29 52ppb
InjuryanimationforJune29
Week3showsozonelevelsbetween35ppband52ppbwithLeaf1progressingtoapurplingratingof4(26%-50%)andLeaf2withapurplingratingof3andLeaf3developingapurplingratingof2.Theozonelevelswerefairlylowandtheprogressioncontinuestomoveslowly.Thestudentiscuriousaboutthepro-gressionsincethelevelsarewellbelow65ppb.
WEEK41-hourozoneaveragefortheweekbeforeJuly7June30 55ppbJuly1 37ppbJuly2 40ppbJuly3 47ppbJuly4 49ppbJuly5 53ppbJuly6 53ppb
InjuryanimationforJuly7
29
Week4showsozonelevelsbetween37ppband55ppbwithLeaf1fallingofftheplant.Leaf2haspro-gressedtoapurplingratingof5(51%-75%)andLeaf3toapurplingratingof3.
WEEK51-hourozoneaveragefortheweekbeforeJuly15July8 57ppbJuly9 57ppbJuly10 60ppbJuly11 57ppbJuly12 51ppbJuly13 58ppbJuly14 59ppb
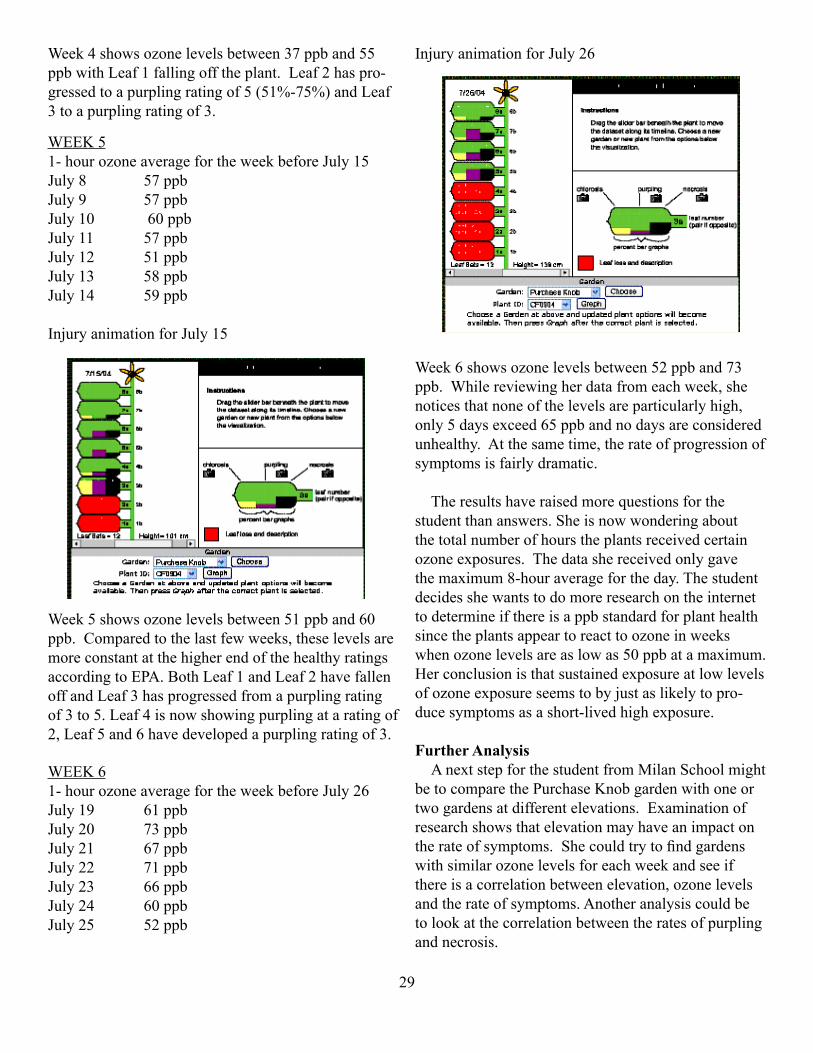
InjuryanimationforJuly15
Week5showsozonelevelsbetween51ppband60ppb.Comparedtothelastfewweeks,theselevelsaremoreconstantatthehigherendofthehealthyratingsaccordingtoEPA.BothLeaf1andLeaf2havefallenoffandLeaf3hasprogressedfromapurplingratingof3to5.Leaf4isnowshowingpurplingataratingof2,Leaf5and6havedevelopedapurplingratingof3.
WEEK61-hourozoneaveragefortheweekbeforeJuly26July19 61ppbJuly20 73ppbJuly21 67ppbJuly22 71ppbJuly23 66ppbJuly24 60ppbJuly25 52ppb
InjuryanimationforJuly26
Week6showsozonelevelsbetween52ppband73ppb.Whilereviewingherdatafromeachweek,shenoticesthatnoneofthelevelsareparticularlyhigh,only5daysexceed65ppbandnodaysareconsideredunhealthy.Atthesametime,therateofprogressionofsymptomsisfairlydramatic.
Theresultshaveraisedmorequestionsforthestudentthananswers.Sheisnowwonderingaboutthetotalnumberofhourstheplantsreceivedcertainozoneexposures.Thedatashereceivedonlygavethemaximum8-houraveragefortheday.Thestudentdecidesshewantstodomoreresearchontheinternettodetermineifthereisappbstandardforplanthealthsincetheplantsappeartoreacttoozoneinweekswhenozonelevelsareaslowas50ppbatamaximum.Herconclusionisthatsustainedexposureatlowlevelsofozoneexposureseemstobyjustaslikelytopro-ducesymptomsasashort-livedhighexposure.
Further Analysis AnextstepforthestudentfromMilanSchoolmightbetocomparethePurchaseKnobgardenwithoneortwogardensatdifferentelevations.Examinationofresearchshowsthatelevationmayhaveanimpactontherateofsymptoms.Shecouldtrytofindgardenswithsimilarozonelevelsforeachweekandseeifthereisacorrelationbetweenelevation,ozonelevelsandtherateofsymptoms.Anotheranalysiscouldbetolookatthecorrelationbetweentheratesofpurplingandnecrosis.
30
ActivitiesBefore Collecting Data
The Leaf Game-Thisactivityallowsstudentstopracticetheestimationskillstheywillneedtocollectdata.
Virtual Ozone Injury Data Collection-SetupontheHandsontheLandwebsitearephotographsfromonefieldseasonatthePurchaseKnobgardeninGreatSmokyMountainsNationalPark.Visithttp://www.handsontheland.org/educator-resources/hol-games/hol-sponsored-games/ozone-inquiry.htmlfortheactivitythatgoesalongwiththeworksheetsonpages32-33ofthisguide.
Collecting Data
Rating Ozone-Induced Foliar Injury on Ozone-sensitive Plants-Thisguidesyouincollectingdata.ChoosetheversionofthedatasheetandOzoneGardenDataCollectionfieldguidethatwillworkbestforyourclass.Also,notethattherearetwodatasheetsforVersionIandII,thesedifferforthevariousplantgrowthforms(alternatevs.oppositeleaves).
Version I-Thisisthesimpliestdatacollectionmethod.Usethisforupperelementaryorremedialmiddle/highschoolgroups.
Version II-Thisistheintermediatedatacollectionmethod.Usethisforadvancedupperelementary,middleschoolorremedialhighschoolgroups.
Version III-Thisisthetrackingdatasheetanditcanbeusedwithadvancedhighschoolorcollegegroups.
31
Recordyourresultshere
Trial1=10leaves1.Whichspeciesdidyouuse?
2.Errorsaretobeexpected,butitisimportanttorecordandtrackthecategoriesinwhichyouhavewronganswers.Pleasewritethetotalwronganswersineachcategoryinthespacesbelow.
__0%__1%-4%__5%-12%__13%-25%__26%-50%__51%-75%___76%-100%
Trial2=10leaves1.Whichspeciesdidyouuse?
2.Errorsaretobeexpected,butitisimportanttorecordandtrackthecategoriesinwhichyouhavewronganswers.Pleasewritethetotalwronganswersineachcategoryinthespacesbelow.
__0%__1%-4%__5%-12%__13%-25%__26%-50%___51%-75%___76%-100%
Trial3=10leaves1.Whichspeciesdidyouuse?
2.Errorsaretobeexpected,butitisimportanttorecordandtrackthecategoriesinwhichyouhavewronganswers.Pleasewritethetotalwronganswersineachcategoryinthespacesbelow.
__0%__1%-4%__5%-12%__13%-25%__26%-50%__51%-75%___76%-100%
Trial4=10leaves1.Whichspeciesdidyouuse?
2.Errorsaretobeexpected,butitisimportanttorecordandtrackthecategoriesinwhichyouhavewronganswers.Pleasewritethetotalwronganswersineachcategoryinthespacesbelow.
__0%__1%-4%__5%-12%__13%-25%__26%-50%__51%-75%___76%-100%
Didyougetanybetterwitheachtrial?Inordertocollectdataintheozonegarden,youmustgetatleast80%correctononeofthe4trialsandbenomorethanonecategoryoffonincorrectanswers.
TheLeafGameNavigatetotheFoliarInjuryAssessmentModulewebsite:http://www.nature.nps.gov/air/edu/O3Training/index.cfm• Changethenumberofleafimagesfortrainingto10• Click“select”• StarttrainingonCommonMilkweed
32
O3 Skills Center 1Parks as Classrooms - Great Smoky Mountains National Park
Name ______________________________
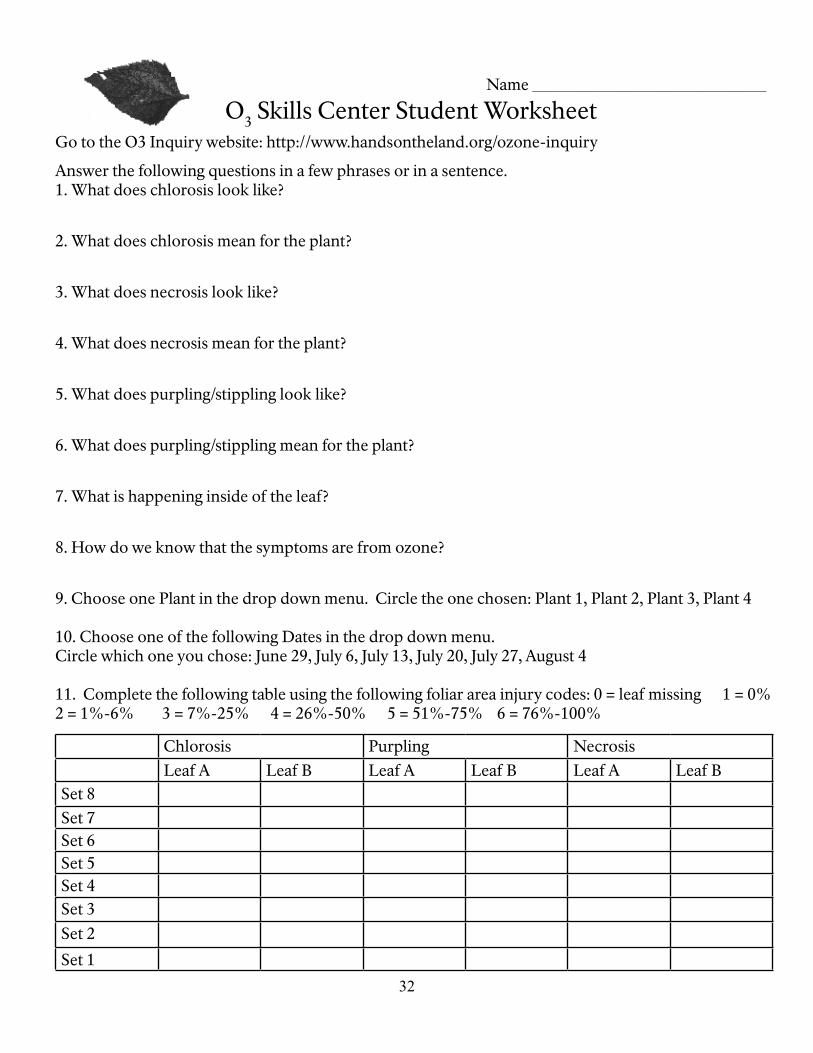
O3 Skills Center Student WorksheetGo to the O3 Inquiry website: http://www.handsontheland.org/ozone-inquiry
Answer the following questions in a few phrases or in a sentence. 1. What does chlorosis look like?
2. What does chlorosis mean for the plant?
3. What does necrosis look like?
4. What does necrosis mean for the plant?
5. What does purpling/stippling look like?
6. What does purpling/stippling mean for the plant?
7. What is happening inside of the leaf?
8. How do we know that the symptoms are from ozone?
9. Choose one Plant in the drop down menu. Circle the one chosen: Plant 1, Plant 2, Plant 3, Plant 4
10. Choose one of the following Dates in the drop down menu. Circle which one you chose: June 29, July 6, July 13, July 20, July 27, August 4
11. Complete the following table using the following foliar area injury codes: 0 = leaf missing 1 = 0% 2 = 1%-6% 3 = 7%-25% 4 = 26%-50% 5 = 51%-75% 6 = 76%-100%
Chlorosis Purpling NecrosisLeaf A Leaf B Leaf A Leaf B Leaf A Leaf B
Set 8Set 7Set 6Set 5Set 4Set 3Set 2
Set 1
12. Insert the above data into the O3 Skills Center website and click the “Check” button. What is your score? ________

33
12. Insert the above data into the O3 Skills Center website and click the “Check” button. What is your score? ________
13. When was the first observed date the selected plant flowered (click at the top of the plant for each week to determine if the plant has flowered)? Circle which date the selected plant flowered: July 27, August 4, August 11, August 31, September 7, September 14
14. Choose another Date (use a date listed below) in the drop down menu using the same selected Plant as before. Circle which one you chose: August 11, August 31, September 7, September 14, September 20, September 28
15. Complete the following table using the following foliar area injury codes: 0 = leaf missing 1 = 0% 2 = 1%-6% 3 = 7%-25% 4 = 26%-50% 5 = 51%-75% 6 = 76%-100%
Chlorosis Purpling NecrosisLeaf A Leaf B Leaf A Leaf B Leaf A Leaf B
Set 8Set 7Set 6Set 5Set 4Set 3Set 2
Set 1
16. Insert the above data into the O3 Skills Center website and click the “Check” button. What is your score? ________
17. Describe three differences you observed between the two dates selected. 1. 2. 3.
34
Lesson Plan: Rating Ozone-Induced Foliar Injury on Ozone-sensitive PlantsPurposeTomeasurethepercentageofozone-inducedinjurytoplants.
Overview• Determineanaveragepercentareaoftheozone-in-ducedinjuryoneachplantleaf.• UsetheNationalParkService’sratingscaletoquantifytheareaofleafaffected.Theratingclassesof1-6representapercentagerangeoffoliarinjury(1=0%,2=1-6%,3=7-25%,4=26-50%,5=51-75%and6=76-100%)andwillbeidentifiedusingafieldguidefortheassessment.
Educational OutcomesParticipantswilllearntoidentifythepercentofozone-inducedinjuryandchangesoccurringtotheplantovertimeasozonepollutionexposureschange.
Science, Geography, Mathematics ConceptsInquiry• Askaquestionaboutplantinjuryandeventsintheenvironment• Planandconductaninvestigation• Usedatatoconstructreasonableexplanations• MaintainajournalPersonandSocialPerspectives• Changesintheenvironmentcanbenaturalorinflu-encedbyhumans• MaterialfromhumansocietiesaffectbothphysicalandchemicalcyclesofearthEarthandSpace• Theatmosphereismadeupofdifferentgases• MaterialsfromhumansocietiesaffectthechemicalcyclesoftheEarthLifeScience• Cellscarryonmanyfunctionsneededtosustainlife.• Demiseisabreakdowninthestructureandfunc-tionsofanorganismGeography• Humanactivitycanmodifythephysicalenviron-ment.Mathematics• Understandandapplyratios,proportions,andper-centsinawidevarietyofsituations• Formulateandsolveproblemsthatinvolvecollect-ingandanalyzingdata• Construct,read,andinterpretdisplaysofdata• Communicateresults
Observation SupportOzoneinducedfoliarinjuryiscommonlymeasuredusingtheNationalParkService’sratingscale.Thegraphicchartidentifiesthevaryingpercentageofozoneinjurytoaplantusingtheratingsof:0%,1-6%,7-25%,26-50%,51-75%and76-100%.Thegreatertheamountofozoneairpollutionpresent,themorefo-liarinjurythatwilllikelybeobservedonozone-sensi-tiveplants.Theplantisobserveddailyusinga10Xmagnifyingglassuntilthebeginningofstipplingisseenonaleaf.Theplantdataarethenrecorded.ThefirstdatacollectingeventshouldoccurnolaterthanJune15eachyear,subsequentobservationsshouldbetakenonedayeachweekoreverytwoweeks,tryingtomaintainaregularschedule.Remember,noinjuryisrelevantdata.
Theamountoffoliar(leaf)injuryislikelytoincreaseshortlyafterdayswithhighlevelsofozoneairpollution.Thiswouldbeanopportunetimeforadiurnalstudyofsurfaceozoneandcorrelatingthatdatawiththelevelofinjuryobservedontheleafoftheplant.Iftakinghourlyozonemeasurementsisnotpossible,thehourlymeasurementsmaybegottenfromthelocalEnvironmentalProtectionAgencyorlocalairquality-monitoringdevice.Aninternetsearchwillrevealifyourstatepostsairqualitydata.
Measurement LogisticsTheneedtoassesstheplantdailyforozoneinjuryuntilthefirstsymptoms,mayposealogisticschal-lenge.Oneapproachmightbetousethemagnifyingglasstocheckthelowestleavesoftheplantduringarecessorlunchbreak,orimmediatelyafterschoolisout.Identifyingthedayeachoftheplantsshowsymp-tomsoffoliarinjuryandratingtheamountofinjuryprovidesabaselineofdataformonitoringthepatternoffoliarinjuryovertime.
Afterestablishingabaselineofdata,theplantisassessedonceaweekpreferably,oreverytwoweeksonthesameday.Establishaschedulesoeveryoneinvolvedknowswhatisexpectedandwhentodoit.
35
Supporting Measurements Thepercentageofinjurytoaplantdependsupontheleveloramountofozonepresentandtheamountofsunlight.Strongsunlightsupportsphotosynthesis,producingfoodtheplantneeds.Thisrequiresmoreintakeofairbytheplant,andincreasedintakeofaircontaininghigherlevelsofozonedamagetheplant.Hotsunnydays,hightemperatures,winddirection,humidity,andcloudcoverallaffecttheconcentrationofozoneproduced.Levelsofozonecanbemeasuredwithahand-heldopticalscannerusingtheSurfaceOzoneProtocolfoundintheGLOBE(GlobalLearn-ingandObservationtoBenefittheEnvironment)Pro-gram(www.globe.gov).ParticipatinginthetrainingfortheozoneprotocolenablesyoutosubmityourdatatotheGLOBEStudentDataServer.Thedatacanberetrievedinrawformorthroughvisualizationsmakingitanaturalextensiontothestudyofplantinjury.
Participant PreparationAnyoneassessingfoliar(plant)injuryandsubmit-tingdataHandsontheLadwebsitemustbetrained.Itisimportanttotheaccuracyofthemeasurementsthatparticipantsareableto:1.Workincooperativegroupsof2-4tosetupthesiteandgather,analyze,anddiscussresults.2.Organizeallmaterialsneededtoassessplantinjury.3.Followaschedulefortakingmeasurements.4.Identifyandrecord,date,time,gardenlocation,plantIDnumber,numberofleavesontheentireplantandotherobservationsrequiredonthedatasheet.5. EstimatethepercentageoffoliarinjuryusingthegraphicallydesignedchartsummarizingtheNationalParkService’sratingscale.6.Practiceestimatingfoliarinjuryusingthewebsite:http://www.nature.nps.gov/air/edu/O3Training/index.cfm7. Recorddataaccuratelyandcompletelyforsubmit-tingtotheHandsontheLandwebsite.
Helpful Hints» Designateanareatokeeptheclipboard,datasheetandallmaterialsforgatheringobservations.» Checkthewrittenrecordsfromtimetotimeforcompletenessandaccuracy.
Questions for Further InvestigationHowistheamountoffoliarinjuryrelatedtootheratmosphericphenomena?Whichone?How?
Whatvariabilityoffoliarinjurydidyouobserveoveraperiodoftime?Daily?Weekly?Seasonally?
Howcouldyouuseyourdataonplantinjurytochar-acterizeanychangesintheozoneexposures…weekly?,seasonally?,betweenyears?
36
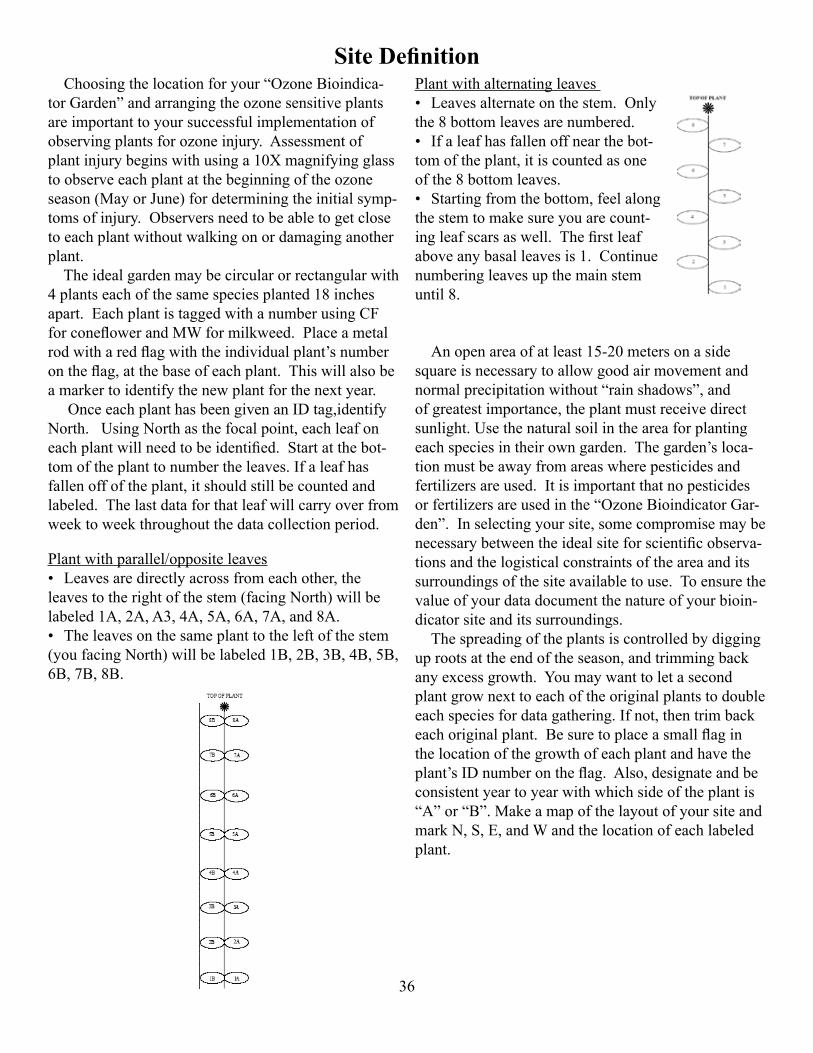
Site Definition Choosingthelocationforyour“OzoneBioindica-torGarden”andarrangingtheozonesensitiveplantsareimportanttoyoursuccessfulimplementationofobservingplantsforozoneinjury.Assessmentofplantinjurybeginswithusinga10Xmagnifyingglasstoobserveeachplantatthebeginningoftheozoneseason(MayorJune)fordeterminingtheinitialsymp-tomsofinjury.Observersneedtobeabletogetclosetoeachplantwithoutwalkingonordamaginganotherplant.Theidealgardenmaybecircularorrectangularwith4plantseachofthesamespeciesplanted18inchesapart.EachplantistaggedwithanumberusingCFforconeflowerandMWformilkweed.Placeametalrodwitharedflagwiththeindividualplant’snumberontheflag,atthebaseofeachplant.Thiswillalsobeamarkertoidentifythenewplantforthenextyear.OnceeachplanthasbeengivenanIDtag,identifyNorth.UsingNorthasthefocalpoint,eachleafoneachplantwillneedtobeidentified.Startatthebot-tomoftheplanttonumbertheleaves.Ifaleafhasfallenoffoftheplant,itshouldstillbecountedandlabeled.Thelastdataforthatleafwillcarryoverfromweektoweekthroughoutthedatacollectionperiod.
Plantwithparallel/oppositeleaves• Leavesaredirectlyacrossfromeachother,theleavestotherightofthestem(facingNorth)willbelabeled1A,2A,A3,4A,5A,6A,7A,and8A.• Theleavesonthesameplanttotheleftofthestem(youfacingNorth)willbelabeled1B,2B,3B,4B,5B,6B,7B,8B.
Anopenareaofatleast15-20metersonasidesquareisnecessarytoallowgoodairmovementandnormalprecipitationwithout“rainshadows”,andofgreatestimportance,theplantmustreceivedirectsunlight.Usethenaturalsoilintheareaforplantingeachspeciesintheirowngarden.Thegarden’sloca-tionmustbeawayfromareaswherepesticidesandfertilizersareused.Itisimportantthatnopesticidesorfertilizersareusedinthe“OzoneBioindicatorGar-den”.Inselectingyoursite,somecompromisemaybenecessarybetweentheidealsiteforscientificobserva-tionsandthelogisticalconstraintsoftheareaanditssurroundingsofthesiteavailabletouse.Toensurethevalueofyourdatadocumentthenatureofyourbioin-dicatorsiteanditssurroundings. Thespreadingoftheplantsiscontrolledbydigginguprootsattheendoftheseason,andtrimmingbackanyexcessgrowth.Youmaywanttoletasecondplantgrownexttoeachoftheoriginalplantstodoubleeachspeciesfordatagathering.Ifnot,thentrimbackeachoriginalplant.Besuretoplaceasmallflaginthelocationofthegrowthofeachplantandhavetheplant’sIDnumberontheflag.Also,designateandbeconsistentyeartoyearwithwhichsideoftheplantis“A”or“B”.MakeamapofthelayoutofyoursiteandmarkN,S,E,andWandthelocationofeachlabeledplant.
Plantwithalternatingleaves• Leavesalternateonthestem.Onlythe8bottomleavesarenumbered.• Ifaleafhasfallenoffnearthebot-tomoftheplant,itiscountedasoneofthe8bottomleaves.• Startingfromthebottom,feelalongthestemtomakesureyouarecount-ingleafscarsaswell.Thefirstleafaboveanybasalleavesis1.Continuenumberingleavesupthemainstemuntil8.
37
Site Definition SheetOzone Biomonitoring Garden
SchoolName:________________________ ClassorGroupName_____________________________
Name(s)ofstudent(s)fillinginSiteDefinitionSheet:______________________________________________
Date:________________ Checkone:ConeflowerSite MilkweedSite
SiteName:(Giveyoursiteauniquename)_______________________________________________________
Location:Latitude:_______________NorS Longitude___________________EorW
Elevation:__________meters
SourceofLocation(Checkone)GPS Other(pleasespecify)______________
Describesite:(Includetrees,buildings,etc.thatarenearyoursite).
SendapictureofyoursiteandorientationofgardenlayouttoHandsontheLand.
Drawamodelofyourgardenlayout,labelNorth,South,EastandWest,andplacemarkersingardentoidentifyN,S,E.andW.Numbereachplantandplaceamarkeratthebaseofeachplant.Youwillusethesamenumberfortheplantthatgrowsinthesameareathefollowingyear.

38
Field InstructionRating Ozone-Induced Foliar Injury
Materials• Meterstick• Tagswithstring,andblackpermanentmarkers• Sitelocationflagforeachplantwiththeplantnum-berontheflag• Metricmeasuringtape• %ozoneleafinjuryidentificationchart• ClipboardandPencil• Smallhandmirrortoplaceundertheleaftoseeifdamagegoesthroughleaf• Small10XhandlensNOTE:ThefirstevaluationsshouldoccuratleastbyJune15.Thefinalevaluationshouldbebeforethetypicalfirsthardfrostforyourarea.
ProceduresforPlotEvaluation1.Begincollectingdataonplantsoncetheytallenoughtohaveatleastthreesetsofleavesgrowingfromthemainstem.Thisdatewillvaryaccordingtolocale.
2.Measuretheindividualheightsoftheplantsfrombasetoapex.usingameterstickandrecordheightincentimeters,athinpieceofwoodshouldbecarriedtothebaseofeachplanttopreventthemeterstickfromdepressingintotheground.
3.Whenmeasuringtheheightoftheplant,measureuptothebottomofthehighest,mostopenleaf.Oncetheplantisinbudorflower,holdtheplantstraight,followthemainstem(thethickestbranch)andmea-suretothetopofthetallestbloomonthemainstem.
4.Whencollectingdataontheindividualleaves,startatthebaseoftheplant.
5.Countthetotalnumberofleavesontheplantthatcomedirectlyoffofthemainstem.Donotcountapicalleavesthatarenotfullyexpanded.(Ingeneral,evaluateonlyleavesthatareatleast65%expanded).Donotcountleavesthatareonsub-branchestothemainstem.Docountleafscarswhereleaveshavefallenoff(runyourhandupthestemtofeelforleafscars).
6.Estimatethepercentageoftotalleafareaofeachleafthathasozone-inducedinjury.Ratingclassesare1=0%,2=1%-6%,3=7%-25%,4=26%-50%,5=51%-75%,6=76-100%.TheplantsareratedonC=clorosis(yellowing),P=purpling(stippling),N=necrosis(death).Necrosisisvisibleonbothsidesofaleafunlikepurplingwhichonlyappearsontheupperleafsurface.
7.Asozoneinjuryprogresses,purplingwillturnintonecrosis.Soitdoesn’tappearthattheplanthasimproved,itisimportanttocarryoverthepreviousweek’sdataforpurpling(e.g.ifaleaf’snecrosisratinggoesuptoa5,thepurplingmaynolongerbeappar-ent.Ithasn’tgottenbetter,ithasjustprogressedtoapointwhereithaschangedfrominjurytodeadtissue.Carryoverthelastdataentryforpurpling).
8.Ideally,datashouldbecollectedonceaweek.Ifthatisnotpossible,tryforatleastoncepermonth.
9.Asthesummerseasoncomestoaclose,recordthenumberofflowersandseedpodsperplant.
10.Forplantswithoppositeleaves,eachfacingpairofleavesisoneset.Foralternateleafplants,suchastheconeflower,countonlytheleavescomingoffofthemainstem.
11.Usecautionwhencheckingthebackoftheleaf,especiallyifyounoticeanysymptoms.Theseleaveswillbecomefragileandwillbreakoffeasily.Getdowncloseandgentlyturntheleafovertomakeyourobservationoruseahandmirrotoreflecttheunder-side.
12.Ifaleafbreaksoff,makesuretoassignittheap-propriateleaflosscode.7-leafgonewithnopriorsymptoms8-leafgonewithpriorchlorosis(yellowing)only9-leafgonewithpriorpurplingonly(ozone)10-leafgonewithpriorpurplingstipplingandchlorosis
13.Whenaleaffallsoff,carryitslastdataentryoverintoallofthefollowingdatacollectionentries.Thisistoshowleaflossonagraphasopposedtoleafim-provement.
39
14.Nevermakeassumptionsaboutwhatyouaresee-ing,justratewhatyouseeatthatpointintime.(Whatofinsectfeedingorsomeothersymptomthatisuncer-tain,contactSusanSachsat:[email protected]?Includedigitalphotosifpossible?
15.Duringtheseason,insectswilleatpartofsomeleaves.Ratetheleafsurfaceareathatisvisible,butthenalsonoteinthecommentsareaforthatleafthepercentageofthetotalleafareamissing.
16.Studentsneedtobeawareofmimickingsymptomsandotherpestproblemsthatlooklikeozoneairpollu-tioninjurytosensitiveplants.Somestrategiesare: a.Lookatolderleavesastheyshouldhavethemostinjury.Ifyoungerleaveshavethemostinjury,thenitisnotozonedamagethatyouareobserving. b.Thepurplestipplingshouldbeonthesurfaceoftheleafonlyandnotontheundersideoftheleaf. c.Thepurplestippling(orsmallpurpledots)donotenteranyoftheveins. d.Beawareofmimickingsymptoms,andotherpestproblemsthatlooklikeozoneinjury.
40
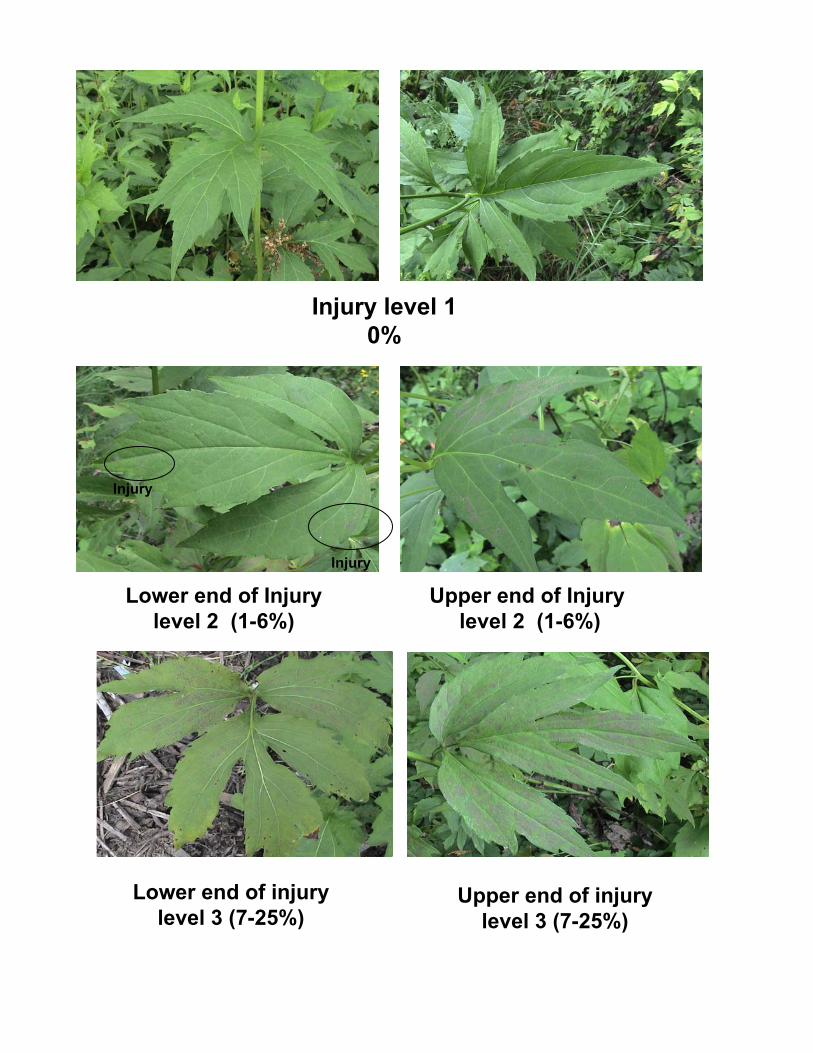
Injury level 10%
Lower end of Injury level 2 (1-6%)
Lower end of injury level 3 (7-25%)
Upper end of Injury level 2 (1-6%)
Upper end of injury level 3 (7-25%)
Injury
Injury
41
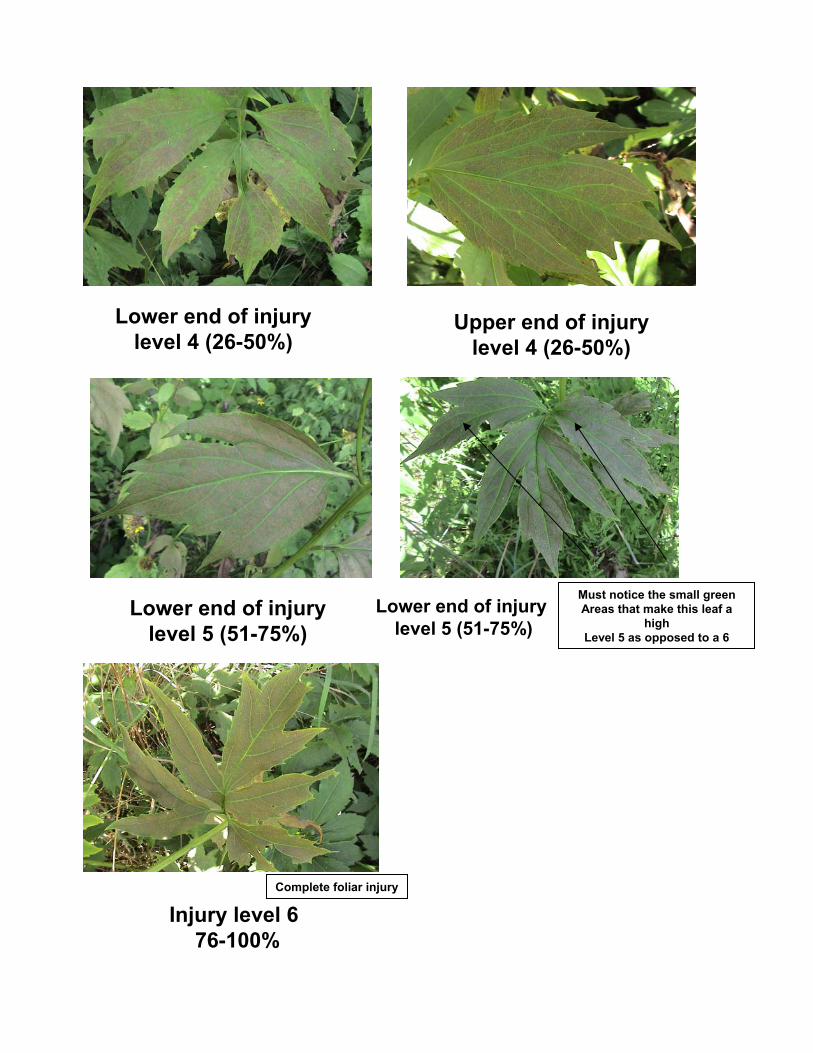
Lower end of injury level 4 (26-50%)
Lower end of injury level 5 (51-75%)
Injury level 676-100%
Upper end of injury level 4 (26-50%)
Lower end of injury level 5 (51-75%)
Must notice the small green Areas that make this leaf a
high Level 5 as opposed to a 6
Complete foliar injury
42
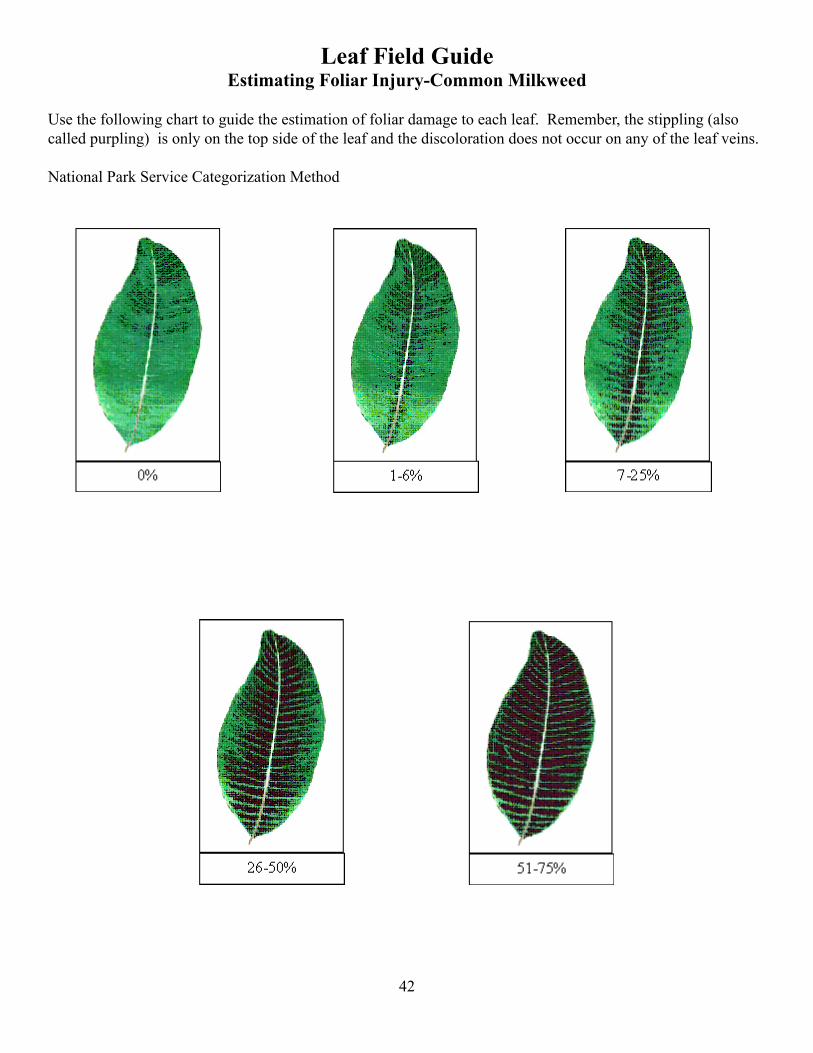
Leaf Field GuideEstimating Foliar Injury-Common Milkweed
Usethefollowingcharttoguidetheestimationoffoliardamagetoeachleaf.Remember,thestippling(alsocalledpurpling)isonlyonthetopsideoftheleafandthediscolorationdoesnotoccuronanyoftheleafveins.NationalParkServiceCategorizationMethod

43
Garden Location: Plant ID #:
Plant species: Plant height (cm):
Total # of leaves on the entire plant:
Observations (inflower,inbud...)
Ozone Bio-monitoring Garden Data Sheet - Alternate Leaves
Group Name: Date:
Ratethe%ofozonesymptomscoveringtheentireleafP=purpling(reddish-purpleinjuryspotscausedbyozone)
1
2
3
4
5
6
7
8
TOP OF PLANT
BOTTOM OF PLANT
�0%1-6%7-25%26-50%51-75%76-100
leafpresent missing
P
Observations
0%1-6%7-25%26-50%51-75%76-100leafpresent missing
P
Observations
0%1-6%7-25%26-50%51-75%76-100leafpresent missing
P
Observations
0%1-6%7-25%26-50%51-75%76-100leafpresent missing
P
Observations
0%1-6%7-25%26-50%51-75%76-100leafpresent missing
P
Observations
0%1-6%7-25%26-50%51-75%76-100leafpresent missing
P
Observations
0%1-6%7-25%26-50%51-75%76-100leafpresent missing
P
Observations
0%1-6%7-25%26-50%51-75%76-100leafpresent missing
P
Observations
AlternateLeafDataSheet-VersionI
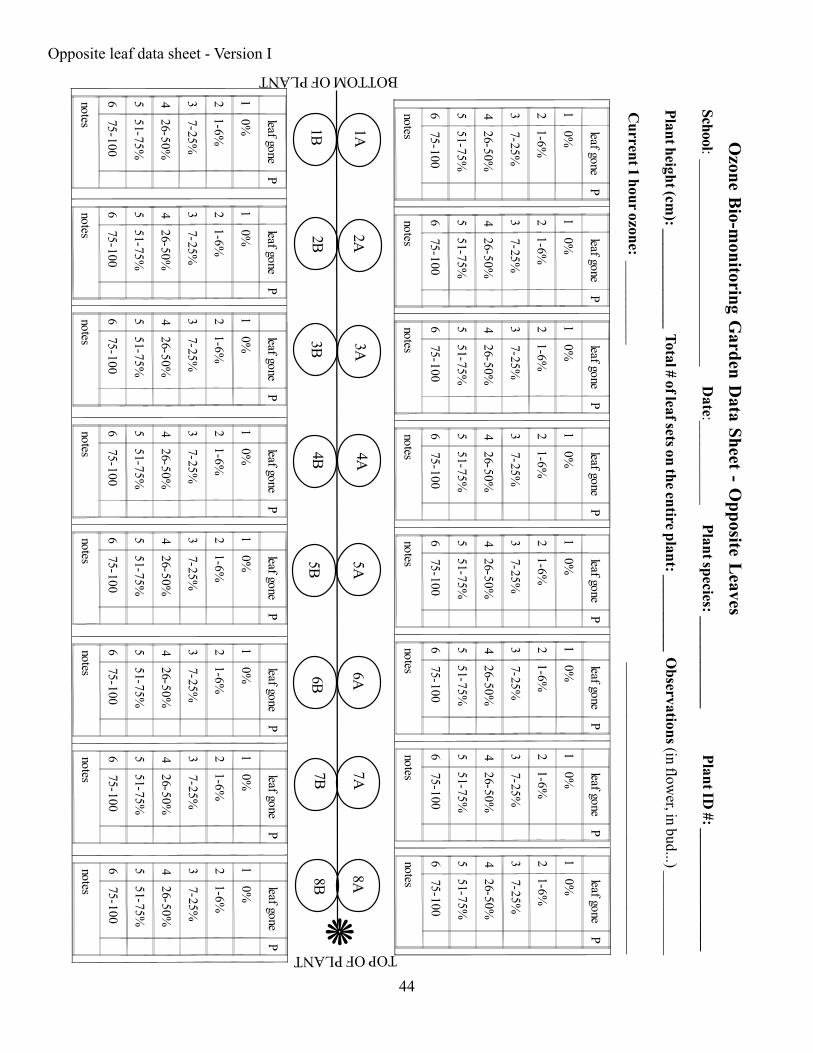
44
Ozone B
io-monitoring G
arden Data Sheet
- Opposite L
eavesSchool:___________________________
Date:___________
Plant species: ____________Plant ID
#: ________________
Plant height (cm): _____________ Total # of leaf sets on the entire plant: __________ O
bservations (inflower,inbud...)___________
Current 1 hour ozone:___________
______________________________________
4A4B
5A5B
6A6B
7A7B
8A8B�
TOPOFPLANT
leafgoneP
10%
21-6%
37-25%
426-50%
551-75%
675-100
notes
leafgoneP
10%
21-6%
37-25%
426-50%
551-75%
675-100
notes
leafgoneP
10%
21-6%
37-25%
426-50%
551-75%
675-100
notes
leafgoneP
10%
21-6%
37-25%
426-50%
551-75%
675-100
notes
leafgoneP
10%
21-6%
37-25%
426-50%
551-75%
675-100
notes
leafgoneP
10%
21-6%
37-25%
426-50%
551-75%
675-100
notes
leafgoneP
10%
21-6%
37-25%
426-50%
551-75%
675-100
notes
leafgoneP
10%
21-6%
37-25%
426-50%
551-75%
675-100
notes
1A2A
3A
1B2B
3B
BOTTOMOFPLANT
leafgoneP
10%
21-6%
37-25%
426-50%
551-75%
675-100
notes
leafgoneP
10%
21-6%
37-25%
426-50%
551-75%
675-100
notes
leafgoneP
10%
21-6%
37-25%
426-50%
551-75%
675-100
notes
leafgoneP
10%
21-6%
37-25%
426-50%
551-75%
675-100
notes
leafgoneP
10%
21-6%
37-25%
426-50%
551-75%
675-100
notes
leafgoneP
10%
21-6%
37-25%
426-50%
551-75%
675-100
notes
leafgoneP
10%
21-6%
37-25%
426-50%
551-75%
675-100
notes
leafgoneP
10%
21-6%
37-25%
426-50%
551-75%
675-100
notes
Oppositeleafdatasheet-VersionI
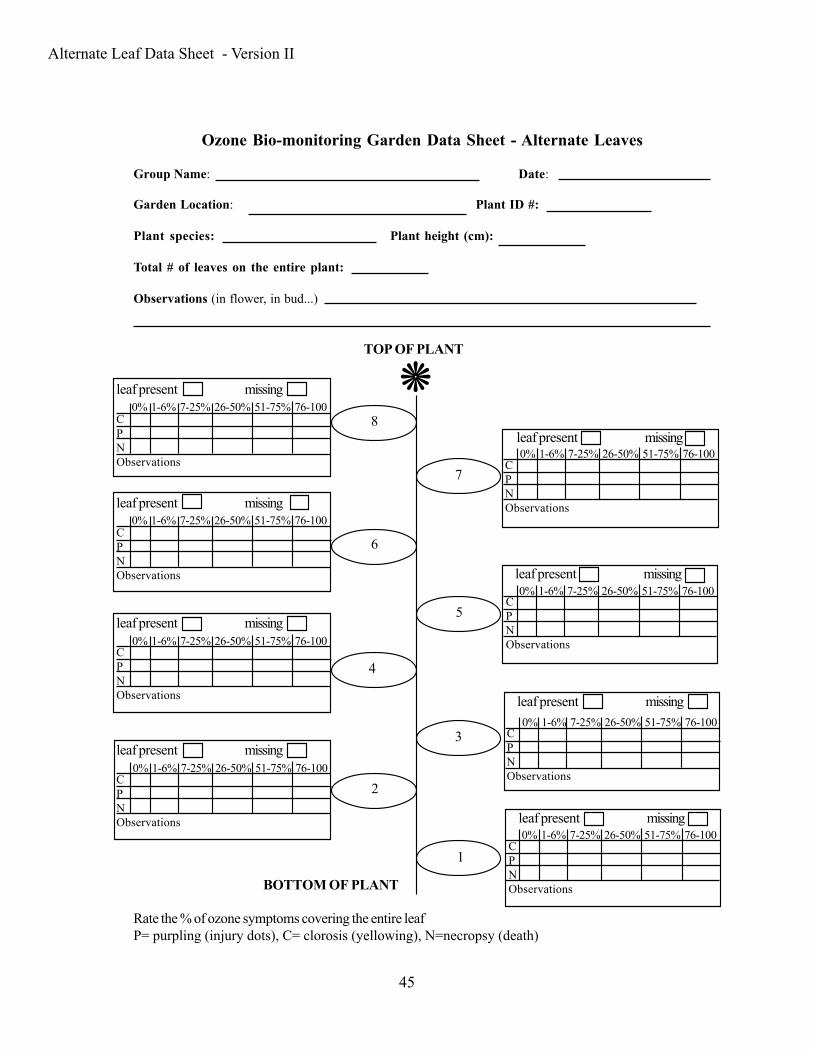
45
Garden Location: Plant ID #:
Plant species: Plant height (cm):
Total # of leaves on the entire plant:
Observations (inflower,inbud...)
Ozone Bio-monitoring Garden Data Sheet - Alternate Leaves
Group Name: Date:
Ratethe%ofozonesymptomscoveringtheentireleafP=purpling(injurydots),C=clorosis(yellowing),N=necropsy(death)
1
2
3
4
5
6
7
8
leafpresent missing0%1-6%7-25%26-50%51-75%76-100
CPNObservations
TOP OF PLANT
leafpresent missing0%1-6%7-25%26-50%51-75%76-100
CPNObservations
leafpresent missing
leafpresent missing
leafpresent missing
leafpresent missing
leafpresent missing
leafpresent missing
0%1-6%7-25%26-50%51-75%76-100
0%1-6%7-25%26-50%51-75%76-100
0%1-6%7-25%26-50%51-75%76-100
0%1-6%7-25%26-50%51-75%76-100
0%1-6%7-25%26-50%51-75%76-100
0%1-6%7-25%26-50%51-75%76-100
CPNObservations
CPNObservations
CPNObservations
CPNObservations
CPNObservations
CPNObservations
BOTTOM OF PLANT
�
AlternateLeafDataSheet-VersionII

46
OppositeLeafDataSheet-VersionII Ozone Biomonitoring Data Sheet - Opposite LeavesCollector Names: _____________________________________________________ Date:_________________
Garden Location: ______________________________
Plant Species: _____________________________________ Plant ID#:_______________________
Plant Height (cm): _________________________________ Total # of leaf pairs: ______________
Observations (in flower, in bud...) _____________________________________________________________
Leaf present Leaf missing
0% 1-6% 7-25% 26-50% 51-75% 76-100%
P
C
N
8A
Leaf present Leaf missing
0% 1-6% 7-25% 26-50% 51-75% 76-100%
P
C
N
Leaf present Leaf missing
0% 1-6% 7-25% 26-50% 51-75% 76-100%
P
C
N
Leaf present Leaf missing
0% 1-6% 7-25% 26-50% 51-75% 76-100%
P
C
N
Leaf present Leaf missing
0% 1-6% 7-25% 26-50% 51-75% 76-100%
P
C
N
Leaf present Leaf missing
0% 1-6% 7-25% 26-50% 51-75% 76-100%
P
C
N
Leaf present Leaf missing
0% 1-6% 7-25% 26-50% 51-75% 76-100%
P
C
N
Leaf present Leaf missing
0% 1-6% 7-25% 26-50% 51-75% 76-100%
P
C
N
Leaf present Leaf missing
0% 1-6% 7-25% 26-50% 51-75% 76-100%
P
C
N
Leaf present Leaf missing
0% 1-6% 7-25% 26-50% 51-75% 76-100%
P
C
N
Leaf present Leaf missing
0% 1-6% 7-25% 26-50% 51-75% 76-100%
P
C
N
Leaf present Leaf missing
0% 1-6% 7-25% 26-50% 51-75% 76-100%
P
C
N
Leaf present Leaf missing
0% 1-6% 7-25% 26-50% 51-75% 76-100%
P
C
N
Leaf present Leaf missing
0% 1-6% 7-25% 26-50% 51-75% 76-100%
P
C
N
Leaf present Leaf missing
0% 1-6% 7-25% 26-50% 51-75% 76-100%
P
C
N
Leaf present Leaf missing
0% 1-6% 7-25% 26-50% 51-75% 76-100%
P
C
N
7A
8B
6A
5A
4A
3A
2A
1A
7B
6B
5B
4B
3B
2B
1B
Bottom of Plant P= purpling (injury dots) C=chlorosis (yellowing) N=necropsy (death)
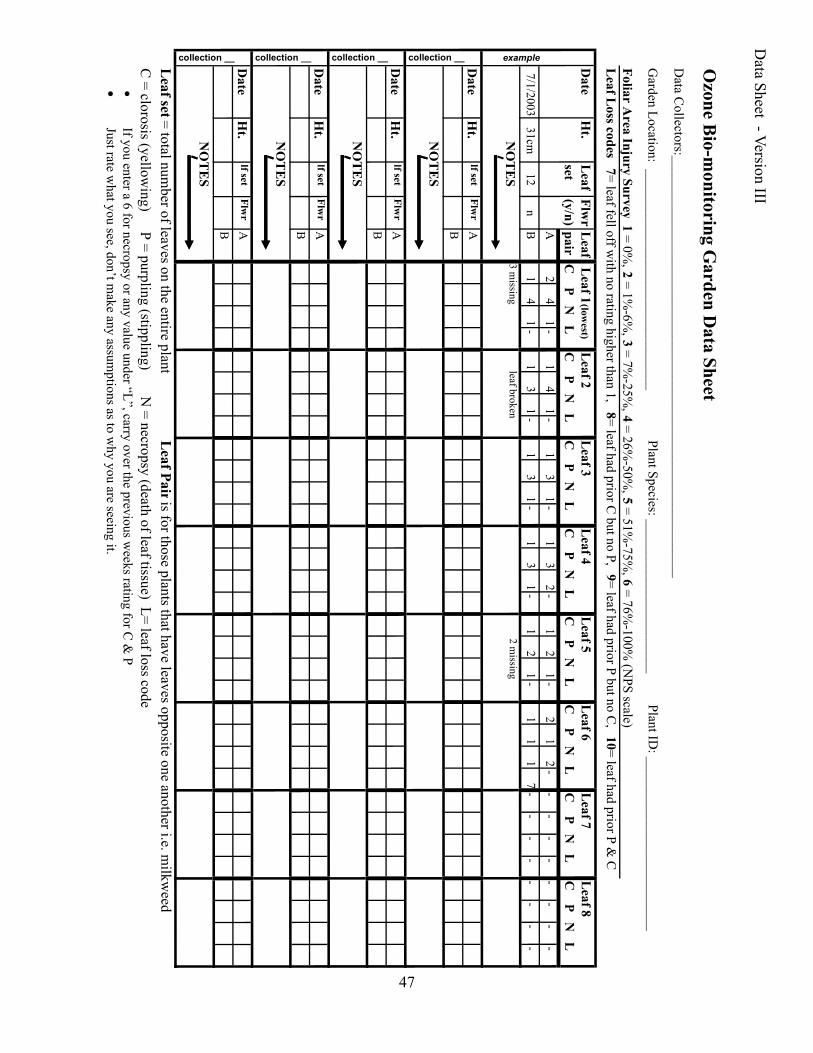
47
Ozone B
io-monitoring G
arden Data Sheet
DataC
ollectors:_______________________________________________________________
GardenLocation:_________________________________
PlantSpecies:_______________________PlantID
:__________________________
Foliar Area Injury Survey
1=0%,2=1%
-6%,3=7%
-25%,4=26%
-50%,5=51%
-75%, 6=76%
-100%(N
PSscale)L
eaf Loss codes
7=leaffelloffwithnoratinghigherthan1,
8=leafhadpriorCbutnoP,
9=leafhadpriorPbutnoC,
10=leafhadpriorP&C
Leaf
Flwr
Leaf
set(y/n)
pairA
24
1-
14
1-
13
1-
13
2-
12
1-
21
2-
--
--
--
--
7/1/200331cm
12n
B1
41-
13
1-
13
1-
13
1-
12
1-
11
17-
--
--
--
-
Date
Ht.
lf setFlw
rAB
Date
Ht.
lf setFlw
rAB
Date
Ht.
lf setFlw
rAB
Date
Ht.
lf setFlw
rAB
Leaf set=totalnum
berofleavesontheentireplantL
eaf Pairisforthoseplantsthathaveleavesoppositeoneanotheri.e.milkw
eedC=clorosis(yellow
ing)P=purpling(stippling)
N=necropsy(deathofleaftissue)L=leaflosscode
•Ifyouentera6fornecropsyoranyvalueunder“L”,carryoverthepreviousweeksratingforC
&P
•Justratewhatyousee,don’tm
akeanyassumptionsastow
hyyouareseeingit.
NO
TE
S
examplecollection __collection __collection __collection __ Date
Ht.N
OT
ES
NO
TE
S
NO
TE
S
NO
TE
S
Leaf 8
C P N
L
3missing
leafbroken2m
issing
Leaf 6
C P N
LL
eaf 7L
eaf 3C
P N L
C P N
LL
eaf 4C
P N L
Leaf 5
C P N
L L
eaf 1(low
est)C
P N L
Leaf 2
C P N
L
DataSheet-VersionIII
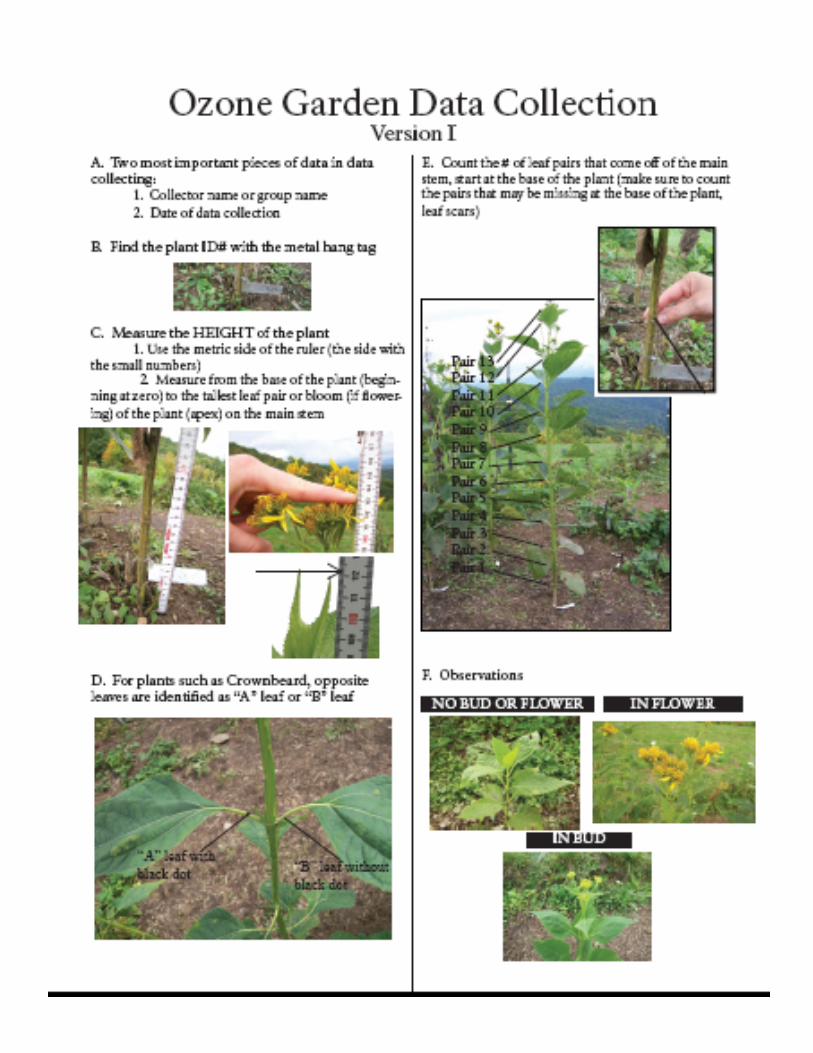
48
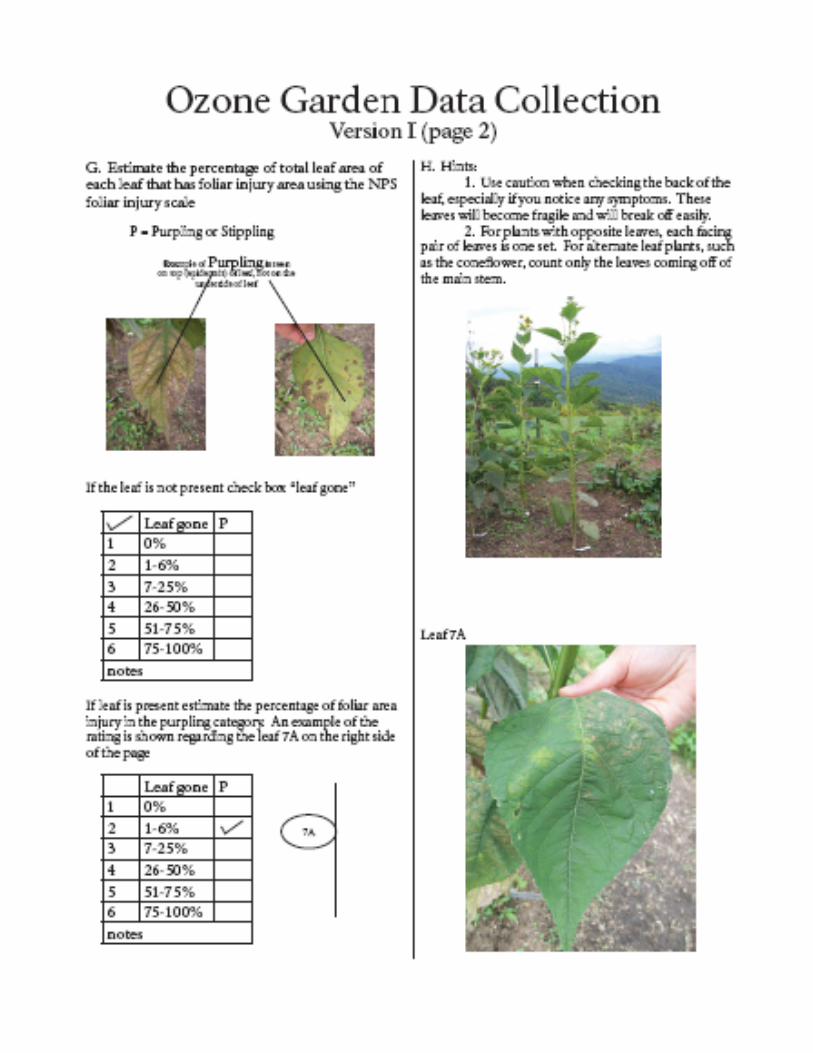
49
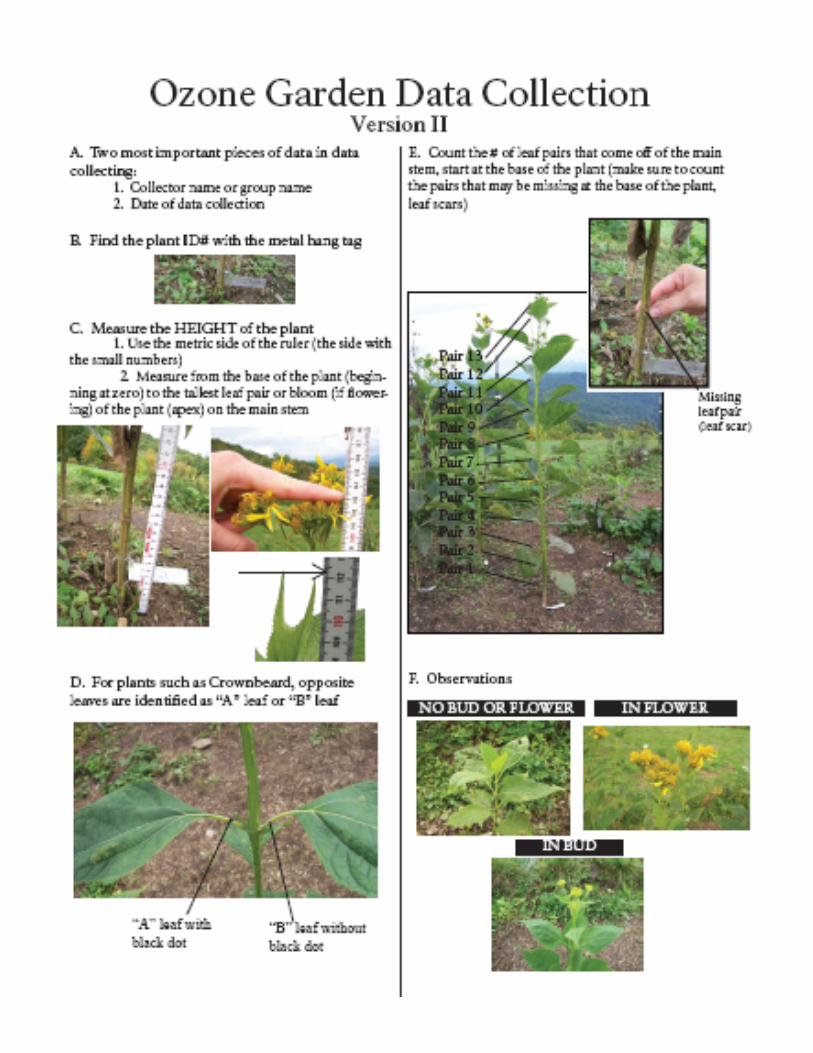
50
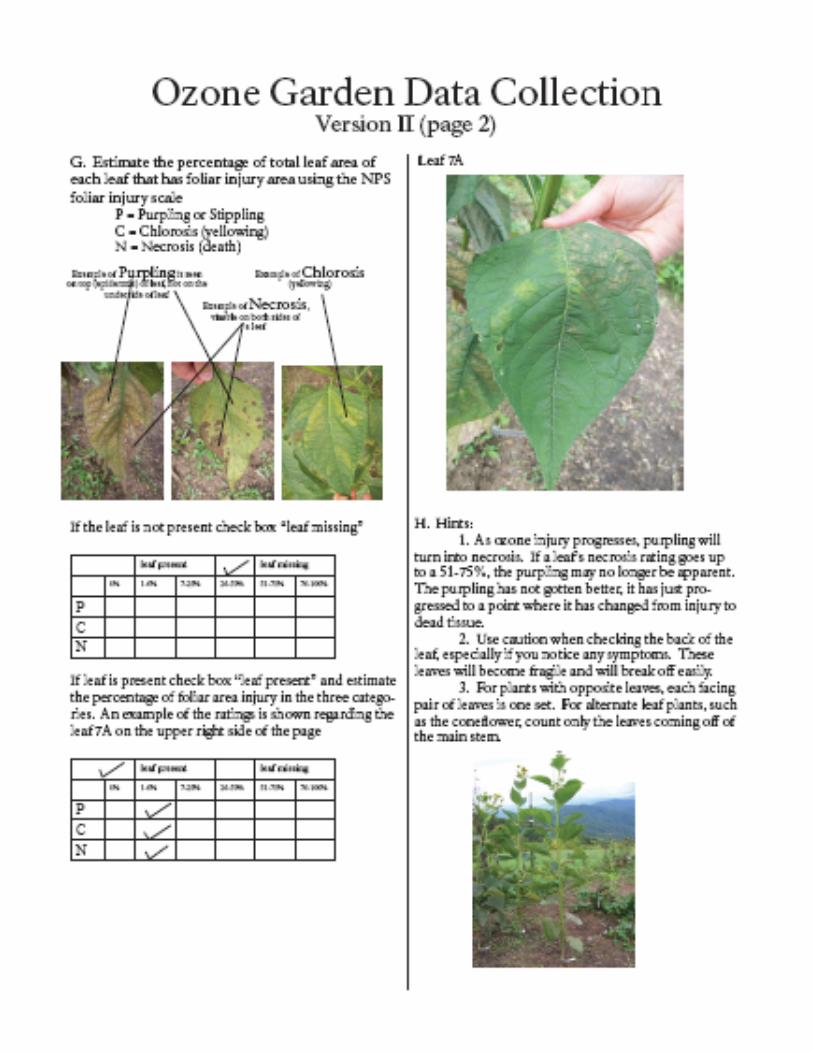
51
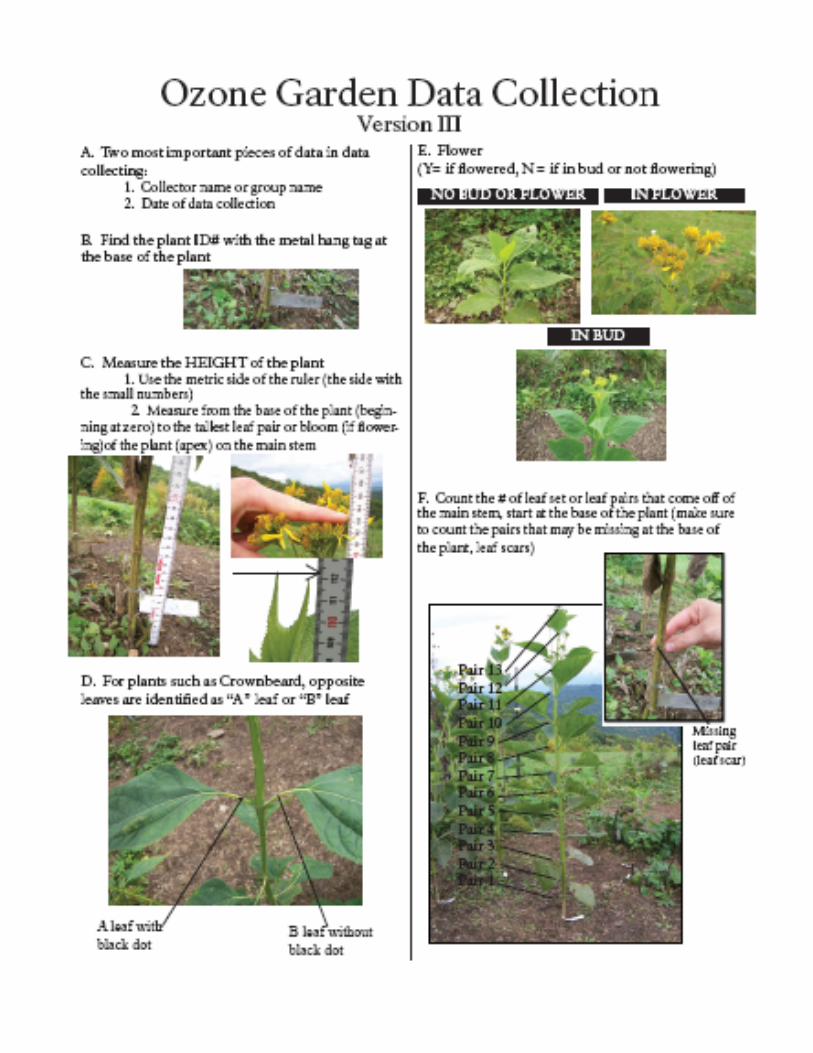
52

53
54
TheseWebpagesshouldprovehelpful,andwillpro-videmanyotherlinks.
1.www.epa.gov
USEnvironmentalProtectionAgencyhomepage:Lotsofinformationregardingairquality(standards,emis-sions,effects,etc.),climatechange,ecosystemeffects.
2.www.noaa.gov
NationalOceanic&AtmosphericAdministrationhomepage:Goodinformationregardingairquality(mainlyatmosphericchemistry&meteorology),cli-matechange.
3.www.ncar.ucar.edu
NationalCenterforAtmosphericResearchhomepage:Lotsofgoodinformationrelatedtoglobalclimatechange,carbonbudgets,&atmosphericchemistry.De-scriptionofalarge-scaleglobalclimatechangemodel.
4.www.ncl.ac.uk/gane
Webpagerelatedtoamajorprogramdealingwithnitrogendeposition&effects.Followthelinksfordetailedinformation.
5.www.ncl.ac.uk/airweb
Webpagerelatedtoadescriptionofbiologicaleffectsforozone,fluoride,andsulfurdioxide.Followthelinksfordetailedinformation.
6.www.ipcc.chIntergovernmentalPanelonClimateChangehomep-age.Somegoodinformationrelatedtoglobalclimatechange.
7.www2.nature.nps.gov/air/ NationalParkService’swebsiteonairqualityinparks.Includesissues,dataandwebcameras.
8.nadp.sws.uiuc.edu.
AdescriptionoftheNationalAtmosphericDeposi-tionProgam/NationalTrendsNetwork(NADP/NTN)nationalnetworkformonitoringacidicdeposition.
9.www.asl-associates.com.
Webpagededicatedtoinformationaboutairpollution,primarilyozone,particulatesandsulfurdioxide.
10.www.epa.gov/airnow.
Realtimeimagedemonstrationofozonebuildupovertimeandcategoriesofseverity.
11.www.ace.mmu.ac.uk.
GototheResourcesIndex.Therearemanydifferentfactsheetsandteachingresourcesthatwillbeofhelptoyou.Isuggestyoulookatthissite.
12.www.ozone.wsl.ch
Webpageshowingvisibleozoneinjuryofseveralsen-sitiveplantsandhowtousethisinformationinassess-ment.
13.www.fia.fs.fed.us&www.fiaozone.net/index.html
InterestinginformationconcerningtheUSDAForestService’sForestHealthMonitoringProgram.
14.http://reports.eea.eu.int
EuropeanEnvironmentAgencyWebsite.
15.www.heinzcenter.org/ecosystems/index.htm
AreportonthestateoftheNation’secosystems.Goodinformationregardingindicatorsofecosystemchange.
16.mona.psu.edu
Alinktoafoliarinjuryassessmentmodule.Atrainingtoolusedforindividualsintheassessmentofairpollu-
Some Useful WebpagesProvidedbyDr.ArtChappelka

55
tioninjurytovegetation.
17.www2.nature.nps.gov/air/pubs/index.htm.
AlinktovariouspublicationsrelatedtoairqualitybytheNPS.
18.airlichen.nacse.org/.
Thisisagoodwebsiteforinformationonlichensasbioindicatorsofairpollution.
19.toxmap.nlm.nih.gov/toxmap/main/index.jsp.
Thiswebsiteprovidessomeinformationandmapsregardingenvironmentalhealthandtoxicology.
20.reports.eea.eu.int/EMEPCORINAIR4/en.
Linkstovariousinventorymodels,etc.inEurope.
56
REFERENCES
Horsefall,J.G.,Barreatt,R.W.1945.AnImprovedGradingsystemforMeasuringPlantDisease. Phytopathology35,655.
Duchelle,S.F.,Skelly,J.M.andKress,L.W.1980.Theimpactofphotochemicaloxidantairpollutiononbio massdevelopmentofnativevegetationandsymptomexpressionofAesclepiasspp.Phytopathol.70:689.
Duchelle,S.F.andSkelly,J.M.1981.TheresponseofAsclepiassyriacatooxidantairpollutioninthe ShenandoahNationalParkofVirginia.PlantDisease65:661-663.
Skelly,J.M.,Davis,D.D.,Merrill,W.,Cameron,E.A.,Brown,H.D.,Drummond,D.B.,andDochinger,L. S.(eds.)1987.DiagnosingInjurytoEasternForestTrees.USDA-For.Ser.,Veg.SurveyRes.Coop.and PennStateUniv.,UniversityPark,PA.122p.
Hildebrand,E.S.,Skelly,J.M.andFredericksen,T.S.1996.Foliarresponseofozonesensitivehardwoodtree speciesfrom1991-1993intheShenandoahNationalPark,VA.Can.J.For.Res.26:658-669.
Neufeld,H.S.,Renfro,H.S.,Hacker,W.D.,andSilsbee,D.1992.OzoneinGreatSmokyMountainsNational Park:DynamicsandEffectsonPlants.In“TroposphericOzoneandtheEnvironmentII”,editedbyR.L. Berglund,Air&WasteManagementAssoc.,pp.594-617
Skelly,J.M.1998.AbriefassessmentofforesthealthinnortheasternUnitedStatesandsoutheasternCanada. NortheasternNaturalist5(2)137-142.
Skelly,J.M.2000.Troposphericozoneanditsimportancetoforestsandnaturalplantcommunitiesofthenorth easternUnitedStates.NortheasternNaturalist(3)221-236.
Innes,J.L.,Skelly,J.M.andSchaub,M.2001.Aguidetotheidentificationofozone-inducedfoliarinjuryon broadleavedtree,shrubandherbspecies.PaulHauptPublishing,Bern,Switzerland.ISBNNo.3-258- 06384-2.136pp.
Chappelka,A.H.,Neufeld,H.S.,Davison,A.W.,Somers,G.L.,andRenfro,J.R.2002.Ozoneinjuryoncutleaf coneflower(Rudbeckialaciniata)andcrown-beard(Verbesinaoccidentalis)inGreatSmokeyMountains NationalPark.EnvironmentalPollution125(2003)pp.53-59.
Orendovici.T.,Skelly,J.M.,Ferdinand,J.A.,Savage,J.E.,Sanz,M-J.andSmith,G.C.2003.Responseof nativeplantsofnortheasternUnitedStatesandsouthernSpaintoozoneexposures:Determiningexposure/re sponserelationships.EnvironmentalPollution125:31-40
Yuska,D.E.,Skelly,J.M.,Ferdinand,J.A.,Stevenson,R.E.,Savage,J.E.,Mulik,J.D.andHines,A.2003. Useofbioindicatorsandpassivesamplingdevicestoevaluateambientozoneconcentrationsinnorthcentral Pennsylvania.EnvironmentalPollution125:71-80.
Skelly,J.M.2003.Nativeplantsasbioindicatorsofairpollutants:contributedpaperstoasymposiumheldin conjunctionwiththe34thairpollutionworkshop.EnvironmentalPollution125:1-2.
Related Documents