Sensors 2009, 9, 5040-5058; doi:10.3390/s90705040 sensors ISSN 1424-8220 www.mdpi.com/journal/sensors Article Sunflower Plants as Bioindicators of Environmental Pollution with Lead (II) Ions Olga Krystofova 1 , Violetta Shestivska 1,2 , Michaela Galiova 3 , Karel Novotny 3 , Jozef Kaiser 4 , Josef Zehnalek 1 , Petr Babula 5 , Radka Opatrilova 5 , Vojtech Adam 1,6 and Rene Kizek 1,* 1 Department of Chemistry and Biochemistry, Mendel University of Agriculture and Forestry, Zemedelska 1, CZ-613 00 Brno, Czech Republic 2 Department of Plant Biology, Mendel University of Agriculture and Forestry, Zemedelska 1, CZ-613 00 Brno, Czech Republic 3 Department of Chemistry, Faculty of Science, Masaryk University, Kotlarska 2, CZ-611 37 Brno, Czech Republic 4 Institute of Physical Engineering, Faculty of Mechanical Engineering, Brno University of Technology, Technicka 2896/2, CZ-616 69 Brno, Czech Republic 5 Department of Natural Drugs, Faculty of Pharmacy, University of Veterinary and Pharmaceutical Sciences, Palackeho 1-3, CZ-612 42 Brno, Czech Republic 6 Department of Animal Nutrition and Forage Production, Faculty of Agronomy, Mendel University of Agriculture and Forestry, Zemedelska 1, CZ-613 00 Brno, Czech Republic * Author to whom correspondence should be addressed; E-Mail: [email protected] Received: 31 May 2009; in revised form: 22 June 2009 / Accepted: 24 June 2009 / Published: 25 June 2009 Abstract: In this study, the influence of lead (II) ions on sunflower growth and biochemistry was investigated from various points of view. Sunflower plants were treated with 0, 10, 50, 100 and/or 500 μM Pb-EDTA for eight days. We observed alterations in growth in all experimental groups compared with non-treated control plants. Further we determined total content of proteins by a Bradford protein assay. By the eighth day of the experiment, total protein contents in all treated plants were much lower compared to control. Particularly noticeable was the loss of approx. 8 μg/mL or 15 μg/mL in shoots or roots of plants treated with 100 mM Pb-EDTA. We also focused our attention on the activity of alanine transaminase (ALT), aspartate transaminase (AST) and urease. Activity of the enzymes increased with increasing length of the treatment and applied concentration OPEN ACCESS

Welcome message from author
This document is posted to help you gain knowledge. Please leave a comment to let me know what you think about it! Share it to your friends and learn new things together.
Transcript

Sensors 2009, 9, 5040-5058; doi:10.3390/s90705040
sensors ISSN 1424-8220
www.mdpi.com/journal/sensors
Article
Sunflower Plants as Bioindicators of Environmental Pollution with Lead (II) Ions
Olga Krystofova 1, Violetta Shestivska 1,2, Michaela Galiova 3, Karel Novotny 3, Jozef Kaiser 4,
Josef Zehnalek 1, Petr Babula 5, Radka Opatrilova 5, Vojtech Adam 1,6 and Rene Kizek 1,*
1 Department of Chemistry and Biochemistry, Mendel University of Agriculture and Forestry,
Zemedelska 1, CZ-613 00 Brno, Czech Republic 2 Department of Plant Biology, Mendel University of Agriculture and Forestry, Zemedelska 1,
CZ-613 00 Brno, Czech Republic 3 Department of Chemistry, Faculty of Science, Masaryk University, Kotlarska 2, CZ-611 37 Brno,
Czech Republic 4 Institute of Physical Engineering, Faculty of Mechanical Engineering, Brno University of
Technology, Technicka 2896/2, CZ-616 69 Brno, Czech Republic 5 Department of Natural Drugs, Faculty of Pharmacy, University of Veterinary and Pharmaceutical
Sciences, Palackeho 1-3, CZ-612 42 Brno, Czech Republic 6 Department of Animal Nutrition and Forage Production, Faculty of Agronomy, Mendel University of
Agriculture and Forestry, Zemedelska 1, CZ-613 00 Brno, Czech Republic
* Author to whom correspondence should be addressed; E-Mail: [email protected]
Received: 31 May 2009; in revised form: 22 June 2009 / Accepted: 24 June 2009 /
Published: 25 June 2009
Abstract: In this study, the influence of lead (II) ions on sunflower growth and
biochemistry was investigated from various points of view. Sunflower plants were treated
with 0, 10, 50, 100 and/or 500 µM Pb-EDTA for eight days. We observed alterations in
growth in all experimental groups compared with non-treated control plants. Further we
determined total content of proteins by a Bradford protein assay. By the eighth day of the
experiment, total protein contents in all treated plants were much lower compared to
control. Particularly noticeable was the loss of approx. 8 µg/mL or 15 µg/mL in shoots or
roots of plants treated with 100 mM Pb-EDTA. We also focused our attention on the
activity of alanine transaminase (ALT), aspartate transaminase (AST) and urease. Activity
of the enzymes increased with increasing length of the treatment and applied concentration
OPEN ACCESS
Sensors 2009, 9
5041
of lead (II) ions. This increase corresponds well with a higher metabolic activity of treated
plants. Contents of cysteine, reduced glutathione (GSH), oxidized glutathione (GSSG) and
phytochelatin 2 (PC2) were determined by high performance liquid chromatography with
electrochemical detection. Cysteine content declined in roots of plants with the increasing
time of treatment of plants with Pb-EDTA and the concentration of toxic substance.
Moreover, we observed ten times higher content of cysteine in roots in comparison with
shoots. The observed reduction of cysteine content probably relates with its utilization for
biosynthesis of GSH and phytochelatins, because the content of GSH and PC2 was similar
in roots and shoots and increased with increased treatment time and concentration of Pb-
EDTA. Moreover, we observed oxidative stress caused by Pb-EDTA in roots where the
GSSG/GSH ratio was about 0.66. In shoots, the oxidative stress was less distinctive, with a
GSSG/GSH ratio 0.14. We also estimated the rate of phytochelatin biosynthesis from the
slope of linear equations plotted with data measured in the particular experimental group.
The highest rate was detected in roots treated with 100 µM of Pb-EDTA. To determine
heavy metal ions many analytical instruments can be used, however, most of them are only
able to quantify total content of the metals. This problem can be overcome using laser
induced breakdown spectroscopy, because it is able to provide a high spatial-distribution of
metal ions in different types of materials, including plant tissues. Data obtained were used to
assemble 3D maps of Pb and Mg distribution. Distribution of these elements is concentrated
around main vascular bundle of leaf, which means around midrib.
Keywords: phytoremediation; heavy metals; sunflower; lead ions; high performance liquid
chromatography with electrochemical detection; spectrometry; laser induced breakdown
spectroscopy
1. Introduction
Environmental remediation deals with the removal of contaminants from soil, groundwater,
sediment, surface water etc. for the general protection of human health and the environment [1].
Remediation processes can be expensive, as the are mostly ex-situ methods involving excavation of
impacted soils and subsequent treatment at the surface. Therefore new, efficient, inexpensive and non-
environmentally disruptive technologies are still developing. One of the groups of such new
technologies is called bioremediation. It involves the treatment of environmental problems through
organisms. Microorganisms (e.g., Desulfomonile, Clostridium, Pseudomonas, Acinetobacter) and
plants (e.g., Betula, Populus) are most commonly used for these purposes [2-7]. If plants are used, we
call this process phytoremediation [1,8-10]. A range of processes mediated by plants are useful in
treating environmental problems. Plants can chemically modify toxic substances as a direct result of
plant metabolism (phytotransformation), can reduce the mobility of substances in the environment
(phytostabilization) or uptake and concentrate substances from the environment into the plant biomass
(phytoextraction). The scheme of various ways how to a plant metabolizes or deposit the pollutant is
shown in Figure 1.

Sensors 2009, 9
5042
Figure 1. Phytoremediation can occur through a series of complex interactions between
plants, microbes, and the soil, including accumulation, hyperaccumulation, exclusion,
volatilization, and degradation of the target pollutant. Plants also stabilize mobile
contaminated sediments by forming dense root mats inside soil.
VolatilizationTranspiration
Inorganics Organics
Accumulation
Heavy metals,Radionuclides,
Metabolites
Rhizosphaeric metabolism
Metals,Organics,
Radionuclides
Heavy metals,Radionuclides Chlorinated
hydrocarbons
Mercury,Selenium
VolatilizationTranspiration
Inorganics Organics
Accumulation
Heavy metals,Radionuclides,
Metabolites
Heavy metals,Radionuclides,
Metabolites
Rhizosphaeric metabolism
Metals,Organics,
Radionuclides
Heavy metals,Radionuclides Chlorinated
hydrocarbons
Mercury,Selenium
Most toxic substances (organic pollutants, heavy metals) come from anthropogenic activities such
as mining, traffic, heavy industry, etc. [11-13]. Contrary to organic pollutants, heavy metals cannot be
degraded or destroyed. To a small extent they enter our bodies via food, drinking water and air. As
trace elements, some heavy metals (e.g., copper, selenium, zinc) are essential to maintain the
metabolism of the human body. However, others such as cadmium, lead, and mercury are toxic at all.
At higher concentrations both groups of heavy metals (toxic and essential) can lead to poisoning [13].
Heavy metals are also dangerous because they tend to bioaccumulate. Lead is one of the most
dangerous and toxic heavy metals. Levels of lead in the environment are not stable and vary according
to industrial production, urbanization, climate changes and many other factors [14]. The levels of lead
in the environment vary between 4 and 20 mg/g of dust. Uncontaminated waters contain lead in
concentrations ranging from 0.001 to 0.06 mg/L. In soils, levels of lead reach 5 to 30 mg per kg of soil.
When lead is added into petrol as an additive, the highest lead levels are determined on the surfaces of
leaves, from where lead enters the food chain, as well as soil or water. Lead is present in soils as salts
in soluble as well as insoluble forms. Lead contamination in the soil is known to inhibit seed
germination [15,16]. The inhibition of germination by exogenously supplied Pb2+ is a possible effect of
interference with some important enzymes involved in the process. Photosynthesis is considered as one
of the metabolic processes most sensitive to Pb2+ toxicity [17]. Closing of the stomata, disruption of
the chloroplastic organization, change in the metabolites of photosynthesis and replacement of
essential ions like magnesium are the main effects on photosynthesis of lead toxicity [14,18-21]. The

Sensors 2009, 9
5043
metal has also been reported to inhibit photosynthesis in isolated chloroplasts. There have been also
published data reporting on inhibition of enzymes crucial for nitrogen assimilation [14].
Figure 2. Experimental arrangement of LIBS: 1 – Nd:YAG laser, 2 – modulator of second
harmonic frequency, 3 – periscope, 4 – CCD camera, 5 – ablation chamber, 6 – fibre optic
system, 7 – monochromator, 8 – ICCD camera.
As we mentioned above for the particular example of lead ions, there are many mechanisms and
pathways which can be affected by heavy metals [22-25]. Protective mechanisms of a plant cell against
the toxic effects of heavy metals mainly involve synthesis of compounds rich in cysteine called
phytochelatins. Their synthesis comes from the most abundant thiol – reduced glutathione. To detect
these compounds many various methods and techniques have been employed [23,24,26-30], including
sensors and biosensors [31-33]. However, uptake and transport as well as storage of heavy metals
through plant tissues remain still unclear. To consider whether a specific plant species is able or not
able to remediate the polluted environment, not only heavy metals content in the plant tissues, but also
the distribution of such metal ions in the tissues must be analysed. Analytical methods and instruments
for detection of lead (II) ions have been reviewed several times [34-38]. The diagnostic techniques
enabling monitoring high spatial- and lateral-distribution of elements within different plant structures
include mainly X-ray imaging methods [39-41]. X-ray microscopy and micro-radiography
investigations usually make use of soft X-rays generated by plasma laser, microfocus X-ray sources
and synchrotron radiation [42]. Although the X-ray radiation based methods are relatively high-cost
and availability of the experimental apparatus is limited due to possibility of “in-situ” analysis only, it
offers new aspects for studying the distribution of heavy metals. However, X-ray imaging methods are
intensively investigated in our laboratories; recently we have been focusing also on the realization of
spatially-resolved spectro-chemical analysis by utilizing laser-ablation based techniques. Laser
induced breakdown spectroscopy (LIBS, Figure 2) is a type of atomic emission spectroscopy which
utilises a highly energetic laser pulse as the excitation source and is able to provide high spatial-
distribution of metal ions in different types of materials [43-45]. The character of the ablative process
Sensors 2009, 9
5044
depends on the features of the laser used (wavelength, pulse duration, power and energetic profile of
the rays), surrounding atmosphere and the features of the sample itself (matrix, absorption
characteristics, its structure) [46]. LIBS method is one of analytical instruments which makes
qualitative and quantitative analysis and also monitoring of element distribution in different types of
samples possible. The main advantage of this method is that it requires no, or minimal sample pre-
treatment and enables multi-elemental analysis with high three-dimensional resolution. A limiting
factor is especially the diameter of laser ray. In this study, the influence of lead (II) ions on sunflower
plants (Figure 3) was investigated from various points of view. We aimed our study at common growth
parameters, morphological changes, total protein content, activity of certain enzymes, level of stress
induced thiols and spatial distribution of lead.
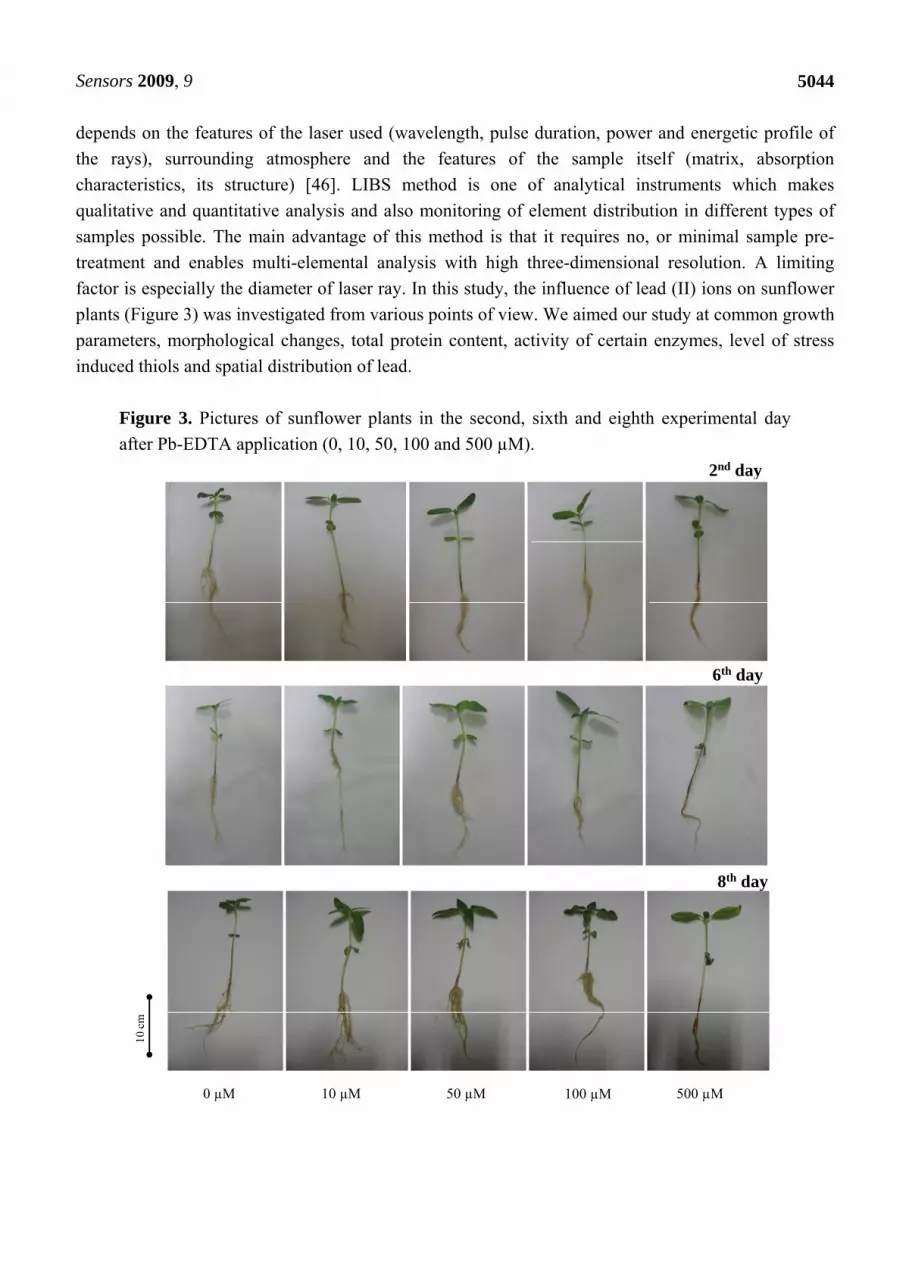
Figure 3. Pictures of sunflower plants in the second, sixth and eighth experimental day
after Pb-EDTA application (0, 10, 50, 100 and 500 µM).
2nd day
0 µM 10 µM 50 µM 100 µM 500 µM
6th day
8th day
10 c
m
Sensors 2009, 9
5045
2. Results and Discussion
2.1. Morphological changes
Lead is a poisonous metal that has many adverse effects on plants and animals. Sunflower plants
were treated with 0, 10, 50, 100 and/or 500 µM Pb-EDTA for eight days. We observed alterations in
growth in all experimental groups compared with non-treated control plants. Plants exposed to lead (II)
ions grew faster in comparison with control plants, except for the highest applied concentration. This
phenomenon probably relates to the stimulatory effects of the presence of Pb-EDTA, because control
plants were cultivated in distilled water only, where no other nutrients are present. In addition we
observed chlorosis on plants treated with the highest concentration (Figure 3). When we compared the
fresh weight of plants treated with lead (II) ions with the non-treated experimental group, it was
possible to clearly notice the effect of applied Pb-EDTA concentration on the aerial parts of plants,
except for the highest applied concentration (Figure 4 A).
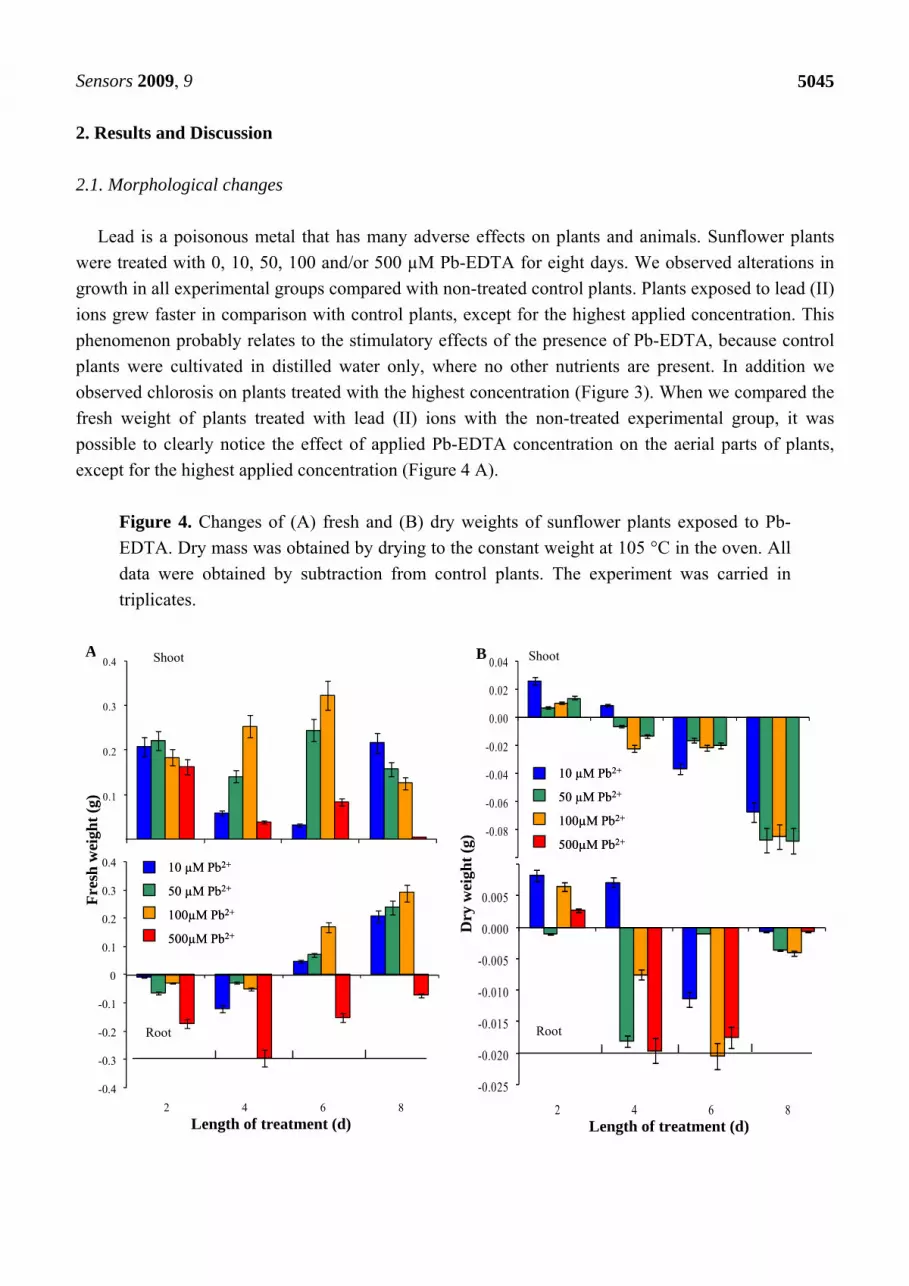
Figure 4. Changes of (A) fresh and (B) dry weights of sunflower plants exposed to Pb-
EDTA. Dry mass was obtained by drying to the constant weight at 105 °C in the oven. All
data were obtained by subtraction from control plants. The experiment was carried in
triplicates.
A B
Length of treatment (d) Length of treatment (d)
-0.4
-0.3
-0.2
-0.1
0
0.1
0.2
0.3
0.4
2 4 6 8
-0.025
-0.020
-0.015
-0.010
-0.005
0.000
0.005
0.010
2 4 6 8
0.0
0.1
0.2
0.3
0.4
10 µM Pb2+
50 µM Pb2+
100µM Pb2+
500µM Pb2+
10 µM Pb2+
50 µM Pb2+
100µM Pb2+
500µM Pb2+
Shoot
Root
-0.10
-0.08
-0.06
-0.04
-0.02
0.00
0.02
0.04
Dry
wei
ght
(g)
Fre
sh w
eigh
t (g
)
Shoot
Root
10 µM Pb2+
50 µM Pb2+
100µM Pb2+
500µM Pb2+
10 µM Pb2+
50 µM Pb2+
100µM Pb2+
500µM Pb2+
Sensors 2009, 9
5046
Nevertheless, the adverse effect of lead (II) ions is shown on dependence of dry weight on length of
the treatment and applied concentration (Figure 3B). Determined change is probably connected with
increased water uptake of plants exposed to stress caused by heavy metals. This hypothesis is
supported by results reporting on nuclear magnetic resonance analysis of early somatic embryos
clusters [29]. In the case of change in fresh weight of roots, increases by the sixth and eighth day were
detected, except for the highest applied concentration. Dry weight of roots decreased, except on the
second day of the treatment for all experimental groups (Figure 4 A,B).
2.2. Total protein content
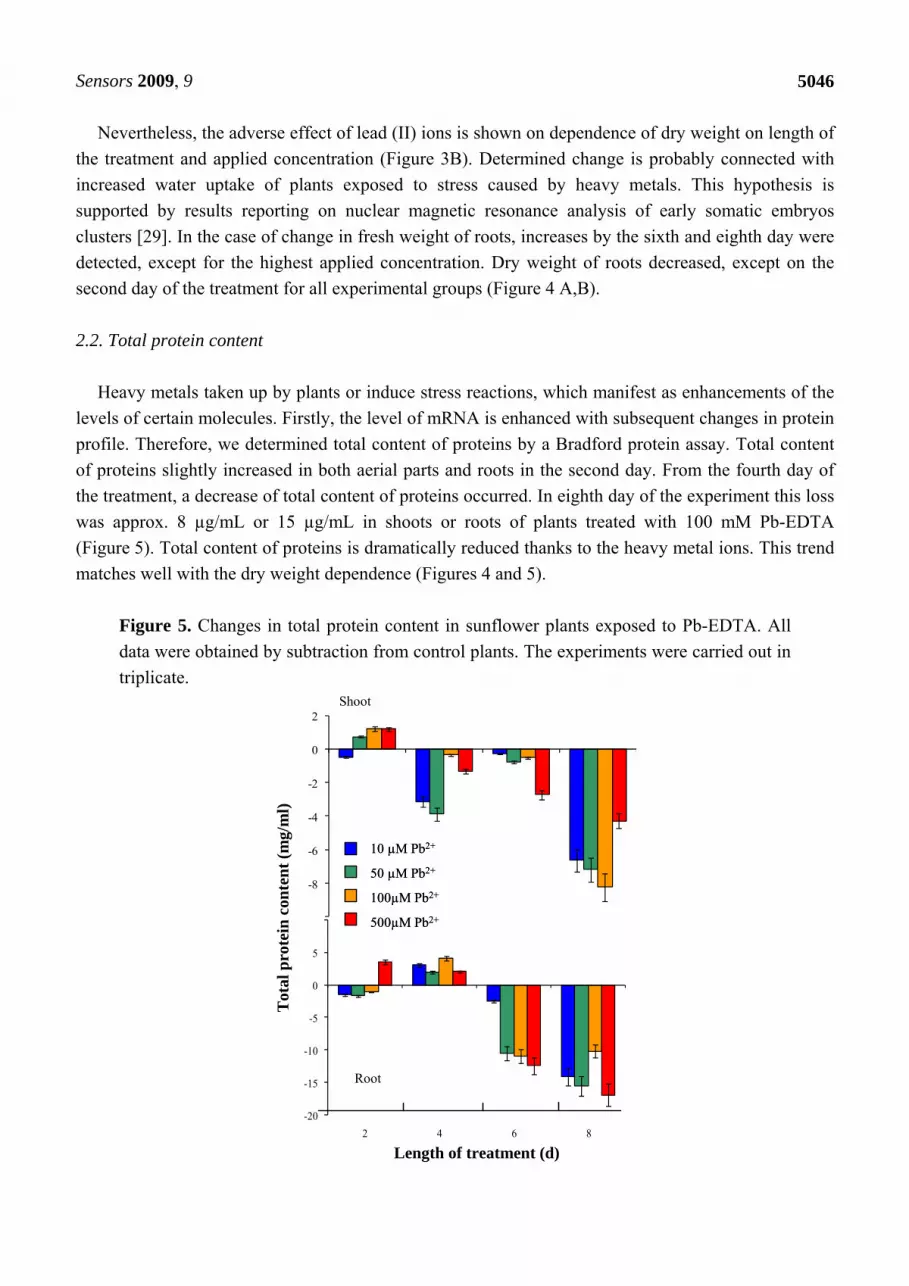
Heavy metals taken up by plants or induce stress reactions, which manifest as enhancements of the
levels of certain molecules. Firstly, the level of mRNA is enhanced with subsequent changes in protein
profile. Therefore, we determined total content of proteins by a Bradford protein assay. Total content
of proteins slightly increased in both aerial parts and roots in the second day. From the fourth day of
the treatment, a decrease of total content of proteins occurred. In eighth day of the experiment this loss
was approx. 8 µg/mL or 15 µg/mL in shoots or roots of plants treated with 100 mM Pb-EDTA
(Figure 5). Total content of proteins is dramatically reduced thanks to the heavy metal ions. This trend
matches well with the dry weight dependence (Figures 4 and 5).
Figure 5. Changes in total protein content in sunflower plants exposed to Pb-EDTA. All
data were obtained by subtraction from control plants. The experiments were carried out in
triplicate.
Length of treatment (d)
-20
-15
-10
-5
0
5
10
2 4 6 8
-10
-8
-6
-4
-2
0
2
Tot
al p
rote
in c
onte
nt
(mg/
ml)
Shoot
Root
10 µM Pb2+
50 µM Pb2+
100µM Pb2+
500µM Pb2+
10 µM Pb2+
50 µM Pb2+
100µM Pb2+
500µM Pb2+

Sensors 2009, 9
5047
2.3. Determination of plant enzymes’ activity
There is still not much available information about the significance of some commonly analyzed
enzymes as markers of stress reactions in plants. In several papers, we have demonstrated that some
enzymes (such as aminotransferases or urease) can participate in plant stress reactions [22,26,47-51].
Thus, we focused our attention on the activity of alanine transaminase (ALT), aspartate transaminase
(AST) and urease. Transaminases catalyze the transfer of the amino groups of amino acids to 2-oxo-
acids. In plants, transaminases participate very effectively in transformations of nitrogen compounds.
They are important for the synthesis of amino acids from oxo-acids in the citrate cycle and for other
crucial biochemical pathways. They also play key roles in the synthesis of secondary metabolites as
well as chlorophyll. In roots AST and ALT activities were increased during the experiments in
comparison to control plants (Figure 6). This increase corresponds well with the higher metabolic
activity. Urease activity was enhanced in aerial plant parts as well as in roots with increasing length of
exposition and applied concentration slightly (data not shown).
Figure 6. Changes of AST and ALT activities in sunflower plants exposed to Pb-EDTA.
All data were obtained by subtraction from control plants. The experiment was carried in
triplicates.
Length of treatment (d) Length of treatment (d)
-0.8
-0.6
-0.4
-0.2
0
0
1
2
3
4
5
2 4 6 8
-10
-8
-6
-4
-2
0ASTShoot
-4
0
4
8
12
16
2 4 6 8
Root
Cat
alyt
ic a
ctiv
ity
(µk
at/l
)
Shoot
Root
ALT
Cat
alyt
ic a
ctiv
ity
(µk
at/l
)
10 µM Pb2+
50 µM Pb2+
100µM Pb2+
500µM Pb2+
10 µM Pb2+
50 µM Pb2+
100µM Pb2+
500µM Pb2+
10 µM Pb2+
50 µM Pb2+
100µM Pb2+
500µM Pb2+
10 µM Pb2+
50 µM Pb2+
100µM Pb2+
500µM Pb2+
2.4. Content of low molecular mass thiols
Low molecular mass compounds rich in cysteine moieties play a very important role in the ability
to withstand or even hyperaccumulate heavy metals ions. Due to this, we paid attention to such
compounds. Particularly, the contents of cysteine, reduced glutathione (GSH), oxidized glutathione

Sensors 2009, 9
5048
(GSSG) and PC2 were determined by high performance liquid chromatography with electrochemical
detection (Figure 7). Contents of cysteine differed markedly in shoots and roots. Cysteine content
declined in the roots of plants as the time of the treatment of plants with Pb-EDTA and concentration
of toxic substance increased. Moreover, we observed ten times higher content of cysteine in roots in
comparison with shoots. The observed reduction of cysteine content probably relates to its utilization
for the biosynthesis of GSH and phytochelatins. Content of GSH was similar in roots and shoots and
increased with increasing time of the treatment and concentration of Pb-EDTA (Figure 7). We plotted
the dependence with linear regression to estimate the rate of synthesis of GSH. The rate expressed as
the slope of the linear equation was 0.531x and 0.635x for roots and shoots, respectively, where “x” is
concentration of applied Pb-EDTA.
Figure 7. Changes of cysteine, GSH, GSSG and PC2 contents in sunflower plants exposed
to Pb-EDTA. All data were obtained by subtraction from control plants. The experiment
was carried out in triplicate.
Cys
Cys
tein
eco
nte
nt
(µg/
g)
shoot
root
GSH GSSG PC2
Red
uce
d g
luta
thio
ne
con
ten
t(µ
g/g)
Ph
ytoc
hel
atin
2 co
nte
nt
(µg/
g)
2 4 6 82 4 6 8
2 4 6 8 2 4 6 8 2 4 6 8 2 4 6 8
2 4 6 82 4 6 8
Length of treatment (d) Length of treatment (d) Length of treatment (d) Length of treatment (d)
Oxi
diz
ed g
luta
thio
ne
con
ten
t(µ
g/g)
10 µM Pb2+
50 µM Pb2+
100µM Pb2+
500µM Pb2+
10 µM Pb2+
50 µM Pb2+
100µM Pb2+
500µM Pb2+
It is a common knowledge that heavy metals induce generation of free oxygen species, which
subsequently damage cell compartments (membranes, nucleic acids). Oxygen radicals can be
scavenged by various mechanisms inside a cell [52]. Low molecular mass thiols are able to react with
oxygen radicals via formation of disulphides. One of the most studied and well known reactions of
such type is the redox cycling of GSH into GSSG [53]. In our experiment, GSSG levels gradually
increased (Figure 7). We observed oxidative stress caused by Pb-EDTA in roots when the GSSG/GSH
ratio was about 0.66. In shoots, the oxidative stress was less distinctive, with a GSSG/GSH ratio of
Sensors 2009, 9
5049
0.14. It follows from the results obtained that only a small part of the up-taken lead(II) ions is
transported into shoots (stems, leaves). The content of PC2 in roots and shoots is shown in Figure 7.
With increasing time of the treatment and concentration of Pb-EDTA the content was markedly
enhanced. Moreover, the ability of plants to withstand oxidative stress caused by heavy metal depends
also on rate of phytochelatin biosynthesis. Therefore, we again estimated the rate of phytochelatin
biosynthesis via the slope of the linear equations plotted with data measured in each particular
experimental group. The highest rate was detected in roots treated with 100 µM of Pb-EDTA (11.200)
followed by 50 µM (13.270), 500 µM (7.100) and 10 µM (6.500). Compared to roots, the rate of
phytochelatin biosynthesis was lower in shoots. The highest rate was detected in shoots treated with 50
µM of Pb-EDTA (4.600) followed by 100 µM (4.500), 500 µM (4.300) and 10 µM (2.719). It can be
concluded that protective metabolic pathways of plants treated with 50 and 100 µM of Pb-EDTA was
stimulated to withstand the adverse effect of heavy metal ions.
2.5. Monitoring of lead and magnesium distribution by LIBS
To determine heavy metal ions many analytical instruments can be used, however, most of them are
only able to quantify total contents of the metals [38,54-60]. This problem can be overcome using
LIBS, because it is able to provide high spatial-distribution of metal ions in different types of
materials [19,20,22,42,61,62]. Recently, we published the first experimental data focused on utilization
of the LIBS technique for analysis of biological samples exposed to various heavy metals. It was
demonstrated that the mentioned techniques are a unique analytical tool that can provide biologically
interesting data [61,62]. The laser-generated patterns consisting of precisely ablated micro-craters have
been utilized for mapping the lead and magnesium distribution on 4.5 × 2 mm2 leaf sections of
sunflower samples. Measurement of optical emission of atoms by ICCD camera was carried out under
optimized conditions. A typical LIBS spectrum after application of one laser pulse is shown in Figure 8.
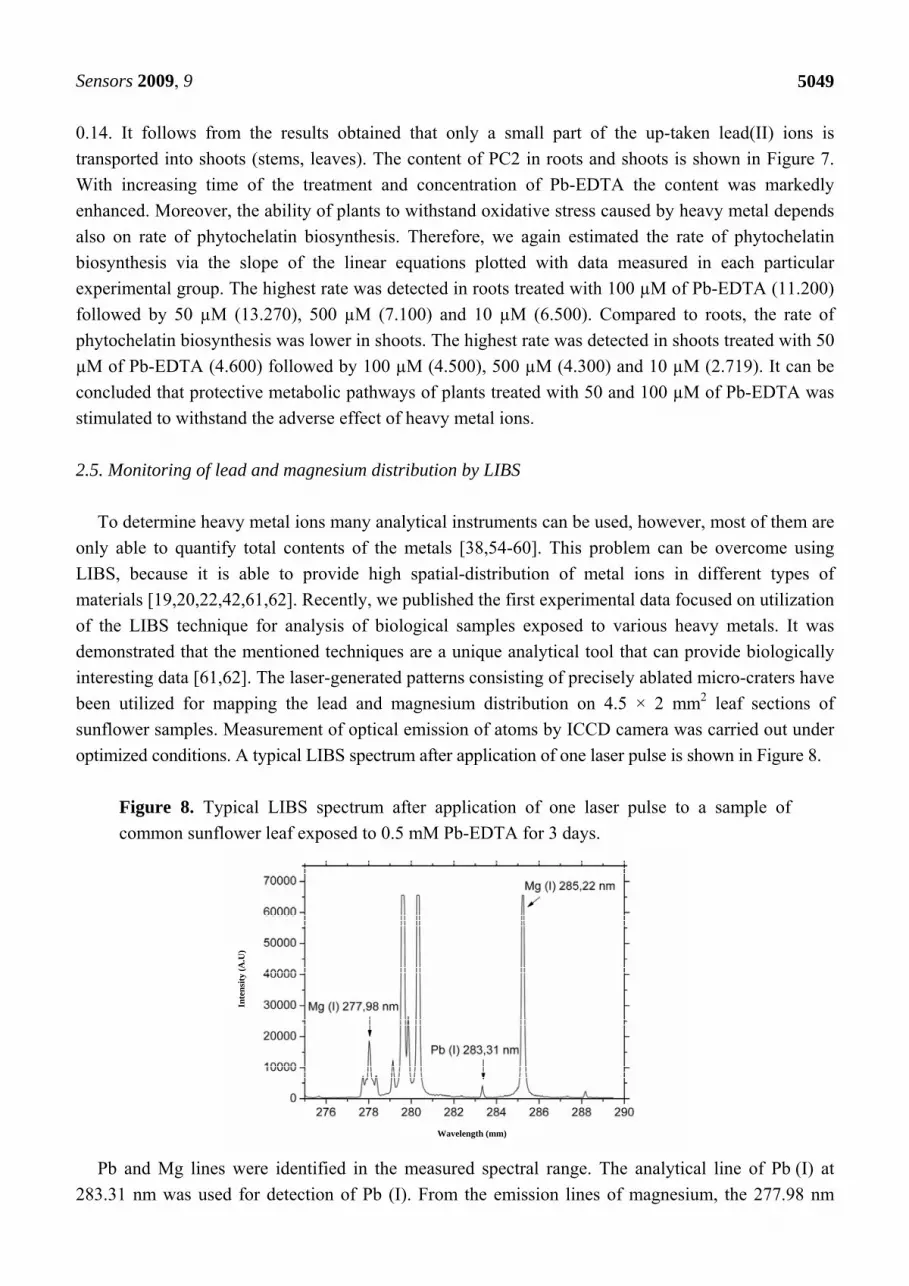
Figure 8. Typical LIBS spectrum after application of one laser pulse to a sample of
common sunflower leaf exposed to 0.5 mM Pb-EDTA for 3 days.
Wavelength (mm)
Inte
nsi
ty (
A.U
)
Pb and Mg lines were identified in the measured spectral range. The analytical line of Pb (I) at
283.31 nm was used for detection of Pb (I). From the emission lines of magnesium, the 277.98 nm
Sensors 2009, 9
5050
Mg (I) analytical line was selected. It was not possible to use other magnesium emission lines due to
detector saturation. Subtraction of background was realized and the area under the emission line was
calculated for all measurements.
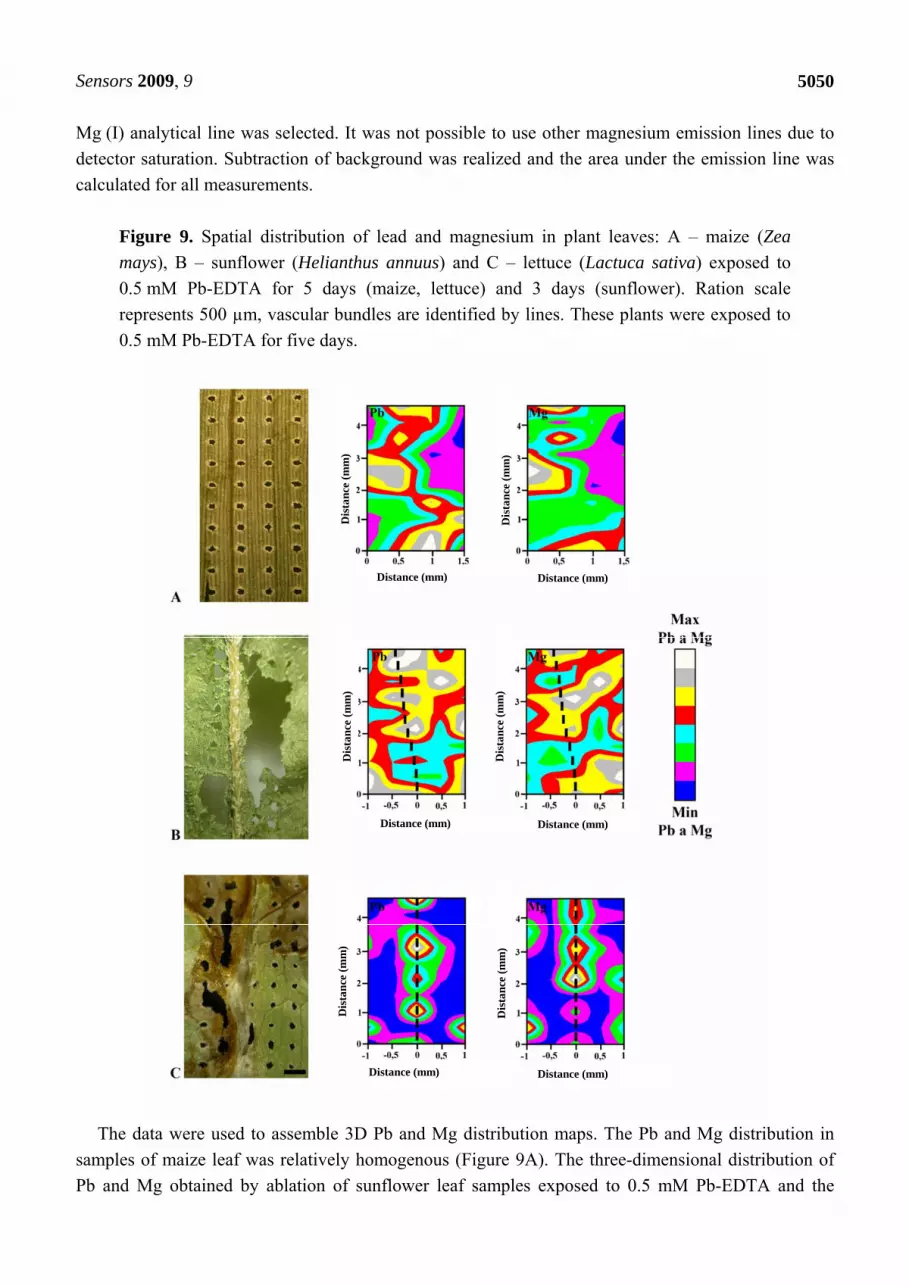
Figure 9. Spatial distribution of lead and magnesium in plant leaves: A – maize (Zea
mays), B – sunflower (Helianthus annuus) and C – lettuce (Lactuca sativa) exposed to
0.5 mM Pb-EDTA for 5 days (maize, lettuce) and 3 days (sunflower). Ration scale
represents 500 µm, vascular bundles are identified by lines. These plants were exposed to
0.5 mM Pb-EDTA for five days.
Distance (mm) Distance (mm)
Distance (mm)Distance (mm)
Dis
tanc
e (m
m)
Dis
tanc
e (m
m)
Dis
tanc
e (m
m)
Dis
tanc
e (m
m)
Distance (mm) Distance (mm)
Dis
tanc
e (m
m)
Dis
tanc
e (m
m)
The data were used to assemble 3D Pb and Mg distribution maps. The Pb and Mg distribution in
samples of maize leaf was relatively homogenous (Figure 9A). The three-dimensional distribution of
Pb and Mg obtained by ablation of sunflower leaf samples exposed to 0.5 mM Pb-EDTA and the

Sensors 2009, 9
5051
ablative patterns are shown in Figure 9B. The midrib is clearly evident in the sample due to
distribution of Pb in this area. The distribution of Mg ions in this sample is homogenous, like in maize
leaves. In the case of leaf samples of lettuce plant exposed to 0.5 mM Pb-EDTA, the highest content of
both elements was determined in the midrib. This fact is clearly shown in Figure 9C. We also
investigated the distribution of Pb and Mg in leaf samples of the same plants treated with 1 mM Pb-
EDTA (3D maps on the right side in Figure 9). In these samples, we can see a heterogeneous
distribution of Mg ions as well as Pb ions. Distribution of these elements is concentrated around the
main vascular bundle of leaf, which means around the midrib. In all samples, LIBS measurements
were compared with those obtained by laser ablation inductively coupled plasma mass spectrometry
[41,42,63]. The results obtained were in good agreement. In the view using LIBS for monitoring of
element accumulation in plant materials, the instrumentation is supplemented by software, which
enables fully automated measurement [46].
3. Material and Methods
3.1. Chemicals
Acetonitrile and methanol (HPLC purity) were purchased from Merck (Darmstadt, Germany).
Urease EC 3.5.1.5 (Jack Beans, type III; 45,000 IU/g) was purchased from Sigma Aldrich (St. Louis,
MI, USA). Standards PC2, PC5 and DesGlyPC with purity higher than 90% were synthesized at
Clonestar Biotech (Brno, Czech Republic). All other used chemical were also purchased from Sigma
Aldrich, unless noted otherwise. The standard stock solutions (100 µg/mL) were prepared in ACS
water (ie, chemicals that meet the specifications of the American Chemical Society) and stored in dark
at 4 °C.
3.2. Cultivation of plants and sample preparation
Sunflower plants (Helianthus annuus L., Compositae) were used in our experiments. Sunflower
kernels were germinated in the dark on wet filter paper in special vessels at 23 ± 2 °C. After ten days,
maize seedlings were placed into vessels containing distilled water and cultivated in a Versatile
Environmental Test Chamber (MLR-350 H, Sanyo, Japan) for eight days with 14 h daylight per day
(maximal light intensity was about 100 μE/m2s1) at a temperature 23.5–25 °C and humidity 71–78%.
After that, Pb-EDTA was added to the cultivation solution at final concentrations of 0, 10, 50, 100 and
500 µM. Plants grown without Pb-EDTA were used as a control. The sunflower plants placed in the
vessels that distilled water with addition of Pb-EDTA (0, 10, 50, 100 and 500 µM) were grown for six
days. Four plants each were harvested at certain time intervals (2nd, 4th, 6th and 8th day of the
experiments), and their roots were rinsed three times in distilled water and 0.5 M EDTA. In addition,
each harvested plant was divided into shoots (aerial plant parts) and roots. Fresh weight of the samples
was measured immediately after the rinsing by using a Sartorius scale.

Sensors 2009, 9
5052
3.3. Sample preparation for thiol determination
Weighed plant tissues (approximately 0.2 g) were transferred to a test-tube, and liquid nitrogen was
added. The samples were frozen to disrupt the cells [48]. The frozen sample was transferred to mortar
and ground for 1 min. Then, 1,000 μL of 0.2 M phosphate buffer (pH 7.2) was added to the mortar, and
the sample was grinding for 5 min. The homogenate was transferred to a new test-tube. The mixture
was homogenised by shaking on a Vortex–2 Genie (Scientific Industries, New York, USA) at 4 °C for
30 min. The homogenate was centrifuged (14,000 g) for 30 min at 4 °C using a Universal 32 R
centrifuge (Hettich-Zentrifugen GmbH, Tuttlingen, Germany). Before the analysis the supernatant was
filtered through a membrane filter (0.45 μm Nylon filter disk, Millipore, Billerica, MA, USA).
3.4. High performance liquid chromatography with electrochemical detection
The HPLC-ED system consisted of two solvent delivery pumps operating in the range of 0.001-
9.999 mL·min-1 (Model 582 ESA Inc., Chelmsford, MA), a Metachem Polaris C18A reverse-phase
column (150 × 4.6; 3 µm particle size, Varian Inc., CA, USA) and a CoulArray electrochemical
detector (Model 5600A, ESA). The electrochemical detector includes three flow cells (Model 6210,
ESA, USA). Each cell consists of four analytical cells. One cell contains the working carbon porous
electrode, two auxiliary and two reference electrodes. Both the detector and the reaction coil/column
were thermostatted. The sample (10 μL) was injected using autosampler (Model 540 Microtiter HPLC,
ESA, USA). For other experimental conditions see [24,28].
3.5. Automated spectrometric measurements
Spectrometric measurements were carried using an automated chemical analyser BS-200 (Mindray,
China). Reagents and samples were placed on cooled sample holder (4 °C) and automatically pipetted
directly into plastic cuvettes. Incubation proceeded at 37 °C. The mixture was consequently stirred.
The washing steps with distilled water (18 mΩ) were done in the midst of the pipetting. The apparatus
was operated using the BS-200 software (Mindray, China).
Urease activity determination – indophenol assay (Berthelot method). Plant tissues samples
(approximately 2 g) were homogenized in mortar for five minutes. Then twenty millilitres of 30%
ethanol was added and this solution was poured into a bottle (50 mL) and vortexed at 300 rpm, 8 °C
for 30 minutes using a vortexer (GFL, Germany). The extract was centrifuged for 10 min at 5,000 g
(Hettich, Germany) and then the supernatant was collected. The supernatant (10 µL) was mixed with
448 µL of hypochlorite solution (12% NaOCl, 0.4 M Na2HPO4 and 0.37 M NaOH, adjusted to pH 12)
and with 42 µL of phenol solution (sodium nitroprusside, 7% phenol). This mixture was stirred and
incubated for 15 min at 37 °C. After this incubation the differences of absorption at 630 and 670 nm
were measured [47,64].
ALT and AST activity determination. For standardization of determination of ATL and AST, sodium
pyruvate (2 mM) in the concentration range 0–1.25 μkat/L was used. Into a test-tube containing

Sensors 2009, 9
5053
100 μL of sample or standard, 250 μL of substrate (for ALT DL-alanine 0.2 M, 2-oxoglutarate 2 mM,
0.1 M phosphate buffer pH 7.4; for AST L-aspartate 0.1 M, 2-oxoglutarate 2 mM, 0.1 M phosphate
buffer pH 7.4) were added and this mixture was incubated for 60 min at 37°C in a thermostatted box.
After 30 min the test-tubes were taken out the box and analysed using automated analyzer. The
incubated solution (45 μL) was added to 45 μL of solution containing 2,4-dinitrophenylhydrazine
(1 mM in 1 M HCl). This mixture was stirred and incubated for 10 min at 37 °C. Further, 180 μL of
sodium hydrate (0.4 M) was added and newly stirred. Absorbance was measured after 10 min. at
wavelength 530 nm.
Bradford protein assay. To 10 μL of sample 190 μL of Bradford reagent was added [65]. After
5 min of incubation at room temperature absorbance was measured at 595 nm against a blank sample
(10 μL phosphate buffer and 190 μL Bradford reagent). Bradford reagent consists of 100 mg
Coomassie Brilliant Blue G250, 50 mL 96% ethanol (v/v), 1,000 mL 8.5% phosphoric acid (v/v),
200 mL 0.1 M phosphate buffer pH 7.6). Total protein concentration was determined from calibration
curve prepared by dilution of bovine serum albumin solution with the phosphate buffer within the
concentration range from 0.05 to 1 mg/mL.
3.6. Laser induced breakdown spectroscopy
To realize the measurements with high-spatial resolution, the sample holder with the investigated
species was placed to the stage with precision movements (2 µm in x, y and z direction) inside the
ablation chamber (Tescan, Czech Republic). The single-shot LIBS analysis was performed in air under
atmospheric pressure. The ablation spot was targeted and controlled for each shot by a CCD camera
placed outside of the chamber. The LIBS micro-plasma was created using the second harmonic
(532 nm) of a Nd:YAG laser system (Quantel, Brilliant B). The laser pulse width was ~5 ns and the
beam diameter 8 mm. The energy of the laser pulse was 10 mJ (at the sample). The laser-induced
plasma was produced by focusing the laser beam with a 30 mm focal-length glass doublet (Sill
Optics). Imaging system consisting of two quartz objectives was used to collect the LIBS micro-
plasma radiation. Subsequently, the radiation was transported by a 3 m fibre optic system onto the
entrance slit of the 0.32 m monochromator (Jobin Yvon TRIAX 320). In this study the grating 2,400
g/mm of the monochromator and 50 µm entrance slit were used. The dispersed spectrum of the plasma
radiation was detected by an ICCD camera (Jobin Yvon Horiba). The time-resolved measurements
were realized triggering the camera by the Q-switch signal of the laser. The detector was gated 1 µs
after the Q-switch signal and the observation window was 10 µs. The lead-content within the leaf was
detected by monitoring the 283.31 nm Pb (I) line in the created micro-plasmas.
4. Conclusions
We have demonstrated the ability of a laser-ablation based analytical method (LIBS) to map the
distribution of lead and magnesium in the leaves of sunflower plants. Moreover, we have shown that
the combination of LIBS with other precise analytical techniques such as high performance liquid
Sensors 2009, 9
5054
chromatography with electrochemical detection and automated spectrometric analysis can provide
many interesting results.
Acknowledgements
The authors gratefully acknowledge support from the Grant Agency of the Czech Republic
(522/07/0692 and 204/09/H002) and DP 6/2009 IGA MZLU.
References and Notes
1. Macek, T.; Kotrba, P.; Svatos, A.; Novakova, M.; Demnerova, K.; Mackova, M. Novel roles for
genetically modified plants in environmental protection. Trends Biotechnol. 2008, 26, 146–152.
2. Novakova, M.; Mackova, M.; Sylvestre, M.; Macek, T. Preparation of genetically modified plants
containing bacterial dioxygenase – Tool for preferable phytoremediation. J. Biotechnol. 2007,
131, S36–S36.
3. Najmanova, J.; Mackova, M.; Macek, T.; Kotrba, P. Preparation of transgenic flax with enhanced
metal tolerance. J. Biotechnol. 2007, 131, S38–S39.
4. Pavlikova, D.; Macek, T.; Mackova, M.; Sura, M.; Szakova, J.; Tlustos, P. The evaluation of
cadmium, zinc and nickel accumulation ability of transgenic tobacco bearing different transgenes.
Plant Soil Environ. 2004, 50, 513–517.
5. Pavlikova, D.; Macek, T.; Mackova, M.; Szakova, J.; Balik, J. Cadmium tolerance and
accumulation in transgenic tobacco plants with a yeast metallothionein combined with a
polyhistidine tail. Int. Biodeterior. Biodegrad. 2004, 54, 233–237.
6. Macek, T.; Mackova, M.; Pavlikova, D.; Szakova, J.; Truksa, M.; Cundy, S.; Kotrba, P.; Yancey,
N.; Scouten, W.H. Accumulation of cadmium by transgenic tobacco. Acta Biotechnol. 2002, 22,
101–106.
7. Francova, K.; Macek, T.; Demnerova, K.; Mackova, M. Transgenic plants – A potential tool for
decontamination of environmental pollutants. Chem. Listy 2001, 95, 630–637.
8. Garbisu, C.; Alkorta, I. Phytoextraction: a cost-effective plant-based technology for the removal
of metals from the environment. Bioresour. Technol. 2001, 77, 229–236.
9. Salt, D.E.; Blaylock, M.; Kumar, N.; Dushenkov, V.; Ensley, B.D.; Chet, I.; Raskin, I.
Phytoremediation – A novel strategy for the removal of toxic metals from the environment using
plants. Bio-Technology 1995, 13, 468–474.
10. Fernandes, J.C.; Henriques, F.S. Biochemical, physiological, and structural effects of excess
copper in plants. Bot. Rev. 1991, 57, 246–273.
11. Li, X.D.; Poon, C.S.; Liu, P.S. Heavy metal contamination of urban soils and street dusts in Hong
Kong. Appl. Geochem. 2001, 16, 1361–1368.
12. Little, P.; Martin, M.H. Biological monitoring of heavy-metal pollution. Environ. Pollut. 1974, 6,
1-19.
13. Jarup, L. Hazards of heavy metal contamination. Br. Med. Bull. 2003, 68, 167–182.
14. Singh, R.P.; Tripathi, R.D.; Sinha, S.K.; Maheshwari, R.; Srivastava, H.S. Response of higher
plants to lead contaminated environment. Chemosphere 1997, 34, 2467–2493.

Sensors 2009, 9
5055
15. Sawidis, T. Effect of cadmium on pollen germination and tube growth in Lilium longiflorum and
Nicotiana tabacum. Protoplasma 2008, 233, 95–106.
16. Pandey, S.; Gupta, K.; Mukherjee, A.K. Impact of cadmium and lead on Catharanthus roseus – A
phytoremediation study. J. Environ. Biol. 2007, 28, 655–662.
17. Doumett, S.; Lamperi, L.; Checchini, L.; Azzarello, E.; Mugnai, S.; Mancuso, S.; Petruzzelli, G.;
Bubba, M. Heavy metal distribution between contaminated soil and Paulownia tomentosa, in a
pilot-scale assisted phytoremediation study: influence of different complexing agents.
Chemosphere 2008, 72, 1481–1490.
18. Malkowski, E.; Kita, A.; Galas, W.; Karcz, W.; Kuperberg, J.M. Lead distribution in corn
seedlings (Zea mays L.) and its effect on growth and the concentrations of potassium and calcium.
Plant Growth Regul. 2002, 37, 69–76.
19. Kaiser, J.; Malina, R.; Galiova, M.; Novotny, K.; Diopan, V.; Adam, V.; Kizek, R. Employment
of laser spectrometry in heavy metal analysis. Lis. Cukrov. Repar. 2007, 123, 332–332.
20. Stejskal, K.; Diopan, V.; Adam, V.; Zehnalek, J.; Trnkova, L.; Havel, L.; Galiova, M.; Malina, R.;
Novotny, K.; Kaiser, J.; Kizek, R. Study of effects of lead ions on sugar beet. Lis. Cukrov. Repar.
2008, 124, 116–119.
21. Stejskal, K.; Supalkova, V.; Baloun, J.; Diopan, V.; Babula, P.; Adam, V.; Zehnalek, J.; Trnkova,
L.; Havel, L.; Kizek, R. Affecting of sugar beet (Beta vulgaris var. Altissima) by lead chelate. Lis.
Cukrov. Repar. 2007, 123, 351–355.
22. Krizkova, S.; Ryant, P.; Krystofova, O.; Adam, V.; Galiova, M.; Beklova, M.; Babula, P.; Kaiser,
J.; Novotny, K.; Novotny, J.; Liska, M.; Malina, R.; Zehnalek, J.; Hubalek, J.; Havel, L.; Kizek,
R. Multi-instrumental analysis of tissues of sunflower plants treated with silver (I) ions – Plants as
bioindicators of environmental pollution. Sensors 2008, 8, 445–463.
23. Supalkova, V.; Huska, D.; Diopan, V.; Hanustiak, P.; Zitka, O.; Stejskal, K.; Baloun, J.; Pikula, J.;
Havel, L.; Zehnalek, J.; Adam, V.; Trnkova, L.; Beklova, M.; Kizek, R. Electroanalysis of plant
thiols. Sensors 2007, 7, 932–959.
24. Potesil, D.; Petrlova, J.; Adam, V.; Vacek, J.; Klejdus, B.; Zehnalek, J.; Trnkova, L.; Havel, L.;
Kizek, R. Simultaneous femtomole determination of cysteine, reduced and oxidized glutathione,
and phytochelatin in maize (Zea mays L.) kernels using high-performance liquid chromatography
with electrochemical detection. J. Chromatogr. A 2005, 1084, 134–144.
25. Vacek, J.; Petrek, J.; Kizek, R.; Havel, L.; Klejdus, B.; Trnkova, L.; Jelen, F. Electrochemical
determination of lead and glutathione in a plant cell culture. Bioelectrochemistry 2004, 63,
347–351.
26. Petrek, J.; Baloun, J.; Vlasinova, H.; Havel, L.; Adam, V.; Vitecek, J.; Babula, P.; Kizek, R.
Image analysis and activity of intracellular esterases as new analytical tools for determination of
growth and viability of embryonic cultures of spruce (Picea sp.) treated with cadmium. Chem.
Listy 2007, 101, 569–577.
27. Zitka, O.; Stejskal, K.; Kleckerova, A.; Adam, V.; Beklova, M.; Horna, A.; Supalkova, V.; Havel,
L.; Kizek, R. Utilizing electrochemical techniques for detection of biological samples. Chem.
Listy 2007, 101, 225–231.
Sensors 2009, 9
5056
28. Petrlova, J.; Mikelova, R.; Stejskal, K.; Kleckerova, A.; Zitka, O.; Petrek, J.; Havel, L.; Zehnalek,
J.; Adam, V.; Trnkova, L.; Kizek, R. Simultaneous determination of eight biologically active thiol
compounds using gradient elution-liquid chromatography with Coul-Array detection. J. Sep. Sci.
2006, 29, 1166–1173.
29. Supalkova, V.; Petrek, J.; Baloun, J.; Adam, V.; Bartusek, K.; Trnkova, L.; Beklova, M.; Diopan,
V.; Havel, L.; Kizek, R. Multi-instrumental investigation of affecting of early somatic embryos of
spruce by cadmium (II) and lead (II) ions. Sensors 2007, 7, 743–759.
30. Ryant, P.; Dolezelova, E.; Fabrik, I.; Baloun, J.; Adam, V.; Babula, P.; Kizek, R. Electrochemical
determination of low molecular mass thiols content in potatoes (Solanum tuberosum) cultivated in
the presence of various sulphur forms and infected by late blight (Phytophora infestans). Sensors
2008, 8, 3165–3182.
31. Lima, P.R.; Santos, W.J.R.; Oliveira, A.B.; Goulart, M.O.; Kubota, L.T. Electrocatalytic activity
of 4-nitrophthalonitrile-modified electrode for the L-glutathione detection. J. Pharm. Biomed.
Anal 2008, 47, 758–764.
32. Gutscher, M.; Pauleau, A.L.; Marty, L.; Brach, T.; Wabnitz, G.H.; Samstag, Y.; Meyer, A.J.;
Dick, T.P. Real-time imaging of the intracellular glutathione redox potential. Nat. Methods 2008,
5, 553–559.
33. Timur, S.; Odaci, D.; Dincer, A.; Zihnioglu, F.; Telefoncu, A. Biosensing approach for
glutathione detection using glutathione reductase and sulfhydryl oxidase bienzymatic system.
Talanta 2008, 74, 1492–1497.
34. Korn, M.D.A.; de Andrade, J.B.; de Jesus, D.S.; Lemos, V.A.; Bandeira, M.; dos Santos, W.N.L.;
Bezerra, M.A.; Amorim, F.A.C.; Souza, A.S.; Ferreira, S.L.C. Separation and preconcentration
procedures for the determination of lead using spectrometric techniques: a review. Talanta 2006,
69, 16–24.
35. Korn, M.D.A.; dos Santos, D.S.S.; Welz, B.; Vale, M.G.R.; Teixeira, A.P.; Lima, D.D.; Ferreira,
S.L.C. Atomic spectrometric methods for the determination of metals and metalloids in
automotive fuels – a review. Talanta 2007, 73, 1–11.
36. Lin, T.J.; Chung, M.F. Using monoclonal antibody to determine lead ions with a localized surface
plasmon resonance fiber-optic biosensor. Sensors 2008, 8, 582–593.
37. Shaw, M.J.; Haddad, P.R. The determination of trace metal pollutants in enviromental matrices
using ion chromatography. Environ. Int. 2004, 30, 403–431.
38. Yantasee, W.; Lin, Y.; Hongsirikarn, K.; Fryxell, G.E.; Addleman, R.; Timchalk, C.
Electrochemical sensors for the detection of lead and other toxic heavy metals: the next
generation of personal exposure biomonitors. Environ. Health Perspect. 2007, 115, 1683–1690.
39. Janssens, K.H.A.; Adams, F.C.V.; Rindby, A. X-ray fluorescence analysis, John Wiley & Sons:
Chichester , UK, 2000.
40. Jorks, S. X-ray microscopy. Instrumentation and biological application, Springer-Verlag: New
York, NY, USA, 1987.
41. Kaiser, J.; Reale, L.; Ritucci, A.; Tomassetti, G.; Poma, A.; Spano, L.; Tucci, A.; Flora, F.; Lai,
A.; Faenov, A.; Pikuz, T.; Mancini, L.; Tromba, G.; Zanini, F. Mapping of the metal intake in
plants by large-field X-ray microradiography and preliminary feasibility studies in
microtomography. Eur. Phys. J. D 2005, 32, 113–118.
Sensors 2009, 9
5057
42. Kaiser, J.; Samek, O.; Reale, L.; Liska, M.; Malina, R.; Ritucci, A.; Poma, A.; Tucci, A.; Flora,
F.; Lai, A.; Mancini, L.; Tromba, G.; Zanini, F.; Faenov, A.; Pikuz, T.; Cinque, G. Monitoring of
the heavy-metal hyperaccumulation in vegetal tissues by X-ray radiography and by femto-second
laser induced breakdown spectroscopy. Microsc. Res. Tech. 2007, 70, 147–153.
43. Becker, J.S.; Su, J.; Zoriya, M.V.; Dobrowolska, J.; Matusch, A. Imaging mass spectrometry in
biological tissues by laser ablation inductively coupled plasma mass spectrometry. Eur. J. Mass
Spectrom. 2007, 13, 1–6.
44. DeLucia, F.C.; Samuels, A.C.; Harmon, R.S.; Walters, R.A.; McNesby, K.L.; LaPointe, A.;
Winkel, R.J.; Miziolek, A.W. Laser-induced breakdown spectroscopy (LIBS): a promising
versatile chemical sensor technology for hazardous material detection. IEEE Sens. J. 2005, 5,
681–689.
45. Martin, M.Z.; Wullschleger, S.D.; Garten, C.T.; Palumbo, A.V. Laser-induced breakdown
spectroscopy for the environmental determination of total carbon and nitrogen in soils. Appl.
Optics 2003, 42, 2072–2077.
46. Russo, R.E.; Mao, X.L.; Gonzalez, J.J.; Mao, S.S. Femtosecond laser ablation ICP-MS. J. Anal.
At. Spectrom. 2002, 17, 1072–1075.
47. Hubalek, J.; Hradecky, J.; Adam, V.; Krystofova, O.; Huska, D.; Masarik, M.; Trnkova, L.;
Horna, A.; Klosova, K.; Adamek, M.; Zehnalek, J.; Kizek, R. Spectrometric and voltammetric
analysis of urease - nickel nanoelectrode as an electrochemical sensor. Sensors 2007, 7, 1238–
1255.
48. Petrek, J.; Vitecek, J.; Vlasinova, H.; Kizek, R.; Kramer, K.J.; Adam, V.; Klejdus, B.; Havel, L.
Application of computer imaging, stripping voltammetry and mass spectrometry to study the
effect of lead (Pb-EDTA) on the growth and viability of early somatic embryos of Norway spruce
(Picea abies/L./Karst.). Anal. Bioanal. Chem. 2005, 383, 576–586.
49. Vitecek, J.; Petrlova, J.; Petrek, J.; Adam, V.; Havel, L.; Kramer, K.J.; Kizek, R. Application of
fluorimetric analysis of plant esterases to study of programmed cell death and effects of
cadmium (II) ions. Biol. Plant. 2007, 51, 551–555.
50. Vitecek, J.; Adam, V.; Petrek, J.; Vacek, J.; Kizek, R.; Havel, L. Esterases as a marker for the
growth of BY-2 tobacco cells and early somatic embryos of the norway spruce. Plant. Cell. Tiss.
Org. 2004, 79, 195–201.
51. Vitecek, J.; Petrlova, J.; Adam, V.; Havel, L.; Kramer, K.J.; Babula, P.; Kizek, R. A fluorimetric
sensor for detection of one living cell. Sensors 2007, 7, 222–238.
52. Droge, W. Free radicals in the physiological control of cell function. Physiol. Rev. 2002, 82,
47–95.
53. Noctor, G.; Foyer, C.H. Ascorbate and glutathione: keeping active oxygen under control. Annu.
Rev. Plant Physiol. Plant Molec. Biol. 1998, 49, 249–279.
54. Adam, V.; Zehnalek, J.; Petrlova, J.; Potesil, D.; Sures, B.; Trnkova, L.; Jelen, F.; Vitecek, J.;
Kizek, R. Phytochelatin modified electrode surface as a sensitive heavy metal ion biosensor.
Sensors 2005, 5, 70–84.
55. Adam, V.; Petrlova, J.; Potesil, D.; Zehnalek, J.; Sures, B.; Trnkova, L.; Jelen, F.; Kizek, R. Study
of metallothionein modified electrode surface behaviour in the presence of heavy metal ions-
biosensor. Electroanalysis 2005, 17, 1649–1657.
Sensors 2009, 9
5058
56. Adam, V.; Hanustiak, P.; Krizkova, S.; Beklova, M.; Zehnalek, J.; Trnkova, L.; Horna, A.; Sures,
B.; Kizek, R. Palladium biosensor. Electroanalysis 2007, 19, 1909–1914.
57. Das, A.K.; de la Guardia, M.; Cervera, M.L. Literature survey of on-line elemental speciation in
aqueous solutions. Talanta 2001, 55, 1–28.
58. Rizk, N.M.H.; Abbas, S.S.; Hamza, S.M.; El-Karem, Y.M.A. Thiopental and phenytoin as novel
ionophores for potentiometric determination of lead (II) ions. Sensors 2009, 9, 1860–1875.
59. Bondarenko, O.; Rolova, T.; Kahru, A.; Ivask, A. Bioavailability of Cd, Zn and Hg in soil to nine
recombinant luminescent metal sensor bacteria. Sensors 2008, 8, 6899–6923.
60. Prasek, J.; Adamek, M.; Hubalek, J.; Adam, V.; Trnkova, L.; Kizek, R. New hydrodynamic
electrochemical arrangement for cadmium ions detection using thick-film chemical sensor
electrodes. Sensors 2006, 6, 1498–1512.
61. Galiova, M.; Kaiser, J.; Novotny, K.; Novotny, J.; Vaculovic, T.; Liska, M.; Malina, R.; Stejskal,
K.; Adam, V.; Kizek, R. Investigation of heavy-metal accumulation in selected plant samples
using laser induced breakdown spectroscopy and laser ablation inductively coupled plasma mass
spectrometry. Appl. Phys. A-Mater. Sci. Process. 2008, 93, 917–922.
62. Kaiser, J.; Galiova, M.; Novotny, K.; Cervenka, R.; Reale, L.; Novotny, J.; Liska, M.; Samek, O.;
Kanicky, V.; Hrdlicka, A.; Stejskal, K.; Adam, V.; Kizek, R. Mapping of lead, magnesium and
copper accumulation in plant tissues by Laser-Induced Breakdown Spectroscopy and Laser-
Ablation Inductively Coupled Plasma Mass Spectrometry Spectrochim. Acta, Part B 2009, 64,
67–73.
63. Kaiser, J.; Galiova, M.; Novotny, K.; Reale, L.; Stejskal, K.; Samek, O.; Malina, R.; Palenikova,
K.; Adam, V.; Kizek, R. Utilization of the Laser Induced Plasma Spectroscopy for monitoring of
the metal accumulation in plant tissues with high spatial resolution. Formatex: Badajoz, Spain,
2007; 434–441.
64. Witte, C.P.; Medina-Escobar, N. In-gel detection of urease with nitroblue tetrazolium and
quantification of the enzyme from different crop plants using the indophenol reaction. Anal.
Biochem. 2001, 290, 102–107.
65. Bradford, M.M. Rapid and sensitive method for quantitation of microgram quantities of protein
utilizing principle of protein-dye binding. Anal. Biochem. 1976, 72, 248–254.
© 2009 by the authors; licensee Molecular Diversity Preservation International, Basel, Switzerland.
This article is an open-access article distributed under the terms and conditions of the Creative
Commons Attribution license (http://creativecommons.org/licenses/by/3.0/).
Related Documents