IJICIS, Vol. 11, No. 2, JULY 2011 1 USING RENYI'S ENTROPY FOR EDGE DETECTION IN LEVEL IMAGES M. A. El-Sayed Department of Mathematics, Faculty of Science, Fayoum University, Fayoum - Egypt. [email protected] M. A. Khafagy Mathematics Department, Faculty of Science, Sohag University - Egypt. [email protected] Abstract: Most of the classical methods for edge detection are based on the first and second order derivatives of gray levels of the pixels of the original image utilizing 2D spatial convolution masks to approximate the derivative. In this paper we present an algorithm for edge detection in gray level images to solve the previous problem of traditional methods. The method is employs Renyi entropy measure of order Æ. The main advantages of the proposed method are its robustness and its flexibility. It has been tested on many different kinds of test images from the real-world and synthetic images. AMS Classification : 68U10, 62H35, 94A17. Keywords: Edge detection, Renyi entropy, Measures of information . 1. Introduction Edge detection can be defined as the boundary between two regions separated by two relatively distinct gray level properties. The causes of the region dissimilarity may be due to some factors such as the geometry of the scene, the radio metric characteristics of the surface, the illumination and so on. The detection results benefit applications such as image enhancement, morphing, compression, retrieval, watermarking, hiding, recognition, restoration, and registration etc [5, 8]. The traditional edge detection algorithms have been developed based on computation of the intensity gradient vector, which, in general, is sensitive to noise in the image. In order to suppress the noise, some spatial averaging may be combined with differentiation such as the Laplacian of Gaussian operators [11]. The Laplacian edge detection method has used a 2-D linear filter to approximate second-order derivative of pixel values of the image [13]. Canny [1, 3] derived analytically optimal step edge operators and showed that the first derivative of Gaussian filter is a good approximation of such operators. An alternative to gradient techniques is based on statistical approaches. The idea is to examine the distribution of intensity values in the neighbourhood of a given pixel and determine if the pixel is to be classified as an edge. In comparison with the differential approaches, less attention has been paid to statistical approaches. However, this method has been approached by some authors, e.g., Bovik et al. [2] and Yakimovsky [12]. The Laplacian generally is not used in its original form for edge detection for several reasons: As a second-order derivative, the Laplacian typically is unacceptably sensitive to noise. The magnitude of the Laplacian produces double edges, an undesirable effect because it complicates segmentation. For these reasons, the Laplacian is combined with smoothing as a precursor to finding edges via zero-crossings. Marr and Hildreth achieved this by using the Laplacian of a Gaussian (LOG) function as a filter [8]. To solve these problems, the study proposed a new technique based on information theory. Renyi entropy is an important measure among several measures of information. The proposed method is decrease the computation time.

Welcome message from author
This document is posted to help you gain knowledge. Please leave a comment to let me know what you think about it! Share it to your friends and learn new things together.
Transcript

IJICIS, Vol. 11, No. 2, JULY 2011
1
USING RENYI'S ENTROPY FOR EDGE DETECTION IN LEVEL IMAGES
M. A. El-Sayed Department of Mathematics, Faculty of Science, Fayoum University,
Fayoum - Egypt. [email protected]
M. A. Khafagy Mathematics Department, Faculty of Science,
Sohag University - Egypt. [email protected]
Abstract: Most of the classical methods for edge detection are based on the first and second order derivatives of gray levels of the pixels of the original image utilizing 2D spatial convolution masks to approximate the derivative. In this paper we present an algorithm for edge detection in gray level images to solve the previous problem of traditional methods. The method is employs Renyi entropy measure of order á. The main advantages of the proposed method are its robustness and its flexibility. It has been tested on many different kinds of test images from the real-world and synthetic images. AMS Classification : 68U10, 62H35, 94A17. Keywords: Edge detection, Renyi entropy, Measures of information .
1. Introduction
Edge detection can be defined as the boundary between two regions separated by two relatively distinct gray level properties. The causes of the region dissimilarity may be due to some factors such as the geometry of the scene, the radio metric characteristics of the surface, the illumination and so on. The detection results benefit applications such as image enhancement, morphing, compression, retrieval, watermarking, hiding, recognition, restoration, and registration etc [5, 8]. The traditional edge detection algorithms have been developed based on computation of the intensity gradient vector, which, in general, is sensitive to noise in the image. In order to suppress the noise, some spatial averaging may be combined with differentiation such as the Laplacian of Gaussian operators [11]. The Laplacian edge detection method has used a 2-D linear filter to approximate second-order derivative of pixel values of the image [13]. Canny [1, 3] derived analytically optimal step edge operators and showed that the first derivative of Gaussian filter is a good approximation of such operators. An alternative to gradient techniques is based on statistical approaches. The idea is to examine the distribution of intensity values in the neighbourhood of a given pixel and determine if the pixel is to be classified as an edge. In comparison with the differential approaches, less attention has been paid to statistical approaches. However, this method has been approached by some authors, e.g., Bovik et al. [2] and Yakimovsky [12]. The Laplacian generally is not used in its original form for edge detection for several reasons: As a second-order derivative, the Laplacian typically is unacceptably sensitive to noise. The magnitude of the Laplacian produces double edges, an undesirable effect because it complicates segmentation. For these reasons, the Laplacian is combined with smoothing as a precursor to finding edges via zero-crossings. Marr and Hildreth achieved this by using the Laplacian of a Gaussian (LOG) function as a filter [8]. To solve these problems, the study proposed a new technique based on information theory. Renyi entropy is an important measure among several measures of information. The proposed method is decrease the computation time.
id55017262 pdfMachine by Broadgun Software - a great PDF writer! - a great PDF creator! - http://www.pdfmachine.com http://www.broadgun.com

El-Sayed, and Khafagy: Using Renyi's Entropy For Edge Detection In Level Images
2
The remainder of the paper is organized as follows: Section (2) presents some fundamental concepts of the mathematical setting of the threshold selection and Renyi entropy. In section (3), we describe the newly proposed method of edge detection in gray level images using Renyi entropy. In section (4), the experimental result of many edge detections obtained when applied to some real-world and synthetic images, then we report the effectiveness of our method and finally in section (5) the discussion and conclusion about our method are given.
2.Selection of suitable threshold value
Entropy is used to measure the amount of information. Entropy is defined in terms of the probabilistic behaviour of a source of information. Given events e1, e2, �, ek occurring with probabilities p1, p2, �, pk, being k the total number of states, 1ip , i=1,2,�,k and 0 ≤ pi ≤ 1.
Shannon entropy is defined as [4, 10]:
k
iii ppS
1
)ln( (1)
If we consider that a system can be decomposed in two statistical independent subsystems A and B, the Shannon entropy has the extensive property: S(A+B) = S(A)+ S(B). This formalism has been shown to be restricted to the Boltzmann-Gibbs-Shannon (BGS) statistics [10].
Let f(x, y) be the gray value of the pixel located at the point (x, y). In a digital image of size M×N, 1≤ x ≤ M and 1≤ y≤N. Let the histogram be h(a) for aG ={0, 1, 2, �, 255} with f as the amplitude (brightness) of the image at the real coordinate position (x, y). Let t be a threshold value, the optimal threshold t* is determined by optimizing a suitable criterion function obtained from the gray level distribution of the image and some other features of the image. If t* is determined solely from the gray level of each pixel, the thresholding method is point dependent [7]. The result of thresholding an image function f(x, y) at gray level t is a binary function ft(x, y) such that ft(x, y) = 0 if ft(x, y) ≤ t otherwise, ft(x, y) =1. In general, a thresholding method determines the value t* of t based on a certain criterion function.
The Rényi entropy is a one-parameter generalization of the Shannon entropy. There is extensive literature on the applications of the Rényi entropy in many fields from biology, medicine, genetics,
linguistics, and economics to electrical engineering, computer science, geophysics, chemistry and physics. The Renyi's entropy measure of order á of an image, H
á(P) is defined as (see Refs. [6,9]):
255
0
)(ln1
1)(
iipPH
(2)
where á≠1 is a positive real parameter. Since Shannon entropy measure is a special case of the Renyi entropy for á →1.
Let pi = p0, p1, . . . , pk be the probability distribution for an image with k gray-levels. From this distribution, we derive two probability distributions, one for the object (class A) and the other for the background (class B), given by:
pA : p
0/P
A , p
1/P
A , �, p
t/P
A and p
B : p
t+1/P
B , p
t+2/P
B , �, p
k/P
B .

IJICIS, Vol. 11, No. 2, JULY 2011
3
where
t
iiA p P
0
, A
k
tiiB Pp P
11
. For the gray levels G, put k =255. The Renyi entropy of order á
for each distribution is defined as:
t
iAi
A PptH0
)/(ln1
1)(
(3)
and
255
1
)/(ln1
1)(
tiBi
B PptH
(4)
Há(t) is parametrically dependent upon the threshold value t for the foreground and background. We try to maximize the information measure between the two classes (object and background). When H
á(t) is
maximized, the luminance level t that maximizes the function is considered to be the optimum threshold value.
)].()([max)(* tHtHArgt BA
Gt
(5)
The technique consists of treating each pixel of the original image and creating a new image, such that ft(x,y) = 0 if ft(x,y) ≤ t*(á) otherwise, ft(x, y) =1 for every 1≤ x ≤ M and 1≤ y ≤ N. Since Shannon entropy measure is a special case of the Renyi entropy. The following expression can be used as a criterion function to obtain the optimal threshold at á →1.
)].()([max)1(* tStSArgt BA
Gt
(6)
To select suitable threshold value t* and á can now be described as follows in RenyiThreshold algorithm: Algorithm RenyiThreshold: Input: A digital grayscale image A of size M × N. Output: Threshold value t* at the parameter á. Begin
1. Let f(x, y) be the original gray value of the pixel at the point (x, y), x=1..M, y=1..N . 2. For all i = 0, 1,�, 255 , calculate pi and P. 3. For all t{0,1,�,255}:
i. Calculate AP , BP , Ap , and Bp .
ii. Calculate )(tH A
and )(tH B
.
iii. For á>0, calculate t*(á), using Equations (5, 6) End. End algorithm.
3.The edge detection
We will use the usual masks for detecting the edges. A spatial filter mask may be defined as a matrix w of size m×n. Assume that m=2ì+1 and n=2ñ+1, where ì, ñ are nonzero positive integers. For this purpose, smallest meaningful size of the mask is 3×3. Such mask coefficients, showing coordinate arrangement as
Figure 1. Image region under the above mask is shown as Figure 2 .

El-Sayed, and Khafagy: Using Renyi's Entropy For Edge Detection In Level Images
4
In order to edge detection, firstly classification of all pixels that satisfy the criterion of homogeneousness, and detection of all pixels on the borders between different homogeneous areas. In the proposed scheme, first create a binary image by choosing a suitable threshold value using Renyi entropy. Window is applied on the binary image. Set all window coefficients equal to 1 except centre, centre equal to × as shown in Figure 3.
Move the window on the whole binary image and find the probability of each central pixel of image under the window. Then, the entropy of each central pixel of image under the window is calculated as S(CPix) = - pc ln ( pc ). Where, pc is the probability of central pixel CPix of binary image under the window. When the probability of central pixel, pc =1, then the entropy of this pixel is zero. Thus, if the gray level of all pixels under the window homogeneous, pc= 1 and S =0. In this case, the central pixel is not an edge pixel. Other possibilities of entropy of central pixel under window are shown in Table 1.
Table 1 . p and S of central under window.
p 1/9 2/9 3/9 4/9 5/9 6/9 7/9 8/9
S 0.2441 0.3342 0.3662 0.3604 0.3265 0.2703 0.1955 0.1047
In cases sum = 8, pc= 8/9, and sum=9, pc=7/9 , the diversity for gray level of pixels under the window is low. So, in these cases, central pixel is not an edge pixel. In remaining cases, sum≤ 6 and pc≤6/9 , the diversity for
gray level of pixels under the window is high. The complete RenyiEdgeDetection algorithm can now be described as follows:
w (-1,-1) w (-1,0) w (-1,1) f (x-1, y-1) f(x-1,y) f (x-1, y+1)
w (0,-1) w (0,0) w (0,1) f (x, y-1) f (x, y) f (x, y+1)
w (1,-1) w (1,0) w (1,1) f (x+1, y-1) f (x+1,y) f (x+1, y+1)
Figure 1
Figure 2
1 1 1
1 × 1
1 1 1
Figure 3

IJICIS, Vol. 11, No. 2, JULY 2011
5
Algorithm RenyiEdgeDetection; Input: A digital grayscale image A of size M × N. Output: The edge detection image g of A. Begin
1. Select suitable *t and á, using RenyiThreshold. 2. Create a binary image: If f(x, y) ≤ t*(á) then f (x,y) =0 Else f(x, y) =1 . 3. Create a mask w, with dimensions m×n : Normally, m=n=3. ì =(m-1)/2 and ñ=(n-1)/2. 4. For all 1≤ x≤ M and 1≤ y ≤ N: find g an output image by set g(x, y) = f(x, y) . 5. For all ñ+1≤ y ≤ N-ñ and ì+1≤ x≤ M-ì, checking for edge pixels:
i. sum� ��� ii. For all -ñ ≤ k ≤ ñ and - ì ≤ j ≤ ì : If ( f(x, y) = f (x+j, y+k) ) Then sum= sum+1. iii. If ( sum >6 ) Then g(x,y)=0 Else g(x,y)=1 .
End End algorithm. The above procedures can be done together in the following MATLAB program: A = imread('lena.tiff'); [M,N]=size(A); if ~islogical(A) A = im2uLQW��$���end; S� �]HURV�������� for ii=1:256 p(ii,1)=ii-���end; S������ �LPKLVW�$��% calculate histogram counts S��S����� ����� �>@��% remove zero entries in p S������ �S���������QXPHO�$���% normalize p so that sum(p) is one. %%%%%%%%% Renyi Entropy to calculate the Threshold %%%%%%%%% $OSKD ����� $UJ0D[ �� for t=1 : size(p) ����3$ �VXP�S���W����� PB= 1-PA ; ����S� S���W����3$�� ����S� S�W����VL]H�S�����3%�� Ha=log2( sum ((p1.^Alpha)) )/(1-Alpha); Hb=log2( sum ((p2.^Alpha)) )/(1-Alpha); Hab = Ha + Hb; if���+DE�!�$UJ0D[����WBRSW S�W�����$UJ0D[ +DE��end; end; f = double (A); for�L ��0� for�M ��1��I�L�M� ���if��$�L�M��! �WBRSW��I�L�M� ���end; end; end %%%%%%%%% Using Threshold_Renyi to find the edge detection of A %%%%%%%%%

El-Sayed, and Khafagy: Using Renyi's Entropy For Edge Detection In Level Images
6
P� �����Q� ��� a0 = (m-����� b0 = (n-����� g=f; % For all pixel coordinates, x and y, do Set g(x, y) = f(x, y) % Checking for edge pixels: for y = b0+1 : N-E�� for x = a0+1 : M-D�� ��������VXP�� ��� for k=-E��E��� for j=-D��D�� if���I�[�\�� �I��[�M�\�N����VXP� VXP�����end; end; end; if���VXP�!����J�[�\� ���else�J�[�\� ���end; end; end; figure; imshow(g);
4. Analysis of Experimental results
The performance of the proposed scheme is evaluated through the simulation results using MATLAB for a many test images. For this purpose, first group, standard test images were taken from free image databases on-line: USC-SIPI Signal and Image Processing Institute in University of Southern California, and CMU. Carnegie Mellon University, Links to image databases. Second group, a test images from the real-world, and synthetic images. Here, we only are present a set of sixteen test images and the results of the proposed scheme are compared with the results of well-established edge detection operator on the same set of test images. The published method by B. Singh and A. P. Singh [8] is chosen for comparison because both approaches are more similar in the technique of implementation. Here, we have used in addition to the original gray level function f(x, y), a function g(x, y) that is the average gray level value in a 3×3 neighborhood around the pixel (x, y). Our analysis is based on how much information is lost due to edge detection. In this analysis, given two edge detections of a same original image, we prefer the one which lost the least amount of information. The optimal threshold value was computed by the proposed method for these sixteen images. Table 1 lists the optimal threshold values t* that are found for these images for á values equal to 0.01, 0.05, 0.1, 0.2, 0.4, 0.6, 0.8, 1, , 2, and 5, respectively. Some original images together with their edge images obtained by using the optimal threshold of some values t* are displayed side by side in Figures 4�10. Using the sixteen images files (see the first columns of Table 2), we conclude that when 0<á<1, our proposed method produced good edge detection with optimal threshold values. Moreover, the optimal threshold value does not change very much when the fractional á value changes a little. However, in most cases, when á was greater than 1, this proposed method did not produce good edge images and the threshold values produced were unacceptable. (See the last columns of Table 2).

IJICIS, Vol. 11, No. 2, JULY 2011
7
This new method when á = 0.1 performs better than Shannon method when the value of á was one on the test images. (see Figures 4�10). We conclude that when á is 0.1 our proposed method produced the best optimal threshold values on the test images. From the results; it has again been observed that the performance of the proposed edge detection scheme is found to be satisfactory for all the test images and works well.
Table 2 . The optimal threshold values t* for various values of á
á Image
t*(.01) t*(.05) t*(0.1) t*(0.2) t*(0.4) t*(0.6) t*(0.8) t*(1) t*(2) t*(5)
baboon.tif 113 112 112 112 112 97 97 97 97 98
biomedical.tif 141 148 148 148 148 148 148 140 82 68
brain.tif 121 121 132 133 141 155 164 172 180 164
cameraman.tif 130 128 125 123 192 192 192 192 197 197
circuit.tif 99 98 96 95 92 89 89 88 83 69
composed.tif 121 121 121 121 121 58 58 58 51 51
eggspindle.tif 90 91 97 115 115 121 121 121 128 128
fluorescein.tif 121 121 121 121 113 106 98 98 82 82
fruits.tif 121 120 119 117 108 107 106 106 101 96
ic.tif 126 125 125 92 84 84 83 83 88 92
head.tif 133 148 148 148 148 164 164 164 164 164
lena.tif 127 127 127 126 124 124 123 123 121 164
peppers.tif 120 120 120 120 120 120 121 121 132 132
Saturn.tif 127 131 134 141 158 164 165 164 2 0
spine.tif 121 121 113 113 105 82 82 67 37 17
synthetic.tif 121 121 121 121 120 113 113 113 164 172
original image gray level histogram proposed method t*(0.1)=112 Shannon method t*(1)=97
Figure 4 baboon image with 512×512 pixel.
El-Sayed, and Khafagy: Using Renyi's Entropy For Edge Detection In Level Images
8
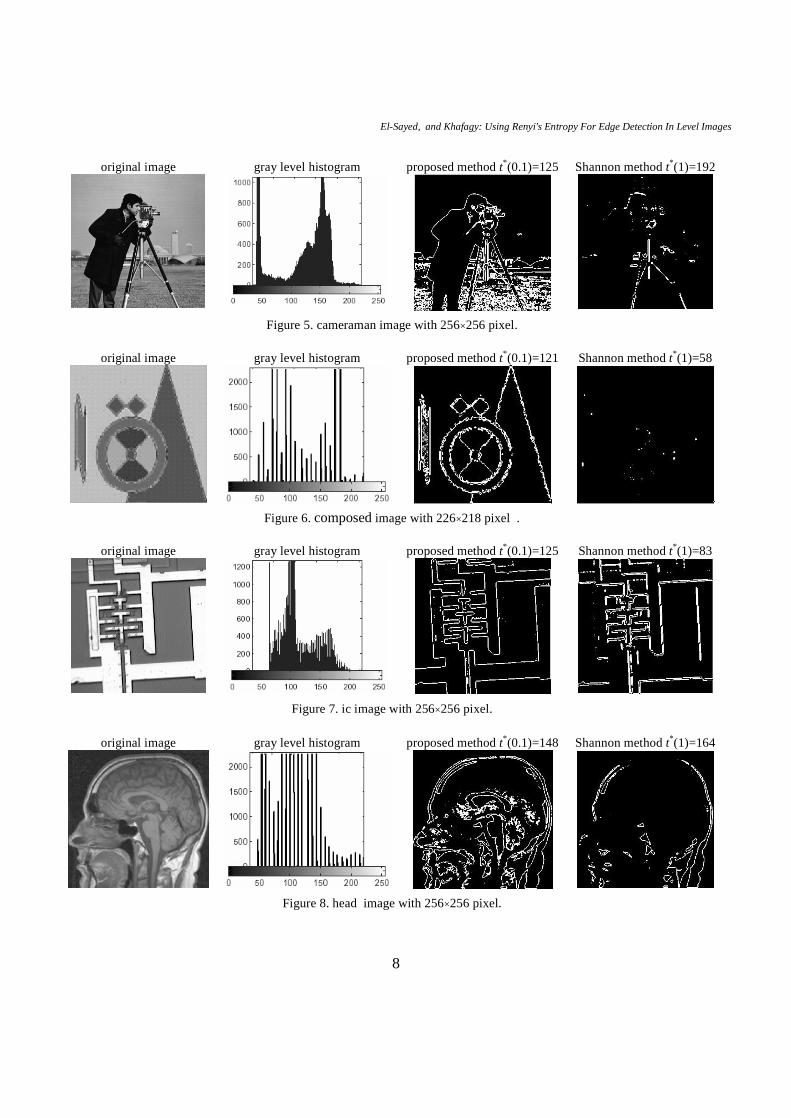
original image gray level histogram proposed method t*(0.1)=125 Shannon method t*(1)=192
Figure 5. cameraman image with 256×256 pixel.
original image gray level histogram proposed method t*(0.1)=121 Shannon method t*(1)=58
Figure 6. composed image with 226×218 pixel .
original image gray level histogram proposed method t*(0.1)=125 Shannon method t*(1)=83
Figure 7. ic image with 256×256 pixel.
original image gray level histogram proposed method t*(0.1)=148 Shannon method t*(1)=164
Figure 8. head image with 256×256 pixel.

IJICIS, Vol. 11, No. 2, JULY 2011
9
original image gray level histogram proposed method t*(0.1)=127 Shannon method t*(1)=123
Figure 9. lena image with 256×256 pixel.
original image gray level histogram proposed method t*(0.1) =127 Shannon method t*(1)=164
Figure 10. Saturn image with 512×512 pixel.
5. Conclusions
We developed a method of edge detection that employs Renyi�s entropy of order á. It is already pointed out in the introduction that the traditional methods give rise to the exponential increment of computational time. However, the proposed method is decrease the computation time with generate high quality of edge detection. Experiment results have demonstrated that the proposed scheme for edge detection works satisfactorily for different gray level digital images. The work is under further progress to examine the performance of the proposed edge detector for different gray level images affected with different kinds of noise. The theoretical principles and systematic development of the algorithm for the proposed versatile edge detector is described in detail. The order á can be used as an adjustable value and can play an important role as a tuning parameter in the image detection chain for the same class of images. This can be an advantage when the image processing tasks depend on an automatic thresholding.
References
[1] M. P. de Albuquerque, I. A. Esquef , A.R. Gesualdi Mello, Image Thresholding Using Tsallis Entropy. Pattern Recognition Letters, 25, (2004)1059-1065.
[2] A. C. Bovik , T. S. Huaung, and D. C. M. JR., Non-parametric tests for edge detection noise, Pattern Recognition, 19 (1986) 209-219.
[3] P. Bao, L. Zhang, and X. Wu, Canny Edge Detection Enhancement by Scale Multiplication, IEEE Tran. Pattern Analysis and Machine Intelligence, 27(9) (2005) 1485-1490.
[4] F. Luthon, M. Lievin and F. Faux, "On the use of entropy power for threshold selection." Int. J. Signal Proc., 84 (2004) 1789-1804.

El-Sayed, and Khafagy: Using Renyi's Entropy For Edge Detection In Level Images
10
[5] K. A. Panetta, E. J. Wharton, Logarithmic Edge Detection with Applications, Journal of Computers, 3 (9) (2008) 1-19.
[6] A. Renyi, "On measures of entropy and information", in: Proceedings of the Fourth Berkeley Symposium on Math. Statist. Prob. Vol. 1, 1960, University of California Press, Berkeley, (1961) 547-561.
[7] P.K. Sahoo, S. Soltani, A.K.C. Wong, Y.C. Chen, "A Survey of the Thresholding Techniques", Computer Vision Graphics Image Process. 41 (1988) 233-260.
[8] B. Singh and A. P. Singh, Edge Detection in Gray Level Images Based on the Shannon Entropy, J. Computer Sci., 4 (3) (2008) 186-191.
[9] P. Sahoo, C. Wilkins, and J. Yeager, "Threshold Selection Using Renyi's Entropy", Pattern Recognition, (1997), pp. 71-84.
[10] C. Tsallis, �Possible generalization of Boltzmann-Gibbs statistics,� J. Stat. Phys., 52 (1988) 479�487. [11] M. Wang and Y. Shuyuan, A Hybrid Genetic Algorithm Based Edge Detection Method for SAR Image,
In: IEEE Proceedings of the Radar Conference�05 May 9-12, (2005) 1503-506. [12] Y. Yakimovsky, Boundary and object detection in real world image, Journal ACM, 23, (1976) 599-
618. [13] R. Zhang, G. Zhao and L. Su, A New Edge Detection Method in Image Processing, In: IEEE
Proceedings of the ISCIT�05 12-14 Oct., 1 (2005) 445-448.
Related Documents