JOURNAL OF INFORMATION SCIENCE AND ENGINEERING 23, 1265-1280 (2007) 1265 Entropy-Based Fade Modeling and Detection JOSE SAN PEDRO WANDELMER 1 , SERGIO DOMINGUEZ CABRERIZO 1 AND NICOLAS DENIS 2 1 DISAM - ETS Ingenieros Industriales Universidad Politecnica de Madrid C/Jose Gutierrez Abascal, 2 − 28006 Madrid, Spain E-mail: {jsanpedro; Sergio}@etsii.upm.es 2 Omnividea Multimedia http://www.omnividea.com E-mail: [email protected] Accurate shot boundary detection techniques have been an important research topic in the last decade. Such interest is motivated by the fact that segmenting a video stream is the first step towards video content analysis and content-based video browsing and re- trieval. In this paper, we present a new algorithm mainly focused on the detection of fades by using of a non-common feature in previous work: entropy, a scalar representa- tion of the amount of information of each video frame. A survey of the properties of this feature is first provided where authors show that the pattern this series exhibits when fades occur is clear and consistent. It does not depend on the monochrome color used to fade and, besides, it is able to deal with on-screen texts remaining in the monochrome stage of them. A statistical model based algorithm to detect fades is proposed. Due to the clear pattern shown by fades in the entropy series and the accurate mathematical model used, motion and illumination changes do not severely affect precision as it normally happens with algorithms dealing with the detection of gradual transitions. Keywords: shot boundary detection, video entropy series, video segmentation, pattern recognition, correlation-based comparison 1. INTRODUCTION Video analysis algorithms commonly rely in results from a series of stages that try to extract structure and meaning from the huge amount of data contained in a clip. Shot boundary detection is often the first of such stages. Its goal is to split the video stream into a series of segments (shots) revealing the syntactic structure of it. Shots are video sequences captured in a single camera’s “record and stop” operation. Shots are joined together during the edition of the video using different types of effects: from simple sharp cuts to gradual transitions as fades or dissolves. This pre-processing stage, if performed accurately, helps to reach high level video interpretation by examin- ing the relationships between shots and transitions. The accurate detection of transition effects between shots requires specialized algo- rithms. Hard cuts represent normally over 80% of the effects in a video. They are char- acterized by an intense and short deviation in the time series of most low level features in the video, which makes its detection easy and fast. A big number of works take advan- tage of the analysis of different features in the time series to detect hard cuts [2, 6]. Received July 20, 2005; revised December 22, 2005; accepted January 23, 2006. Communicated by H. Y. Mark Liao.

Welcome message from author
This document is posted to help you gain knowledge. Please leave a comment to let me know what you think about it! Share it to your friends and learn new things together.
Transcript
JOURNAL OF INFORMATION SCIENCE AND ENGINEERING 23, 1265-1280 (2007)
1265
Entropy-Based Fade Modeling and Detection
JOSE SAN PEDRO WANDELMER1, SERGIO DOMINGUEZ CABRERIZO1
AND NICOLAS DENIS2 1DISAM - ETS Ingenieros Industriales
Universidad Politecnica de Madrid C/Jose Gutierrez Abascal, 2 − 28006 Madrid, Spain
E-mail: {jsanpedro; Sergio}@etsii.upm.es 2Omnividea Multimedia
http://www.omnividea.com E-mail: [email protected]
Accurate shot boundary detection techniques have been an important research topic
in the last decade. Such interest is motivated by the fact that segmenting a video stream is the first step towards video content analysis and content-based video browsing and re-trieval. In this paper, we present a new algorithm mainly focused on the detection of fades by using of a non-common feature in previous work: entropy, a scalar representa-tion of the amount of information of each video frame. A survey of the properties of this feature is first provided where authors show that the pattern this series exhibits when fades occur is clear and consistent. It does not depend on the monochrome color used to fade and, besides, it is able to deal with on-screen texts remaining in the monochrome stage of them. A statistical model based algorithm to detect fades is proposed. Due to the clear pattern shown by fades in the entropy series and the accurate mathematical model used, motion and illumination changes do not severely affect precision as it normally happens with algorithms dealing with the detection of gradual transitions. Keywords: shot boundary detection, video entropy series, video segmentation, pattern recognition, correlation-based comparison
1. INTRODUCTION
Video analysis algorithms commonly rely in results from a series of stages that try to extract structure and meaning from the huge amount of data contained in a clip. Shot boundary detection is often the first of such stages. Its goal is to split the video stream into a series of segments (shots) revealing the syntactic structure of it.
Shots are video sequences captured in a single camera’s “record and stop” operation. Shots are joined together during the edition of the video using different types of effects: from simple sharp cuts to gradual transitions as fades or dissolves. This pre-processing stage, if performed accurately, helps to reach high level video interpretation by examin-ing the relationships between shots and transitions.
The accurate detection of transition effects between shots requires specialized algo-rithms. Hard cuts represent normally over 80% of the effects in a video. They are char-acterized by an intense and short deviation in the time series of most low level features in the video, which makes its detection easy and fast. A big number of works take advan-tage of the analysis of different features in the time series to detect hard cuts [2, 6]. Received July 20, 2005; revised December 22, 2005; accepted January 23, 2006. Communicated by H. Y. Mark Liao.
JOSE SAN PEDRO WANDELMER, SERGIO DOMINGUEZ CABRERIZO AND NICOLAS DENIS
1266
Gradual transitions, such as dissolves and fades, sometimes produce patterns similar to those of moderate motion or lighting changes. However, fades can be detected more ac-curately because of the monochrome sequence of frames at the end of a fade-out or at the beginning of a fade-in.
The assumption of lineal decreasing of luminance during this kind of effects is the base for many algorithms. Alattar [1] and Meng et al. [13] use variance as an indication for detecting a dissolve. In these cases, dissolves are ascertained from peaks and spikes using a threshold that is heuristically determined based on experience and the assumption that neighboring scenes are independent. However, in most real cases a certain correla-tion exists between different scenes, thereby affecting the detection of peaks and spikes in a dissolve region. Consequently, dissolves can be missed in a video sequence that has a high correlation or low variance between adjacent scenes, plus scenes including object and camera motion can be falsely detected as a dissolve. In [17] an adaptive dissolve detection method based on the analysis of a dissolve modeling error is proposed. Candi-dates are extracted using the characteristics of the first and second derivative of a vari-ance pattern, similar to [1] and [13]. After that, candidate regions are verified based on a dissolve modeling error of the parabolic variance pattern. Recall and precision values are above 90%.
Enhancements to gradual transition detection algorithms are proposed by Truong et al. in [16]. Instead of selecting thresholds based on the traditional trial-and-error ap-proach, adaptive thresholds are derived analytically from the mathematical models of transitions. For the detection of fades, monochrome frames are first located. Large nega-tive spikes in the second derivative curve of luminance variance should appear at the beginning of a fade-out and at the end of a fade-in. These spikes will be taken as the boundaries of possible fades, and the first derivative curve of the mean luminance is studied in the values between the spike and the monochrome frames. A new technique for eliminating false positives is proposed: a histogram-based comparison between frames of consecutive shots. This technique can effectively prevent common effects such as flash lights or close-up objects moving in front of the camera to be detected as transitions. This method tends to miss dissolves starting or ending with low variance frames, because the parabolic variance curve is not obvious. Moreover, object and camera motion may pro-duce similar patterns in the parabolic variance curve to those of the dissolves.
Su et al. propose a method to avoid the effects of motion in the detection of transi-tions [15]. It is assumed that the intensity of pixels during a dissolve must be either an ascending or a descending function if shots are different. A sum of pixels which exhibit such condition is performed during the potential dissolve. Only those pixels which are successively increasing or decreasing are taken into account. A threshold is statistically derived and when the sum is above such threshold, a dissolve is detected. Global motion is discarded by the different effect it has on pixel intensities. Hit-rate obtained by this algorithm is in the [77%-85%] range while false positives are in the [18%-34%] range.
Fernando et al. use statistical behavior and structural properties of each frame to identify any kind of boundaries [5]. In addition, an efficient technique is proposed to extract such statistical features (mean and variance) from the compressed video. Statisti-cal methods are also used by Campisi et al. in [3] where they present a computational inexpensive correlation-based algorithm for dissolve and fade detection. Fades and dis-solves are gradual transitions that change linearly: differences between frames are a con-
ENTROPY-BASED FADE MODELING AND DETECTION
1267
stant during the effect. The difference between consecutive frames is computed and sub-divided in W blocks. W correlation coefficients are then computed by comparing appro-priate blocks of consecutive frame differences. A global correlation value is evaluated and compared to a threshold to decide whether it is a transition or not.
A similar method is used by Han et al. using classical statistics to find the correla-tion between two subsequent frame differences [9]. When dissolves undergo camera and object motion, their linear association weakens. To solve this, images are divided into 8 × 8 blocks represented by their average intensity. From this set, some of them will be adap-tively selected: those with low contrast, because they contribute to the reduction of mo-tion artifacts. The overall recall and precision rates for this algorithm are 82% and 74%. In [10] a solution is provided in the form of a statistical detector that is based on the minimization of the average detection-error probability. Required statistical functions are modeled using a robust metric for visual content discontinuities which takes into account shot-length distribution, visual discontinuity patterns at shot boundary and characteristic temporal changes of visual features around a boundary. This algorithm features a recall of 83% and a false detection rate of 22%.
Many different approaches to the detection exist in addition to the luminance analy-sis and the use of statistical methods. A good example of the variety is the work proposed by Guimaraes et al. [7]. Video content is transformed into a 2D image and then image processing tools are used then to find transitions by detecting specified patterns in this image. The transformation is based on the visual rhythm by histogram (VHR). Lumi-nance histogram is extracted for each frame and represented as a vertical line in the 2D image. The height of this image will be the number of histogram bins and the intensity of the (x, y) pixel will be the number of pixels in frame x with a color contained in the his-togram bin y. The proposed method is able to detect fades taking advantage of the fact that each fade is represented by a “slanted line” in this image. The same author uses morphological multi-scale gradient operators (Soille’s gradient) to find the presence, but not the limits, of cuts and gradual transitions in the video [8].
Another approach is the use of advanced pattern recognition and machine learning techniques in the detection of shot boundaries, as proposed by Lienhart and Zaccarin [12]. A dissolve synthesizer capable of creating an infinite number of dissolve examples from a video database is used to train neural networks, which requires large training sets. Two simple features are chosen to find the pattern exhibited by dissolves: contrast-based fea-tures (as the sum of the magnitude of the directional gradients) and color-based features (YUV image histograms). They respond similarly to dissolves, but sometimes differently to typical false positive situations. A post-processing stage of global motion compensa-tion further reduces the number of false positives providing hit-rates of 75% and false- rates of just 16%. Synthetic frames are also used by Covell et al. in a different algorithm [4]. They locate potential dissolves in the footage and create a dissolve using frames at the nominal starting and ending time of the potential dissolve. It is then compared to the frames of the real footage using pixel and histogram differences. Another novelty of this detector is the use of a fixed length window to detect the boundaries. Under some as-sumptions it can be shown that for long dissolve with some amount of motion, the inter-mediate frames are better modeled by a sequence of shorter, nominal-length dissolves. Recall values of this algorithm are close to 88% while precisions is around 93%.
In this paper, we use frame entropy to improve results of fade detectors. Entropy is a
JOSE SAN PEDRO WANDELMER, SERGIO DOMINGUEZ CABRERIZO AND NICOLAS DENIS
1268
measurement of the average amount of bits needed to code some information. Previous work using entropy in video segmentation algorithms is not common. We can highlight the work of Cernekova et al.. They use mutual information and joint entropy series to segment video and extract key frames [18]. Entropy is extracted from frame differences, giving a measurement of the amount of information changing between successive frames.
In this paper we consider entropy in the scope of the color distribution of each frame, which provides a scalar value representing the amount of information contained in each. We provide theoretical and experimental results that show how time series produced by mean luminance or variance (common in previous works) tend to be more difficult to analyze and are more likely to produce false detections than entropy time series.
This paper shows how entropy time series can be used to accurately detect fades, using mathematical models to discard false positives. In section 2, we introduce entropy as a generic measure of information and also as a measure of color information in images. A theoretical study of the behavior of frame entropy in the time series of a video is also presented, focusing in the pattern produced by fades. Section 3 describes a new algorithm to detect fades using frame entropy series. Mathematical models introduced in section 2 are used to create a model-based approach to detection using correlation. Section 4 in-troduces the results obtained by the detector along with an analysis of the effects that could decrease recall and precision. In section 5, we present some conclusions about the quality of this new detector.
2. ENTROPY
The method described in this paper makes use of the unique features that entropy time series exhibit. In this section we introduce the entropy and its behavior in relation to the shot boundary detection problem. 2.1 Mathematical Background
Authors consider the Shannon’s definition of Entropy along this paper [14]. This is, given a random variable, X, which takes on a finite set value according to a probability distribution p(X), the entropy of this probability distribution is defined as:
1( ) ( ) log ( ).
n
i ii
H X p x p x=
= −∑ (1)
Shannon’s entropy is the average amount of information contained in random vari-able X. It is also the uncertainty removed after the actual outcome of X is revealed. The Shannon’s function is based on the concept that the information gain from an event is inversely related to its probability of occurrence.
2.2 Entropy Applied to Images
This definition of the information theory field has a number of applications in com-
ENTROPY-BASED FADE MODELING AND DETECTION
1269
puter vision. We are interested in the meaning of entropy of images. Using Eq. (1) we can compute the entropy of an image, I, in the following way:
Consider X a random variable representing the luminance intensity of I. Consider also that Ik the number of pixels in I with a luminance level of k, where 0 ≤ k ≤ N − 1. We can then define
1
0
( ) kI N
jj
Ip k
I−
=
=
∑ (2)
as the probability of X being color k. This probability can be easily obtained using an histogram representation of I. Con-
sider hI to be the histogram of image I and hI(k) the value of the histogram for luminance level k, then it follows:
1
0
( )( ) ,
( )
II N
Ij
h kp k
h j−
=
=
∑ (3)
1
0( ) ( ) log( ( )).
N
I Ik
H X p k p k−
== −∑ (4)
As entropy can be seen as the uncertainty removed after the actual outcome of X is revealed, it follows that its value increases along with the width of the histogram. Thus, maximum entropy is reached when pI(ci) = 1
N while minimum is reached when all the pixels are within bin k, so pI(ck) = 1. This relation of the entropy with the color distribu-tion of the image lacks an spatial component; its value is the same after applying any transformation to the image that keeps its histogram invariant. This behavior can be use to extract information from a sequence of images or frames by observing the time series of the entropy values.
2.3 Video Sequence Entropy Time Series
The Eq. (4) provides a measurement of the luminance complexity of a frame in a
sequence. Computing this value for the complete sequence give us a time series that can be analyzed to search for certain patterns. Fig. 1 (a) shows a typical scenario in an en-tropy time series. The first values of the series have a constant value, representing a se-quence of frames with the same luminance complexity (frames 0 to 22). A shot with little motion activity and lighting changes will have such behavior. When a hard-cut occurs, the series will normally change abruptly (Frame 23). This is caused by the different lu-minance distribution between frames in different shots. After the cut, the series shows also a constant value, but different from the first. Again, this is a sequence of frames with the same color complexity. Note that, although sometimes it is very clear in the time se-ries where a hard cut exists, histogram difference is a much more reliable method to de-
JOSE SAN PEDRO WANDELMER, SERGIO DOMINGUEZ CABRERIZO AND NICOLAS DENIS
1270
tect them: different histograms can lead to the same entropy value, causing a missed boundary.
When the frame sequence includes a fade, a well defined pattern appears in the en-tropy time series. A fade can be modeled with the following equations:
Tfi = α(t)M + (1 − α(t))I(t) (5)
Tfo = α(t)I(t) + (1 − α(t))M (6) where α(t) is a transformation function that is usually a linear function and t ∈ [0, Time − 1] where Time represents the duration of the fade. M is a monochrome frame and I(t) is the frame at time t.
This linear function, α(t), causes a linear decrease in the width of the histogram and thus a logarithmic decrease in the value of the entropy time series. A simple detector can be built to look for logarithmic curves close to monochrome frame sequences, as we will show in the next section.
3. FADE DETECTION
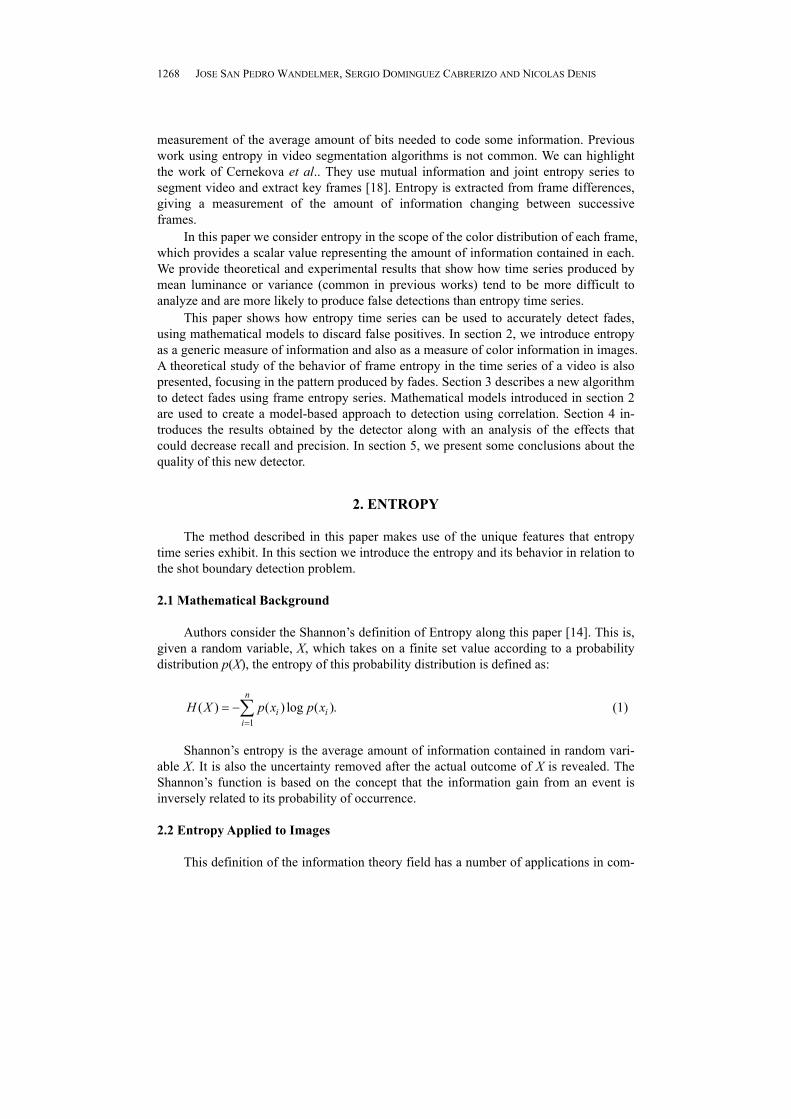
Entropy time series pattern in the presence of fades is depicted in Fig. 1. The figure shows a nearly logarithmic behavior. Motion, lighting changes and irregularities in the luminance histogram cause the curve to have slight variations from the expected loga-rithmic values.
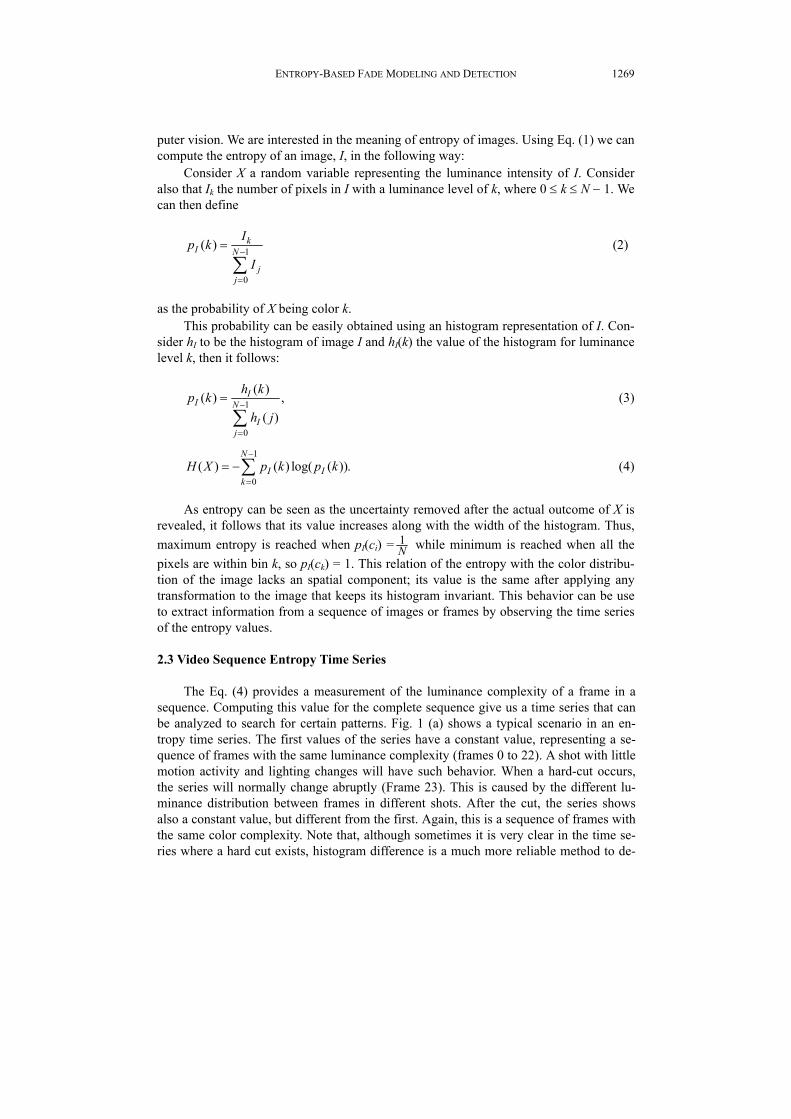
Figs. 1 and 2 show the differences between entropy and mean luminance series, where it is shown that entropy is a better alternative to detect fades. Firstly, entropy is able to filter low information values so monochrome frames can be detected more accu-rately (avoiding artifacts such as on screen text, etc.). Near frame 20, the figure shows a sudden fall in both series, caused by a hard-cut; while the entropy series stays clearly above the monochrome threshold, luminance falls to values that could be considered as monochrome frames. Furthermore, if we consider Fig. 2 (b), near frame 40 a fade exists where there is some on-screen text. The monochrome sequence of this fade has lumi-nance values above the non-monochrome frame luminance of Fig. 2 (b).
Entropy series make no difference to the color the fade goes to (black, white, …). Entropy is a measure of the width of the histogram and not of its value, so if the scene is mainly composed of one single intensity value, the entropy value will be low. Compare the entropy and luminance series in Fig. 2. The FadeIn−FadeOut−FadeIn sequence is much clearer in Fig. 2 (a) because the first fade-in comes from a white (not black) series of monochrome frames.
Note also that, as it usually happens, the fade-in between frames 90 and 120 does not increase linearly. This happens because of lighting and motion and can produce missing detection when using quite selective filters. Detecting such irregular fades causes a decrease in precision, because tolerance to deviations in the ideal behavior can produce false detections.
Knowing the pattern that a fade exhibits in the entropy time series, authors have developed a detector based on the correlation of the real series and the theoretical loga-rithmic series. We can concentrate only in the surroundings of monochrome sequences
ENTROPY-BASED FADE MODELING AND DETECTION
1271
(a) Entropy series. (b) Mean luminance series.
Fig. 1. Frame Sequence A – Entropy and mean luminance series. The sequence has three hard cuts (frames 23, 130 and 190); one face-out ([63-88]) and a fade-in ([90-120]).
(a) Entropy series. (b) Mean luminance series.
Fig. 2. Frame Sequence B – Entropy and mean luminance series. The sequence has two fade-ins ([0, 15], [40, 53]) and a fade out ([30-40]).
that have always very low entropy values even when the color is not black and even in the presence of on-screen text or images. Then, we analyze the surroundings of this monochrome sequence (left and right) to search for a possible fade out and fade in. The correlation based comparison procedure makes use of several fade models to cope with motion or lighting changes during the fades.
3.1 Fade Detection Algorithm Introduction
Using a similar procedure to the one introduced in [11], the first stage of the fade
detection will be the location of the monochrome frame sequences of the video, charac-terized by very low entropy values even when the color is not black and even in the pres-ence of on-screen text or images. A frame sequence 0 1 1{ , , ..., }, 0i i i i
kM f f f k−= ≥ is a monochrome sequence if for every frame in it:
( ) is a monochrome framei i
j mono jH f fθ< (7)
JOSE SAN PEDRO WANDELMER, SERGIO DOMINGUEZ CABRERIZO AND NICOLAS DENIS
1272
being ( )ijH f the entropy of frame and i
j monof θ the monochrome threshold ijf is said
to be a monochrome frame. Fades can only happen just before or after a monochrome frame sequence. Locating
monochrome sequences allows to discard large portions of the entropy time series. For every sequence Mi, we analyze the preceding and succeeding series to detect fade-outs and fade-ins. The detection procedure is analogous in both cases.
To avoid false detections, we use a correlation based comparison approach using a theoretical model of a fade in the entropy series. Some effects other than fades can de-crease entropy gradually to the monochrome region; consider a light spot aiming pro-gressively the camera. When the light comes directly to the camera, low entropy frames are produced. However, the pattern this effect produces does not resemble the one pro-duced by a fade in the entropy series. Therefore, potential fades are compared to a theo-retical model by studying the correlation between them. Correlation between two random variables, X and Y, is defined as:
( , )( , )X Y
Cov X YX Yρσ σ
=
where
2
2
( , ) [( )( )]
( ) ( mean value)
( ) ( mean value)
( ) ( variance)
( ) ( variance).
X Y
X
Y
X
Y
Cov X Y E X Y
E X X
E Y Y
Var X X
Var Y Y
μ μ
μ
μ
σ
σ
= − −
=
=
=
=
When both variables are independent, correlation takes values close to 0 while in the opposite case correlation takes values close to 1 in absolute value (− 1 ≤ ρ(X, Y) ≤ 1). This measure allows to state if the real series meets the model by establishing a threshold, θcov.
This approach relies in the fact that fades will always produce such a characteristic pattern in the time series. Unfortunately, fades do not show such a regular behavior. We can find different fade production functions, α(t). Consider also the noise in the series caused by motion, lighting or non-linear fades. We cannot expect to detect all the fades using a high threshold, θcov, and a single model. However, decreasing θcov could lead to false detections and, consequently, to decreasing precision. These facts lead us to build adapted models for each possible fade.
3.2 Model-Based Approach
Let us consider a potential fade-out defined by
0 1{ , ..., }.i i inF f f −=
Assuming a constant distribution of pixels in the histogram, we can simplify the
ENTROPY-BASED FADE MODELING AND DETECTION
1273
computation of the entropy of a frame, ,ijI f≡ using
1 1
1 10 0 0 01
0
( ) ( )( ) ( ) log( ( )) log( )
( ) ( )
1 1 log( ) log( ).
N NI I
N Nk k I Ic cN
k
h k h kH I p k p k
h c h c
NN N
− −
− −= = = =−
=
= − = −
= − =
∑ ∑∑ ∑
∑ (8)
During a fade-out, and assuming a linear production function α(t), the histogram narrows linearly. The number of histogram bins that contain pixels, K, decreases. The entropy of these frames can be computed as:
1 1 1
0 0
1 1( ) ( ) log( ( )) 0 log(0) log( ) log( ).K N K
k k K kH I p k p k K
K K
− − −
= = == − − = − =∑ ∑ ∑ (9)
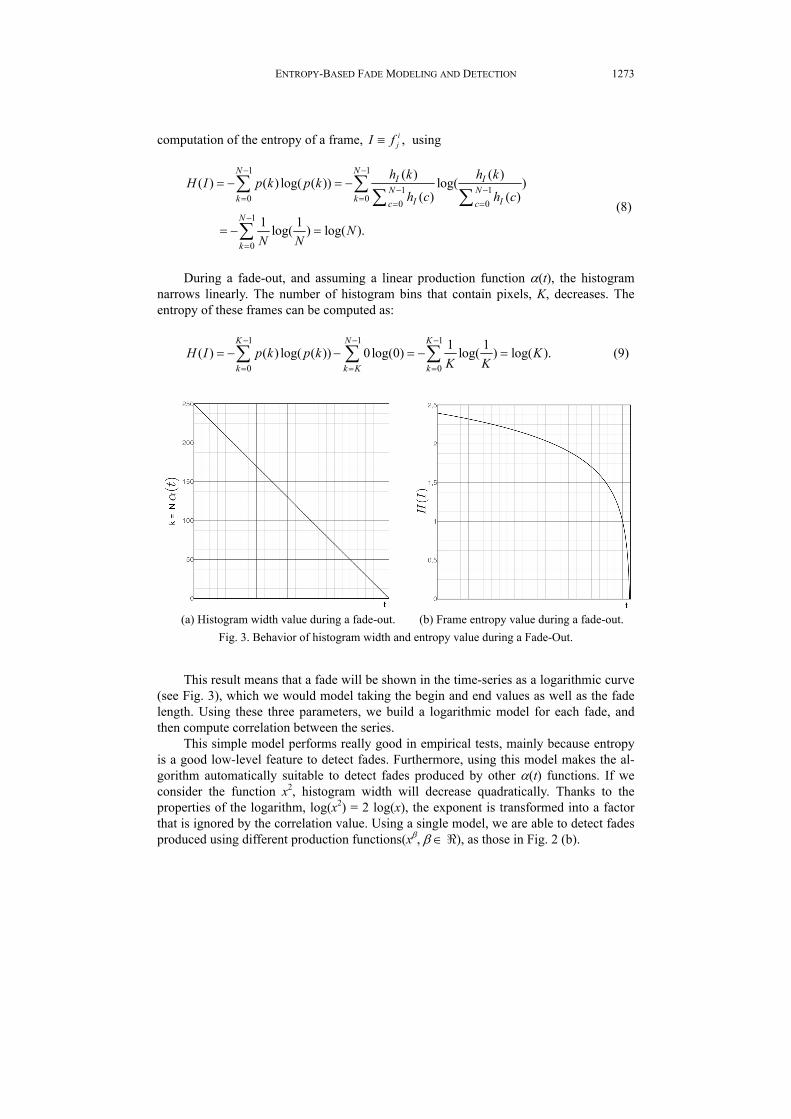
(a) Histogram width value during a fade-out. (b) Frame entropy value during a fade-out.
Fig. 3. Behavior of histogram width and entropy value during a Fade-Out.
This result means that a fade will be shown in the time-series as a logarithmic curve
(see Fig. 3), which we would model taking the begin and end values as well as the fade length. Using these three parameters, we build a logarithmic model for each fade, and then compute correlation between the series.
This simple model performs really good in empirical tests, mainly because entropy is a good low-level feature to detect fades. Furthermore, using this model makes the al-gorithm automatically suitable to detect fades produced by other α(t) functions. If we consider the function x2, histogram width will decrease quadratically. Thanks to the properties of the logarithm, log(x2) = 2 log(x), the exponent is transformed into a factor that is ignored by the correlation value. Using a single model, we are able to detect fades produced using different production functions(xβ, β ∈ ℜ), as those in Fig. 2 (b).
JOSE SAN PEDRO WANDELMER, SERGIO DOMINGUEZ CABRERIZO AND NICOLAS DENIS
1274
3.3 Fade Detection Algorithm
Using all these elements, the detection algorithm locates the next monochrome se-quence 0 1 1{ , , ..., }i i i i
kM f f f −= and then studies the surrounding values. As the proce-dures to detect fade-outs and fade-ins are analogous we will only discuss the detection of fade-outs to simplify the explanation of the algorithm. Fig. 4 shows a fade sample la-beled with the notation used in the algorithm explanation below.
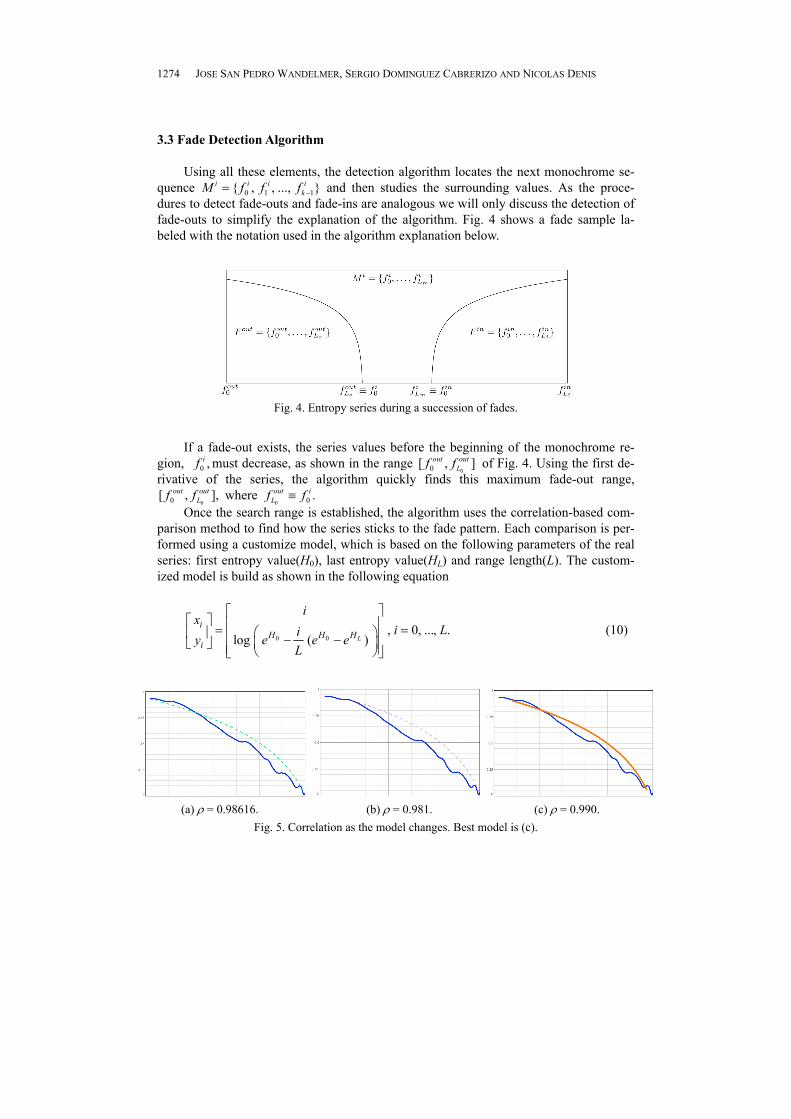
Fig. 4. Entropy series during a succession of fades.
If a fade-out exists, the series values before the beginning of the monochrome re-
gion, 0 ,if must decrease, as shown in the range 00[ , ]out out
Lf f of Fig. 4. Using the first de-rivative of the series, the algorithm quickly finds this maximum fade-out range,
00[ , ],out outLf f where
0 0 .out iLf f≡
Once the search range is established, the algorithm uses the correlation-based com-parison method to find how the series sticks to the fade pattern. Each comparison is per-formed using a customize model, which is based on the following parameters of the real series: first entropy value(H0), last entropy value(HL) and range length(L). The custom-ized model is build as shown in the following equation
0 0, 0, ..., .
log ( )L
iH H H
i
ix
i Lie e eyL
⎡ ⎤⎡ ⎤ ⎢ ⎥= =⎛ ⎞⎢ ⎥ ⎢ ⎥− −⎜ ⎟⎣ ⎦ ⎢ ⎥⎝ ⎠⎣ ⎦
(10)
(a) ρ = 0.98616. (b) ρ = 0.981. (c) ρ = 0.990.
Fig. 5. Correlation as the model changes. Best model is (c).
ENTROPY-BASED FADE MODELING AND DETECTION
1275
The correlation value between the model and the real series is also used to locate the real limits of the fade; it is common that the original fade-out search range,
00[ , ],out outLf f
includes extra frames that meet the decreasing condition but do not belong to the fade-out. Fig. 5 shows how, by modifying the limits of the initial search range, the corre-lation value changes. The algorithm will look for the sub-range that gets the highest cor-relation value. Note that, for each sub-range, the correlation is performed using a differ-ent model: at least the first entropy value and the range length change.
The algorithm includes two additional conditions in the comparison process: longer fades are preferred over shorter and the minimum length for a fade is limited, lmin. The first condition comes from the fact that if a real fade exist in the range
00[ , ],out outLf f the
correlation of a sub-range 0
[ , ]out outk Lf f takes also very high values. The second condition
is used to finalize the search; an appropriate value is lmin = 4, as shorter fades could be considered as abrupt transitions instead of gradual.
The algorithm proceeds following these steps: For the range of series 0
[ , ],out outj Lf f j
∈ [0, L0] the algorithm:
• computes correlation for A = 0
[ , ]out outj Lf f and B =
01[ , ]out outj Lf f+ with the customized
models, MA and MB. • if length(A) < lmin there is no fade-out. • else if ρ(A, MA) < θcov or ρ(A, MA) < ρ(B, MB) then repeat from the beginning with j = j
+ 1. • else a fade-out exists in the range
0[ , ].out out
j Lf f
4. RESULTS
In this section, a performance evaluation of the proposed detector is provided. The study is focused on two aspects: features of entropy as a fade detector and correlation analysis of our mathematical model. These two points are introduced in this paper as an improvement over previous work related to the detection of gradual transitions, fades in particular.
The video test set used has been selected to provide information in the worst case and includes a wide range of different fades as well as different motion and lighting ef-fects that are known to cause errors (both false and missed detections). A first set of test videos are action movie sequences with explosions, zooms, fast camera panning and high motion activity. The second set of videos includes segments with features that affect en-tropy-based detection: low entropy of the shots surrounding the transitions (e.g. text over a plain background), sudden changes in lighting, too dark and too bright scenes, etc. A big number of fades of all kinds are found in both sets: short (4 frames long) and large (35 frames long), using black and white as the monochrome frame color, …. 4.1 Analysis of Mathematical Model
One of the most common problems of shot detection is getting the highest recall value without increasing the number of false hits. Threshold based algorithms, as the one we have introduced, can be tuned to get the optimum combination of recall and precision
JOSE SAN PEDRO WANDELMER, SERGIO DOMINGUEZ CABRERIZO AND NICOLAS DENIS
1276
changing the threshold. However, each video has its own optimum threshold. Further-more, this technique always decreases precision to increase recall. The mathematical model presented has shown to be valid; recall and precision are above 90%. We were able to get it due to the good behaviour of the model: true and false hits are clearly sepa-rated, so θcov can take a wide range of values without affecting the results.
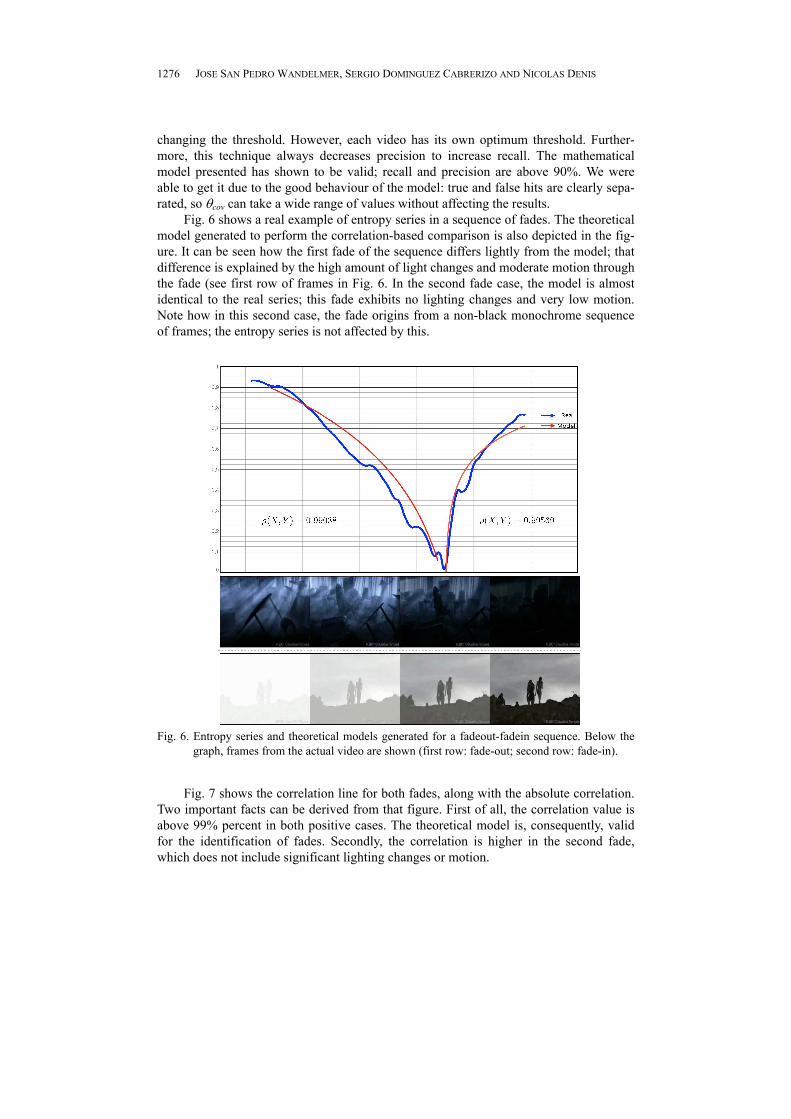
Fig. 6 shows a real example of entropy series in a sequence of fades. The theoretical model generated to perform the correlation-based comparison is also depicted in the fig-ure. It can be seen how the first fade of the sequence differs lightly from the model; that difference is explained by the high amount of light changes and moderate motion through the fade (see first row of frames in Fig. 6. In the second fade case, the model is almost identical to the real series; this fade exhibits no lighting changes and very low motion. Note how in this second case, the fade origins from a non-black monochrome sequence of frames; the entropy series is not affected by this.
Fig. 6. Entropy series and theoretical models generated for a fadeout-fadein sequence. Below the
graph, frames from the actual video are shown (first row: fade-out; second row: fade-in).
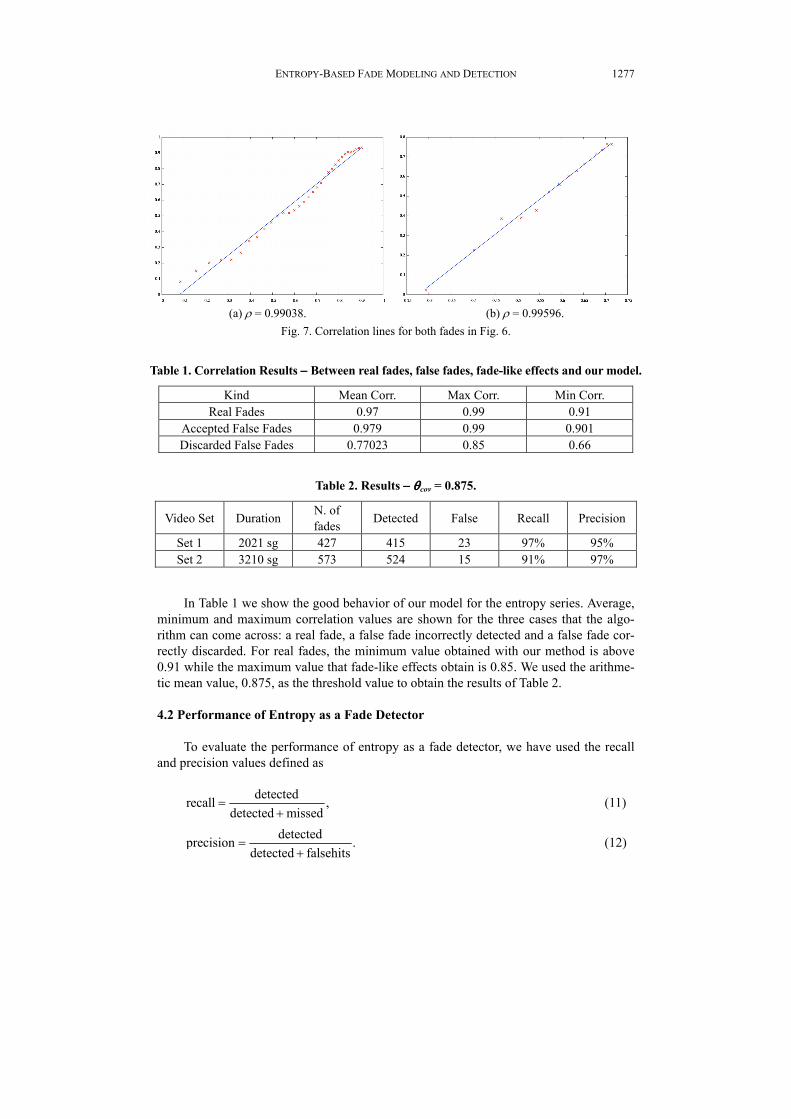
Fig. 7 shows the correlation line for both fades, along with the absolute correlation.
Two important facts can be derived from that figure. First of all, the correlation value is above 99% percent in both positive cases. The theoretical model is, consequently, valid for the identification of fades. Secondly, the correlation is higher in the second fade, which does not include significant lighting changes or motion.
ENTROPY-BASED FADE MODELING AND DETECTION
1277
(a) ρ = 0.99038. (b) ρ = 0.99596.
Fig. 7. Correlation lines for both fades in Fig. 6.
Table 1. Correlation Results − Between real fades, false fades, fade-like effects and our model.
Kind Mean Corr. Max Corr. Min Corr. Real Fades 0.97 0.99 0.91
Accepted False Fades 0.979 0.99 0.901 Discarded False Fades 0.77023 0.85 0.66
Table 2. Results − θcov = 0.875.
Video Set Duration N. of fades Detected False Recall Precision
Set 1 2021 sg 427 415 23 97% 95% Set 2 3210 sg 573 524 15 91% 97%
In Table 1 we show the good behavior of our model for the entropy series. Average,
minimum and maximum correlation values are shown for the three cases that the algo-rithm can come across: a real fade, a false fade incorrectly detected and a false fade cor-rectly discarded. For real fades, the minimum value obtained with our method is above 0.91 while the maximum value that fade-like effects obtain is 0.85. We used the arithme-tic mean value, 0.875, as the threshold value to obtain the results of Table 2. 4.2 Performance of Entropy as a Fade Detector
To evaluate the performance of entropy as a fade detector, we have used the recall
and precision values defined as
detectedrecall ,detected missed
=+
(11)
detectedprecision .detected falsehits
=+
(12)
JOSE SAN PEDRO WANDELMER, SERGIO DOMINGUEZ CABRERIZO AND NICOLAS DENIS
1278
The same two measures are used in most of the bibliography; recall is in charge of evaluating the rate of correct detections while precision evaluates the ability of the de-tector to avoid false detections.
The results presented in Table 2 illustrate high average precision (94%) and recall (96%) values obtained using our detector. The algorithm is therefore very accurate and features good tolerance to motion and lighting effects and independence from the fade length and monochrome color. The noise presents in the first set of videos do not affect the recall value, but mainly precision (false detecting events that exhibit the same pattern as fades: e.g. a zoom into a dark object or objects appearing over a low-entropy back-ground). Recall values are affected by low entropy sequences in which the model is not very clear (e.g. shots with text over plain background).
5. CONCLUSIONS
Authors have successfully used entropy in the fade detection task and results ob-tained are really satisfying. Entropy series present features that make it appropriate to detect fades. Firstly, fade produces an easy to recognize entropy pattern. Fades that use colors other than black produce the same pattern, so entropy provides independence from the monochrome color. In addition, motion and illumination do not produce significant changes in the series that can result in a missed or false detection. To conclude, artifacts and noise (such as on-screen text) don’t make the series to rise above the monochrome region, so fades can be recognized.
Most existing approaches for shot-boundary detection are based on given thresholds, which determine the detection performance. The problem of specifying such a precise threshold and the sensitivity of this method make its validity questionable. In our detector, thanks to the selective and regular behavior of entropy series and the use of a mathe-matical model, we get a very discriminative estimator avoiding being too sensitive to the thresh- old value. Results show a certain degree of independence from the threshold value and from the video being analyzed.
REFERENCES
1. A. M. Alattar, “Detecting and compressing dissolve regions in video sequences with dvi multimedia images compression algorithm,” International Symposium on Cir-cuits and Systems, 1993, pp. 13-16.
2. J. Boreczky and L. Rowe, “Comparison of video shot boundary detection tech-niques,” in Proceedings of the SPIE Conference on Storage and Retrieval for Image and Video Databases, Vol. 2670, 1996, pp. 170-179.
3. P. Campisi, A. Neri, and L. Sorgi, “Automatic dissolve and fade detection for video sequences,” in Proceedings of the 14th International Conference on Digital Signal Processing, 2002, pp. 567-570.
4. M. Covell and S. Ahmad, “Analysis-by-synthesis dissolve detection,” in Proceed-ings of International Conference on Image Processing, 2002, pp. 425-428.
5. W. A. C. Fernando, C. N. Canagarajah, and D. R. Bull, “A unified approach to scene change detection in uncompressed and compressed video,” IEEE Transactions on
ENTROPY-BASED FADE MODELING AND DETECTION
1279
Consumer Electronics, Vol. 46, 2000, pp. 769-779. 6. S. J. F. Guimaraes, M. Couprie, A. de A. Araujo, and N. J. Leite, “A method for cut
detection based on visual rhythm,” in Proceedings of the 14th Brazilian Symposium on Computer Graphics and Image Processing, 2001, pp. 297-304.
7. S. J. F. Guimaraes and A. de A. Araújo, “Video fade detection by discrete line iden-tification,” in Proceedings of International Conference on Pattern Recognition, 2002, pp. 1013-1016.
8. S. J. F. Guimaraes, A. de A. Araújo, M. Couprie, and N. J. Leite, “An approach to detect video transitions based on mathematical morphology,” in Proceedings of In-ternational Conference on Image Processing, 2003, pp. 14-17.
9. S. H. Han and I. S. Kweon, “Detecting cuts and dissolves through linear regression analysis,” IEEE Electronic Letters, Vol. 39, 2003, pp. 1579-1581.
10. A. Hanjalic, “Shot-boundary detection: unraveled and resolved?” IEEE Transactions on Circuits and Systems for Video Technology, Vol. 12, 2002, pp. 90-105.
11. R. Lienhart, C. Kuhmünch, and W. Effelsberg, “On the detection and recognition of television commercials,” in Proceedings of the International Conference on Multi-media Computing and Systems, 1997, pp. 509-516.
12. R. Lienhart and A. Zaccarin, “A system for reliable dissolve detections in videos,” in Proceedings of International Conference on Image Processing, 2001, pp. 406-409.
13. J. Meng, Y. Juan, and S. F. Chang, “Scene change detection in a mpeg compressed video sequence,” in Proceedings of SPIE Conference on Digital Video Compression: Algorithms and Technologies, Vol. 2419, 1995, pp. 14-25.
14. C. E. Shannon, “A mathematical theory of communications,” Bell System Technical Journal, Vol. 27, 1949, pp. 379-423.
15. C. W. Su, H. R. Tyan, H. Y. M. Liao, and L. H. Chen, “A motion-tolerant dissolve detection algorithm,” in Proceedings of IEEE International Conference on Multime-dia and Expo, Vol. 2, 2002, pp. 225-229.
16. B. T. Truong, C. Dorai, and S. Venkatesh, “Improved fade and dissolve detection for reliable video segmentation,” in Proceedings of IEEE International Conference on Image Processing, Vol. 3, 2000, pp. 961-964.
17. J. U. Won, Y. S. Chung, I. S. Kim, J. G. Choi, and K. H. Park, “Correlation based video-dissolve detection,” in Proceedings of IEEE International Conference on In-formation Technology: Research and Education, 2003, pp. 104-107.
18. Z. Cernekova, C. Nikou, and I. Pitas, “Entropy metrics used for video summariza-tion,” in Proceedings of the 18th Spring Conference on Computer Graphics, 2002, pp. 73-82.
Jose San Pedro Wandelmer received his Bachelor degree in Computer Science from Universidad Autonoma de Madrid in 2000 and his Master degree in the Department of Computer Vi-sion, Universidad Politecnica de Madrid in 2003. He is currently pursuing the Ph.D. degree in Computer Science at Universidad Politecnica de Madrid. His research interests include image and video processing, multimedia indexing and retrieval and paral-lelization of video analysis algorithms.
JOSE SAN PEDRO WANDELMER, SERGIO DOMINGUEZ CABRERIZO AND NICOLAS DENIS
1280
Sergio Dominguez Cabrerizo received the M.S. in Control Engineering and the Ph.D. degrees from Universidad Politecnica de Madrid in 1991 and 1996 respectively. He is currently an As-sociate Professor in the Department of Control and Industrial Electronics at the same University. His research interests include computer vision, image and video processing and multimedia indexing and retrieval.
Nicolas Denis received the M.S. degree in Electronic Engi-neering from Lyon School of Chemistry, Physics and Electronics (France) in 2000, in the Signal Processing section. He has worked on various research projects in the Image Processing and Analy-sis Laboratory of Politehnica University, Bucharest, Romania, in the Pattern Recognition and Vision Laboratory of INSA, Lyon, France and in the DISAM Laboratory of the UPM, Madrid, Spain. His research interests include artificial vision and multimedia indexing and retrieval.
Related Documents

![[EXE] Scaling Detection in Time Series Diffusion Entropy Analysis](https://static.cupdf.com/doc/110x72/55cf98e1550346d0339a350f/exe-scaling-detection-in-time-series-diffusion-entropy-analysis.jpg)