1 Using Queueing Theory to Increase the Effectiveness of ED Provider Staffing Objectives: Significant variation in emergency department (ED) patient arrival rates necessitates the adjustment of staffing patterns to optimize the timely care of patients. This study evaluates the effectiveness of a queueing model in identifying provider staffing patterns to reduce the fraction of patients who leave without being seen (LWBS). Methods: We collected detailed emergency department arrival data from an urban hospital and used a “Lag SIPP” queueing analysis to gain insights on how to change provider staffing to decrease the proportion of patients who leave without being seen. We then compared this proportion for the same 39 week period before and after the resulting changes. Results: Despite an increase in arrival volume of 1078 patients (6.3%), an average increase in provider hours of 12 hours/week (3.1%) resulted in 258 fewer patients who left without being seen. This represents a decrease in the proportion of patients who left without being seen by 22.9%. Restricting attention to a 4 day subset of the week during which there was no increase in total provider hours, a reallocation of providers based on the queueing model resulted in 161 fewer patients who left without being seen (21.7%) despite an additional 548 patients (5.5%) arriving in the second half of the study. Conclusion: Timely access to a provider is a critical dimension of emergency department quality performance. In an environment in which emergency departments are often understaffed, analyses of arrival patterns and the use of queueing models can be extremely useful in identifying the most effective allocation of staff. INTRODUCTION Several national reports have documented a growing demand for care from emergency departments (EDs) and a simultaneous decrease in the number of operating emergency departments. The result has been increased crowding, prolonged waiting times to be treated by an emergency provider (i.e. physician or physician assistant), and high percentages of patients leaving emergency departments without being seen.[1, 2] A recent study found that in 2001, 7.7% of the 36.6 million adults in the U.S. who sought care in a hospital emergency department reported trouble in receiving emergency care, and that over half of these cited long waiting times as a cause.[3] Timely access to an emergency provider is a critical dimension of quality for emergency departments. Yet, hospitals often struggle to provide adequate staffing to handle increasing demands for care. Constrained provider capacity relative to demand volume is exacerbated by the extreme variability in demand during each 24 hour period experienced by a typical emergency department. This time-of-day pattern, as reported in the National Hospital Ambulatory Medical Care Survey for 2002 is distinguished by a relatively low level of demand during the night followed by a precipitous increase starting at about 8 or 9 A.M., a peak at about noon, and persistently high levels until late

Welcome message from author
This document is posted to help you gain knowledge. Please leave a comment to let me know what you think about it! Share it to your friends and learn new things together.
Transcript
1
Using Queueing Theory to Increase the Effectiveness of ED Provider Staffing
Objectives: Significant variation in emergency department (ED) patient arrival rates necessitates the adjustment of staffing patterns to optimize the timely care of patients. This study evaluates the effectiveness of a queueing model in identifying provider staffing patterns to reduce the fraction of patients who leave without being seen (LWBS). Methods: We collected detailed emergency department arrival data from an urban hospital and used a “Lag SIPP” queueing analysis to gain insights on how to change provider staffing to decrease the proportion of patients who leave without being seen. We then compared this proportion for the same 39 week period before and after the resulting changes. Results: Despite an increase in arrival volume of 1078 patients (6.3%), an average increase in provider hours of 12 hours/week (3.1%) resulted in 258 fewer patients who left without being seen. This represents a decrease in the proportion of patients who left without being seen by 22.9%. Restricting attention to a 4 day subset of the week during which there was no increase in total provider hours, a reallocation of providers based on the queueing model resulted in 161 fewer patients who left without being seen (21.7%) despite an additional 548 patients (5.5%) arriving in the second half of the study. Conclusion: Timely access to a provider is a critical dimension of emergency department quality performance. In an environment in which emergency departments are often understaffed, analyses of arrival patterns and the use of queueing models can be extremely useful in identifying the most effective allocation of staff.
INTRODUCTION
Several national reports have documented a growing demand for care from emergency departments (EDs) and a simultaneous decrease in the number of operating emergency departments. The result has been increased crowding, prolonged waiting times to be treated by an emergency provider (i.e. physician or physician assistant), and high percentages of patients leaving emergency departments without being seen.[1, 2] A recent study found that in 2001, 7.7% of the 36.6 million adults in the U.S. who sought care in a hospital emergency department reported trouble in receiving emergency care, and that over half of these cited long waiting times as a cause.[3] Timely access to an emergency provider is a critical dimension of quality for emergency departments. Yet, hospitals often struggle to provide adequate staffing to handle increasing demands for care. Constrained provider capacity relative to demand volume is exacerbated by the extreme variability in demand during each 24 hour period experienced by a typical emergency department. This time-of-day pattern, as reported in the National Hospital Ambulatory Medical Care Survey for 2002 is distinguished by a relatively low level of demand during the night followed by a precipitous increase starting at about 8 or 9 A.M., a peak at about noon, and persistently high levels until late
2
evening. [4] In addition, though the general pattern of demand is similar across the week, individual days are likely to experience different overall volumes as well as slight differences in the exact timing of peaks and valleys. Among the foremost challenges in determining emergency department provider schedules is trying to match staffing levels to accommodate these changing demand levels. This is a difficult task for several reasons. First, even in the case of constant demand levels over the day, statistical fluctuations in individual patient arrival times and the variability in the time needed by a provider to treat patients can create long delays even when overall average staff capacity is greater than average demand. Second, the magnitude of delays is a non-linear function of the demand or staffing level, and is thus impossible to predict without the use of a queueing model.[5] In an environment with time-varying demands, delays are likely to be even greater, particularly if staffing is not carefully adjusted based on the actual fluctuation of the arrival rate over the day. Furthermore, the level of staffing in any given interval affects delays in other staffing intervals and the interaction effects are not predictable without the use of a model. [6, 7] Finally, staff levels at any given time may be constrained by organizationally mandated shift lengths as well as by the preferences of individual providers. The primary goal of this study is to demonstrate the benefit of using a queueing model to construct emergency department provider staffing schedules that result in a more effective allocation of provider hours over the day and over the week.
METHODS Study design and setting. We conducted a controlled trial with a “before-after” design. The study examined the response of one emergency department measure of performance, left without being seen (LWBS), to a provider staffing reallocation based on queueing theory. The study site is an urban emergency department in the Inwood neighborhood of northern Manhattan and has an annual census of approximately 25,000 patients. The population is 61% Hispanic, 18% African-American, and 17% White. Twenty-five percent of patients arrive via ambulance. The admission rate for patients seen by a provider is 23%. At the time that the study began, staffing levels and shift schedules were identical for all days of the week using 55 provider-hours per day. The ED was staffed with attending emergency medicine physicians and physician assistants. There were no residents rotating through this ED during the study. This study was granted an exemption from full review by the institutional review board. Study protocol. Two 39 week periods - one before the staffing changes (August 26th, 2002 – May 25th, 2003) and one after the staffing changes (September 1st 2003 – May 30th 2004) - were studied. Matching weeks were chosen to better control for seasonal variation in both volume and disease states. The intervals are not aligned by exact date as to control for number of total days as well as days of the week. These date intervals result in exactly 39 complete weeks for both the before and after time intervals. The two periods of study are not contiguous; they are separated by a 14 week intervening period during which the staffing changes had started but were not yet fully implemented.

3
Queueing Model Description. An M/M/s queueing model was used to estimate the number of providers needed during each staffing interval.[8] This model assumes a single queue with unlimited waiting room that feeds into s identical servers (e.g. providers). Arrivals occur according to a time-homogeneous Poisson process with a constant rate and the service duration (e.g. provider time associated with a patient) has an exponential distribution. (These two assumptions are often called Markovian, hence the use of the two “M’s” in the notation used for the model). One advantage of using the M/M/s model is that given an arrival rate, an average service duration and the number of servers, formulae for performance measures such as the probability of a positive delay or the mean delay can be easily obtained and implemented on a spreadsheet.[8] Software packages that contain these formulae are widely available. The delay is measured from the time of the demand for service (e.g. patient registered in the emergency department) to the time at which service begins (e.g. a provider is available to treat that patient). It is important to note that the model’s delay predictions pertain only to waiting times due to provider unavailability and do not include any other possible delays prior to seeing a provider such as registration and triage times, which would have to be estimated independently. Since the M/M/s model assumes that the arrival rate does not change over the day, actual service systems that have time-varying demands typically use this type of model as part of a SIPP (stationary independent period by period) approach to determine how to vary staffing to meet changing demand. The SIPP approach begins by dividing the workday into staffing periods, e.g. one, two, four or eight hours. Then a series of M/M/s models are constructed, one for each staffing period. Each of these period-specific models is independently solved for the minimum number of servers needed to meet the service target in that period. The service target might be a desired maximum mean delay or probability of delay standard. However, recent research has shown that the SIPP approach is often unreliable, and that a simple modification, called Lag SIPP, is often more effective in identifying staffing levels that achieve the desired performance standard.[7] This is because in many service systems with time-varying arrival rates, the time of peak congestion significantly lags the time of the peak in the arrival rate.[6] While the standard SIPP approach ignores this phenomenon, the Lag SIPP method incorporates an estimation of this lag and thus does a better job of identifying staffing levels to limit delays. In this study, we used the Lag SIPP methodology, which was programmed using C as part of a prior research project, to identify provider staffing levels to achieve a given delay standard. The delay standard we choose was that no more than 20% of patients wait more than one hour before being seen by a provider. The use of one hour is consistent with the time standards associated with emergent and urgent patient groups used in the National Hospital Ambulatory Medical Care Survey.[4] The 20% criterion reflects the approximate percentage of non-urgent arrivals at the study institution.
Measures. For the performance analysis phase, patient disposition, arrival mode, age, gender and length of stay were extracted from the Eagle 2000 registration database.
4
Percent left without being seen was defined as the total patients who left without being seen divided by the total number of registered patients during the specified time period. Since patients are triaged before registration, it is possible that some LWBS patients were not captured in our data collection.
A critical measure of emergency department performance related to provider staffing and patient throughput is the time from triage to the time to be seen by a provider. This measure was not recorded during the time period of this study. Instead, we used the strongly related measure - the proportion of patients who leave without being seen – as the determinant of the efficacy of the staffing changes suggested by our study. Previous studies have established a strong link between long emergency department delays and LWBS.[9, 10] In addition, the proportion of LWBS is itself an important measure of emergency department performance and quality of care. Several studies have concluded that patients who LWBS are sick and do require emergency care. One study has shown that up to 11% of patients who leave without being seen are hospitalized within a week and 46% of patients were judged to require immediate medical attention.[11] Data analysis. Data was extracted from the hospital’s admission database (Eagle 2000, Siemens Inc., Malvern, PA), using SAS version 9.1.3 (SAS Institute Inc. Cary, NC). Emergency department hourly arrival data during 2002 were grouped by day of week. These data were used to construct the arrival rates needed as input to the queueing model. The queueing model also requires an average provider service time per patient, which must include the times of all activities related to a patient. These activities include direct patient care, review of x-rays and lab tests, phone calls, charting, and speaking with other providers or consults. At the time of the study, provider service times were not recorded. The only reference we were able to find in the literature that includes such data reports an average service time of 24 minutes based on a prospective time study.[12] For the purposes of our study, we used an average service time of 30 minutes based, in part, on the existing literature, but also on productivity data and observation from the study site. We constructed a multivariate logistic regression model using LWBS (0 or 1) as the dependent variable. The main independent variable was an indicator variable designating the original or new staffing (0 or 1). Daily mean total emergency department length of stay values, daily mean total visit values and mode of arrival (ambulance vs. ambulatory) were used in a logistic regression model to assess the relationship between the staffing change and the odds of LWBS. There was no change in nursing or tech staffing during the study period and thus these variables were not included in the model. The model was applied to obtain odds ratios (ORs) with 95% confidence intervals (CIs) before and after adjustment for these potentially confounding factors. Hosmer-Lemeshow goodness-of-fit test was used to test the multivariate logistic regression model fit. Statistical analysis was conducted using SAS version 9.1.3 (SAS Institute Inc. Cary, NC).
In addition to the analysis of the complete dataset, the following subgroups were
examined separately; weekdays, weekends and the 4 day subset of Saturday, Sunday,

5
Monday and Tuesday. As noted above, 4 hours were moved from both Saturday and Sunday and 4 hours were added to each of the weekdays. Therefore, by examining a 4 day subset consisting of 2 weekend days and 2 weekdays, we were able to analyze the effect of reallocation of hours, both between days and within each day, without the confounding effect of the additional provider hours added to the schedule.
RESULTS
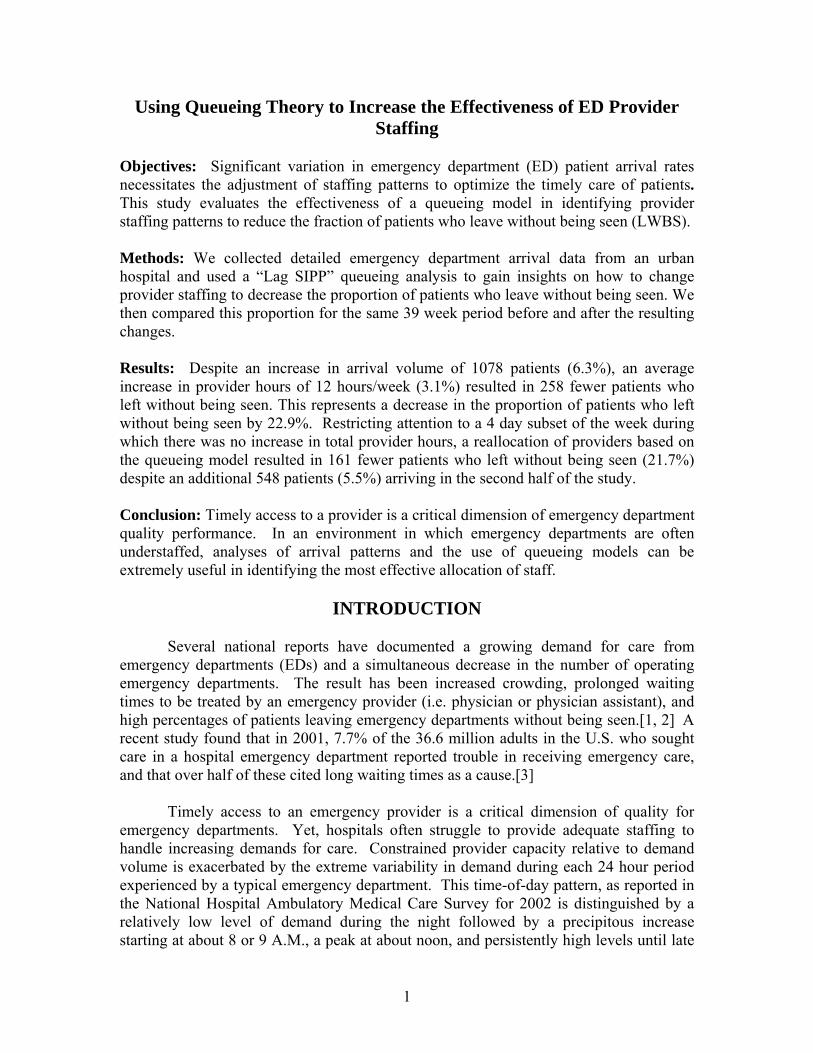
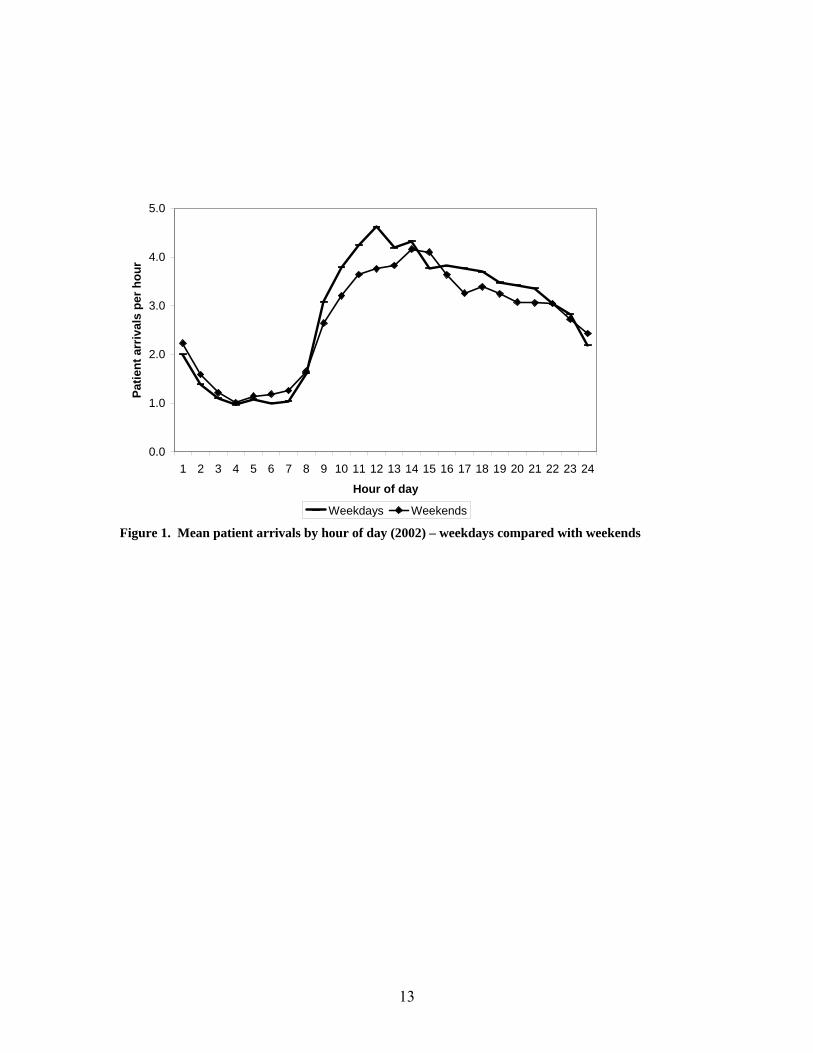
Queueing Model Analysis, Recommendations and Resulting Insights. Linear regressions for arrivals for the 2002 calendar year showed that the ratio of the mean to the variance of the number of emergency department patient arrivals each half-hour by day of week was consistently close to 1. This supports for the assumption of time-varying Poisson arrivals used by the queueing model. An examination of the hourly average arrival rates by day of week revealed that while the daily pattern of peaks and valleys was quite consistent, the overall average volume varied from a low of 63 patients per day on Saturdays to a high of 72 per day on Mondays. While this degree of variation indicated that the current policy of identical staffing levels for all days of the week was likely suboptimal, it was deemed impractical to have a different provider schedule every day. So we decided to use queueing analyses to develop two schedules: weekday and weekend. Figure 1 shows the aggregated average hourly emergency department visit rates for weekdays and weekends. We used these average hourly arrival rates and the estimated average provider time per patient of 30 minutes as input to the Lag SIPP routine to estimate staffing levels, based on two-hour staffing intervals, to achieve a maximum probability of 20% that a patient would wait more than one hour to be seen by a provider during any staffing interval.
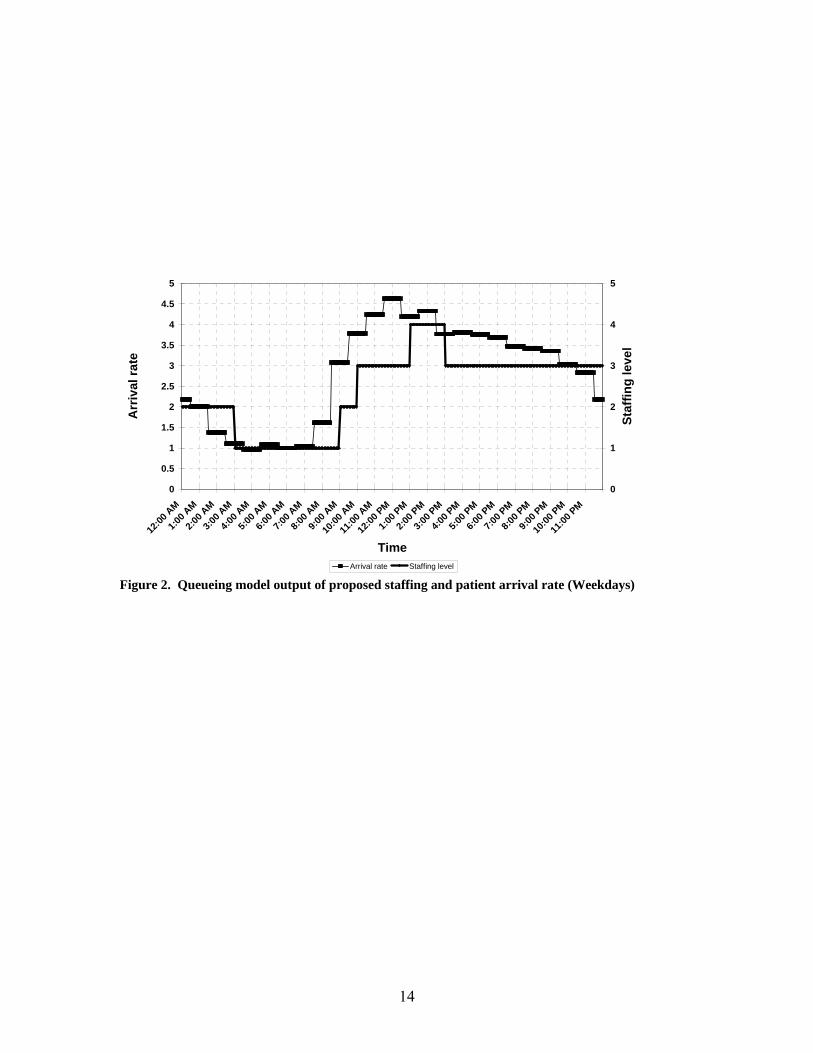
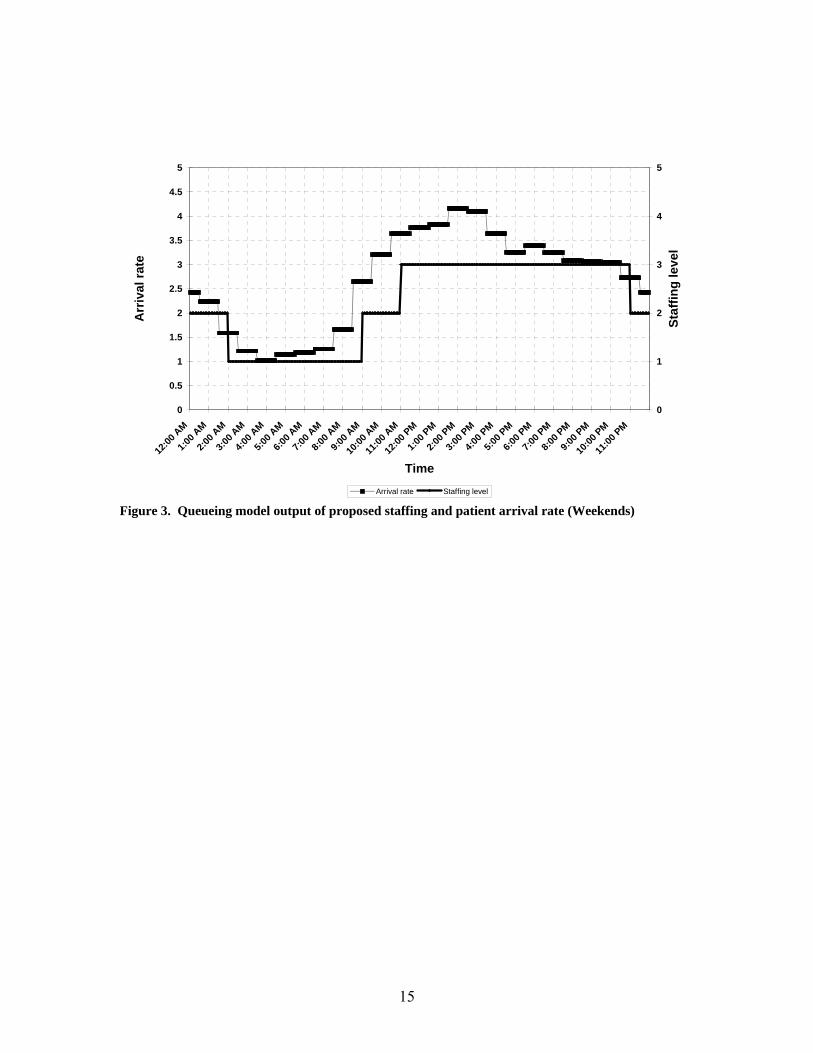
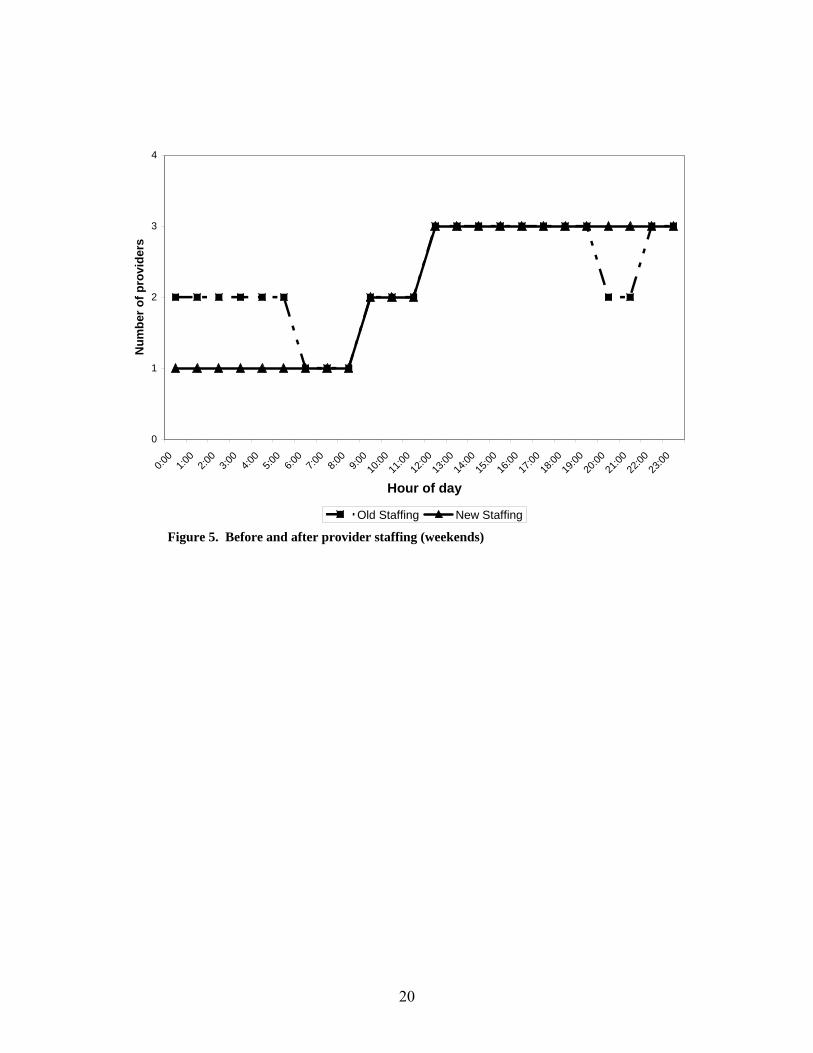
The modeling results (Figures 2 and 3) indicated that a total of 58 provider-hours were needed on weekdays to achieve the desired service standard, which represented an increase of 3 hours over the existing staffing level of 55 provider-hours. Model runs for the weekend indicated that the target performance standard could be achieved with a total of 53 provider-hours. In both these cases, the queueing analyses suggested that the existing staffing pattern over the course of the day needed to be changed (See Figures 4 and 5 for the original and new staffing patterns.). Specifically, it indicated that some provider hours should be switched from the middle of the night to much earlier in the day. This suggested change was further supported by the realization that more patients are impacted by staffing levels during high arrival rate intervals than during low demand levels. Therefore, implementing adequate staffing levels during the late morning, afternoon and evening hours would have a greater positive effect on emergency department delays and LWBS levels than doing so during the middle of the night. A more subtle change suggested by the model was that the increase in staffing level to handle the morning surge in demand needed to occur earlier than in the original schedule. The insights gained from these analyses became the guiding principles in developing new provider schedules. Development of New Schedules. The entire weekly staffing schedule was deconstructed and rebuilt based on the results of the queueing analyses. The resulting staffing

6
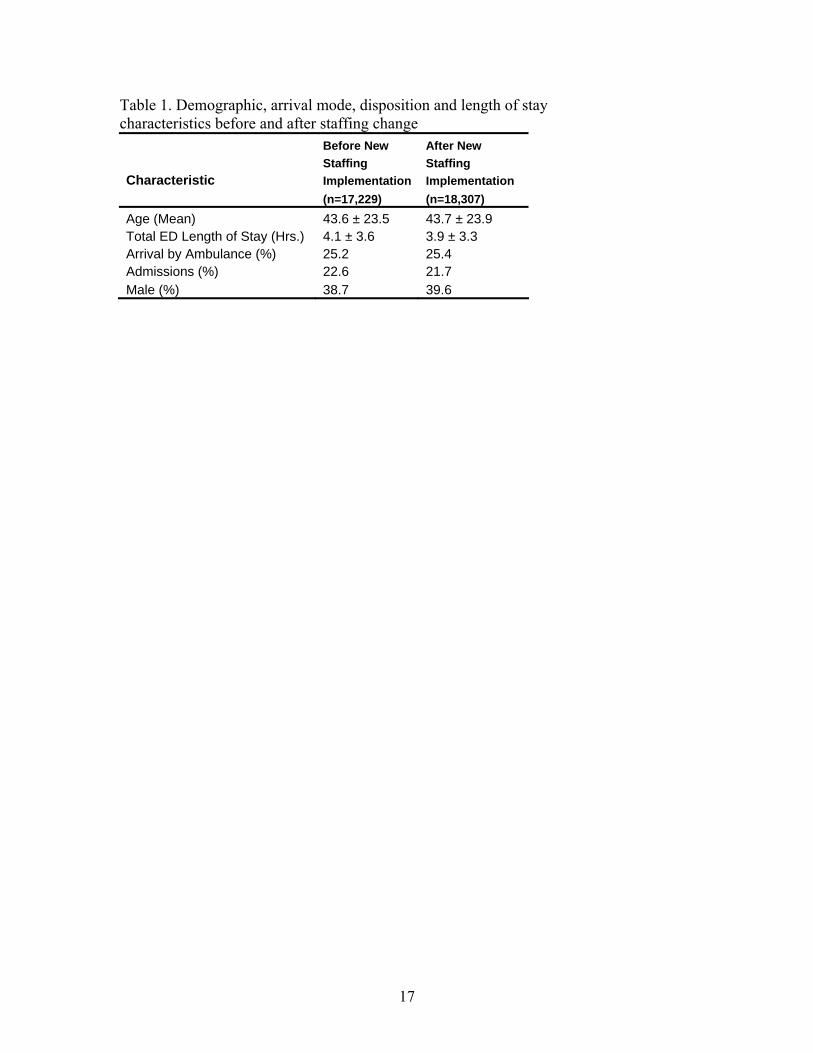
requirement of 59 hours on weekdays to achieve the performance standard of provider contact within 1 hour for 80% of patients translated into 20 more hours on weekdays relative to the 55 hours per weekday which was then available. Though there was a 3% staffing increase approved at the time of the implementation phase of this study, this additional 12 hours still fell short of the recommended levels. The queueing model, however, facilitated a more logical placement of providers throughout the week and the day including the movement of 8 provider hours from the weekend to the weekdays. Weekdays. Figure 4 illustrates the weekday staffing levels both before and after the change was made. The second provider on the overnight shift, 10pm-6am, was moved to a daytime shift, 2pm-10pm. In addition, the noon–8pm shift was moved to a 10am-6pm shift based on the model results indicating a need to increase staffing earlier in the day. To better handle the high afternoon and evening volumes, an additional 4 hours were added to the 2pm-10pm shift resulting in a 12 hour shift from 2pm – 2am. Eight of these 20 additional hours (5 weekdays * 4 hours/day) were obtained by decreasing staffing on weekends based on the modeling results, and the 12 remaining additional hours represent the 3% increase in staffing placed into the emergency department. The net result of these changes resulted in a schedule of 59 provider hours (daily) for weekdays, 1 more than suggested by the queueing model. Weekends. Figure 5 illustrates the weekend staffing levels both before and after the change was made. The second provider on overnight shifts (10pm-6am) was eliminated. The noon – 8pm shift was extended to midnight. This resulted in a net removal of 4 hours of provider time on both Saturday and Sunday and resulting in 51 provider hours (daily) for both weekend days, 2 less than suggested by the queueing model. Outcome Results. 35,536 patients arrived to seek care in the emergency department during the 78 weeks examined. There was an increase of 1,078 patient visits (6.3%) during the implementation phase compared to the baseline period. Demographic characteristics of the patients in each group are shown in Table 1.
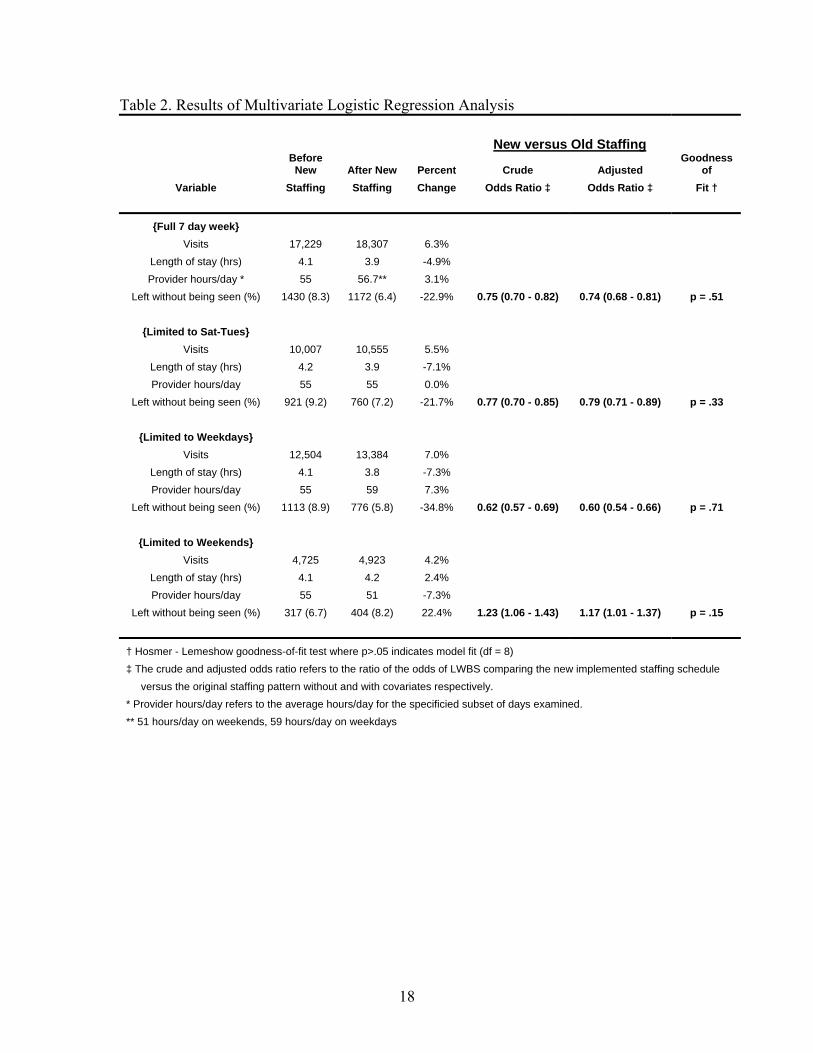
Table 2 contains our results on LWBS. Considering the entire week, there were 258 fewer LWBS events (8.3% to 6.4% of total visits) despite the significant increase in emergency department visits. Isolating the 4 day subset of the week for which there was only rearrangement of provider schedules and no net increase in provider hours, there were 161 fewer LWBS events; the proportion of LWBS declined from 9.2% to 7.2%. This improvement is particularly noteworthy given that the number of visits for this subset increased by 548 patients (5.5%) between the before and after time periods. The weekends, when net provider hours were decreased by 4 hours each day, experienced an increase of 87 LWBS events (6.7% to 8.2% of total visits). Weekday performance, when net provider hours were augmented by 4 hours each day improved significantly, with a net decrease of 337 LWBS events which represents a decrease in the proportion of LWBS from 8.9% to 5.8%.
7
Table 3 contains the multivariate logistic regression results for the 3 covariates used in the models, all of which were significant. A 1 hour increase of the average daily ED LOS was found to increase the odds of LWBS by 41%, while an additional patient arrival/day resulted in a 2.4% increase in odds of LWBS. Arrival by ambulance decreased the odds of LWBS by about 50%. These results were similar in all the subgroups; weekdays, weekends and the 4 day subgroup, Sat-Tues.
DISCUSSION
Analytic models, such as queueing models, can never capture all characteristics of an actual operational setting. However, as has been demonstrated over many years and in an extremely broad variety of settings, models can be invaluable in providing decision support that greatly improves performance, particularly in complex environments. This study supports the usefulness of queueing models in guiding emergency department provider scheduling decisions. This is particularly true in emergency departments where resources are tight relative to demand, since in such situations, even small changes in staffing can have a dramatic impact on delays. Our study also demonstrates the need to collect and examine arrival patterns and to adjust daily staffing levels to assure that schedules are appropriate for what might be significantly different levels and patterns of demand across the week.
This work also highlights the importance of setting delay standards in order to obtain meaningful estimates of how much capacity is needed. An analytic model, in combination with a carefully developed, clinically appropriate delay standard, can provide an objective evaluation of what additional resources are required in order to meet a given standard of quality care. In the emergency department setting, timely treatment is most essential for emergent and urgent patients. So, ideally, the standard used would reflect the time urgency associated with these types of patients and the queueing model would be priority based, reflecting the actual dynamics of the triage system. This was not done in this initial study because the patient information system did not accurately identify the triage status of patients. Future work to identify the best way to schedule additional provider hours that will become available this coming year will use the improved patient information system to produce a more refined analysis to reflect the triage classification.
LIMITATIONS
As mentioned previously, we did not have access to all of the data that is required for a queueing model. In particular, we had no data on the time providers spend with patients and had to estimate this based on the existing literature, observation and judgment. We performed several analyses varying our estimate of this time and found that the resulting staffing levels were quite sensitive to this parameter. This highlights the need for an information system which can accurately capture this data. It’s also important to note that the queueing model assumes that the time a provider spends with a patient is continuous while in most cases, patient care is delivered in discontinuous time intervals. Examples included waiting for test results or breaks in care during patient
8
observation periods. The impact of these interruptions on delays is not clear and there are no queueing models that incorporate this type of feature. Furthermore, without well-defined rules on how these service interruptions occur, they cannot be modeled.
We also did not have the ability to collect data on delays that patients
experienced in being seen by a provider. Therefore, we could not directly validate the estimates produced by the queueing model. A new information system, implemented subsequent to this study, will enable the collection of these data in the future. In addition, due to constraints on the timing of provider shifts and personal preferences, the staffing schedules that were implemented were somewhat different than those that most closely aligned with the model’s suggestions. It is possible that our results would have been different had these constraints not existed.
Finally, we note that while the approach we employed can be generalized to other
hospitals, large EDs which have a more complex structure with regard to types of providers, e.g. attending physicians, residents, nurse practitioners; and locations and/or types of care, e.g. multiple districts and fast track areas; may require a more complex analysis. However, if patients and providers can be divided into independently operating segments, then each can by analyzed independently using the approach described in this paper.
CONCLUSIONS
We believe that the queueing model, by providing a more rigorous and scientific basis for predicting patient delays in being seen by a provider, identified staffing schedules which reduced these delays and hence reduced the fraction of LWBS. Emergency department delays have been widely documented and many hospitals have been engaged in efforts to reduce ED congestion, provide more timely care to patients, and reduce the percentage of LWBS patients. Given the financial constraints that exist in most hospitals, it is increasingly important to find ways to improve performance with existing resources. This study illustrates how data analysis and queueing models can be used to identify staffing changes that can decrease the delays in being seen by a provider and thus, the fraction of patients who leave without being seen, without necessarily increasing capacity. It also highlights the need to establish patient delay standards, preferably by triage class, and to establish information systems to collect and track data on provider service times and patient delays in seeing a provider. ________________________________________________________________________ We thank William T. Friedewald, MD, and Shing M. Lee for their consultation and advice relating to the statistical analysis. CONTACT INFORMATION The M/M/s excel spreadsheet is available upon request. Contact: Robert Green, MD NewYork – Presbyterian Hospital/Columbia University Medical Center Department of Emergency Medicine Email: [email protected]
9
Appendix
A queueing model is a mathematical description of a service system which makes some specific assumptions about the probabilistic nature of the arrival and service processes, the number and type of servers, and the queue discipline and organization. There are countless variations possible, but some queueing models are more widely used than others because of their “robustness” in being able to provide good estimates of performance for a broad variety of applications, and their ease of use with regard to data requirements and fast calculation of various performance measures.
The most commonly used model is the M/M/s queueing model. This model assumes a single queue with unlimited waiting room that feeds into s identical servers. Customers (e.g. patients) arrive according to a time-homogeneous Poisson process with a constant rate and the service duration (e.g. LOS or provider time associated with a patient) has an exponential distribution. (These two assumptions are often called Markovian, hence the use of the two “M’s” in the notation used for the model.) There are many software packages that include the M/M/s model and the formulae for various performance measures such as expected delay and probability of delay can be easily implemented in a spreadsheet.
The Poisson process is considered the most “random” arrival process because of its assumption that the number of arrivals in any given time period, which has a Poisson distribution, is independent of the number in any other non-overlapping time period. Many real arrival and demand processes have been empirically shown to be very well approximated by a Poisson process. (The Poisson process is a good model for an arrival process whenever the ratio of the mean to the variance of the number of arrivals in a given time period is close to one.) Among these are demands for emergency services such as police, fire and ambulance, arrivals to banks and other retail establishments, and arrivals of telephone calls to customer service call centers. Consequently, the Poisson process is the most commonly used arrival process in modeling service systems. In healthcare, the Poisson process has been verified to be a good representation of unscheduled arrivals to various parts of the hospital including ICUs and obstetrics units .[13, 14]
The standard Poisson process assumes a constant arrival rate. Since many actual service systems, such as hospital EDs, experience a time-varying arrival rate, this means that different times of the day may require different models. If the mean service time is long, e.g. more than 10 minutes, there may be a significant lag in the congestion that results from arrivals in any given time period. The Lag SIPP method is a variant of the widely used SIPP approach for determining staffing levels in time-varying service systems which explicitly adjusts for the lag by “shifting” the arrival rate curve by an estimate of this lag. In the case of exponential service times, the mean service time is a very good estimate of the lag. Suppose we denote this mean service time by S. Then Lag SIPP would determine the staffing in any given staffing period (t, t + ∆t) by using an M/M/s model with a mean arrival rate estimated from the arrival rate during [t – S, t + ∆t - S) and the appropriate mean service time in an iterative fashion to get the minimum number of servers needed to achieve the desired performance standard. It’s important to note that this is an approximation technique. Extensive testing has demonstrated that the Lag SIPP approach is more reliable than SIPP in identifying staffing levels that will meet the desired performance standard. However, there is no guarantee that the resulting staffing levels are optimal. That is, in some
10
cases, it may be possible to achieve the desired performance with slightly fewer staffing hours. If greater accuracy is desired, Lag SIPP can be used to identify a good initial staffing plan and then a simulation model could be used to determine whether one or more slight adjustments might be better. Since simulating the system requires significantly more data and time, the additional potential improvement may not be considered worth the effort.
An important characteristic of the exponential distribution used in the M/M/s is that the standard distribution equals the mean and so the coefficient of variation (CV) of the service time equals one. If the actual CV of service is a bit less than or greater than one, the M/M/s will still give good estimates of delay. However, if the CV is substantially different than one, the M/M/s may significantly underestimate or overestimate actual delays. In this case, if the arrival process is Poisson, and there is only one server, the mean delay can still be calculated for any service distribution through use of the Pollaczek-Khintchine formulae for what is known as the M/G/1 system which requires the standard deviation of the service time as well as the mean. Though there are no exact formulae for non-Markovian multi-server queues, there are some good, simple approximations.[8]
1. Derlet, R., J. Richards, and R. Kravitz, Frequent overcrowding in US emergency
departments. Academic Emergency Medicine, 2001. 8: p. 151-155. 2. Derlet, R. and J. Richards, Overcrowding in the nation's emergency departments:
complex causes and disturbing effects. Annals of Emergency Medicine, 2000. 35: p. 63-68.
3. Kennedy, J., et al., Access to emergency care: restricted by long waiting times and cost and coverage concerns. Annals of Emergency Medicine, 2004. 43: p. 567-573.
4. McCaig, L.F. and C.W. Burt, National Hospital Ambulatory Medical Care Survey: 2002 Emergency Department Summary. Advance data from vital and health statistics - CDC: National Center for Health Statistics, Hyattsville, Maryland, 2004. 340: p. 1-36.
5. Green, L.V. and V. Nguyen, Strategies for cutting hospital beds: the impact on patient service. Health Ser Res, 2001. 36: p. 421-442.
6. Green, L.V., P.J. Kolesar, and A. Svoronos, Some effects of nonstationarity on multiserver Markovian queueing systems. Opns Res, 1991. 39: p. 502-511.
7. Green, L.V., P.J. Kolesar, and A. Svoronos, Improving the SIPP approach for staffing service systems that have cyclic demands. Opns Res, 2001. 49: p. 549-564.
8. Hall, R.W., Queueing Methods for Service and Manufacturing. 1990, New Jersey: Prentice Hall.
9. Green, R.A., P.C. Wyer, and J. Giglio, ED walkout rate correlated with ED length of stay but not with ED volume or hospital census (abstract). Academic Emergency Medicine, 2002. 9(5): p. 514.
10. Fernandes, C.M., A. Price, and J.M. Christenson, Does reduced length of stay decrease the number of emergency department patients who leave without seeing a physician? Journal of Emergency Medicine, 1997. 15(3): p. 397-399.
11. Baker, D.W., C.D. Stevens, and R.H. Brook, Patients who leave a public hospital emergency department without being seen by a physician. Causes and consequences. JAMA, 1991. 266(8): p. 1085-90.

11
12. Graff, L.G., et al., Emergency physician workload: a time study. Annals of Emergency Medicine, 1993. 22(7): p. 1156-63.
13. Kim, S., Horowitz, I., Yound, K.K., Buckley, T.A., Analysis of capacity management of the intensive care unit in a hospital. European J. of Operational Research, 1999. 115: p. 36-46.
14. Young, J.P., Stabilization of inpatient bed occupancy through control of admissions. Journal of the American Hospital Association, 1965. 39: p. 41-48.

12
13
0.0
1.0
2.0
3.0
4.0
5.0
1 2 3 4 5 6 7 8 9 10 11 12 13 14 15 16 17 18 19 20 21 22 23 24
Hour of day
Patie
nt a
rriv
als
per h
our
Weekdays Weekends Figure 1. Mean patient arrivals by hour of day (2002) – weekdays compared with weekends
14
0
0.5
1
1.5
2
2.5
3
3.5
4
4.5
5
12:00
AM
1:00 A
M
2:00 A
M
3:00 A
M
4:00 A
M
5:00 A
M
6:00 A
M
7:00 A
M
8:00 A
M
9:00 A
M
10:00
AM
11:00
AM
12:00
PM
1:00 P
M
2:00 P
M
3:00 P
M
4:00 P
M
5:00 P
M
6:00 P
M
7:00 P
M
8:00 P
M
9:00 P
M
10:00
PM
11:00
PM
Time
Arr
ival
rate
0
1
2
3
4
5
Staf
fing
leve
l
Arrival rate Staffing level Figure 2. Queueing model output of proposed staffing and patient arrival rate (Weekdays)
15
0
0.5
1
1.5
2
2.5
3
3.5
4
4.5
5
12:00
AM
1:00 A
M
2:00 A
M
3:00 A
M
4:00 A
M
5:00 A
M
6:00 A
M
7:00 A
M
8:00 A
M
9:00 A
M
10:00
AM
11:00
AM
12:00
PM
1:00 P
M
2:00 P
M
3:00 P
M
4:00 P
M
5:00 P
M
6:00 P
M
7:00 P
M
8:00 P
M
9:00 P
M
10:00
PM
11:00
PM
Time
Arr
ival
rate
0
1
2
3
4
5
Staf
fing
leve
l
Arrival rate Staffing level Figure 3. Queueing model output of proposed staffing and patient arrival rate (Weekends)

16
0
1
2
3
4
5
0:00
1:00
2:00
3:00
4:00
5:00
6:00
7:00
8:00
9:00
10:00
11:00
12:00
13:00
14:00
15:00
16:00
17:00
18:00
19:00
20:00
21:00
22:00
23:00
Hour of day
Num
ber o
f pro
vide
rs
Old Staffing New Staffing Figure 4. Before and after provider staffing (weekdays)
17
Table 1. Demographic, arrival mode, disposition and length of stay characteristics before and after staffing change Before New After New Staffing Staffing Characteristic Implementation Implementation (n=17,229) (n=18,307) Age (Mean) 43.6 ± 23.5 43.7 ± 23.9 Total ED Length of Stay (Hrs.) 4.1 ± 3.6 3.9 ± 3.3 Arrival by Ambulance (%) 25.2 25.4 Admissions (%) 22.6 21.7 Male (%) 38.7 39.6
18
Table 2. Results of Multivariate Logistic Regression Analysis New versus Old Staffing
Before New After New Percent Crude Adjusted
Goodness of
Variable Staffing Staffing Change Odds Ratio ‡ Odds Ratio ‡ Fit †
{Full 7 day week} Visits 17,229 18,307 6.3%
Length of stay (hrs) 4.1 3.9 -4.9% Provider hours/day * 55 56.7** 3.1%
Left without being seen (%) 1430 (8.3) 1172 (6.4) -22.9% 0.75 (0.70 - 0.82) 0.74 (0.68 - 0.81) p = .51
{Limited to Sat-Tues} Visits 10,007 10,555 5.5%
Length of stay (hrs) 4.2 3.9 -7.1% Provider hours/day 55 55 0.0%
Left without being seen (%) 921 (9.2) 760 (7.2) -21.7% 0.77 (0.70 - 0.85) 0.79 (0.71 - 0.89) p = .33
{Limited to Weekdays} Visits 12,504 13,384 7.0%
Length of stay (hrs) 4.1 3.8 -7.3% Provider hours/day 55 59 7.3%
Left without being seen (%) 1113 (8.9) 776 (5.8) -34.8% 0.62 (0.57 - 0.69) 0.60 (0.54 - 0.66) p = .71
{Limited to Weekends} Visits 4,725 4,923 4.2%
Length of stay (hrs) 4.1 4.2 2.4% Provider hours/day 55 51 -7.3%
Left without being seen (%) 317 (6.7) 404 (8.2) 22.4% 1.23 (1.06 - 1.43) 1.17 (1.01 - 1.37) p = .15
† Hosmer - Lemeshow goodness-of-fit test where p>.05 indicates model fit (df = 8) ‡ The crude and adjusted odds ratio refers to the ratio of the odds of LWBS comparing the new implemented staffing schedule versus the original staffing pattern without and with covariates respectively. * Provider hours/day refers to the average hours/day for the specificied subset of days examined. ** 51 hours/day on weekends, 59 hours/day on weekdays

19
Table 3. Results of Multivariate Logistic Regression Analysis - Covariates
Full 7 day Week Sat-Tuesday Weekdays Weekends
Parameter Parameter Estimate
Odds Ratio (95% Wald CI)
Parameter Estimate
Odds Ratio (95% Wald CI)
Parameter Estimate
Odds Ratio (95% Wald CI)
Parameter Estimate
Odds Ratio (95% Wald CI)
Arrivals 0.0241 1.024 (1.02-1.03) 0.0235
1.024 (1.018-1.029) 0.028
1.028 (1.023 - 1.034) 0.024
1.025 (1.015 - 1.034)
Length of Stay 0.345 1.41 (1.35 - 1.48) 0.33
1.39 (1.31 - 1.47) 0.31
1.36 (1.29 - 1.44) 0.36
1.43 (1.31 - 1.55)
Arrived by Ambulance -0.708
0.49 (0.44 - 0.55) -0.591
0.55 (0.48 - 0.63) -0.753
0.47 (0.41 - 0.54) -0.58
0.56 (0.56 - 0.69)
For the non-categorical variables, arrivals and length of stay, the parameter estimates illustrated indicate the increase in the log odds ratio of LWBS for each unit increase in the parameter. Length of stay is measured in hours (average daily LOS) and arrivals refer to average daily patient arrivals. Arrival by ambulance is a binary categorical variable.
20
0
1
2
3
4
0:00
1:00
2:00
3:00
4:00
5:00
6:00
7:00
8:00
9:00
10:00
11:00
12:00
13:00
14:00
15:00
16:00
17:00
18:00
19:00
20:00
21:00
22:00
23:00
Hour of day
Num
ber o
f pro
vide
rs
Old Staffing New Staffing Figure 5. Before and after provider staffing (weekends)

21
Related Documents


![08 Queueing Models.ppt [Kompatibilitätsmodus] ... KeyelementsofqueueingsystemsKey elements of queueing systems ... • Customer is pendingwhen the customer is outside the queueing](https://static.cupdf.com/doc/110x72/5b236bc17f8b9a92298b6c18/08-queueing-kompatibilitaetsmodus-keyelementsofqueueingsystemskey-elements.jpg)