Using Quarterly Report Data OR I’ve Been Collecting Systems Data All Along and Didn’t Know It!

Using Quarterly Report Data OR I’ve Been Collecting Systems Data All Along and Didn’t Know It!
Dec 17, 2015
Welcome message from author
This document is posted to help you gain knowledge. Please leave a comment to let me know what you think about it! Share it to your friends and learn new things together.
Transcript
Using Quarterly Report DataOR
I’ve Been Collecting Systems Data All Along and Didn’t Know It!

Inputs into Councils

Council Functions
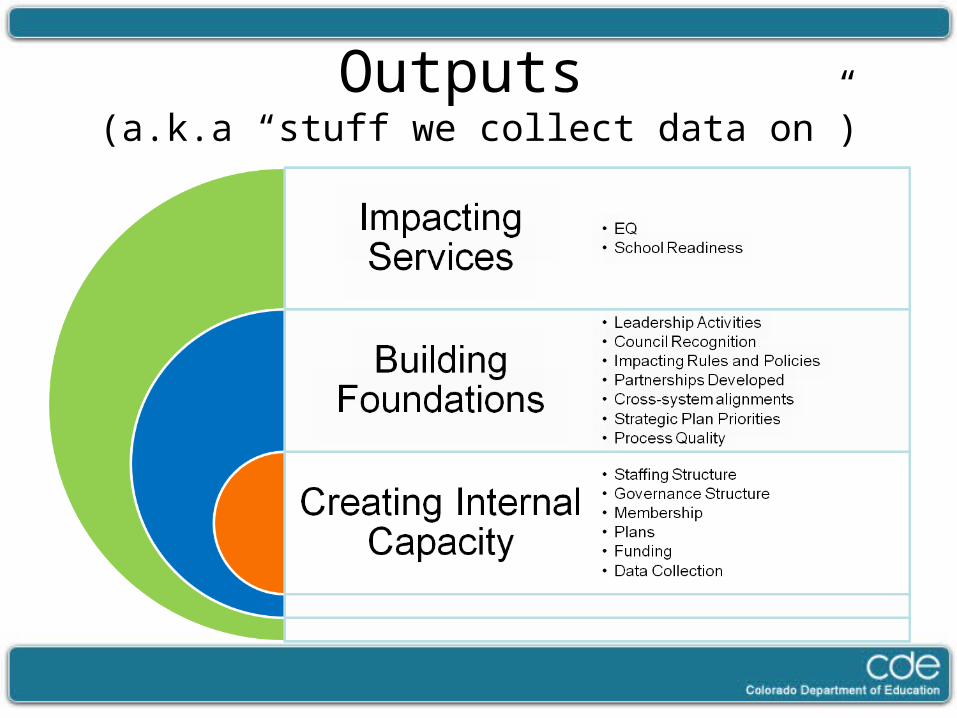
Outputs (a.k.a “stuff we collect data on”)

I Don’t Think of THAT as Data!
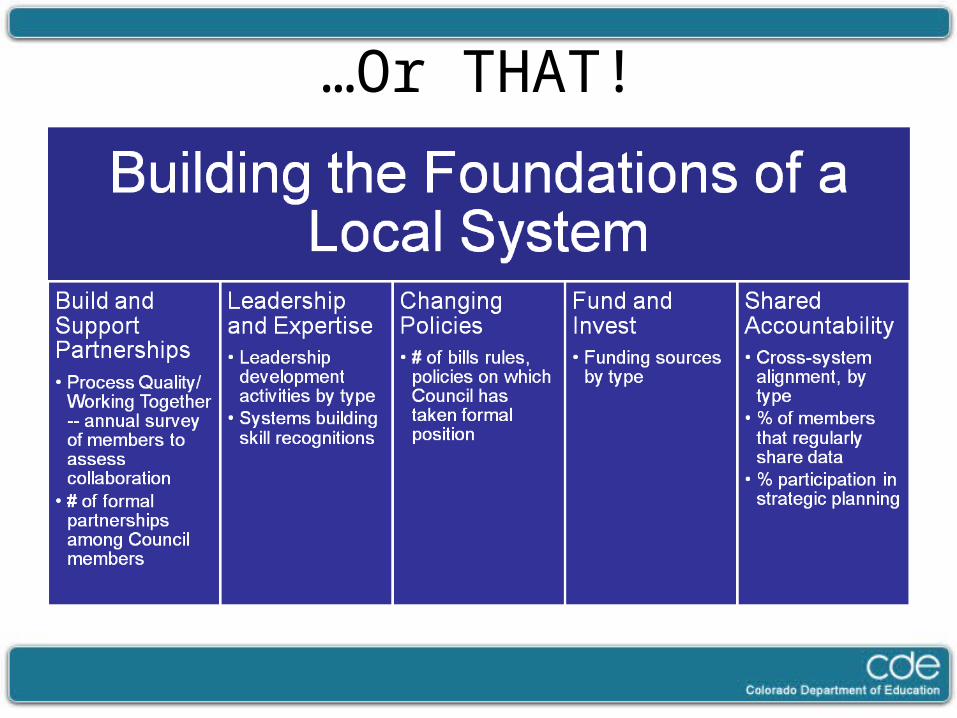
…Or THAT!
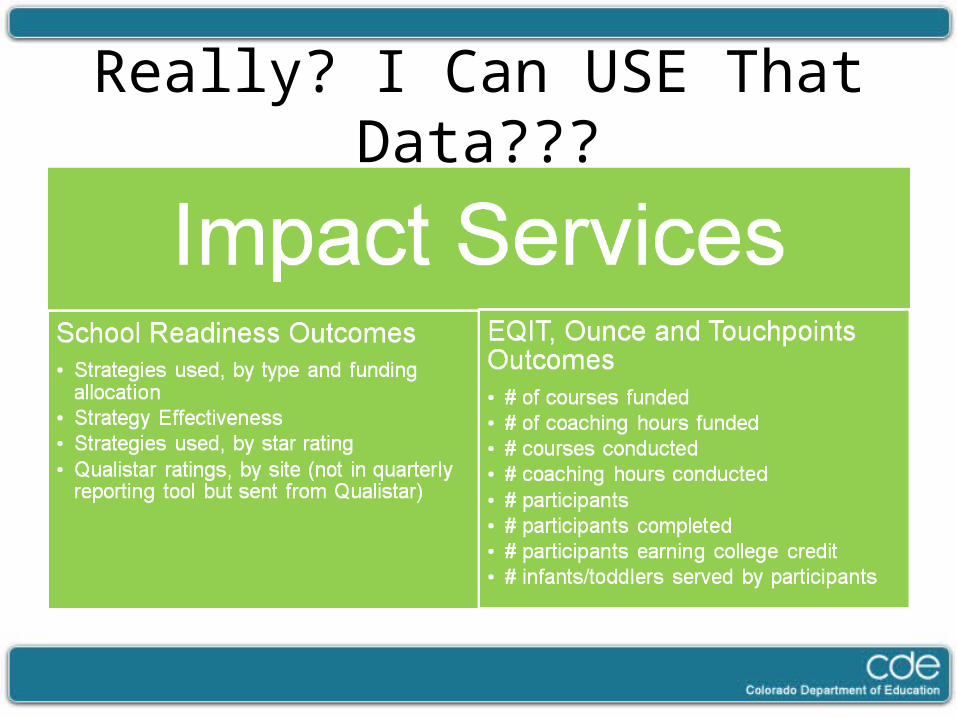
Really? I Can USE That Data???
Talk Amongst Yourselves
• Select one data item from each Council Function that your table thinks is most important.– Identify why it’s important– Talk about what you currently do locally to
collect this data for the report
-10 Minutes-
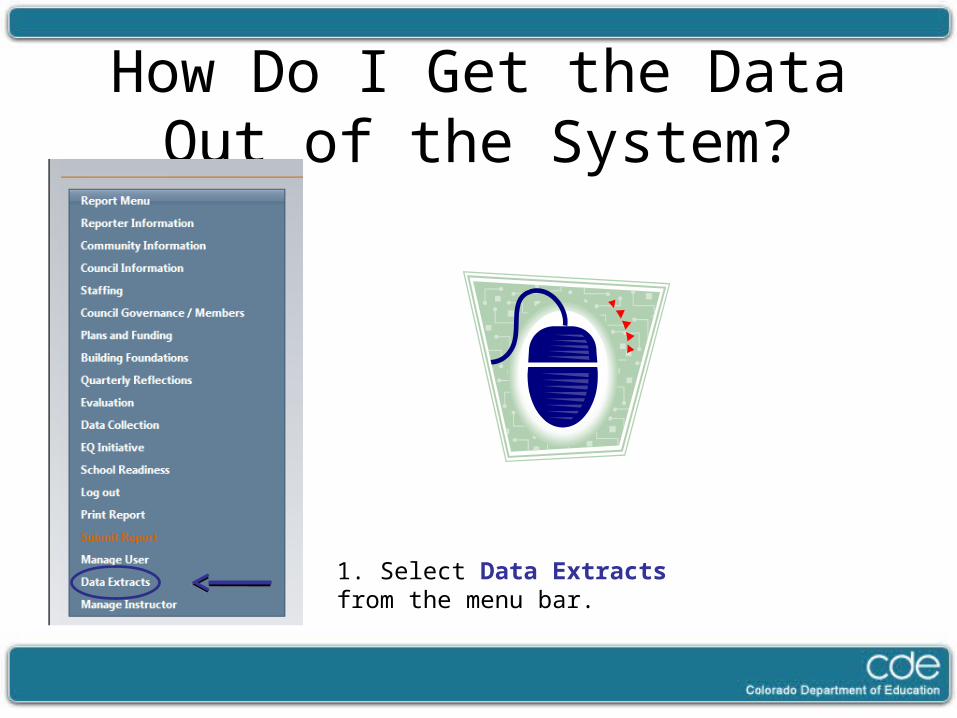
How Do I Get the Data Out of the System?
1. Select Data Extracts from the menu bar.
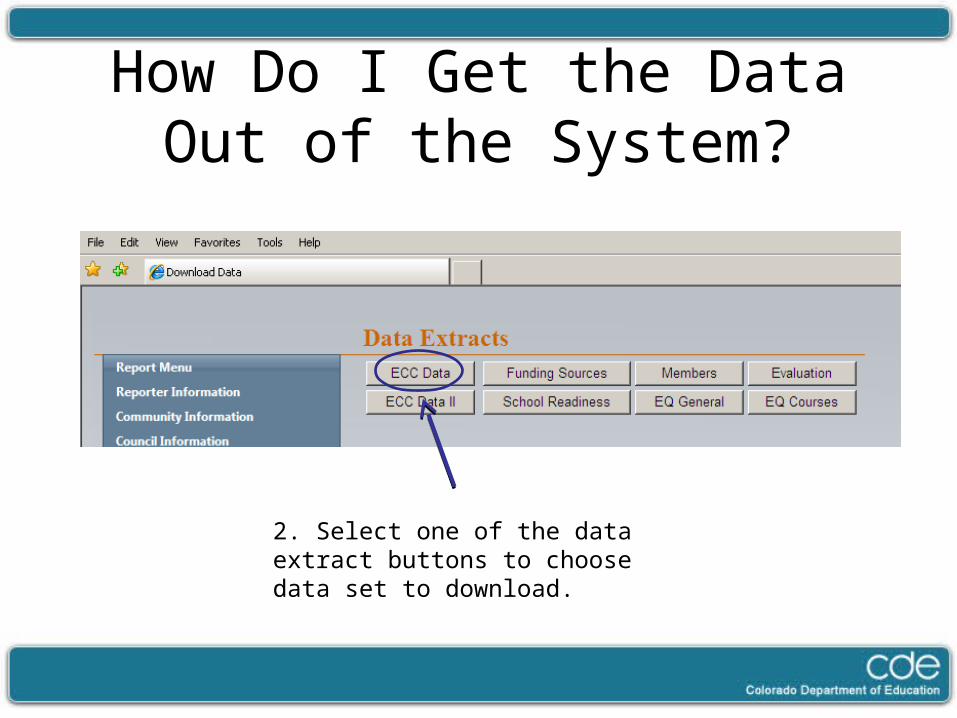
How Do I Get the Data Out of the System?
2. Select one of the data extract buttons to choose data set to download.
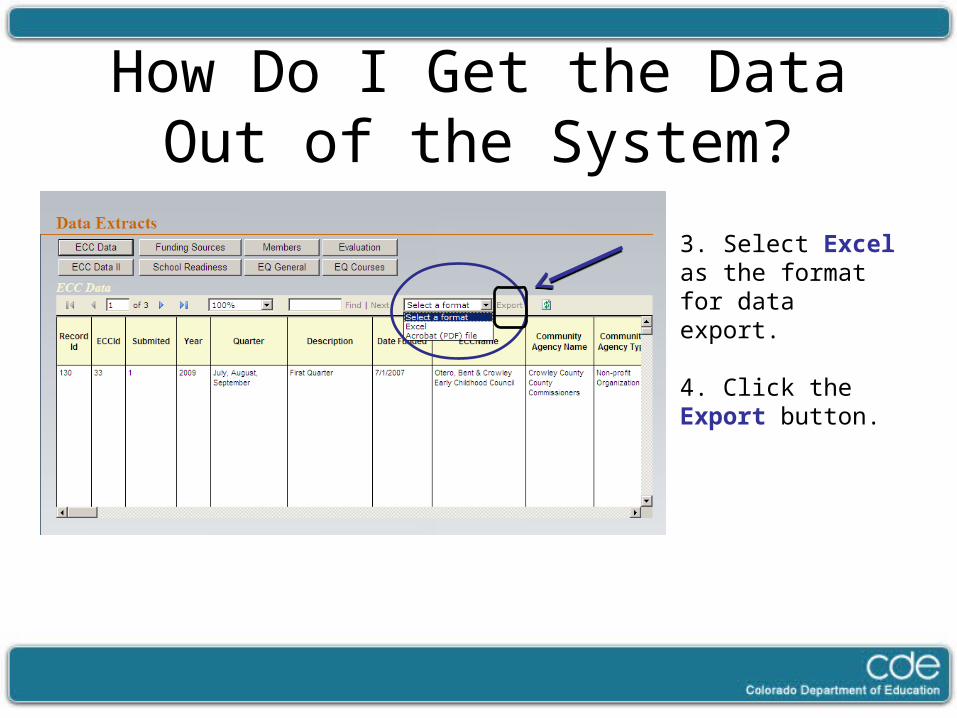
How Do I Get the Data Out of the System?
3. Select Excel as the format for data export.
4. Click the Export button.
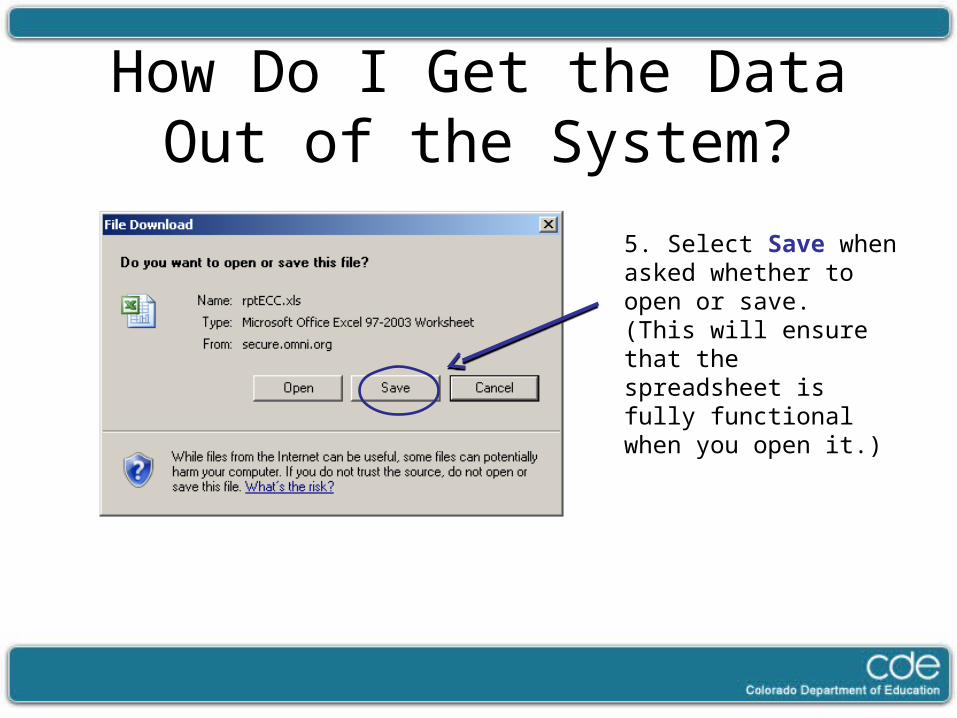
How Do I Get the Data Out of the System?
5. Select Save when asked whether to open or save. (This will ensure that the spreadsheet is fully functional when you open it.)

Talk Amongst Yourselves
• Work in pairs or threes to try to download your data from the Quarterly Reporting Tool.– Give each person a chance to try to download
their own data.
-10 Minutes-
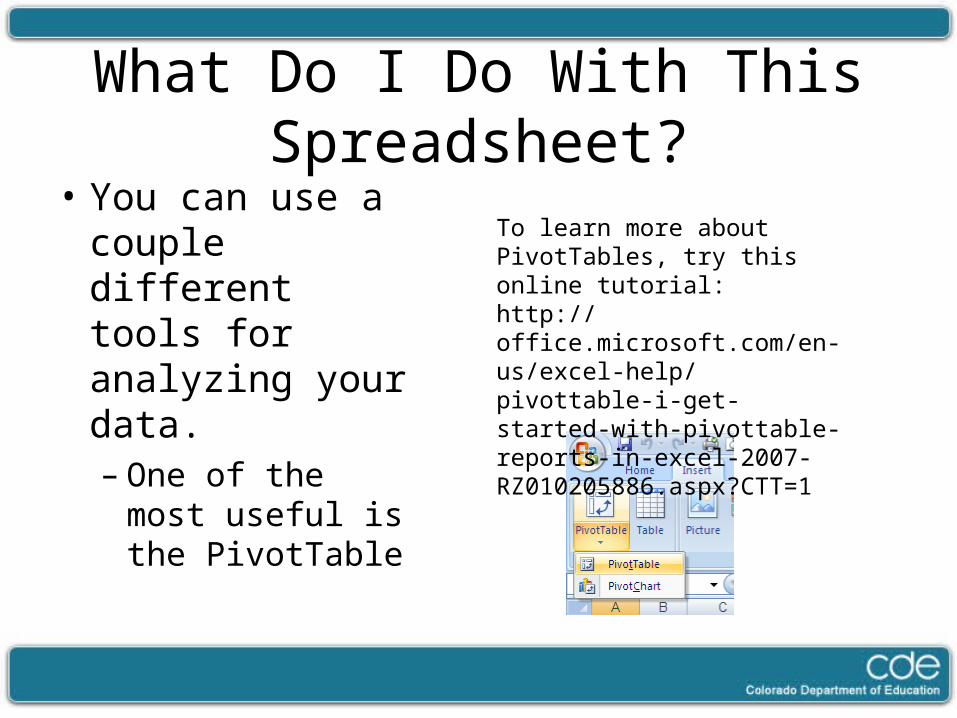
What Do I Do With This Spreadsheet?
• You can use a couple different tools for analyzing your data.– One of the most
useful is the PivotTable
To learn more about PivotTables, try this online tutorial:http://office.microsoft.com/en-us/excel-help/pivottable-i-get-started-with-pivottable-reports-in-excel-2007-RZ010205886.aspx?CTT=1

What Do I Do With This Spreadsheet?
• You can also do all sorts of things with the built-in formula functions.
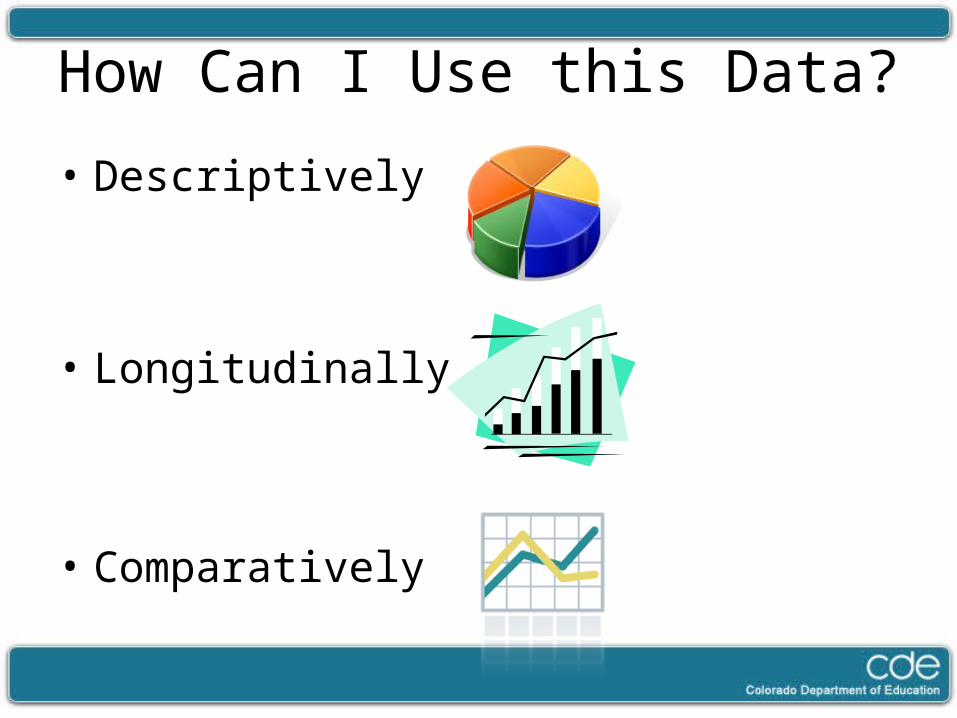
How Can I Use this Data?
• Descriptively
• Longitudinally
• Comparatively
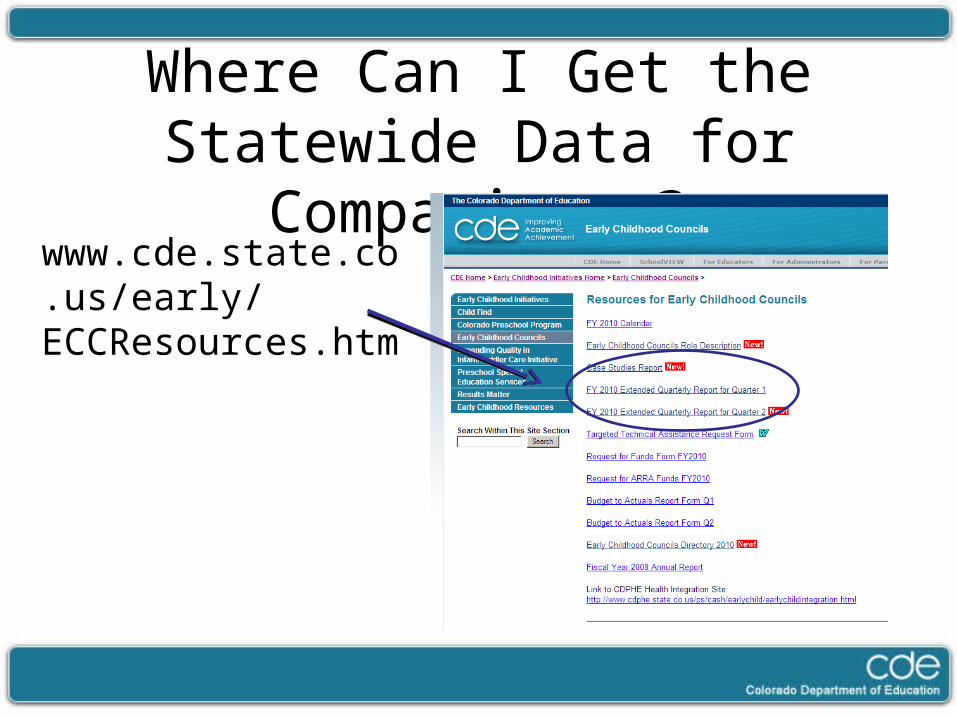
Where Can I Get the Statewide Data for Comparisons?
www.cde.state.co.us/early/ECCResources.htm
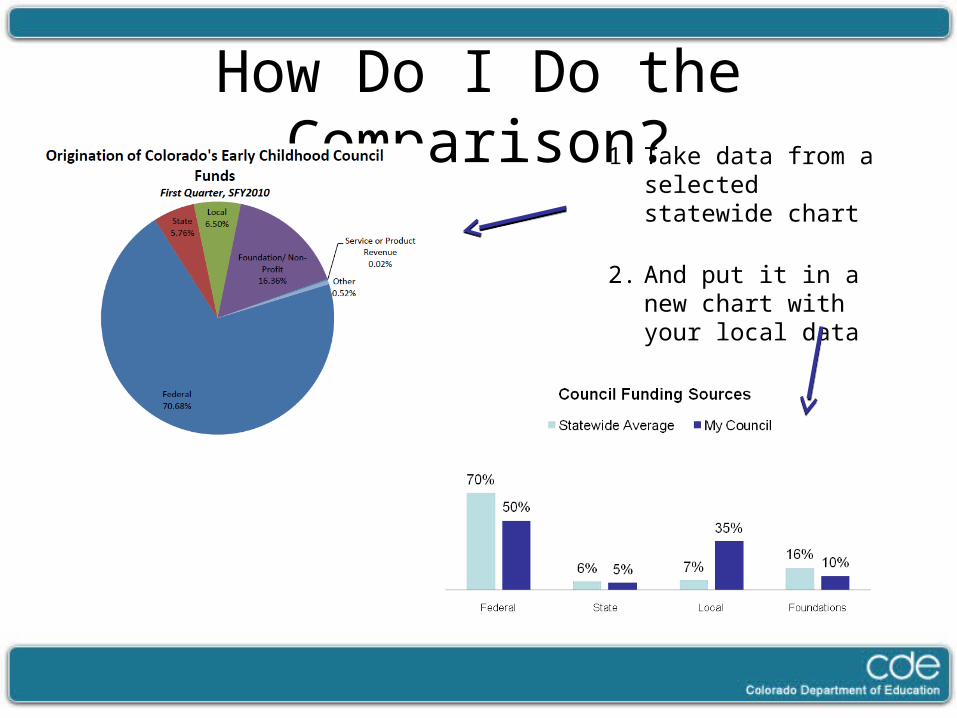
How Do I Do the Comparison?1. Take data from a
selected statewide chart
2. And put it in a new chart with your local data

Talk Amongst Yourselves
• Use your list of 3 data items from earlier and discuss how you might use this data with your Council and/or stakeholders.
• Select the best kind of analysis for presenting this data (descriptive, longitudinal, comparative)
-10 Minutes-
Related Documents