Using New Key Performance Indicators to Transition from Volume to Value ISMA 2015 Practice Management Conference Indianapolis, Indiana May 8, 2015

Welcome message from author
This document is posted to help you gain knowledge. Please leave a comment to let me know what you think about it! Share it to your friends and learn new things together.
Transcript
Using New Key Performance Indicators
to Transition from Volume to Value
ISMA 2015 Practice Management Conference
Indianapolis, Indiana
May 8, 2015

THE CAMDEN GROUP | 5/08/2015 1
With the shift from volume to value-
based reimbursement, practices need
to retain diligence on traditional key
performance indicators (“KPIs”) while
adopting next generation KPI’s to
manage in this emerging payment
environment.
Track next-generation KPIs
Communicate KPIs to physicians
Incorporate KPIs into dashboard reports
Apply the data
Leverage KPIs in payer contracting
Today’s Objectives
THE CAMDEN GROUP | 5/08/2015 2
Healthcare
Syste
ms
Payment Reform
Health Reform
Accountable Care Organization
Bundled PaymentMedical Home
Service Line Management
Primary Care
Ne
two
rks
Mergers
CompetitionFra
ud &
Abuse
Telemedicine
Transparency
People
Ambulatory Centers
Physician Employment
Bon
d R
ati
ng
Joint Ventures
Clinical Integration
QualityPatie
nt S
afe
ty
Supply Chain
Revenue Cycle
PATIENT
SATISFACTION
Medical
Education
Leadership
GOVERNANCE
Evidence Based Medicine
Readmissions
Group
Practice
EM
R
CPOE
PHO
MSO
Gainsharing
Managed
Care
P4P
Volume
Market Share
Physician Extenders
Regional Health Information Organizations
Industry Consolidation Networks
Private Equity
Centers of Excellence
Comparative Effectiveness Research
Health Navigators
IT
AC
OH
ealth
Insura
nce
Exchan
ges
Care Redesign
CAPITAL
Population Health Management
Medicare
Capitation
Medicaid
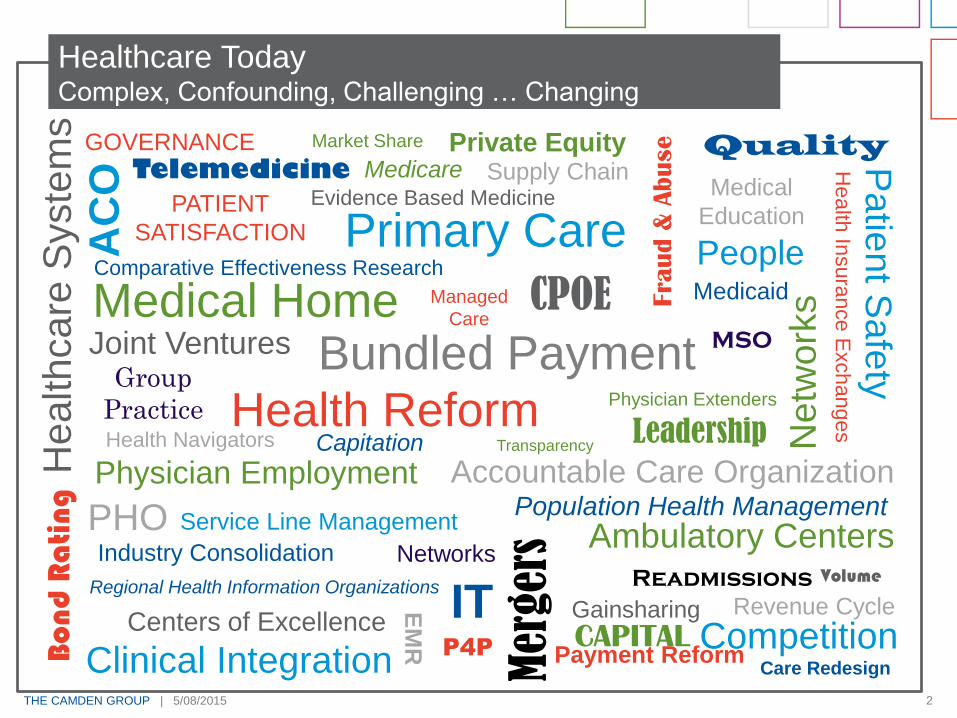
Healthcare TodayComplex, Confounding, Challenging … Changing
THE CAMDEN GROUP | 5/08/2015 3
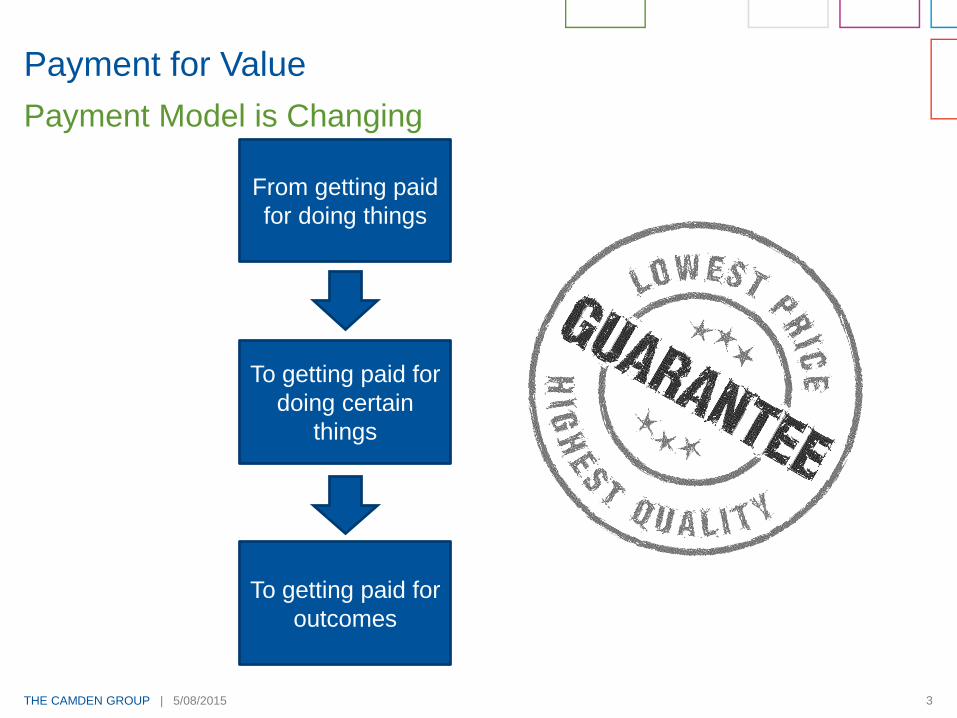
Payment for Value
Payment Model is Changing
From getting paid
for doing things
To getting paid for
doing certain
things
To getting paid for
outcomes

THE CAMDEN GROUP | 5/08/2015 4
Making the Leap
Lack of Quality
Indicators
Volume Driven
Fragmented Care
Fee-For-ServiceValue-Based Quality/Outcome
Driven
Performance
Payments for
Chronic Care
Management
Continuity of
Care

THE CAMDEN GROUP | 5/08/2015 5
Where Do You Want to Be?
Create Patient-Centered Care
Model
Coordinate care within
practice population
Establish value around
chronic disease outcomes
Use outcomes to create value
with payers
Do Nothing
Maintain fee-for-service
(“FFS”) model
Negotiate contracts under
current strategy
Tolerate fee schedule
reductions
Develop Organization
Coordinated Care Model
Focus on cost reduction
Invest in health information
technology
Connect providers to acute
care setting
Clinically Integrate Care
Track quality across
continuum
Establish a patient
longitudinal record
Prepare for value-based
contracting
Med
ical
Gro
up
Level
of
Co
llab
ora
tio
n
Organization’s Level of Collaboration
THE CAMDEN GROUP | 5/08/2015 6
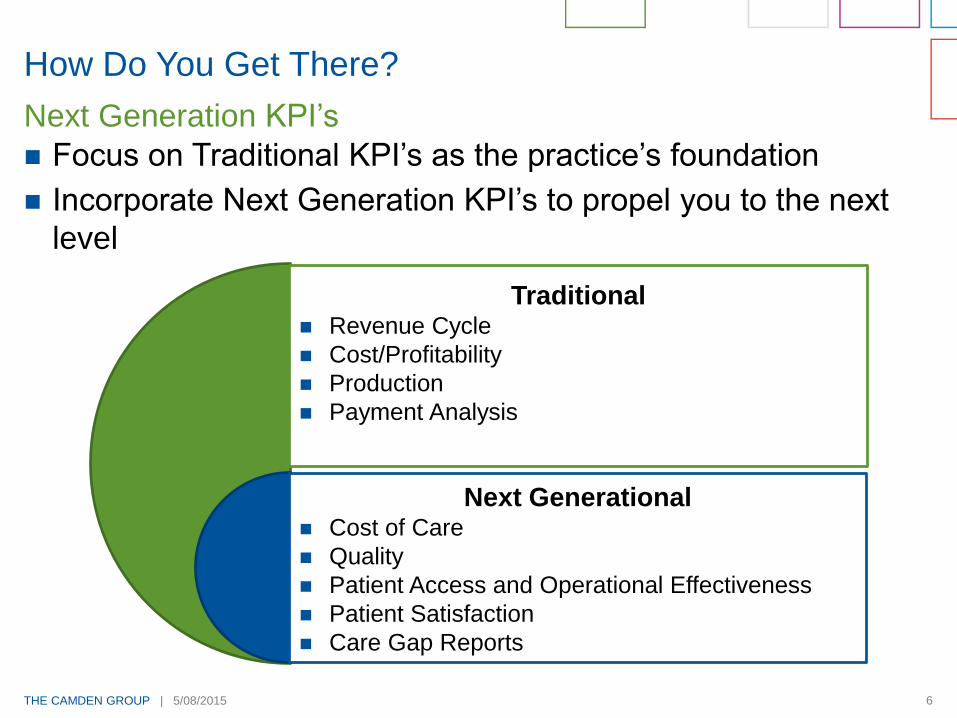
How Do You Get There?
Focus on Traditional KPI’s as the practice’s foundation
Incorporate Next Generation KPI’s to propel you to the next
level
Next Generation KPI’s
Traditional Revenue Cycle
Cost/Profitability
Production
Payment Analysis
Next Generational Cost of Care
Quality
Patient Access and Operational Effectiveness
Patient Satisfaction
Care Gap Reports
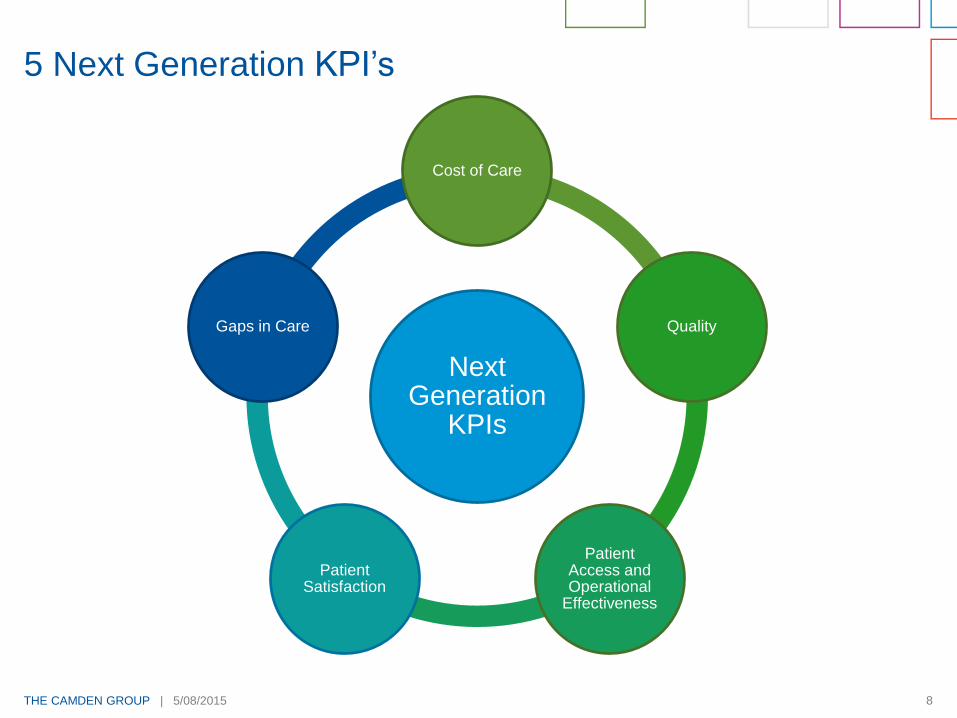
5 Next Generation KPI’s
THE CAMDEN GROUP | 5/08/2015 8
Next Generation
KPIs
Cost of Care
Quality
Patient Access and Operational
Effectiveness
Patient Satisfaction
Gaps in Care
5 Next Generation KPI’s
THE CAMDEN GROUP | 5/08/2015 9
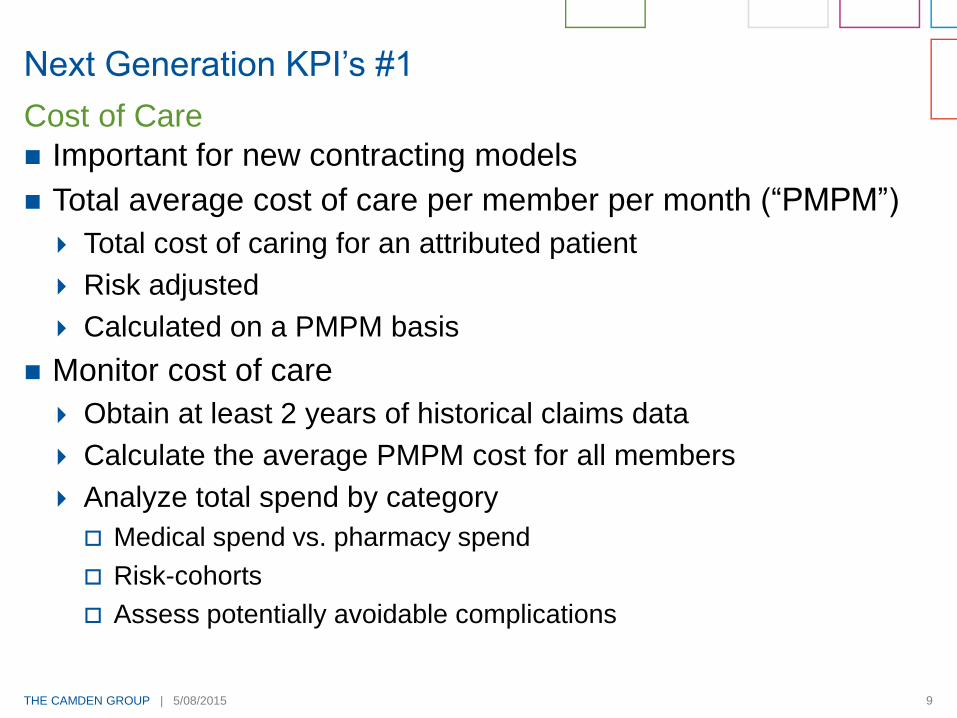
Next Generation KPI’s #1
Important for new contracting models
Total average cost of care per member per month (“PMPM”)
Total cost of caring for an attributed patient
Risk adjusted
Calculated on a PMPM basis
Monitor cost of care
Obtain at least 2 years of historical claims data
Calculate the average PMPM cost for all members
Analyze total spend by category
Medical spend vs. pharmacy spend
Risk-cohorts
Assess potentially avoidable complications
Cost of Care
THE CAMDEN GROUP | 5/08/2015 10
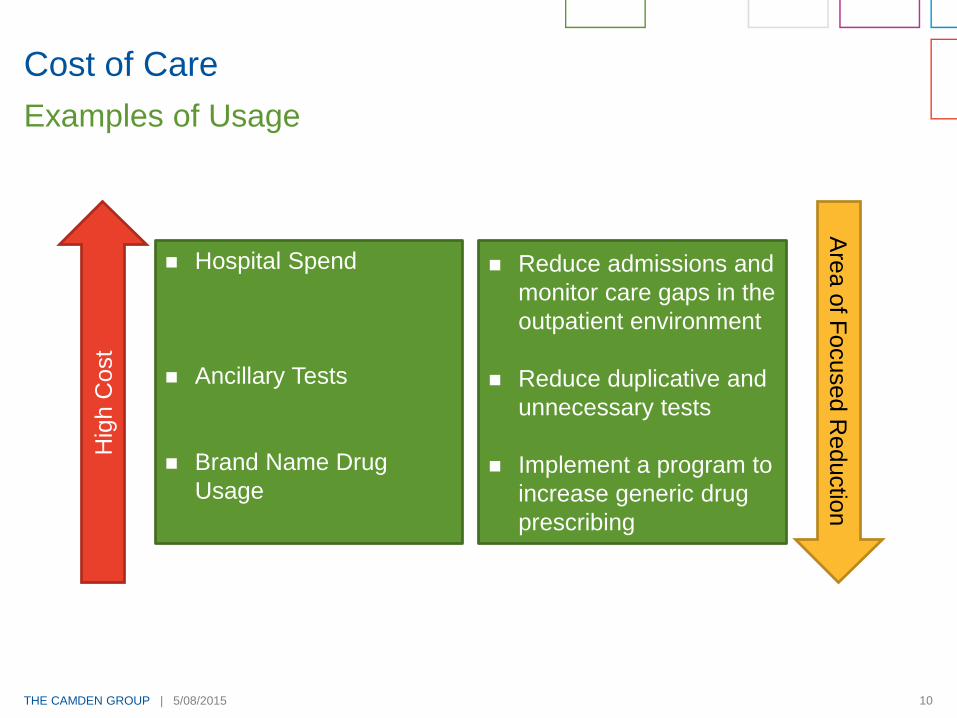
Cost of Care
Examples of UsageH
igh C
ost
Hospital Spend
Ancillary Tests
Brand Name Drug
Usage
Reduce admissions and
monitor care gaps in the
outpatient environment
Reduce duplicative and
unnecessary tests
Implement a program to
increase generic drug
prescribing
Are
a o
f Focused R
eductio
n

THE CAMDEN GROUP | 5/08/2015 11
Next Generation KPI’s #2
Key component of most new payment models
What measures should be tracked?
What measures must be tracked?
What measures are payers rewarding in your market?
What are the top 5 conditions your providers treat?
Quality
THE CAMDEN GROUP | 5/08/2015 12
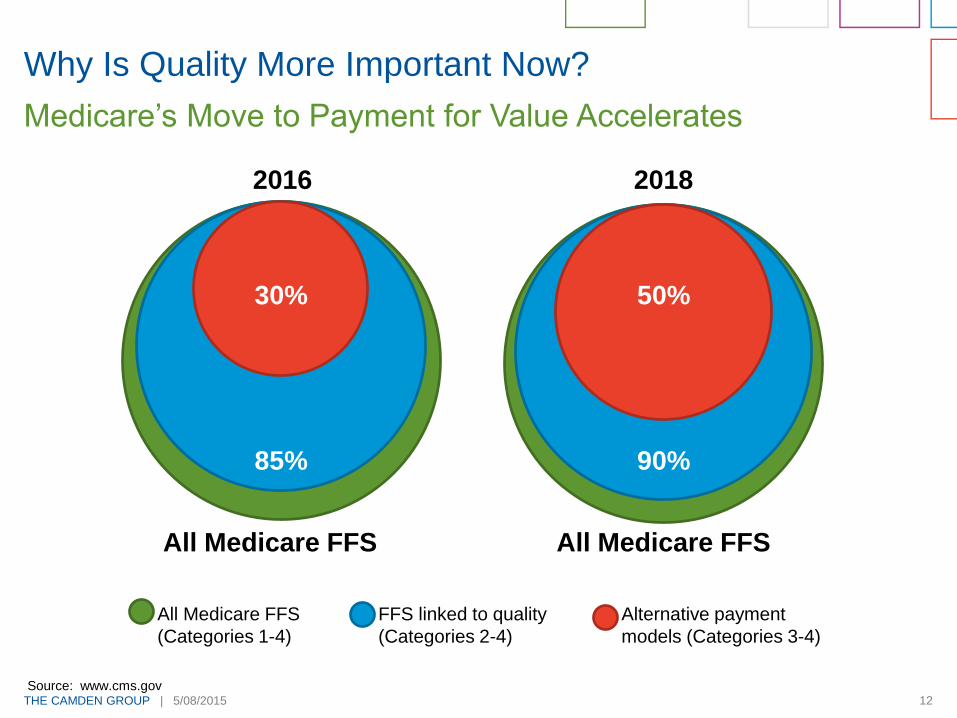
Why Is Quality More Important Now?
Medicare’s Move to Payment for Value Accelerates
30%
85%
2016
All Medicare FFS
50%
90%
2018
All Medicare FFS
All Medicare FFS
(Categories 1-4)
FFS linked to quality
(Categories 2-4)
Alternative payment
models (Categories 3-4)
Source: www.cms.gov
THE CAMDEN GROUP | 5/08/2015 13
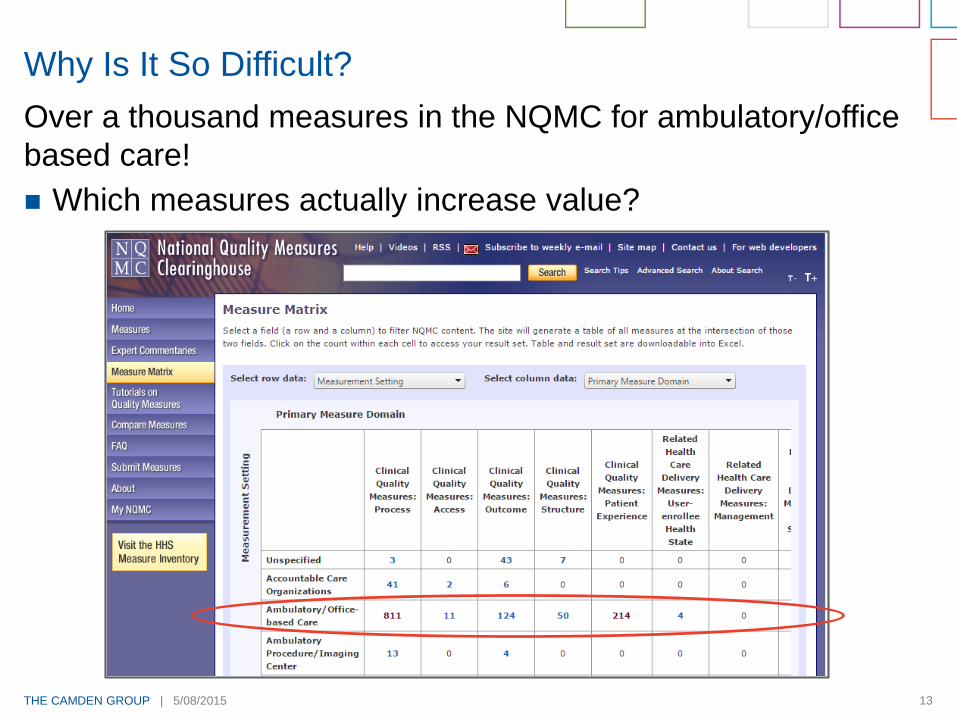
Over a thousand measures in the NQMC for ambulatory/office
based care!
Which measures actually increase value?
Why Is It So Difficult?

THE CAMDEN GROUP | 5/08/2015 14
SGR Fix Is Near, But Establishes New Payment Path
Movement to pay-for-value starting in 2019
Streamlines current quality programs under the Merit-Based
Incentive System beginning in 2019
Quality
Resource use
Clinical practice improvement activities
Meaningful use of certified EHR technology
Implements new incentive protocol based on a “composite
performance score” based on the above 4 categories.
Need to attest to Stage 2 Meaningful Use (“MU”) in 2015 to
avoid penalty in 2017
Proposed Stage 3 MU rule
Must be at Stage 3 by 2018 or face 4 percent penalty
Senate Action Required
THE CAMDEN GROUP | 5/08/2015 15
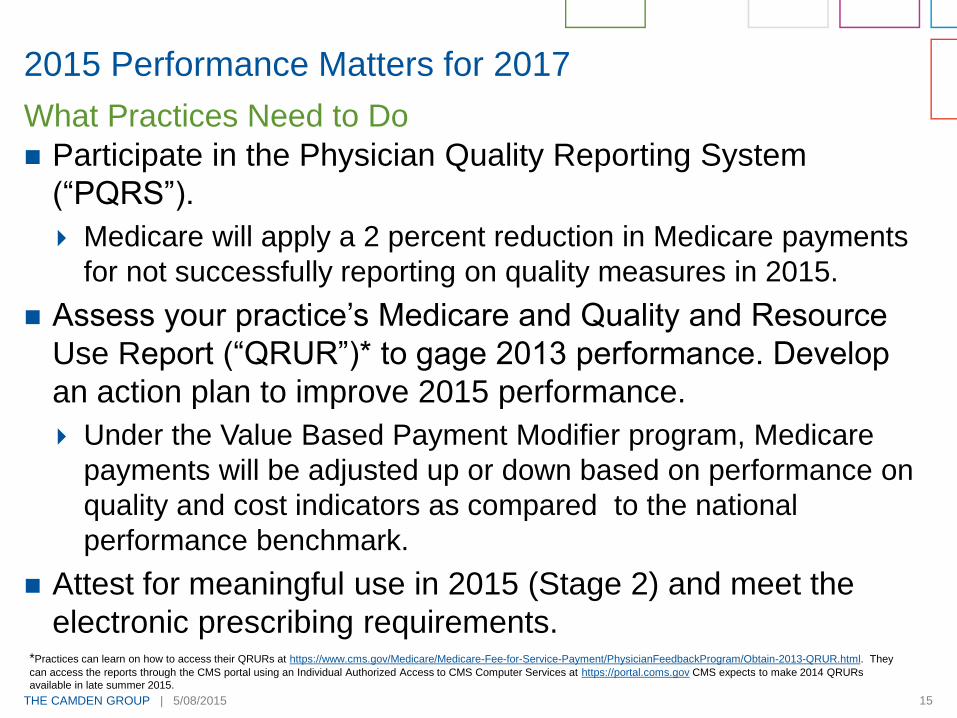
2015 Performance Matters for 2017
Participate in the Physician Quality Reporting System
(“PQRS”).
Medicare will apply a 2 percent reduction in Medicare payments
for not successfully reporting on quality measures in 2015.
Assess your practice’s Medicare and Quality and Resource
Use Report (“QRUR”)* to gage 2013 performance. Develop
an action plan to improve 2015 performance.
Under the Value Based Payment Modifier program, Medicare
payments will be adjusted up or down based on performance on
quality and cost indicators as compared to the national
performance benchmark.
Attest for meaningful use in 2015 (Stage 2) and meet the
electronic prescribing requirements.
What Practices Need to Do
*Practices can learn on how to access their QRURs at https://www.cms.gov/Medicare/Medicare-Fee-for-Service-Payment/PhysicianFeedbackProgram/Obtain-2013-QRUR.html. They
can access the reports through the CMS portal using an Individual Authorized Access to CMS Computer Services at https://portal.coms.gov CMS expects to make 2014 QRURs
available in late summer 2015.
THE CAMDEN GROUP | 5/08/2015 16
Groups often have multiple programs in place
Understand the measures that are involved in each program
At what stage is your group in terms of changing the care
model, implementing health information technology systems,
etc.?
Have you been successful in previous incentive models?
Do you need penalties such as a withhold to gain attention to
measures?
Of the measures that the group is currently accountable for,
determine which make the most sense.
Do not bite off more than you can chew
– change is difficult.
Ease In
THE CAMDEN GROUP | 5/08/2015 17
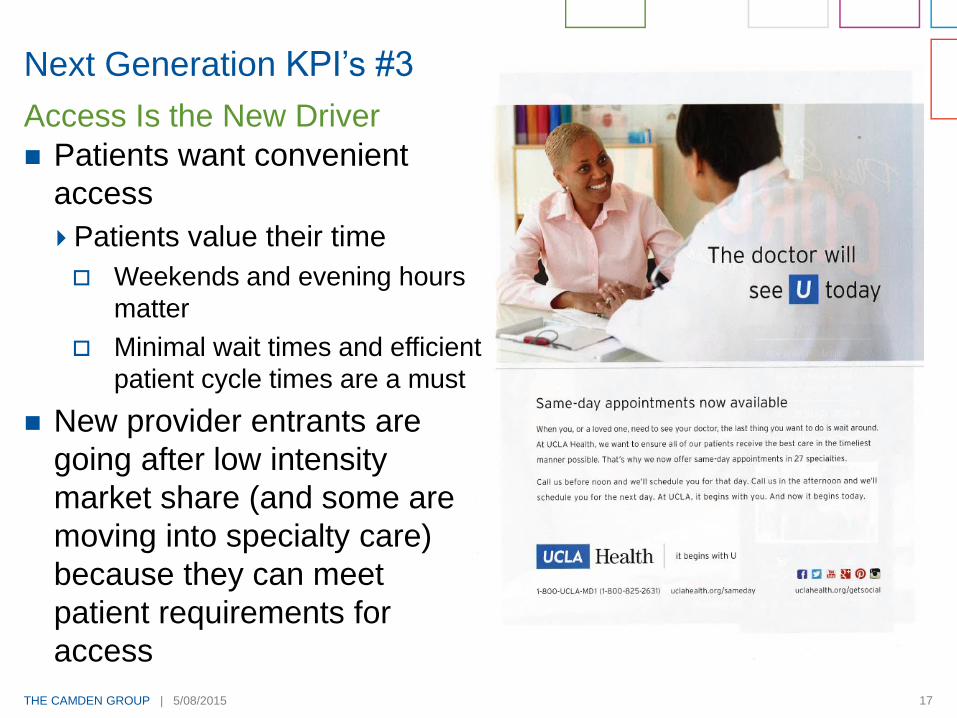
Next Generation KPI’s #3
Patients want convenient
access
Patients value their time
Weekends and evening hours
matter
Minimal wait times and efficient
patient cycle times are a must
New provider entrants are
going after low intensity
market share (and some are
moving into specialty care)
because they can meet
patient requirements for
access
Access Is the New Driver
THE CAMDEN GROUP | 5/08/2015 18
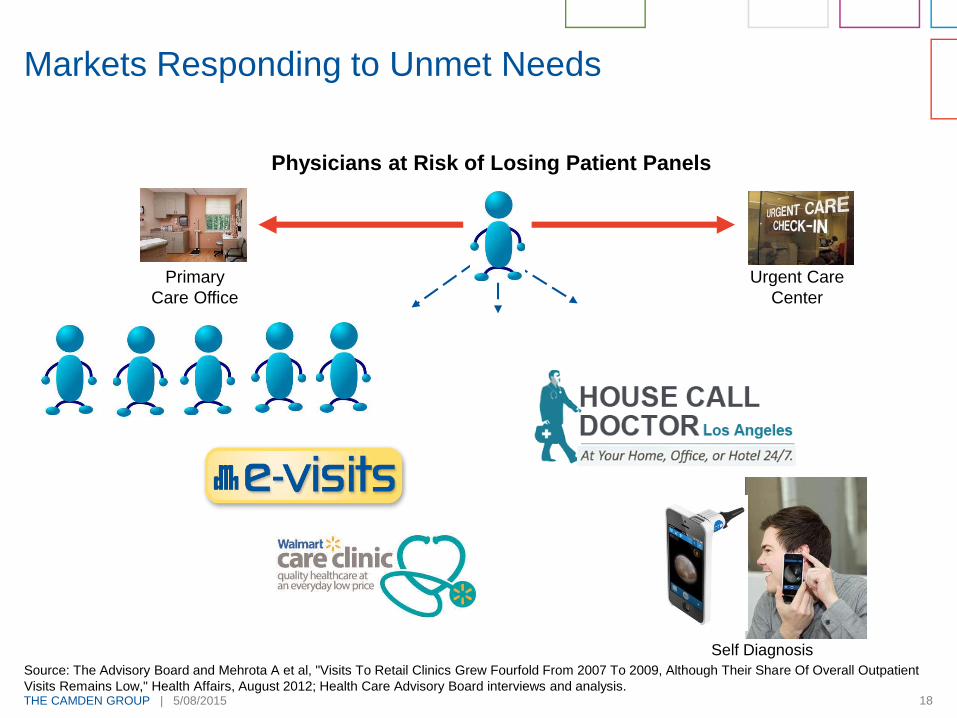
Markets Responding to Unmet Needs
Primary
Care Office
Physicians at Risk of Losing Patient Panels
Urgent Care
Center
18
Self Diagnosis
Source: The Advisory Board and Mehrota A et al, "Visits To Retail Clinics Grew Fourfold From 2007 To 2009, Although Their Share Of Overall Outpatient
Visits Remains Low," Health Affairs, August 2012; Health Care Advisory Board interviews and analysis.

THE CAMDEN GROUP | 5/08/2015 19
Trend Towards Advanced Access
Traditional
Schedule is always full
Patients pushed into the future (no capacity for
today's demand)
Patients have to prove they are "sick enough" to be seen
today
Carve Out
Some slots available for today's demand
Patients pushed into the future (limited capacity for
today's demand)
Patients have to prove they are "sick enough" to be seen
today
Advanced Access
40-60 percent of the schedule is available for
today's demand
Work is done today
Patients determine their need to be seen
-
THE CAMDEN GROUP | 5/08/2015 20
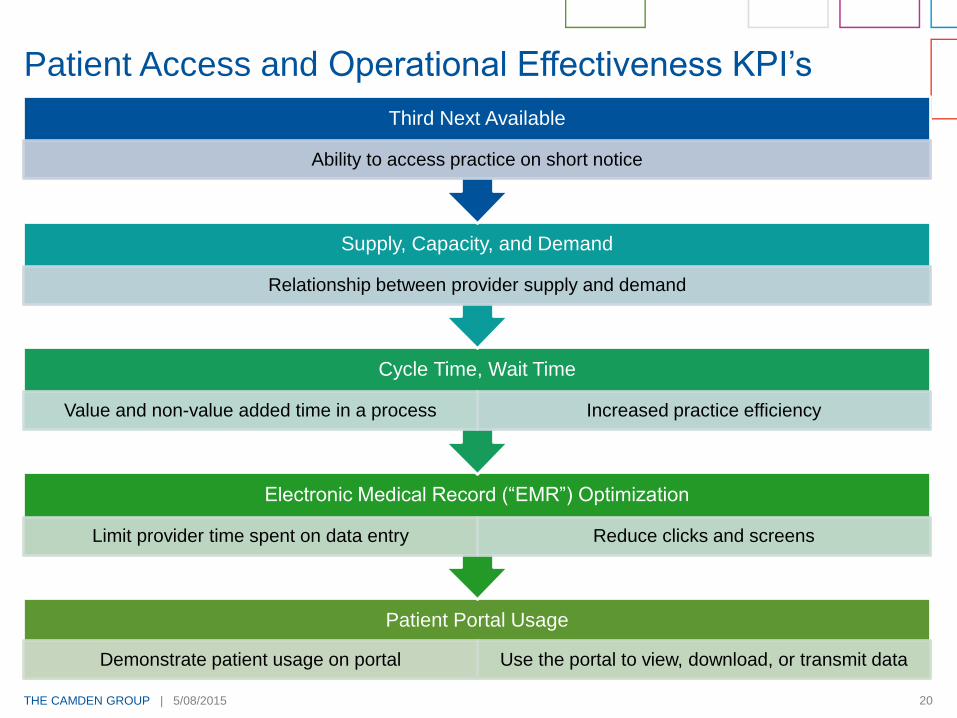
Patient Portal Usage
Demonstrate patient usage on portal Use the portal to view, download, or transmit data
Electronic Medical Record (“EMR”) Optimization
Limit provider time spent on data entry Reduce clicks and screens
Cycle Time, Wait Time
Value and non-value added time in a process Increased practice efficiency
Supply, Capacity, and Demand
Relationship between provider supply and demand
Third Next Available
Ability to access practice on short notice
Patient Access and Operational Effectiveness KPI’s

THE CAMDEN GROUP | 5/08/2015 21
Actions for Success
Measure your capacity vs. demand
and expand capacity, if needed
Expanded hours
Group visits
E-visits
Effectively use your patient portal (create one if you do not
have one!)
Scheduling appointments
Access to test results and medical records
Health information
Communicate by e-mail and text to create seamless
communication
Ensure Access

THE CAMDEN GROUP | 5/08/2015 22
Patient Access and Engagement
Meaningful use – must provide portal
access to half your patients
≥ 5 percent usage to view, download,
or transmit PHI
≥ 5 percent must send an electronic
message to a care provider
KPI’s to track, number of patients that:
Have access to PHI within 4 business
days
View, download, or transmit PHI
Send an e-message to their provider
Patient Portal Usage
THE CAMDEN GROUP | 5/08/2015 23
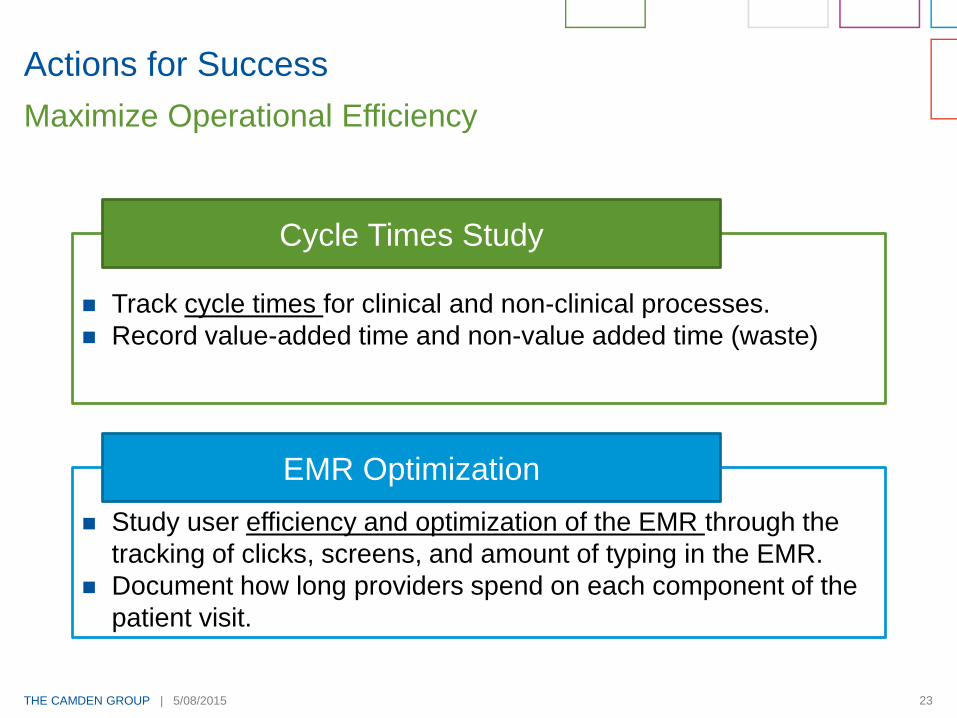
Actions for Success
Maximize Operational Efficiency
Track cycle times for clinical and non-clinical processes.
Record value-added time and non-value added time (waste)
Cycle Times Study
Study user efficiency and optimization of the EMR through the
tracking of clicks, screens, and amount of typing in the EMR.
Document how long providers spend on each component of the
patient visit.
EMR Optimization
THE CAMDEN GROUP | 5/08/2015 24
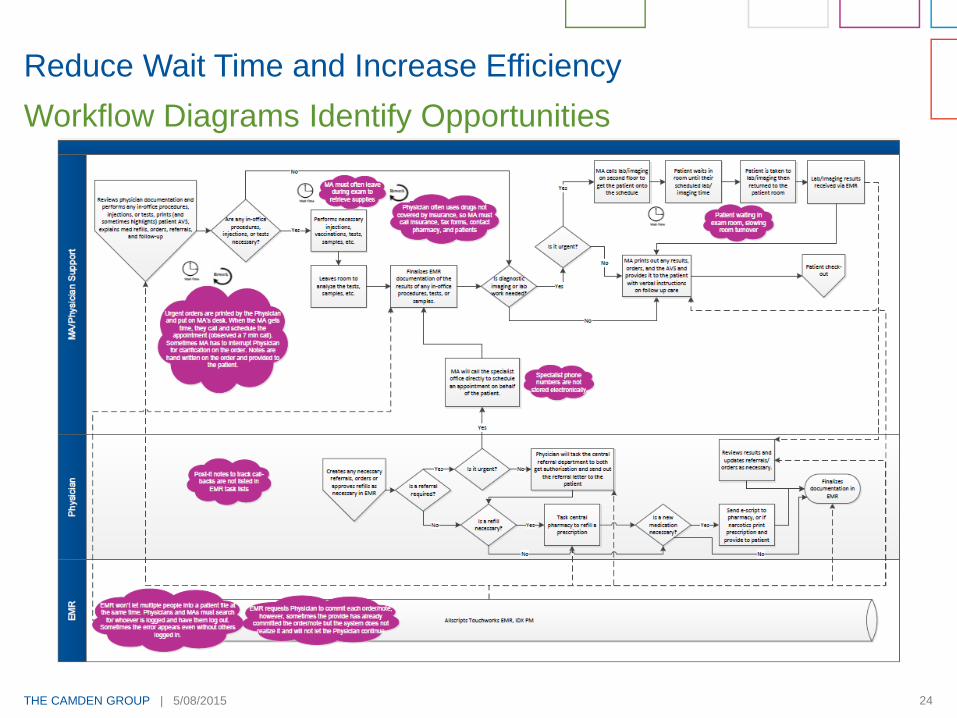
Reduce Wait Time and Increase Efficiency
Workflow Diagrams Identify Opportunities
THE CAMDEN GROUP | 5/08/2015 25
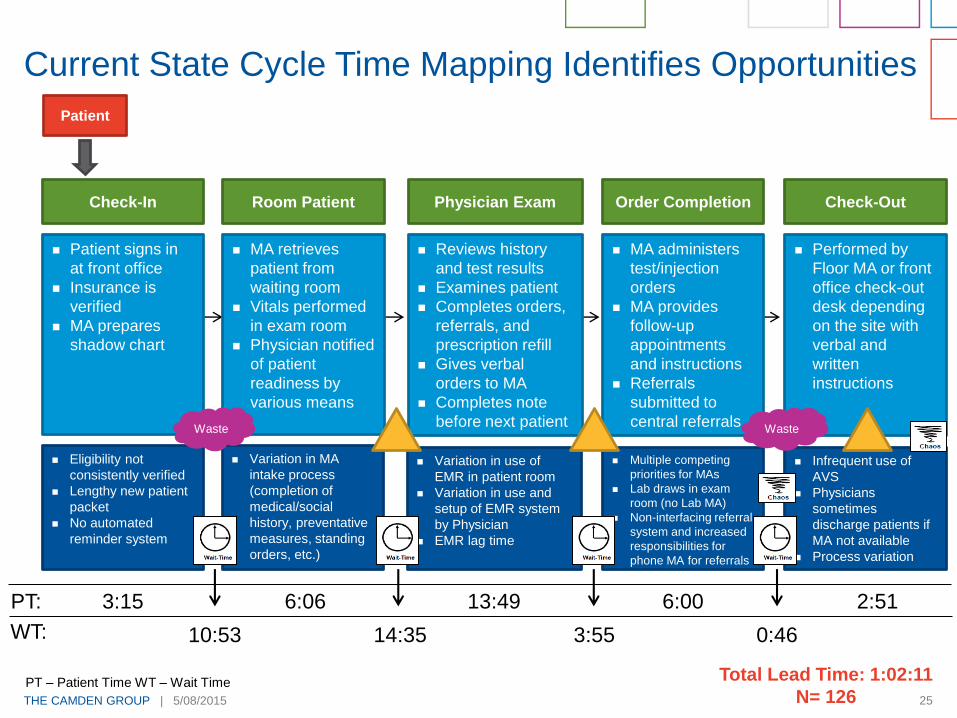
Total Lead Time: 1:02:11
N= 126
Check-In
Patient signs in
at front office
Insurance is
verified
MA prepares
shadow chart
Patient
Eligibility not
consistently verified
Lengthy new patient
packet
No automated
reminder system
Variation in MA
intake process
(completion of
medical/social
history, preventative
measures, standing
orders, etc.)
Variation in use of
EMR in patient room
Variation in use and
setup of EMR system
by Physician
EMR lag time
Multiple competing
priorities for MAs
Lab draws in exam
room (no Lab MA)
Non-interfacing referral
system and increased
responsibilities for
phone MA for referrals
MA retrieves
patient from
waiting room
Vitals performed
in exam room
Physician notified
of patient
readiness by
various means
Reviews history
and test results
Examines patient
Completes orders,
referrals, and
prescription refill
Gives verbal
orders to MA
Completes note
before next patient
Order Completion
MA administers
test/injection
orders
MA provides
follow-up
appointments
and instructions
Referrals
submitted to
central referrals
Performed by
Floor MA or front
office check-out
desk depending
on the site with
verbal and
written
instructions
Check-Out
Infrequent use of
AVS
Physicians
sometimes
discharge patients if
MA not available
Process variation
Room Patient Physician Exam
3:15
10:53
6:06
14:35
13:49
3:55
6:00
0:46
PT:
WT:
2:51
Current State Cycle Time Mapping Identifies Opportunities
Waste Waste
PT – Patient Time WT – Wait Time
THE CAMDEN GROUP | 5/08/2015 26
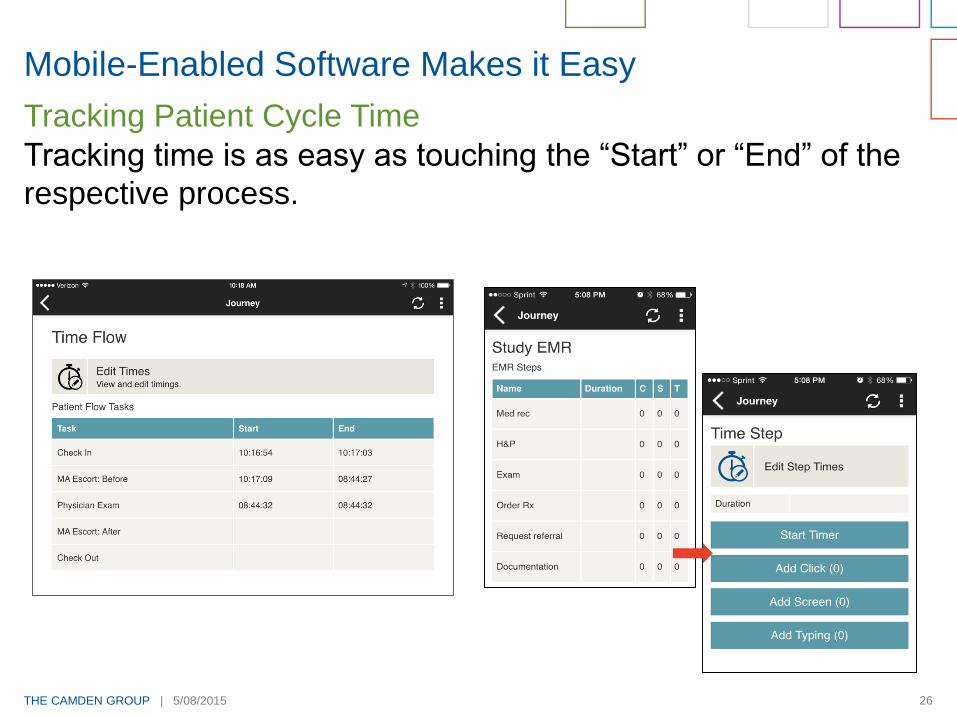
Mobile-Enabled Software Makes it Easy
Tracking time is as easy as touching the “Start” or “End” of the
respective process.
Tracking Patient Cycle Time
THE CAMDEN GROUP | 5/08/2015 27
0:00
0:15
0:30
0:45
1:00
1:15
1:30
1:45
Anaheim Carson Long BeachPlaza
Madrona ManhattanBeach
Sepulveda Spring Tustin
Pro
ce
ss
Tim
e (
Ho
urs
:Min
ute
s)
Southern California Primary Care Clinics
Check-Out Duration
Order Completion Duration
Physician Exam Duration
Patient Rooming Duration
Check-In Duration
Wait Time
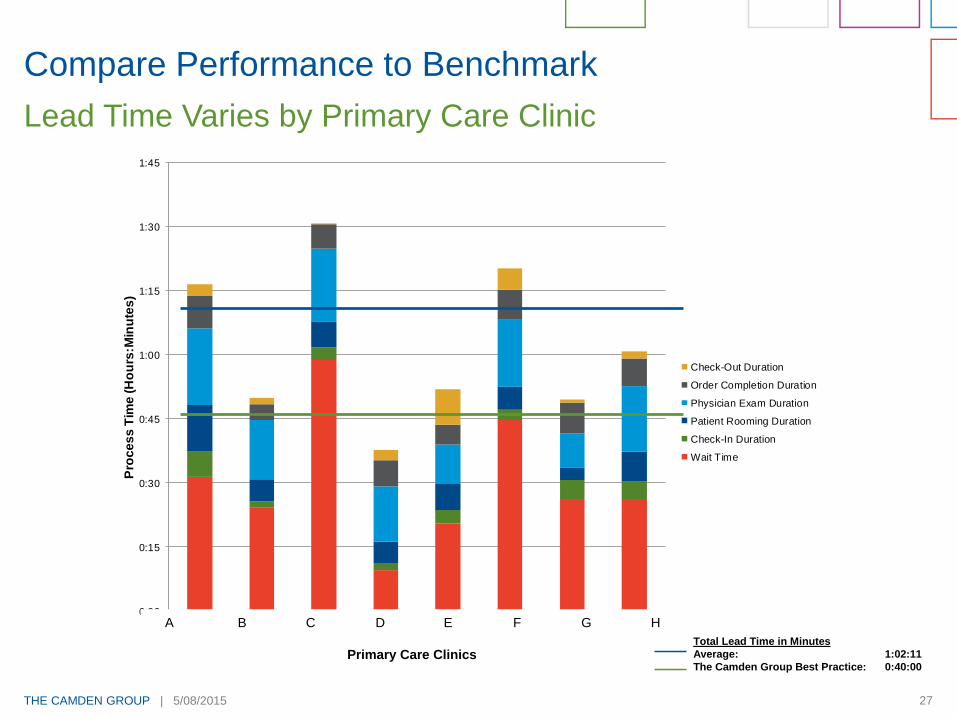
Compare Performance to Benchmark
Lead Time Varies by Primary Care Clinic
A B C D E F G H
Primary Care ClinicsTotal Lead Time in Minutes
Average: 1:02:11
The Camden Group Best Practice: 0:40:00

THE CAMDEN GROUP | 5/08/2015 28
Quantifying Impact on Physician Time
Physicians spend approximately 38 percent of their day in direct
patient care activities and have the potential to optimize their
hours by 1.5 hours per day.
Identify Physician Time Savings Opportunities
HealthCare Partners Project Landmark
Optimization of Physician Time per Day: California
Item
Direct Patient Care 3.7 3.5 -0.1 -3.8%
EMR Training and Optimization
Netw ork Speed and Connectivity
Single Sign-on/Badge Authentication
Documentation 2.6 1.8 -0.8 -30.0%
EMR Training and Optimization
Clinical Processes
Netw ork Speed and Connectivity
HCC Coding
Tasks 1.3 1.0 -0.3 -25.0%
Interfaces and Digital Fax
Streamline referral/authorization process
Simplify and Streamline Prescription Process
Phone Calls 0.8 0.7 -0.2 -20.0%
Message Screening
Clinical Staff Direction 0.5 0.5 -0.1 -10.0%
Patient Appointment Access
Message Screening
Simplify and Streamline Prescription Process
Total 9.0 7.5 -1.5 -16.5%
Source: The Camden Group engagements/HCP/Work-Flow-M ap/Documents/04_Deliverables/Final_Report/ [Revised_Opportunity_Graphs_By_M arket_12_09_2014.xlsx]CA
Current
Hours
Optimized
Hours Difference
Percent
Change
0
1
2
3
4
5
6
7
8
9
10
Current Hours Optimized Hours
Ho
urs
pe
r D
ay
Direct Patient Care Documentation Tasks
Phone Calls Clinical Staff Direction
Optimization of Physician Time per Day
THE CAMDEN GROUP | 5/08/2015 29
Next Generation KPI #4
Patient Satisfaction - Everyone Is Rating Physicians

THE CAMDEN GROUP | 5/08/2015 30
CAHPS Clinical and Group
Survey
Getting Timely Appointments,
Care, and Information
How Well Doctors Communicate
With Patients
Helpful, Courteous, and
Respectful Office Staff
Follow-up on Test Results
Patients’ Rating of the Doctor
Willingness to Recommend
Patient Satisfaction Survey: CAHPS
Source: www.cahps.ahrq.gov/clinician_group/cgdata/a4bar_results.htm
Patients’ Rating of the Doctor

THE CAMDEN GROUP | 5/08/2015 31
Next Generation KPI’s #5
Care gap reports measure
and support care
coordination and
management of patient
populations
Use clinical and claims data
to identify patients that have
not received recommended
services and compare to care
standards
Measures current
performance
Establishes tools to improve
patient care proactively
Report Gaps in Care
THE CAMDEN GROUP | 5/08/2015 32
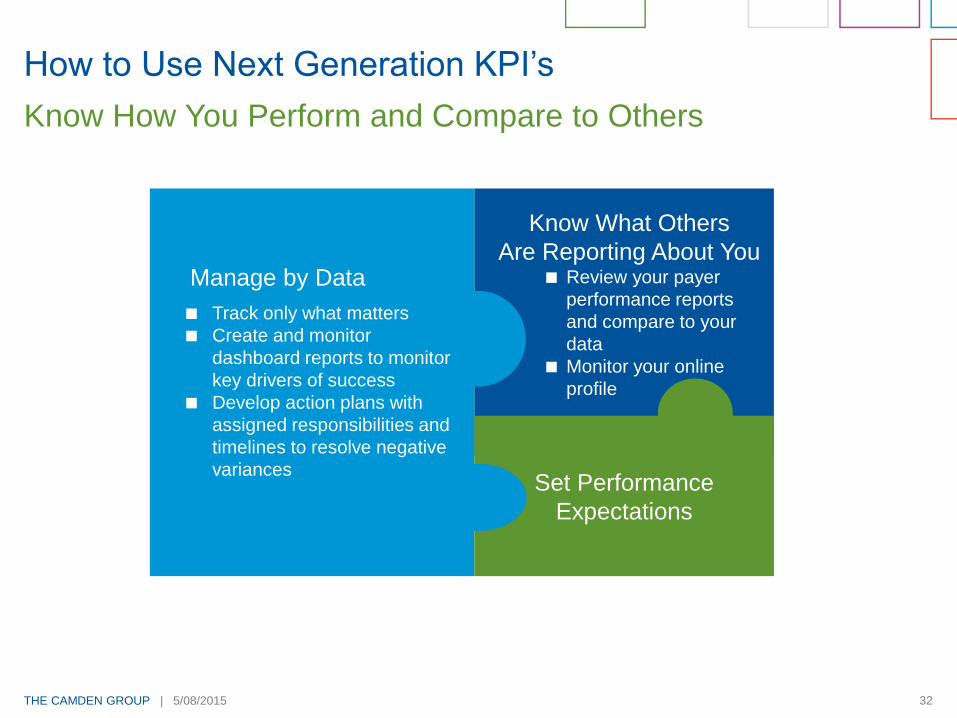
How to Use Next Generation KPI’s
Know How You Perform and Compare to Others
Manage by Data
Track only what matters
Create and monitor
dashboard reports to monitor
key drivers of success
Develop action plans with
assigned responsibilities and
timelines to resolve negative
variancesSet Performance
Expectations
Know What Others
Are Reporting About You Review your payer
performance reports
and compare to your
data
Monitor your online
profile
THE CAMDEN GROUP | 5/08/2015 33
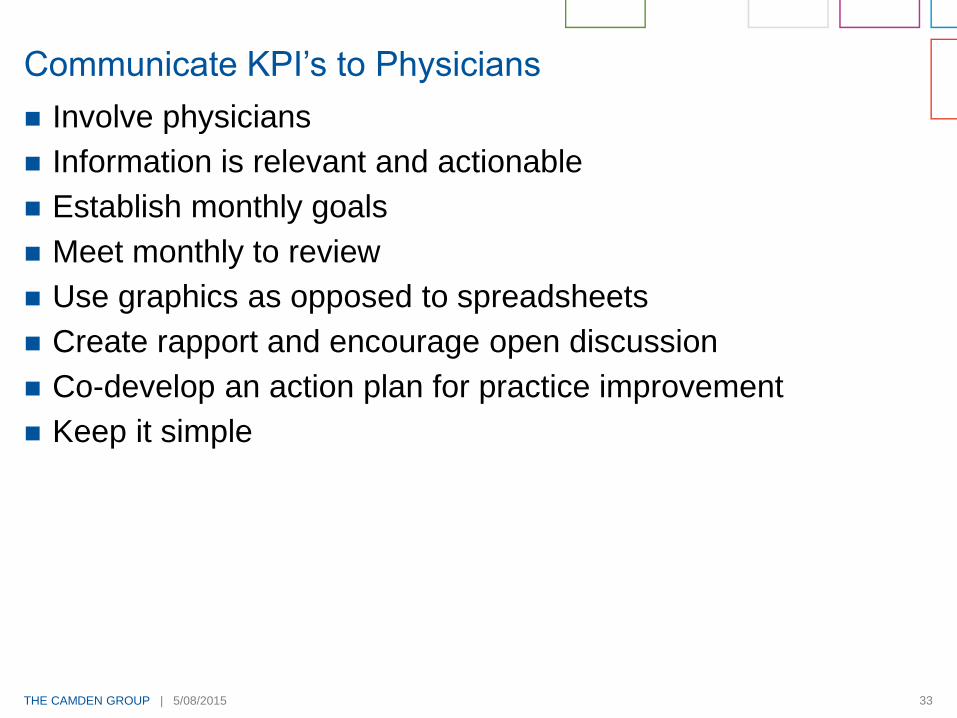
Involve physicians
Information is relevant and actionable
Establish monthly goals
Meet monthly to review
Use graphics as opposed to spreadsheets
Create rapport and encourage open discussion
Co-develop an action plan for practice improvement
Keep it simple
Communicate KPI’s to Physicians
THE CAMDEN GROUP | 5/08/2015 34
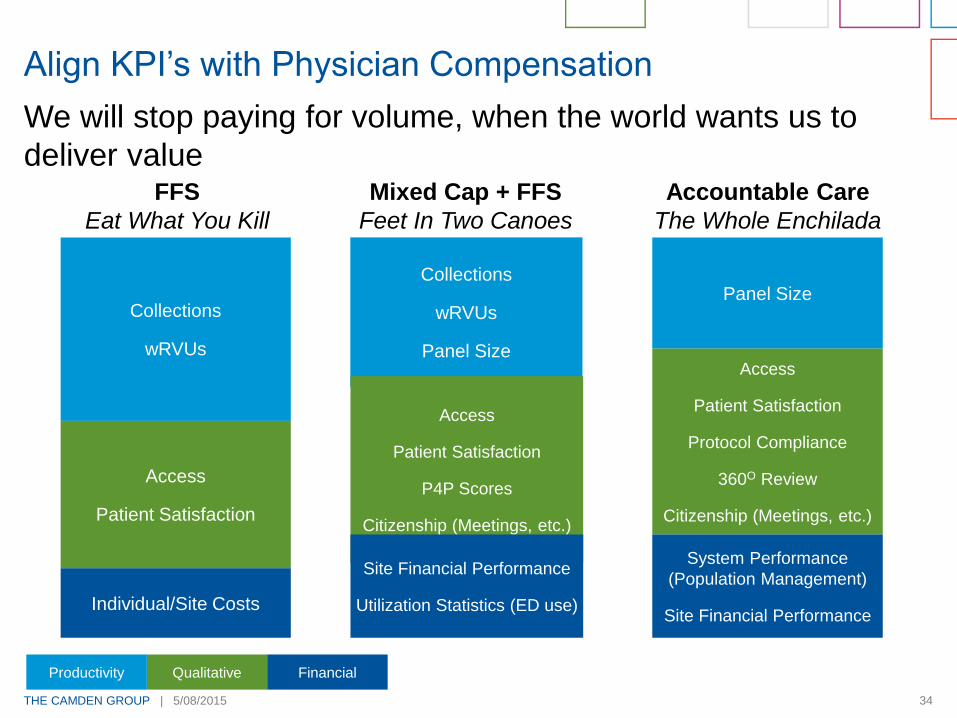
We will stop paying for volume, when the world wants us to
deliver value
Align KPI’s with Physician Compensation
Collections
wRVUs
Panel Size
Access
Patient Satisfaction
P4P Scores
Citizenship (Meetings, etc.)
Site Financial Performance
Utilization Statistics (ED use)
Collections
wRVUs
Access
Patient Satisfaction
Individual/Site Costs
Panel Size
Access
Patient Satisfaction
Protocol Compliance
360O Review
Citizenship (Meetings, etc.)
System Performance
(Population Management)
Site Financial Performance
FFS
Eat What You Kill
Mixed Cap + FFS
Feet In Two Canoes
Accountable Care
The Whole Enchilada
FinancialQualitativeProductivity
THE CAMDEN GROUP | 5/08/2015 35
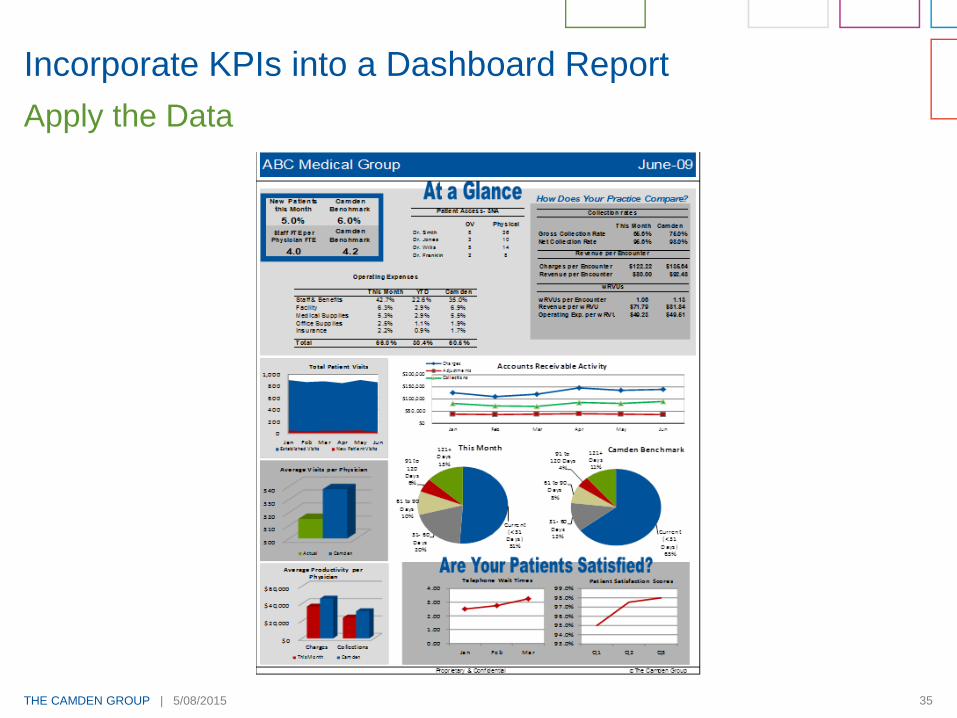
Incorporate KPIs into a Dashboard Report
Apply the Data
THE CAMDEN GROUP | 5/08/2015 36
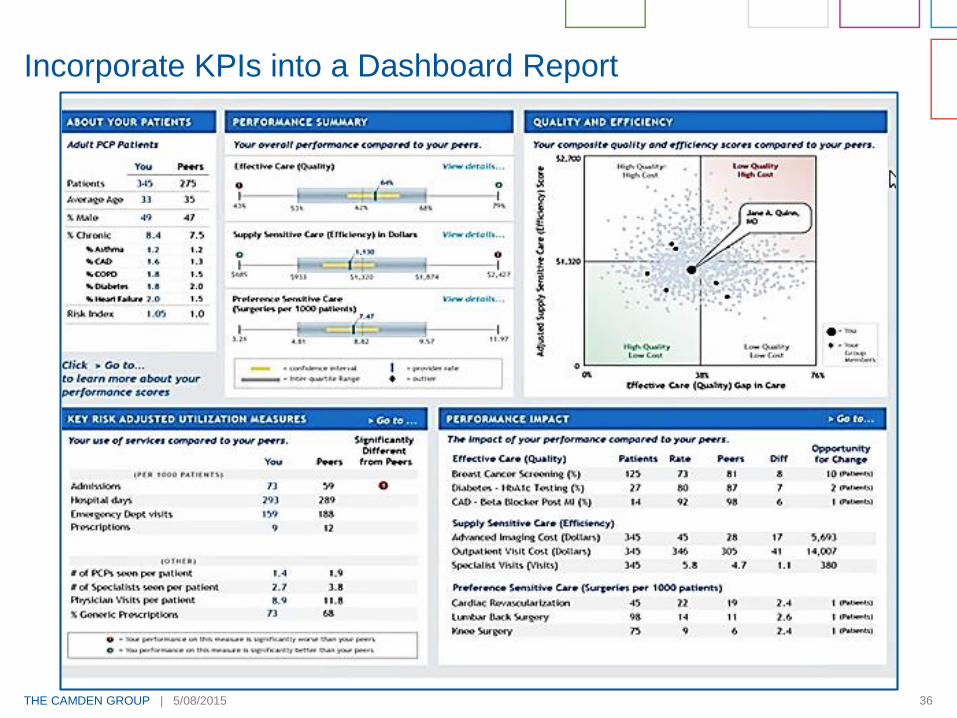
Incorporate KPIs into a Dashboard Report

THE CAMDEN GROUP | 5/08/2015 37
Understand your performance and cost of care to negotiate
favorable payment contracts
Select KPI’s that strategically target areas of quality, outcomes,
and efficiency
Select KPI’s with the biggest impact on payer costs
Review KPI’s on a regular basis
Leverage KPIs in Payer Contracting
THE CAMDEN GROUP | 5/08/2015 38
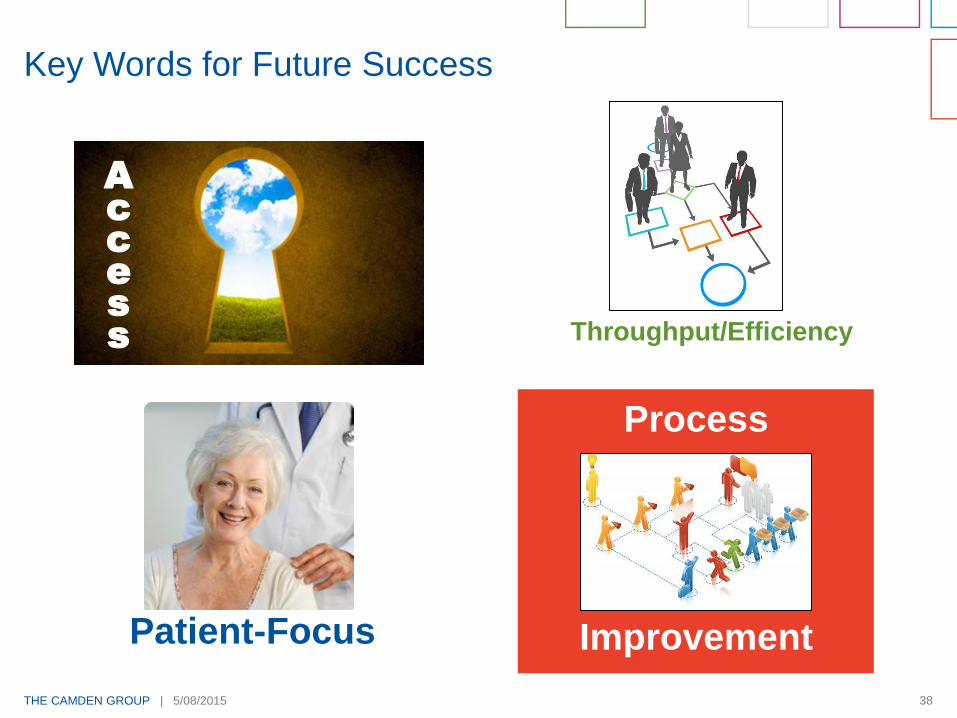
Key Words for Future Success
A
c
c
e
s
s
Improvement
Process
Throughput/Efficiency
Patient-Focus
THE CAMDEN GROUP | 5/08/2015 39
Susan Corneliuson, Senior Manager
The Camden Group
www.TheCamdenGroup.com
310.320.3990
Thank you for your time
and if you would like to sign up for a free subscription to our
quarterly newsletter and monthly online news briefing,
please leave your business card.
https://sptemp.thecamdengroup.com/sites/CamdenHome/Practice/docs/Presentations/Camden_Using_Key_Performance_Indicators_to_Transition_from_Volume_to_Value_05_08_15.pptx
Related Documents