NATHALIE TRUDEAU, CECILIA TAM, DAGMAR GRACZYK AND PETER TAYLOR INFORMATION PAPER ENERGY TRANSITION FOR INDUSTRY: INDIA AND THE GLOBAL CONTEXT 2011 January

Welcome message from author
This document is posted to help you gain knowledge. Please leave a comment to let me know what you think about it! Share it to your friends and learn new things together.
Transcript
Nathalie trudeau, CeCilia tam, dagmar graCzyk aNd Peter taylor
INFORMATION PAPER
ENERGY TRANSITION FOR INDUSTRY: INDIA AND THE GLOBAL CONTEXT
2011 January

INTERNATIONAL ENERGY AGENCY
The International Energy Agency (IEA), an autonomous agency, was established in November 1974. Its mandate is two-fold: to promote energy security amongst its member countries through collective response to physical disruptions in oil supply and to advise member
countries on sound energy policy.
The IEA carries out a comprehensive programme of energy co-operation among 28 advanced economies, each of which is obliged to hold oil stocks equivalent to 90 days of its net imports. The Agency aims to:
n Secure member countries’ access to reliable and ample supplies of all forms of energy; in particular, through maintaining effective emergency response capabilities in case of oil supply disruptions.
n Promote sustainable energy policies that spur economic growth and environmental protection in a global context – particularly in terms of reducing greenhouse-gas emissions that contribute to climate change.
n Improve transparency of international markets through collection and analysis of energy data.
n Support global collaboration on energy technology to secure future energy supplies and mitigate their environmental impact, including through improved energy
efficiency and development and deployment of low-carbon technologies.
n Find solutions to global energy challenges through engagement and dialogue with non-member countries, industry,
international organisations and other stakeholders. IEA member countries:
Australia Austria
Belgium Canada
Czech RepublicDenmark
Finland France
GermanyGreece
HungaryIreland
ItalyJapan
Korea (Republic of)LuxembourgNetherlandsNew Zealand NorwayPolandPortugalSlovak RepublicSpainSwedenSwitzerland
TurkeyUnited Kingdom
United States
The European Commission also participates in
the work of the IEA.
Please note that this publication is subject to specific restrictions that limit its use and distribution.
The terms and conditions are available online at www.iea.org/about/copyright.asp
© OECD/IEA, 2011International Energy Agency
9 rue de la Fédération 75739 Paris Cedex 15, France
www.iea.org
Nathalie trudeau, CeCilia tam, dagmar graCzyk aNd Peter taylor
INFORMATION PAPER
ENERGY TRANSITION FOR INDUSTRY: INDIA AND THE GLOBAL CONTEXT
2011 January
This information paper was prepared for the Energy Technology Perspective Project of the International Energy Agency (IEA). It was drafted by the Energy Technology Policy Division of the IEA. This paper reflects the views of the IEA Secretariat, but does not necessarily reflect those of individual IEA member countries.
For further information, please contact Nathalie Trudeau at [email protected]

© OECD/IEA 2011 Energy Transition for Industry: India and the Global Context
Page | 3
Table of contents Acknowledgements ........................................................................................................................ 7
Executive summary......................................................................................................................... 9
Transition to a low‐carbon energy future ............................................................................. 14
Introduction .................................................................................................................................. 17
Chapter 1. Industry overview ........................................................................................................ 19
Energy and CO2 savings potential in India, based on best available technologies ................ 21
IEA scenarios for India’s industrial sector .............................................................................. 22
Further considerations .......................................................................................................... 25
Chapter 2. Sectoral analysis .......................................................................................................... 27
Iron and steel ......................................................................................................................... 27
Cement .................................................................................................................................. 36
Chemicals and petrochemicals .............................................................................................. 43
Pulp and paper....................................................................................................................... 51
Aluminium ............................................................................................................................. 59
Chapter 3. Alternative case for India: Strong growth ................................................................... 69
Basic assumption for India’s strong growth case .................................................................. 69
Materials consumption and production under the strong growth case .............................. 70
Scenarios for industrial energy use and CO2 emissions in the strong growth case............... 71
Annex A: Key trends in India’s industrial sector ........................................................................... 75
Annex B: Indicators for the chemical and petrochemical sector .................................................. 81
Annex C: References ..................................................................................................................... 85
Annex D: Abbreviations, acronyms and units ............................................................................... 89
List of figures
Figure ES.1: India’s direct CO2 emissions reduction by industry in the low‐demand case ........... 11
Figure 1: Global CO2 emissions reduction by sector in the BLUE Scenario ................................... 17
Figure 2: Industrial energy use by region, 2007 ............................................................................ 19
Figure 3: Industrial final energy consumption by sub‐sector in India and in the world, 2007 ..... 20
Figure 4: Industrial final energy mix in India and in the world, 2007 ........................................... 20
Figure 5: Materials production by region in the low‐ and high‐demand cases ............................ 24
Figure 6: Use of coke dry quenching technology by country, 2004 .............................................. 29
Figure 7: Reducing agents consumption in Blast Furnaces in the world 2007/2008*/2009** .... 29
Figure 8: Energy savings potential in 2007 for iron and steel, based on BAT ............................... 30
Figure 9: Iron and steel energy and direct CO2 intensity for low‐demand scenarios, India and world average ................................................................................................................ 32
Figure 10: India’s direct CO2 emissions reduction by technology option for iron and steel ........ 33
Figure 11: Global direct CO2 emissions reduction by technology option for iron and steel ......... 33

Energy Transition for Industry: India and the Global Context © OECD/IEA 2011
Page | 4
Figure 12: Regional contribution to reducing global direct CO2 emissions in iron and steel, low‐demand case .......................................................................................................... 34
Figure 13: Share of cement‐kiln technology ................................................................................. 37
Figure 14: Thermal energy consumption per tonne of clinker ..................................................... 38
Figure 15: Energy‐savings potential in 2007 for cement, based on BAT ...................................... 39
Figure 16: Cement direct CO2 intensity in India and world average ............................................. 40
Figure 17: India’s direct CO2 emissions reduction by technology option for cement .................. 41
Figure 18: Global direct CO2 emissions reduction by technology option for cement .................. 42
Figure 19: Regional contribution in global direct CO2 emissions in cement, low‐demand case .......................................................................................................................... 42
Figure 20: Energy savings potential in 2007 for chemicals and petrochemicals, based on BPT ................................................................................................................................. 46
Figure 21: India’s chemical and petrochemical sector energy consumption, including feedstock ....................................................................................................................... 47
Figure 22: India’s direct CO2 emissions reduction by technology option for chemicals and petrochemicals ...................................................................................................... 48
Figure 23: Global direct emissions reduction by technology option for chemicals and petrochemicals .............................................................................................................................. 49
Figure 24: Regional contribution to reducing global direct CO2 emissions in chemicals and petrochemicals, low‐demand case ................................................................................................ 49
Figure 25: Pulp and paper heat efficiency potentials ................................................................... 53
Figure 26: Energy savings potential in 2007 for the pulp and paper, based on BAT .................... 54
Figure 27: India’s pulp and paper energy consumption by energy source and scenarios ............ 56
Figure 28: India’s direct CO2 emissions reduction by technology option for pulp and paper ...... 56
Figure 29: Global direct CO2 emissions reduction by technology option for pulp and paper ...... 57
Figure 30: Regional contribution to reduction in global direct CO2 emissions in pulp and paper, low‐demand case ........................................................................................................ 58
Figure 31: Specific energy consumption of metallurgical alumina production ............................ 60
Figure 32: Smelter technology mix, 1990 to 2008 ........................................................................ 61
Figure 33: Energy savings potential in 2007 for aluminium, based on BAT .................................. 62
Figure 34: India’s direct and indirect CO2 emissions in aluminium ............................................... 64
Figure 35: India’s direct CO2 emissions reduction by technology option for aluminium ............. 64
Figure 36: Global direct CO2 emissions reduction by technology option for aluminium ............. 65
Figure 37: Regional contribution to reducing global direct CO2 emissions in aluminium, low‐demand cases ......................................................................................................................... 66
Figure 38: India’s materials production under the ETP 2010 and strong growth cases ............... 71
Figure 39: Final energy use in India’s industry .............................................................................. 71
Figure 40: India’s direct energy and process CO2 emissions by industrial sector ......................... 72
Figure 41: Options for reducing direct CO2 emissions from India’s industry in the strong growth case ......................................................................................................................... 73
© OECD/IEA 2011 Energy Transition for Industry: India and the Global Context
Page | 5
List of tables
Table ES.1: India’s direct CO2 emissions reduction by industry .................................................... 10
Table ES.2: Production, energy consumption and CO2 emissions for India’s iron and steel industry ................................................................................................................... 11
Table ES.3: Production, energy consumption and CO2 emissions for India’s cement industry ............................................................................................................................ 12
Table ES.4: Production, energy consumption and CO2 emissions for India’s chemical and petrochemical industry ........................................................................................... 13
Table ES.5: Production, energy consumption and CO2 emissions for India’s pulp and paper industry ...................................................................................................... 13
Table ES.6: Production, energy consumption and CO2 emissions for India’s aluminium industry ....................................................................................................................... 14
Table 1: India’s industrial materials production and energy use, 2007 ........................................ 21
Table 2: India’s materials demand in kilograms per capita (kg/cap) ............................................ 22
Table 3: India’s total final energy use by industry, Mtoe ............................................................. 23
Table 4: India’s direct CO2 emissions by industry, Mt CO2 ............................................................ 24
Table 5: Global steel production, 2007 ......................................................................................... 27
Table 6: India’s iron and steel production by scenarios, Mt ......................................................... 31
Table 7: Technology options for the iron and steel industry ........................................................ 35
Table 8: Global cement production, 2007 .................................................................................... 36
Table 9: India’s cement industry main indicators by scenarios .................................................... 39
Table 10: Technology options for the cement industry ................................................................ 43
Table 11: Potential energy improvements by BPT in the global chemical and petrochemical sector, 2006 (including both process energy and feedstock use)a ....................... 45
Table 12: India’s HVC, ammonia and methanol production ......................................................... 47
Table 13: Technology options for the chemical and petrochemical industry............................... 50
Table 14: Global paper and paperboard production, 2007 .......................................................... 51
Table 15: India’s pulp and paper production by scenarios ........................................................... 55
Table 16: Technology options for the pulp and paper industry ................................................... 58
Table 17. Global primary aluminium production, 2007 ................................................................ 59
Table 18: India’s aluminium production by scenarios .................................................................. 63
Table 19: Technology options for the aluminium industry ........................................................... 67
Table 20: GDP projections (% per year, based on purchasing power parity) ............................... 69
Table 21: High‐level indicators for India in ETP 2010 and strong growth cases ........................... 70
Table 22: India’s materials demand per capita, kg/cap ................................................................ 70
Table A.1: Demand projection for industry, kg/cap ..................................................................... 75
Table A.2: Materials production in the Baseline Scenario, Mt ..................................................... 75
Table A.3: Materials production in the BLUE Scenario, Mt .......................................................... 77
Table A.4: Final energy use in industry in the Baseline Scenario, Mtoe ....................................... 79
Table A.5: Final energy use in industry in the BLUE Scenario, Mtoe ............................................ 79
Table A.6: Direct CO2 emissions in industry in the Baseline Scenario, Mt CO2 ............................. 80
Energy Transition for Industry: India and the Global Context © OECD/IEA 2011
Page | 6
Table A.7: Direct CO2 emissions in industry in the BLUE Scenario, Mt CO2 ................................. 80
Table B.1: BPT values on the specific energy consumption for the production of key chemicals (left: in final energy terms, denoted with index ”f”; right: in primary energy terms, denoted with index “p”)1 ...................................................................... 82
List of boxes
Box ES.1: Scenarios for the industrial sector .................................................................................. 9
Box 1: The ETP 2010 scenarios ...................................................................................................... 23

© OECD/IEA 2011 Energy Transition for Industry: India and the Global Context
Page | 7
Acknowledgements This paper was prepared by staff of the International Energy Agency’s Directorate of Sustainable Energy Policy and Technology in collaboration with the Directorate of Global Energy Dialogue.
A number of Indian experts have contributed significantly to improving the data and analysis presented in this paper. The IEA is grateful for the contribution of the India Energy Technology Perspectives Expert Group and wishes to thank the then Secretary, Ministry of Power, H. S. Brahma for establishing the India Energy Technology Expert Group to work with the IEA in preparing Energy Technology Perspectives 2010.
The expert group provided invaluable insights to our team to develop the India analysis. The IEA wish to thank for their important contributions: S.M. Dhiman, Member (Planning), Central Electricity Authority, chairman of the Expert group; Dilip Chenoy, Director General, Society of Indian Automobile Manufacturers (SIAM), chairman of the transportation sub‐group; I.C.P. Keshari, Joint Secretary, Ministry of Power, chairman of the power sub‐group; Dr. Ajay Mathur, Director General, Bureau of Energy Efficiency (BEE), chairman of the buildings sub‐group; V. Raghuraman, Chief Adviser, Jaguar Overseas Ltd, chairman of the industry sub‐group; A. S. Bakshi, Chief Engineer, Central Electricity Authority (CEA); Amarjeet Singh, Chief Engineer (C&E), (CEA); Anita Gahlot, Deputy Director, CEA; and the convener and members of the sub‐working groups:
Sub‐Group for Power sector: Sewa Bhawan, R.K.Puram Chief Engineer, CEA (convener); Ms. Shruti Bhatia, Conferederation of Indian Industry (CII); Dr. Pradeep Dadhich, Senior Fellow, The Energy and Resources Institute (TERI); Mr. D.K.Dubey, AGM (CCT); Shri P.K. Goel, Director, Ministry of Power; Shri R.B. Grover, Scientific Adviser, Department of Atomic Energy (DAE); Shri D.K. Jain, Executive Director (Engg), NTPC Ltd; Dr. Sudhir Kapur, Member CII National Committee on Power and MD & CEO‐Country Strategy Business; Shri R.K. Kaul, Joint Advisor, Planning Commission; Sh. Sanjeev Mahajan, DGM (PE‐CCT); Shri Sudhir Mohan, Advisor, Ministry of New and Renewable Energy (MNRE); Mr. B.H. Narayana, Addl. Dir., Central Power Research Institute (CPRI); Mr. Sunil Parwani, Addl. General Manager (Power Sector‐Planning & Monitoring), BHEL; Shri D.N. Prasad, Director, Ministry of Coal; Shri R.K. Sethi, Director, Ministry of Environment and Forests (MOEF); Sh. Arun Srivastava Scientific Officer/Engineer‐H, (Strategic Planning Group), DAE.
Sub‐Group for Buildings sector: Sh. Sanjay Seth, Energy Economist, BEE (Convener); Mr. Pradeep Kumar, Senior Fellow, TERI;Mr. K.I. Singh, GM (PE‐Infrastructure Services), NTPC Ltd; Mr. S. Srinivas, Principal Counsellor, CII Green Business Centre, Hyderabad; Sh. Lekhan Thakkar, Vice President, Gujarat Urban Development Company Ltd. (GUDC); Dr. Vakil, CEPT University, Ahmedabad.
Sub‐Group for Industry sector: Sh. Amarjeet Singh, Chief Engineer (C&E), CEA (Convener); Shri B.N. Bankapur, Director (Ref), Indian Oil Corporation (IOC); Mr. M.R. Gandhi, Scientist‐G, Central Salt & Marine Chemical Research Institute;Dr. Satish Kumar, Chief of Party, USAID ECO‐III Project, IRG; Sh. A. Panda, ED (S&EP); Shri K.Murali, Director (Ref), Hindustan Petroleum Corporation Limited (HPCL); Sh. U. Venkata Ramana; Sh. Gautam Roy, GM(T); Mr. Ambuj Sagar, Indian Institute of Technology Delhi (IIT); Mr. Girish Sethi, Director (EET Division), TERI; Mr. S.P. Singh, GM (E&P); Sh. S.B. Thakur, DGM (S&EP); Mr. K.S. Venkatagiri, Principal Counsellor, CII Green Business Centre, Hyderabad; Saurabh Yadav, Knowledge Management Specialist, BEE.
Sub‐Group for Transport sector: Smt. Neerja Mathur, Chief Engineer (OM), CEA (Convener); Dr. Ajit Gupta, Retd. Advisor, MNRE; Mr. Saurabh Dalela, Addl. Dir, NATRiP; Sh. Dinesh Tyagi, Director (Tech) National Automotive Testing and R&D Infrastructure Project (NATRiP).
Energy Transition for Industry: India and the Global Context © OECD/IEA 2011
Page | 8
As well as all other participants at the Joint IEA‐India Workshop on Regional Analysis of India who provided valuable comments and feedback on the Indian analysis including, but not limited to: Suresh Chander, Chief Engineer, CEA; K.K. Roy Chowdhury, Technical Associate, Cement Manufacturers’ Association; Sriganesh Gandham, GM‐ Corporate R&D, HPCL; Shri Alok kumar Goyal, Scientist, CPRI; Praveen Gupta, Director, CEA; Shri A.K. Gupta, Chief Engineer, CEA; Ravi Kapoor, USAID, ECO‐III; Shri S. M. Kulkarni, Hindalco; A.K. Kulshreshtha, CDE (PE‐Mech); Rajesh Kumar, Assistant Director, CEA; Mr. R.C Mall, IPMA; Dr. Nand, Fertiliser Association of India; P. Pal, Deputy GM, Engineering; Prof. V.K. Paul, Head of the Dept of Building Engineering & Management; Shri M.S. Puri, Chief Engineer, CEA; Prof. P.K. Sarkar, Professor of Transport Planning; Naveen Kumar Sharma, GM, Grinding Unit, JK Lakshmi Cement Ltd.; K. Sheshadri, Assistant Director I, CEA; Shri Avtar Singh, Indian Paper Manufacturers Association (IPMA); K.I Singh, NTPC; Hardayal Singh, Deputy Director, CEA; Major Singh, Chief Engineer, CEA; V.K. Singh, Deputy Director, CEA; Dr. B.P. Thapliyal, Scientist, Central Power Research Institute (CPRI); C.B. Trivedi, Deputy Director, CEA; Anil K Varshney, Additional Vice President, BSES Rajdhani Power.
© OECD/IEA 2011 Energy Transition for Industry: India and the Global Context
Page | 9
Executive summary Population growth, the modernisation of lifestyles, higher electrification rates and rapidly growing gross domestic product (GDP) in India drive a large increase in energy demand and put pressure on the security, reliability and affordability of energy supply, all of which are strongly linked to economic stability and development.
Globally, the erosion of energy security, the threat of disruptive climate change and the growing energy needs of the developing world all pose major challenges to energy decision makers. Energy security concerns are compounded by the increasingly urgent need to mitigate greenhouse‐gas (GHG) emissions, including those relating to energy production and consumption. Current energy consumption and carbon dioxide (CO2) emission trends run directly counter to the repeated warnings sent by the United Nations Intergovernmental Panel on Climate Change (IPCC), which concludes that only scenarios resulting in a 50% to 85% reduction of global CO2 emissions by 2050 (compared to 2000 levels) can limit the long‐term global mean temperature rise to 2.0°Celsius (°C) to 2.4°C (IPCC, 2007).
The BLUE Scenario, developed by the International Energy Agency (IEA) and presented in Energy Technology Perspectives 2010 (ETP 2010) (IEA, 2010), examines the least‐cost pathways for meeting the goal of reducing global energy‐related CO2 emissions to 50% of 2005 levels by 2050 while also proposing measures to overcome technical and policy barriers. The BLUE Scenario is consistent with a long‐term global rise in temperatures of 2.0°C to 3.0°C, but only if the reduction in energy‐related CO2 emissions is combined with deep cuts in other GHG emissions.
The scenario envisaged in the BLUE Scenario required CO2 emissions reduction across all the energy‐consuming sectors. For industry, action is particularly crucial in the five most energy‐intensive sectors: iron and steel; cement; chemicals and petrochemicals; pulp and paper; and aluminium. Globally, these sectors currently account for 77% of total direct CO2 emissions from industry; in India, they account for 56% of industrial energy consumption and 82% of direct CO2 emissions.
Box ES.1: Scenarios for the industrial sector
Each country and region of the world will contribute differently to the reduction in emissions from the industrial sector, depending on the expected growth in production as well as the potential for energy and CO2 savings.
In ETP 2010, the IEA developed two different scenarios to analyse the industrial sector:
The Baseline Scenario reflects developments that are expected on the basis of the energy policies that have been implemented or that have been approved and are to be implemented.
The BLUE Scenario is target‐driven and aims to achieve total emissions from the industry that are 24% lower in 2050 than the 2007 level.
Given the recent global economic crisis and uncertainties about projecting long‐term growth in consumption of materials, the IEA also developed two different cases for each scenario: a low‐demand and a high‐demand case for industrial materials. The industrial low‐demand case is used to develop the global BLUE Scenario presented in ETP 2010.
Going beyond the analysis presented in the ETP 2010, the IEA has developed an alternative strong growth case for India. In this alternative case, the future growth of GDP is higher than that used for the development of ETP 2010.

Energy Transition for Industry: India and the Global Context © OECD/IEA 2011
Page | 10
In the case of India, total industrial energy consumption between 2007 and 2050 is expected to grow 3.5 times under the Baseline low‐demand scenario and 4.2 times under the high‐demand scenario. By implementing policies and measures defined in the BLUE Scenario, energy consumption in India would be higher in 2050 than in 2007, but between 121 million tonnes of oil equivalent (Mtoe) and 140 Mtoe lower than in the Baseline Scenario in 2050. In any scenario, the final energy use in 2030 and 2050 is significantly higher than today.
No single option can yield the necessary emission reductions. Energy efficiency alone will not be sufficient to reduce emissions in the industrial sector as the production growth in India by far exceeds the savings potential from energy efficiency. Government policies are needed to facilitate a transition to more efficient and lower‐carbon technologies.
A significant reduction in CO2 emissions in Indian industry will only be possible if all sub‐sectors contribute. Direct industry emissions can only be limited to an increase of 100% and 268% of current levels by 2050 if all sub‐sectors significantly reduce their future emissions below the level anticipated in the Baseline Scenario (Table ES.1). In the BLUE Scenario, all sub‐sectors need to reduce emissions substantially in 2050 and, for the overall industrial sector, obtain levels that are 46% (low‐demand case) and 51% (high‐demand case) lower than in the Baseline Scenario.
Table ES.1: India’s direct CO2 emissions reduction by industry
Total
industry Iron and
steel Cement
Chemicals and petrochemicals
Pulp and
paper Aluminium
Other industries
Direct CO2 emissions in industry, Mt CO2
2007 413 151 128 48 8 4 74
2050
Baseline low-demand 1 564 703 422 132 36 14 256
Baseline high-demand 1 852 858 483 173 62 21 256
Baseline strong growth 2 807 1 153 1 060 229 87 22 256
BLUE low-demand 827 333 275 68 17 12 122
BLUE high-demand 906 362 291 77 31 16 129
BLUE strong growth 1 519 532 676 119 50 22 122
Changes in BLUE 2050 vs. 2007
BLUE low-demand 100% 121% 114% 42% 113% 214% 65%
BLUE high-demand 120% 140% 126% 61% 285% 321% 74%
BLUE strong growth 268% 253% 426% 149% 507% 469% 65%
Changes in BLUE 2050 vs. Baseline 2050
BLUE low-demand -47% -53% -35% -48% -52% -16% -53%
BLUE high-demand -51% -58% -40% -55% -49% -24% -50%
BLUE strong growth -46% -54% -36% -48% -43% -1% -53%
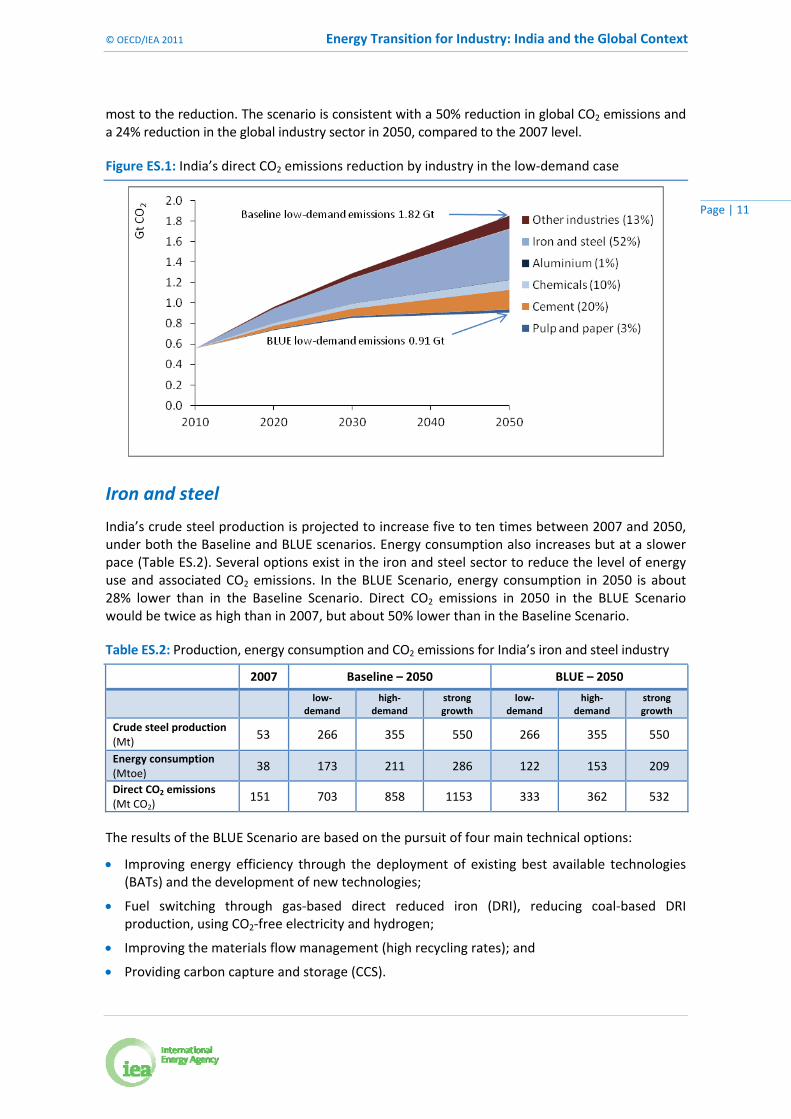
Each industrial sub‐sector will contribute to limit the growth in direct CO2 emissions in India under the BLUE low‐demand scenario (Figure ES.1). Direct CO2 emissions reduction is limited in the aluminium sector given its high share of electricity use. The iron and steel sector will contribute the
© OECD/IEA 2011 Energy Transition for Industry: India and the Global Context
Page | 11
most to the reduction. The scenario is consistent with a 50% reduction in global CO2 emissions and a 24% reduction in the global industry sector in 2050, compared to the 2007 level.
Figure ES.1: India’s direct CO2 emissions reduction by industry in the low‐demand case
Iron and steel
India’s crude steel production is projected to increase five to ten times between 2007 and 2050, under both the Baseline and BLUE scenarios. Energy consumption also increases but at a slower pace (Table ES.2). Several options exist in the iron and steel sector to reduce the level of energy use and associated CO2 emissions. In the BLUE Scenario, energy consumption in 2050 is about 28% lower than in the Baseline Scenario. Direct CO2 emissions in 2050 in the BLUE Scenario would be twice as high than in 2007, but about 50% lower than in the Baseline Scenario.
Table ES.2: Production, energy consumption and CO2 emissions for India’s iron and steel industry
2007 Baseline – 2050 BLUE – 2050
low‐
demand high‐
demand strong growth
low‐demand
high‐demand
strong growth
Crude steel production (Mt)
53 266 355 550 266 355 550
Energy consumption (Mtoe)
38 173 211 286 122 153 209
Direct CO2 emissions (Mt CO2)
151 703 858 1153 333 362 532
The results of the BLUE Scenario are based on the pursuit of four main technical options:
Improving energy efficiency through the deployment of existing best available technologies (BATs) and the development of new technologies;
Fuel switching through gas‐based direct reduced iron (DRI), reducing coal‐based DRI production, using CO2‐free electricity and hydrogen;
Improving the materials flow management (high recycling rates); and
Providing carbon capture and storage (CCS).

Energy Transition for Industry: India and the Global Context © OECD/IEA 2011
Page | 12
Cement
Demand for cement in India will be between 3.8 and 9.7 times higher in 2050 than it was in 2007. Production is projected to be the same under the Baseline and BLUE scenarios (Table ES.3).
Table ES.3: Production, energy consumption and CO2 emissions for India’s cement industry
2007 Baseline – 2050 BLUE – 2050
low‐
demand high‐
demand strong growth
low‐demand
high‐demand
strong growth
Cement production (Mt) 170 646 742 1 656 646 742 1 656
Energy consumption (Mtoe)
13 42 48 105 48 55 126
Direct CO2 emissions (Mt CO2)
128 422 483 1 060 275 291 676
Based on the technology characteristics of India’s cement industry, it appears clear that the efficiency of India’s cement production is better than the world average. The majority of large kilns are among the most energy efficient in the world. As such, little improvement can be achieved by applying BATs in these large kilns, but there is large potential to improve efficiency if BAT is applied in smaller units. Other measures could deliver large energy and/or CO2 emissions reduction. Those measures include:
Improving cement production energy efficiency by deploying existing BATs for new plants and small units, and phasing out wet kilns and retrofitting to more energy‐efficient technologies;
Expanding the use of clinker substitutes;
Fuel switching to less carbon‐intensive fossil fuels, and expanding the use of biomass and alterative fuels; and
Providing CCS.
Chemicals and petrochemicals
India’s chemical and petrochemical sector continues to be very innovative, but is it unclear how it will develop in future if, for example, substantially higher oil and gas prices slow demand. Even though the pace is expected to slow to some extent, the sector is still expected to grow significantly in the coming decades, both in India and globally.
A growing world population is likely to require more fertilisers to produce food and to meet increased demand for biomass as a fuel and a feedstock. In the last few decades, the sector has experienced substantial growth world wide. The production of high‐valued chemicals (HVC)1 in India is projected to be between 4.3 and 10 times higher in 2050 than in 2007. Ammonia and methanol production will also increase substantially (Table ES.4).
1 High‐value chemicals include ethylene, propylene from the pyrolysis gas of steam crackers, benzene (contained amounts, excluding extracted amounts), butadiene (also contained), acetylene and hydrogen (sold as fuel).

© OECD/IEA 2011 Energy Transition for Industry: India and the Global Context
Page | 13
Table ES.4: Production, energy consumption and CO2 emissions for India’s chemical and petrochemical industry
2007 Baseline – 2050 BLUE – 2050
low‐
demand high‐
demand strong growth
low‐demand
high‐demand
strong growth
Production (Mt)
‐ High‐value chemicals 10 45 80 104 39 59 91
‐ Ammonia 13 30 33 47 30 33 47
‐ Methanol 0.1 0.8 1.0 1.4 0.8 1.0 1.4
Total energy consumption (Mtoe)
27 83 126 165 74 100 153
Total direct CO2 emissions (Mt CO2)
48 132 173 229 68 77 119
If the expected substantial growth in the chemical and petrochemical sector is to be sustainable and consistent with achieving broader goals for CO2 emissions reduction, steps will need to be taken, notably on:
Implementing best practice technologies (BPT) in the short term and new technologies in the long term;
Expanding the production of bio‐based plastics and chemicals, and continuing to switch away from oil feedstock;
Improving the flow management of materials; and
Providing CCS.
Pulp and paper
Demand for paper and paperboard in India is expected to increase from 7.7 kilogram per capita (kg/cap) today to 43 kg/cap in the low‐demand case, 76 kg/cap in the high‐demand case and 120 kg/cap in the strong growth case. These strong increases in demand will drive the production of paper and paperboard in India from 7.6 Mt in 2007 to between 81 Mt and 232 Mt in 2050. Despite this strong increase in production, the energy consumption associated with the production of pulp and paper will only be 6.1 to 15 times higher in the BLUE Scenario in 2050 than in 2007 (Table ES.5).
Table ES.5: Production, energy consumption and CO2 emissions for India’s pulp and paper industry
2007 Baseline – 2050 BLUE – 2050
low‐
demand high‐
demand strong growth
low‐demand
high‐demand
strong growth
Production (Mt)
‐ Pulp 4 13 21 19 11 19 16
‐ Paper and paperboard 8 81 148 232 81 148 232
Total energy consumption (Mtoe)
3 19 33 47 17 31 43
Total direct CO2 emissions (Mt CO2)
8 36 62 87 17 32 50
Energy Transition for Industry: India and the Global Context © OECD/IEA 2011
Page | 14
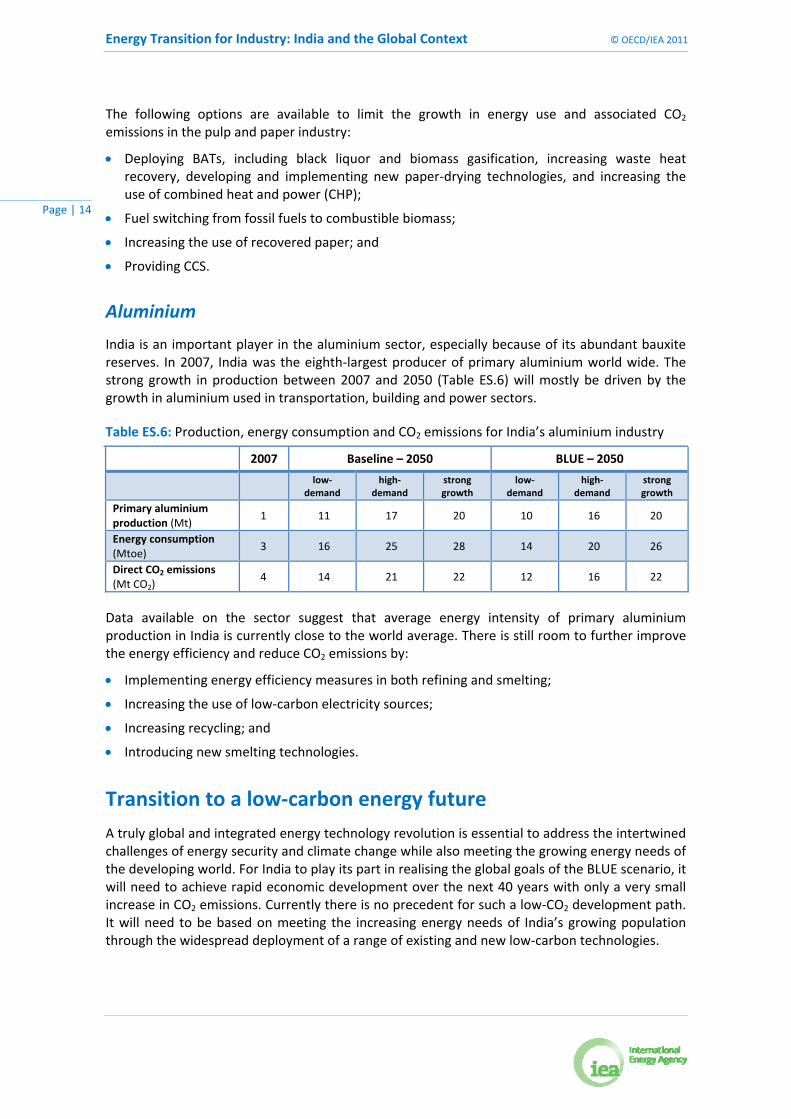
The following options are available to limit the growth in energy use and associated CO2 emissions in the pulp and paper industry:
Deploying BATs, including black liquor and biomass gasification, increasing waste heat recovery, developing and implementing new paper‐drying technologies, and increasing the use of combined heat and power (CHP);
Fuel switching from fossil fuels to combustible biomass;
Increasing the use of recovered paper; and
Providing CCS.
Aluminium
India is an important player in the aluminium sector, especially because of its abundant bauxite reserves. In 2007, India was the eighth‐largest producer of primary aluminium world wide. The strong growth in production between 2007 and 2050 (Table ES.6) will mostly be driven by the growth in aluminium used in transportation, building and power sectors.
Table ES.6: Production, energy consumption and CO2 emissions for India’s aluminium industry
2007 Baseline – 2050 BLUE – 2050
low‐
demand high‐
demand strong growth
low‐demand
high‐demand
strong growth
Primary aluminium production (Mt)
1 11 17 20 10 16 20
Energy consumption (Mtoe)
3 16 25 28 14 20 26
Direct CO2 emissions (Mt CO2)
4 14 21 22 12 16 22
Data available on the sector suggest that average energy intensity of primary aluminium production in India is currently close to the world average. There is still room to further improve the energy efficiency and reduce CO2 emissions by:
Implementing energy efficiency measures in both refining and smelting;
Increasing the use of low‐carbon electricity sources;
Increasing recycling; and
Introducing new smelting technologies.
Transition to a low‐carbon energy future
A truly global and integrated energy technology revolution is essential to address the intertwined challenges of energy security and climate change while also meeting the growing energy needs of the developing world. For India to play its part in realising the global goals of the BLUE scenario, it will need to achieve rapid economic development over the next 40 years with only a very small increase in CO2 emissions. Currently there is no precedent for such a low‐CO2 development path. It will need to be based on meeting the increasing energy needs of India’s growing population through the widespread deployment of a range of existing and new low‐carbon technologies.

© OECD/IEA 2011 Energy Transition for Industry: India and the Global Context
Page | 15
In the industrial sector, the application of BATs and the development of breakthrough technologies will help in reducing emissions. CCS will be needed to keep the increase in emissions in line with the overall reduction targets. Priority should be given to reducing the CO2 intensity in the three largest industrial sectors (iron and steel, chemicals and petrochemicals and cement). Special attention should focus on coal‐based DRI, pulp and paper making and small‐scale cement kilns. There three areas offer interesting opportunities to increase efficiency and limit the growth in energy consumption.
The challenge for India will be to achieve a strong economic growth while improving their energy security but without locking in high emissions. In identifying the step towards achieving this, national technology roadmaps for the most promising low‐carbon technologies should be developed. It will also require international collaboration on a number of initiatives. Enhanced international co‐operation for researching, developing, sharing and transferring technologies will be required. International mechanisms for reducing carbon such as the Clean Development Mechanism (CDM) will need to play a role in deploying low‐carbon energy technologies in India.

Energy Transition for Industry: India and the Global Context © OECD/IEA 2011
Page | 16

© OECD/IEA 2011 Energy Transition for Industry: India and the Global Context
Page | 17
Introduction The fourth assessment report of the United Nations Intergovernmental Panel on Climate Change (IPCC), released in November 2007, concluded that global carbon dioxide (CO2) emissions must be reduced by between 50% and 85% by 2050 (compared to 2000 levels) if global warming is to be limited to between 2.0°Celsius (°C) and 2.4°C.
Following the publication of the IPCC report, the urgency to address climate change rose significantly. A general guideline is that global CO2 emissions must be halved.
In 2010, the International Energy Agency (IEA) published Energy Technology Perspectives 2010 (ETP 2010) (IEA, 2010). The book explains how to transform the global energy economy over the coming decades. A BLUE Scenario was developed to explore the energy and technology implications of reducing global energy‐related CO2 emissions to 50% of the 2005 levels by 2050. If fully implemented, the BLUE Scenario could limit the long‐term global mean temperature rise to between 2.0°C and 3.0°C. The analysis indicates that beyond 2030, the end‐use sectors (residential, services, industry and transport) have an increasingly important role to play in reducing emissions (Figure 1). Achieving such a significant reduction requires maximum energy efficiency world wide and a virtually decarbonised power sector.
Figure 1: Global CO2 emissions reduction by sector in the BLUE Scenario
Note: CO2 emissions savings from fuel transformation have been allocated to the transport sector and the reduction in CO2 from electricity savings has been allocated to end‐use sector. Source: IEA, 2010.
To achieve a 50% reduction in CO2 emissions globally by 2050, ETP 2010 calculated that, based on a “least‐cost approach”, industry would have to reduce its overall emissions to 24% of the 2007 levels by 2050. The contribution from different countries and industrial sectors varies according to their respective potential to reduce emissions through energy efficiency, the availability of fuel‐switching and recycling options, and their potential for deploying carbon capture and storage (CCS).
Energy Transition for Industry: India and the Global Context © OECD/IEA 2011
Page | 18
As part of the ETP 2010 analysis, the Baseline and BLUE scenarios presented in the previous ETP report (ETP 2008, IEA, 2008a) have been elaborated to include more information on the following four countries/regions: China, India, OECD Europe2 and the United States.
This working paper further develops the analysis presented in the India chapter of ETP 2010 and provides insights on the implications of achieving deep energy and CO2 emission cuts in the industrial sector both for India and globally. It investigates from a Baseline Scenario the least‐cost options to significantly reduce energy and CO2 emissions in India’s industrial sector, while enabling the Indian economy to continue to grow and alleviate energy poverty. It does so from a techno‐economical perspective – building on detailed resource and technology data for India. It also identifies the key technologies for India, as well as the energy and CO2 savings that would result from their deployment. It analyses the possibilities for energy efficiency improvements and CO2 emissions reduction for the five most energy‐intensive industrial sectors including: iron and steel; cement; chemicals and petrochemicals; pulp and paper; and aluminium. Each sector presents a review of recent trends based on the latest IEA industry indicators3 and an analysis of the potential of existing technologies to increase energy efficiency and reduce CO2 emissions for India and for the world.
The intent is not to examine what kind of energy savings or CO2 emissions reduction India should make in the future or analyse how to achieve the deployment of low‐carbon technology in India, or what technology transfer should look like and in which areas it would be needed. However, discussion of generic technology transfer issues is included in ETP 2010.
The paper comprises three chapters:
Chapter 1 provides an overview of the results for the industrial sector both for India and for the world. The results are presented for the two different variants of the industrial sector included in ETP 2010 – the low‐ and high‐demand cases.
Chapter 2 examines the energy and emissions trends by sub‐industry, both for India and the global economy. It also provides insights into the future energy technologies that will play a part in reducing emissions for India and at the global level.
Chapter 3 presents an alternative case using stronger growth in gross domestic product (GDP) and materials production for India. The “strong growth” case shows the implication of a strong growth in India assuming the same level of research, development, demonstration and deployment (RDD&D) and the carbon price is the same as in the BLUE Scenario.
2 OECD Europe includes: Austria, Belgium, Czech Republic, Denmark, Finland, France, Germany, Greece, Hungary, Iceland, Ireland, Italy, Luxembourg, the Netherlands, Norway, Poland, Portugal, Slovak Republic, Spain, Sweden, Switzerland, Turkey and the United Kingdom. 3 In the context of this publication, an “indicator” is defined as any information that helps to explain an energy situation or a change in energy at the economy, industry, country or global level. Indicators in this paper include: energy intensity; use of a particular technology or feedstock; efficiency improvement; and savings potential.

© OECD/IEA 2011 Energy Transition for Industry: India and the Global Context
Page | 19
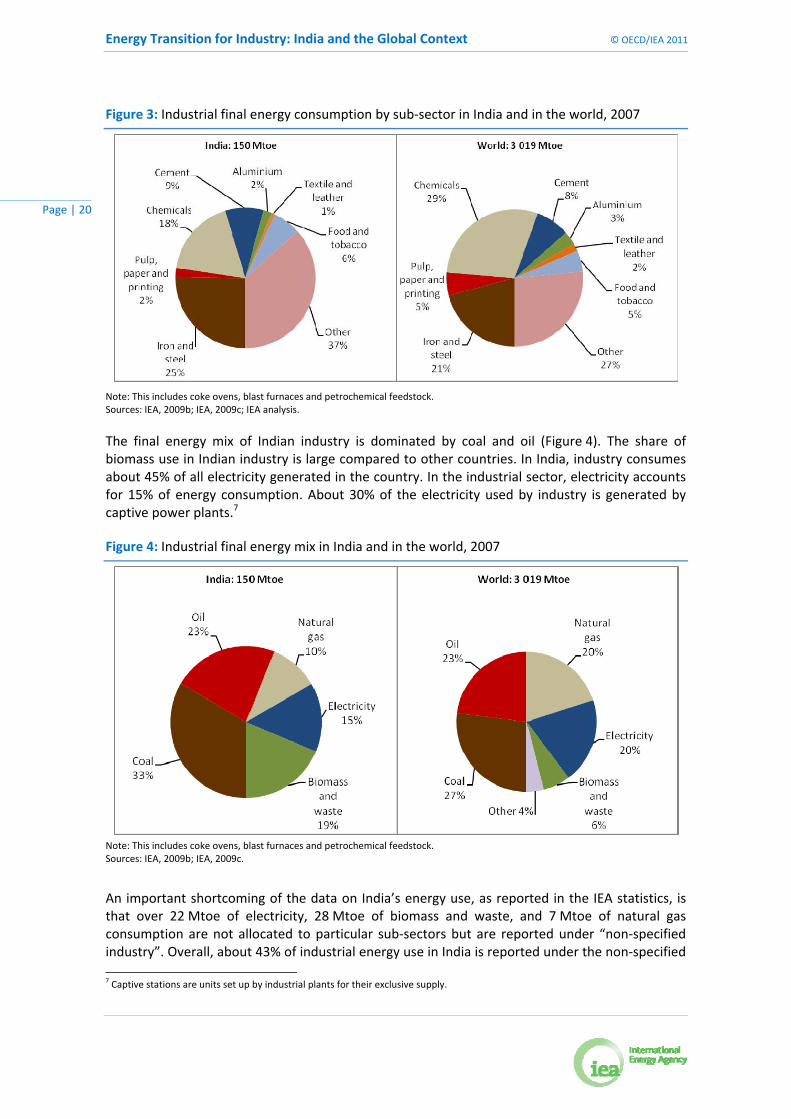
Chapter 1. Industry overview In India, industrial energy use4 reached 150 million tonnes of oil equivalent (Mtoe) in 2007 accounting for 38% of the country’s final energy used. From a global perspective, India is the fourth‐largest industrial energy consumer with a 5% share of total industrial energy use, surpassed only by China, the United States and Russia (Figure 2).
Globally, industry accounts for one‐third of all the energy used and for almost 40% of worldwide carbon dioxide (CO2) emissions. In 2007, total final energy use in industry amounted to 3 019 Mtoe. Direct emissions5 of CO2 in industry amounted to 7.6 gigatonnes of CO2 (Gt CO2) and indirect emissions6 to 3.9 Gt CO2. Reducing CO2 emissions from industry must be an essential part of a global action to prevent dangerous climate change. The International Energy Agency (IEA) analysis shows that industry will need to reduce its current direct emissions by about 24% of 2007 levels if it is to halve global emissions from 2005 levels by 2050.
Figure 2: Industrial energy use by region, 2007
Note: This includes coke ovens, blast furnaces and petrochemical feedstock. Sources: IEA, 2009b; IEA, 2009c.
The five most energy‐intensive industrial sectors (iron and steel, cement, chemicals and petrochemicals, pulp and paper, and aluminium) accounted for 56% of India’s industrial energy consumption in 2007. Globally, these five sectors accounted for 66% of industrial energy consumption (Figure 3).
4 In this document, iron and steel includes energy use for coke making. The energy data for chemicals and petrochemicals include feedstock. 5 Direct emissions include fuel combustion and process‐related CO2 emissions from within the industry. 6 Indirect emissions are emissions from the power generation sector due to electricity use in industry.
Energy Transition for Industry: India and the Global Context © OECD/IEA 2011
Page | 20
Figure 3: Industrial final energy consumption by sub‐sector in India and in the world, 2007
Note: This includes coke ovens, blast furnaces and petrochemical feedstock. Sources: IEA, 2009b; IEA, 2009c; IEA analysis.
The final energy mix of Indian industry is dominated by coal and oil (Figure 4). The share of biomass use in Indian industry is large compared to other countries. In India, industry consumes about 45% of all electricity generated in the country. In the industrial sector, electricity accounts for 15% of energy consumption. About 30% of the electricity used by industry is generated by captive power plants.7
Figure 4: Industrial final energy mix in India and in the world, 2007
Note: This includes coke ovens, blast furnaces and petrochemical feedstock. Sources: IEA, 2009b; IEA, 2009c.
An important shortcoming of the data on India’s energy use, as reported in the IEA statistics, is that over 22 Mtoe of electricity, 28 Mtoe of biomass and waste, and 7 Mtoe of natural gas consumption are not allocated to particular sub‐sectors but are reported under “non‐specified industry”. Overall, about 43% of industrial energy use in India is reported under the non‐specified
7 Captive stations are units set up by industrial plants for their exclusive supply.

© OECD/IEA 2011 Energy Transition for Industry: India and the Global Context
Page | 21
category (Table 1). Furthermore, the statistics for biomass consumption are highly uncertain. As a consequence, it is not possible to perform detailed energy efficiency analyses for the industry as a whole based on these data. The IEA has developed estimates of India’s energy consumption by compiling a mixture of top‐down and bottom‐up sources. The energy use as reported in IEA statistics (IEA, 2009c) as well as the estimates used in the current analysis are presented in Table 1. These estimates are based on current production levels and energy intensities from a range of sources. There is still a need to validate these data.
Table 1: India’s industrial materials production and energy use, 2007
Production
Reported energy use
Reported electricity use
Estimated energy use
Estimated electricity use
Estimated direct CO2 emissions
(Mt) (Mtoe) (Mtoe) (Mtoe) (Mtoe) (Mt CO2)
Industry sector 150 22 150 22 413
Iron and steel 53 33 38 3.3 151
Chemicals and petrochemicals
27 27 48
Non-ferrous metals
0.4
Total aluminium 2 - - 2.9 1.6 3.8
Non-metallic minerals
11
Cement 170 - - 13 1.1 128
Pulp, paper and printing
1.4
8.2
Paper and paperboard
8 - - 1.4 0.4
Pulp 4 - - 1.7 0.3
Recovered paper 1 - - 0.1 0.0
Food and tobacco
10 n.a. n.a. n.a.
Textile and leather 1.3 n.a. n.a. n.a.
Other
2 66 15 74
Non-specified industry 65 22
Notes: Iron and steel includes energy use for coke making and the energy data for chemicals and petrochemicals include feedstock. The table has been compiled from a mixture of top‐down and bottom‐up sources and so the totals may not match.
Sources: Worldsteel, 2009; USGS, 2009a; IAI, 2009a; IPMA ,2010a; IEA, 2009a, b, c; IEA analysis.
Energy and CO2 savings potential in India, based on best available technologies8
In order to quantify the energy and CO2 savings potential by applying best available technologies (BATs), the IEA developed a top‐down approach. In this approach the theoretical minimum energy consumption is calculated by assuming each process in a sector would apply BAT (or best practice technology [BPT] in the case of the chemical and petrochemical sector). In order to assess the potential reduction in energy and CO2 emissions, the estimated energy consumption values are compared to the reported actual energy consumption.
8 Defining best available technology (BAT) requires consideration of both technical and economic factors. In the IEA’s analysis, BAT designation in relation to energy efficiency in a particular industry has been drawn from a range of sources, including technical documentation produced for the European Union Directive 96/61/EC concerning integrated pollution prevention and control, and other technical and peer reviewed literature. In contrast to BAT, BPT is a term that applies to technologies and processes that are currently deployed. BAT could, in many cases, be identical to BPT. In other cases, a new technology may have just emerged but is not yet deployed. If this is the case, the BAT energy efficiency may be better than BPT.
Energy Transition for Industry: India and the Global Context © OECD/IEA 2011
Page | 22
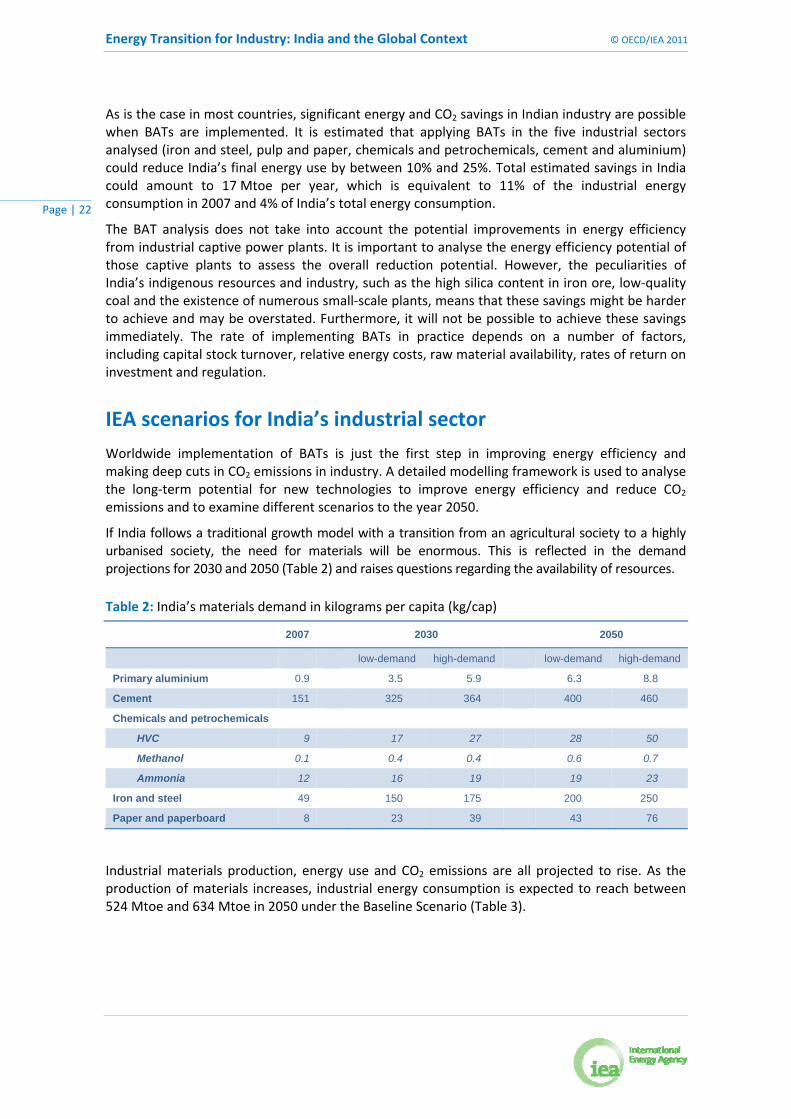
As is the case in most countries, significant energy and CO2 savings in Indian industry are possible when BATs are implemented. It is estimated that applying BATs in the five industrial sectors analysed (iron and steel, pulp and paper, chemicals and petrochemicals, cement and aluminium) could reduce India’s final energy use by between 10% and 25%. Total estimated savings in India could amount to 17 Mtoe per year, which is equivalent to 11% of the industrial energy consumption in 2007 and 4% of India’s total energy consumption.
The BAT analysis does not take into account the potential improvements in energy efficiency from industrial captive power plants. It is important to analyse the energy efficiency potential of those captive plants to assess the overall reduction potential. However, the peculiarities of India’s indigenous resources and industry, such as the high silica content in iron ore, low‐quality coal and the existence of numerous small‐scale plants, means that these savings might be harder to achieve and may be overstated. Furthermore, it will not be possible to achieve these savings immediately. The rate of implementing BATs in practice depends on a number of factors, including capital stock turnover, relative energy costs, raw material availability, rates of return on investment and regulation.
IEA scenarios for India’s industrial sector
Worldwide implementation of BATs is just the first step in improving energy efficiency and making deep cuts in CO2 emissions in industry. A detailed modelling framework is used to analyse the long‐term potential for new technologies to improve energy efficiency and reduce CO2 emissions and to examine different scenarios to the year 2050.
If India follows a traditional growth model with a transition from an agricultural society to a highly urbanised society, the need for materials will be enormous. This is reflected in the demand projections for 2030 and 2050 (Table 2) and raises questions regarding the availability of resources.
Table 2: India’s materials demand in kilograms per capita (kg/cap)
2007
2030
2050
low-demand high-demand low-demand high-demand
Primary aluminium 0.9 3.5 5.9 6.3 8.8
Cement 151 325 364 400 460
Chemicals and petrochemicals
HVC 9 17 27 28 50
Methanol 0.1 0.4 0.4 0.6 0.7
Ammonia 12 16 19 19 23
Iron and steel 49 150 175 200 250
Paper and paperboard 8 23 39 43 76
Industrial materials production, energy use and CO2 emissions are all projected to rise. As the production of materials increases, industrial energy consumption is expected to reach between 524 Mtoe and 634 Mtoe in 2050 under the Baseline Scenario (Table 3).

© OECD/IEA 2011 Energy Transition for Industry: India and the Global Context
Page | 23
Table 3: India’s total final energy use by industry, Mtoe
2007
Baseline – 2050 BLUE – 2050
low-demand high-demand low-demand high-demand
Aluminium 3
16 25 14 20
Cement 13
42 48 49 55
Chemicals and petrochemicals 27
83 126 74 100
Iron and steel 38
173 211 122 153
Pulp and paper 3
19 33 17 31
Other industries 66
191 191 126 134
Total 150
524 634 402 624
Sources: IEA, 2009c; IEA analysis.
The Baseline Scenario considers all policies implemented to date. A BLUE Scenario, in which global industrial energy‐related emissions would be 24% lower by 2050 compared to 2007 levels, has been investigated with maximum use of energy efficiency, high levels of recycling, greater shares of biomass use and the implementation of carbon capture and storage (CCS) in the iron and steel, cement, chemical, and pulp and paper sectors. In the BLUE Scenario for India, final energy use is approximately 22% lower than in the Baseline Scenario, but still between 2.7 and 3.3 times higher than the 2007 level. Because the production growth far exceeds the savings potential from energy efficiency and other reduction options, in all scenarios the final energy use in 2030 and 2050 will be significantly higher than today.
Box 1: The ETP 2010 scenarios
In the Baseline Scenario for India, total direct industrial CO2 emissions are projected to rise from 413 million tonnes of CO2 (Mt CO2) in 2007 to between 1 568 Mt CO2 and 1 852 Mt CO2 in 2050 (Table 4). In the BLUE Scenario, total industrial CO2 emissions rise by a much lower rate to
The ETP 2010 Baseline Scenario follows the Reference Scenario, outlined in the World Energy Outlook 2009, to 2030, and then extends it to 2050. The Baseline Scenario assumes that governments will not introduce new energy and climate policies. In contrast, the BLUE Scenario (with several variants) is target‐orientated: it sets the goal of halving global energy‐related CO2 emissions by 2050 (compared to 2005 levels). It examines the least‐cost means of achieving that goal through the deployment of existing and new low‐carbon technologies.
These scenarios are not predictions. They are internally consistent analyses of the least‐cost pathways that may be available to meet energy policy objectives, given a certain set of optimistic technology assumptions.
For the industry sector, given the recent global economic crisis and uncertainties about projecting long‐term growth in consumption of materials, a low‐demand and a high‐demand case have been developed for each industry and for all countries analysed. In the five sectors covered in this analysis, the difference in materials demand between the low‐ and high‐demand cases to 2050 varies by between 20% and 50%. As both the BLUE low‐ and high‐demand scenarios aim to achieve the same level of CO2 emissions in 2050, a greater reduction in emissions levels is needed in the high‐demand case than in the low‐demand one. As a result, costs are also higher in the high‐demand case.
The industrial scenarios take an optimistic view of technology development and assume that technologies are adopted as they become cost‐competitive. The analysis does not assess the likelihood of these assumptions being fulfilled. But it is clear that deep cuts in CO2 emissions can only be achieved if all countries play their part, both in seeking to achieve that outcome and in developing and deploying the technologies that can help to bring it about.
Energy Transition for Industry: India and the Global Context © OECD/IEA 2011
Page | 24
between 828 Mt CO2 and 800 Mt CO2 in 2050. Although emissions in the BLUE Scenario are 47% to 51% lower than under the Baseline Scenario, they still represent an increase of 100% to 120% compared to current levels.
Clearly apart from energy efficiency, other measures will be needed to limit the further growth in Indian energy consumption and CO2 emissions, such as fuel and feedstock switching and greater use of recycled materials. These measures can also help to reduce the rapidly rising dependence on oil and gas.
Table 4: India’s direct CO2 emissions by industry, Mt CO2
2007 Baseline – 2050 BLUE – 2050
low-demand high-demand low-demand high-demand
Aluminium 4 14 21 12 16
Cement 128 422 483 275 291
Chemicals and petrochemicals 48 132 173 68 77
Iron and steel 151 703 858 333 362
Pulp and paper 8 36 62 17 31
Other industries 74 256 256 122 129
Total 413 1 563 1 852 828 906
Source: IEA, 2009e; IEA analysis.
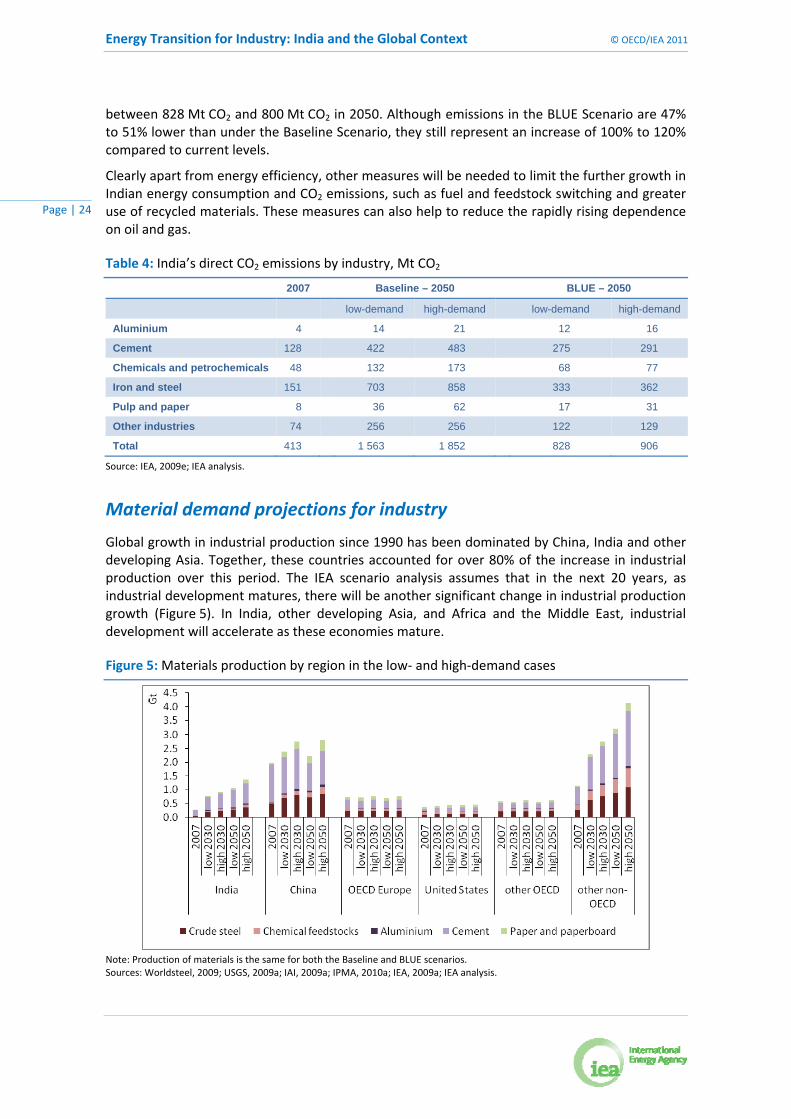
Material demand projections for industry
Global growth in industrial production since 1990 has been dominated by China, India and other developing Asia. Together, these countries accounted for over 80% of the increase in industrial production over this period. The IEA scenario analysis assumes that in the next 20 years, as industrial development matures, there will be another significant change in industrial production growth (Figure 5). In India, other developing Asia, and Africa and the Middle East, industrial development will accelerate as these economies mature.
Figure 5: Materials production by region in the low‐ and high‐demand cases
Note: Production of materials is the same for both the Baseline and BLUE scenarios. Sources: Worldsteel, 2009; USGS, 2009a; IAI, 2009a; IPMA, 2010a; IEA, 2009a; IEA analysis.
© OECD/IEA 2011 Energy Transition for Industry: India and the Global Context
Page | 25
Production in China will flatten or, as in cement production, decline. India’s production of the five key materials covered in this analysis is expected, in the low‐demand case, to be three times higher than the 2007 levels by 2030 and more than four times higher by 2050. In the high‐demand case, production is more than three times higher by 2030 and five times higher by 2050.
Further considerations
The energy efficiency of Indian industry varies widely. Certain sectors and companies are among world leaders in terms of efficiency, such as large‐scale cement kilns and certain ammonia producers. In sectors where there has been a significant increase in production, the capital stock is newer and often plants are larger, which makes installation of energy efficiency equipment often more cost‐effective. In other cases, the efficiency is clearly below world average.
The three largest industrial sectors, (iron and steel, chemicals and petrochemicals, and cement) are responsible for over 25% of India’s overall CO2 emissions and priority should be given to reducing the CO2 intensity in these sectors. Special attention should also focus on coal‐based direct reduced iron (DRI), the pulp and paper‐making process and small‐scale cement kilns. These three areas offer interesting opportunities to increase efficiency and limit the growth in energy consumption. With international support, these industries offer attractive opportunities for the early demonstration of CCS. Broader implementation of sectoral crediting mechanisms could ensure that low‐carbon technologies are also used more widely, which in turn would encourage Indian industries to invest in these technologies. India is taking a step in the right direction by introducing its Perform, Achieve and Trade Scheme – a market‐based mechanism that improves energy efficiency in energy‐intensive large industries and facilities more cost effective by certifying energy savings that could be traded.
Industrial electricity use deserves special attention as it represents 45% of India’s total electricity consumption and the efficiency of power generation is currently low. Industry captive power plants may provide significant potential for improving energy efficiency.
Available feedstock has a number of negative effects on the level of efficiency in Indian industry. Indian coal has a high ash content, which reduces energy efficiency. Small‐scale cement kilns have been built in order to exploit small limestone deposits that could not support large kilns. The lack of accessible or available large forest areas that can support large plants largely explains the small scale of India’s pulp and paper plants. These disadvantages are structural and the only alternative would be to import materials from other countries, which is often a challenge because of the constraints in transportation infrastructure.
Data collection in India needs to be improved. It is not possible to carry out an accurate analysis of energy efficiency and potential savings, as nearly half of industrial energy use is reported in the unspecified industrial category. The fact that no detailed national comprehensive energy statistics exist poses a major constraint and hinders efficient and effective energy policies. Ideally, one single entity should be nominated to develop an energy balance on an annual basis.
The rapid growth in materials demand in India over the next decades is expected to replicate the growth seen in China over the last decade. Such an increase will have a global impact on both resources and CO2 emissions. Given the projected rapid expansion of India’s industrial production, it is of key importance that new investments are based on BAT. Policies are needed to promote the adoption of current BAT and other options such as fuel switching, higher levels of recycling and CCS will need to be deployed to improve energy efficiency and reduce the CO2 intensity of industrial production.

Energy Transition for Industry: India and the Global Context © OECD/IEA 2011
Page | 26
© OECD/IEA 2011 Energy Transition for Industry: India and the Global Context
Page | 27
Chapter 2. Sectoral analysis
Iron and steel
Overview and context
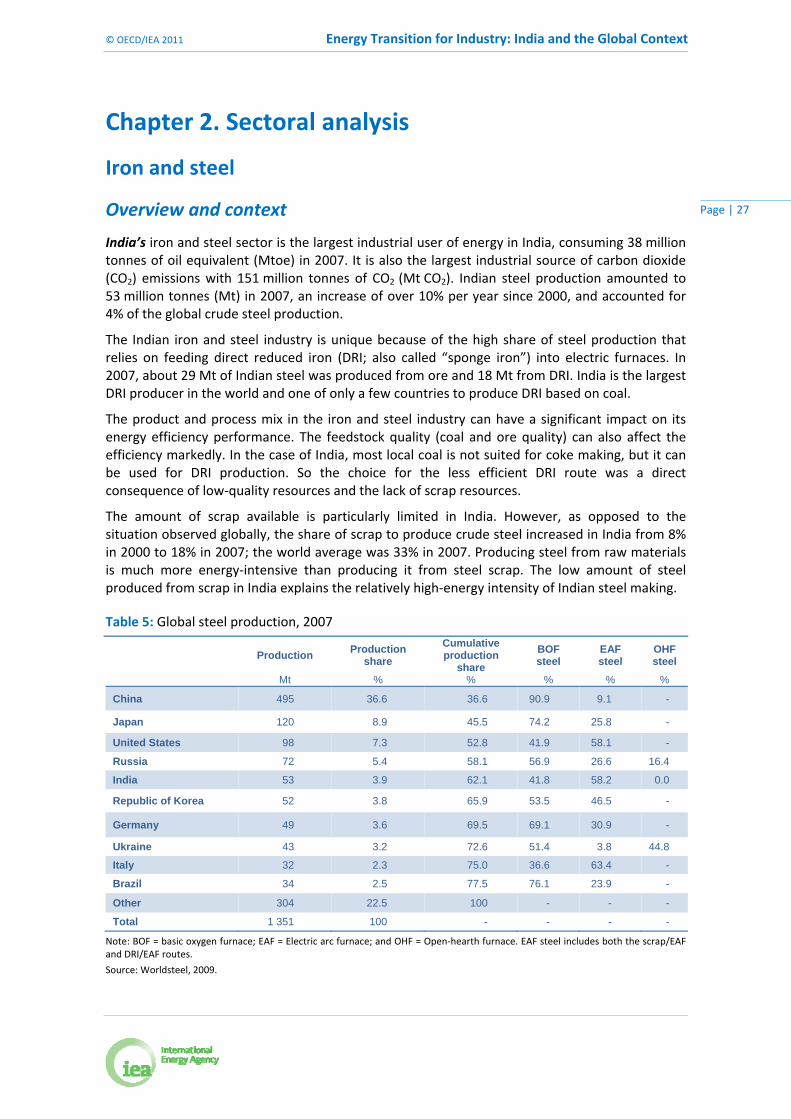
India’s iron and steel sector is the largest industrial user of energy in India, consuming 38 million tonnes of oil equivalent (Mtoe) in 2007. It is also the largest industrial source of carbon dioxide (CO2) emissions with 151 million tonnes of CO2 (Mt CO2). Indian steel production amounted to 53 million tonnes (Mt) in 2007, an increase of over 10% per year since 2000, and accounted for 4% of the global crude steel production.
The Indian iron and steel industry is unique because of the high share of steel production that relies on feeding direct reduced iron (DRI; also called “sponge iron”) into electric furnaces. In 2007, about 29 Mt of Indian steel was produced from ore and 18 Mt from DRI. India is the largest DRI producer in the world and one of only a few countries to produce DRI based on coal.
The product and process mix in the iron and steel industry can have a significant impact on its energy efficiency performance. The feedstock quality (coal and ore quality) can also affect the efficiency markedly. In the case of India, most local coal is not suited for coke making, but it can be used for DRI production. So the choice for the less efficient DRI route was a direct consequence of low‐quality resources and the lack of scrap resources.
The amount of scrap available is particularly limited in India. However, as opposed to the situation observed globally, the share of scrap to produce crude steel increased in India from 8% in 2000 to 18% in 2007; the world average was 33% in 2007. Producing steel from raw materials is much more energy‐intensive than producing it from steel scrap. The low amount of steel produced from scrap in India explains the relatively high‐energy intensity of Indian steel making.
Table 5: Global steel production, 2007
Production
Production share
Cumulative production
share
BOF steel
EAF steel
OHF steel
Mt % % % % %
China 495 36.6 36.6 90.9 9.1 -
Japan 120 8.9 45.5 74.2 25.8 -
United States 98 7.3 52.8 41.9 58.1 -
Russia 72 5.4 58.1 56.9 26.6 16.4
India 53 3.9 62.1 41.8 58.2 0.0
Republic of Korea 52 3.8 65.9 53.5 46.5 -
Germany 49 3.6 69.5 69.1 30.9 -
Ukraine 43 3.2 72.6 51.4 3.8 44.8
Italy 32 2.3 75.0 36.6 63.4 -
Brazil 34 2.5 77.5 76.1 23.9 -
Other 304 22.5 100 - - -
Total 1 351 100 - - - -
Note: BOF = basic oxygen furnace; EAF = Electric arc furnace; and OHF = Open‐hearth furnace. EAF steel includes both the scrap/EAF and DRI/EAF routes.
Source: Worldsteel, 2009.

Energy Transition for Industry: India and the Global Context © OECD/IEA 2011
Page | 28
Globally, the iron and steel sector is the second‐largest industrial user of energy, consuming 616 Mtoe in 2007, and the largest industrial source of CO2 emissions with 2.3 gigatonnes of CO2 (Gt CO2). World crude steel production amounted to 1 351 Mt in 2007 (Worldsteel, 2009). The five most important producers (China, Japan, the United States, Russia and India) account for over 60% of total world crude steel production (Table 5).
While global steel production was nearly constant between 1975 and 2000, it grew by 59% between 2000 and 2007. The rapid expansion of production capacity has generally had a positive effect on the energy efficiency of the industry. Additional capacity has reduced the average age of the capital stock. New plants tend to be more energy‐efficient than old plants, although not all new plants apply the BAT. In addition, energy efficiency equipment has been retrofitted to existing furnaces and ambitious efficiency policies have led to the early closure of inefficient plants in several countries.
But in parallel, recycling as a proportion of total steel production has declined from 47% in 2000 to around 33% in 2007. This decline in scrap use is primarily attributable to the rapid increase in China of using blast furnace/basic oxygen furnace (BF/BOF) technologies, rather than scrap‐intensive electric arc furnaces (EAF), as well as the increasing amount of steel in products still in use.
With a limited amount of scrap available, more crude steel has had to be produced from ore to meet the rapid rise in demand for steel. In 2007, about 950 Mt of steel was produced from ore and 65 Mt from DRI. The rise in the global production of primary materials has resulted in higher energy use per tonne of steel products.
Technology and energy consumption in the iron and steel sector
Steel is produced through a dozen or so processing steps, laid out in various configurations depending on product mix, available raw materials and scrap, energy supply and investment capital. There are three principal modern processing routes:
BF/BOF, based on 70% to 100% ore and the remainder scrap for the iron input.
Scrap/EAF method based on scrap for the iron input.
DRI/EAF method based on iron ore and often scrap for the iron input.
Within these processes, the iron and steel industry has complex flows of energy and materials. Most of the commodities can be sold “over the fence” and some can be shipped long distances. As a consequence, energy use and CO2 emissions across the full production chain may be considerably higher or lower than the site footprint would suggest.
A broad‐based comparison of total sub‐sector energy consumption per tonne of crude steel is of limited use because the production processes are very different. At the very least, the BF/BOF, scrap/EAF and DRI processes need to be treated separately. Even then, there are considerable differences in the energy efficiency of primary steel production among countries and even among individual plants. These differences can be explained by factors such as: economies of scale; the level of waste‐energy recovery; the quality of iron ore; operations know‐how; and quality control.
Given these and additional complicating factors it was decided not to develop a single measure of efficiency in the iron and steel sector but to develop efficiency and explanatory indicators for individual process steps. Two examples are discussed below: coke dry quenching (CDQ) and the use of reducing agents.
The CDQ process quenches carbonised coke using an inert gas. The heat in the gas is used to generate electricity. Therefore CDQ has energy benefits compared to conventional wet quenching. However, the energy benefits compared to advanced wet quenching are not so clear:
© OECD/IEA 2011 Energy Transition for Industry: India and the Global Context
Page | 29
A plant in Germany added air to the CDQ cooling gas to reduce the hydrogen build‐up for safety reasons. This resulted in a burn‐off of about 2% of the coke produced.
Advanced wet quenching is a process that cools the coke from top and bottom, which results in more rapid cooling. This does not result in energy recovery, but it does result in a high‐quality coke that can result in energy savings in the blast furnace.
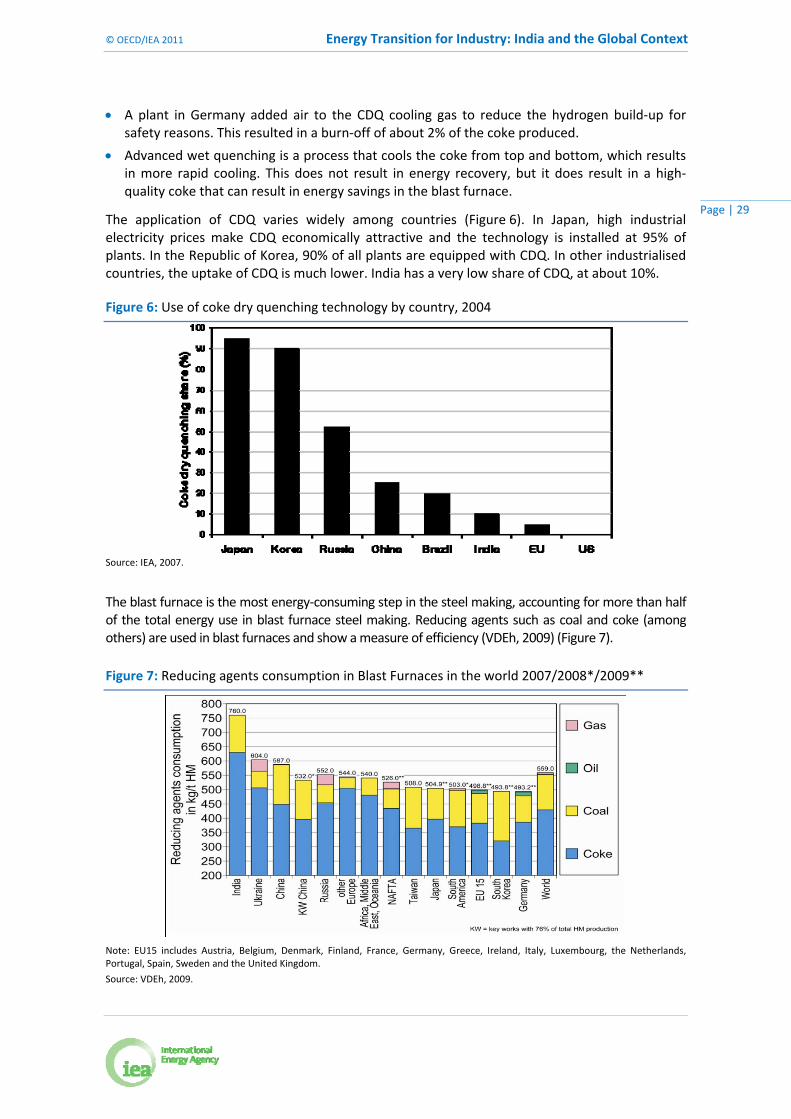
The application of CDQ varies widely among countries (Figure 6). In Japan, high industrial electricity prices make CDQ economically attractive and the technology is installed at 95% of plants. In the Republic of Korea, 90% of all plants are equipped with CDQ. In other industrialised countries, the uptake of CDQ is much lower. India has a very low share of CDQ, at about 10%.
Figure 6: Use of coke dry quenching technology by country, 2004
Source: IEA, 2007.
The blast furnace is the most energy‐consuming step in the steel making, accounting for more than half of the total energy use in blast furnace steel making. Reducing agents such as coal and coke (among others) are used in blast furnaces and show a measure of efficiency (VDEh, 2009) (Figure 7).
Figure 7: Reducing agents consumption in Blast Furnaces in the world 2007/2008*/2009**
Note: EU15 includes Austria, Belgium, Denmark, Finland, France, Germany, Greece, Ireland, Italy, Luxembourg, the Netherlands, Portugal, Spain, Sweden and the United Kingdom.
Source: VDEh, 2009.

Energy Transition for Industry: India and the Global Context © OECD/IEA 2011
Page | 30
The best‐performing region – South America – uses 475 kilogram per tonne of hot metal (kg/thm). On average, India uses 760 kg/thm, which is high compared with other countries. This corresponds with Indian sources (SAIL, 2005) that indicate total energy use for steel making is 60% to 75% above comparable plants in OECD countries. It should be stressed that the energy use for blast furnace steel making has been declining in India. However, the lack of suitable coking coal and the subsequent introduction of DRI processes has counteracted this positive development. Also, many options for waste heat and residual gas recovery are not yet fully used (SAIL, 2005).
Best available technology and technical savings potential
While disaggregated‐level energy data are not currently available to construct detailed indicators, bottom‐up estimates can be made of the energy and CO2 emissions reduction that could be achieved by applying BAT. It is possible to provide a breakdown of the estimated potential of technological efficiency based on current production volumes and current technologies (Figure 8).9
In the case of India, the potential energy savings that could be achieved by applying BATs amount to 7.7 Mtoe, about 20% of the energy use in Indian iron and steel sector. The estimated technical potential in India is slightly lower than that of most industrialised countries. The peculiarities of indigenous resources and industry, such as the high silica and alumina content in iron ore, low‐quality coal and the existence of numerous small‐scale plants, means that these technical savings might be harder to achieve and may be overstated.
Globally, the total potential energy saving is around 133 Mtoe (Figure 8). If achieved, this would result in 421 Mt CO2 avoided, about 19% of total direct CO2 emissions from the iron and steel industry.
Figure 8: Energy savings potential in 2007 for iron and steel, based on BAT
Note: BF = blast furnace; OHF = open‐hearth furnace; BOF = basic oxygen furnace; COG = coke oven gas; and CDQ = coke dry quenching.
9 The IEA strives to improve the quality of the underlying data and to refine the methodologies used in calculating the savings
potential in the industrial sector.

© OECD/IEA 2011 Energy Transition for Industry: India and the Global Context
Page | 31
Although using BATs globally could result in significant energy and CO2 emissions reduction, their potential in the iron and steel sector is limited to around 22% of the global energy. This is considerably less than the energy demand growth that will result from production doubling between 2007 and 2050.
A global net reduction in energy consumption and CO2 emissions will therefore depend on significant innovation strategies to bring new technological solutions on stream well before 2050. Smelting reduction, molten oxide electrolysis (MOE), and the use of waste plastic and hydrogen are among the technologies that should be further developed (IEA, 2009a).
The technical potential in iron and steel for reducing energy consumption is high. However, the economic potential for achieving these savings is significantly lower as it will require re‐building or major refurbishment of plants. In some regions, such as India, with small‐scale production and low‐quality indigenous coal and iron ore, the potential to reduce energy consumption will be particularly difficult to achieve.
Scenario results
In India, energy consumption amounted to 49 kilograms per capita (kg/cap) in 2007, one of the lowest rates in the world as compared to the average global of about 200 kg/cap. The current low per‐capita consumption rate strengthens the argument that the domestic steel industry has enormous growth potential (GoI, 2010). Driven by strong economic development, increased income per capita and population growth, the energy consumption rate is expected to increase to between 200 kg/cap and 250 kg/cap by 2050. To meet this strong domestic demand, crude steel production is estimated to increase from 53 Mt in 2007 to between 266 Mt and 355 Mt in 2050.
Table 6: India’s iron and steel production by scenarios, Mt
2007
Baseline low-demand
Baseline high-demand
BLUE low-demand
BLUE high-demand
2015 2030 2050 2015 2030 2050 2015 2030 2050 2015 2030 2050
Crude Steel 53 131 200 266 169 242 355 131 200 266 169 242 355
EF steel 31 35 72 138 40 84 168 32 43 51 35 43 63
BOF/BF 22 96 128 128 129 158 187 99 157 215 134 199 292
BF pig iron 29 96 128 128 129 158 187 99 150 190 134 184 242
Smelting reduction metal
0 0 0 0 0 0 0 0 7 25 0 15 50
Gas-based DRI
5 7 10 11 8 11 12 8 12 13 9 14 15
Coal-based DRI
13 33 69 120 38 79 143 11 7 2 8 0 0
Scrap 10 24 38 51 31 46 70 25 40 57 32 48 76
India will become the second‐largest producer of steel by 2015 and will remain so throughout the projection period. India’s share of global crude steel production will increase from the current rate of 4% to reach more than 10% in 2050. About 18% of India’s steel production in 2007 was

Energy Transition for Industry: India and the Global Context © OECD/IEA 2011
Page | 32
from recycled steel; this share is estimated to increase to 19% in 2050 in the Baseline Scenario and to 22% in the BLUE Scenario. Under the Baseline Scenario, coal‐based DRI represents a growing share of iron production (Table 6).
The picture that emerges from the BLUE Scenario for India is totally different than that of the Baseline Scenario. The production of coal‐based DRI will be phased out and replaced by production from BF/BOF equipped with carbon capture and storage (CCS). As a result, the production of crude steel from electric furnaces will decrease from 58% in 2007 to less than 20% in 2050.
The large differences in production and process routes used in the two scenarios will have a strong impact on the energy efficiency and CO2 intensity of the iron and steel sector. Under the BLUE Scenario, energy intensity in 2050 will be about 28% lower and CO2 intensity between 53% and 58% lower than under the Baseline Scenario (Figure 9). Applying CCS in blast furnaces explains the greater improvement in CO2 intensity. Despite these important improvements, the intensities in India are expected to remain higher than the world average partly due to the limited recycled steel available and the poor quality of coking coal and iron ore.
Figure 9: Iron and steel energy and direct CO2 intensity for low‐demand scenarios, India and world average
In the Baseline Scenario, iron and steel energy use in India increases from 38 Mtoe in 2007 to 173 Mtoe and 211 Mtoe in the low‐ and high‐demand cases in 2050. Total direct emissions rise 4.7 and 5.7 times, reaching 703 Mt CO2 and 858 Mt CO2.
In the BLUE Scenario, changes in production process and further improvements in energy efficiency significantly reduce energy intensity. But given the expected growth in steel production, energy use will still rise and reach 98 Mtoe and 153 Mtoe in the low‐ and high‐demand cases in 2050. Furthermore, the use of CCS in the BLUE Scenario to reduce CO2 emissions increases energy consumption, offsetting some of the savings from higher energy efficiency that would otherwise be achieved.
CO2 emissions for iron and steel in the BLUE Scenario for India would still be higher than the 2007 level. But compared to the Baseline Scenario, CO2 emissions in 2050 would be 53% lower in the low‐demand case and 58% lower in the high‐demand case (Figure 10). The reduction in CO2 emissions in the BLUE Scenario largely results from technological innovation and efficiency gains, and the introduction of CCS. Total direct emissions reduction amount to 370 Mt CO2 in the low‐demand case and to 496 Mt CO2 in the high‐demand case in 2050. CCS contributes 39% and 47% of the total reduction in 2050 (Figure 10).

© OECD/IEA 2011 Energy Transition for Industry: India and the Global Context
Page | 33
Figure 10: India’s direct CO2 emissions reduction by technology option for iron and steel
Globally, crude steel production is estimated to increase from 1 351 Mt in 2007 to 2 408 Mt in the low‐demand case and 2857 Mt in the high‐demand case in 2050. In both cases, China remains the main crude steel producer, accounting for about 30% of world production in 2050. India, other developing Asia, Africa and the Middle East will have the strongest growth rates; in 2050 between 32% and 35% of all production will be from these countries/regions.
In the BLUE Scenario, total direct CO2 emissions from steel production reach about 1.5 gigatonnes of CO2 (Gt CO2) in 2050. This represents a decrease of about 35% to 37% in direct CO2 emissions compared to 2007. Initially, reduction from recycling dominates (Figure 11). From 2020 onwards, fuel switching and CCS start to play a more important role. Total direct emissions reduction amount to 1.6 Gt CO2 in the low‐demand case and to 2.1 Gt CO2 in the high‐demand case in 2050. Production from recycled steel in the BLUE Scenario is expected to rise from 444 Mt in 2007 to 1 207 Mt and 1 470 Mt in 2050.
Figure 11: Global direct CO2 emissions reduction by technology option for iron and steel
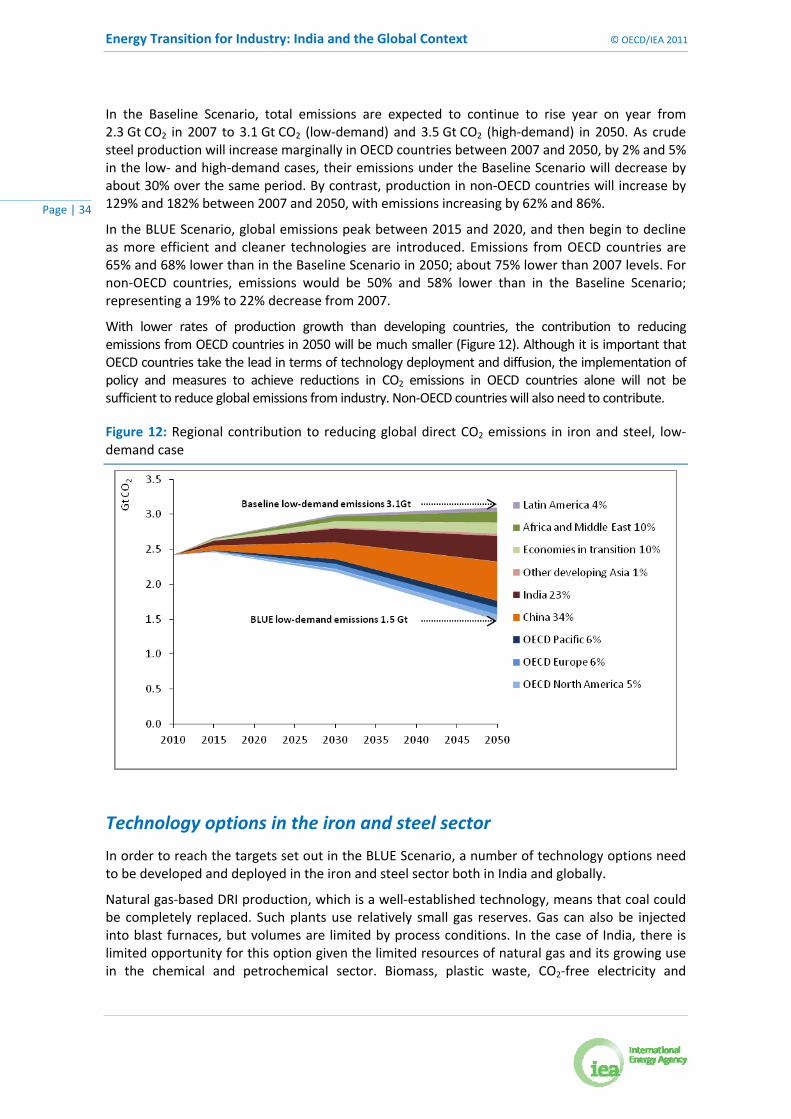
Energy Transition for Industry: India and the Global Context © OECD/IEA 2011
Page | 34
In the Baseline Scenario, total emissions are expected to continue to rise year on year from 2.3 Gt CO2 in 2007 to 3.1 Gt CO2 (low‐demand) and 3.5 Gt CO2 (high‐demand) in 2050. As crude steel production will increase marginally in OECD countries between 2007 and 2050, by 2% and 5% in the low‐ and high‐demand cases, their emissions under the Baseline Scenario will decrease by about 30% over the same period. By contrast, production in non‐OECD countries will increase by 129% and 182% between 2007 and 2050, with emissions increasing by 62% and 86%.
In the BLUE Scenario, global emissions peak between 2015 and 2020, and then begin to decline as more efficient and cleaner technologies are introduced. Emissions from OECD countries are 65% and 68% lower than in the Baseline Scenario in 2050; about 75% lower than 2007 levels. For non‐OECD countries, emissions would be 50% and 58% lower than in the Baseline Scenario; representing a 19% to 22% decrease from 2007.
With lower rates of production growth than developing countries, the contribution to reducing emissions from OECD countries in 2050 will be much smaller (Figure 12). Although it is important that OECD countries take the lead in terms of technology deployment and diffusion, the implementation of policy and measures to achieve reductions in CO2 emissions in OECD countries alone will not be sufficient to reduce global emissions from industry. Non‐OECD countries will also need to contribute.
Figure 12: Regional contribution to reducing global direct CO2 emissions in iron and steel, low‐demand case
Technology options in the iron and steel sector
In order to reach the targets set out in the BLUE Scenario, a number of technology options need to be developed and deployed in the iron and steel sector both in India and globally.
Natural gas‐based DRI production, which is a well‐established technology, means that coal could be completely replaced. Such plants use relatively small gas reserves. Gas can also be injected into blast furnaces, but volumes are limited by process conditions. In the case of India, there is limited opportunity for this option given the limited resources of natural gas and its growing use in the chemical and petrochemical sector. Biomass, plastic waste, CO2‐free electricity and

© OECD/IEA 2011 Energy Transition for Industry: India and the Global Context
Page | 35
hydrogen are other future options. The deployment milestones indicate some of the main technology assumptions in the BLUE Scenario (Table 7).
Table 7: Technology options for the iron and steel industry
Technology R&D needs Demonstration needs Deployment milestones
Smelting reduction Improve heat exchange in FINEX*
New configuration of HIsmelt** to lower coal consumption
Integration of HIsmelt and Isarna*** processes (Hisarna). Pilot plantis under construction
Paired straight hearth furnace
Demonstration plants already operational for FINEX and HIsmelt
Demonstration plant for producing reduced pellets operational by 2015
Demonstration plant with smelter by 2020
In India, share rise to between 9% and 14% in 2050
Globally, share rise to between 5% and 8% in 2050
Top-gas recycling blast furnace
Trial on existing experimental furnace successful
Commercial scale demonstration – small blast furnace – by 2014
Full scale demonstration plant by 2016
Deployment in 2020
Contribute to a 40% decrease between 2007 and 2050 in coke needs in India
Use of charcoal and waste plastic
Proven technologies
Research needs to focus on improving the mechanical stability of charcoal
No use of biomass and waste in India
Between 36 Mtoe and 66 Mtoe of charcoal and waste plastic used globally in 2050
Production of iron by molten oxide electrolysis
Assessment of technical feasibility and optimum operating parameters
If the laboratory-scale project is successful, demonstration may start in the next 15 to 20 years
Deployment after 2035
Marginal market share in India by 2050
Hydrogen smelting Assessment of technical feasibility and optimum operating parameters
If the laboratory-scale project is successful, demonstration may start in the next 15 to 20 years
Deployment after 2035
Marginal market share in India by 2050
CCS for blast furnaces Research focusing on reducing the energy used in capture
2015–20
75% to 90% of all new plants built between 2030 and 2050 equipped with CCS
CCS for DRI 2015–20
75% to 90% of all new plants built between 2030 and 2050 equipped with CCS
CCS for smelting reduction
2020–30 75% to 90% of all new plants built between 2030 and 2050 equipped with CCS
Notes: *FINEX is a smelting reduction process developed by Pohang Iron and Steel Company (POSCO), which consists of a melting furnace with a liquid iron bath in which coal is injected and a cascade of fluidised bed reactors for the pre‐reduction of iron fines.
**HIsmelt (high‐intensity smelting) is an iron bath reactor process.
***Isarna is a smelting reduction technology under development by the consortium ULCOS. It is a highly energy‐efficient iron‐making process based on direct smelting of iron‐ore fines using a smelting cyclone in combination with a coal‐based smelter. All process steps are directly hot‐coupled, avoiding energy losses from intermediate treatment of materials and process gases.

Energy Transition for Industry: India and the Global Context © OECD/IEA 2011
Page | 36
Cement
Overview and context
India’s cement industry is the third‐largest industrial energy consumer and second‐largest CO2 emitter in the country’s industrial sector. India, which is the second‐largest cement producer in the world, has seen its annual production rise from 95 Mt in 2000 to 170 Mt in 2007. The main factors prompting this growth include: the real estate boom during 2004–08; increased investments in infrastructure by both the private sector and government; and higher governmental spending under various social programmes (GoI, 2010b).
The Indian cement industry comprises 148 large and 365 mini cement plants, with average installed capacities of 219 Mt and 11 Mt respectively as of March 2009 (CMA, 2010). The majority of large kilns are among the most energy efficient in the world. The total installed capacity of large kilns has increased by 42% since 2005 (IBEF, 2009).
India has a clinker‐to‐cement ratio of 0.84 i.e. 0.84 tonnes of clinker are used per tonne of cement produced. In comparison, China has a clinker‐to‐cement ratio of about 0.74 and the world average is 0.79. A low clinker‐cement ratio contributes significantly to lower energy use per tonne of cement.
In 2007, India used about 3.2 gigajoules of energy per tonne (GJ/t) of cement, compared with 3.0 GJ/t cement for the most energy efficient country (Japan) and a world average of 3.6 GJ/t cement. The energy intensity of India’s cement industry has improved by 1.5% per year in the last 15 years. India uses about 78 kilowatt‐hours (kWh) of electricity per tonne of cement. This value is the lowest in the world and even lower than the estimated BAT value of 95 kWh/t to 100 kWh/t cement. It is not verifiable if stand‐alone grinding stations and small kilns are included in the data. Nevertheless, based on the technology characteristics and data available from large cement producers, the energy efficiency of India’s cement production and the electricity intensity are clearly better than the world average.
Table 8: Global cement production, 2007
Production (Mt/yr)
Production share (%)
Cumulative production share (%)
China 1 354 48.8 48.8
India 170 6.1 54.9
United States 97 3.5 58.4
Japan 68 2.4 60.9
Russia 60 2.2 63.0
Korea 57 2.1 65.1
Spain 55 2.0 67.1
Turkey 50 1.8 68.8
Italy 48 1.7 70.6
Brazil 46 1.7 72.2
World 2 774 100
Source: USGS, 2009a.
Globally, the cement sector is the third‐largest energy consumer in industry and the second‐largest CO2 emitter. Although energy intensity per tonne of product is less than that of other energy‐intensive materials such as aluminium and steel, the volume of production is much
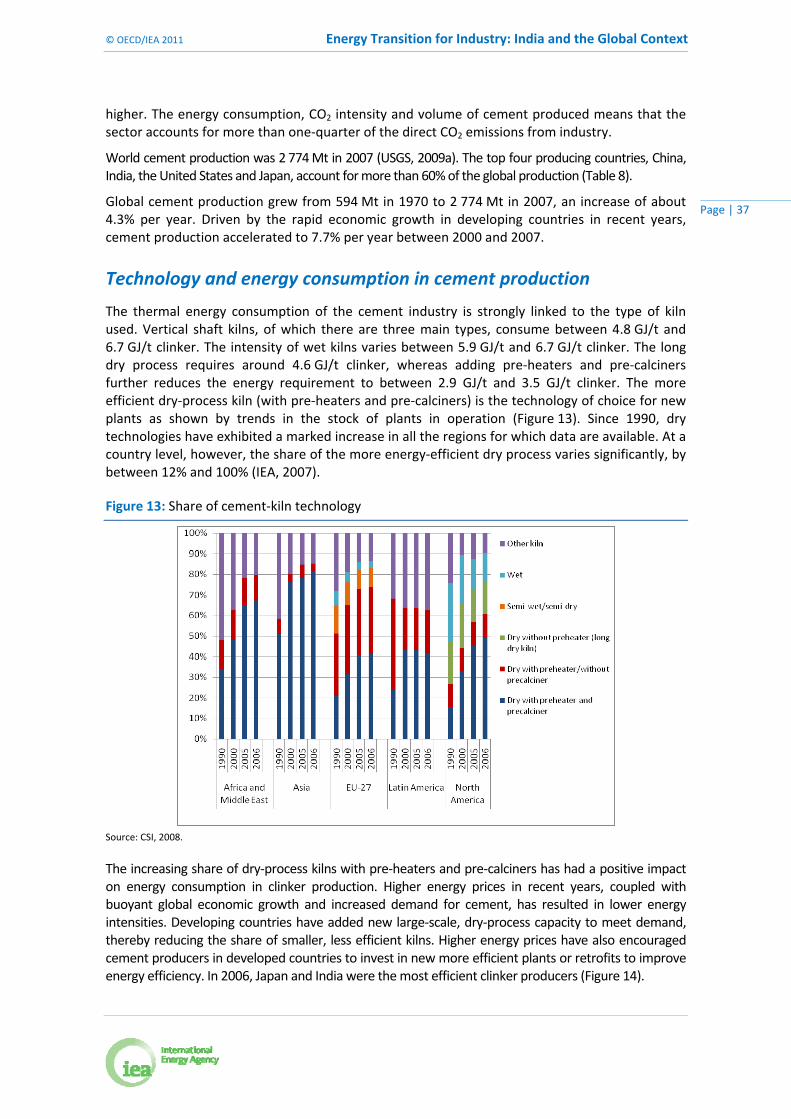
© OECD/IEA 2011 Energy Transition for Industry: India and the Global Context
Page | 37
higher. The energy consumption, CO2 intensity and volume of cement produced means that the sector accounts for more than one‐quarter of the direct CO2 emissions from industry.
World cement production was 2 774 Mt in 2007 (USGS, 2009a). The top four producing countries, China, India, the United States and Japan, account for more than 60% of the global production (Table 8).
Global cement production grew from 594 Mt in 1970 to 2 774 Mt in 2007, an increase of about 4.3% per year. Driven by the rapid economic growth in developing countries in recent years, cement production accelerated to 7.7% per year between 2000 and 2007.
Technology and energy consumption in cement production
The thermal energy consumption of the cement industry is strongly linked to the type of kiln used. Vertical shaft kilns, of which there are three main types, consume between 4.8 GJ/t and 6.7 GJ/t clinker. The intensity of wet kilns varies between 5.9 GJ/t and 6.7 GJ/t clinker. The long dry process requires around 4.6 GJ/t clinker, whereas adding pre‐heaters and pre‐calciners further reduces the energy requirement to between 2.9 GJ/t and 3.5 GJ/t clinker. The more efficient dry‐process kiln (with pre‐heaters and pre‐calciners) is the technology of choice for new plants as shown by trends in the stock of plants in operation (Figure 13). Since 1990, dry technologies have exhibited a marked increase in all the regions for which data are available. At a country level, however, the share of the more energy‐efficient dry process varies significantly, by between 12% and 100% (IEA, 2007).
Figure 13: Share of cement‐kiln technology
Source: CSI, 2008.
The increasing share of dry‐process kilns with pre‐heaters and pre‐calciners has had a positive impact on energy consumption in clinker production. Higher energy prices in recent years, coupled with buoyant global economic growth and increased demand for cement, has resulted in lower energy intensities. Developing countries have added new large‐scale, dry‐process capacity to meet demand, thereby reducing the share of smaller, less efficient kilns. Higher energy prices have also encouraged cement producers in developed countries to invest in new more efficient plants or retrofits to improve energy efficiency. In 2006, Japan and India were the most efficient clinker producers (Figure 14).

Energy Transition for Industry: India and the Global Context © OECD/IEA 2011
Page | 38
Figure 14: Thermal energy consumption per tonne of clinker
Note: Care must be taken in interpreting the absolute values of data in this figure, given the possibility that different system boundaries and measurement methods (low‐ or high‐heating value) may have been used. The Japanese method of calculating net energy consumption per tonne of clinker yields a value 2.94 GJ/t clinker for 2006. The data for Japan have a break in the time series for clinker production in 2000 when a different definition of clinker was adopted.
Sources: CSI, 2008; Soares and Tolmasquim, 2000; Worrell et al., 2001; IBGE, 2008; EEA, 2006; AITEC, 2008; USGS, 2008c; PCA, 2008; NRCan, 2008; JCA, 2006 and METI, 2008; OFICEMEN, 2007; Siam Cement Company Ltd., 2005; INEGI, 2008; VDZ, 2008; Battelle, 2002; LBNL, IEA and Tshinghua University estimates.
Best available technology and technical savings potential
Current BAT for the cement industry is a dry‐process kiln with pre‐heater and pre‐calciner. Up to six stages of pre‐heating can be used if the raw material feed has a low‐moisture content (<6%; VDZ, 2008), although a five‐stage pre‐heater is the norm in Europe for new plants. BAT for six‐stage pre‐heater and pre‐calciner kilns is in the range of 2.9 GJ/t and 3.3 GJ/t clinker. For five‐stage pre‐heater and pre‐calciner kilns, this range is between 3.1 GJ/t and 3.5 GJ/t clinker. BAT for electricity consumption in the cement industry depends on the type of plant, but is assumed to be in the range of 95 kWh/t to 100 kWh/t cement. The increased use of alternative fuels, however, tends to increase electricity consumption for pre‐treatment and handling.
India has one of the lowest potential for reducing its energy efficiency by applying BAT in cement. Over two‐thirds of this potential lies in the increased use of fly ash and other clinker substitutes as the current energy intensity for many plants are among the most efficient in the world. The potential for saving energy in India’s cement sector by applying current BAT and increasing the clinker substitutes is an estimated 18% from current levels.
Globally, if all plants were BAT, assuming an average fuel need of 3.2 GJ/t clinker, 42 Mtoe of thermal fuel use could be saved. Shifting to BAT for electricity consumption would achieve savings of around 5.2 Mtoe or 61 terawatt‐hours (TWh). Taking into account all the potentials, the global intensity of cement production could be reduced by 0.9 GJ/t cement produced, with significantly higher savings possible in many countries and regions (Figure 15).10
10 The calculation of potential savings is based on the assumption that the energy efficiency of cement kilns is improved first, so that subsequent savings
are evaluated relative to the BAT and energy savings from clinker substitutes are based on the BAT level of energy consumption. An alternative approach would have been to assess the savings from clinker substitutes at current energy efficiencies and then assess the BAT savings from the lower level of clinker demand. This approach would have yielded a slightly lower share of savings from energy efficiency and slightly more from clinker substitutes.
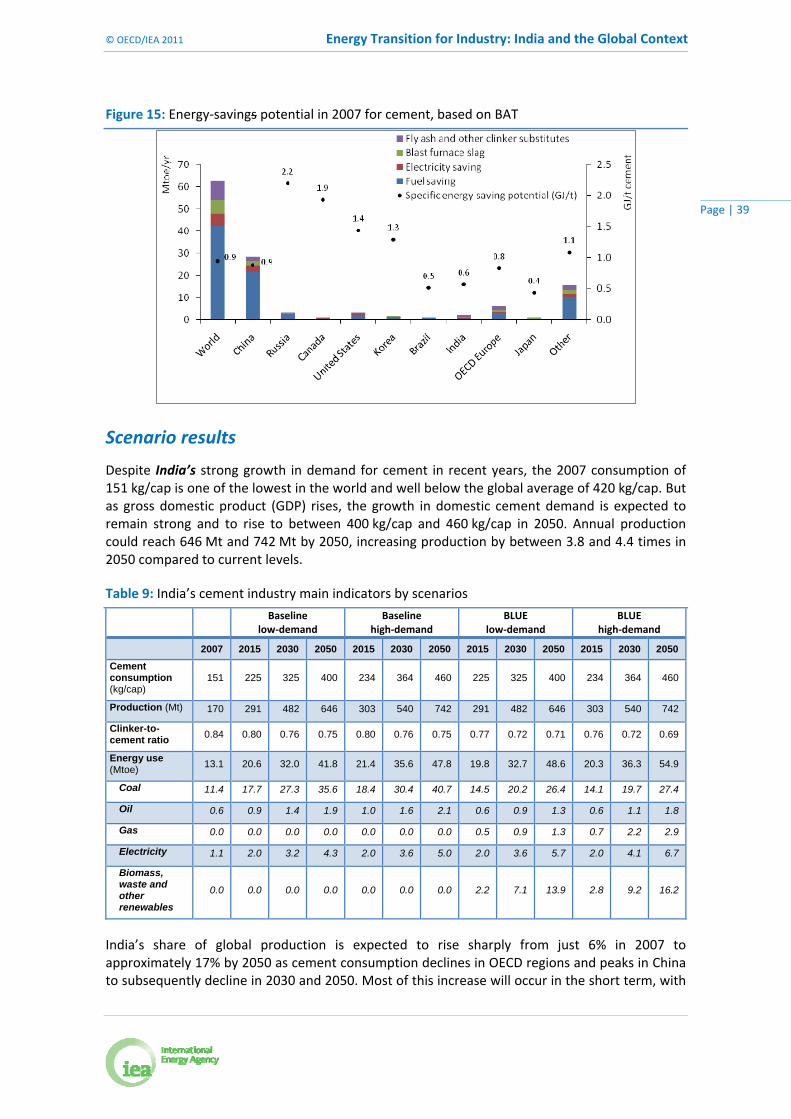
© OECD/IEA 2011 Energy Transition for Industry: India and the Global Context
Page | 39
Figure 15: Energy‐savings potential in 2007 for cement, based on BAT
Scenario results
Despite India’s strong growth in demand for cement in recent years, the 2007 consumption of 151 kg/cap is one of the lowest in the world and well below the global average of 420 kg/cap. But as gross domestic product (GDP) rises, the growth in domestic cement demand is expected to remain strong and to rise to between 400 kg/cap and 460 kg/cap in 2050. Annual production could reach 646 Mt and 742 Mt by 2050, increasing production by between 3.8 and 4.4 times in 2050 compared to current levels.
Table 9: India’s cement industry main indicators by scenarios
Baseline low‐demand
Baselinehigh‐demand
BLUElow‐demand
BLUE high‐demand
2007 2015 2030 2050 2015 2030 2050 2015 2030 2050 2015 2030 2050
Cement consumption (kg/cap)
151 225 325 400 234 364 460 225 325 400 234 364 460
Production (Mt) 170 291 482 646 303 540 742 291 482 646 303 540 742
Clinker-to-cement ratio
0.84 0.80 0.76 0.75 0.80 0.76 0.75 0.77 0.72 0.71 0.76 0.72 0.69
Energy use (Mtoe)
13.1 20.6 32.0 41.8 21.4 35.6 47.8 19.8 32.7 48.6 20.3 36.3 54.9
Coal 11.4 17.7 27.3 35.6 18.4 30.4 40.7 14.5 20.2 26.4 14.1 19.7 27.4
Oil 0.6 0.9 1.4 1.9 1.0 1.6 2.1 0.6 0.9 1.3 0.6 1.1 1.8
Gas 0.0 0.0 0.0 0.0 0.0 0.0 0.0 0.5 0.9 1.3 0.7 2.2 2.9
Electricity 1.1 2.0 3.2 4.3 2.0 3.6 5.0 2.0 3.6 5.7 2.0 4.1 6.7
Biomass, waste and other renewables
0.0 0.0 0.0 0.0 0.0 0.0 0.0 2.2 7.1 13.9 2.8 9.2 16.2
India’s share of global production is expected to rise sharply from just 6% in 2007 to approximately 17% by 2050 as cement consumption declines in OECD regions and peaks in China to subsequently decline in 2030 and 2050. Most of this increase will occur in the short term, with

Energy Transition for Industry: India and the Global Context © OECD/IEA 2011
Page | 40
consumption increasing by 7.0% to 7.5% per year between 2007 and 2015. India will remain the second‐largest producer of cement throughout the period from 2007 to 2050.
Two main differences can be observed between India’s Baseline and the BLUE scenarios. The clinker‐to‐cement ratio in the Baseline Scenario will be about 11% lower in 2050 than in 2007 and will reach 0.75. In the BLUE Scenario, the ratio will reduce even further to reach about 0.70 in 2050 (Table 9).
The second difference relates to the mix of energy sources used to produce Indian cement. In the Baseline Scenario, the energy mix remains fairly unchanged between 2007 and 2050. In the BLUE Scenario, the share of coal decreases substantially from 85% in 2007 to about 50% in 2050. The use of biomass and alternative fuels will increase to reach almost 30% of total energy consumption by 2050.
The energy intensity of India’s cement production in the Baseline Scenario improves from the current level of 3.2 GJ/t cement to 2.7 GJ/t cement in 2050. However, in the BLUE Scenario low‐demand case, the intensity will be 3.2 GJ/t cement and for the high‐demand case 3.1 GJ/t cement in 2050. The reason for this is that the lower energy consumption arising from the increased use of clinker substitutes is offset by applying CCS that requires additional energy. As a result, energy use in the BLUE Scenario will be about 15% higher than in the Baseline Scenario in 2050. But even under the BLUE Scenario, India remains one of the most efficient countries in the world as energy intensity also increases in most other countries.
Figure 16: Cement direct CO2 intensity in India and world average
The trend is noticeably different when considering CO2 emissions intensity (Figure 16). In the Baseline Scenario, the trends in CO2 intensity are similar to the trends observed in energy intensity. However, in the BLUE Scenario, the CO2 intensity is 35% and 40% lower than in the Baseline Scenario despite the higher energy intensity. The results of the BLUE Scenario are attributable to the change in the fuel mix and the wide application of CCS.
As most energy efficiency improvements are part of the Baseline Scenario, little emissions reduction could be achieved through further efficiency improvements under a BLUE Scenario. It is nevertheless possible for India to reduce its CO2 emissions by 35% to 40% below the Baseline Scenario. About 60% of the reduction comes from the use of CCS and 25% from the increased use of alternative fuels and other fuel switching (Figure 17).

© OECD/IEA 2011 Energy Transition for Industry: India and the Global Context
Page | 41
Figure 17: India’s direct CO2 emissions reduction by technology option for cement
Global cement production is estimated to increase from 2 774 Mt in 2007 to 3 817 Mt and 4 586 Mt in 2050 in the low‐ and high‐demand cases of both scenarios. In both cases, China remains the main cement producer. Between 2007 and 2050, all the growth in cement production will come from non‐OECD countries; production from OECD countries will slightly decrease between 2007 and 2050 in the low‐demand and increase by only 8% in the high‐demand case, reflecting the fact that many OECD countries are projected to experience a decline in population between 2030 and 2050. Cement production will more than triple between 2007 and 2050 in India and other developing Asia and Africa, with the result that about 45% of all production in 2050 will be from these countries/regions.
Direct CO2 emissions will continue to rise year‐on‐year in the Baseline Scenario. In the BLUE Scenario, emissions will also increase in the short run, but at a slower pace than in the Baseline Scenario. By 2050, through greater energy efficiency, increased use of clinker substitutes and alternative fuels, as well as the application of CCS, direct CO2 emissions in 2050 in the BLUE Scenario will be 35% to 45% lower than in the Baseline Scenario.
The breakdown of savings in the BLUE Scenario compared to the Baseline Scenario is shown in Figure 18. Efficiency improvements in the BLUE Scenario over and above the Baseline Scenario achieve their maximum effect in 2030. Thereafter, their contribution to savings declines, as the Baseline Scenario already assumes that most of the available energy efficiency options will have been implemented by 2050. CCS dominates total savings by 2050, accounting for more than half the reduction below the Baseline Scenario by that time. CCS is essential to reduce CO2 emissions below the current level.
The regional trends in CO2 emissions vary considerably, with China, OECD Europe and OECD Pacific seeing their emissions decrease, while India’s emissions more than triple. These emission trends are consistent with the production trends. Overall, direct CO2 emissions in 2050 would be 23% and 47% higher in the Baseline low‐ and high‐demand cases than in 2007.
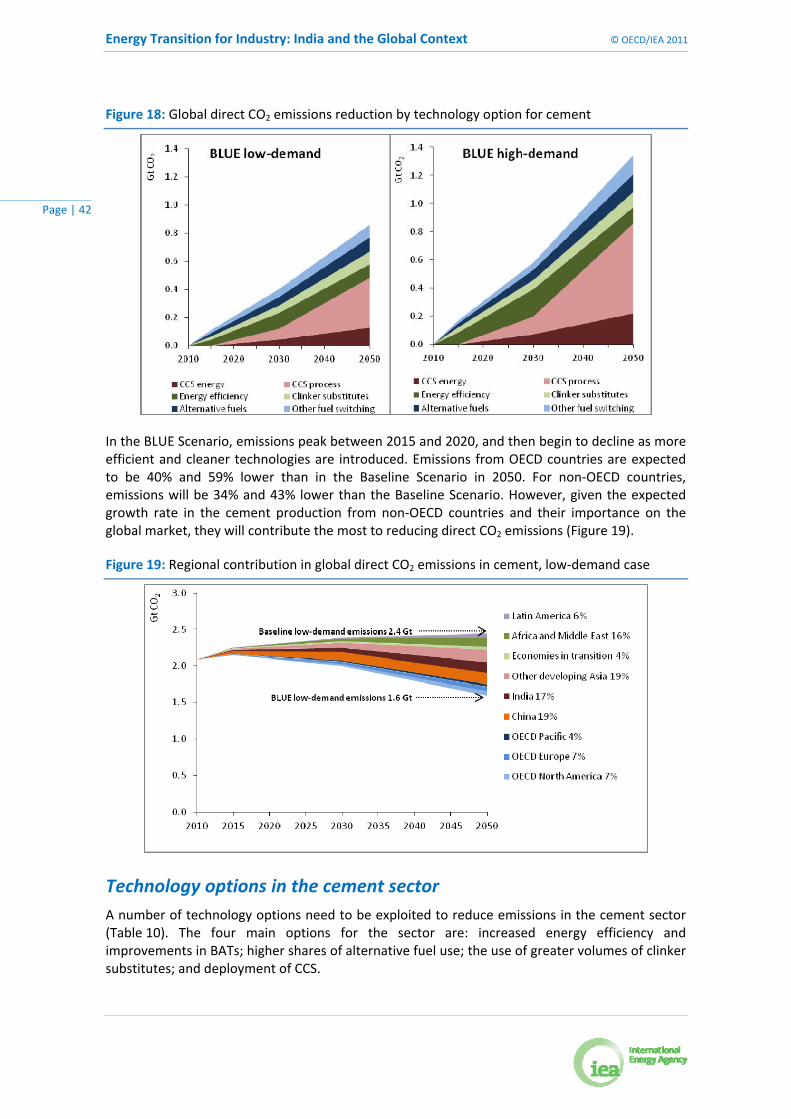
Energy Transition for Industry: India and the Global Context © OECD/IEA 2011
Page | 42
Figure 18: Global direct CO2 emissions reduction by technology option for cement
In the BLUE Scenario, emissions peak between 2015 and 2020, and then begin to decline as more efficient and cleaner technologies are introduced. Emissions from OECD countries are expected to be 40% and 59% lower than in the Baseline Scenario in 2050. For non‐OECD countries, emissions will be 34% and 43% lower than the Baseline Scenario. However, given the expected growth rate in the cement production from non‐OECD countries and their importance on the global market, they will contribute the most to reducing direct CO2 emissions (Figure 19).
Figure 19: Regional contribution in global direct CO2 emissions in cement, low‐demand case
Technology options in the cement sector
A number of technology options need to be exploited to reduce emissions in the cement sector (Table 10). The four main options for the sector are: increased energy efficiency and improvements in BATs; higher shares of alternative fuel use; the use of greater volumes of clinker substitutes; and deployment of CCS.
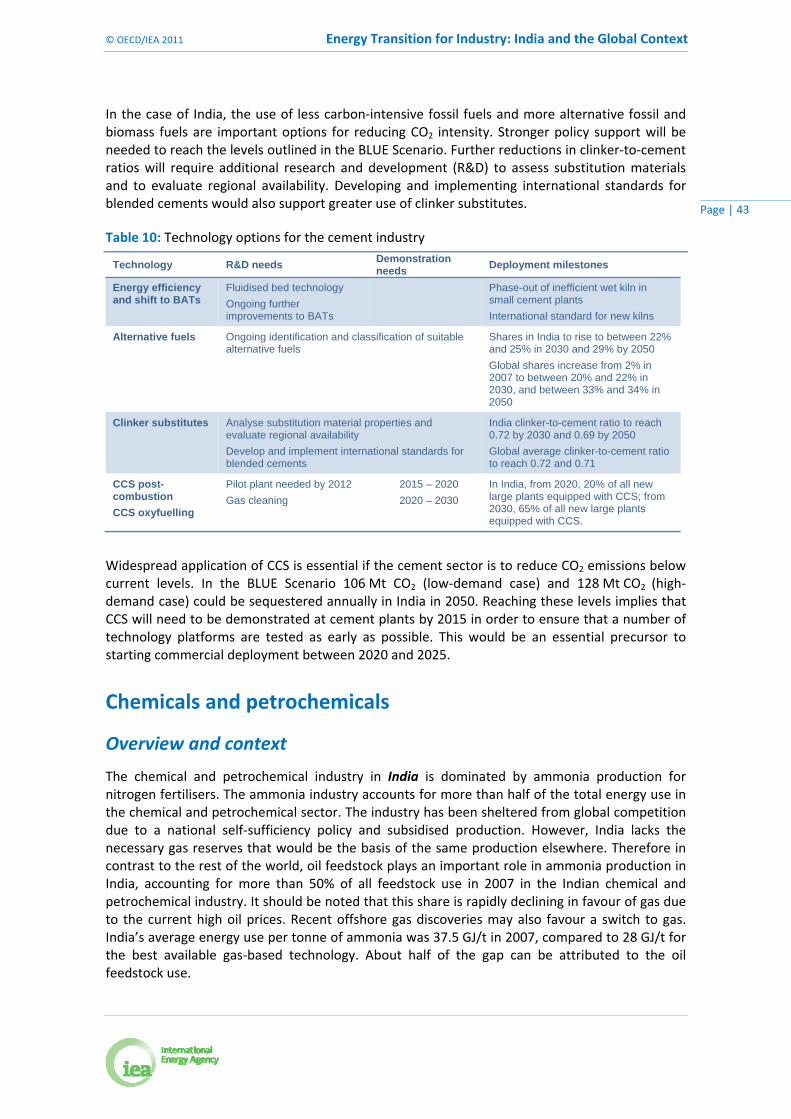
© OECD/IEA 2011 Energy Transition for Industry: India and the Global Context
Page | 43
In the case of India, the use of less carbon‐intensive fossil fuels and more alternative fossil and biomass fuels are important options for reducing CO2 intensity. Stronger policy support will be needed to reach the levels outlined in the BLUE Scenario. Further reductions in clinker‐to‐cement ratios will require additional research and development (R&D) to assess substitution materials and to evaluate regional availability. Developing and implementing international standards for blended cements would also support greater use of clinker substitutes.
Table 10: Technology options for the cement industry
Technology R&D needs Demonstration needs
Deployment milestones
Energy efficiency and shift to BATs
Fluidised bed technology
Ongoing further improvements to BATs
Phase-out of inefficient wet kiln in small cement plants
International standard for new kilns
Alternative fuels Ongoing identification and classification of suitable alternative fuels
Shares in India to rise to between 22% and 25% in 2030 and 29% by 2050
Global shares increase from 2% in 2007 to between 20% and 22% in 2030, and between 33% and 34% in 2050
Clinker substitutes Analyse substitution material properties and evaluate regional availability
Develop and implement international standards for blended cements
India clinker-to-cement ratio to reach 0.72 by 2030 and 0.69 by 2050
Global average clinker-to-cement ratio to reach 0.72 and 0.71
CCS post-combustion
CCS oxyfuelling
Pilot plant needed by 2012
Gas cleaning
2015 – 2020
2020 – 2030
In India, from 2020, 20% of all new large plants equipped with CCS; from 2030, 65% of all new large plants equipped with CCS.
Widespread application of CCS is essential if the cement sector is to reduce CO2 emissions below current levels. In the BLUE Scenario 106 Mt CO2 (low‐demand case) and 128 Mt CO2 (high‐demand case) could be sequestered annually in India in 2050. Reaching these levels implies that CCS will need to be demonstrated at cement plants by 2015 in order to ensure that a number of technology platforms are tested as early as possible. This would be an essential precursor to starting commercial deployment between 2020 and 2025.
Chemicals and petrochemicals
Overview and context
The chemical and petrochemical industry in India is dominated by ammonia production for nitrogen fertilisers. The ammonia industry accounts for more than half of the total energy use in the chemical and petrochemical sector. The industry has been sheltered from global competition due to a national self‐sufficiency policy and subsidised production. However, India lacks the necessary gas reserves that would be the basis of the same production elsewhere. Therefore in contrast to the rest of the world, oil feedstock plays an important role in ammonia production in India, accounting for more than 50% of all feedstock use in 2007 in the Indian chemical and petrochemical industry. It should be noted that this share is rapidly declining in favour of gas due to the current high oil prices. Recent offshore gas discoveries may also favour a switch to gas. India’s average energy use per tonne of ammonia was 37.5 GJ/t in 2007, compared to 28 GJ/t for the best available gas‐based technology. About half of the gap can be attributed to the oil feedstock use.
Energy Transition for Industry: India and the Global Context © OECD/IEA 2011
Page | 44
Petrochemical production in India is relatively small. The production capacity for ethylene amounted to 3.2 Mt in 2007, 13% ethane based, 9% propane based and 78% naphtha based. Ethane and propane crackers tend to be less energy efficient than naphtha crackers. Chlorine production amounted to 1.7 Mt in 2003/04, 29% of which is based on the less energy efficient mercury process and the other 71% based on the membrane process. Soda ash production amounted to 2.2 Mt in 2003/04 (TERI, 2006). High‐value chemicals (HVC) production amounted to 10.4 Mt in 2007. India is the second‐largest producer of ammonia with a production of 13.4 Mt, which accounts for 8% of global production.
Globally, the use of energy and feedstock in the chemical and petrochemical sector accounted for approximately 10% of worldwide final energy demand in 2007, equivalent to 880 Mtoe.11 It is the largest energy‐consuming sector in industry, accounting for approximately 30% of the total industrial final energy demand. The process energy requirements of the chemical and petrochemical sector generated approximately 1.3 Gt CO2, excluding indirect emissions from electricity use and from the treatment of post‐consumer waste (for example, from the incineration of plastics).
It is difficult to measure the physical production of the organic chemical industry given the large number of intermediate products that are traded at all levels of production. Some information is, however, available for some products. Polymer production represents both the largest and the fastest‐growing segment of the chemical and petrochemical sector, representing approximately 75% of the total physical production and rising nearly 6% per year to approximately 300 Mt in 2006 (PlasticsEurope, 2008; SRI Consulting, 2008). While growth has levelled off in some industrialised countries, polymer production in China and some other emerging economies has continued to increase rapidly. However, worldwide growth has been negatively affected by the recent global economic turmoil.
Technology and energy consumption in the chemical and petrochemical sector
Given the scale of most chemical and petrochemical plants, it is more appropriate to analyse potential improvements in energy efficiency by referring to the most advanced technologies that are currently in use at industrial scale, in other words best practice technology (BPT). BPT is generally, by definition, economically viable.
The potential to improve energy efficiency in the chemical and petrochemical sector is established by comparing fuel use (including steam) statistics from the IEA energy balance with the BPT values for each of the 57 processes covered (these values, covering 66 products, are provided in Annex B).12 The values for the most important chemicals (olefins, aromatics, ammonia and several intermediates) come from an analysis of the BPTs in Europe (Schyns, 2006), rather than world wide (worldwide BPT values are not available).13
Energy improvement potential for the chemical and petrochemical sector is shown in Table 11. Process energy and feedstock uses are combined in this analysis to remove the uncertainties caused by different countries adopting different definitions for the individual components in their
11 Final process energy is the total demand for fuel (excluding feedstock energy), steam use and electricity. Final energy is the sum of
final process energy and feedstock energy. 12 Steam cracking and aromatics extraction are counted as one process each. Methanol production from natural gas and coal is
counted as two processes. Ammonia production from natural gas, oil and coal is counted as three processes. The production of resins, fibres and rubber products are counted as individual processes. 13 Synthetic rubber is an exception: for confidentiality reasons the BPT data used refer to the global situation, but not to Europe.
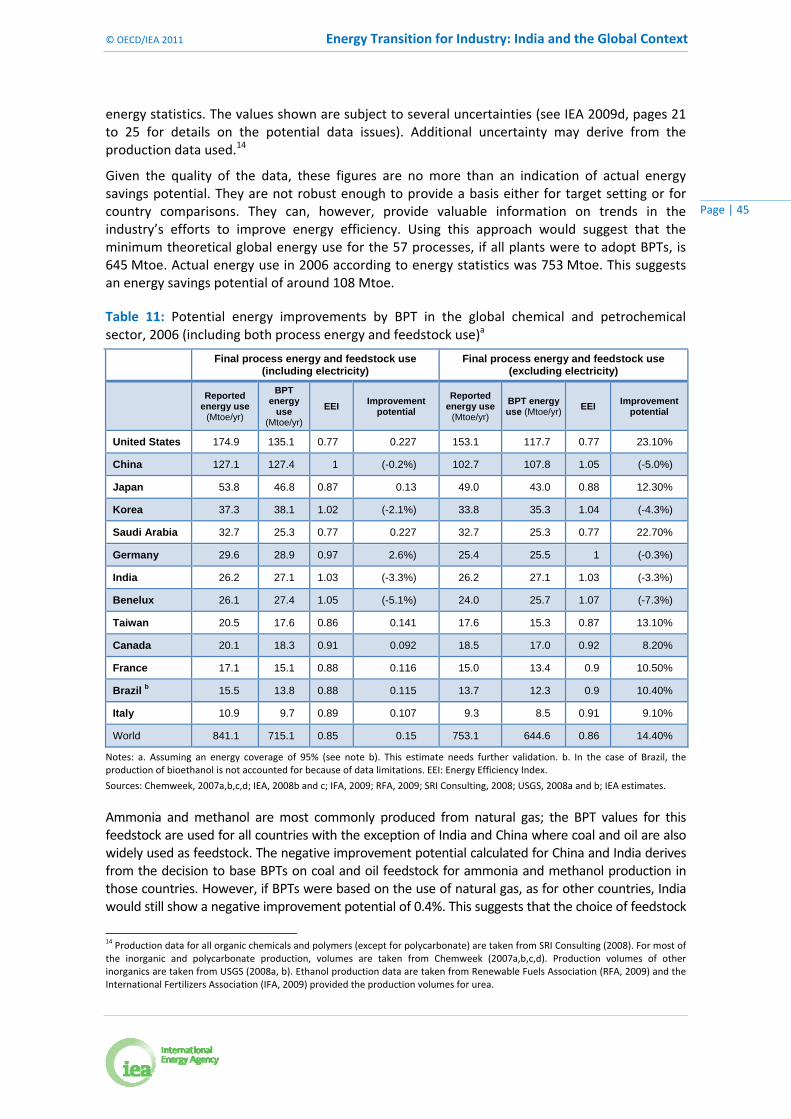
© OECD/IEA 2011 Energy Transition for Industry: India and the Global Context
Page | 45
energy statistics. The values shown are subject to several uncertainties (see IEA 2009d, pages 21 to 25 for details on the potential data issues). Additional uncertainty may derive from the production data used.14
Given the quality of the data, these figures are no more than an indication of actual energy savings potential. They are not robust enough to provide a basis either for target setting or for country comparisons. They can, however, provide valuable information on trends in the industry’s efforts to improve energy efficiency. Using this approach would suggest that the minimum theoretical global energy use for the 57 processes, if all plants were to adopt BPTs, is 645 Mtoe. Actual energy use in 2006 according to energy statistics was 753 Mtoe. This suggests an energy savings potential of around 108 Mtoe.
Table 11: Potential energy improvements by BPT in the global chemical and petrochemical sector, 2006 (including both process energy and feedstock use)a
Final process energy and feedstock use (including electricity)
Final process energy and feedstock use (excluding electricity)
Reported
energy use (Mtoe/yr)
BPT energy
use (Mtoe/yr)
EEI Improvement
potential
Reported energy use
(Mtoe/yr)
BPT energy use (Mtoe/yr)
EEI Improvement
potential
United States 174.9 135.1 0.77 0.227 153.1 117.7 0.77 23.10%
China 127.1 127.4 1 (-0.2%) 102.7 107.8 1.05 (-5.0%)
Japan 53.8 46.8 0.87 0.13 49.0 43.0 0.88 12.30%
Korea 37.3 38.1 1.02 (-2.1%) 33.8 35.3 1.04 (-4.3%)
Saudi Arabia 32.7 25.3 0.77 0.227 32.7 25.3 0.77 22.70%
Germany 29.6 28.9 0.97 2.6%) 25.4 25.5 1 (-0.3%)
India 26.2 27.1 1.03 (-3.3%) 26.2 27.1 1.03 (-3.3%)
Benelux 26.1 27.4 1.05 (-5.1%) 24.0 25.7 1.07 (-7.3%)
Taiwan 20.5 17.6 0.86 0.141 17.6 15.3 0.87 13.10%
Canada 20.1 18.3 0.91 0.092 18.5 17.0 0.92 8.20%
France 17.1 15.1 0.88 0.116 15.0 13.4 0.9 10.50%
Brazil b 15.5 13.8 0.88 0.115 13.7 12.3 0.9 10.40%
Italy 10.9 9.7 0.89 0.107 9.3 8.5 0.91 9.10%
World 841.1 715.1 0.85 0.15 753.1 644.6 0.86 14.40%
Notes: a. Assuming an energy coverage of 95% (see note b). This estimate needs further validation. b. In the case of Brazil, the production of bioethanol is not accounted for because of data limitations. EEI: Energy Efficiency Index.
Sources: Chemweek, 2007a,b,c,d; IEA, 2008b and c; IFA, 2009; RFA, 2009; SRI Consulting, 2008; USGS, 2008a and b; IEA estimates.
Ammonia and methanol are most commonly produced from natural gas; the BPT values for this feedstock are used for all countries with the exception of India and China where coal and oil are also widely used as feedstock. The negative improvement potential calculated for China and India derives from the decision to base BPTs on coal and oil feedstock for ammonia and methanol production in those countries. However, if BPTs were based on the use of natural gas, as for other countries, India would still show a negative improvement potential of 0.4%. This suggests that the choice of feedstock
14 Production data for all organic chemicals and polymers (except for polycarbonate) are taken from SRI Consulting (2008). For most of
the inorganic and polycarbonate production, volumes are taken from Chemweek (2007a,b,c,d). Production volumes of other inorganics are taken from USGS (2008a, b). Ethanol production data are taken from Renewable Fuels Association (RFA, 2009) and the International Fertilizers Association (IFA, 2009) provided the production volumes for urea.

Energy Transition for Industry: India and the Global Context © OECD/IEA 2011
Page | 46
is not the only problem with the data. The negative improvement potential may partly be caused by erroneous production statistics and/or erroneous energy statistics also in other countries.
Best practice technology and technical savings potential
This analysis presented in Table 11 reports the energy savings that would be achieved by implementing BPT only in core chemical processes. There are further opportunities within the sector for achieving energy savings in the short to medium term. As discussed in more detail in an IEA Information Paper (IEA, 2009d), process intensification/integration, combined heat and power (CHP), recycling and energy recovery all offer opportunities for reducing the industry’s energy use and CO2 emissions.
The total worldwide potential savings from these measures and from applying BPTs is approximately 235 Mtoe in final energy and approximately 290 Mtoe in primary energy use (Figure 20). Regional potentials based on this methodology vary significantly. In the case of India, the potentials are estimated to be 6.6 Mtoe in final energy.
Figure 20: Energy savings potential in 2007 for chemicals and petrochemicals, based on BPT
Note: Europe includes Benelux, France, Germany, Italy and the United Kingdom. No BPT energy savings potential is shown for those countries with apparently negative improvement potential.
Scenario results
Consumption of HVC in India is low compared to the world average. In 2007, HVC consumption was 9.3 kg/cap while the world average was 43 kg/cap. In the Baseline Scenario, HVC production in India is projected to increase from 10 Mt in 2007 to 45 Mt in the low‐demand case and 80 Mt in the high‐demand case. This increase will be fully met by the primary production of chemicals. However, in the BLUE Scenario, recycling of post‐consumer plastic waste will reduce the need for HVC production (Table 12), explaining the lower production in this scenario. In the BLUE Scenario, India’s HVC production is estimated to increase to 39 Mt (low‐demand) and 59 Mt (high‐demand). In both scenarios, India will be one of the top‐five HVC producers in 2050.
Per‐capita consumption of ammonia in India remained relatively stable in the past few years and, in 2007, was about half the world average. Production in India is projected to increase at a higher
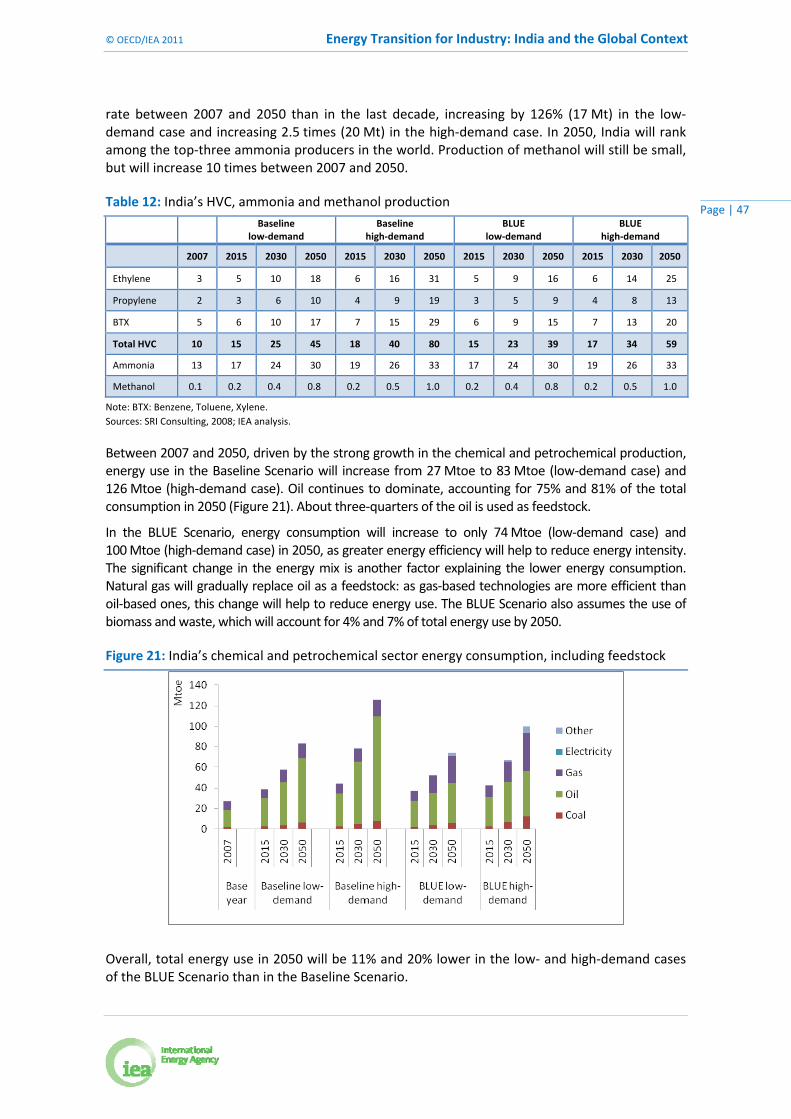
© OECD/IEA 2011 Energy Transition for Industry: India and the Global Context
Page | 47
rate between 2007 and 2050 than in the last decade, increasing by 126% (17 Mt) in the low‐demand case and increasing 2.5 times (20 Mt) in the high‐demand case. In 2050, India will rank among the top‐three ammonia producers in the world. Production of methanol will still be small, but will increase 10 times between 2007 and 2050.
Table 12: India’s HVC, ammonia and methanol production
Baseline low‐demand
Baselinehigh‐demand
BLUElow‐demand
BLUE high‐demand
2007 2015 2030 2050 2015 2030 2050 2015 2030 2050 2015 2030 2050
Ethylene 3 5 10 18 6 16 31 5 9 16 6 14 25
Propylene 2 3 6 10 4 9 19 3 5 9 4 8 13
BTX 5 6 10 17 7 15 29 6 9 15 7 13 20
Total HVC 10 15 25 45 18 40 80 15 23 39 17 34 59
Ammonia 13 17 24 30 19 26 33 17 24 30 19 26 33
Methanol 0.1 0.2 0.4 0.8 0.2 0.5 1.0 0.2 0.4 0.8 0.2 0.5 1.0
Note: BTX: Benzene, Toluene, Xylene.
Sources: SRI Consulting, 2008; IEA analysis.
Between 2007 and 2050, driven by the strong growth in the chemical and petrochemical production, energy use in the Baseline Scenario will increase from 27 Mtoe to 83 Mtoe (low‐demand case) and 126 Mtoe (high‐demand case). Oil continues to dominate, accounting for 75% and 81% of the total consumption in 2050 (Figure 21). About three‐quarters of the oil is used as feedstock.
In the BLUE Scenario, energy consumption will increase to only 74 Mtoe (low‐demand case) and 100 Mtoe (high‐demand case) in 2050, as greater energy efficiency will help to reduce energy intensity. The significant change in the energy mix is another factor explaining the lower energy consumption. Natural gas will gradually replace oil as a feedstock: as gas‐based technologies are more efficient than oil‐based ones, this change will help to reduce energy use. The BLUE Scenario also assumes the use of biomass and waste, which will account for 4% and 7% of total energy use by 2050.
Figure 21: India’s chemical and petrochemical sector energy consumption, including feedstock
Overall, total energy use in 2050 will be 11% and 20% lower in the low‐ and high‐demand cases of the BLUE Scenario than in the Baseline Scenario.
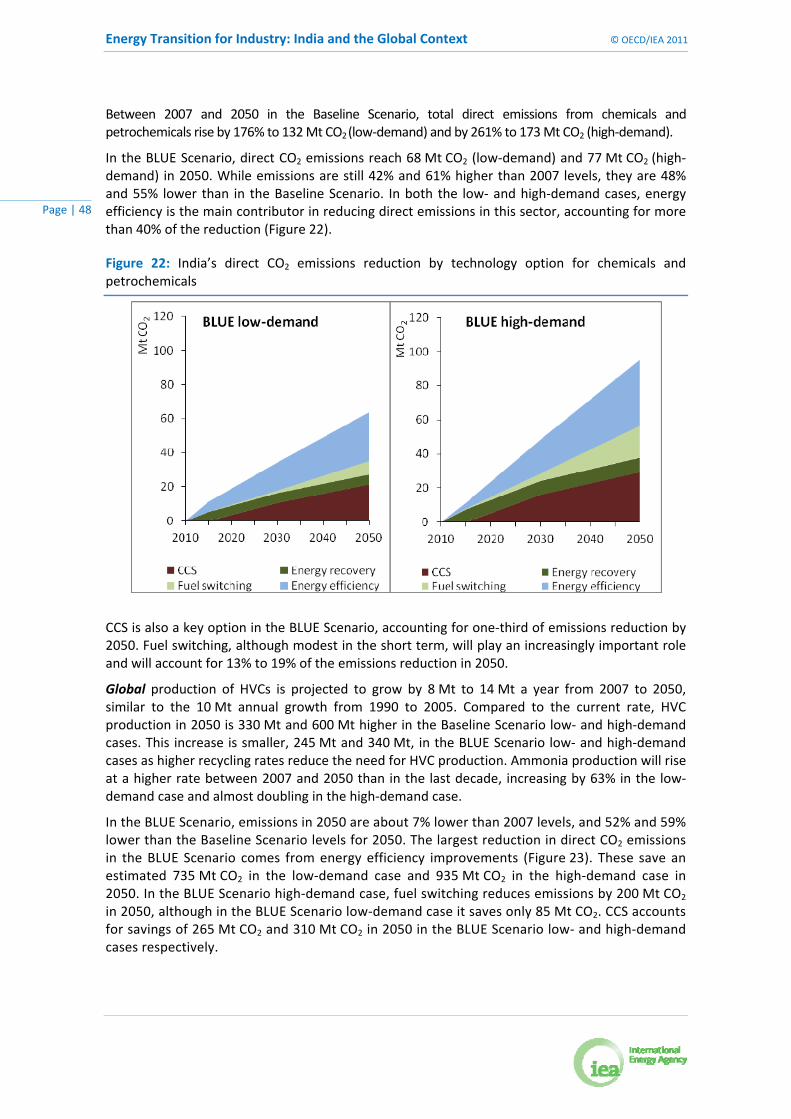
Energy Transition for Industry: India and the Global Context © OECD/IEA 2011
Page | 48
Between 2007 and 2050 in the Baseline Scenario, total direct emissions from chemicals and petrochemicals rise by 176% to 132 Mt CO2 (low‐demand) and by 261% to 173 Mt CO2 (high‐demand).
In the BLUE Scenario, direct CO2 emissions reach 68 Mt CO2 (low‐demand) and 77 Mt CO2 (high‐demand) in 2050. While emissions are still 42% and 61% higher than 2007 levels, they are 48% and 55% lower than in the Baseline Scenario. In both the low‐ and high‐demand cases, energy efficiency is the main contributor in reducing direct emissions in this sector, accounting for more than 40% of the reduction (Figure 22).
Figure 22: India’s direct CO2 emissions reduction by technology option for chemicals and petrochemicals
CCS is also a key option in the BLUE Scenario, accounting for one‐third of emissions reduction by 2050. Fuel switching, although modest in the short term, will play an increasingly important role and will account for 13% to 19% of the emissions reduction in 2050.
Global production of HVCs is projected to grow by 8 Mt to 14 Mt a year from 2007 to 2050, similar to the 10 Mt annual growth from 1990 to 2005. Compared to the current rate, HVC production in 2050 is 330 Mt and 600 Mt higher in the Baseline Scenario low‐ and high‐demand cases. This increase is smaller, 245 Mt and 340 Mt, in the BLUE Scenario low‐ and high‐demand cases as higher recycling rates reduce the need for HVC production. Ammonia production will rise at a higher rate between 2007 and 2050 than in the last decade, increasing by 63% in the low‐demand case and almost doubling in the high‐demand case.
In the BLUE Scenario, emissions in 2050 are about 7% lower than 2007 levels, and 52% and 59% lower than the Baseline Scenario levels for 2050. The largest reduction in direct CO2 emissions in the BLUE Scenario comes from energy efficiency improvements (Figure 23). These save an estimated 735 Mt CO2 in the low‐demand case and 935 Mt CO2 in the high‐demand case in 2050. In the BLUE Scenario high‐demand case, fuel switching reduces emissions by 200 Mt CO2 in 2050, although in the BLUE Scenario low‐demand case it saves only 85 Mt CO2. CCS accounts for savings of 265 Mt CO2 and 310 Mt CO2 in 2050 in the BLUE Scenario low‐ and high‐demand cases respectively.

© OECD/IEA 2011 Energy Transition for Industry: India and the Global Context
Page | 49
Figure 23: Global direct emissions reduction by technology option for chemicals and petrochemicals
In the Baseline Scenario, regional emissions grow fastest in Asia, and Africa and the Middle East with emissions in these regions seeing an increase of three times the current rate. Emissions in OECD Europe and OECD Pacific will decline slightly. Given the strong growth in HVC production expected in Africa and Middle East, these regions will contribute the most to reducing CO2 emissions from the Baseline Scenario (Figure 24). Their emissions, however, will still increase by 84% between 2007 and 2050 in the BLUE Scenario low‐demand case.
The move away from coal and, to a lesser extent, oil feedstock explains, in part, China’s large contribution to the overall emissions reduction.
Figure 24: Regional contribution to reducing global direct CO2 emissions in chemicals and petrochemicals, low‐demand case
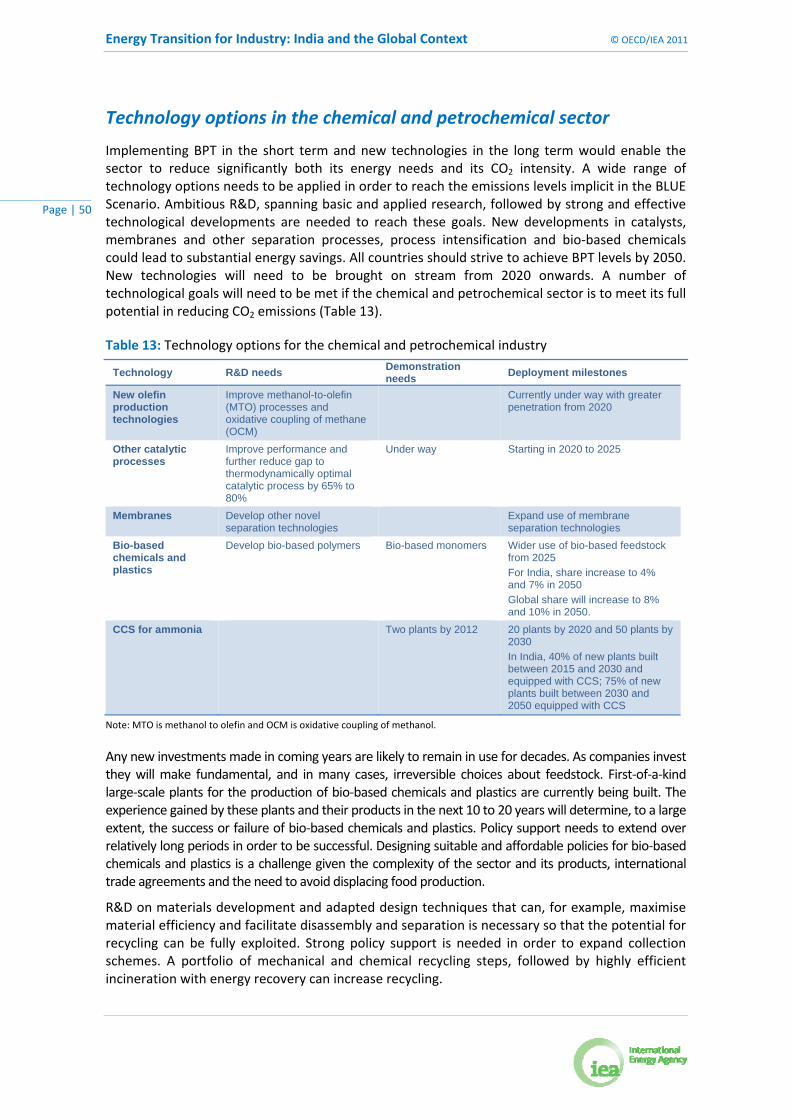
Energy Transition for Industry: India and the Global Context © OECD/IEA 2011
Page | 50
Technology options in the chemical and petrochemical sector
Implementing BPT in the short term and new technologies in the long term would enable the sector to reduce significantly both its energy needs and its CO2 intensity. A wide range of technology options needs to be applied in order to reach the emissions levels implicit in the BLUE Scenario. Ambitious R&D, spanning basic and applied research, followed by strong and effective technological developments are needed to reach these goals. New developments in catalysts, membranes and other separation processes, process intensification and bio‐based chemicals could lead to substantial energy savings. All countries should strive to achieve BPT levels by 2050. New technologies will need to be brought on stream from 2020 onwards. A number of technological goals will need to be met if the chemical and petrochemical sector is to meet its full potential in reducing CO2 emissions (Table 13).
Table 13: Technology options for the chemical and petrochemical industry
Technology R&D needs Demonstration needs
Deployment milestones
New olefin production technologies
Improve methanol-to-olefin (MTO) processes and oxidative coupling of methane (OCM)
Currently under way with greater penetration from 2020
Other catalytic processes
Improve performance and further reduce gap to thermodynamically optimal catalytic process by 65% to 80%
Under way Starting in 2020 to 2025
Membranes Develop other novel separation technologies
Expand use of membrane separation technologies
Bio-based chemicals and plastics
Develop bio-based polymers Bio-based monomers Wider use of bio-based feedstock from 2025
For India, share increase to 4% and 7% in 2050
Global share will increase to 8% and 10% in 2050.
CCS for ammonia Two plants by 2012 20 plants by 2020 and 50 plants by 2030
In India, 40% of new plants built between 2015 and 2030 and equipped with CCS; 75% of new plants built between 2030 and 2050 equipped with CCS
Note: MTO is methanol to olefin and OCM is oxidative coupling of methanol.
Any new investments made in coming years are likely to remain in use for decades. As companies invest they will make fundamental, and in many cases, irreversible choices about feedstock. First‐of‐a‐kind large‐scale plants for the production of bio‐based chemicals and plastics are currently being built. The experience gained by these plants and their products in the next 10 to 20 years will determine, to a large extent, the success or failure of bio‐based chemicals and plastics. Policy support needs to extend over relatively long periods in order to be successful. Designing suitable and affordable policies for bio‐based chemicals and plastics is a challenge given the complexity of the sector and its products, international trade agreements and the need to avoid displacing food production.
R&D on materials development and adapted design techniques that can, for example, maximise material efficiency and facilitate disassembly and separation is necessary so that the potential for recycling can be fully exploited. Strong policy support is needed in order to expand collection schemes. A portfolio of mechanical and chemical recycling steps, followed by highly efficient incineration with energy recovery can increase recycling.
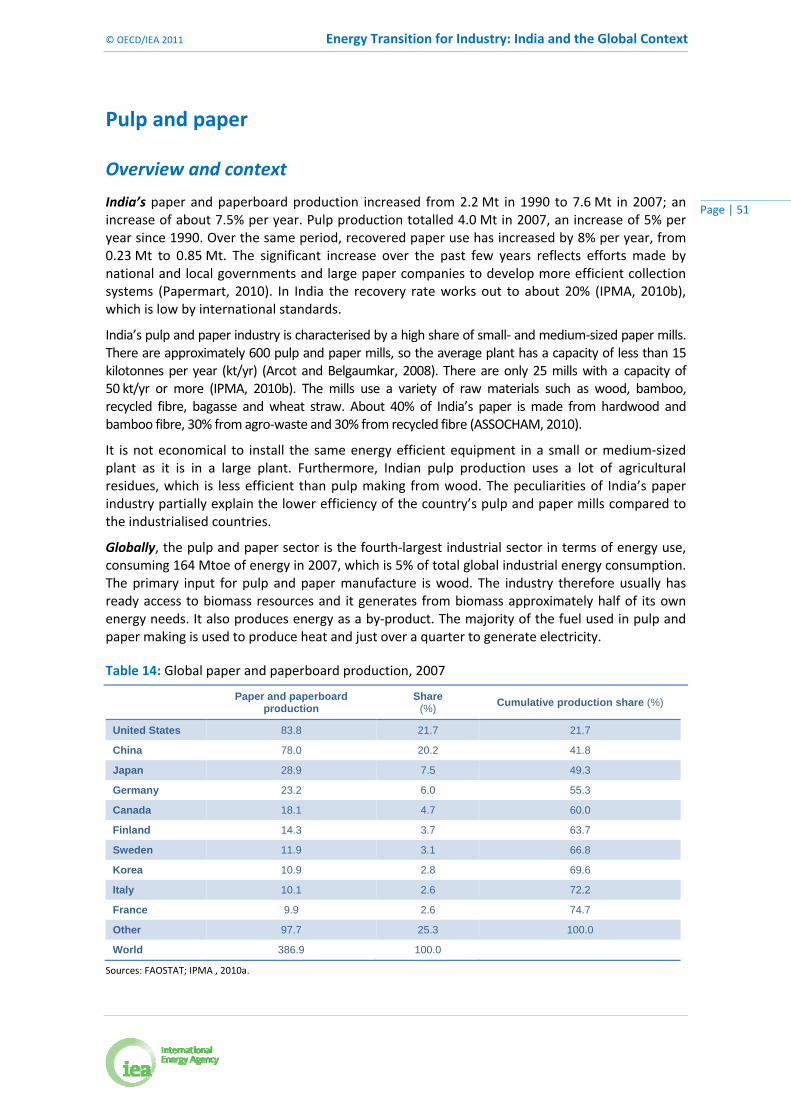
© OECD/IEA 2011 Energy Transition for Industry: India and the Global Context
Page | 51
Pulp and paper
Overview and context
India’s paper and paperboard production increased from 2.2 Mt in 1990 to 7.6 Mt in 2007; an increase of about 7.5% per year. Pulp production totalled 4.0 Mt in 2007, an increase of 5% per year since 1990. Over the same period, recovered paper use has increased by 8% per year, from 0.23 Mt to 0.85 Mt. The significant increase over the past few years reflects efforts made by national and local governments and large paper companies to develop more efficient collection systems (Papermart, 2010). In India the recovery rate works out to about 20% (IPMA, 2010b), which is low by international standards.
India’s pulp and paper industry is characterised by a high share of small‐ and medium‐sized paper mills. There are approximately 600 pulp and paper mills, so the average plant has a capacity of less than 15 kilotonnes per year (kt/yr) (Arcot and Belgaumkar, 2008). There are only 25 mills with a capacity of 50 kt/yr or more (IPMA, 2010b). The mills use a variety of raw materials such as wood, bamboo, recycled fibre, bagasse and wheat straw. About 40% of India’s paper is made from hardwood and bamboo fibre, 30% from agro‐waste and 30% from recycled fibre (ASSOCHAM, 2010).
It is not economical to install the same energy efficient equipment in a small or medium‐sized plant as it is in a large plant. Furthermore, Indian pulp production uses a lot of agricultural residues, which is less efficient than pulp making from wood. The peculiarities of India’s paper industry partially explain the lower efficiency of the country’s pulp and paper mills compared to the industrialised countries.
Globally, the pulp and paper sector is the fourth‐largest industrial sector in terms of energy use, consuming 164 Mtoe of energy in 2007, which is 5% of total global industrial energy consumption. The primary input for pulp and paper manufacture is wood. The industry therefore usually has ready access to biomass resources and it generates from biomass approximately half of its own energy needs. It also produces energy as a by‐product. The majority of the fuel used in pulp and paper making is used to produce heat and just over a quarter to generate electricity.
Table 14: Global paper and paperboard production, 2007
Paper and paperboard production
Share (%)
Cumulative production share (%)
United States 83.8 21.7 21.7
China 78.0 20.2 41.8
Japan 28.9 7.5 49.3
Germany 23.2 6.0 55.3
Canada 18.1 4.7 60.0
Finland 14.3 3.7 63.7
Sweden 11.9 3.1 66.8
Korea 10.9 2.8 69.6
Italy 10.1 2.6 72.2
France 9.9 2.6 74.7
Other 97.7 25.3 100.0
World 386.9 100.0
Sources: FAOSTAT; IPMA , 2010a.
Energy Transition for Industry: India and the Global Context © OECD/IEA 2011
Page | 52
Global paper and paperboard production has grown by more than 60% since 1990, totalling 387 Mt in 2007. The global paper industry is highly concentrated in the United States, China, Japan, Germany and Canada, which together accounted for 60% of total paper production in 2007 (Table 14). As recovered paper use has increased, pulp production since 1990 has increased at a slower rate than paper and paperboard production. Pulp production was 192 Mt in 2007, 16% higher than in 1990. Over the same period, recovered paper more than doubled from 84 Mt in 1990 to 194 Mt in 2007. The six largest pulp‐producing countries, the United States, Canada, China, Finland, Sweden and Brazil produced just below 70% of the world’s pulp in 2007.
The large share of biomass use as fuel makes the sector one of the least CO2‐intensive, although large variations exist among different countries, depending on biomass availability and industry structure.15 The sector emitted 183 Mt of direct CO2 in 2007, representing only 2% of direct emissions from the industry.
Technology and energy consumption in pulp and paper production
Energy is used in the pulp and paper industry in a number of different production processes. The main processes are:
chemical pulping;
mechanical pulping;
paper recycling; and
paper production.
The main production facilities are either pulp mills or integrated paper and pulp mills. An integrated mill is more energy‐efficient than the combination of a stand‐alone pulp mill and paper mill because pulp drying can be avoided. But integrated plants require grid electricity as well as additional fuel. Most of the improvements in energy efficiency that have been achieved so far have come from integrated pulp and paper mills in which recovered heat is used in the production process, for example to dry the paper. Investment in heat recovery systems in stand‐alone mechanical pulp mills is not economically viable.
Chemical pulping yields black liquor as a by‐product, which can then be processed in a recovery boiler to produce heat and electricity. Roughly 22 GJ of black liquor can be combusted per tonne of pulp. Large modern chemical pulp mills are more than self‐sufficient in energy terms, delivering surplus electricity to the grid.
The production of recovered paper pulp uses 10 GJ to 13 GJ less energy per tonne than the production of virgin pulp, depending on whether the recovered paper is de‐inked and whether mechanical or chemical pulp is being replaced. Although less energy‐intensive, the production of recovered paper pulp is generally more CO2‐intensive, as the production of chemical pulp, by using biomass for energy, is CO2‐neutral. In many cases, the energy used for the production of recovered paper pulp comes from fossil fuels. As a result, using higher levels of recovered paper can significantly reduce energy intensity in the sector, but at the cost of higher CO2 emissions.
Current levels of recovered paper production are already high in many countries. They vary from 30% in the Russian Federation to 70% in Japan. Recycling rates can be increased in most regions, especially in many non‐OECD countries where the recovered paper production rate varies from 10% to 50%. The upper technical limit to waste paper collection is 81% (CEPI, 2006), but practically the upper limit may be closer to 60%.
15 The combustion of biomass is considered to be carbon‐neutral.
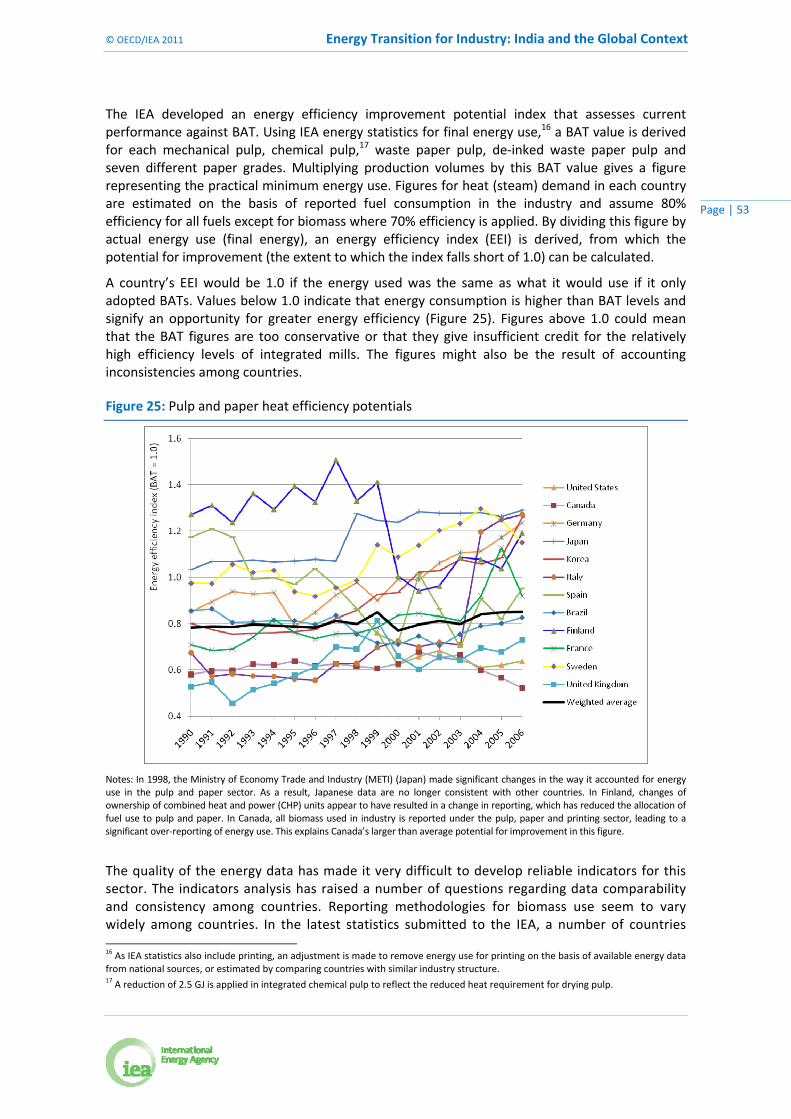
© OECD/IEA 2011 Energy Transition for Industry: India and the Global Context
Page | 53
The IEA developed an energy efficiency improvement potential index that assesses current performance against BAT. Using IEA energy statistics for final energy use,16 a BAT value is derived for each mechanical pulp, chemical pulp,17 waste paper pulp, de‐inked waste paper pulp and seven different paper grades. Multiplying production volumes by this BAT value gives a figure representing the practical minimum energy use. Figures for heat (steam) demand in each country are estimated on the basis of reported fuel consumption in the industry and assume 80% efficiency for all fuels except for biomass where 70% efficiency is applied. By dividing this figure by actual energy use (final energy), an energy efficiency index (EEI) is derived, from which the potential for improvement (the extent to which the index falls short of 1.0) can be calculated.
A country’s EEI would be 1.0 if the energy used was the same as what it would use if it only adopted BATs. Values below 1.0 indicate that energy consumption is higher than BAT levels and signify an opportunity for greater energy efficiency (Figure 25). Figures above 1.0 could mean that the BAT figures are too conservative or that they give insufficient credit for the relatively high efficiency levels of integrated mills. The figures might also be the result of accounting inconsistencies among countries.
Figure 25: Pulp and paper heat efficiency potentials
Notes: In 1998, the Ministry of Economy Trade and Industry (METI) (Japan) made significant changes in the way it accounted for energy use in the pulp and paper sector. As a result, Japanese data are no longer consistent with other countries. In Finland, changes of ownership of combined heat and power (CHP) units appear to have resulted in a change in reporting, which has reduced the allocation of fuel use to pulp and paper. In Canada, all biomass used in industry is reported under the pulp, paper and printing sector, leading to a significant over‐reporting of energy use. This explains Canada’s larger than average potential for improvement in this figure.
The quality of the energy data has made it very difficult to develop reliable indicators for this sector. The indicators analysis has raised a number of questions regarding data comparability and consistency among countries. Reporting methodologies for biomass use seem to vary widely among countries. In the latest statistics submitted to the IEA, a number of countries 16 As IEA statistics also include printing, an adjustment is made to remove energy use for printing on the basis of available energy data
from national sources, or estimated by comparing countries with similar industry structure. 17 A reduction of 2.5 GJ is applied in integrated chemical pulp to reflect the reduced heat requirement for drying pulp.
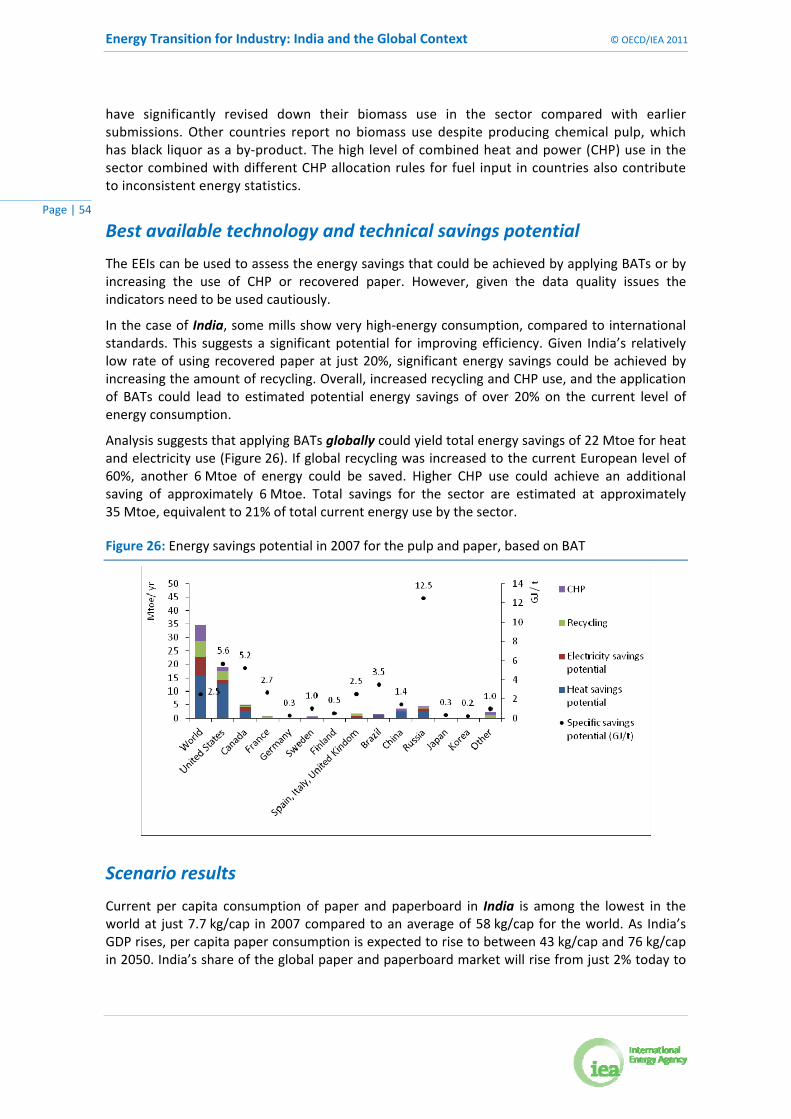
Energy Transition for Industry: India and the Global Context © OECD/IEA 2011
Page | 54
have significantly revised down their biomass use in the sector compared with earlier submissions. Other countries report no biomass use despite producing chemical pulp, which has black liquor as a by‐product. The high level of combined heat and power (CHP) use in the sector combined with different CHP allocation rules for fuel input in countries also contribute to inconsistent energy statistics.
Best available technology and technical savings potential
The EEIs can be used to assess the energy savings that could be achieved by applying BATs or by increasing the use of CHP or recovered paper. However, given the data quality issues the indicators need to be used cautiously.
In the case of India, some mills show very high‐energy consumption, compared to international standards. This suggests a significant potential for improving efficiency. Given India’s relatively low rate of using recovered paper at just 20%, significant energy savings could be achieved by increasing the amount of recycling. Overall, increased recycling and CHP use, and the application of BATs could lead to estimated potential energy savings of over 20% on the current level of energy consumption.
Analysis suggests that applying BATs globally could yield total energy savings of 22 Mtoe for heat and electricity use (Figure 26). If global recycling was increased to the current European level of 60%, another 6 Mtoe of energy could be saved. Higher CHP use could achieve an additional saving of approximately 6 Mtoe. Total savings for the sector are estimated at approximately 35 Mtoe, equivalent to 21% of total current energy use by the sector.
Figure 26: Energy savings potential in 2007 for the pulp and paper, based on BAT
Scenario results
Current per capita consumption of paper and paperboard in India is among the lowest in the world at just 7.7 kg/cap in 2007 compared to an average of 58 kg/cap for the world. As India’s GDP rises, per capita paper consumption is expected to rise to between 43 kg/cap and 76 kg/cap in 2050. India’s share of the global paper and paperboard market will rise from just 2% today to
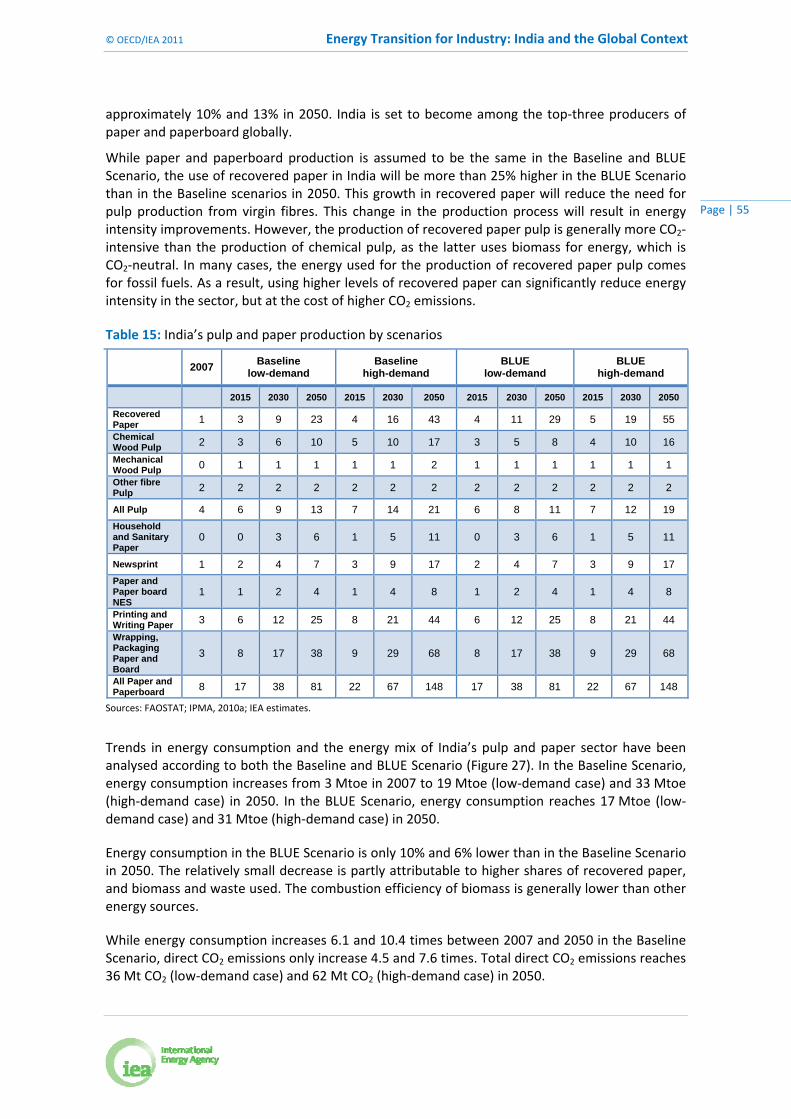
© OECD/IEA 2011 Energy Transition for Industry: India and the Global Context
Page | 55
approximately 10% and 13% in 2050. India is set to become among the top‐three producers of paper and paperboard globally.
While paper and paperboard production is assumed to be the same in the Baseline and BLUE Scenario, the use of recovered paper in India will be more than 25% higher in the BLUE Scenario than in the Baseline scenarios in 2050. This growth in recovered paper will reduce the need for pulp production from virgin fibres. This change in the production process will result in energy intensity improvements. However, the production of recovered paper pulp is generally more CO2‐intensive than the production of chemical pulp, as the latter uses biomass for energy, which is CO2‐neutral. In many cases, the energy used for the production of recovered paper pulp comes for fossil fuels. As a result, using higher levels of recovered paper can significantly reduce energy intensity in the sector, but at the cost of higher CO2 emissions.
Table 15: India’s pulp and paper production by scenarios
2007
Baseline low-demand
Baseline high-demand
BLUE low-demand
BLUE high-demand
2015 2030 2050 2015 2030 2050 2015 2030 2050 2015 2030 2050
Recovered Paper 1 3 9 23 4 16 43 4 11 29 5 19 55
Chemical Wood Pulp 2 3 6 10 5 10 17 3 5 8 4 10 16
Mechanical Wood Pulp 0 1 1 1 1 1 2 1 1 1 1 1 1
Other fibre Pulp 2 2 2 2 2 2 2 2 2 2 2 2 2
All Pulp 4 6 9 13 7 14 21 6 8 11 7 12 19
Household and Sanitary Paper
0 0 3 6 1 5 11 0 3 6 1 5 11
Newsprint 1 2 4 7 3 9 17 2 4 7 3 9 17
Paper and Paper board NES
1 1 2 4 1 4 8 1 2 4 1 4 8
Printing and Writing Paper 3 6 12 25 8 21 44 6 12 25 8 21 44
Wrapping, Packaging Paper and Board
3 8 17 38 9 29 68 8 17 38 9 29 68
All Paper and Paperboard 8 17 38 81 22 67 148 17 38 81 22 67 148
Sources: FAOSTAT; IPMA, 2010a; IEA estimates.
Trends in energy consumption and the energy mix of India’s pulp and paper sector have been analysed according to both the Baseline and BLUE Scenario (Figure 27). In the Baseline Scenario, energy consumption increases from 3 Mtoe in 2007 to 19 Mtoe (low‐demand case) and 33 Mtoe (high‐demand case) in 2050. In the BLUE Scenario, energy consumption reaches 17 Mtoe (low‐demand case) and 31 Mtoe (high‐demand case) in 2050.
Energy consumption in the BLUE Scenario is only 10% and 6% lower than in the Baseline Scenario in 2050. The relatively small decrease is partly attributable to higher shares of recovered paper, and biomass and waste used. The combustion efficiency of biomass is generally lower than other energy sources.
While energy consumption increases 6.1 and 10.4 times between 2007 and 2050 in the Baseline Scenario, direct CO2 emissions only increase 4.5 and 7.6 times. Total direct CO2 emissions reaches 36 Mt CO2 (low‐demand case) and 62 Mt CO2 (high‐demand case) in 2050.

Energy Transition for Industry: India and the Global Context © OECD/IEA 2011
Page | 56
Figure 27: India’s pulp and paper energy consumption by energy source and scenarios
There is a significant shift away from coal in the BLUE Scenario. While coal accounted for 60% of total energy use is 2007, it only accounts for 44% in 2050 in the Baseline Scenario and is further reduced to 25% in the BLUE Scenario. This change in the fuel mix has a major impact on the CO2 intensity of the pulp and paper industry.
In the BLUE Scenario, CO2 emissions are still 2.1 and 3.8 times higher in 2050 than they were in 2007, but a reduction from the Baseline Scenario reaches 52% in the low‐demand case and 49% in the high‐demand cases. Fuel switching is the main factor reducing emissions, accounting for 51% and 60% of the reduction in 2050 (Figure 28). CCS is a later option for the sector and will account for 7% (low‐demand case) and 11% (high‐demand case) of the total reduction in 2050.
Figure 28: India’s direct CO2 emissions reduction by technology option for pulp and paper
Globally, paper production is estimated to reach almost 800 Mt by 2050 in the low‐demand case and over 1 100 Mt in the high‐demand case. In both cases, China becomes the largest paper
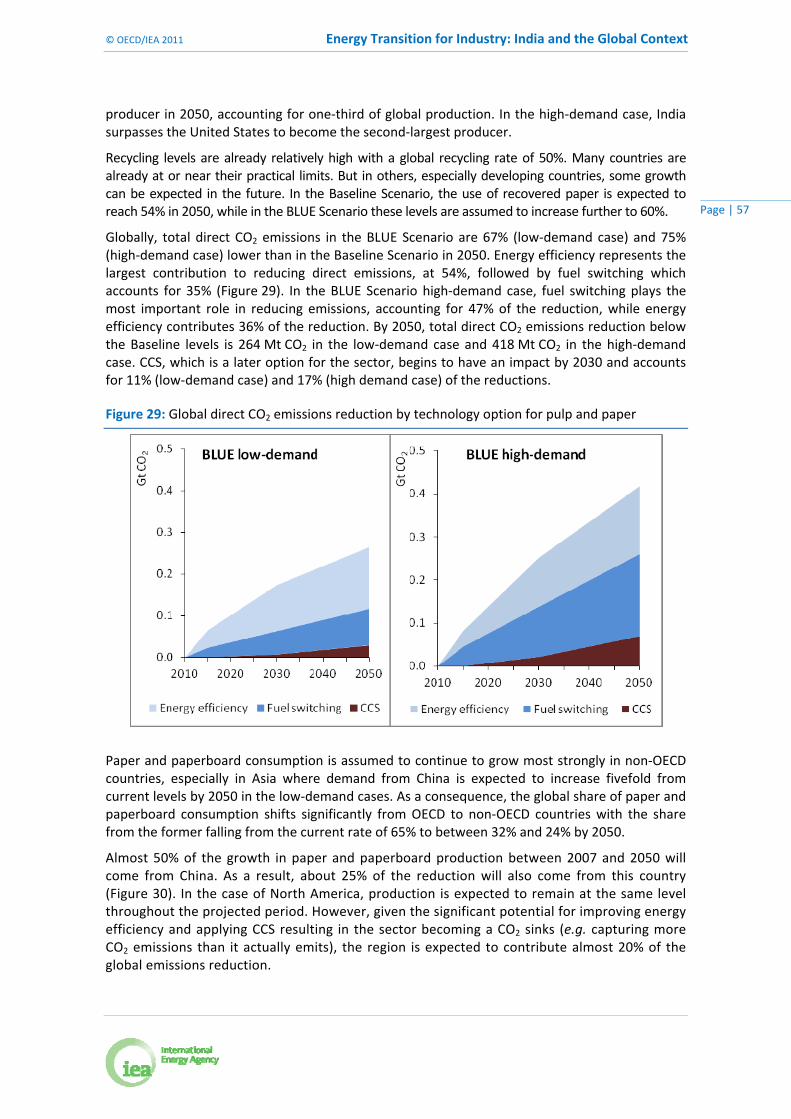
© OECD/IEA 2011 Energy Transition for Industry: India and the Global Context
Page | 57
producer in 2050, accounting for one‐third of global production. In the high‐demand case, India surpasses the United States to become the second‐largest producer.
Recycling levels are already relatively high with a global recycling rate of 50%. Many countries are already at or near their practical limits. But in others, especially developing countries, some growth can be expected in the future. In the Baseline Scenario, the use of recovered paper is expected to reach 54% in 2050, while in the BLUE Scenario these levels are assumed to increase further to 60%.
Globally, total direct CO2 emissions in the BLUE Scenario are 67% (low‐demand case) and 75% (high‐demand case) lower than in the Baseline Scenario in 2050. Energy efficiency represents the largest contribution to reducing direct emissions, at 54%, followed by fuel switching which accounts for 35% (Figure 29). In the BLUE Scenario high‐demand case, fuel switching plays the most important role in reducing emissions, accounting for 47% of the reduction, while energy efficiency contributes 36% of the reduction. By 2050, total direct CO2 emissions reduction below the Baseline levels is 264 Mt CO2 in the low‐demand case and 418 Mt CO2 in the high‐demand case. CCS, which is a later option for the sector, begins to have an impact by 2030 and accounts for 11% (low‐demand case) and 17% (high demand case) of the reductions.
Figure 29: Global direct CO2 emissions reduction by technology option for pulp and paper
Paper and paperboard consumption is assumed to continue to grow most strongly in non‐OECD countries, especially in Asia where demand from China is expected to increase fivefold from current levels by 2050 in the low‐demand cases. As a consequence, the global share of paper and paperboard consumption shifts significantly from OECD to non‐OECD countries with the share from the former falling from the current rate of 65% to between 32% and 24% by 2050.
Almost 50% of the growth in paper and paperboard production between 2007 and 2050 will come from China. As a result, about 25% of the reduction will also come from this country (Figure 30). In the case of North America, production is expected to remain at the same level throughout the projected period. However, given the significant potential for improving energy efficiency and applying CCS resulting in the sector becoming a CO2 sinks (e.g. capturing more CO2 emissions than it actually emits), the region is expected to contribute almost 20% of the global emissions reduction.
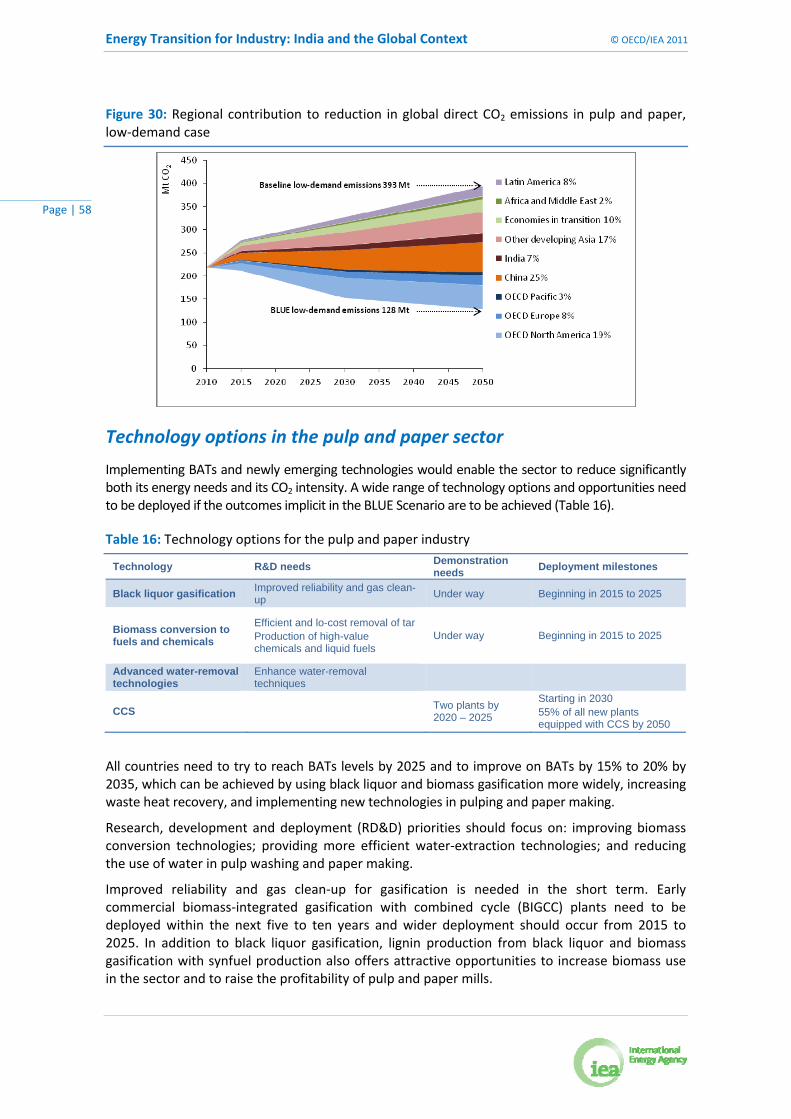
Energy Transition for Industry: India and the Global Context © OECD/IEA 2011
Page | 58
Figure 30: Regional contribution to reduction in global direct CO2 emissions in pulp and paper, low‐demand case
Technology options in the pulp and paper sector
Implementing BATs and newly emerging technologies would enable the sector to reduce significantly both its energy needs and its CO2 intensity. A wide range of technology options and opportunities need to be deployed if the outcomes implicit in the BLUE Scenario are to be achieved (Table 16).
Table 16: Technology options for the pulp and paper industry
Technology R&D needs Demonstration needs
Deployment milestones
Black liquor gasification Improved reliability and gas clean-up
Under way Beginning in 2015 to 2025
Biomass conversion to fuels and chemicals
Efficient and lo-cost removal of tar Production of high-value chemicals and liquid fuels
Under way Beginning in 2015 to 2025
Advanced water-removal technologies
Enhance water-removal techniques
CCS Two plants by 2020 – 2025
Starting in 2030 55% of all new plants equipped with CCS by 2050
All countries need to try to reach BATs levels by 2025 and to improve on BATs by 15% to 20% by 2035, which can be achieved by using black liquor and biomass gasification more widely, increasing waste heat recovery, and implementing new technologies in pulping and paper making.
Research, development and deployment (RD&D) priorities should focus on: improving biomass conversion technologies; providing more efficient water‐extraction technologies; and reducing the use of water in pulp washing and paper making.
Improved reliability and gas clean‐up for gasification is needed in the short term. Early commercial biomass‐integrated gasification with combined cycle (BIGCC) plants need to be deployed within the next five to ten years and wider deployment should occur from 2015 to 2025. In addition to black liquor gasification, lignin production from black liquor and biomass gasification with synfuel production also offers attractive opportunities to increase biomass use in the sector and to raise the profitability of pulp and paper mills.
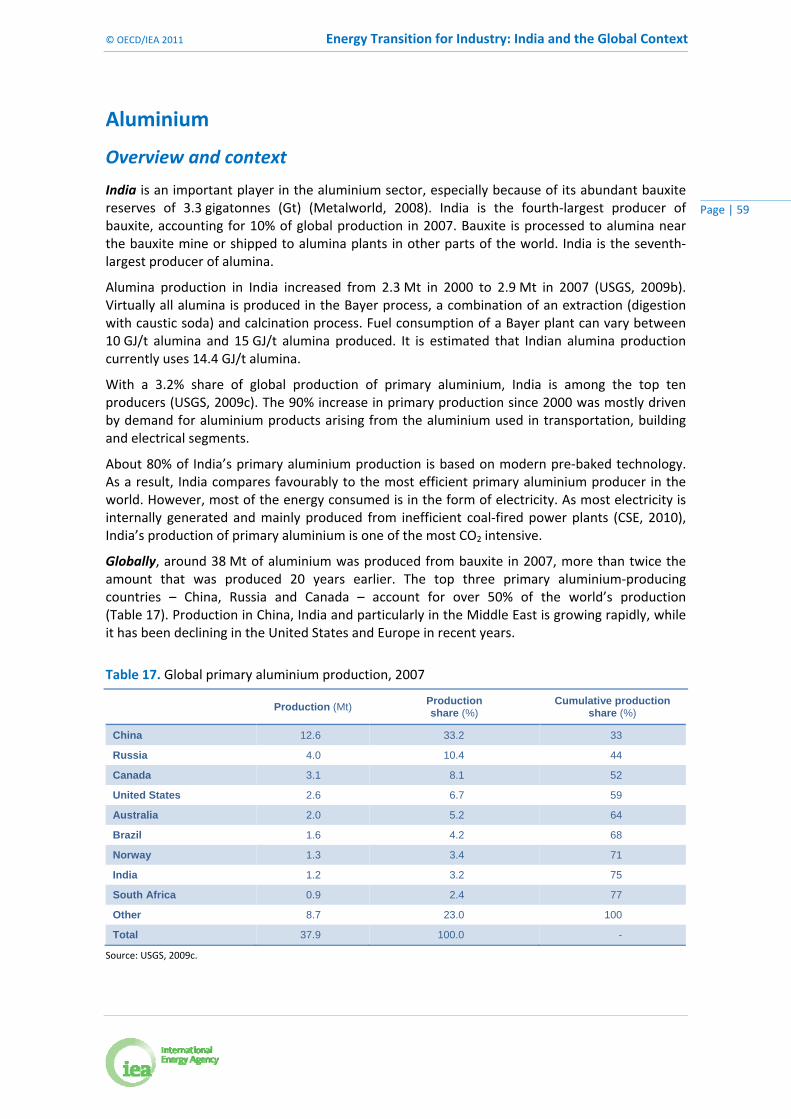
© OECD/IEA 2011 Energy Transition for Industry: India and the Global Context
Page | 59
Aluminium
Overview and context
India is an important player in the aluminium sector, especially because of its abundant bauxite reserves of 3.3 gigatonnes (Gt) (Metalworld, 2008). India is the fourth‐largest producer of bauxite, accounting for 10% of global production in 2007. Bauxite is processed to alumina near the bauxite mine or shipped to alumina plants in other parts of the world. India is the seventh‐largest producer of alumina.
Alumina production in India increased from 2.3 Mt in 2000 to 2.9 Mt in 2007 (USGS, 2009b). Virtually all alumina is produced in the Bayer process, a combination of an extraction (digestion with caustic soda) and calcination process. Fuel consumption of a Bayer plant can vary between 10 GJ/t alumina and 15 GJ/t alumina produced. It is estimated that Indian alumina production currently uses 14.4 GJ/t alumina.
With a 3.2% share of global production of primary aluminium, India is among the top ten producers (USGS, 2009c). The 90% increase in primary production since 2000 was mostly driven by demand for aluminium products arising from the aluminium used in transportation, building and electrical segments.
About 80% of India’s primary aluminium production is based on modern pre‐baked technology. As a result, India compares favourably to the most efficient primary aluminium producer in the world. However, most of the energy consumed is in the form of electricity. As most electricity is internally generated and mainly produced from inefficient coal‐fired power plants (CSE, 2010), India’s production of primary aluminium is one of the most CO2 intensive.
Globally, around 38 Mt of aluminium was produced from bauxite in 2007, more than twice the amount that was produced 20 years earlier. The top three primary aluminium‐producing countries – China, Russia and Canada – account for over 50% of the world’s production (Table 17). Production in China, India and particularly in the Middle East is growing rapidly, while it has been declining in the United States and Europe in recent years.
Table 17. Global primary aluminium production, 2007
Production (Mt)
Production share (%)
Cumulative production share (%)
China 12.6 33.2 33
Russia 4.0 10.4 44
Canada 3.1 8.1 52
United States 2.6 6.7 59
Australia 2.0 5.2 64
Brazil 1.6 4.2 68
Norway 1.3 3.4 71
India 1.2 3.2 75
South Africa 0.9 2.4 77
Other 8.7 23.0 100
Total 37.9 100.0 -
Source: USGS, 2009c.
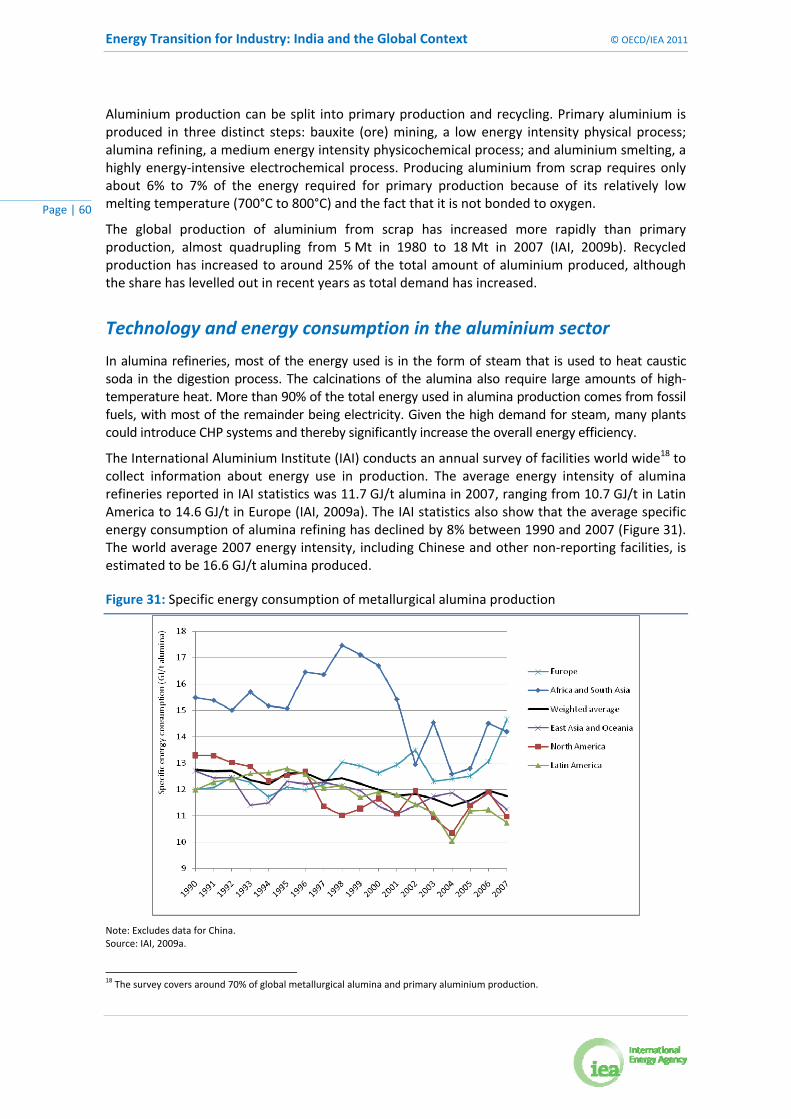
Energy Transition for Industry: India and the Global Context © OECD/IEA 2011
Page | 60
Aluminium production can be split into primary production and recycling. Primary aluminium is produced in three distinct steps: bauxite (ore) mining, a low energy intensity physical process; alumina refining, a medium energy intensity physicochemical process; and aluminium smelting, a highly energy‐intensive electrochemical process. Producing aluminium from scrap requires only about 6% to 7% of the energy required for primary production because of its relatively low melting temperature (700°C to 800°C) and the fact that it is not bonded to oxygen.
The global production of aluminium from scrap has increased more rapidly than primary production, almost quadrupling from 5 Mt in 1980 to 18 Mt in 2007 (IAI, 2009b). Recycled production has increased to around 25% of the total amount of aluminium produced, although the share has levelled out in recent years as total demand has increased.
Technology and energy consumption in the aluminium sector
In alumina refineries, most of the energy used is in the form of steam that is used to heat caustic soda in the digestion process. The calcinations of the alumina also require large amounts of high‐temperature heat. More than 90% of the total energy used in alumina production comes from fossil fuels, with most of the remainder being electricity. Given the high demand for steam, many plants could introduce CHP systems and thereby significantly increase the overall energy efficiency.
The International Aluminium Institute (IAI) conducts an annual survey of facilities world wide18 to collect information about energy use in production. The average energy intensity of alumina refineries reported in IAI statistics was 11.7 GJ/t alumina in 2007, ranging from 10.7 GJ/t in Latin America to 14.6 GJ/t in Europe (IAI, 2009a). The IAI statistics also show that the average specific energy consumption of alumina refining has declined by 8% between 1990 and 2007 (Figure 31). The world average 2007 energy intensity, including Chinese and other non‐reporting facilities, is estimated to be 16.6 GJ/t alumina produced.
Figure 31: Specific energy consumption of metallurgical alumina production
Note: Excludes data for China. Source: IAI, 2009a.
18 The survey covers around 70% of global metallurgical alumina and primary aluminium production.

© OECD/IEA 2011 Energy Transition for Industry: India and the Global Context
Page | 61
Smelting is the most energy‐intensive step in the production of aluminium and is based on the Hall‐Héroult process. Alumina is dissolved in an electrolytic bath of molten cryolite within a large carbon‐ or graphite‐lined steel container known as a "pot". A low‐voltage, very high‐amperage electric current is passed through the electrolyte between a carbon anode, which is made of petroleum coke and pitch, and a cathode, which is formed by the lining of the pot. The strongly bonded aluminium and oxygen atoms in the alumina are split as the high current pulls oxygen ions towards the anode where they react with the carbon, leaving molten aluminium that is deposited at the bottom of the pot and siphoned off from time to time.
More than 80% of global primary aluminium production now comes from smelters using modern pre‐baked anodes, although some facilities still use an older Søderberg technology with in situ baked anodes (Figure 32). Pre‐baked smelters use between 13.6 Megawatt‐hour per tonne of aluminium (MWh/t) and 15.7 MWh/t aluminium whereas Søderberg smelters use between 15.1 MWh/t aluminium and 17.5 MWh/t aluminium (EC, 2008).
Figure 32: Smelter technology mix, 1990 to 2008
Notes: CWPB – centre work pre‐bake; HSS – horizontal stud Søderberg; PFPB – point fed pre‐bake; SWPB – side work pre‐bake; and VSS ‐ vertical stud Søderberg.
Source: IAI, 2009c.
Specific power consumption for primary aluminium production has declined in most regions. This has been achieved by building new refineries that are more energy efficient and by retrofitting old refineries with new cells. Global average electricity consumption in the industry has declined by about 0.4% per year since 1980. It is now around 15.4 MWh/t aluminium. This differs only slightly among regions. Africa has the most energy‐efficient smelters in the IAI dataset, reflecting their relatively young age. However, anecdotal evidence suggests that China, which is not included in the IAI energy statistics, has a more energy‐efficient production on average (Tao and Liang, 2008).

Energy Transition for Industry: India and the Global Context © OECD/IEA 2011
Page | 62
Best available technology and technical savings potentials
There are a number of ways to improve the energy efficiency of alumina production in the Bayer process. Improved process controls and modified equipment can increase yields. Heat losses can be reduced by: using more CHP; improving heat transfer efficiency; updating calciner technologies and operations; and adopting more effective waste‐heat recovery. Such measures could reduce the total use of fuel and electricity to between 9.5 GJ/t alumina and 10 GJ/t alumina (ISR, 2000; Worrell et al., 2008), which is a 40% saving on the global 2007 average consumption of 16.6 GJ/t alumina.
Like many other countries, India could save a significant amount of energy in the aluminium sector by applying BATs. Given that the primary production process is relatively energy efficient, about two‐thirds of these savings, 338 thousands of tonnes of oil equivalent (ktoe), could come from improving the efficiency of the refineries. Overall, the savings would amount to 507 ktoe or about 18% of the total energy consumed by the sector in 2007.
Globally, the performance of smelters has improved significantly in recent years, but there remains considerable scope for further energy savings. The main opportunities involve: replacing old smelter technologies with modern pre‐baked cells; developing process controls that optimise cell‐operating conditions; improving insulation to reduce heat losses; and saving electricity in auxiliary technology such as compressors and fans. New world‐class plants can achieve around 13.5 megawatt‐hour per tonne of aluminium (MWh/t aluminium) (Keniry, 2001), a saving of 13% compared to the current world average.
Smaller energy savings are also possible in other processes, such as in anode manufacture and in recycling. The BAT fuel consumption for anode production is 2.45 GJ/t anode (Worrell et al., 2008), around 70% less than the current global average. The BAT for recycling using natural gas‐fired regenerative furnaces consumes between 2.0 GJ/t aluminium and 2.5 GJ/t aluminium (Worrell et al., 2008; Bayliss and Marks, 2008), which is around 50% less than conventional cold air technologies. BATs provide the possibility to reduce energy use in aluminium production by up to 10% compared with current levels (Figure 33).
Figure 33: Energy savings potential in 2007 for aluminium, based on BAT
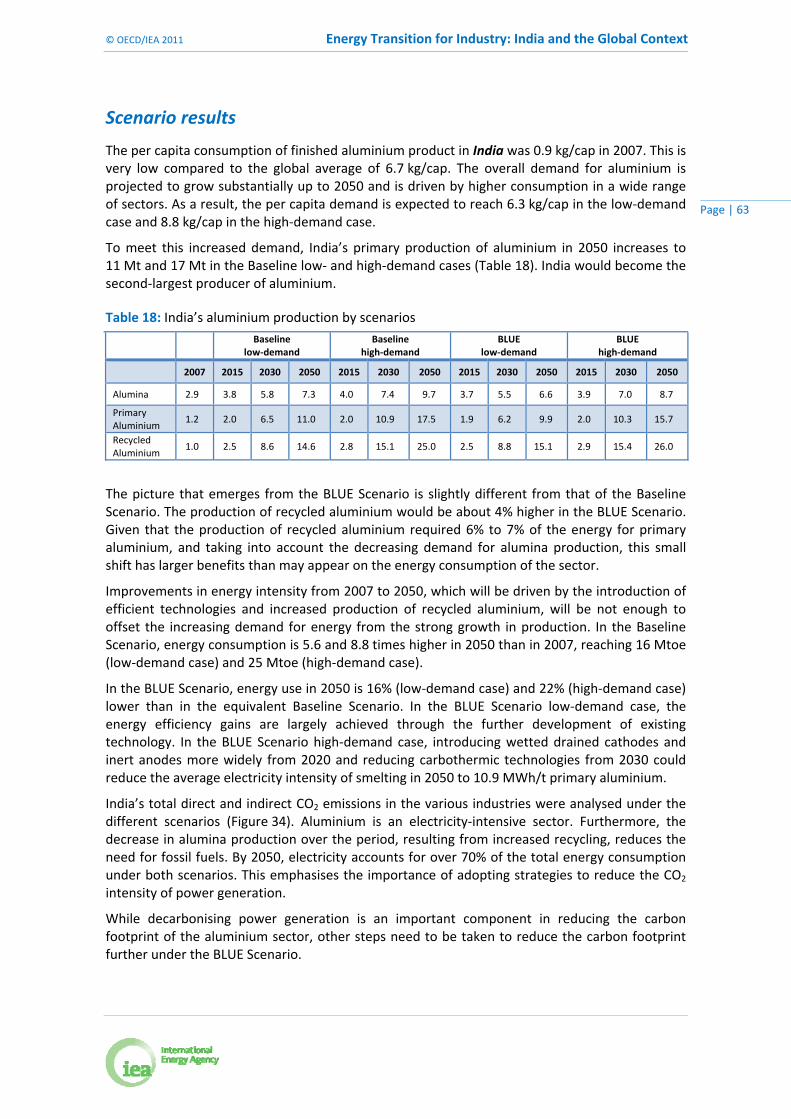
© OECD/IEA 2011 Energy Transition for Industry: India and the Global Context
Page | 63
Scenario results
The per capita consumption of finished aluminium product in India was 0.9 kg/cap in 2007. This is very low compared to the global average of 6.7 kg/cap. The overall demand for aluminium is projected to grow substantially up to 2050 and is driven by higher consumption in a wide range of sectors. As a result, the per capita demand is expected to reach 6.3 kg/cap in the low‐demand case and 8.8 kg/cap in the high‐demand case.
To meet this increased demand, India’s primary production of aluminium in 2050 increases to 11 Mt and 17 Mt in the Baseline low‐ and high‐demand cases (Table 18). India would become the second‐largest producer of aluminium.
Table 18: India’s aluminium production by scenarios
Baseline low‐demand
Baselinehigh‐demand
BLUElow‐demand
BLUE high‐demand
2007 2015 2030 2050 2015 2030 2050 2015 2030 2050 2015 2030 2050
Alumina 2.9 3.8 5.8 7.3 4.0 7.4 9.7 3.7 5.5 6.6 3.9 7.0 8.7
Primary Aluminium
1.2 2.0 6.5 11.0 2.0 10.9 17.5 1.9 6.2 9.9 2.0 10.3 15.7
Recycled Aluminium
1.0 2.5 8.6 14.6 2.8 15.1 25.0 2.5 8.8 15.1 2.9 15.4 26.0
The picture that emerges from the BLUE Scenario is slightly different from that of the Baseline Scenario. The production of recycled aluminium would be about 4% higher in the BLUE Scenario. Given that the production of recycled aluminium required 6% to 7% of the energy for primary aluminium, and taking into account the decreasing demand for alumina production, this small shift has larger benefits than may appear on the energy consumption of the sector.
Improvements in energy intensity from 2007 to 2050, which will be driven by the introduction of efficient technologies and increased production of recycled aluminium, will be not enough to offset the increasing demand for energy from the strong growth in production. In the Baseline Scenario, energy consumption is 5.6 and 8.8 times higher in 2050 than in 2007, reaching 16 Mtoe (low‐demand case) and 25 Mtoe (high‐demand case).
In the BLUE Scenario, energy use in 2050 is 16% (low‐demand case) and 22% (high‐demand case) lower than in the equivalent Baseline Scenario. In the BLUE Scenario low‐demand case, the energy efficiency gains are largely achieved through the further development of existing technology. In the BLUE Scenario high‐demand case, introducing wetted drained cathodes and inert anodes more widely from 2020 and reducing carbothermic technologies from 2030 could reduce the average electricity intensity of smelting in 2050 to 10.9 MWh/t primary aluminium.
India’s total direct and indirect CO2 emissions in the various industries were analysed under the different scenarios (Figure 34). Aluminium is an electricity‐intensive sector. Furthermore, the decrease in alumina production over the period, resulting from increased recycling, reduces the need for fossil fuels. By 2050, electricity accounts for over 70% of the total energy consumption under both scenarios. This emphasises the importance of adopting strategies to reduce the CO2 intensity of power generation.
While decarbonising power generation is an important component in reducing the carbon footprint of the aluminium sector, other steps need to be taken to reduce the carbon footprint further under the BLUE Scenario.
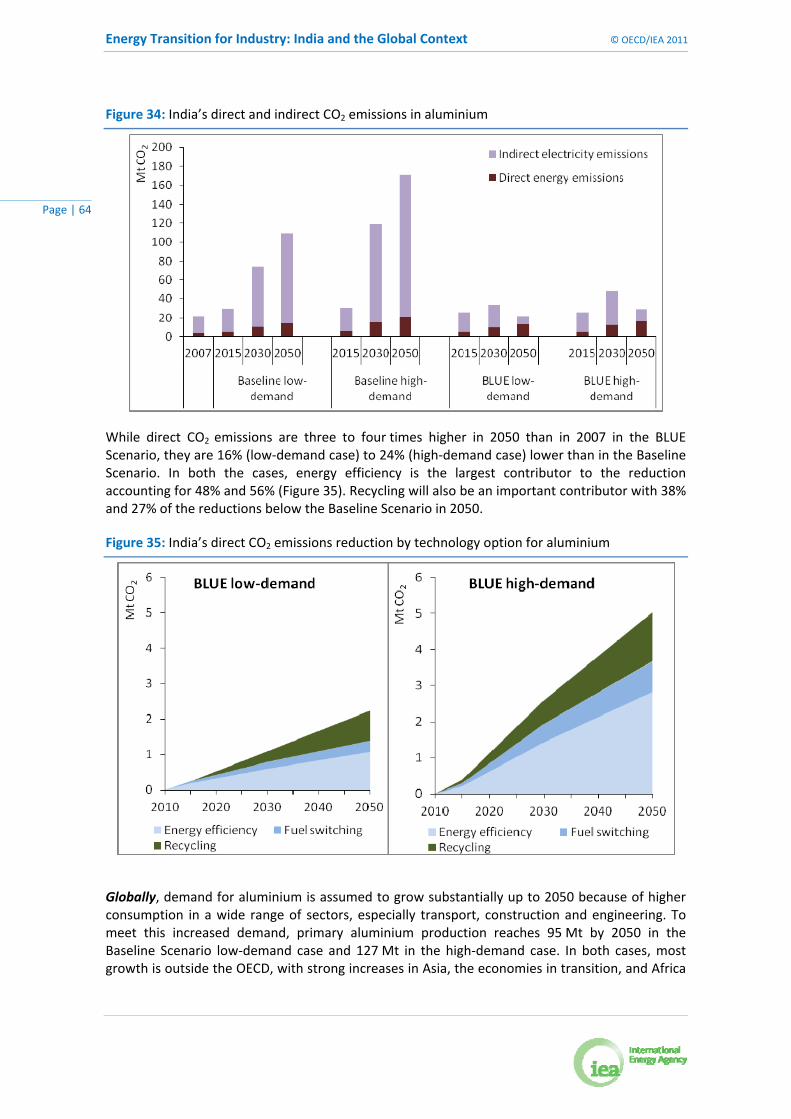
Energy Transition for Industry: India and the Global Context © OECD/IEA 2011
Page | 64
Figure 34: India’s direct and indirect CO2 emissions in aluminium
While direct CO2 emissions are three to four times higher in 2050 than in 2007 in the BLUE Scenario, they are 16% (low‐demand case) to 24% (high‐demand case) lower than in the Baseline Scenario. In both the cases, energy efficiency is the largest contributor to the reduction accounting for 48% and 56% (Figure 35). Recycling will also be an important contributor with 38% and 27% of the reductions below the Baseline Scenario in 2050.
Figure 35: India’s direct CO2 emissions reduction by technology option for aluminium
Globally, demand for aluminium is assumed to grow substantially up to 2050 because of higher consumption in a wide range of sectors, especially transport, construction and engineering. To meet this increased demand, primary aluminium production reaches 95 Mt by 2050 in the Baseline Scenario low‐demand case and 127 Mt in the high‐demand case. In both cases, most growth is outside the OECD, with strong increases in Asia, the economies in transition, and Africa
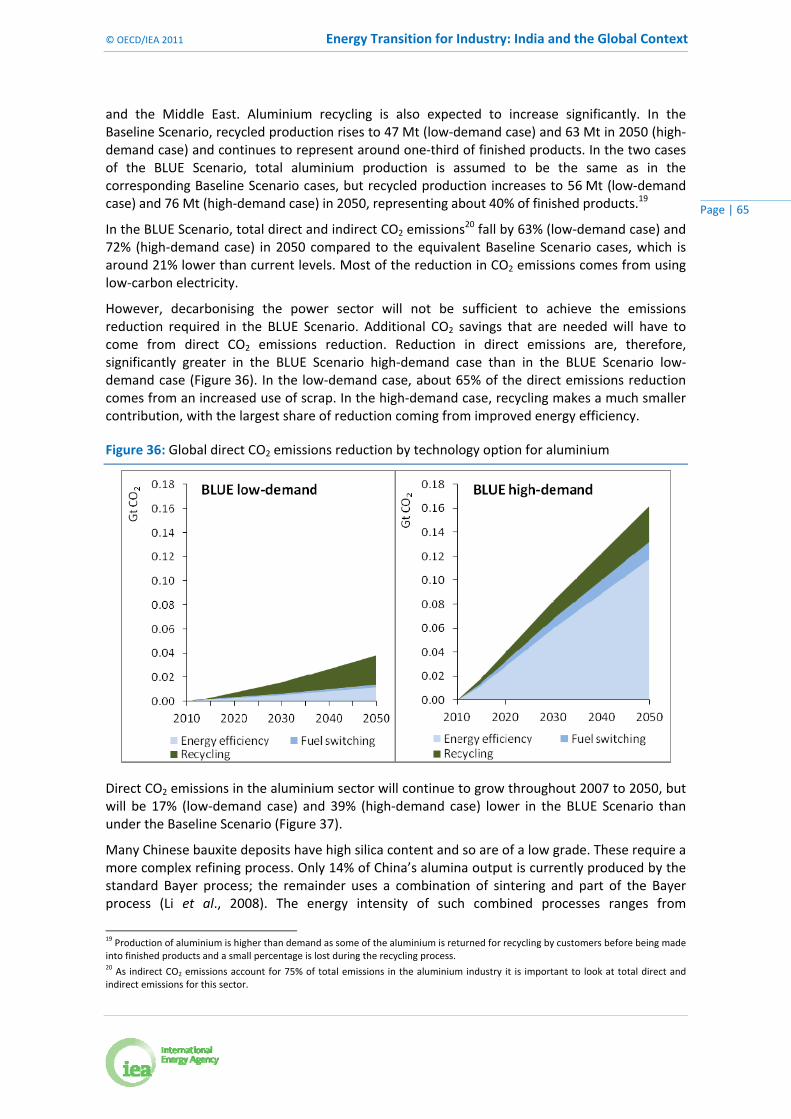
© OECD/IEA 2011 Energy Transition for Industry: India and the Global Context
Page | 65
and the Middle East. Aluminium recycling is also expected to increase significantly. In the Baseline Scenario, recycled production rises to 47 Mt (low‐demand case) and 63 Mt in 2050 (high‐demand case) and continues to represent around one‐third of finished products. In the two cases of the BLUE Scenario, total aluminium production is assumed to be the same as in the corresponding Baseline Scenario cases, but recycled production increases to 56 Mt (low‐demand case) and 76 Mt (high‐demand case) in 2050, representing about 40% of finished products.19
In the BLUE Scenario, total direct and indirect CO2 emissions20 fall by 63% (low‐demand case) and 72% (high‐demand case) in 2050 compared to the equivalent Baseline Scenario cases, which is around 21% lower than current levels. Most of the reduction in CO2 emissions comes from using low‐carbon electricity.
However, decarbonising the power sector will not be sufficient to achieve the emissions reduction required in the BLUE Scenario. Additional CO2 savings that are needed will have to come from direct CO2 emissions reduction. Reduction in direct emissions are, therefore, significantly greater in the BLUE Scenario high‐demand case than in the BLUE Scenario low‐demand case (Figure 36). In the low‐demand case, about 65% of the direct emissions reduction comes from an increased use of scrap. In the high‐demand case, recycling makes a much smaller contribution, with the largest share of reduction coming from improved energy efficiency.
Figure 36: Global direct CO2 emissions reduction by technology option for aluminium
Direct CO2 emissions in the aluminium sector will continue to grow throughout 2007 to 2050, but will be 17% (low‐demand case) and 39% (high‐demand case) lower in the BLUE Scenario than under the Baseline Scenario (Figure 37).
Many Chinese bauxite deposits have high silica content and so are of a low grade. These require a more complex refining process. Only 14% of China’s alumina output is currently produced by the standard Bayer process; the remainder uses a combination of sintering and part of the Bayer process (Li et al., 2008). The energy intensity of such combined processes ranges from
19 Production of aluminium is higher than demand as some of the aluminium is returned for recycling by customers before being made
into finished products and a small percentage is lost during the recycling process. 20 As indirect CO2 emissions account for 75% of total emissions in the aluminium industry it is important to look at total direct and
indirect emissions for this sector.
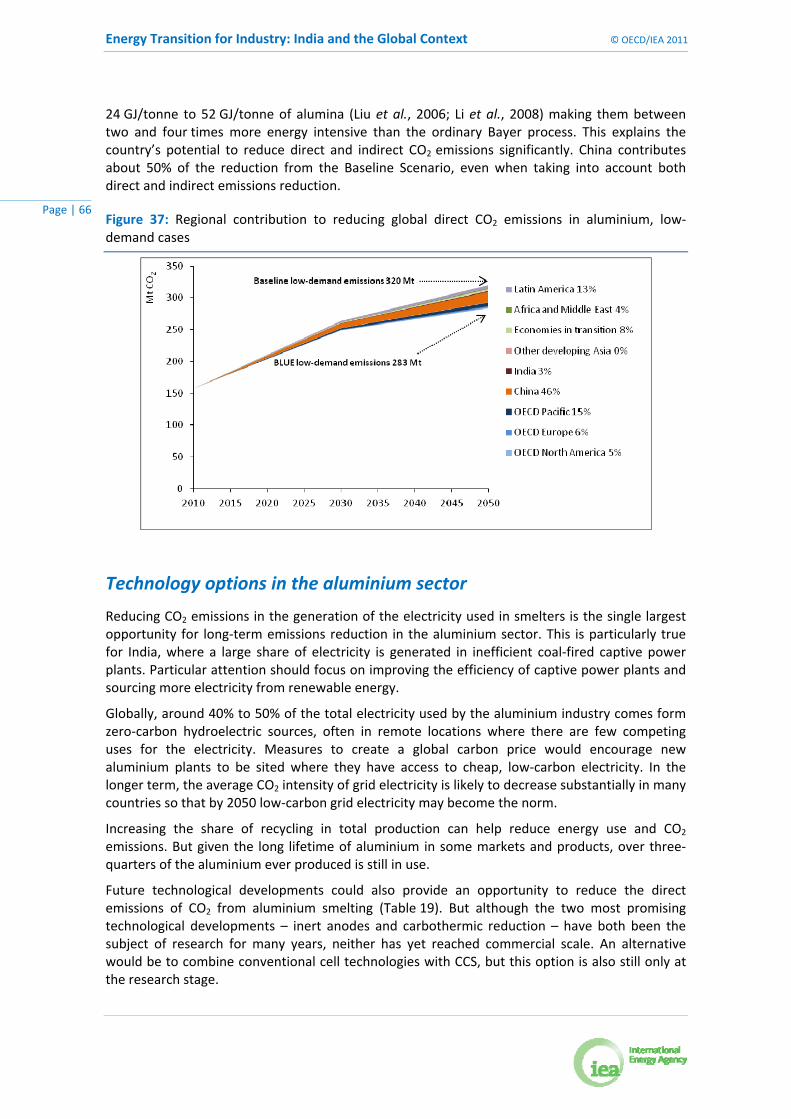
Energy Transition for Industry: India and the Global Context © OECD/IEA 2011
Page | 66
24 GJ/tonne to 52 GJ/tonne of alumina (Liu et al., 2006; Li et al., 2008) making them between two and four times more energy intensive than the ordinary Bayer process. This explains the country’s potential to reduce direct and indirect CO2 emissions significantly. China contributes about 50% of the reduction from the Baseline Scenario, even when taking into account both direct and indirect emissions reduction.
Figure 37: Regional contribution to reducing global direct CO2 emissions in aluminium, low‐demand cases
Technology options in the aluminium sector
Reducing CO2 emissions in the generation of the electricity used in smelters is the single largest opportunity for long‐term emissions reduction in the aluminium sector. This is particularly true for India, where a large share of electricity is generated in inefficient coal‐fired captive power plants. Particular attention should focus on improving the efficiency of captive power plants and sourcing more electricity from renewable energy.
Globally, around 40% to 50% of the total electricity used by the aluminium industry comes form zero‐carbon hydroelectric sources, often in remote locations where there are few competing uses for the electricity. Measures to create a global carbon price would encourage new aluminium plants to be sited where they have access to cheap, low‐carbon electricity. In the longer term, the average CO2 intensity of grid electricity is likely to decrease substantially in many countries so that by 2050 low‐carbon grid electricity may become the norm.
Increasing the share of recycling in total production can help reduce energy use and CO2 emissions. But given the long lifetime of aluminium in some markets and products, over three‐quarters of the aluminium ever produced is still in use.
Future technological developments could also provide an opportunity to reduce the direct emissions of CO2 from aluminium smelting (Table 19). But although the two most promising technological developments – inert anodes and carbothermic reduction – have both been the subject of research for many years, neither has yet reached commercial scale. An alternative would be to combine conventional cell technologies with CCS, but this option is also still only at the research stage.
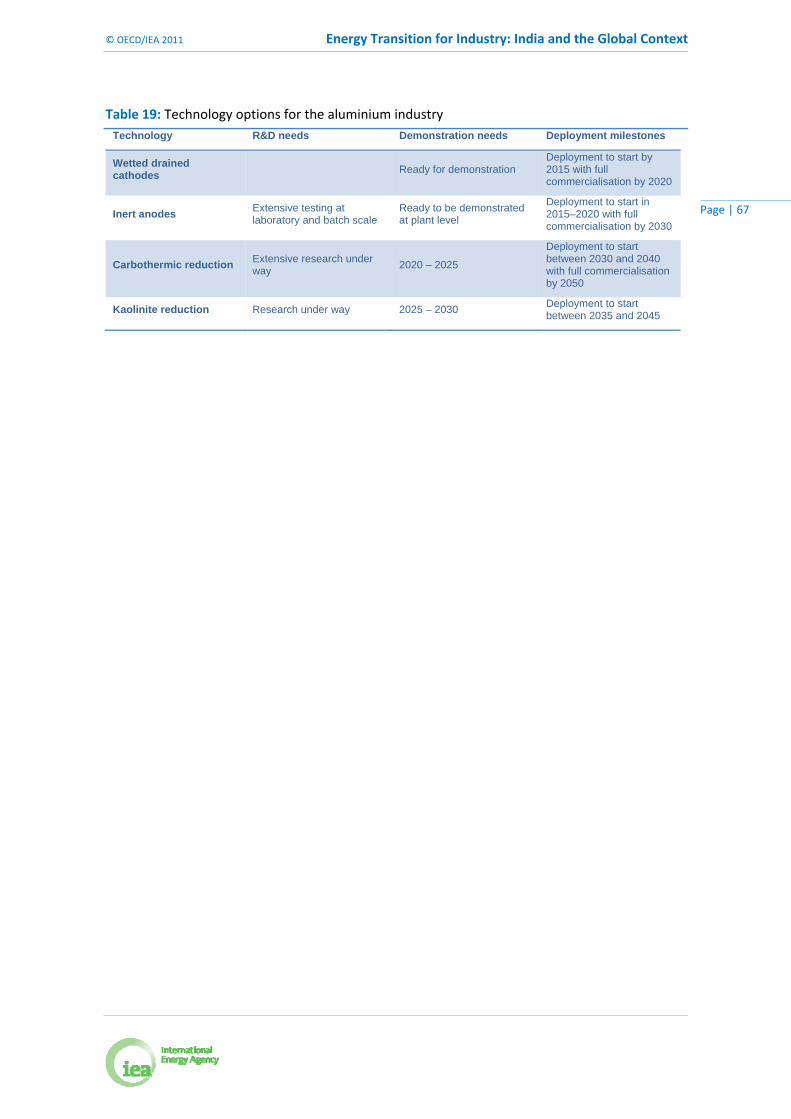
© OECD/IEA 2011 Energy Transition for Industry: India and the Global Context
Page | 67
Table 19: Technology options for the aluminium industry
Technology R&D needs Demonstration needs Deployment milestones
Wetted drained cathodes
Ready for demonstration Deployment to start by 2015 with full commercialisation by 2020
Inert anodes Extensive testing at laboratory and batch scale
Ready to be demonstrated at plant level
Deployment to start in 2015–2020 with full commercialisation by 2030
Carbothermic reduction Extensive research under way
2020 – 2025
Deployment to start between 2030 and 2040 with full commercialisation by 2050
Kaolinite reduction Research under way 2025 – 2030 Deployment to start between 2035 and 2045

Energy Transition for Industry: India and the Global Context © OECD/IEA 2011
Page | 68
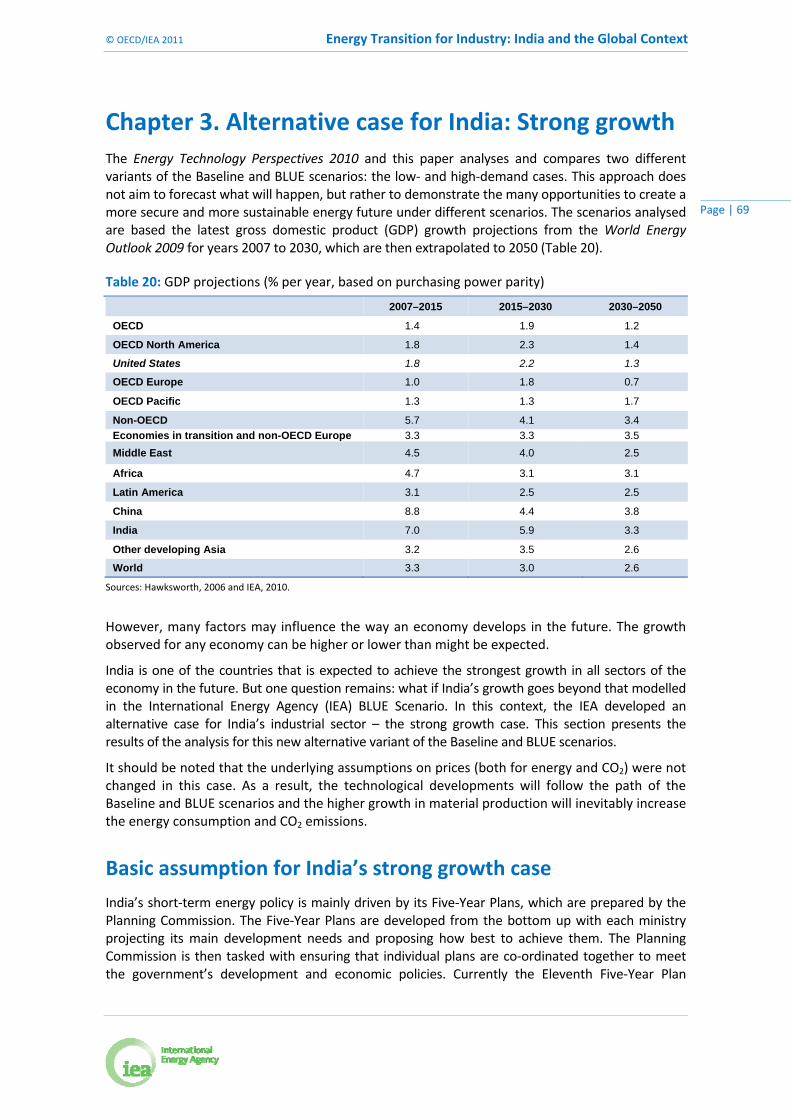
© OECD/IEA 2011 Energy Transition for Industry: India and the Global Context
Page | 69
Chapter 3. Alternative case for India: Strong growth The Energy Technology Perspectives 2010 and this paper analyses and compares two different variants of the Baseline and BLUE scenarios: the low‐ and high‐demand cases. This approach does not aim to forecast what will happen, but rather to demonstrate the many opportunities to create a more secure and more sustainable energy future under different scenarios. The scenarios analysed are based the latest gross domestic product (GDP) growth projections from the World Energy Outlook 2009 for years 2007 to 2030, which are then extrapolated to 2050 (Table 20).
Table 20: GDP projections (% per year, based on purchasing power parity)
2007–2015 2015–2030 2030–2050
OECD 1.4 1.9 1.2
OECD North America 1.8 2.3 1.4
United States 1.8 2.2 1.3
OECD Europe 1.0 1.8 0.7
OECD Pacific 1.3 1.3 1.7
Non-OECD 5.7 4.1 3.4
Economies in transition and non-OECD Europe 3.3 3.3 3.5
Middle East 4.5 4.0 2.5
Africa 4.7 3.1 3.1
Latin America 3.1 2.5 2.5
China 8.8 4.4 3.8
India 7.0 5.9 3.3
Other developing Asia 3.2 3.5 2.6
World 3.3 3.0 2.6
Sources: Hawksworth, 2006 and IEA, 2010.
However, many factors may influence the way an economy develops in the future. The growth observed for any economy can be higher or lower than might be expected.
India is one of the countries that is expected to achieve the strongest growth in all sectors of the economy in the future. But one question remains: what if India’s growth goes beyond that modelled in the International Energy Agency (IEA) BLUE Scenario. In this context, the IEA developed an alternative case for India’s industrial sector – the strong growth case. This section presents the results of the analysis for this new alternative variant of the Baseline and BLUE scenarios.
It should be noted that the underlying assumptions on prices (both for energy and CO2) were not changed in this case. As a result, the technological developments will follow the path of the Baseline and BLUE scenarios and the higher growth in material production will inevitably increase the energy consumption and CO2 emissions.
Basic assumption for India’s strong growth case
India’s short‐term energy policy is mainly driven by its Five‐Year Plans, which are prepared by the Planning Commission. The Five‐Year Plans are developed from the bottom up with each ministry projecting its main development needs and proposing how best to achieve them. The Planning Commission is then tasked with ensuring that individual plans are co‐ordinated together to meet the government’s development and economic policies. Currently the Eleventh Five‐Year Plan

Energy Transition for Industry: India and the Global Context © OECD/IEA 2011
Page | 70
(2007–2012) is being implemented (GoI, 2008). This plan sets a target for 9% growth in GDP in the five‐year period 2007/08 to 2011/12 with acceleration during the period to reach 10% by the end of the plan. The intent is to maintain a 10% growth in the following Five‐Year Plan (2012/13 to 2016/17) in order to double the per capita income by the end of the Twelfth Five‐Year Plan.
Table 21: High‐level indicators for India in ETP 2010 and strong growth cases
ETP 2010 Strong growth
2007 2015 2030 2050 2015 2030 2050
GDP (billion USD using purchasing power parity) 4 025 6 916 16 340 31 280 8 020 25 189 55 192
GDP (billion USD using exchange rates) 771 1 325 3 131 5 993 1 536 4 826 10 574
GDP per capita (thousands USD using exchange rates) 3 583 5 343 11 007 19 383 6 197 16 967 34 200
GDP per capita (thousands USD using purchasing power parity) 686 1 024 2 109 3 713 1 187 3 251 6 552
Growth rate from previous period - 7.0% 5.9% 3.3% 9.0% 9.0% 6.3%
Note: GDP is expressed in constant 2000 USD.
Taking these targets into account, the IEA has developed the alternative “strong growth” case where the annual growth rate of GDP is higher than that used to develop ETP 2010 (Table 21). Under the strong growth case, GDP would increase by 9% per year until 2030, and then by 6.3% per year between 2030 and 2050. Indian GDP would be 75% higher in 2050 than in the ETP 2010 scenario. GDP per capita in 2050 will be about 35% higher than the world average of USD 25 100 and similar to GDP per capita in the European Union.
Materials consumption and production under the strong growth case
Such a growth in the GDP per capita will have an important impact on the level of materials demanded by the population. This is reflected in the demand projections in Table 22, represented in kilograms per capita (kg/cap). India’s demand for most materials in 2050 as represented in the strong growth case will be slightly higher than the world average. The noticeable exceptions are: chemicals and petrochemicals for which demand in India will be slightly lower than the world average; and cement for which demand will be twice as high as the world average.
Table 22: India’s materials demand per capita, kg/cap
ETP 2010 low-demand
ETP 2010 high-demand
Strong growth
2007 2030 2050 2030 2050 2030 2050
Primary aluminium 1 4 6 4 6 12 21
Cement 151 325 400 325 400 620 1 026
Chemicals and petrochemicals
HVC 9 17 28 17 28 36 65
Ammonia 12 16 19 16 19 22 29
Methanol 0.1 0.4 0.6 0.4 0.6 0.5 1.0
Iron and steel 49 150 200 150 200 250 350
Paper and paperboard 8 23 43 23 43 52 121
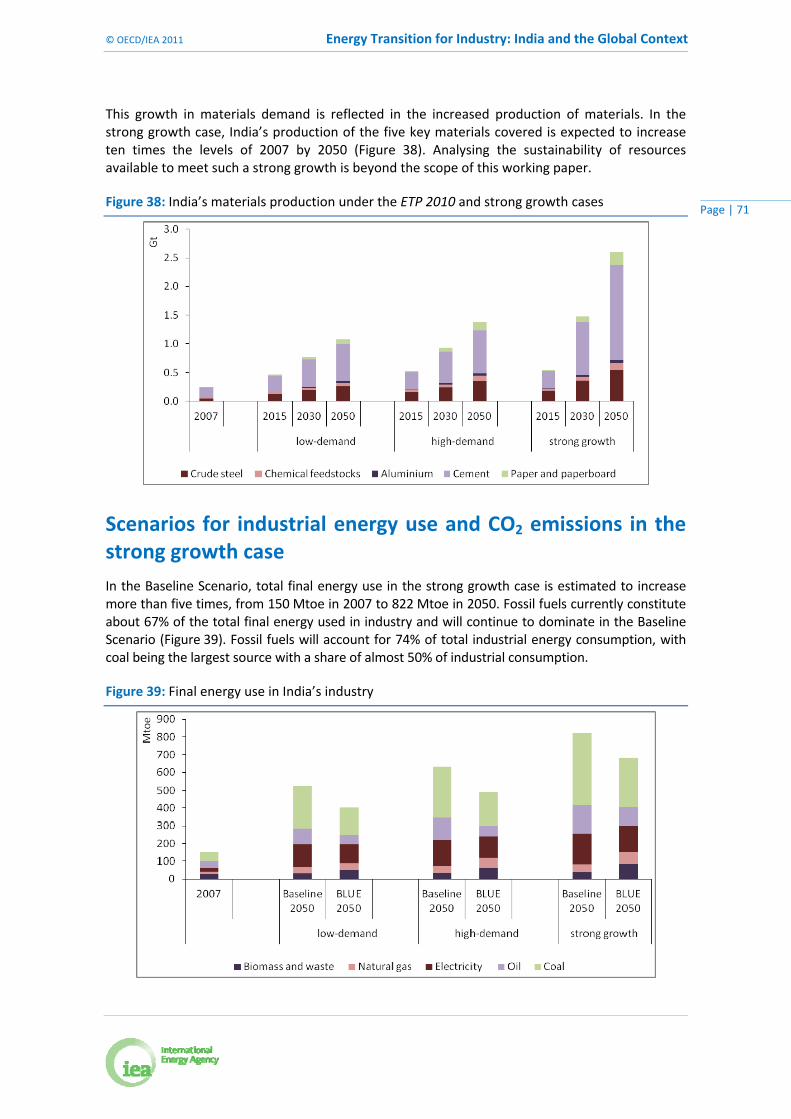
© OECD/IEA 2011 Energy Transition for Industry: India and the Global Context
Page | 71
This growth in materials demand is reflected in the increased production of materials. In the strong growth case, India’s production of the five key materials covered is expected to increase ten times the levels of 2007 by 2050 (Figure 38). Analysing the sustainability of resources available to meet such a strong growth is beyond the scope of this working paper.
Figure 38: India’s materials production under the ETP 2010 and strong growth cases
Scenarios for industrial energy use and CO2 emissions in the strong growth case
In the Baseline Scenario, total final energy use in the strong growth case is estimated to increase more than five times, from 150 Mtoe in 2007 to 822 Mtoe in 2050. Fossil fuels currently constitute about 67% of the total final energy used in industry and will continue to dominate in the Baseline Scenario (Figure 39). Fossil fuels will account for 74% of total industrial energy consumption, with coal being the largest source with a share of almost 50% of industrial consumption.
Figure 39: Final energy use in India’s industry
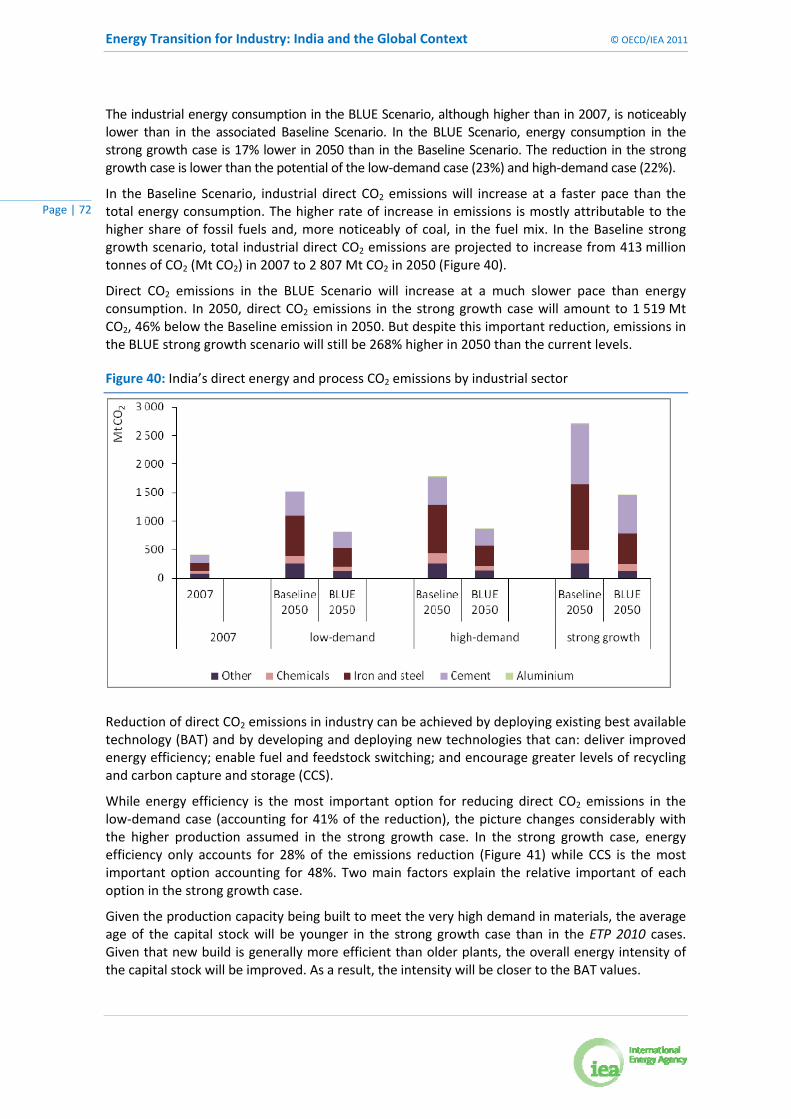
Energy Transition for Industry: India and the Global Context © OECD/IEA 2011
Page | 72
The industrial energy consumption in the BLUE Scenario, although higher than in 2007, is noticeably lower than in the associated Baseline Scenario. In the BLUE Scenario, energy consumption in the strong growth case is 17% lower in 2050 than in the Baseline Scenario. The reduction in the strong growth case is lower than the potential of the low‐demand case (23%) and high‐demand case (22%).
In the Baseline Scenario, industrial direct CO2 emissions will increase at a faster pace than the total energy consumption. The higher rate of increase in emissions is mostly attributable to the higher share of fossil fuels and, more noticeably of coal, in the fuel mix. In the Baseline strong growth scenario, total industrial direct CO2 emissions are projected to increase from 413 million tonnes of CO2 (Mt CO2) in 2007 to 2 807 Mt CO2 in 2050 (Figure 40).
Direct CO2 emissions in the BLUE Scenario will increase at a much slower pace than energy consumption. In 2050, direct CO2 emissions in the strong growth case will amount to 1 519 Mt CO2, 46% below the Baseline emission in 2050. But despite this important reduction, emissions in the BLUE strong growth scenario will still be 268% higher in 2050 than the current levels.
Figure 40: India’s direct energy and process CO2 emissions by industrial sector
Reduction of direct CO2 emissions in industry can be achieved by deploying existing best available technology (BAT) and by developing and deploying new technologies that can: deliver improved energy efficiency; enable fuel and feedstock switching; and encourage greater levels of recycling and carbon capture and storage (CCS).
While energy efficiency is the most important option for reducing direct CO2 emissions in the low‐demand case (accounting for 41% of the reduction), the picture changes considerably with the higher production assumed in the strong growth case. In the strong growth case, energy efficiency only accounts for 28% of the emissions reduction (Figure 41) while CCS is the most important option accounting for 48%. Two main factors explain the relative important of each option in the strong growth case.
Given the production capacity being built to meet the very high demand in materials, the average age of the capital stock will be younger in the strong growth case than in the ETP 2010 cases. Given that new build is generally more efficient than older plants, the overall energy intensity of the capital stock will be improved. As a result, the intensity will be closer to the BAT values.
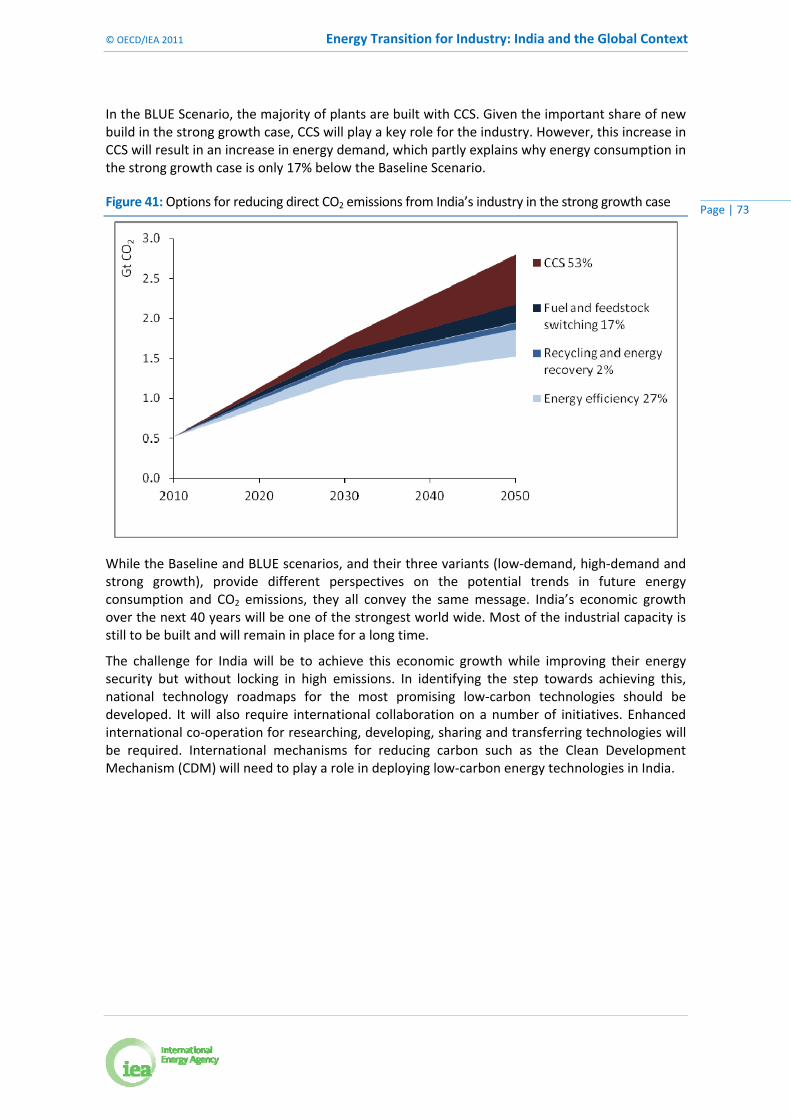
© OECD/IEA 2011 Energy Transition for Industry: India and the Global Context
Page | 73
In the BLUE Scenario, the majority of plants are built with CCS. Given the important share of new build in the strong growth case, CCS will play a key role for the industry. However, this increase in CCS will result in an increase in energy demand, which partly explains why energy consumption in the strong growth case is only 17% below the Baseline Scenario.
Figure 41: Options for reducing direct CO2 emissions from India’s industry in the strong growth case
While the Baseline and BLUE scenarios, and their three variants (low‐demand, high‐demand and strong growth), provide different perspectives on the potential trends in future energy consumption and CO2 emissions, they all convey the same message. India’s economic growth over the next 40 years will be one of the strongest world wide. Most of the industrial capacity is still to be built and will remain in place for a long time.
The challenge for India will be to achieve this economic growth while improving their energy security but without locking in high emissions. In identifying the step towards achieving this, national technology roadmaps for the most promising low‐carbon technologies should be developed. It will also require international collaboration on a number of initiatives. Enhanced international co‐operation for researching, developing, sharing and transferring technologies will be required. International mechanisms for reducing carbon such as the Clean Development Mechanism (CDM) will need to play a role in deploying low‐carbon energy technologies in India.

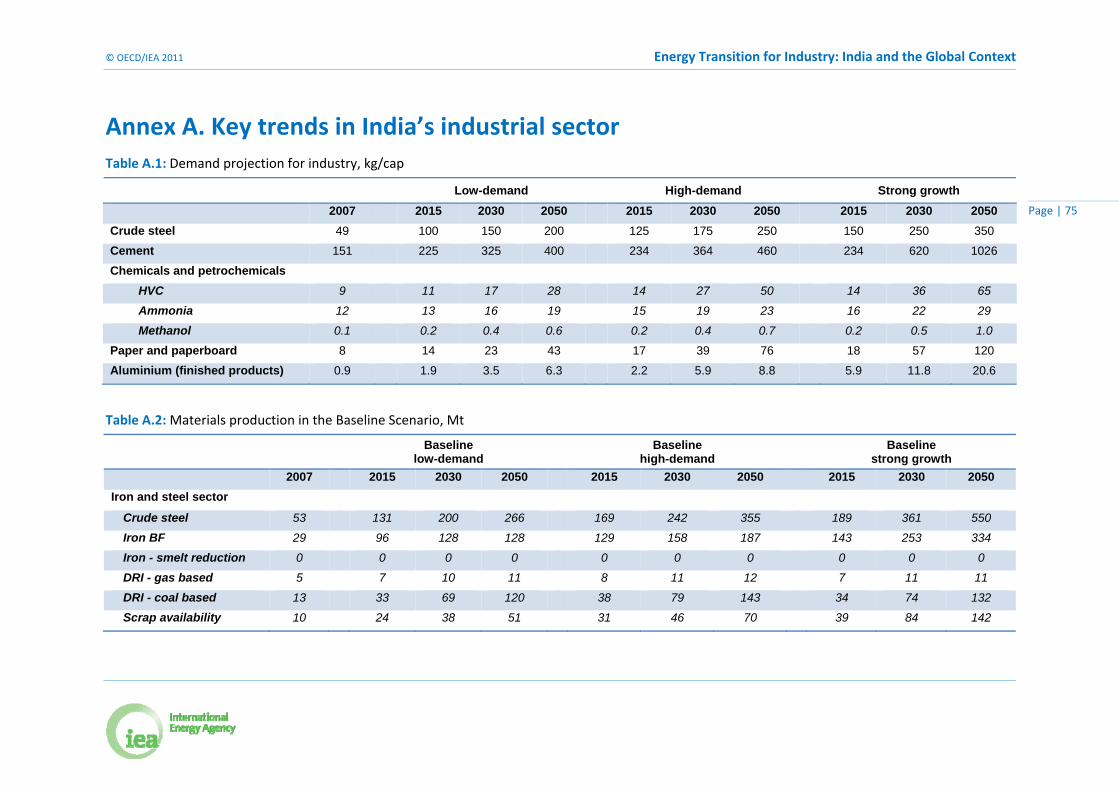
© OECD/IEA 2011 Energy Transition for Industry: India and the Global Context
Page | 75
Annex A. Key trends in India’s industrial sector Table A.1: Demand projection for industry, kg/cap
Low-demand High-demand Strong growth
2007 2015 2030 2050 2015 2030 2050 2015 2030 2050
Crude steel 49 100 150 200 125 175 250 150 250 350
Cement 151 225 325 400 234 364 460 234 620 1026
Chemicals and petrochemicals
HVC 9 11 17 28 14 27 50 14 36 65
Ammonia 12 13 16 19 15 19 23 16 22 29
Methanol 0.1 0.2 0.4 0.6 0.2 0.4 0.7 0.2 0.5 1.0
Paper and paperboard 8 14 23 43 17 39 76 18 57 120
Aluminium (finished products) 0.9 1.9 3.5 6.3 2.2 5.9 8.8 5.9 11.8 20.6
Table A.2: Materials production in the Baseline Scenario, Mt
Baseline low-demand
Baseline high-demand
Baseline strong growth
2007 2015 2030 2050 2015 2030 2050 2015 2030 2050
Iron and steel sector
Crude steel 53 131 200 266 169 242 355 189 361 550
Iron BF 29 96 128 128 129 158 187 143 253 334
Iron - smelt reduction 0 0 0 0 0 0 0 0 0 0
DRI - gas based 5 7 10 11 8 11 12 7 11 11
DRI - coal based 13 33 69 120 38 79 143 34 74 132
Scrap availability 10 24 38 51 31 46 70 39 84 142

Energy Transition for Industry: India and the Global Context © OECD/IEA 2011
Page | 76
Baseline low-demand
Baseline high-demand
Baseline strong growth
2007 2015 2030 2050 2015 2030 2050 2015 2030 2050
Cement sector
Cement 170 291 482 646 303 540 742 303 920 1656
Clinker-to-cement ratio 0.84 0.80 0.76 0.75 0.80 0.76 0.75 0.80 0.74 0.74
Chemical and petrochemical sector
Ethylene 3 5 10 18 6 16 31 7 21 41
Propylene 2 3 6 10 4 9 19 4 12 24
BTX 5 6 10 17 7 15 29 8 20 39
Ammonia 13 17 24 30 19 26 33 21 32 47
Methanol 0.1 0.2 0.4 0.8 0.2 0.5 1.0 0.2 0.6 1.4
Pulp and paper sector
Pulp 4 6 9 13 7 14 21 6 11 19
Chemical wood pulp 2 3 6 10 5 10 17 3 8 14
Mechanical wood pulp 0 1 1 1 1 1 2 1 1 3
Other fibre pulp 2 2 2 2 2 2 2 2 2 2
Paper and paperboard 8 17 38 81 22 67 148 23 95 232
Household and sanitary paper
0 0 3 6 1 5 11 1 7 18
Newsprint 1 2 4 7 3 9 17 3 10 24
Printing and writing paper
3 6 12 25 8 21 44 8 30 70
Wrapping, Packaging paper and board
3 8 17 38 9 29 68 10 43 108
Paper and paperboard NES
1 1 2 4 1 4 8 1 5 12
Recovered paper 1 3 9 23 4 16 43 4 23 68

© OECD/IEA 2011 Energy Transition for Industry: India and the Global Context
Page | 77
Baseline low-demand
Baseline high-demand
Baseline strong growth
2007 2015 2030 2050 2015 2030 2050 2015 2030 2050
Aluminium sector
Alumina 2.9 3.8 5.8 7.3 4.0 7.4 9.7 4.0 6.6 8.8
Primary aluminium 1.2 2.0 6.5 11.0 2.0 10.9 17.5 2.9 11.3 20.2
Recycled aluminium* 1.0 2.5 8.6 14.6 2.8 15.1 25.0 3.7 15.8 28.0
*Recycled aluminium includes all scrap (fabricator, traded new, old)
Table A.3: Materials production in the BLUE Scenario, Mt
BLUE low-demand
BLUE high-demand
BLUE strong growth
2007 2015 2030 2050 2015 2030 2050 2015 2030 2050
Iron and steel sector
Crude steel 53 131 200 266 169 242 355 189 361 550
Iron BF 29 99 150 190 134 184 242 141 253 344
Iron - smelt reduction 0 0 7 25 0 15 50 0 15 50
DRI - gas based 5 8 12 13 9 14 15 8 13 14
DRI - coal based 13 11 7 2 8 0 0 10 7 1
Scrap availability 10 25 40 57 32 48 76 44 102 183
Cement sector
Cement 170 291 482 646 303 540 742 303 920 1656
Clinker-to-cement ratio 0.84 0.77 0.72 0.71 0.76 0.72 0.69 0.76 0.71 0.71

Energy Transition for Industry: India and the Global Context © OECD/IEA 2011
Page | 78
BLUE low-demand
BLUE high-demand
BLUE strong growth
2007 2015 2030 2050 2015 2030 2050 2015 2030 2050
Chemicals and petrochemicals
Ethylene 3 5 9 16 6 14 25 7 20 36
Propylene 2 3 5 9 4 8 13 4 11 21
Benzene, Toluene, Xylene (BTX)
5 6 9 15 7 13 20 8 19 34
Ammonia 13 17 24 30 19 26 33 21 32 47
Methanol 0.1 0.2 0.4 0.8 0.2 0.5 1.0 0.2 0.6 1.4
Pulp and paper sector
Pulp 4 6 8 11 7 12 19 6 10 16
Chemical wood pulp 2 3 5 8 4 10 16 3 7 11
Mechanical wood pulp 0 1 1 1 1 1 1 1 1 3
Other fibre pulp 2 2 2 2 2 2 2 2 2 2
Paper and paperboard 8 17 38 81 22 67 148 23 95 232
Household and sanitary paper
0 0 3 6 1 5 11 1 7 18
Newsprint 1 2 4 7 3 9 17 3 10 24
Printing and writing paper
3 6 12 25 8 21 44 8 30 70
Wrapping, Packaging paper and board
3 8 17 38 9 29 68 10 43 108
Paper and paperboard NES
1 1 2 4 1 4 8 1 5 12
Aluminium sector
Alumina 2.9 3.7 5.5 6.6 3.9 7.0 8.7 4.0 6.8 8.6
Primary aluminium 1.2 1.9 6.2 9.9 2.0 10.3 15.7 2.9 11.6 19.8
Recycled aluminium* 1.0 2.5 8.8 15.1 2.9 15.4 26.0 3.7 16.2 29.7
*Recycled aluminium includes all scrap (fabricator, traded new, old)
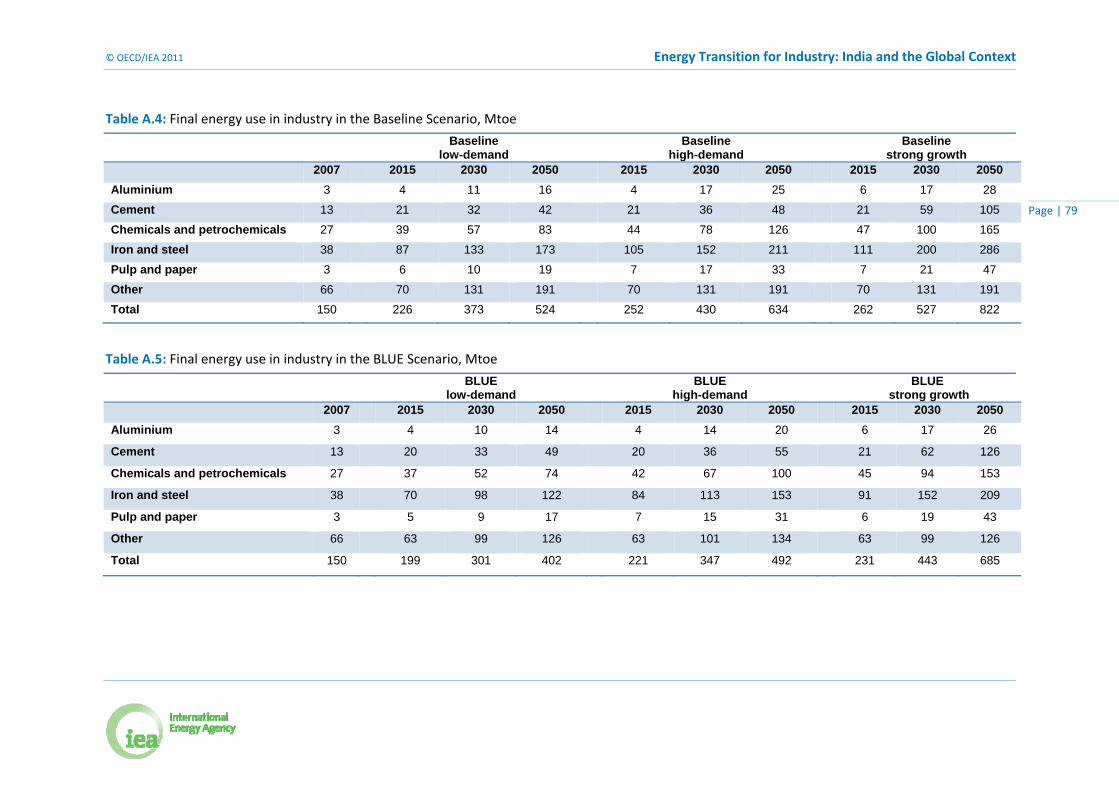
© OECD/IEA 2011 Energy Transition for Industry: India and the Global Context
Page | 79
Table A.4: Final energy use in industry in the Baseline Scenario, Mtoe
Baseline low-demand
Baselinehigh-demand
Baseline strong growth
2007 2015 2030 2050 2015 2030 2050 2015 2030 2050
Aluminium 3 4 11 16 4 17 25 6 17 28
Cement 13 21 32 42 21 36 48 21 59 105
Chemicals and petrochemicals 27 39 57 83 44 78 126 47 100 165
Iron and steel 38 87 133 173 105 152 211 111 200 286
Pulp and paper 3 6 10 19 7 17 33 7 21 47
Other 66 70 131 191 70 131 191 70 131 191
Total 150 226 373 524 252 430 634 262 527 822
Table A.5: Final energy use in industry in the BLUE Scenario, Mtoe
BLUE low-demand
BLUEhigh-demand
BLUE strong growth
2007 2015 2030 2050 2015 2030 2050 2015 2030 2050
Aluminium 3 4 10 14 4 14 20 6 17 26
Cement 13 20 33 49 20 36 55 21 62 126
Chemicals and petrochemicals 27 37 52 74 42 67 100 45 94 153
Iron and steel 38 70 98 122 84 113 153 91 152 209
Pulp and paper 3 5 9 17 7 15 31 6 19 43
Other 66 63 99 126 63 101 134 63 99 126
Total 150 199 301 402 221 347 492 231 443 685
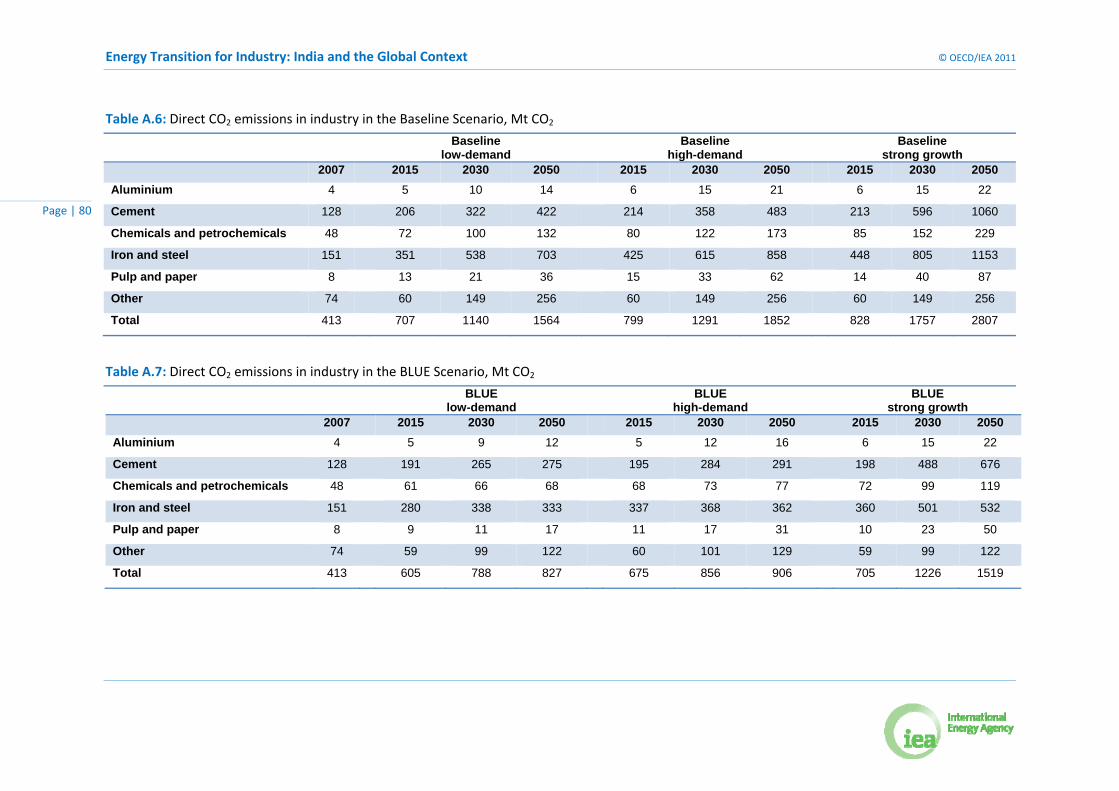
Energy Transition for Industry: India and the Global Context © OECD/IEA 2011
Page | 80
Table A.6: Direct CO2 emissions in industry in the Baseline Scenario, Mt CO2
Baseline low-demand
Baseline high-demand
Baseline strong growth
2007 2015 2030 2050 2015 2030 2050 2015 2030 2050
Aluminium 4 5 10 14 6 15 21 6 15 22
Cement 128 206 322 422 214 358 483 213 596 1060
Chemicals and petrochemicals 48 72 100 132 80 122 173 85 152 229
Iron and steel 151 351 538 703 425 615 858 448 805 1153
Pulp and paper 8 13 21 36 15 33 62 14 40 87
Other 74 60 149 256 60 149 256 60 149 256
Total 413 707 1140 1564 799 1291 1852 828 1757 2807
Table A.7: Direct CO2 emissions in industry in the BLUE Scenario, Mt CO2
BLUElow-demand
BLUEhigh-demand
BLUEstrong growth
2007 2015 2030 2050 2015 2030 2050 2015 2030 2050
Aluminium 4 5 9 12 5 12 16 6 15 22
Cement 128 191 265 275 195 284 291 198 488 676
Chemicals and petrochemicals 48 61 66 68 68 73 77 72 99 119
Iron and steel 151 280 338 333 337 368 362 360 501 532
Pulp and paper 8 9 11 17 11 17 31 10 23 50
Other 74 59 99 122 60 101 129 59 99 122
Total 413 605 788 827 675 856 906 705 1226 1519

© OECD/IEA 2011 Energy Transition for Industry: India and the Global Context
Page | 81
Annex B. Indicators for the chemical and petrochemical sector Best practice technology (BPT) values in Table B.1 are plant‐specific net energy requirements expressed as lower heating values. They refer to the core process excluding options for heat cascading and the process integration of material flows in individual plants on a site and for combined heat and power (CHP) systems. Steam exports from production processes with exothermic reactions, such as steam from steam cracking and from ammonia production, are expressed as negative values. This approach assumes that all excess heat can be used on site.
This table also reports electricity use, although the potential for energy efficiency has been established only for fuels, including steam. Only one‐third of total electricity use in the chemicals and petrochemicals sector can be accounted for by bottom‐up energy analysis using process energy data (IEA, 2009a). The remainder is probably used to run pumping equipment for pipelines and tanks and auxiliary uses for which no detailed data are available. The overall short‐ to medium‐term savings potential in electricity use in the sector has been estimated at 20% (IEA, 2009a).
Feedstock consumption is estimated by means of the calorific value of the chemicals resulting from the first conversion of fossil fuels to chemicals such as benzene, ethylene and propylene. These chemicals are raw materials used in the production of intermediates and their derivatives. To avoid counting them twice, the calorific values of intermediates and derivatives are excluded. As a result, it is not possible to attribute any improvements in energy efficiency to the feedstock used for the production of organic chemicals.
The system boundaries of the data used in this analysis can be described as “factory gate to factory gate”. For example, for steam cracking the data refer to the conversion of naphtha to olefins. For an intermediate chemical such as ethylene oxide, the data cover only the conversion of ethylene to ethylene oxide, excluding the raw materials and energy used in upstream processes.
Processes that result in several products are common in the chemicals and petrochemical sector. They represent a particular challenge when modelling energy use and carbon dioxide (CO2) emissions. This is especially the case for steam cracking, which is by far the largest multi‐product process in this sector. In this annex we use the definition of high‐value chemicals (HVCs) used by Solomon Associates (who are known for their benchmark studies on steam cracking). According to this definition, HVCs include ethylene, propylene from the pyrolysis gas of steam crackers, benzene (contained amounts, excluding extracted amounts), butadiene (also contained), acetylene and hydrogen (sold as fuel). Unlike the previous IEA publication (2008a), in this current analysis toluene and xylene have not been included in the definition of HVCs.
The average fuel use of a BPT steam cracker is 13.1 gigajoules per tonne (GJ/t) of HVCs. This value, shown in Table B.1, covers all steam cracker HVCs. The product of this value and the production volumes of HVCs results in a figure for the total BPT fuel use (in petajoules [PJ]) of steam crackers. The same calculation is repeated for steam, electricity and feedstock in order to calculate the total energy use of steam crackers.
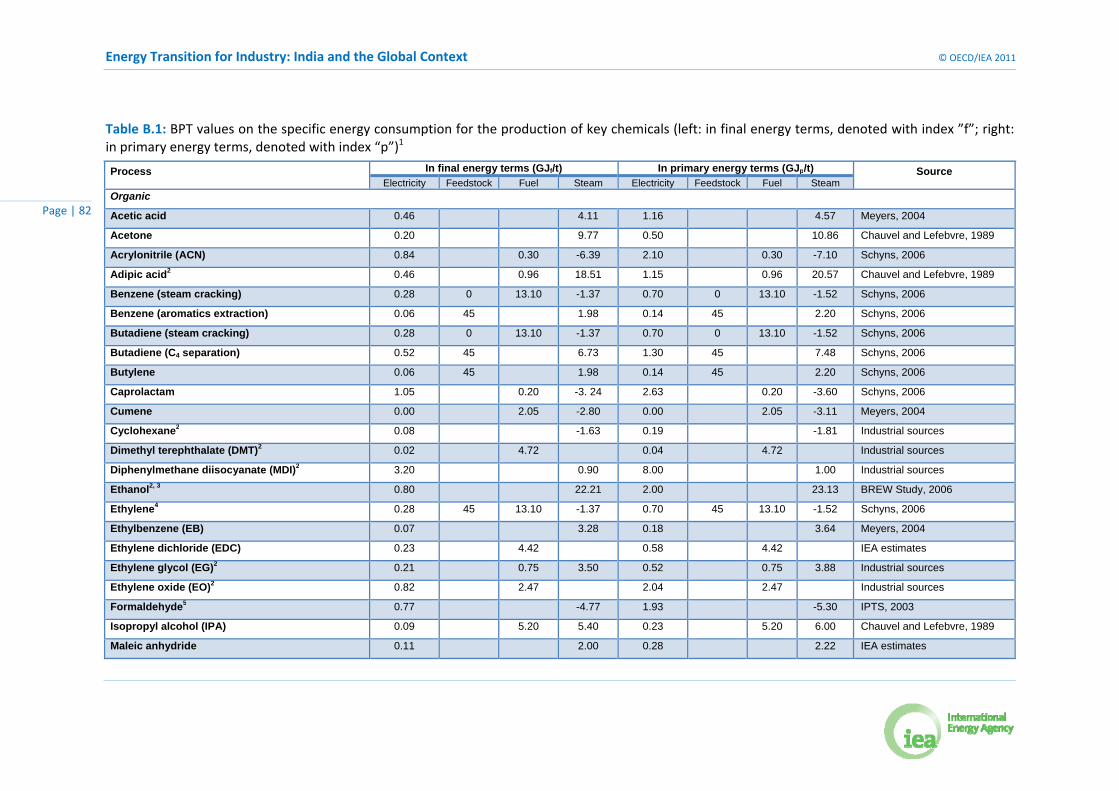
Energy Transition for Industry: India and the Global Context © OECD/IEA 2011
Page | 82
Table B.1: BPT values on the specific energy consumption for the production of key chemicals (left: in final energy terms, denoted with index ”f”; right: in primary energy terms, denoted with index “p”)1
Process In final energy terms (GJf/t) In primary energy terms (GJp/t) Source Electricity Feedstock Fuel Steam Electricity Feedstock Fuel Steam
Organic
Acetic acid 0.46 4.11 1.16 4.57 Meyers, 2004
Acetone 0.20 9.77 0.50 10.86 Chauvel and Lefebvre, 1989
Acrylonitrile (ACN) 0.84 0.30 -6.39 2.10 0.30 -7.10 Schyns, 2006
Adipic acid2 0.46 0.96 18.51 1.15 0.96 20.57 Chauvel and Lefebvre, 1989
Benzene (steam cracking) 0.28 0 13.10 -1.37 0.70 0 13.10 -1.52 Schyns, 2006
Benzene (aromatics extraction) 0.06 45 1.98 0.14 45 2.20 Schyns, 2006
Butadiene (steam cracking) 0.28 0 13.10 -1.37 0.70 0 13.10 -1.52 Schyns, 2006
Butadiene (C4 separation) 0.52 45 6.73 1.30 45 7.48 Schyns, 2006
Butylene 0.06 45 1.98 0.14 45 2.20 Schyns, 2006
Caprolactam 1.05 0.20 -3. 24 2.63 0.20 -3.60 Schyns, 2006
Cumene 0.00 2.05 -2.80 0.00 2.05 -3.11 Meyers, 2004
Cyclohexane2 0.08 -1.63 0.19 -1.81 Industrial sources
Dimethyl terephthalate (DMT)2 0.02 4.72 0.04 4.72 Industrial sources
Diphenylmethane diisocyanate (MDI)2 3.20 0.90 8.00 1.00 Industrial sources
Ethanol2, 3 0.80 22.21 2.00 23.13 BREW Study, 2006
Ethylene4 0.28 45 13.10 -1.37 0.70 45 13.10 -1.52 Schyns, 2006
Ethylbenzene (EB) 0.07 3.28 0.18 3.64 Meyers, 2004
Ethylene dichloride (EDC) 0.23 4.42 0.58 4.42 IEA estimates
Ethylene glycol (EG)2 0.21 0.75 3.50 0.52 0.75 3.88 Industrial sources
Ethylene oxide (EO)2 0.82 2.47 2.04 2.47 Industrial sources
Formaldehyde5 0.77 -4.77 1.93 -5.30 IPTS, 2003
Isopropyl alcohol (IPA) 0.09 5.20 5.40 0.23 5.20 6.00 Chauvel and Lefebvre, 1989
Maleic anhydride 0.11 2.00 0.28 2.22 IEA estimates

© OECD/IEA 2011 Energy Transition for Industry: India and the Global Context
Page | 83
Process In final energy terms (GJf/t) In primary energy terms (GJp/t) Source Electricity Feedstock Fuel Steam Electricity Feedstock Fuel Steam
Melamine5 1.89 7.90 3.87 4.73 7.90 4.30 Schyns, 2006
Methacrylate 0.11 2.00 0.28 2.22 IEA estimates
Methanol from natural gas6 20 8.50 20 9.44 IEA estimates
Methanol from coal6 20 12.75 20 16.06 IEA estimates
Methyl tertiary butyl ether (MTBE) 0.05 0.84 0.13 0.93 Schyns, 2006
Oxo alcohols 2.48 2.31 1.0 2.08 Meyers, 2004
Phenol 0.60 9.10 1.50 10.11 Meyers, 2004
Phthalic anhydride 0.70 20.00 1.75 20.00 IEA estimates
Propylene (steam cracking) 0.28 45 13.10 -1.37 0.70 45 13.10 -1.52 Schyns, 2006
Propylene (FCC)7 0.06 45 1.98 0.14 45 2.20 Schyns, 2006
Propylene oxide2 0.84 14.24 2.10 15.82 Industrial sources
Purified terephthalic acid (PTA) 0.30 2.60 0.75 2.89 Meyers, 2004
Styrene 7.70 8.56 JPCA, 2009
Toluene (aromatics extraction)8 0.06 22.5 1.98 0.14 22.5 2.20 Schyns, 2006
Toluene diisocyanate (TDI)5 2.80 21.70 7.00 24.11 Schyns, 2006
Xylene (aromatics extraction) 0.06 45 1.98 0.14 45 2.20 IEA estimates
p-Xylene 0.20 6.30 0.80 0.50 6.30 0.89 Schyns, 2006
Vinyl acetate monomer2 0.48 3.80 1.20 4.22 Industrial sources
Vinyl chloride monomer 0.40 2.70 1.00 2.70 Meyers, 2004
Urea 0.26 2.20 0.64 2.45 Schyns, 2006
Plastics
Phenolic resins5 10.00 11.11 IEA estimates
Polycarbonate 2.16 10.32 11.47 Schyns, 2006
Polyethylene, high density (HDPE) 0.86 0.99 2.15 1.10 Schyns, 2006
Polyethylene, low density (LDPE) 3.50 -2.14 8.75 -2.38 Schyns, 2006
Polyethylene, linear low density (LLDPE) 0.44 1.64 1.10 1.82 IPTS, 2007a
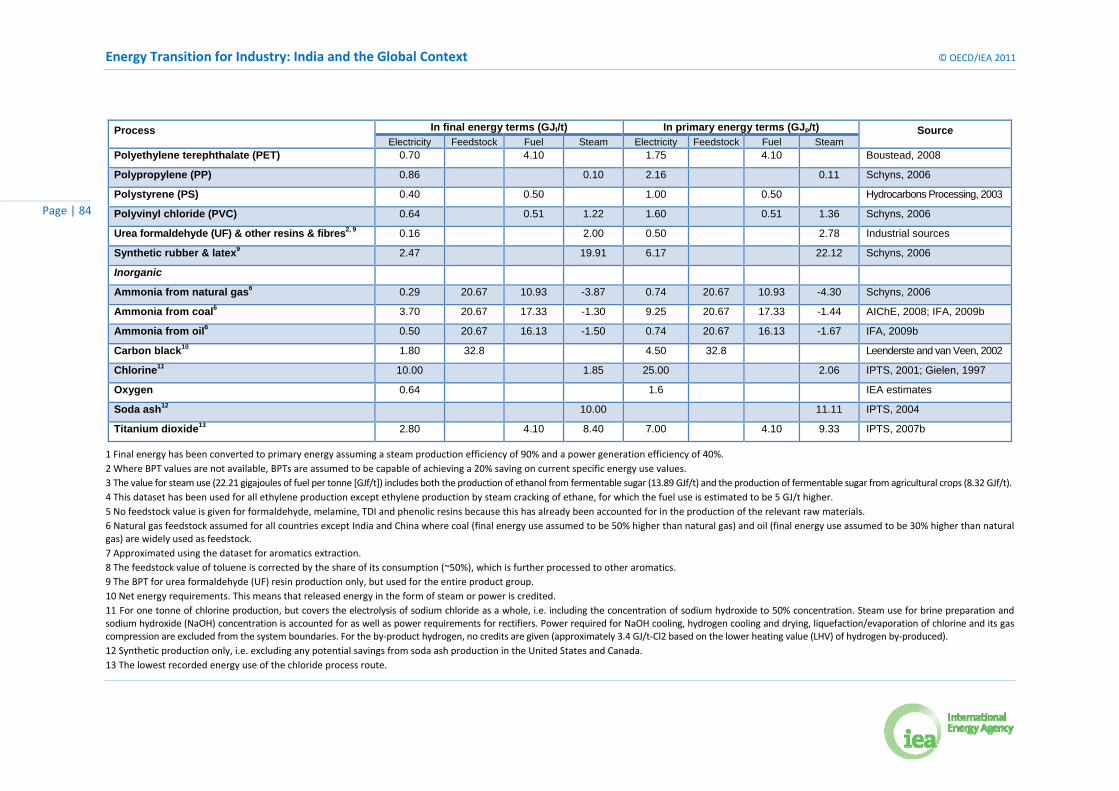
Energy Transition for Industry: India and the Global Context © OECD/IEA 2011
Page | 84
Process In final energy terms (GJf/t) In primary energy terms (GJp/t) Source Electricity Feedstock Fuel Steam Electricity Feedstock Fuel Steam
Polyethylene terephthalate (PET) 0.70 4.10 1.75 4.10 Boustead, 2008
Polypropylene (PP) 0.86 0.10 2.16 0.11 Schyns, 2006
Polystyrene (PS) 0.40 0.50 1.00 0.50 Hydrocarbons Processing, 2003
Polyvinyl chloride (PVC) 0.64 0.51 1.22 1.60 0.51 1.36 Schyns, 2006
Urea formaldehyde (UF) & other resins & fibres2, 9 0.16 2.00 0.50 2.78 Industrial sources
Synthetic rubber & latex9 2.47 19.91 6.17 22.12 Schyns, 2006
Inorganic
Ammonia from natural gas6 0.29 20.67 10.93 -3.87 0.74 20.67 10.93 -4.30 Schyns, 2006
Ammonia from coal6 3.70 20.67 17.33 -1.30 9.25 20.67 17.33 -1.44 AIChE, 2008; IFA, 2009b
Ammonia from oil6 0.50 20.67 16.13 -1.50 0.74 20.67 16.13 -1.67 IFA, 2009b
Carbon black10 1.80 32.8 4.50 32.8 Leenderste and van Veen, 2002
Chlorine11 10.00 1.85 25.00 2.06 IPTS, 2001; Gielen, 1997
Oxygen 0.64 1.6 IEA estimates
Soda ash12 10.00 11.11 IPTS, 2004
Titanium dioxide13 2.80 4.10 8.40 7.00 4.10 9.33 IPTS, 2007b
1 Final energy has been converted to primary energy assuming a steam production efficiency of 90% and a power generation efficiency of 40%.
2 Where BPT values are not available, BPTs are assumed to be capable of achieving a 20% saving on current specific energy use values.
3 The value for steam use (22.21 gigajoules of fuel per tonne [GJf/t]) includes both the production of ethanol from fermentable sugar (13.89 GJf/t) and the production of fermentable sugar from agricultural crops (8.32 GJf/t).
4 This dataset has been used for all ethylene production except ethylene production by steam cracking of ethane, for which the fuel use is estimated to be 5 GJ/t higher.
5 No feedstock value is given for formaldehyde, melamine, TDI and phenolic resins because this has already been accounted for in the production of the relevant raw materials.
6 Natural gas feedstock assumed for all countries except India and China where coal (final energy use assumed to be 50% higher than natural gas) and oil (final energy use assumed to be 30% higher than natural gas) are widely used as feedstock.
7 Approximated using the dataset for aromatics extraction.
8 The feedstock value of toluene is corrected by the share of its consumption (~50%), which is further processed to other aromatics.
9 The BPT for urea formaldehyde (UF) resin production only, but used for the entire product group.
10 Net energy requirements. This means that released energy in the form of steam or power is credited.
11 For one tonne of chlorine production, but covers the electrolysis of sodium chloride as a whole, i.e. including the concentration of sodium hydroxide to 50% concentration. Steam use for brine preparation and sodium hydroxide (NaOH) concentration is accounted for as well as power requirements for rectifiers. Power required for NaOH cooling, hydrogen cooling and drying, liquefaction/evaporation of chlorine and its gas compression are excluded from the system boundaries. For the by‐product hydrogen, no credits are given (approximately 3.4 GJ/t‐Cl2 based on the lower heating value (LHV) of hydrogen by‐produced).
12 Synthetic production only, i.e. excluding any potential savings from soda ash production in the United States and Canada.
13 The lowest recorded energy use of the chloride process route.

© OECD/IEA 2011 Energy Transition for Industry: India and the Global Context
Page | 85
Annex C. References ACR (2008), India’s Pulp & Paper Industry Must Seek Global competitiveness through Automation System
and Enter prise Solution Investments.
www.arcweb.com/Regions/Asia/Lists/Posts/Post.aspx?List=d954eb0a%2D8950%2D46e8%2D86f7%2D433f68e9cf4b&ID=59
AITEC (Associazione Italiana Tecnico Economica Cemento) (2000 to 2008), Annual Report, AITEC, Rome.
Bayliss, C. and J. Marks (2008), The Aluminium Industry, presentation to the IEA/ERI Workshop on International comparison of Industrial Energy Efficiency, Beijing.
Battelle (2002), Toward a Sustainable Cement Industry, Climate Change, WBCSD, Geneva.
www.wbcsd.org
BEE (India Bureau of Energy Efficiency) (2008), Textile Sector.
www.bee‐india.nic.in/sector/textile/001.zip
CEPI (Confederation of European Paper Industries) (2006), Europe Global Champion in Paper Recycling: Paper Industries Meet Ambitious Target, Press Release, July, Brussels.
Chemweek (2007a), Product Focus: Carbon Black, 31 January.
Chemweek (2007b), Product Focus: Chlor‐Alkali, 25 April.
Chemweek (2007c), Product Focus: Polycarbonate, 28 November‐5 December.
Chemweek (2007d), Product Focus: Titanium Dioxide, 14‐21 February.
CPPRI (Central Pulp and Paper Research Institute (2006), Development of energy consumption norms for pulp and paper industry under Energy conservation act – 2001, CPPRI, Saharanpur, 2006.
CSI (Cement Sustainability Initiative) (2008), Getting the Numbers Right database, WBCSD, Geneva.
European Environment Agency (2006), Annual European Community Greenhouse Gas Inventory 1990‐2004 and Inventory Report 2006, European Commission, Brussels
EC (2008), IPCC Draft Reference Document on Best Available Techniques in the Non‐Ferrous Metals Industry, European Commission, Brussels/Seville.
ftp.jrc.es/eippcb/doc/nfm_2d_07‐2009_public.pdf
GoI (Government of India) (2008), Continuation of Scheme for Integrated Textiles Parks during 11th Plan.
pib.nic.in/release/release.asp?relid=36684
GoI Textiles Committee (2003), Status of powerloom sector in Tamil Nadu ‐ Focus on modernisation. Mumbai: Government of India.
IAI (International Aluminium Institute) (2007), Life Cycle Assessment of Aluminium: Inventory Data for the Primary Aluminium Industry, year 2005 update, International Aluminium Institute.
www.world‐aluminium.org/cache/fl0000166.pdf
IAI (2009a), Historical IAI statistics.
www.world‐aluminium.org/Statistics/Historical+statistics
IAI (2009b), Fourth Sustainable Bauxite Mining Report.
www.world‐aluminium.org/cache/fl0000292.pdf
IAI (2009c), Global Aluminium Recycling: A Cornerstone of Sustainable Development.

Energy Transition for Industry: India and the Global Context © OECD/IEA 2011
Page | 86
http://www.world‐aluminium.org/cache/fl0000181.pdf
IAI (2009d), Results of the 2008 Anode effect survey, Report on the Aluminium Industry’s Global Perfluorocarbon Gases Emissions Reduction Programme, IAI, London.
IBEF (India Brand Equity Foundation) (2009a), Cement Industry, August 2009.
www.ibef.org/industry/cement.aspx
IBEF (2009b), Textiles.
http://ibef.org/industry/textiles.aspx
IBGE (Instituto Brasileiro de Geofrafia e Estatistics) (2008), Cement Sector Energy Consumption Statistics, IBGE, Brasilia.
ICRA (2006). The Indian cement industry. July 2006.
www.icra.in
IEA (International Energy Agency) (2007), Tracking Industrial Energy Efficiency and CO2 Emissions, OECD/IEA, Paris.
www.iea.org/w/bookshop/add.aspx?id=298
IEA (2008a), Energy Technology Perspectives 2008, Scenarios & Strategies to 2050, IEA/OECD, Paris.
www.iea.org/w/bookshop/add.aspx?id=330
IEA (2008b), Energy Statistics of OECD Countries, 2008 Edition, IEA/OECD, Paris.
IEA (2008c), Energy Balances of OECD Countries, 2008 Edition, IEA/OECD, Paris.
IEA (2008d), Energy Balances of Non‐OECD Countries, 2008 Edition, IEA/OECD, Paris.
IEA (2008e), CHP and District Cooling: An Assessment of Market and Policy Potential in India, The International CHP/DHC Collaborative, IEA/OECD, Paris.
IEA (2009a), Energy Technology Transitions for Industry, Strategies for the Next Industrial Revolution, IEA/OECD, Paris.
www.iea.org/w/bookshop/add.aspx?id=354
IEA (2009b), Energy Balances of OECD Countries, 2009 Edition, IEA/OECD, Paris.
www.iea.org/w/bookshop/add.aspx?id=29
IEA (2009c), Energy Balances of Non‐OECD Countries, 2009 Edition, IEA/OECD, Paris.
www.iea.org/w/bookshop/add.aspx?id=31
IEA (2009d), Chemical and Petrochemical Sector: Potential of best practice technology and other measures for improving energy efficiency, IEA information paper, IEA/OECD, Paris.
www.iea.org/publications/free_new_Desc.asp?PUBS_ID=2138
IEA (2009e), CO2 Emissions from Fuel Combustion, 2009 Edition, IEA/OECD, Paris.
www.iea.org/w/bookshop/add.aspx?id=36
IFA (International Fertilizers Association) (2009), Urea production for year 2006, personal communication, IFA.
INEGI (Instituto nacional de Estadistics Geografia e Informatica) (2008), Balance Nacional de Energia, INEGI, Mexico City.
IPCC (Intergovernmental Panel on Climate Change) (2007), Climate Change 2007: Mitigation of Climate Change: Contribution of Working Group III to the Fourth Assessment Report of the Intergovernmental
© OECD/IEA 2011 Energy Transition for Industry: India and the Global Context
Page | 87
Panel on Climate Change [B. Metz, et al. (eds.)], Cambridge University Press, Cambridge, UK and New York.
ISR (2000), Energy Efficiency Best Practices in the Australian Aluminium Industry, Department of Industry, Science and Resources, Canberra.
JCA (Japan Cement Association) (2006), Cement Industry’s Status and Activities for GHG Emissions Reduction in Japan, presentation to the IEA‐WBCSD Workshop on Energy Efficiency and CO2 Emission Reduction Potentials and Policies in the Cement Industry, IEA, Paris, September.
Keniry, J. (2001), The economics of Inert Anodes and Wettable Cathodes for Aluminium Reduction Cells, JOM Journalof the Minerals, Metals and Materials Society, Volume 53, Number 5, pp 43‐47.
Metalworld (2008), Expansion on Cards for the Aluminium Industries in India, Metalworld Journal, Mumbai.
www.metalworld.co.in/report0108.pdf
METI (Ministry of Economy, Trade and Industry) (2008), Personal Communication, April 16.
Nagesha, N. (2008), Role of energy efficiency in sustainable development of small‐scale industry clusters: an empirical study, Energy for sustainable Development , 12 (3), 34‐39.
NRCan (Natural Resources Canada) (2008), Comprehensive Energy Use Database, NRCan, Ottawa.
OECD (Organisation for Economic Co‐operation and Development) (2008), The Financial Crisis and Outlook for Steel, DSTI/SU/SC (2008)37, OECD, Paris.
OFICEMEN (2007), Statistics of the Spanish Cement Industry.
www.oficemen.com
Palanichamy, C., & Babu, N. S. (2005). Second stage energy conservation experience with a textile industry, Energy policy , 603‐609.
PCA (Portland Cement Association) (2008), North American Cement Industry Annual Yearbook, Skokie, Illinois.
PlasticsEurope (2008), The Compelling Facts About Plastics 2007, an analysis of plastic production, demand and recovery for 2007 in Europe, Brussels, October.
RFA (Renewable Fuels Association (2009), Statistics.
www.ethanolrfa.org/industry/statistics
SAIL (Steel Authority of India Limited) (2005), India‐Canada cooperation for Clean Development Mechanism, presentation to TERI, New Delhi, 6 September 2005.
Siam Cement Company Ltd. (2005) Sustainable Development Report 2005, Siam Cement Company Ltd, Bangkok.
Schumacher, K. J. Sathaye (1999), India’s pulp and paper industry: Productivity and energy efficiency, Lawrence Berkeley National Laboratory, LBNL‐41843.
Schyns, V. (2006), Towards a Simple, Robust and Predictable EU Emissions Trading Scheme, Benchmarks from Concrete to Practice, Utility Support Group, Geleen, the Netherlands.
Soares, J.B. and M.T. Tolmasquim (2000), Energy Efficiency and Reduction of CO2 Emissions Through 2015: The Brazilian Cement Industry, Mitigation and Adaptation Strategies for Global Change No. 5, pp. 297‐318, Netherlands.
SRI Consulting (2008), Production, Capacity and Capacity Average Age Data for selected chemicals and for selected countries and for OECD regions, Menlo Park, CA.
Tao Z. and X. Liang (2008) Energy Conservation and the Development of China’s Electrolysis Aluminium Industry, presentation to the IEA/ERI Workshop on International Comparison of Industrial Energy Efficiency, Beijing.
Energy Transition for Industry: India and the Global Context © OECD/IEA 2011
Page | 88
Tata Energy Research Institute. (2003).
TERI (The Energy Research Institute) (2006), TERI Energy Data Directory & Yearbook, New Delhi, 2006.
USGS (United States Geological Survey) (2008a), 2007 Minerals Yearbook: Nitrogen [advance release], Reston, Virginia.
USGS (2008b), 2007 Minerals Yearbook: Soda ash [advance release], Reston, Virginia.
USGS (2008c), 2007 Minerals Yearbook: Cement, Reston, Virginia.
USGS (2009a), 2008 Minerals Yearbook: Cement [advance release], Reston, Virginia.
minerals.usgs.gov/minerals/pubs/commodity/cement/myb1‐2007‐cemen.pdf
USGS (2009b), 2008 Minerals Yearbook: Aluminum [advance release], Reston, Virginia.
minerals.usgs.gov/minerals/pubs/commodity/aluminum/myb1‐2008‐alumi.pdf
USGS (2009b), 2007 Minerals Yearbook: Bauxite and Alumina [advance release], Reston, Virginia.
http://minerals.usgs.gov/minerals/pubs/commodity/bauxite/myb1‐2007‐bauxi.pdf
VDEh (Stahl Institut VDEH) (2009), Steel Industry in Germany,
www.stahl‐online.de/english/media_lounge/Lectures/start.asp
VDZ (Verein Deutscher Zementwerke e.V.) (2008), Activity Report 2005‐2007, VDZ, Dusseldorf.
Worrell, E., L. Price, N. Martin, C. Hendriks, L.O. Meida, (2001), Carbon Dioxide Emissions from the Global Cement Industry, Annual Review of Energy and Environment, Vol 26, 2001.
Worrell, E., et al. (2008), World Best Practice Energy Intensity Values for Selected Industrial Sectors, Ernest Orlando Lawrence Berkeley National Laboratory, LBNL‐62806 Rev2.
Worldsteel (World Steel Association) (2009), Steel Statistical Yearbook 2008, worldsteel Committee on Economic Studies, Brussels.
www.worldsteel.org/pictures/publicationfiles/SSY2008[1].pdf

© OECD/IEA 2011 Energy Transition for Industry: India and the Global Context
Page | 89
Annex D. Abbreviations, acronyms and units °C degree Celsius
BAT best available technology
BF blast furnace
BF/BOF blast furnace/Basic oxygen furnace
BIGCC biomass‐integrated gasification with combined cycle
BOF basic oxygen furnace
BPT best practice technology
BTX Benzene, Toluene, Xylene
Cap Capita
CCS carbon capture and storage
CDM Clean development mechanism
CDQ coke dry quenching
CHP combined heat and power
CO2 carbon dioxide
COG coke oven gas
CWPB centre work pre‐bake
DRI direct reduced iron
EAF electric arc furnace
EEI Energy Efficiency Index
EJ exajoules (1018 joules)
ETP Energy Technology Perspectives
GDP gross domestic product
GHG greenhouse gas
GJ gigajoules (109 joules)
GJ/t gigajoules (109 joules) per tonne
Gt gigatonnes
Gt/CO2 gigatonnes of carbon dioxide
HSS horizontal stud Søderberg
HVC high‐value chemicals
IAI International Aluminium Institute
IEA International Energy Agency
IPCC United Nations Intergovernmental Panel on Climate Change
kg kilogram (103 grammes)
kg/cap kilogram per capita
kg/thm kilogram per tonne of hot metal
kt/yr thousands of tonners per year
ktoe thousands of tonnes of oil equivalent
Energy Transition for Industry: India and the Global Context © OECD/IEA 2011
Page | 90
KWh kilowatt‐hour
KWh/t kilowatt‐hour per tonne
LHV lower heating value
MOE molten oxide electrolysis
Mt millions of tonnes (106 tonnes)
Mt/CO2 millions of tonnes to carbon dioxide
Mt/yr millions of tonnes per year
MTO methanol to olefin
Mtoe millions of tonnes of oil equivalent
MWh megawatt‐hour
MWh/t megawatt‐hour per tonne
OCM oxidative coupling of methane
OECD Organisation of Economic Co‐operation and Development
OHF open‐hearth furnace
PFPB point fed pre‐bake
PJ petajoules (1015 joules)
POSCO Pohang Iron & Steel Company
ppm parts per million
R&D research and development
RD&D Research, development and demonstration
RDD&D research, development, demonstration and deployment
SWPB side work pre‐bake
thm tonne of hot metal
TWh terawatt‐hour
VSS vertical stud Søderberg

9 rue de la Fédération 75739 Paris Cedex 15
www.iea.org
Phot
o cr
edit
© B
ASF
Related Documents